Canandaigua, NY
Canandaigua Map
Canandaigua Overview
10,562
TOTAL POPULATION
4,939
MALE POPULATION
5,623
FEMALE POPULATION
87.84
MALES / 100 FEMALES
113.85
FEMALES / 100 MALES
41.8
MEDIAN AGE
2.8
AVG FAMILY SIZE
2.0
AVG HOUSEHOLD SIZE
$40,391
PER CAPITA INCOME
$90,281
AVG FAMILY INCOME
$59,144
AVG HOUSEHOLD INCOME
17.7%
WAGE / INCOME GAP [ % ]
82.3¢/ $1
WAGE / INCOME GAP [ $ ]
0.45
INEQUALITY / GINI INDEX
5,775
LABOR FORCE [ PEOPLE ]
63.1%
PERCENT IN LABOR FORCE
3.6%
UNEMPLOYMENT RATE
Canandaigua Zip Codes
Canandaigua Area Codes
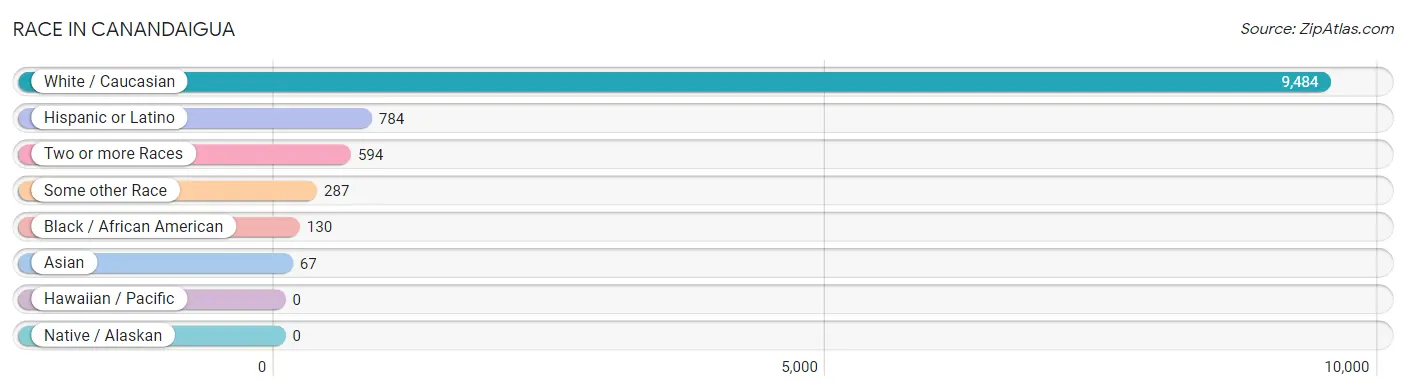
Race in Canandaigua
The most populous races in Canandaigua are White / Caucasian (9,484 | 89.8%), Hispanic or Latino (784 | 7.4%), and Two or more Races (594 | 5.6%).
| Race | # Population | % Population |
| Asian | 67 | 0.6% |
| Black / African American | 130 | 1.2% |
| Hawaiian / Pacific | 0 | 0.0% |
| Hispanic or Latino | 784 | 7.4% |
| Native / Alaskan | 0 | 0.0% |
| White / Caucasian | 9,484 | 89.8% |
| Two or more Races | 594 | 5.6% |
| Some other Race | 287 | 2.7% |
| Total | 10,562 | 100.0% |
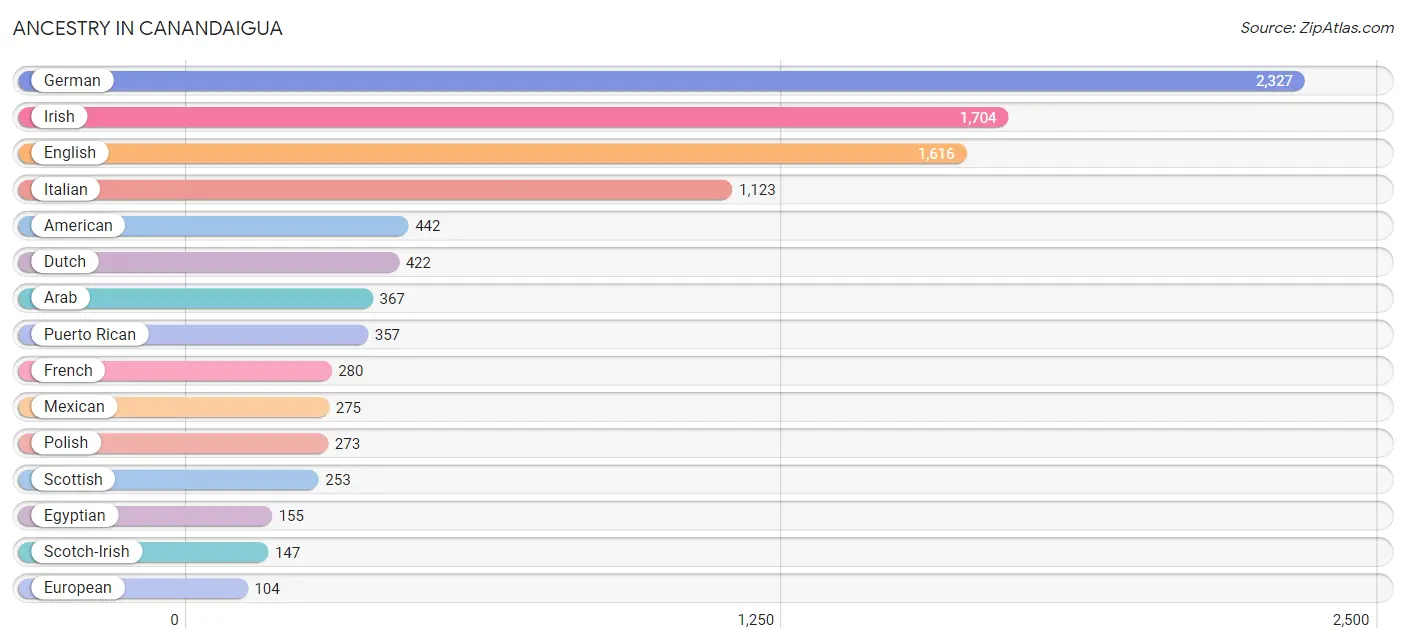
Ancestry in Canandaigua
The most populous ancestries reported in Canandaigua are German (2,327 | 22.0%), Irish (1,704 | 16.1%), English (1,616 | 15.3%), Italian (1,123 | 10.6%), and American (442 | 4.2%), together accounting for 68.3% of all Canandaigua residents.
| Ancestry | # Population | % Population |
| Afghan | 1 | 0.0% |
| African | 21 | 0.2% |
| American | 442 | 4.2% |
| Arab | 367 | 3.5% |
| Austrian | 17 | 0.2% |
| Belgian | 12 | 0.1% |
| Bhutanese | 35 | 0.3% |
| Blackfeet | 28 | 0.3% |
| Brazilian | 30 | 0.3% |
| British | 36 | 0.3% |
| Burmese | 47 | 0.4% |
| Canadian | 48 | 0.4% |
| Central American | 94 | 0.9% |
| Czech | 42 | 0.4% |
| Czechoslovakian | 29 | 0.3% |
| Danish | 17 | 0.2% |
| Dominican | 8 | 0.1% |
| Dutch | 422 | 4.0% |
| Eastern European | 13 | 0.1% |
| Egyptian | 155 | 1.5% |
| English | 1,616 | 15.3% |
| European | 104 | 1.0% |
| Finnish | 8 | 0.1% |
| French | 280 | 2.6% |
| French Canadian | 79 | 0.7% |
| German | 2,327 | 22.0% |
| Guatemalan | 33 | 0.3% |
| Irish | 1,704 | 16.1% |
| Italian | 1,123 | 10.6% |
| Jamaican | 56 | 0.5% |
| Lebanese | 103 | 1.0% |
| Lithuanian | 25 | 0.2% |
| Mexican | 275 | 2.6% |
| Norwegian | 37 | 0.4% |
| Panamanian | 61 | 0.6% |
| Pennsylvania German | 12 | 0.1% |
| Polish | 273 | 2.6% |
| Puerto Rican | 357 | 3.4% |
| Russian | 46 | 0.4% |
| Scandinavian | 11 | 0.1% |
| Scotch-Irish | 147 | 1.4% |
| Scottish | 253 | 2.4% |
| Slovak | 18 | 0.2% |
| Slovene | 10 | 0.1% |
| Spaniard | 20 | 0.2% |
| Subsaharan African | 21 | 0.2% |
| Swedish | 70 | 0.7% |
| Swiss | 44 | 0.4% |
| Syrian | 37 | 0.4% |
| Thai | 27 | 0.3% |
| Turkish | 6 | 0.1% |
| Ukrainian | 93 | 0.9% |
| Vietnamese | 6 | 0.1% |
| Welsh | 104 | 1.0% |
| Yugoslavian | 7 | 0.1% | View All 55 Rows |
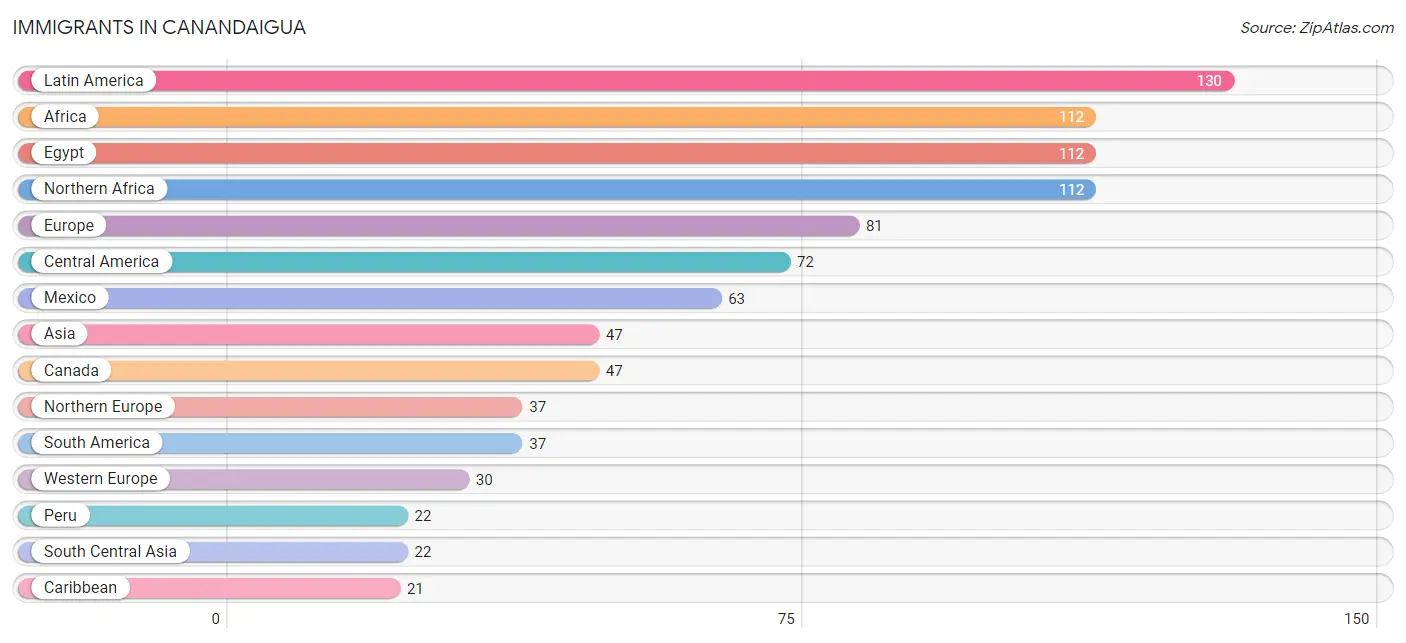
Immigrants in Canandaigua
The most numerous immigrant groups reported in Canandaigua came from Latin America (130 | 1.2%), Africa (112 | 1.1%), Egypt (112 | 1.1%), Northern Africa (112 | 1.1%), and Europe (81 | 0.8%), together accounting for 5.2% of all Canandaigua residents.
| Immigration Origin | # Population | % Population |
| Afghanistan | 1 | 0.0% |
| Africa | 112 | 1.1% |
| Asia | 47 | 0.4% |
| Austria | 10 | 0.1% |
| Bangladesh | 6 | 0.1% |
| Belgium | 12 | 0.1% |
| Brazil | 13 | 0.1% |
| Canada | 47 | 0.4% |
| Caribbean | 21 | 0.2% |
| Central America | 72 | 0.7% |
| Colombia | 2 | 0.0% |
| Eastern Asia | 19 | 0.2% |
| Eastern Europe | 14 | 0.1% |
| Egypt | 112 | 1.1% |
| England | 20 | 0.2% |
| Europe | 81 | 0.8% |
| Germany | 8 | 0.1% |
| Guatemala | 9 | 0.1% |
| India | 13 | 0.1% |
| Ireland | 17 | 0.2% |
| Jamaica | 21 | 0.2% |
| Korea | 19 | 0.2% |
| Latin America | 130 | 1.2% |
| Mexico | 63 | 0.6% |
| Northern Africa | 112 | 1.1% |
| Northern Europe | 37 | 0.4% |
| Peru | 22 | 0.2% |
| Russia | 7 | 0.1% |
| South America | 37 | 0.4% |
| South Central Asia | 22 | 0.2% |
| Sri Lanka | 2 | 0.0% |
| Turkey | 6 | 0.1% |
| Ukraine | 7 | 0.1% |
| Western Asia | 6 | 0.1% |
| Western Europe | 30 | 0.3% | View All 35 Rows |
Sex and Age in Canandaigua
Sex and Age in Canandaigua
The most populous age groups in Canandaigua are 20 to 24 Years (570 | 11.5%) for men and 20 to 24 Years (525 | 9.3%) for women.
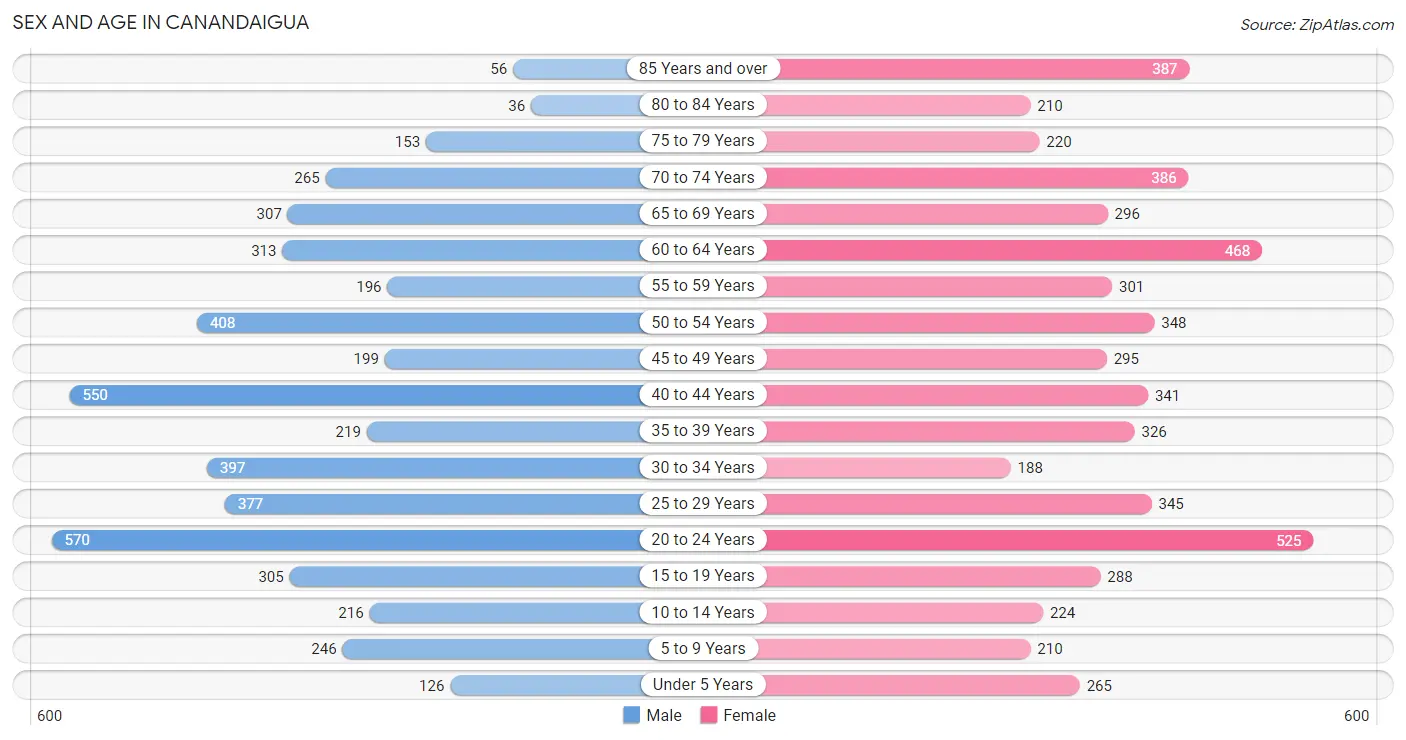
| Age Bracket | Male | Female |
| Under 5 Years | 126 (2.5%) | 265 (4.7%) |
| 5 to 9 Years | 246 (5.0%) | 210 (3.7%) |
| 10 to 14 Years | 216 (4.4%) | 224 (4.0%) |
| 15 to 19 Years | 305 (6.2%) | 288 (5.1%) |
| 20 to 24 Years | 570 (11.5%) | 525 (9.3%) |
| 25 to 29 Years | 377 (7.6%) | 345 (6.1%) |
| 30 to 34 Years | 397 (8.0%) | 188 (3.3%) |
| 35 to 39 Years | 219 (4.4%) | 326 (5.8%) |
| 40 to 44 Years | 550 (11.1%) | 341 (6.1%) |
| 45 to 49 Years | 199 (4.0%) | 295 (5.2%) |
| 50 to 54 Years | 408 (8.3%) | 348 (6.2%) |
| 55 to 59 Years | 196 (4.0%) | 301 (5.3%) |
| 60 to 64 Years | 313 (6.3%) | 468 (8.3%) |
| 65 to 69 Years | 307 (6.2%) | 296 (5.3%) |
| 70 to 74 Years | 265 (5.4%) | 386 (6.9%) |
| 75 to 79 Years | 153 (3.1%) | 220 (3.9%) |
| 80 to 84 Years | 36 (0.7%) | 210 (3.7%) |
| 85 Years and over | 56 (1.1%) | 387 (6.9%) |
| Total | 4,939 (100.0%) | 5,623 (100.0%) |
Families and Households in Canandaigua
Median Family Size in Canandaigua
The median family size in Canandaigua is 2.77 persons per family, with married-couple families (1,620 | 67.4%) accounting for the largest median family size of 2.96 persons per family. On the other hand, single female/mother families (677 | 28.1%) represent the smallest median family size with 2.36 persons per family.
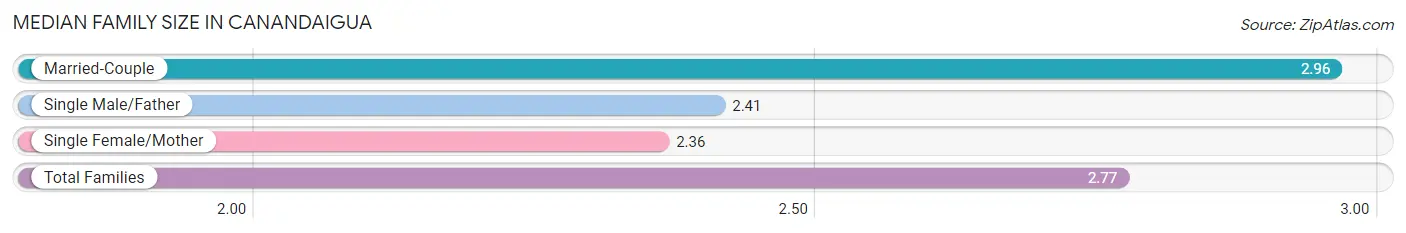
| Family Type | # Families | Family Size |
| Married-Couple | 1,620 (67.4%) | 2.96 |
| Single Male/Father | 108 (4.5%) | 2.41 |
| Single Female/Mother | 677 (28.1%) | 2.36 |
| Total Families | 2,405 (100.0%) | 2.77 |
Median Household Size in Canandaigua
The median household size in Canandaigua is 2.02 persons per household, with single male/father households (108 | 2.1%) accounting for the largest median household size of 3.14 persons per household. non-family households (2,699 | 52.9%) represent the smallest median household size with 1.23 persons per household.
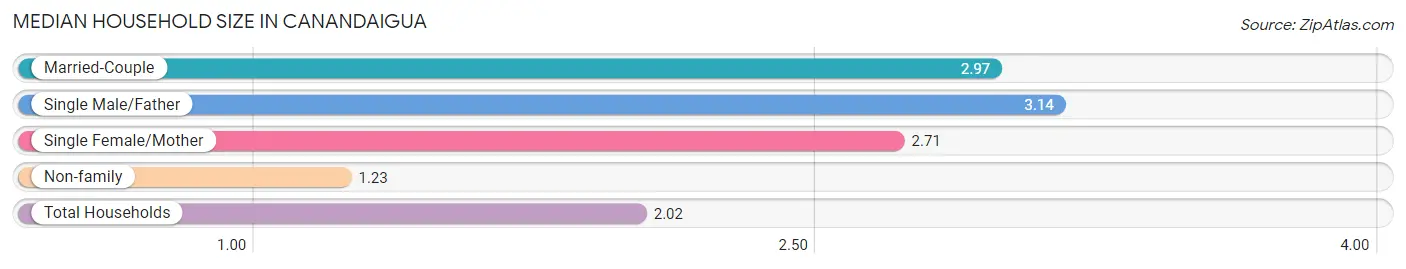
| Household Type | # Households | Household Size |
| Married-Couple | 1,620 (31.7%) | 2.97 |
| Single Male/Father | 108 (2.1%) | 3.14 |
| Single Female/Mother | 677 (13.3%) | 2.71 |
| Non-family | 2,699 (52.9%) | 1.23 |
| Total Households | 5,104 (100.0%) | 2.02 |
Household Size by Marriage Status in Canandaigua
Out of a total of 5,104 households in Canandaigua, 2,405 (47.1%) are family households, while 2,699 (52.9%) are nonfamily households. The most numerous type of family households are 2-person households, comprising 1,131, and the most common type of nonfamily households are 1-person households, comprising 2,196.
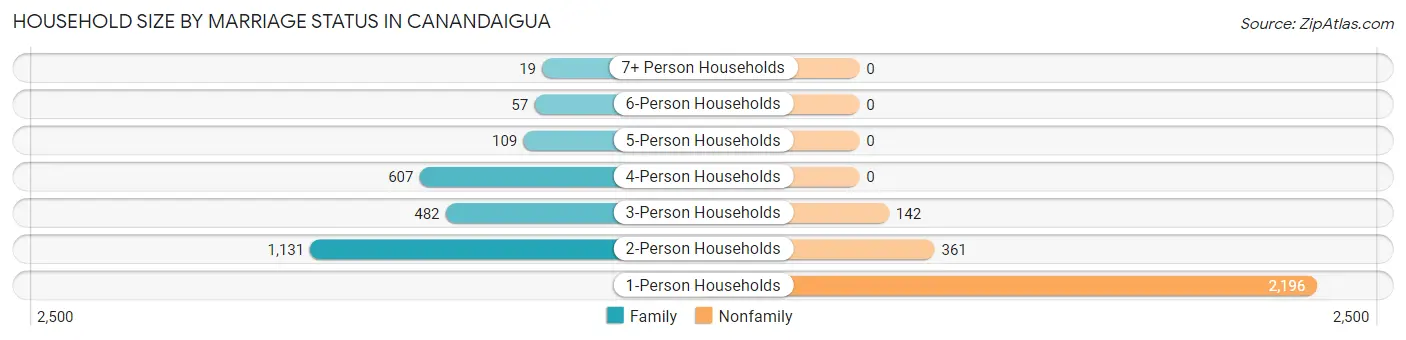
| Household Size | Family Households | Nonfamily Households |
| 1-Person Households | - | 2,196 (43.0%) |
| 2-Person Households | 1,131 (22.2%) | 361 (7.1%) |
| 3-Person Households | 482 (9.4%) | 142 (2.8%) |
| 4-Person Households | 607 (11.9%) | 0 (0.0%) |
| 5-Person Households | 109 (2.1%) | 0 (0.0%) |
| 6-Person Households | 57 (1.1%) | 0 (0.0%) |
| 7+ Person Households | 19 (0.4%) | 0 (0.0%) |
| Total | 2,405 (47.1%) | 2,699 (52.9%) |
Female Fertility in Canandaigua
Fertility by Age in Canandaigua
Average fertility rate in Canandaigua is 13.0 births per 1,000 women. Women in the age bracket of 20 to 34 years have the highest fertility rate with 20.0 births per 1,000 women. Women in the age bracket of 20 to 34 years acount for 67.7% of all women with births.
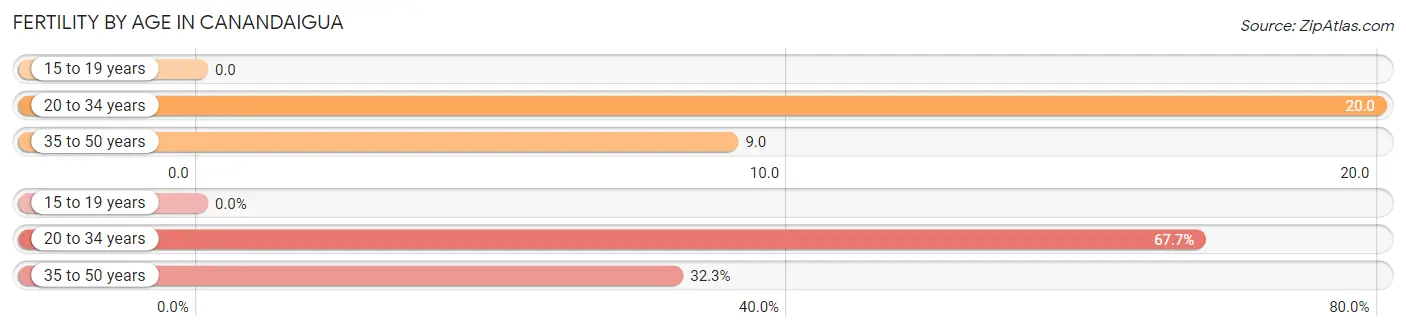
| Age Bracket | Women with Births | Births / 1,000 Women |
| 15 to 19 years | 0 (0.0%) | 0.0 |
| 20 to 34 years | 21 (67.7%) | 20.0 |
| 35 to 50 years | 10 (32.3%) | 9.0 |
| Total | 31 (100.0%) | 13.0 |
Fertility by Age by Marriage Status in Canandaigua
64.5% of women with births (31) in Canandaigua are married. The highest percentage of unmarried women with births falls into 20 to 34 years age bracket with 52.4% of them unmarried at the time of birth, while the lowest percentage of unmarried women with births belong to 35 to 50 years age bracket with 0.0% of them unmarried.
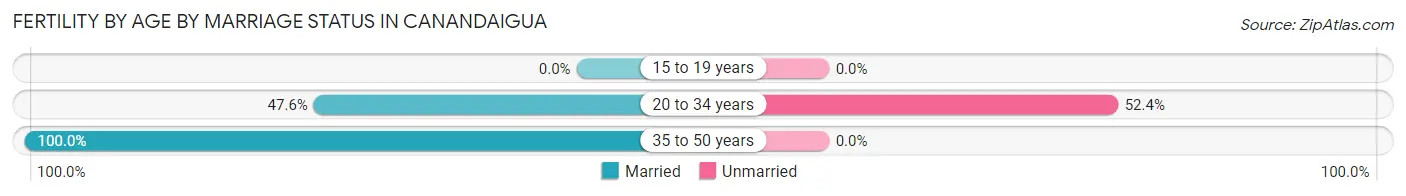
| Age Bracket | Married | Unmarried |
| 15 to 19 years | 0 (0.0%) | 0 (0.0%) |
| 20 to 34 years | 10 (47.6%) | 11 (52.4%) |
| 35 to 50 years | 10 (100.0%) | 0 (0.0%) |
| Total | 20 (64.5%) | 11 (35.5%) |
Fertility by Education in Canandaigua
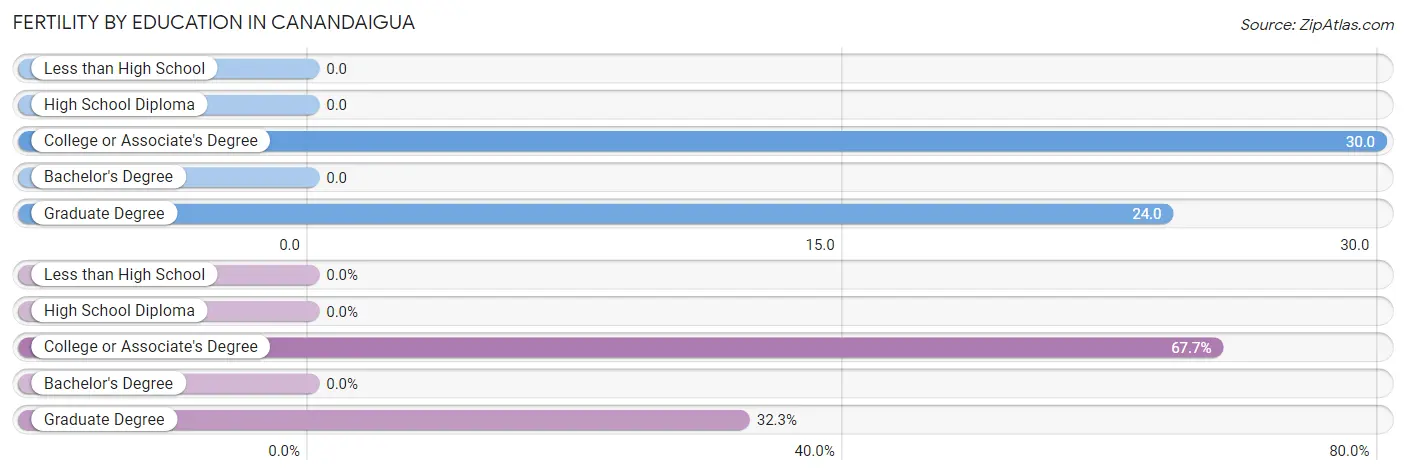
| Educational Attainment | Women with Births | Births / 1,000 Women |
| Less than High School | 0 (0.0%) | 0.0 |
| High School Diploma | 0 (0.0%) | 0.0 |
| College or Associate's Degree | 21 (67.7%) | 30.0 |
| Bachelor's Degree | 0 (0.0%) | 0.0 |
| Graduate Degree | 10 (32.3%) | 24.0 |
| Total | 31 (100.0%) | 13.0 |
Fertility by Education by Marriage Status in Canandaigua
35.5% of women with births in Canandaigua are unmarried. Women with the educational attainment of graduate degree are most likely to be married with 100.0% of them married at childbirth, while women with the educational attainment of college or associate's degree are least likely to be married with 52.4% of them unmarried at childbirth.
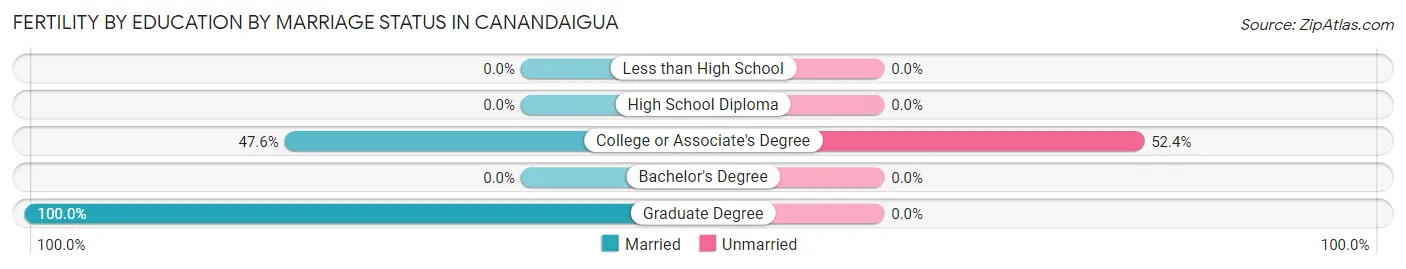
| Educational Attainment | Married | Unmarried |
| Less than High School | 0 (0.0%) | 0 (0.0%) |
| High School Diploma | 0 (0.0%) | 0 (0.0%) |
| College or Associate's Degree | 10 (47.6%) | 11 (52.4%) |
| Bachelor's Degree | 0 (0.0%) | 0 (0.0%) |
| Graduate Degree | 10 (100.0%) | 0 (0.0%) |
| Total | 20 (64.5%) | 11 (35.5%) |
Income in Canandaigua
Income Overview in Canandaigua
Per Capita Income in Canandaigua is $40,391, while median incomes of families and households are $90,281 and $59,144 respectively.
| Characteristic | Number | Measure |
| Per Capita Income | 10,562 | $40,391 |
| Median Family Income | 2,405 | $90,281 |
| Mean Family Income | 2,405 | $112,207 |
| Median Household Income | 5,104 | $59,144 |
| Mean Household Income | 5,104 | $83,577 |
| Income Deficit | 2,405 | $0 |
| Wage / Income Gap (%) | 10,562 | 17.70% |
| Wage / Income Gap ($) | 10,562 | 82.30¢ per $1 |
| Gini / Inequality Index | 10,562 | 0.45 |
Earnings by Sex in Canandaigua
Average Earnings in Canandaigua are $40,543, $44,789 for men and $36,860 for women, a difference of 17.7%.
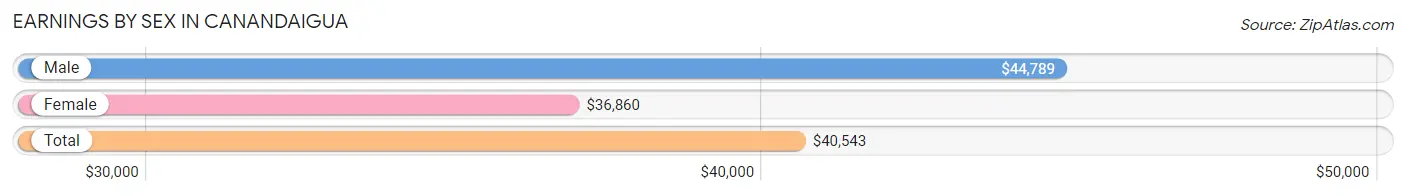
| Sex | Number | Average Earnings |
| Male | 3,129 (52.3%) | $44,789 |
| Female | 2,857 (47.7%) | $36,860 |
| Total | 5,986 (100.0%) | $40,543 |
Earnings by Sex by Income Bracket in Canandaigua
The most common earnings brackets in Canandaigua are $100,000+ for men (475 | 15.2%) and $55,000 to $64,999 for women (322 | 11.3%).
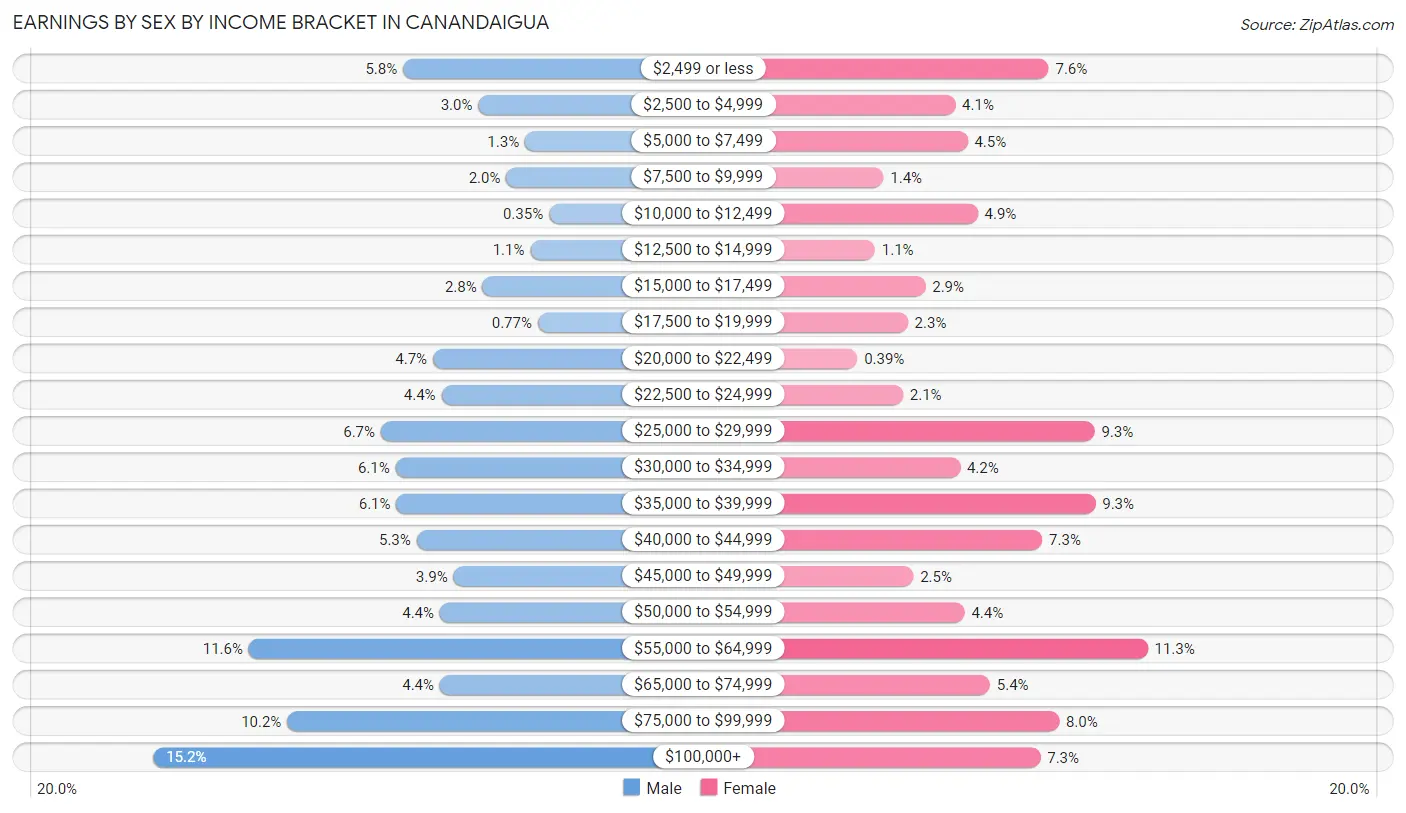
| Income | Male | Female |
| $2,499 or less | 182 (5.8%) | 216 (7.6%) |
| $2,500 to $4,999 | 94 (3.0%) | 116 (4.1%) |
| $5,000 to $7,499 | 39 (1.3%) | 129 (4.5%) |
| $7,500 to $9,999 | 61 (1.9%) | 39 (1.4%) |
| $10,000 to $12,499 | 11 (0.4%) | 140 (4.9%) |
| $12,500 to $14,999 | 33 (1.1%) | 30 (1.1%) |
| $15,000 to $17,499 | 89 (2.8%) | 84 (2.9%) |
| $17,500 to $19,999 | 24 (0.8%) | 65 (2.3%) |
| $20,000 to $22,499 | 147 (4.7%) | 11 (0.4%) |
| $22,500 to $24,999 | 137 (4.4%) | 60 (2.1%) |
| $25,000 to $29,999 | 208 (6.7%) | 265 (9.3%) |
| $30,000 to $34,999 | 191 (6.1%) | 121 (4.2%) |
| $35,000 to $39,999 | 190 (6.1%) | 266 (9.3%) |
| $40,000 to $44,999 | 166 (5.3%) | 209 (7.3%) |
| $45,000 to $49,999 | 123 (3.9%) | 71 (2.5%) |
| $50,000 to $54,999 | 139 (4.4%) | 126 (4.4%) |
| $55,000 to $64,999 | 363 (11.6%) | 322 (11.3%) |
| $65,000 to $74,999 | 139 (4.4%) | 153 (5.4%) |
| $75,000 to $99,999 | 318 (10.2%) | 227 (8.0%) |
| $100,000+ | 475 (15.2%) | 207 (7.2%) |
| Total | 3,129 (100.0%) | 2,857 (100.0%) |
Earnings by Sex by Educational Attainment in Canandaigua
Average earnings in Canandaigua are $55,845 for men and $43,085 for women, a difference of 22.9%. Men with an educational attainment of graduate degree enjoy the highest average annual earnings of $111,359, while those with less than high school education earn the least with $27,596. Women with an educational attainment of graduate degree earn the most with the average annual earnings of $67,353, while those with less than high school education have the smallest earnings of $28,177.
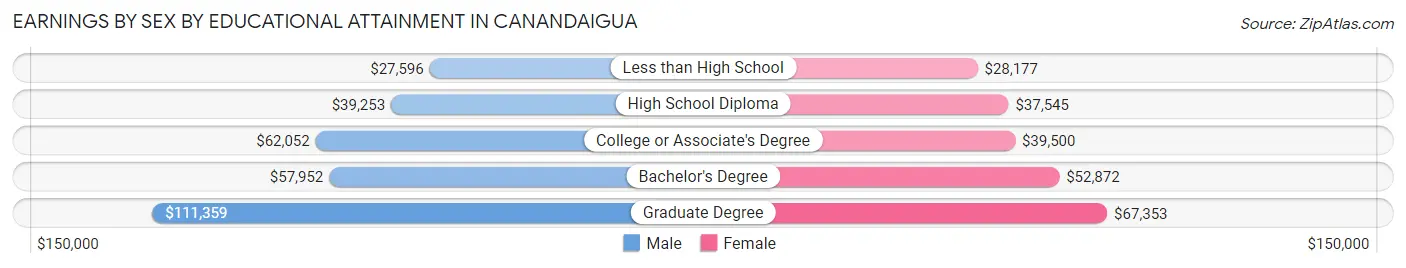
| Educational Attainment | Male Income | Female Income |
| Less than High School | $27,596 | $28,177 |
| High School Diploma | $39,253 | $37,545 |
| College or Associate's Degree | $62,052 | $39,500 |
| Bachelor's Degree | $57,952 | $52,872 |
| Graduate Degree | $111,359 | $67,353 |
| Total | $55,845 | $43,085 |
Family Income in Canandaigua
Family Income Brackets in Canandaigua
According to the Canandaigua family income data, there are 438 families falling into the $100,000 to $149,999 income range, which is the most common income bracket and makes up 18.2% of all families.
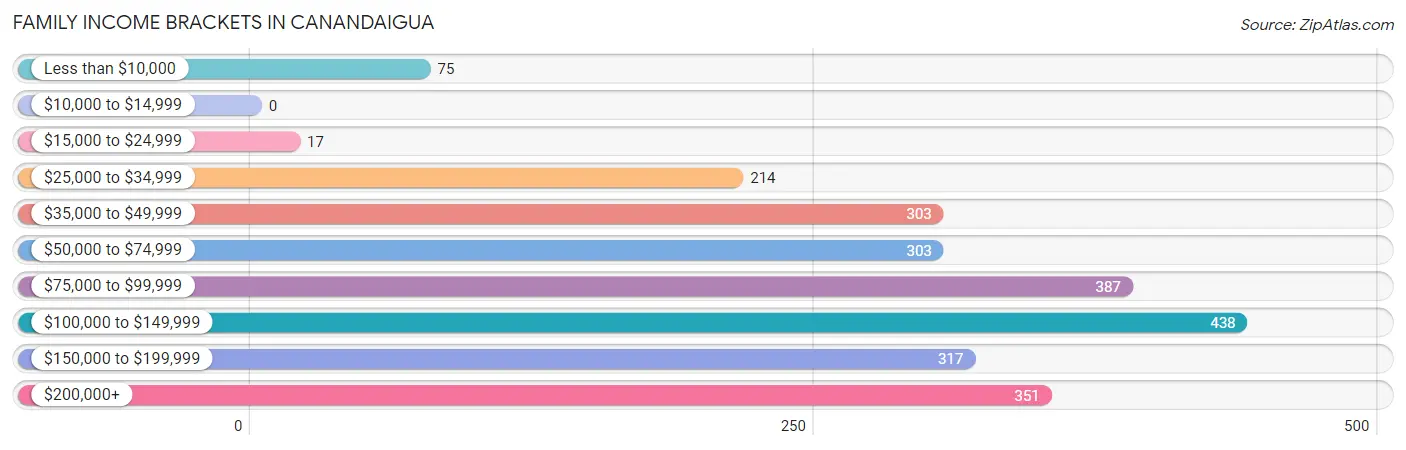
| Income Bracket | # Families | % Families |
| Less than $10,000 | 75 | 3.1% |
| $10,000 to $14,999 | 0 | 0.0% |
| $15,000 to $24,999 | 17 | 0.7% |
| $25,000 to $34,999 | 214 | 8.9% |
| $35,000 to $49,999 | 303 | 12.6% |
| $50,000 to $74,999 | 303 | 12.6% |
| $75,000 to $99,999 | 387 | 16.1% |
| $100,000 to $149,999 | 438 | 18.2% |
| $150,000 to $199,999 | 317 | 13.2% |
| $200,000+ | 351 | 14.6% |
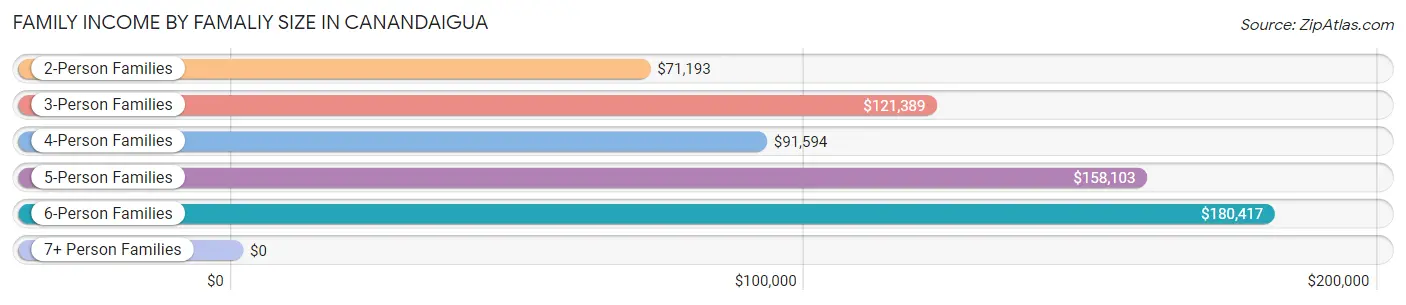
Family Income by Famaliy Size in Canandaigua
6-person families (57 | 2.4%) account for the highest median family income in Canandaigua with $180,417 per family, while 3-person families (528 | 22.0%) have the highest median income of $40,463 per family member.
| Income Bracket | # Families | Median Income |
| 2-Person Families | 1,237 (51.4%) | $71,193 |
| 3-Person Families | 528 (22.0%) | $121,389 |
| 4-Person Families | 481 (20.0%) | $91,594 |
| 5-Person Families | 92 (3.8%) | $158,103 |
| 6-Person Families | 57 (2.4%) | $180,417 |
| 7+ Person Families | 10 (0.4%) | $0 |
| Total | 2,405 (100.0%) | $90,281 |
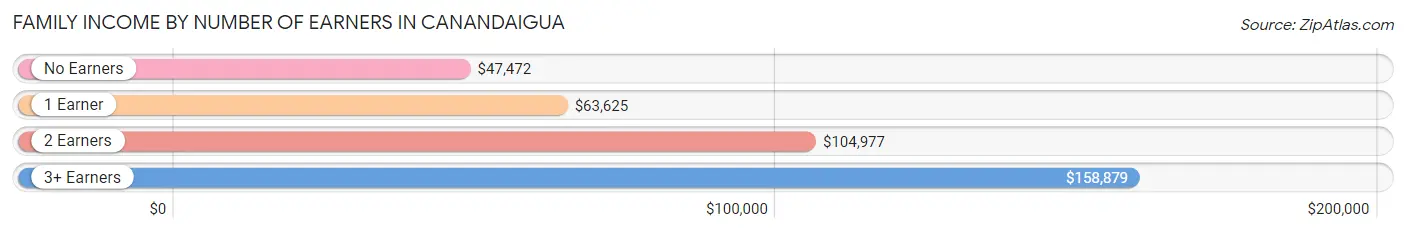
Family Income by Number of Earners in Canandaigua
The median family income in Canandaigua is $90,281, with families comprising 3+ earners (308) having the highest median family income of $158,879, while families with no earners (428) have the lowest median family income of $47,472, accounting for 12.8% and 17.8% of families, respectively.
| Number of Earners | # Families | Median Income |
| No Earners | 428 (17.8%) | $47,472 |
| 1 Earner | 600 (24.9%) | $63,625 |
| 2 Earners | 1,069 (44.5%) | $104,977 |
| 3+ Earners | 308 (12.8%) | $158,879 |
| Total | 2,405 (100.0%) | $90,281 |
Household Income in Canandaigua
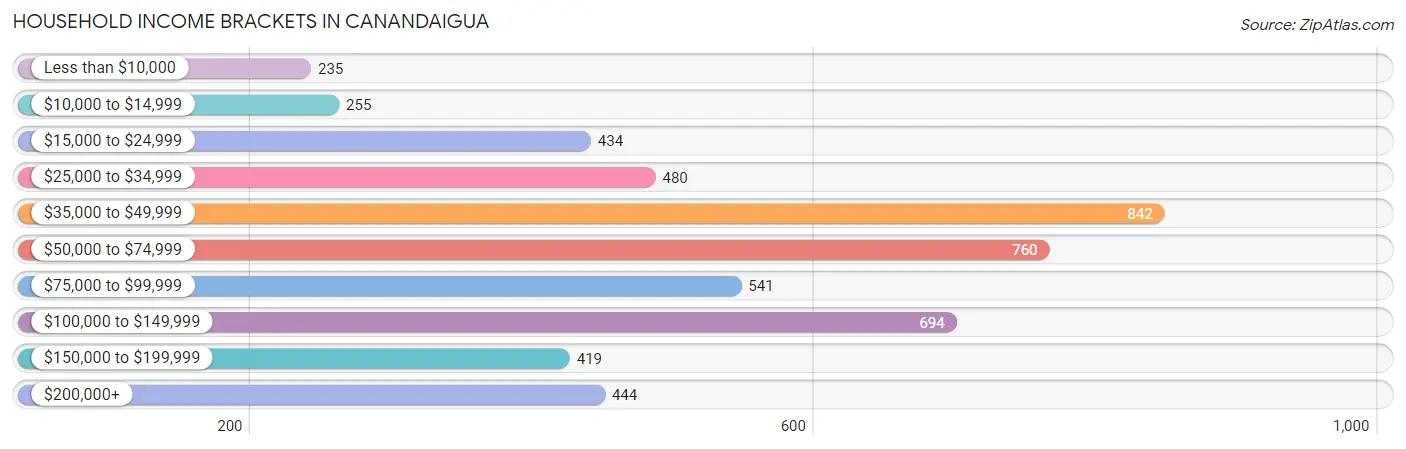
Household Income Brackets in Canandaigua
With 842 households falling in the category, the $35,000 to $49,999 income range is the most frequent in Canandaigua, accounting for 16.5% of all households. In contrast, only 235 households (4.6%) fall into the less than $10,000 income bracket, making it the least populous group.
| Income Bracket | # Households | % Households |
| Less than $10,000 | 235 | 4.6% |
| $10,000 to $14,999 | 255 | 5.0% |
| $15,000 to $24,999 | 434 | 8.5% |
| $25,000 to $34,999 | 480 | 9.4% |
| $35,000 to $49,999 | 842 | 16.5% |
| $50,000 to $74,999 | 760 | 14.9% |
| $75,000 to $99,999 | 541 | 10.6% |
| $100,000 to $149,999 | 694 | 13.6% |
| $150,000 to $199,999 | 419 | 8.2% |
| $200,000+ | 444 | 8.7% |
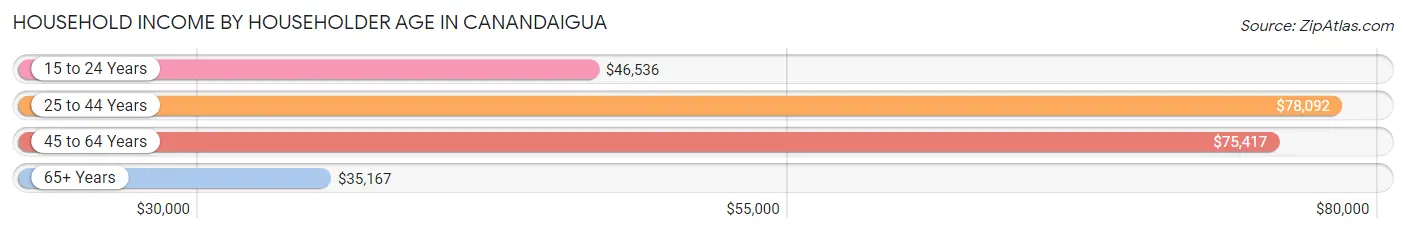
Household Income by Householder Age in Canandaigua
The median household income in Canandaigua is $59,144, with the highest median household income of $78,092 found in the 25 to 44 years age bracket for the primary householder. A total of 1,515 households (29.7%) fall into this category. Meanwhile, the 65+ years age bracket for the primary householder has the lowest median household income of $35,167, with 1,532 households (30.0%) in this group.
| Income Bracket | # Households | Median Income |
| 15 to 24 Years | 425 (8.3%) | $46,536 |
| 25 to 44 Years | 1,515 (29.7%) | $78,092 |
| 45 to 64 Years | 1,632 (32.0%) | $75,417 |
| 65+ Years | 1,532 (30.0%) | $35,167 |
| Total | 5,104 (100.0%) | $59,144 |
Poverty in Canandaigua
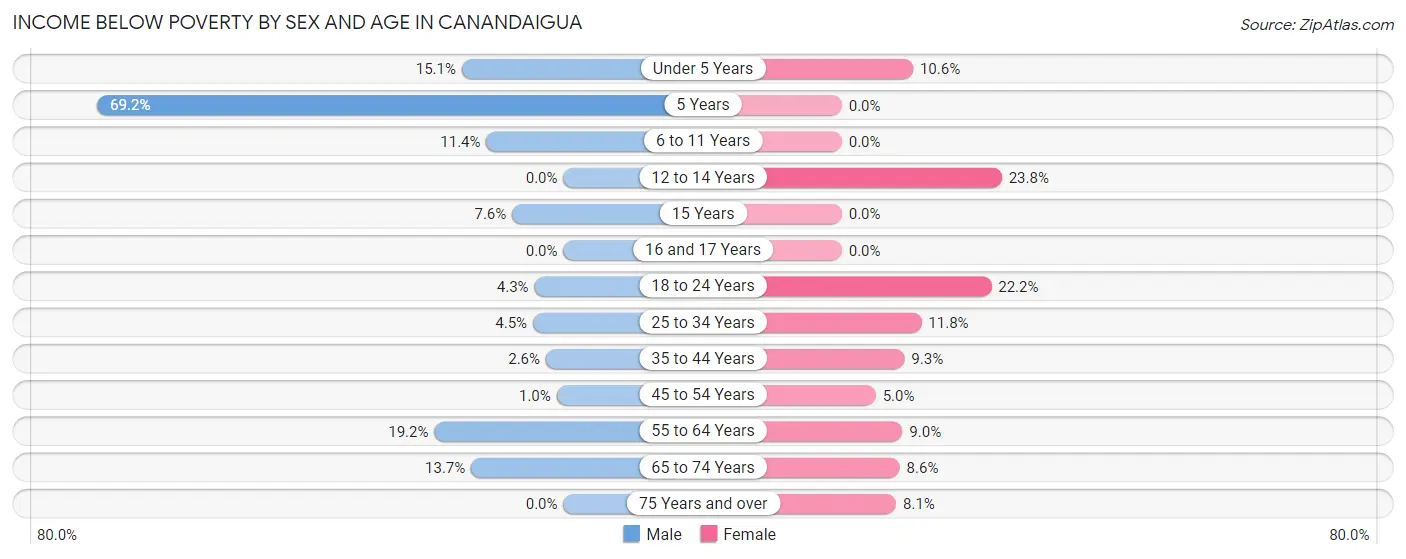
Income Below Poverty by Sex and Age in Canandaigua
With 6.8% poverty level for males and 9.5% for females among the residents of Canandaigua, 5 year old males and 12 to 14 year old females are the most vulnerable to poverty, with 9 males (69.2%) and 19 females (23.7%) in their respective age groups living below the poverty level.
| Age Bracket | Male | Female |
| Under 5 Years | 19 (15.1%) | 28 (10.6%) |
| 5 Years | 9 (69.2%) | 0 (0.0%) |
| 6 to 11 Years | 32 (11.4%) | 0 (0.0%) |
| 12 to 14 Years | 0 (0.0%) | 19 (23.7%) |
| 15 Years | 7 (7.6%) | 0 (0.0%) |
| 16 and 17 Years | 0 (0.0%) | 0 (0.0%) |
| 18 to 24 Years | 30 (4.3%) | 133 (22.2%) |
| 25 to 34 Years | 35 (4.5%) | 63 (11.8%) |
| 35 to 44 Years | 20 (2.6%) | 62 (9.3%) |
| 45 to 54 Years | 6 (1.0%) | 32 (5.0%) |
| 55 to 64 Years | 96 (19.2%) | 69 (9.0%) |
| 65 to 74 Years | 74 (13.7%) | 56 (8.6%) |
| 75 Years and over | 0 (0.0%) | 63 (8.1%) |
| Total | 328 (6.8%) | 525 (9.5%) |
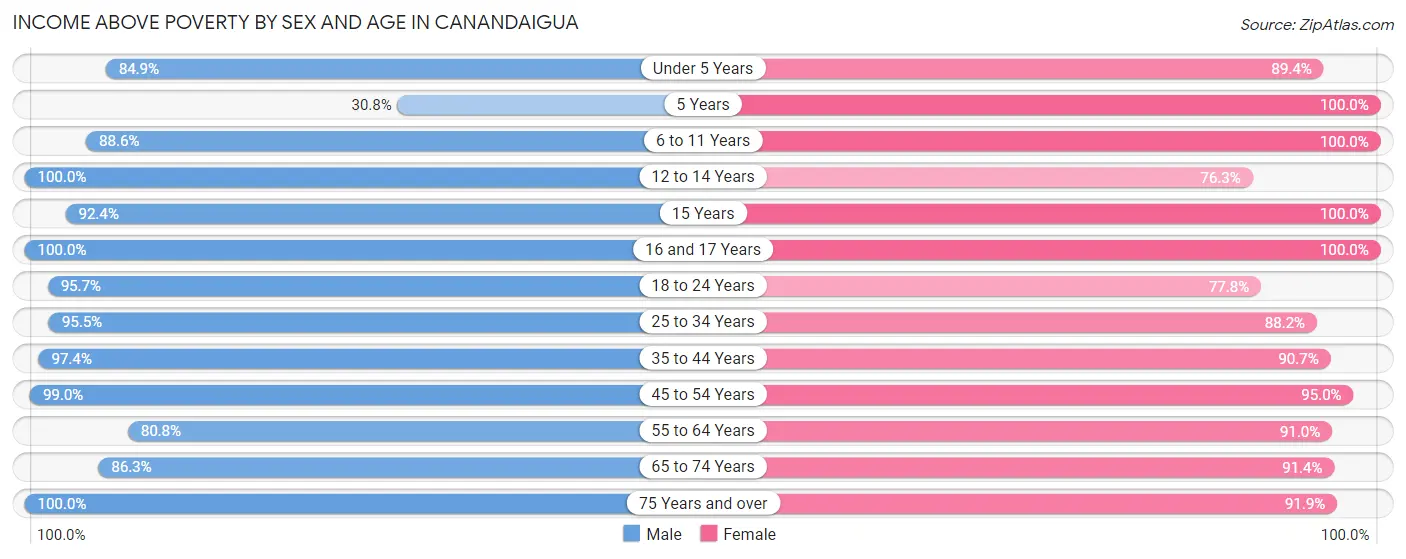
Income Above Poverty by Sex and Age in Canandaigua
According to the poverty statistics in Canandaigua, males aged 12 to 14 years and females aged 5 years are the age groups that are most secure financially, with 100.0% of males and 100.0% of females in these age groups living above the poverty line.
| Age Bracket | Male | Female |
| Under 5 Years | 107 (84.9%) | 237 (89.4%) |
| 5 Years | 4 (30.8%) | 24 (100.0%) |
| 6 to 11 Years | 248 (88.6%) | 314 (100.0%) |
| 12 to 14 Years | 140 (100.0%) | 61 (76.2%) |
| 15 Years | 85 (92.4%) | 31 (100.0%) |
| 16 and 17 Years | 82 (100.0%) | 183 (100.0%) |
| 18 to 24 Years | 670 (95.7%) | 466 (77.8%) |
| 25 to 34 Years | 739 (95.5%) | 470 (88.2%) |
| 35 to 44 Years | 749 (97.4%) | 605 (90.7%) |
| 45 to 54 Years | 592 (99.0%) | 603 (95.0%) |
| 55 to 64 Years | 405 (80.8%) | 698 (91.0%) |
| 65 to 74 Years | 466 (86.3%) | 596 (91.4%) |
| 75 Years and over | 233 (100.0%) | 719 (91.9%) |
| Total | 4,520 (93.2%) | 5,007 (90.5%) |
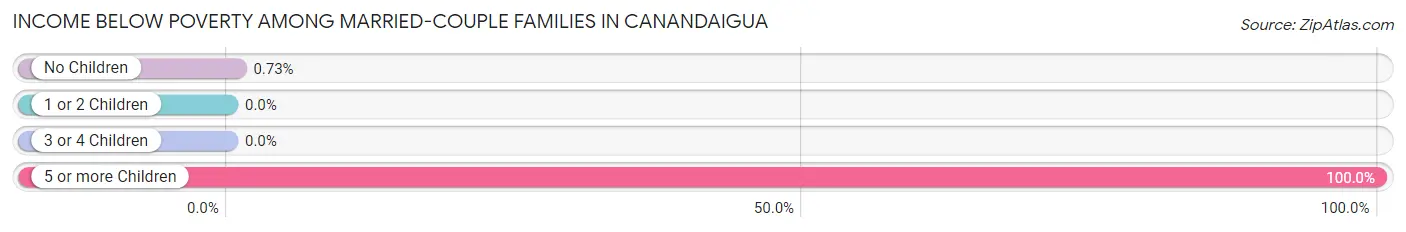
Income Below Poverty Among Married-Couple Families in Canandaigua
The poverty statistics for married-couple families in Canandaigua show that 1.1% or 17 of the total 1,620 families live below the poverty line. Families with 5 or more children have the highest poverty rate of 100.0%, comprising of 10 families. On the other hand, families with 1 or 2 children have the lowest poverty rate of 0.0%, which includes 0 families.
| Children | Above Poverty | Below Poverty |
| No Children | 958 (99.3%) | 7 (0.7%) |
| 1 or 2 Children | 533 (100.0%) | 0 (0.0%) |
| 3 or 4 Children | 112 (100.0%) | 0 (0.0%) |
| 5 or more Children | 0 (0.0%) | 10 (100.0%) |
| Total | 1,603 (99.0%) | 17 (1.1%) |
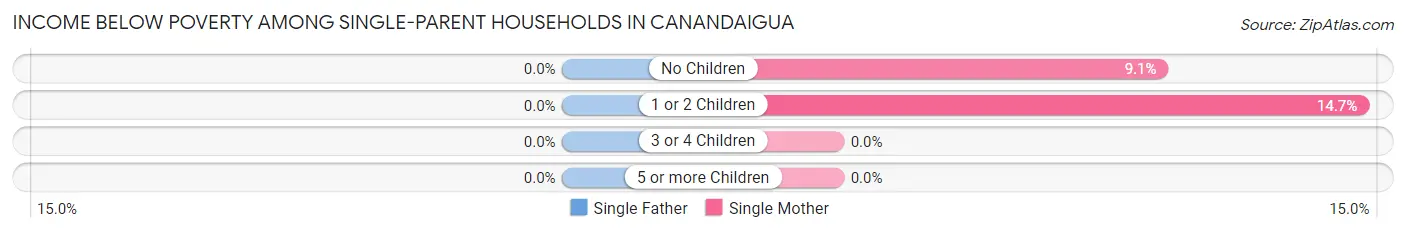
Income Below Poverty Among Single-Parent Households in Canandaigua
| Children | Single Father | Single Mother |
| No Children | 0 (0.0%) | 34 (9.1%) |
| 1 or 2 Children | 0 (0.0%) | 43 (14.7%) |
| 3 or 4 Children | 0 (0.0%) | 0 (0.0%) |
| 5 or more Children | 0 (0.0%) | 0 (0.0%) |
| Total | 0 (0.0%) | 77 (11.4%) |
Income Below Poverty Among Married-Couple vs Single-Parent Households in Canandaigua
The poverty data for Canandaigua shows that 17 of the married-couple family households (1.1%) and 77 of the single-parent households (9.8%) are living below the poverty level. Within the married-couple family households, those with 5 or more children have the highest poverty rate, with 10 households (100.0%) falling below the poverty line. Among the single-parent households, those with 1 or 2 children have the highest poverty rate, with 43 household (12.8%) living below poverty.
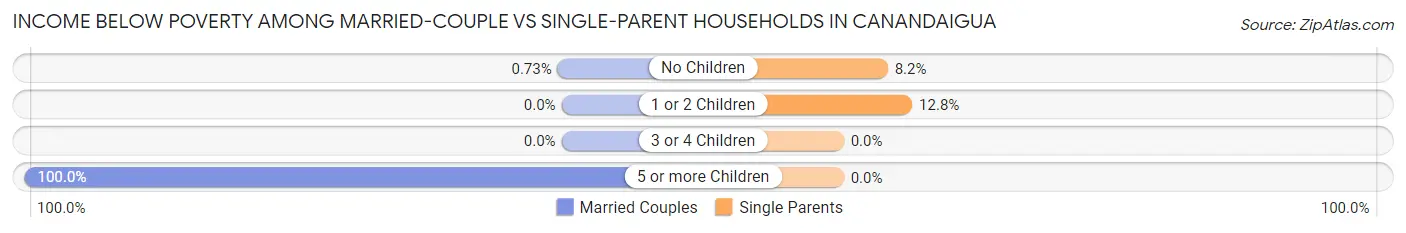
| Children | Married-Couple Families | Single-Parent Households |
| No Children | 7 (0.7%) | 34 (8.2%) |
| 1 or 2 Children | 0 (0.0%) | 43 (12.8%) |
| 3 or 4 Children | 0 (0.0%) | 0 (0.0%) |
| 5 or more Children | 10 (100.0%) | 0 (0.0%) |
| Total | 17 (1.1%) | 77 (9.8%) |
Employment Characteristics in Canandaigua
Employment by Class of Employer in Canandaigua
Among the 5,417 employed individuals in Canandaigua, private company employees (3,727 | 68.8%), not-for-profit organizations (664 | 12.3%), and local government employees (350 | 6.5%) make up the most common classes of employment.
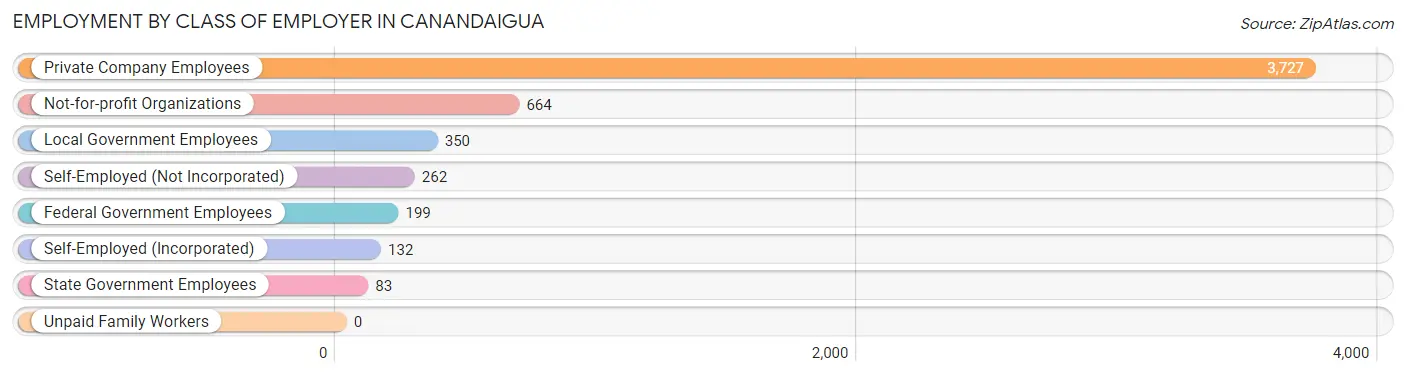
| Employer Class | # Employees | % Employees |
| Private Company Employees | 3,727 | 68.8% |
| Self-Employed (Incorporated) | 132 | 2.4% |
| Self-Employed (Not Incorporated) | 262 | 4.8% |
| Not-for-profit Organizations | 664 | 12.3% |
| Local Government Employees | 350 | 6.5% |
| State Government Employees | 83 | 1.5% |
| Federal Government Employees | 199 | 3.7% |
| Unpaid Family Workers | 0 | 0.0% |
| Total | 5,417 | 100.0% |
Employment Status by Age in Canandaigua
According to the labor force statistics for Canandaigua, out of the total population over 16 years of age (9,152), 63.1% or 5,775 individuals are in the labor force, with 3.6% or 208 of them unemployed. The age group with the highest labor force participation rate is 25 to 29 years, with 91.7% or 662 individuals in the labor force. Within the labor force, the 16 to 19 years age range has the highest percentage of unemployed individuals, with 19.0% or 37 of them being unemployed.
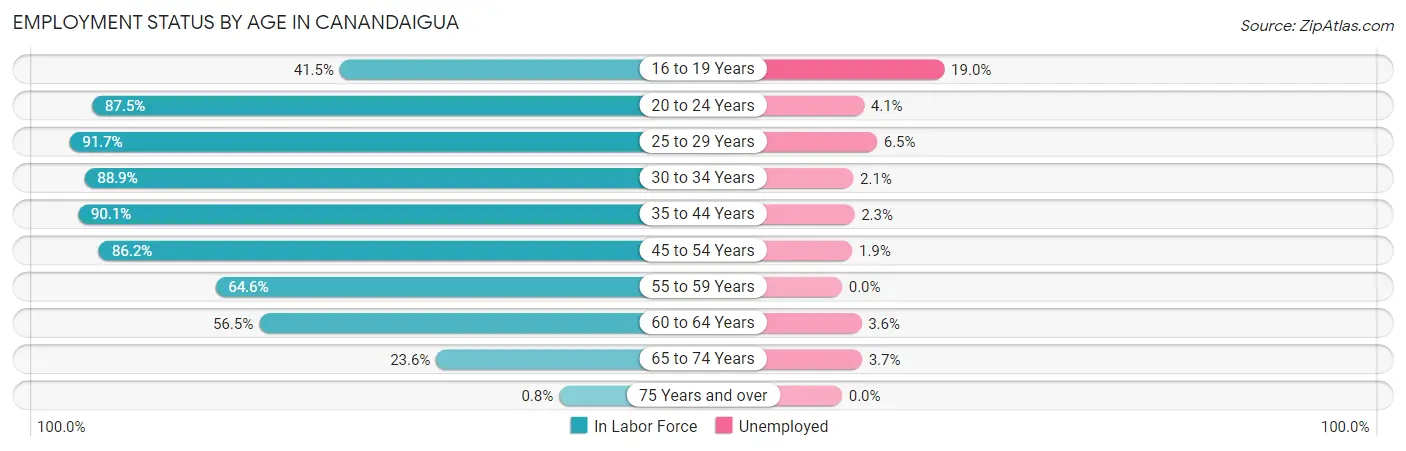
| Age Bracket | In Labor Force | Unemployed |
| 16 to 19 Years | 195 (41.5%) | 37 (19.0%) |
| 20 to 24 Years | 958 (87.5%) | 39 (4.1%) |
| 25 to 29 Years | 662 (91.7%) | 43 (6.5%) |
| 30 to 34 Years | 520 (88.9%) | 11 (2.1%) |
| 35 to 44 Years | 1,294 (90.1%) | 30 (2.3%) |
| 45 to 54 Years | 1,078 (86.2%) | 20 (1.9%) |
| 55 to 59 Years | 321 (64.6%) | 0 (0.0%) |
| 60 to 64 Years | 441 (56.5%) | 16 (3.6%) |
| 65 to 74 Years | 296 (23.6%) | 11 (3.7%) |
| 75 Years and over | 8 (0.8%) | 0 (0.0%) |
| Total | 5,775 (63.1%) | 208 (3.6%) |
Employment Status by Educational Attainment in Canandaigua
According to labor force statistics for Canandaigua, 81.9% of individuals (4,317) out of the total population between 25 and 64 years of age (5,271) are in the labor force, with 2.8% or 121 of them being unemployed. The group with the highest labor force participation rate are those with the educational attainment of bachelor's degree or higher, with 87.1% or 1,874 individuals in the labor force. Within the labor force, individuals with less than high school education have the highest percentage of unemployment, with 12.5% or 35 of them being unemployed.
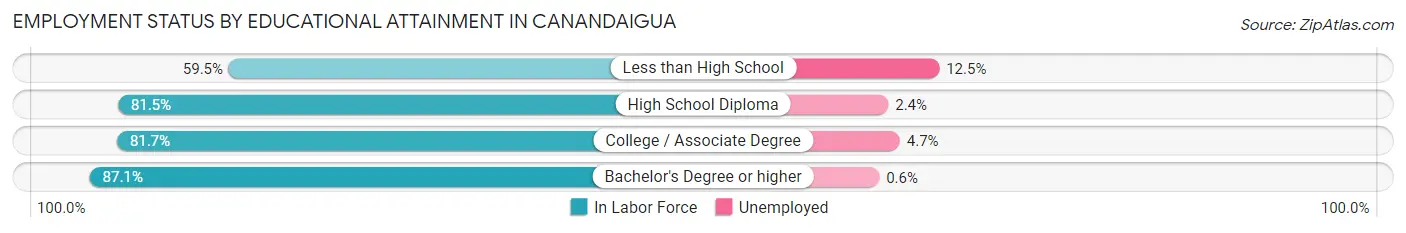
| Educational Attainment | In Labor Force | Unemployed |
| Less than High School | 279 (59.5%) | 59 (12.5%) |
| High School Diploma | 1,132 (81.5%) | 33 (2.4%) |
| College / Associate Degree | 1,031 (81.7%) | 59 (4.7%) |
| Bachelor's Degree or higher | 1,874 (87.1%) | 13 (0.6%) |
| Total | 4,317 (81.9%) | 148 (2.8%) |
Employment Occupations by Sex in Canandaigua
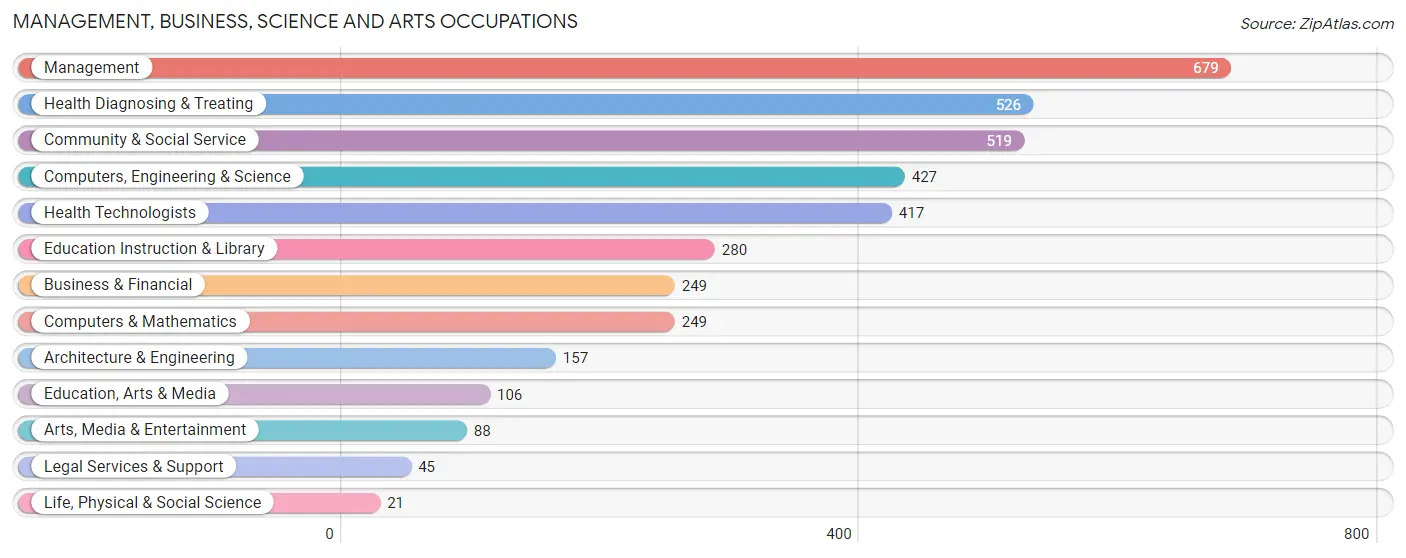
Management, Business, Science and Arts Occupations
The most common Management, Business, Science and Arts occupations in Canandaigua are Management (679 | 12.2%), Health Diagnosing & Treating (526 | 9.5%), Community & Social Service (519 | 9.3%), Computers, Engineering & Science (427 | 7.7%), and Health Technologists (417 | 7.5%).
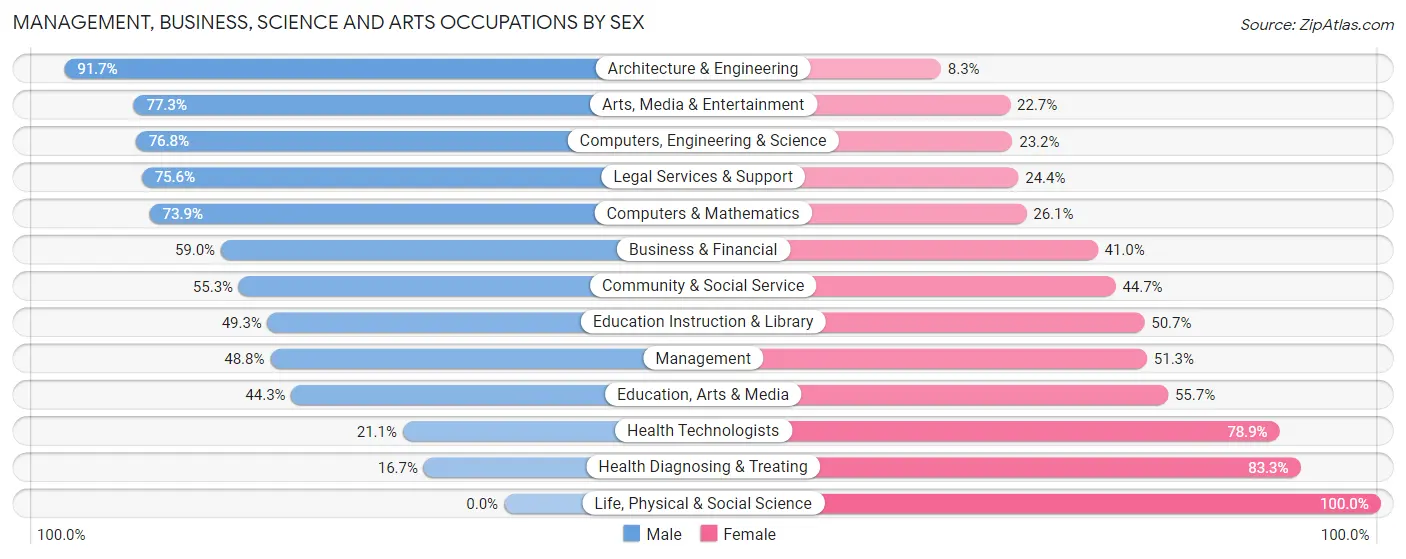
Management, Business, Science and Arts Occupations by Sex
Within the Management, Business, Science and Arts occupations in Canandaigua, the most male-oriented occupations are Architecture & Engineering (91.7%), Arts, Media & Entertainment (77.3%), and Computers, Engineering & Science (76.8%), while the most female-oriented occupations are Life, Physical & Social Science (100.0%), Health Diagnosing & Treating (83.3%), and Health Technologists (78.9%).
| Occupation | Male | Female |
| Management | 331 (48.7%) | 348 (51.2%) |
| Business & Financial | 147 (59.0%) | 102 (41.0%) |
| Computers, Engineering & Science | 328 (76.8%) | 99 (23.2%) |
| Computers & Mathematics | 184 (73.9%) | 65 (26.1%) |
| Architecture & Engineering | 144 (91.7%) | 13 (8.3%) |
| Life, Physical & Social Science | 0 (0.0%) | 21 (100.0%) |
| Community & Social Service | 287 (55.3%) | 232 (44.7%) |
| Education, Arts & Media | 47 (44.3%) | 59 (55.7%) |
| Legal Services & Support | 34 (75.6%) | 11 (24.4%) |
| Education Instruction & Library | 138 (49.3%) | 142 (50.7%) |
| Arts, Media & Entertainment | 68 (77.3%) | 20 (22.7%) |
| Health Diagnosing & Treating | 88 (16.7%) | 438 (83.3%) |
| Health Technologists | 88 (21.1%) | 329 (78.9%) |
| Total (Category) | 1,181 (49.2%) | 1,219 (50.8%) |
| Total (Overall) | 2,929 (52.6%) | 2,636 (47.4%) |
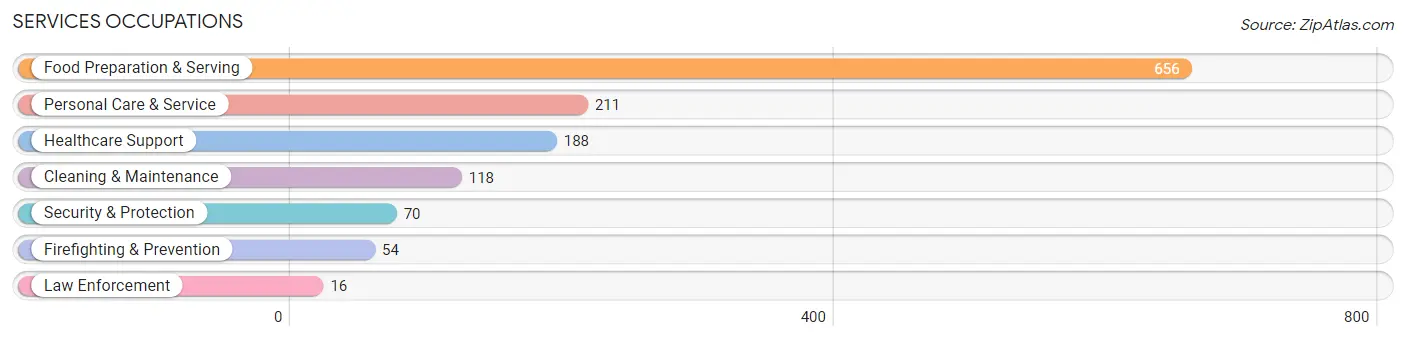
Services Occupations
The most common Services occupations in Canandaigua are Food Preparation & Serving (656 | 11.8%), Personal Care & Service (211 | 3.8%), Healthcare Support (188 | 3.4%), Cleaning & Maintenance (118 | 2.1%), and Security & Protection (70 | 1.3%).
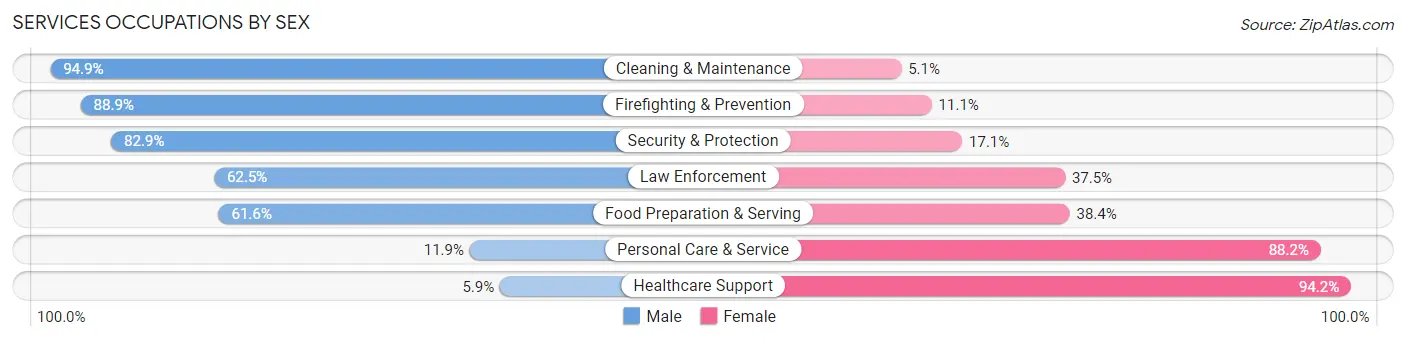
Services Occupations by Sex
Within the Services occupations in Canandaigua, the most male-oriented occupations are Cleaning & Maintenance (94.9%), Firefighting & Prevention (88.9%), and Security & Protection (82.9%), while the most female-oriented occupations are Healthcare Support (94.2%), Personal Care & Service (88.1%), and Food Preparation & Serving (38.4%).
| Occupation | Male | Female |
| Healthcare Support | 11 (5.9%) | 177 (94.2%) |
| Security & Protection | 58 (82.9%) | 12 (17.1%) |
| Firefighting & Prevention | 48 (88.9%) | 6 (11.1%) |
| Law Enforcement | 10 (62.5%) | 6 (37.5%) |
| Food Preparation & Serving | 404 (61.6%) | 252 (38.4%) |
| Cleaning & Maintenance | 112 (94.9%) | 6 (5.1%) |
| Personal Care & Service | 25 (11.8%) | 186 (88.1%) |
| Total (Category) | 610 (49.1%) | 633 (50.9%) |
| Total (Overall) | 2,929 (52.6%) | 2,636 (47.4%) |
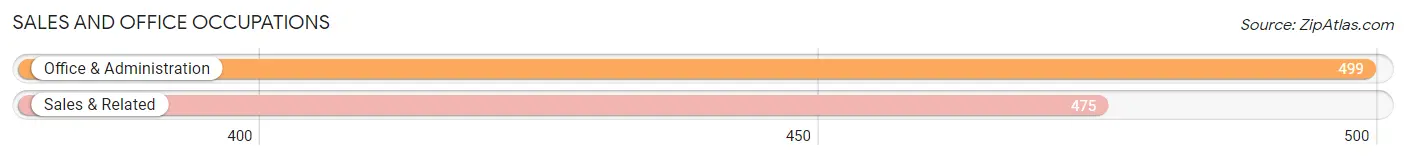
Sales and Office Occupations
The most common Sales and Office occupations in Canandaigua are Office & Administration (499 | 9.0%), and Sales & Related (475 | 8.5%).
Sales and Office Occupations by Sex
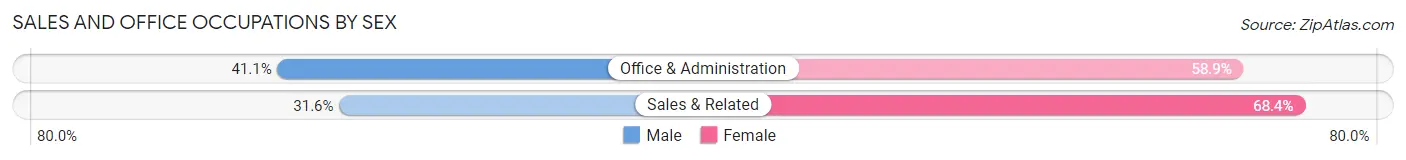
| Occupation | Male | Female |
| Sales & Related | 150 (31.6%) | 325 (68.4%) |
| Office & Administration | 205 (41.1%) | 294 (58.9%) |
| Total (Category) | 355 (36.4%) | 619 (63.5%) |
| Total (Overall) | 2,929 (52.6%) | 2,636 (47.4%) |
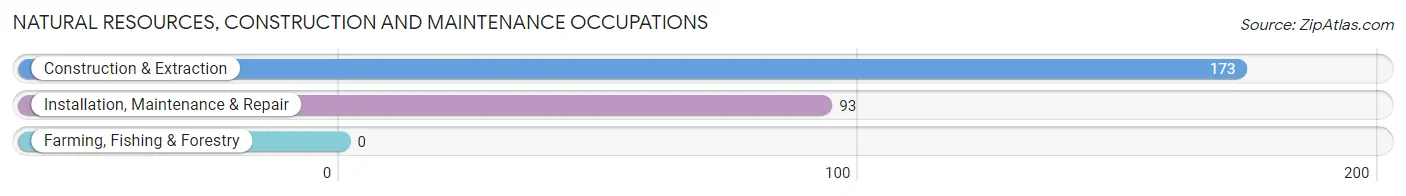
Natural Resources, Construction and Maintenance Occupations
The most common Natural Resources, Construction and Maintenance occupations in Canandaigua are Construction & Extraction (173 | 3.1%), and Installation, Maintenance & Repair (93 | 1.7%).
Natural Resources, Construction and Maintenance Occupations by Sex
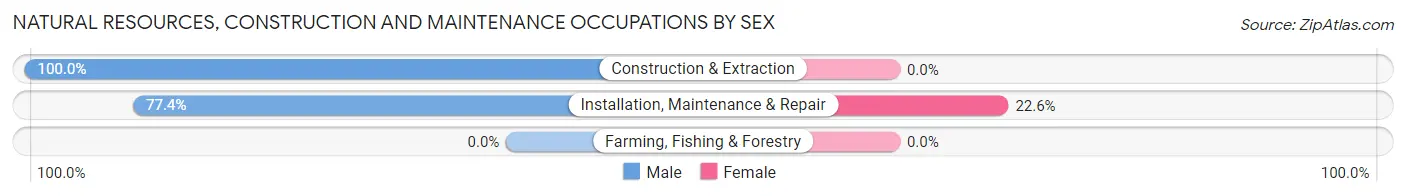
| Occupation | Male | Female |
| Farming, Fishing & Forestry | 0 (0.0%) | 0 (0.0%) |
| Construction & Extraction | 173 (100.0%) | 0 (0.0%) |
| Installation, Maintenance & Repair | 72 (77.4%) | 21 (22.6%) |
| Total (Category) | 245 (92.1%) | 21 (7.9%) |
| Total (Overall) | 2,929 (52.6%) | 2,636 (47.4%) |
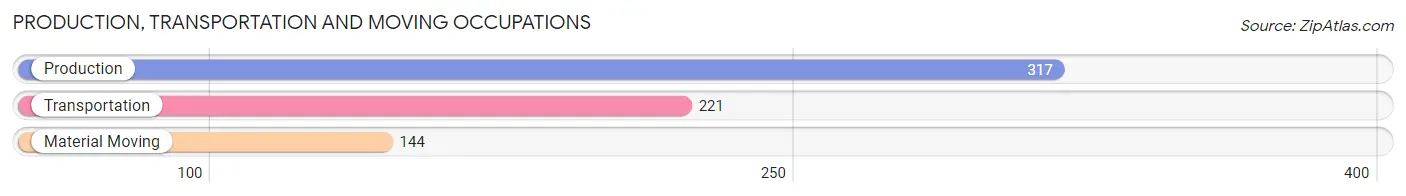
Production, Transportation and Moving Occupations
The most common Production, Transportation and Moving occupations in Canandaigua are Production (317 | 5.7%), Transportation (221 | 4.0%), and Material Moving (144 | 2.6%).
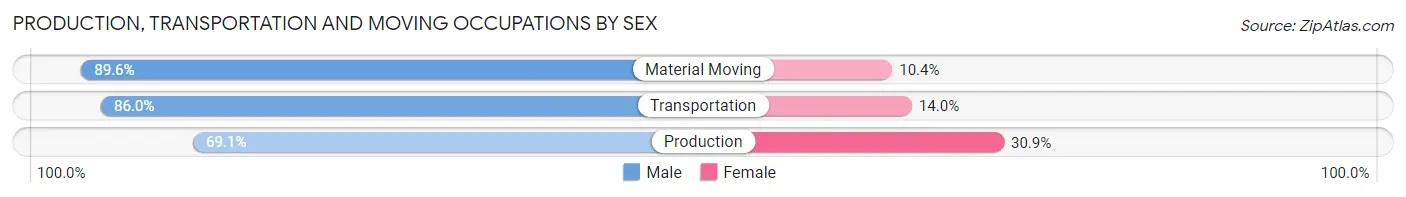
Production, Transportation and Moving Occupations by Sex
| Occupation | Male | Female |
| Production | 219 (69.1%) | 98 (30.9%) |
| Transportation | 190 (86.0%) | 31 (14.0%) |
| Material Moving | 129 (89.6%) | 15 (10.4%) |
| Total (Category) | 538 (78.9%) | 144 (21.1%) |
| Total (Overall) | 2,929 (52.6%) | 2,636 (47.4%) |
Employment Industries by Sex in Canandaigua
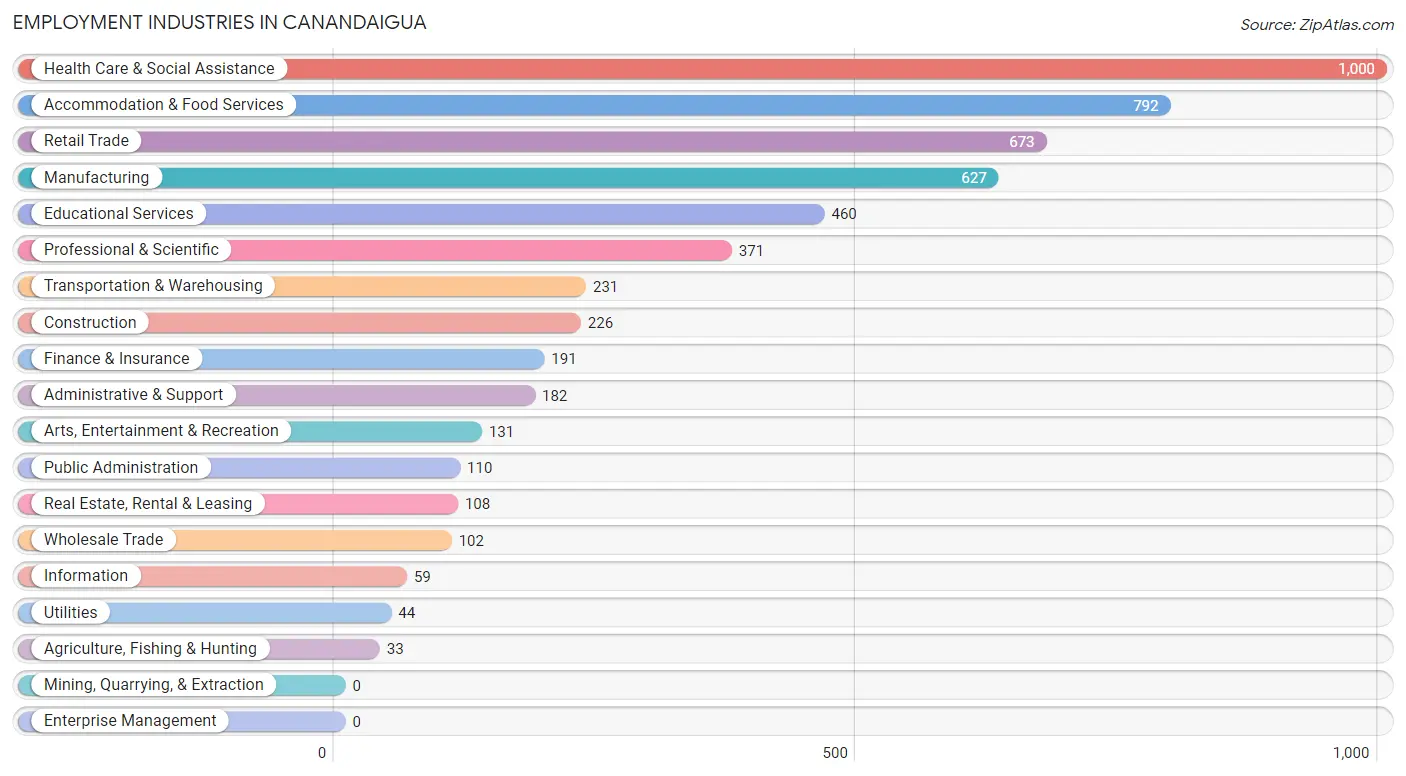
Employment Industries in Canandaigua
The major employment industries in Canandaigua include Health Care & Social Assistance (1,000 | 18.0%), Accommodation & Food Services (792 | 14.2%), Retail Trade (673 | 12.1%), Manufacturing (627 | 11.3%), and Educational Services (460 | 8.3%).
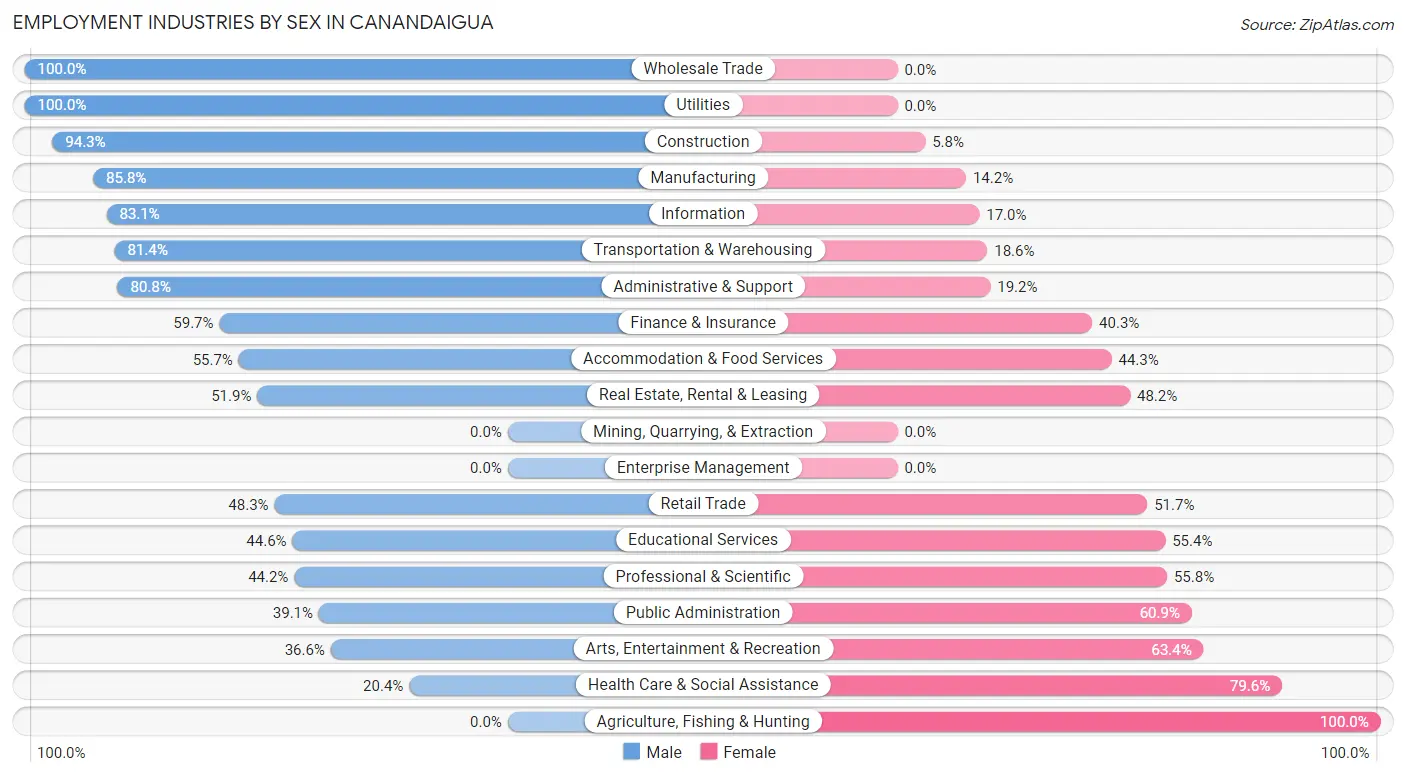
Employment Industries by Sex in Canandaigua
The Canandaigua industries that see more men than women are Wholesale Trade (100.0%), Utilities (100.0%), and Construction (94.3%), whereas the industries that tend to have a higher number of women are Agriculture, Fishing & Hunting (100.0%), Health Care & Social Assistance (79.6%), and Arts, Entertainment & Recreation (63.4%).
| Industry | Male | Female |
| Agriculture, Fishing & Hunting | 0 (0.0%) | 33 (100.0%) |
| Mining, Quarrying, & Extraction | 0 (0.0%) | 0 (0.0%) |
| Construction | 213 (94.3%) | 13 (5.8%) |
| Manufacturing | 538 (85.8%) | 89 (14.2%) |
| Wholesale Trade | 102 (100.0%) | 0 (0.0%) |
| Retail Trade | 325 (48.3%) | 348 (51.7%) |
| Transportation & Warehousing | 188 (81.4%) | 43 (18.6%) |
| Utilities | 44 (100.0%) | 0 (0.0%) |
| Information | 49 (83.1%) | 10 (17.0%) |
| Finance & Insurance | 114 (59.7%) | 77 (40.3%) |
| Real Estate, Rental & Leasing | 56 (51.8%) | 52 (48.1%) |
| Professional & Scientific | 164 (44.2%) | 207 (55.8%) |
| Enterprise Management | 0 (0.0%) | 0 (0.0%) |
| Administrative & Support | 147 (80.8%) | 35 (19.2%) |
| Educational Services | 205 (44.6%) | 255 (55.4%) |
| Health Care & Social Assistance | 204 (20.4%) | 796 (79.6%) |
| Arts, Entertainment & Recreation | 48 (36.6%) | 83 (63.4%) |
| Accommodation & Food Services | 441 (55.7%) | 351 (44.3%) |
| Public Administration | 43 (39.1%) | 67 (60.9%) |
| Total | 2,929 (52.6%) | 2,636 (47.4%) |
Education in Canandaigua
School Enrollment in Canandaigua
The most common levels of schooling among the 1,985 students in Canandaigua are high school (553 | 27.9%), college / undergraduate (457 | 23.0%), and elementary school (373 | 18.8%).
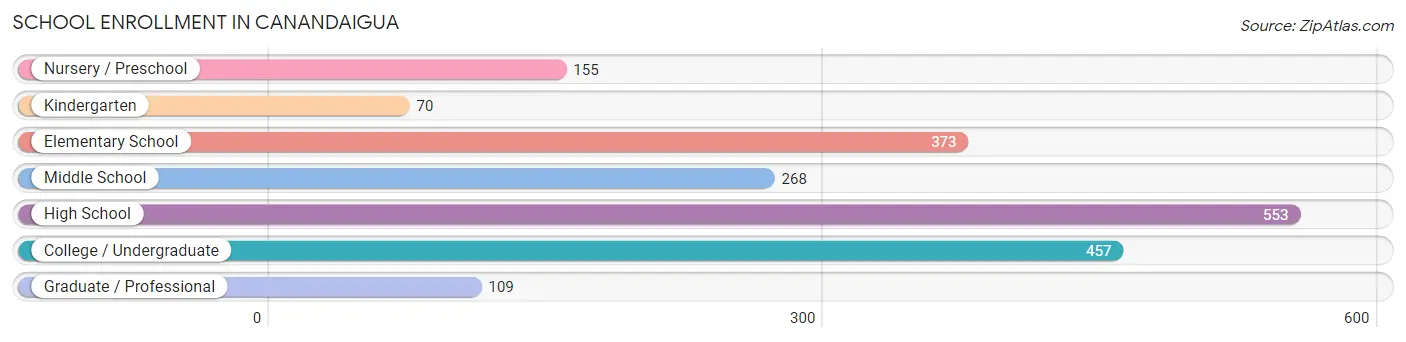
| School Level | # Students | % Students |
| Nursery / Preschool | 155 | 7.8% |
| Kindergarten | 70 | 3.5% |
| Elementary School | 373 | 18.8% |
| Middle School | 268 | 13.5% |
| High School | 553 | 27.9% |
| College / Undergraduate | 457 | 23.0% |
| Graduate / Professional | 109 | 5.5% |
| Total | 1,985 | 100.0% |
School Enrollment by Age by Funding Source in Canandaigua
Out of a total of 1,985 students who are enrolled in schools in Canandaigua, 244 (12.3%) attend a private institution, while the remaining 1,741 (87.7%) are enrolled in public schools. The age group of 35 years and over has the highest likelihood of being enrolled in private schools, with 36 (48.0% in the age bracket) enrolled. Conversely, the age group of 3 to 4 year olds has the lowest likelihood of being enrolled in a private school, with 129 (100.0% in the age bracket) attending a public institution.
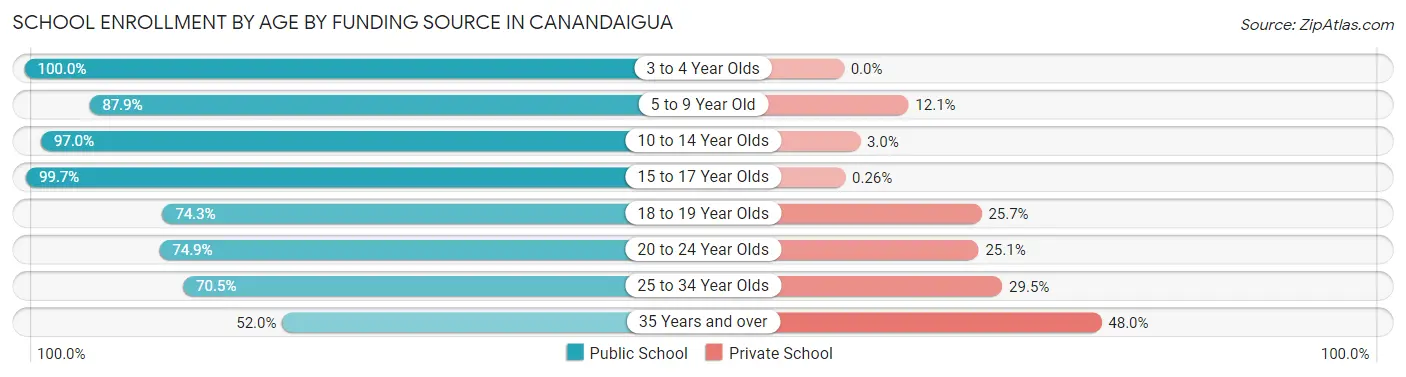
| Age Bracket | Public School | Private School |
| 3 to 4 Year Olds | 129 (100.0%) | 0 (0.0%) |
| 5 to 9 Year Old | 372 (87.9%) | 51 (12.1%) |
| 10 to 14 Year Olds | 415 (97.0%) | 13 (3.0%) |
| 15 to 17 Year Olds | 388 (99.7%) | 1 (0.3%) |
| 18 to 19 Year Olds | 113 (74.3%) | 39 (25.7%) |
| 20 to 24 Year Olds | 167 (74.9%) | 56 (25.1%) |
| 25 to 34 Year Olds | 117 (70.5%) | 49 (29.5%) |
| 35 Years and over | 39 (52.0%) | 36 (48.0%) |
| Total | 1,741 (87.7%) | 244 (12.3%) |
Educational Attainment by Field of Study in Canandaigua
Business (505 | 16.1%), education (462 | 14.7%), science & technology (425 | 13.5%), liberal arts & history (239 | 7.6%), and psychology (235 | 7.5%) are the most common fields of study among 3,138 individuals in Canandaigua who have obtained a bachelor's degree or higher.
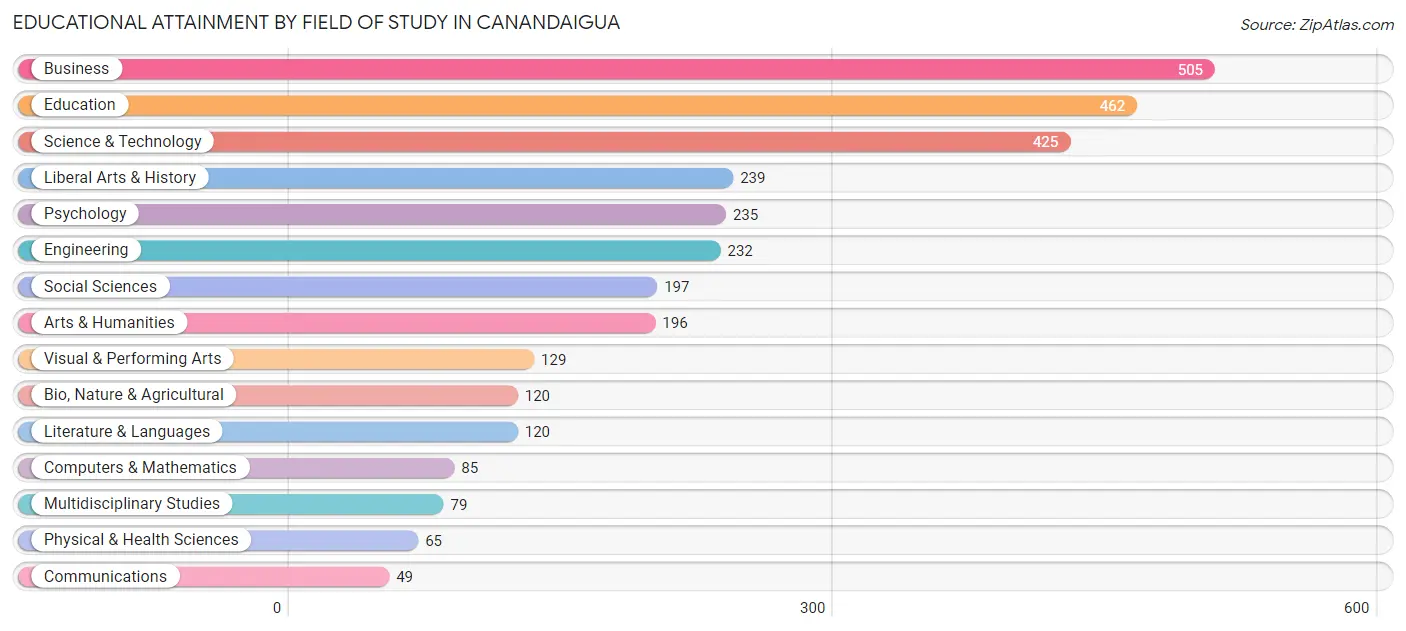
| Field of Study | # Graduates | % Graduates |
| Computers & Mathematics | 85 | 2.7% |
| Bio, Nature & Agricultural | 120 | 3.8% |
| Physical & Health Sciences | 65 | 2.1% |
| Psychology | 235 | 7.5% |
| Social Sciences | 197 | 6.3% |
| Engineering | 232 | 7.4% |
| Multidisciplinary Studies | 79 | 2.5% |
| Science & Technology | 425 | 13.5% |
| Business | 505 | 16.1% |
| Education | 462 | 14.7% |
| Literature & Languages | 120 | 3.8% |
| Liberal Arts & History | 239 | 7.6% |
| Visual & Performing Arts | 129 | 4.1% |
| Communications | 49 | 1.6% |
| Arts & Humanities | 196 | 6.2% |
| Total | 3,138 | 100.0% |
Transportation & Commute in Canandaigua
Vehicle Availability by Sex in Canandaigua
The most prevalent vehicle ownership categories in Canandaigua are males with 2 vehicles (1,100, accounting for 38.3%) and females with 2 vehicles (1,038, making up 43.5%).
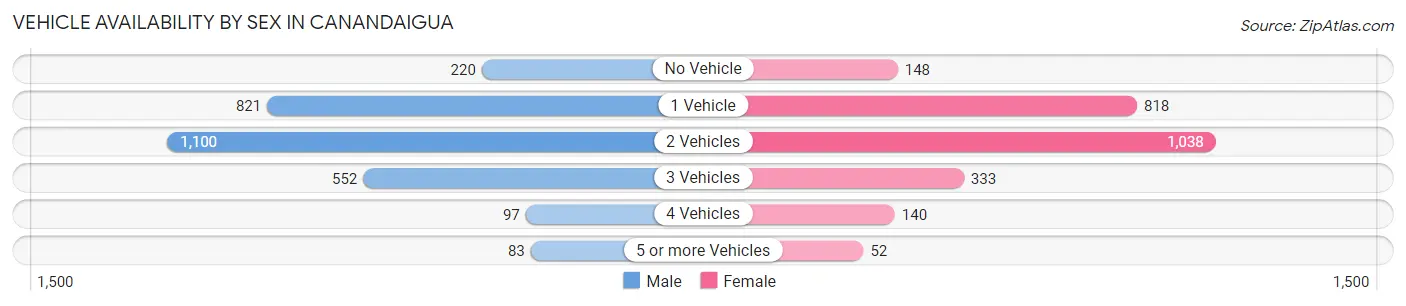
| Vehicles Available | Male | Female |
| No Vehicle | 220 (7.7%) | 148 (5.9%) |
| 1 Vehicle | 821 (28.6%) | 818 (32.3%) |
| 2 Vehicles | 1,100 (38.3%) | 1,038 (41.0%) |
| 3 Vehicles | 552 (19.2%) | 333 (13.2%) |
| 4 Vehicles | 97 (3.4%) | 140 (5.5%) |
| 5 or more Vehicles | 83 (2.9%) | 52 (2.1%) |
| Total | 2,873 (100.0%) | 2,529 (100.0%) |
Commute Time in Canandaigua
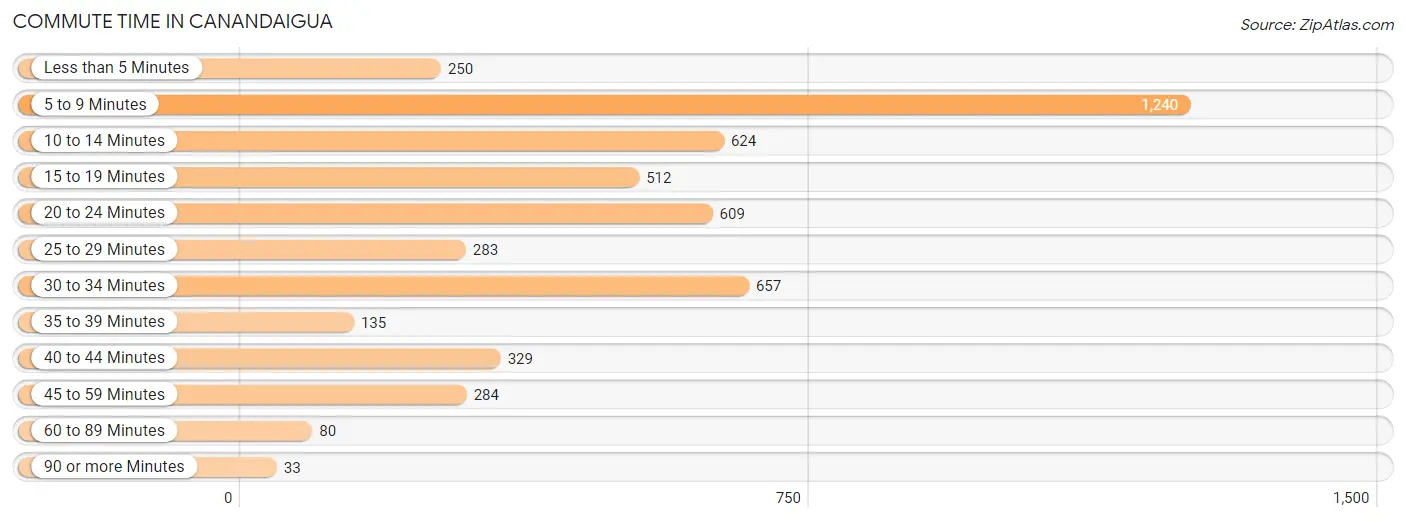
The most frequently occuring commute durations in Canandaigua are 5 to 9 minutes (1,240 commuters, 24.6%), 30 to 34 minutes (657 commuters, 13.1%), and 10 to 14 minutes (624 commuters, 12.4%).
| Commute Time | # Commuters | % Commuters |
| Less than 5 Minutes | 250 | 5.0% |
| 5 to 9 Minutes | 1,240 | 24.6% |
| 10 to 14 Minutes | 624 | 12.4% |
| 15 to 19 Minutes | 512 | 10.2% |
| 20 to 24 Minutes | 609 | 12.1% |
| 25 to 29 Minutes | 283 | 5.6% |
| 30 to 34 Minutes | 657 | 13.1% |
| 35 to 39 Minutes | 135 | 2.7% |
| 40 to 44 Minutes | 329 | 6.5% |
| 45 to 59 Minutes | 284 | 5.6% |
| 60 to 89 Minutes | 80 | 1.6% |
| 90 or more Minutes | 33 | 0.7% |
Commute Time by Sex in Canandaigua
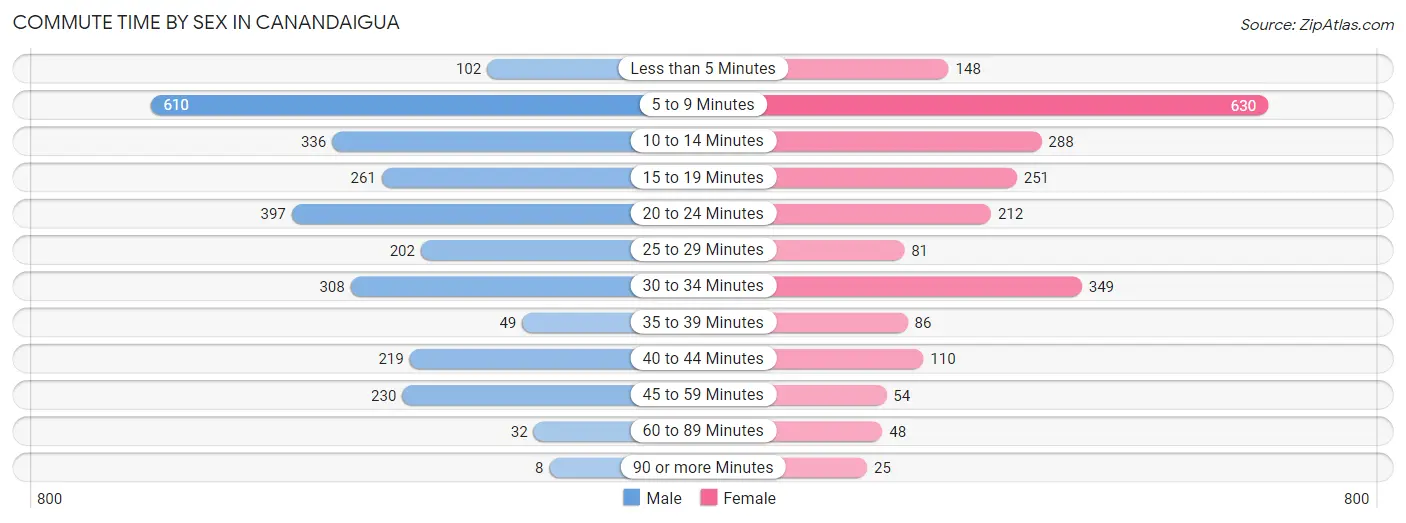
The most common commute times in Canandaigua are 5 to 9 minutes (610 commuters, 22.2%) for males and 5 to 9 minutes (630 commuters, 27.6%) for females.
| Commute Time | Male | Female |
| Less than 5 Minutes | 102 (3.7%) | 148 (6.5%) |
| 5 to 9 Minutes | 610 (22.2%) | 630 (27.6%) |
| 10 to 14 Minutes | 336 (12.2%) | 288 (12.6%) |
| 15 to 19 Minutes | 261 (9.5%) | 251 (11.0%) |
| 20 to 24 Minutes | 397 (14.4%) | 212 (9.3%) |
| 25 to 29 Minutes | 202 (7.3%) | 81 (3.5%) |
| 30 to 34 Minutes | 308 (11.2%) | 349 (15.3%) |
| 35 to 39 Minutes | 49 (1.8%) | 86 (3.8%) |
| 40 to 44 Minutes | 219 (8.0%) | 110 (4.8%) |
| 45 to 59 Minutes | 230 (8.4%) | 54 (2.4%) |
| 60 to 89 Minutes | 32 (1.2%) | 48 (2.1%) |
| 90 or more Minutes | 8 (0.3%) | 25 (1.1%) |
Time of Departure to Work by Sex in Canandaigua
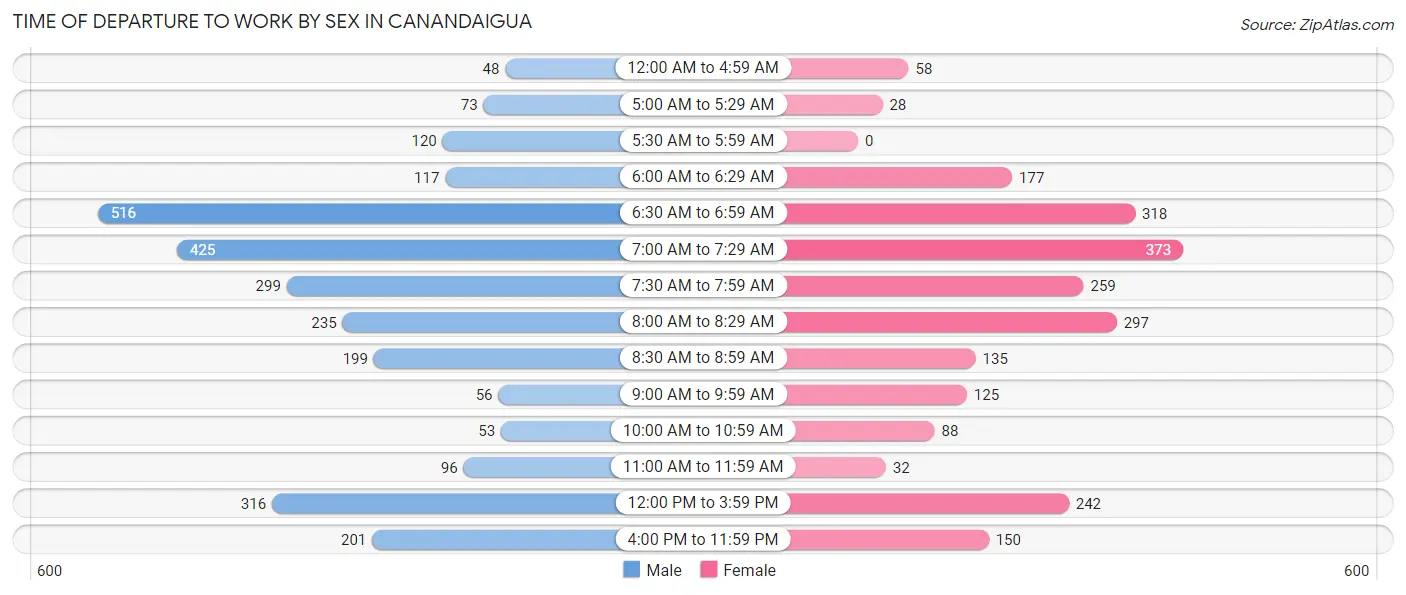
The most frequent times of departure to work in Canandaigua are 6:30 AM to 6:59 AM (516, 18.7%) for males and 7:00 AM to 7:29 AM (373, 16.4%) for females.
| Time of Departure | Male | Female |
| 12:00 AM to 4:59 AM | 48 (1.7%) | 58 (2.5%) |
| 5:00 AM to 5:29 AM | 73 (2.6%) | 28 (1.2%) |
| 5:30 AM to 5:59 AM | 120 (4.4%) | 0 (0.0%) |
| 6:00 AM to 6:29 AM | 117 (4.3%) | 177 (7.8%) |
| 6:30 AM to 6:59 AM | 516 (18.7%) | 318 (13.9%) |
| 7:00 AM to 7:29 AM | 425 (15.4%) | 373 (16.4%) |
| 7:30 AM to 7:59 AM | 299 (10.9%) | 259 (11.4%) |
| 8:00 AM to 8:29 AM | 235 (8.5%) | 297 (13.0%) |
| 8:30 AM to 8:59 AM | 199 (7.2%) | 135 (5.9%) |
| 9:00 AM to 9:59 AM | 56 (2.0%) | 125 (5.5%) |
| 10:00 AM to 10:59 AM | 53 (1.9%) | 88 (3.9%) |
| 11:00 AM to 11:59 AM | 96 (3.5%) | 32 (1.4%) |
| 12:00 PM to 3:59 PM | 316 (11.5%) | 242 (10.6%) |
| 4:00 PM to 11:59 PM | 201 (7.3%) | 150 (6.6%) |
| Total | 2,754 (100.0%) | 2,282 (100.0%) |
Housing Occupancy in Canandaigua
Occupancy by Ownership in Canandaigua
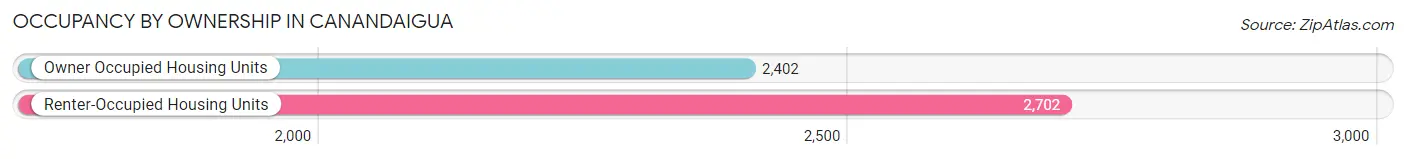
Of the total 5,104 dwellings in Canandaigua, owner-occupied units account for 2,402 (47.1%), while renter-occupied units make up 2,702 (52.9%).
| Occupancy | # Housing Units | % Housing Units |
| Owner Occupied Housing Units | 2,402 | 47.1% |
| Renter-Occupied Housing Units | 2,702 | 52.9% |
| Total Occupied Housing Units | 5,104 | 100.0% |
Occupancy by Household Size in Canandaigua
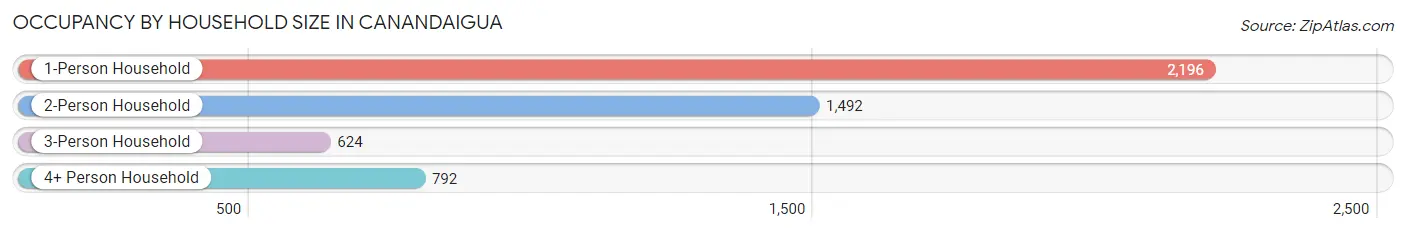
| Household Size | # Housing Units | % Housing Units |
| 1-Person Household | 2,196 | 43.0% |
| 2-Person Household | 1,492 | 29.2% |
| 3-Person Household | 624 | 12.2% |
| 4+ Person Household | 792 | 15.5% |
| Total Housing Units | 5,104 | 100.0% |
Occupancy by Ownership by Household Size in Canandaigua
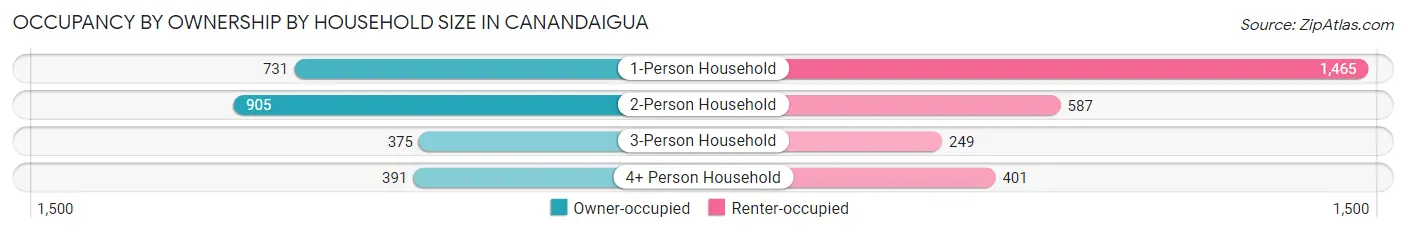
| Household Size | Owner-occupied | Renter-occupied |
| 1-Person Household | 731 (33.3%) | 1,465 (66.7%) |
| 2-Person Household | 905 (60.7%) | 587 (39.3%) |
| 3-Person Household | 375 (60.1%) | 249 (39.9%) |
| 4+ Person Household | 391 (49.4%) | 401 (50.6%) |
| Total Housing Units | 2,402 (47.1%) | 2,702 (52.9%) |
Occupancy by Educational Attainment in Canandaigua
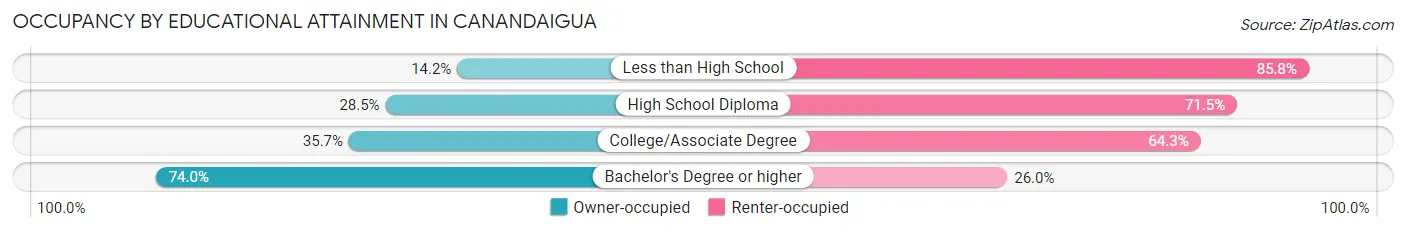
| Household Size | Owner-occupied | Renter-occupied |
| Less than High School | 38 (14.2%) | 229 (85.8%) |
| High School Diploma | 397 (28.5%) | 998 (71.5%) |
| College/Associate Degree | 541 (35.7%) | 974 (64.3%) |
| Bachelor's Degree or higher | 1,426 (74.0%) | 501 (26.0%) |
Occupancy by Age of Householder in Canandaigua
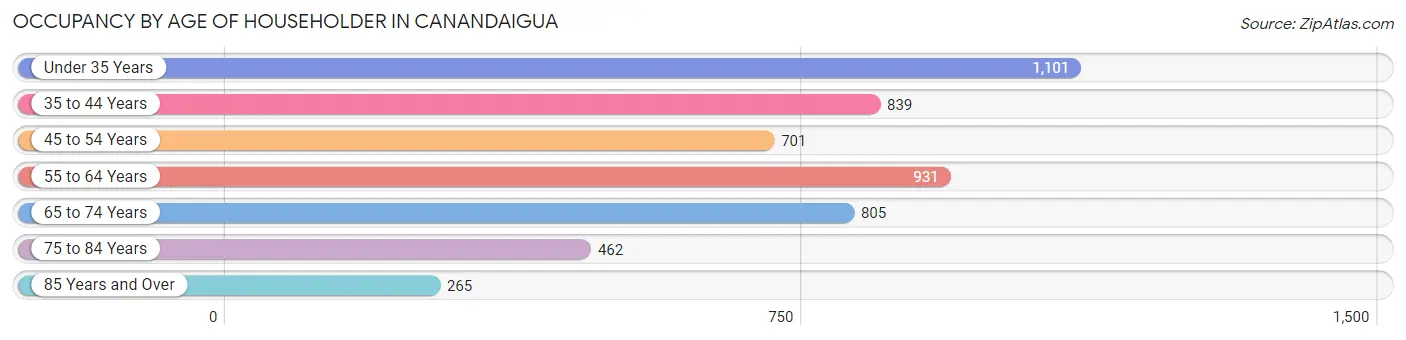
| Age Bracket | # Households | % Households |
| Under 35 Years | 1,101 | 21.6% |
| 35 to 44 Years | 839 | 16.4% |
| 45 to 54 Years | 701 | 13.7% |
| 55 to 64 Years | 931 | 18.2% |
| 65 to 74 Years | 805 | 15.8% |
| 75 to 84 Years | 462 | 9.0% |
| 85 Years and Over | 265 | 5.2% |
| Total | 5,104 | 100.0% |
Housing Finances in Canandaigua
Median Income by Occupancy in Canandaigua
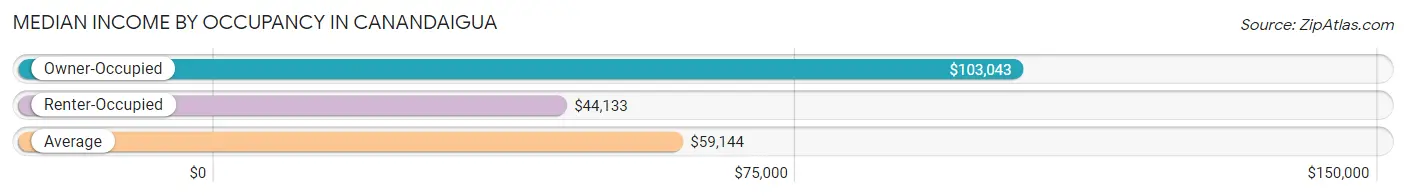
| Occupancy Type | # Households | Median Income |
| Owner-Occupied | 2,402 (47.1%) | $103,043 |
| Renter-Occupied | 2,702 (52.9%) | $44,133 |
| Average | 5,104 (100.0%) | $59,144 |
Occupancy by Householder Income Bracket in Canandaigua
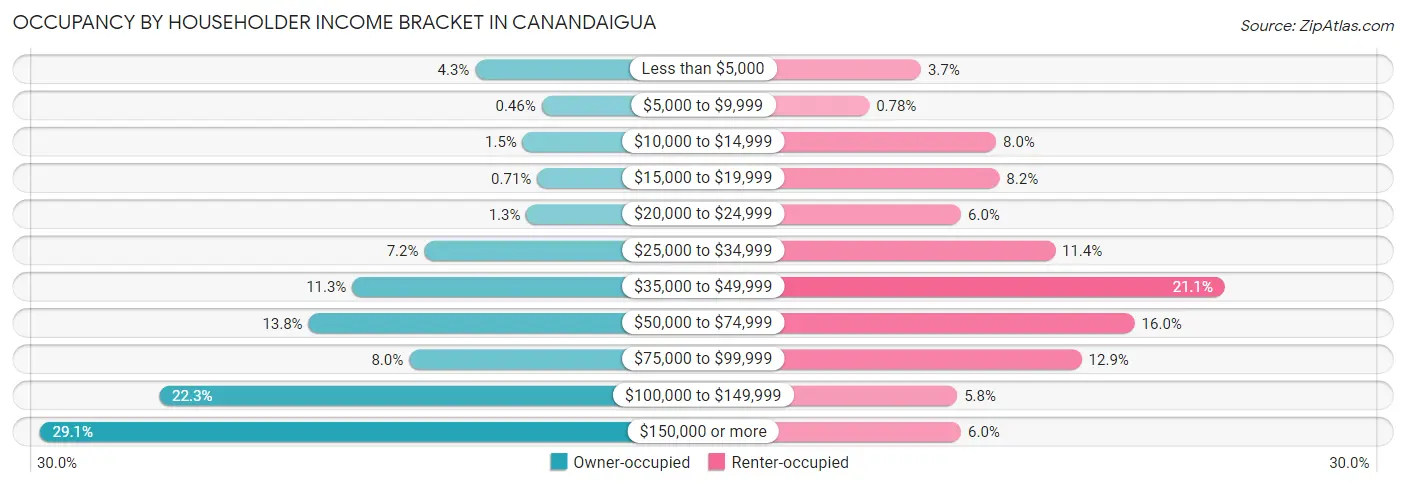
| Income Bracket | Owner-occupied | Renter-occupied |
| Less than $5,000 | 102 (4.3%) | 101 (3.7%) |
| $5,000 to $9,999 | 11 (0.5%) | 21 (0.8%) |
| $10,000 to $14,999 | 37 (1.5%) | 217 (8.0%) |
| $15,000 to $19,999 | 17 (0.7%) | 222 (8.2%) |
| $20,000 to $24,999 | 32 (1.3%) | 163 (6.0%) |
| $25,000 to $34,999 | 172 (7.2%) | 308 (11.4%) |
| $35,000 to $49,999 | 271 (11.3%) | 570 (21.1%) |
| $50,000 to $74,999 | 331 (13.8%) | 431 (16.0%) |
| $75,000 to $99,999 | 193 (8.0%) | 349 (12.9%) |
| $100,000 to $149,999 | 536 (22.3%) | 157 (5.8%) |
| $150,000 or more | 700 (29.1%) | 163 (6.0%) |
| Total | 2,402 (100.0%) | 2,702 (100.0%) |
Monthly Housing Cost Tiers in Canandaigua
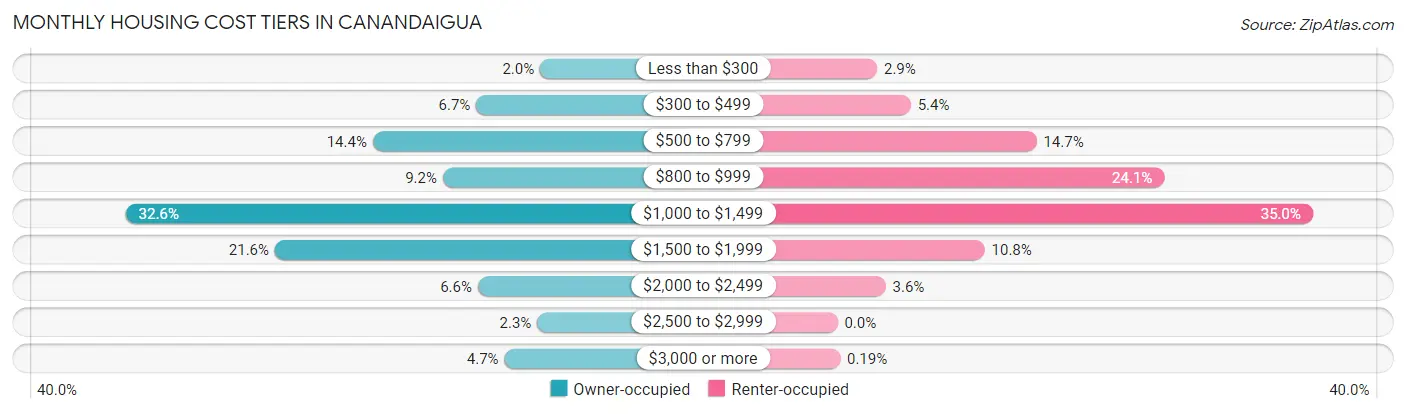
| Monthly Cost | Owner-occupied | Renter-occupied |
| Less than $300 | 49 (2.0%) | 79 (2.9%) |
| $300 to $499 | 162 (6.7%) | 146 (5.4%) |
| $500 to $799 | 345 (14.4%) | 396 (14.7%) |
| $800 to $999 | 221 (9.2%) | 650 (24.1%) |
| $1,000 to $1,499 | 782 (32.6%) | 946 (35.0%) |
| $1,500 to $1,999 | 518 (21.6%) | 293 (10.8%) |
| $2,000 to $2,499 | 159 (6.6%) | 96 (3.5%) |
| $2,500 to $2,999 | 54 (2.2%) | 0 (0.0%) |
| $3,000 or more | 112 (4.7%) | 5 (0.2%) |
| Total | 2,402 (100.0%) | 2,702 (100.0%) |
Physical Housing Characteristics in Canandaigua
Housing Structures in Canandaigua
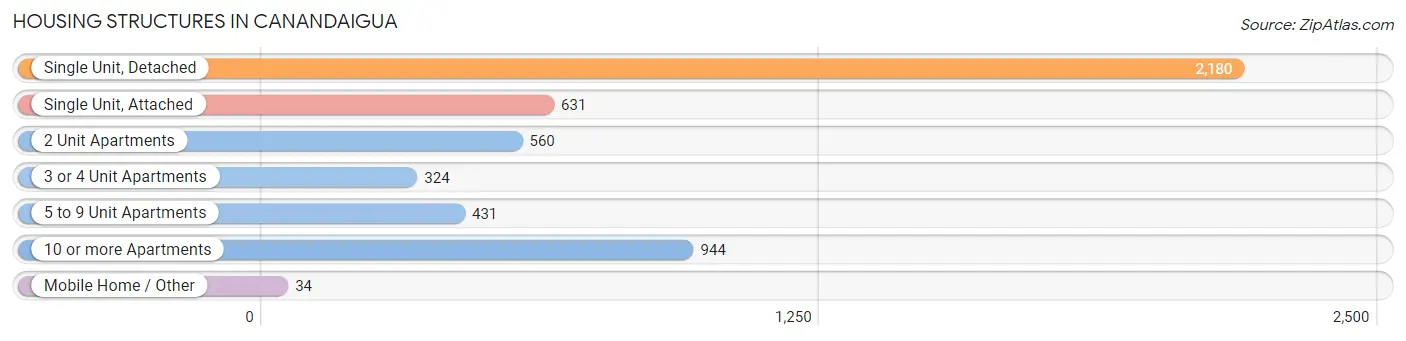
| Structure Type | # Housing Units | % Housing Units |
| Single Unit, Detached | 2,180 | 42.7% |
| Single Unit, Attached | 631 | 12.4% |
| 2 Unit Apartments | 560 | 11.0% |
| 3 or 4 Unit Apartments | 324 | 6.4% |
| 5 to 9 Unit Apartments | 431 | 8.4% |
| 10 or more Apartments | 944 | 18.5% |
| Mobile Home / Other | 34 | 0.7% |
| Total | 5,104 | 100.0% |
Housing Structures by Occupancy in Canandaigua
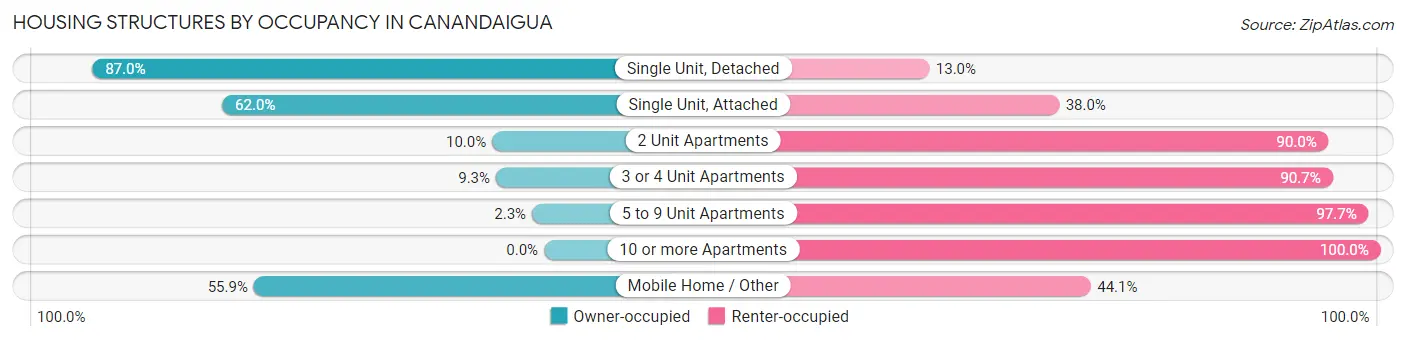
| Structure Type | Owner-occupied | Renter-occupied |
| Single Unit, Detached | 1,896 (87.0%) | 284 (13.0%) |
| Single Unit, Attached | 391 (62.0%) | 240 (38.0%) |
| 2 Unit Apartments | 56 (10.0%) | 504 (90.0%) |
| 3 or 4 Unit Apartments | 30 (9.3%) | 294 (90.7%) |
| 5 to 9 Unit Apartments | 10 (2.3%) | 421 (97.7%) |
| 10 or more Apartments | 0 (0.0%) | 944 (100.0%) |
| Mobile Home / Other | 19 (55.9%) | 15 (44.1%) |
| Total | 2,402 (47.1%) | 2,702 (52.9%) |
Housing Structures by Number of Rooms in Canandaigua
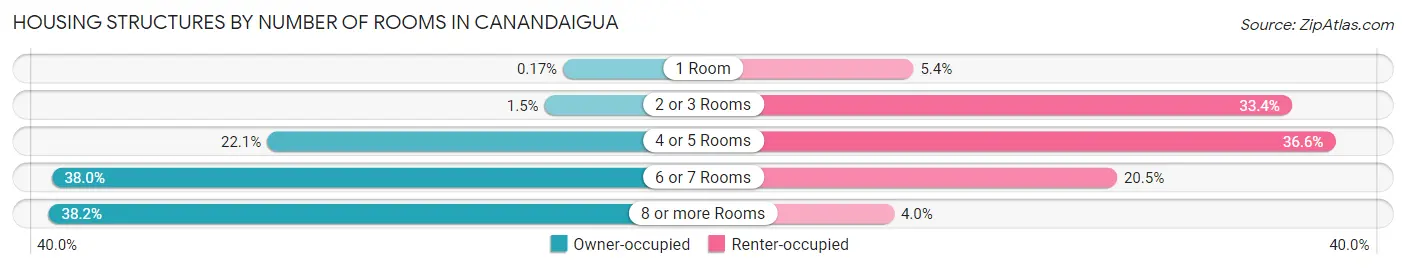
| Number of Rooms | Owner-occupied | Renter-occupied |
| 1 Room | 4 (0.2%) | 147 (5.4%) |
| 2 or 3 Rooms | 37 (1.5%) | 903 (33.4%) |
| 4 or 5 Rooms | 530 (22.1%) | 990 (36.6%) |
| 6 or 7 Rooms | 913 (38.0%) | 554 (20.5%) |
| 8 or more Rooms | 918 (38.2%) | 108 (4.0%) |
| Total | 2,402 (100.0%) | 2,702 (100.0%) |
Housing Structure by Heating Type in Canandaigua
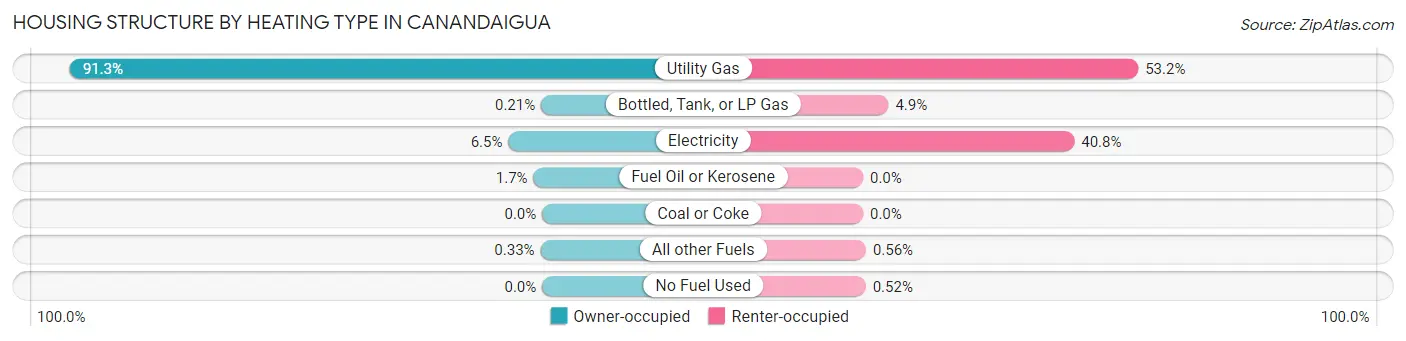
| Heating Type | Owner-occupied | Renter-occupied |
| Utility Gas | 2,192 (91.3%) | 1,437 (53.2%) |
| Bottled, Tank, or LP Gas | 5 (0.2%) | 133 (4.9%) |
| Electricity | 157 (6.5%) | 1,103 (40.8%) |
| Fuel Oil or Kerosene | 40 (1.7%) | 0 (0.0%) |
| Coal or Coke | 0 (0.0%) | 0 (0.0%) |
| All other Fuels | 8 (0.3%) | 15 (0.6%) |
| No Fuel Used | 0 (0.0%) | 14 (0.5%) |
| Total | 2,402 (100.0%) | 2,702 (100.0%) |
Household Vehicle Usage in Canandaigua
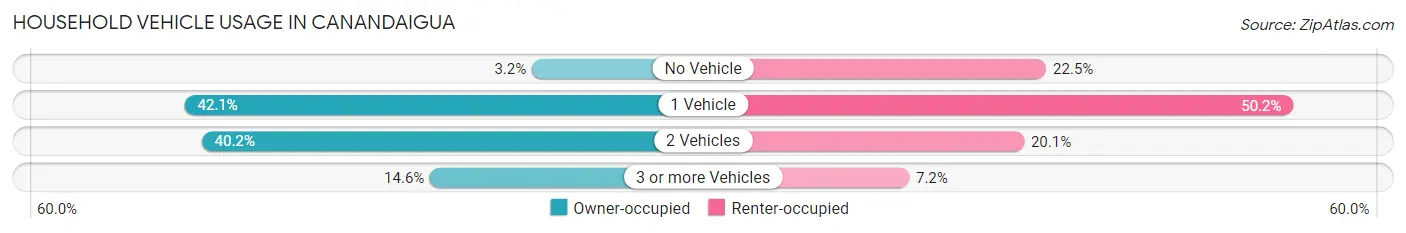
| Vehicles per Household | Owner-occupied | Renter-occupied |
| No Vehicle | 76 (3.2%) | 609 (22.5%) |
| 1 Vehicle | 1,011 (42.1%) | 1,357 (50.2%) |
| 2 Vehicles | 965 (40.2%) | 542 (20.1%) |
| 3 or more Vehicles | 350 (14.6%) | 194 (7.2%) |
| Total | 2,402 (100.0%) | 2,702 (100.0%) |
Real Estate & Mortgages in Canandaigua
Real Estate and Mortgage Overview in Canandaigua
| Characteristic | Without Mortgage | With Mortgage |
| Housing Units | 999 | 1,403 |
| Median Property Value | $224,800 | $201,400 |
| Median Household Income | $60,089 | $534 |
| Monthly Housing Costs | $765 | $112 |
| Real Estate Taxes | $5,529 | $13 |
Property Value by Mortgage Status in Canandaigua
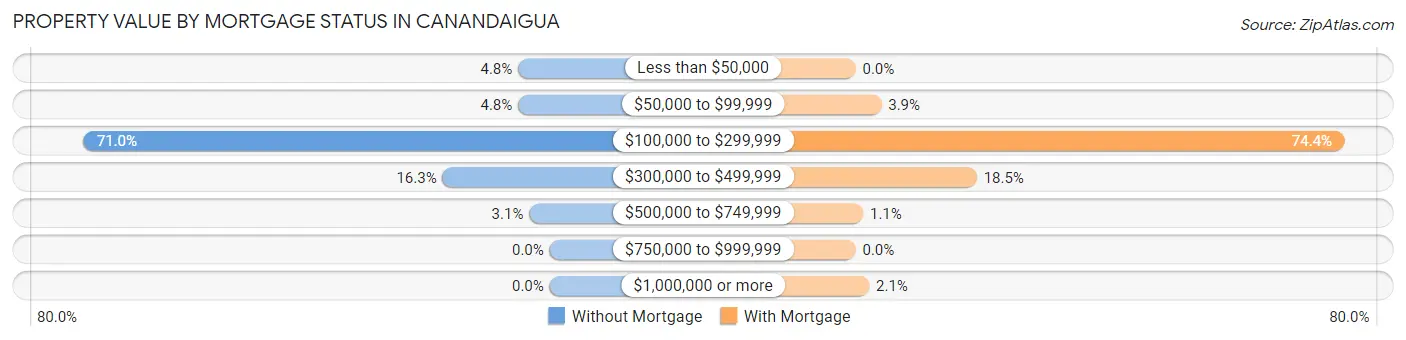
| Property Value | Without Mortgage | With Mortgage |
| Less than $50,000 | 48 (4.8%) | 0 (0.0%) |
| $50,000 to $99,999 | 48 (4.8%) | 55 (3.9%) |
| $100,000 to $299,999 | 709 (71.0%) | 1,044 (74.4%) |
| $300,000 to $499,999 | 163 (16.3%) | 259 (18.5%) |
| $500,000 to $749,999 | 31 (3.1%) | 16 (1.1%) |
| $750,000 to $999,999 | 0 (0.0%) | 0 (0.0%) |
| $1,000,000 or more | 0 (0.0%) | 29 (2.1%) |
| Total | 999 (100.0%) | 1,403 (100.0%) |
Household Income by Mortgage Status in Canandaigua
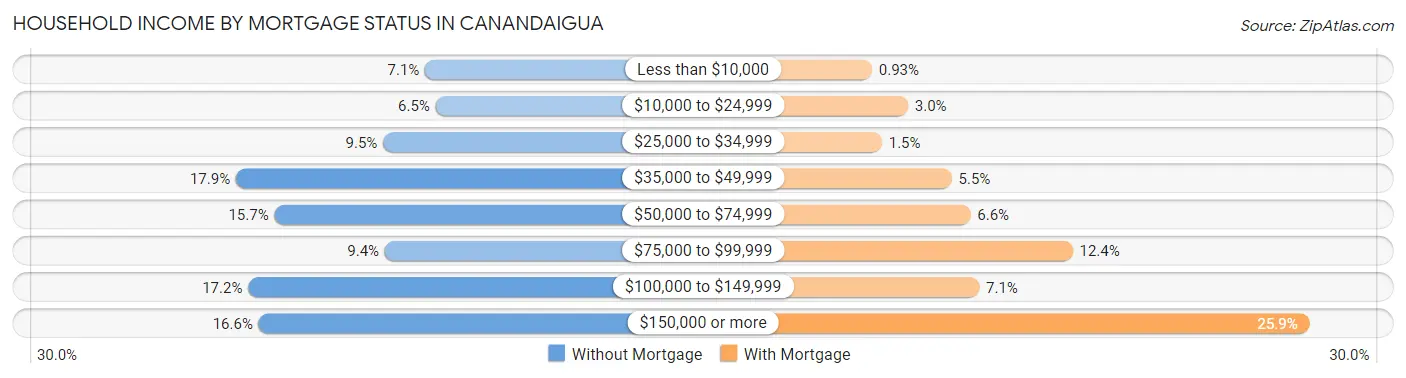
| Household Income | Without Mortgage | With Mortgage |
| Less than $10,000 | 71 (7.1%) | 13 (0.9%) |
| $10,000 to $24,999 | 65 (6.5%) | 42 (3.0%) |
| $25,000 to $34,999 | 95 (9.5%) | 21 (1.5%) |
| $35,000 to $49,999 | 179 (17.9%) | 77 (5.5%) |
| $50,000 to $74,999 | 157 (15.7%) | 92 (6.6%) |
| $75,000 to $99,999 | 94 (9.4%) | 174 (12.4%) |
| $100,000 to $149,999 | 172 (17.2%) | 99 (7.1%) |
| $150,000 or more | 166 (16.6%) | 364 (25.9%) |
| Total | 999 (100.0%) | 1,403 (100.0%) |
Property Value to Household Income Ratio in Canandaigua
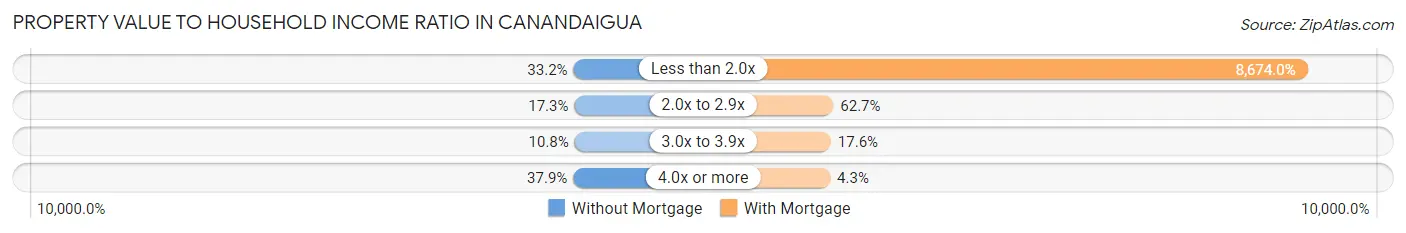
| Value-to-Income Ratio | Without Mortgage | With Mortgage |
| Less than 2.0x | 332 (33.2%) | 121,696 (8,674.0%) |
| 2.0x to 2.9x | 173 (17.3%) | 879 (62.6%) |
| 3.0x to 3.9x | 108 (10.8%) | 247 (17.6%) |
| 4.0x or more | 379 (37.9%) | 60 (4.3%) |
| Total | 999 (100.0%) | 1,403 (100.0%) |
Real Estate Taxes by Mortgage Status in Canandaigua
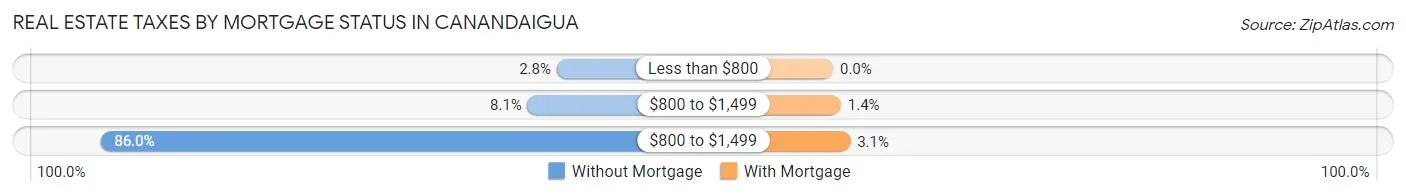
| Property Taxes | Without Mortgage | With Mortgage |
| Less than $800 | 28 (2.8%) | 0 (0.0%) |
| $800 to $1,499 | 81 (8.1%) | 20 (1.4%) |
| $800 to $1,499 | 859 (86.0%) | 44 (3.1%) |
| Total | 999 (100.0%) | 1,403 (100.0%) |
Health & Disability in Canandaigua
Health Insurance Coverage by Age in Canandaigua
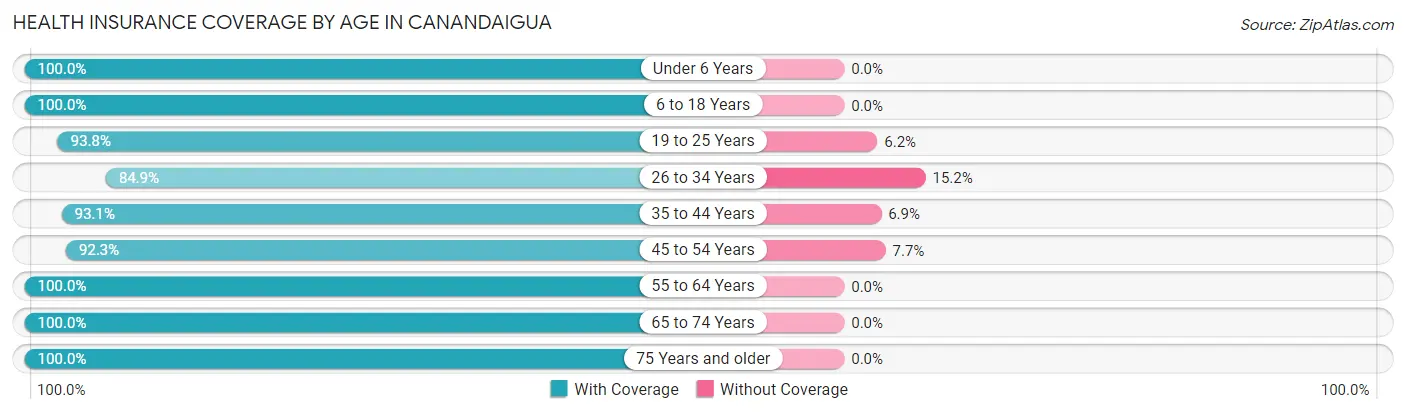
| Age Bracket | With Coverage | Without Coverage |
| Under 6 Years | 454 (100.0%) | 0 (0.0%) |
| 6 to 18 Years | 1,329 (100.0%) | 0 (0.0%) |
| 19 to 25 Years | 1,371 (93.8%) | 90 (6.2%) |
| 26 to 34 Years | 879 (84.9%) | 157 (15.1%) |
| 35 to 44 Years | 1,337 (93.1%) | 99 (6.9%) |
| 45 to 54 Years | 1,138 (92.3%) | 95 (7.7%) |
| 55 to 64 Years | 1,268 (100.0%) | 0 (0.0%) |
| 65 to 74 Years | 1,192 (100.0%) | 0 (0.0%) |
| 75 Years and older | 1,015 (100.0%) | 0 (0.0%) |
| Total | 9,983 (95.8%) | 441 (4.2%) |
Health Insurance Coverage by Citizenship Status in Canandaigua
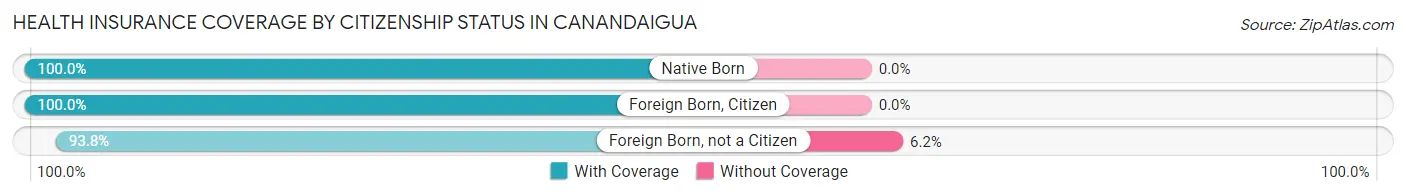
| Citizenship Status | With Coverage | Without Coverage |
| Native Born | 454 (100.0%) | 0 (0.0%) |
| Foreign Born, Citizen | 1,329 (100.0%) | 0 (0.0%) |
| Foreign Born, not a Citizen | 1,371 (93.8%) | 90 (6.2%) |
Health Insurance Coverage by Household Income in Canandaigua
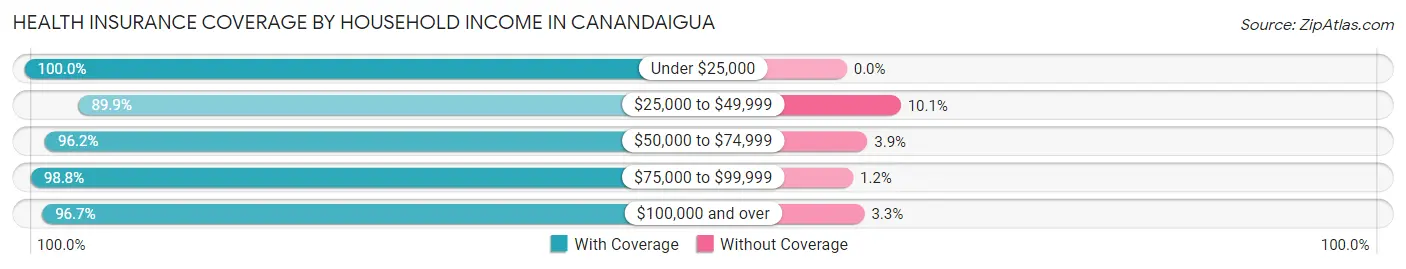
| Household Income | With Coverage | Without Coverage |
| Under $25,000 | 1,027 (100.0%) | 0 (0.0%) |
| $25,000 to $49,999 | 2,030 (89.9%) | 228 (10.1%) |
| $50,000 to $74,999 | 1,275 (96.2%) | 51 (3.8%) |
| $75,000 to $99,999 | 1,343 (98.8%) | 16 (1.2%) |
| $100,000 and over | 4,173 (96.7%) | 143 (3.3%) |
Public vs Private Health Insurance Coverage by Age in Canandaigua
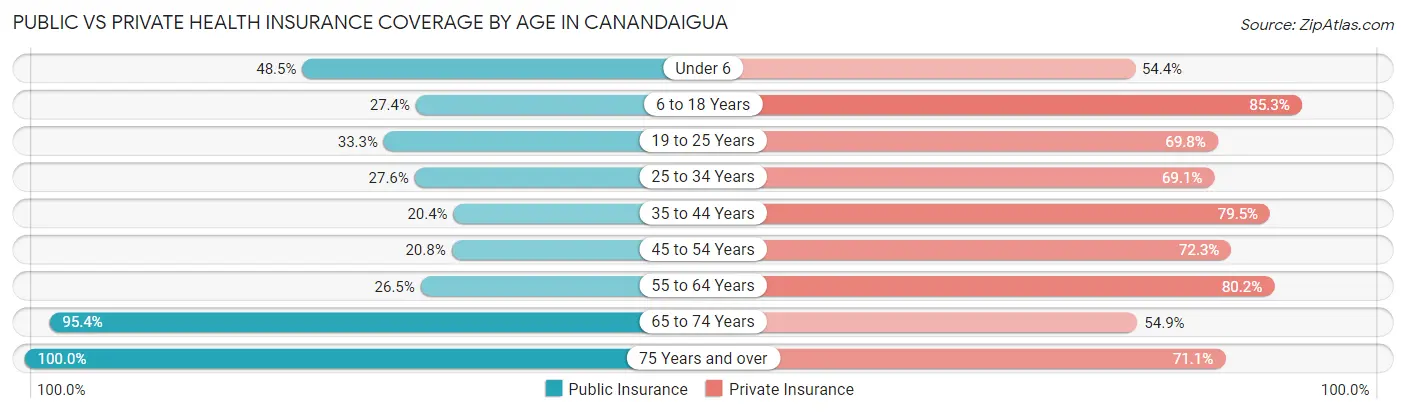
| Age Bracket | Public Insurance | Private Insurance |
| Under 6 | 220 (48.5%) | 247 (54.4%) |
| 6 to 18 Years | 364 (27.4%) | 1,134 (85.3%) |
| 19 to 25 Years | 487 (33.3%) | 1,019 (69.8%) |
| 25 to 34 Years | 286 (27.6%) | 716 (69.1%) |
| 35 to 44 Years | 293 (20.4%) | 1,141 (79.5%) |
| 45 to 54 Years | 256 (20.8%) | 891 (72.3%) |
| 55 to 64 Years | 336 (26.5%) | 1,017 (80.2%) |
| 65 to 74 Years | 1,137 (95.4%) | 654 (54.9%) |
| 75 Years and over | 1,015 (100.0%) | 722 (71.1%) |
| Total | 4,394 (42.1%) | 7,541 (72.3%) |
Disability Status by Sex by Age in Canandaigua
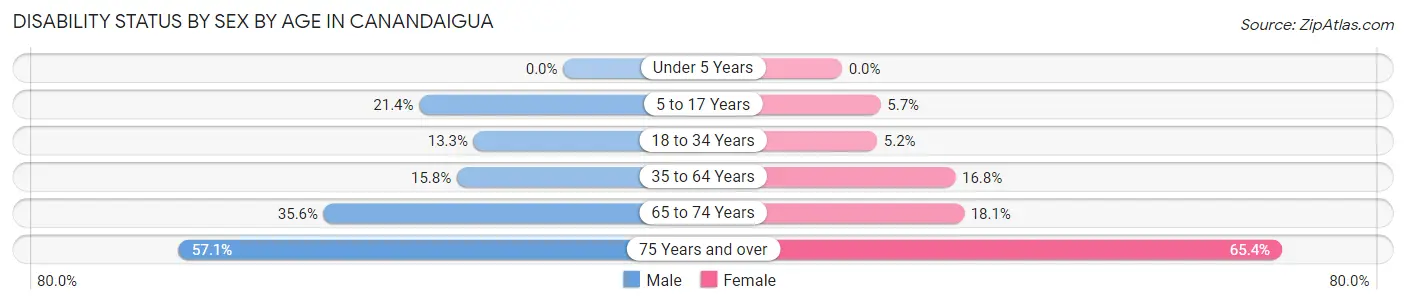
| Age Bracket | Male | Female |
| Under 5 Years | 0 (0.0%) | 0 (0.0%) |
| 5 to 17 Years | 136 (21.4%) | 37 (5.7%) |
| 18 to 34 Years | 196 (13.3%) | 59 (5.2%) |
| 35 to 64 Years | 295 (15.8%) | 348 (16.8%) |
| 65 to 74 Years | 192 (35.6%) | 118 (18.1%) |
| 75 Years and over | 133 (57.1%) | 511 (65.3%) |
Disability Class by Sex by Age in Canandaigua
Disability Class: Hearing Difficulty
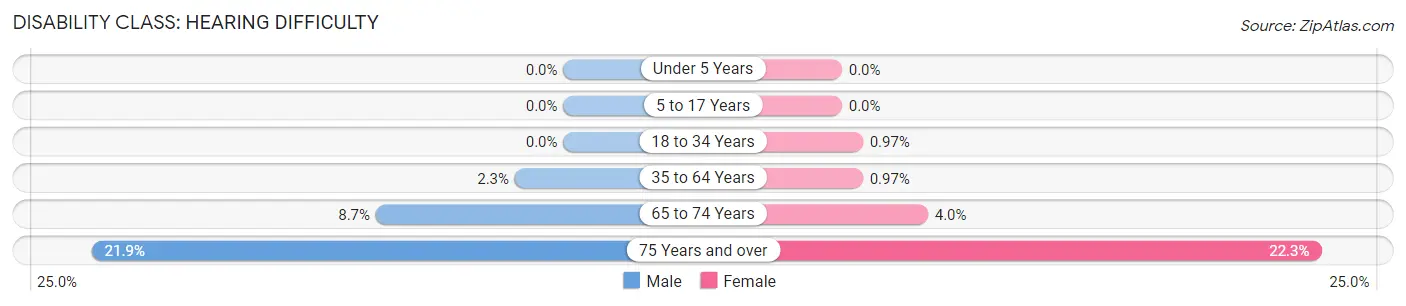
| Age Bracket | Male | Female |
| Under 5 Years | 0 (0.0%) | 0 (0.0%) |
| 5 to 17 Years | 0 (0.0%) | 0 (0.0%) |
| 18 to 34 Years | 0 (0.0%) | 11 (1.0%) |
| 35 to 64 Years | 42 (2.2%) | 20 (1.0%) |
| 65 to 74 Years | 47 (8.7%) | 26 (4.0%) |
| 75 Years and over | 51 (21.9%) | 174 (22.3%) |
Disability Class: Vision Difficulty
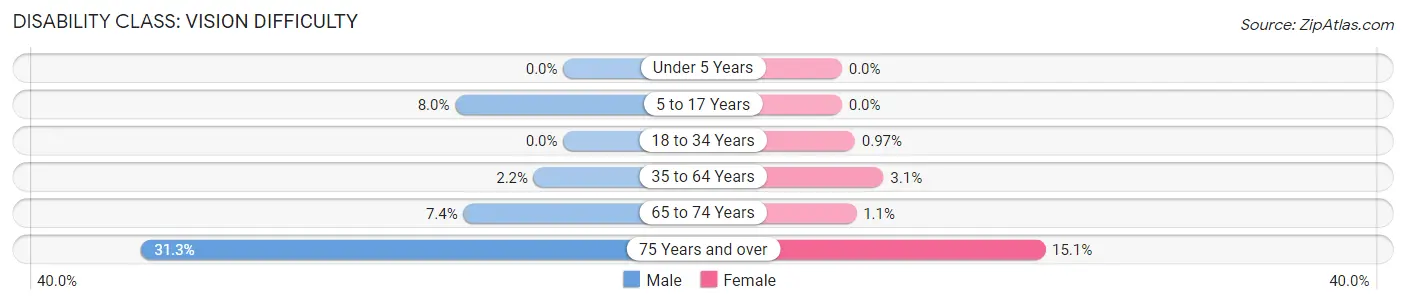
| Age Bracket | Male | Female |
| Under 5 Years | 0 (0.0%) | 0 (0.0%) |
| 5 to 17 Years | 51 (8.0%) | 0 (0.0%) |
| 18 to 34 Years | 0 (0.0%) | 11 (1.0%) |
| 35 to 64 Years | 41 (2.2%) | 64 (3.1%) |
| 65 to 74 Years | 40 (7.4%) | 7 (1.1%) |
| 75 Years and over | 73 (31.3%) | 118 (15.1%) |
Disability Class: Cognitive Difficulty
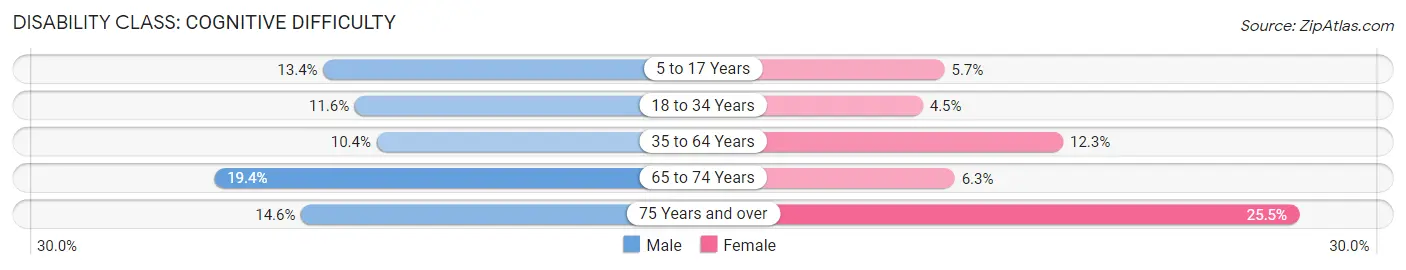
| Age Bracket | Male | Female |
| 5 to 17 Years | 85 (13.4%) | 37 (5.7%) |
| 18 to 34 Years | 171 (11.6%) | 51 (4.5%) |
| 35 to 64 Years | 194 (10.4%) | 255 (12.3%) |
| 65 to 74 Years | 105 (19.4%) | 41 (6.3%) |
| 75 Years and over | 34 (14.6%) | 199 (25.5%) |
Disability Class: Ambulatory Difficulty
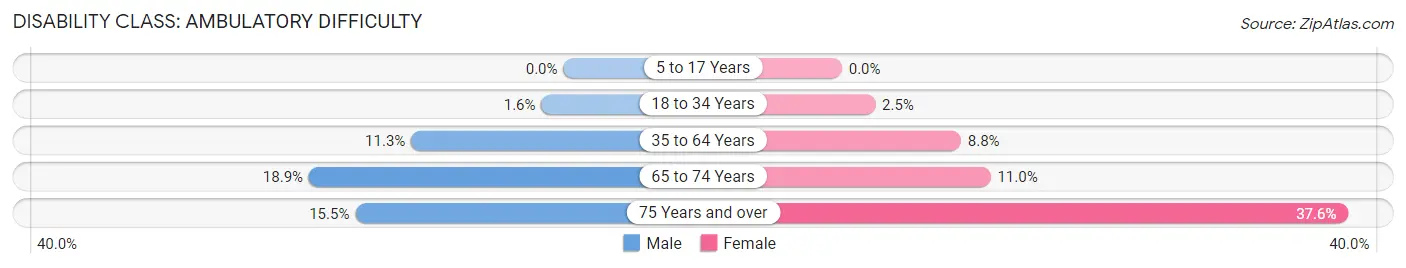
| Age Bracket | Male | Female |
| 5 to 17 Years | 0 (0.0%) | 0 (0.0%) |
| 18 to 34 Years | 24 (1.6%) | 28 (2.5%) |
| 35 to 64 Years | 211 (11.3%) | 183 (8.8%) |
| 65 to 74 Years | 102 (18.9%) | 72 (11.0%) |
| 75 Years and over | 36 (15.4%) | 294 (37.6%) |
Disability Class: Self-Care Difficulty
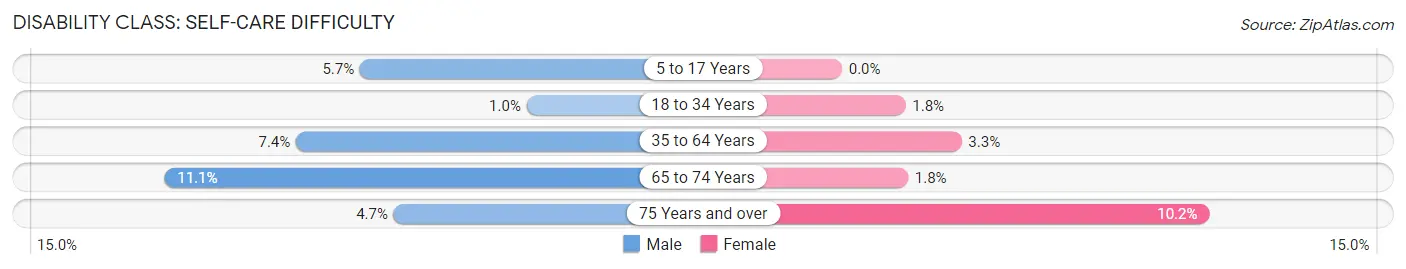
| Age Bracket | Male | Female |
| 5 to 17 Years | 36 (5.7%) | 0 (0.0%) |
| 18 to 34 Years | 15 (1.0%) | 20 (1.8%) |
| 35 to 64 Years | 139 (7.4%) | 69 (3.3%) |
| 65 to 74 Years | 60 (11.1%) | 12 (1.8%) |
| 75 Years and over | 11 (4.7%) | 80 (10.2%) |
Technology Access in Canandaigua
Computing Device Access in Canandaigua
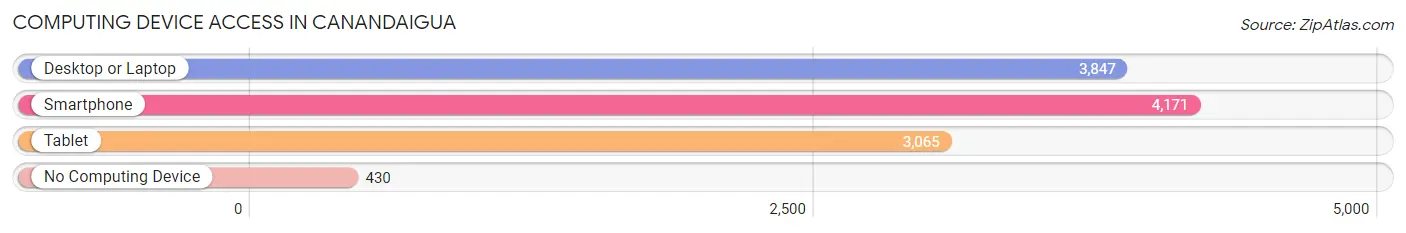
| Device Type | # Households | % Households |
| Desktop or Laptop | 3,847 | 75.4% |
| Smartphone | 4,171 | 81.7% |
| Tablet | 3,065 | 60.1% |
| No Computing Device | 430 | 8.4% |
| Total | 5,104 | 100.0% |
Internet Access in Canandaigua
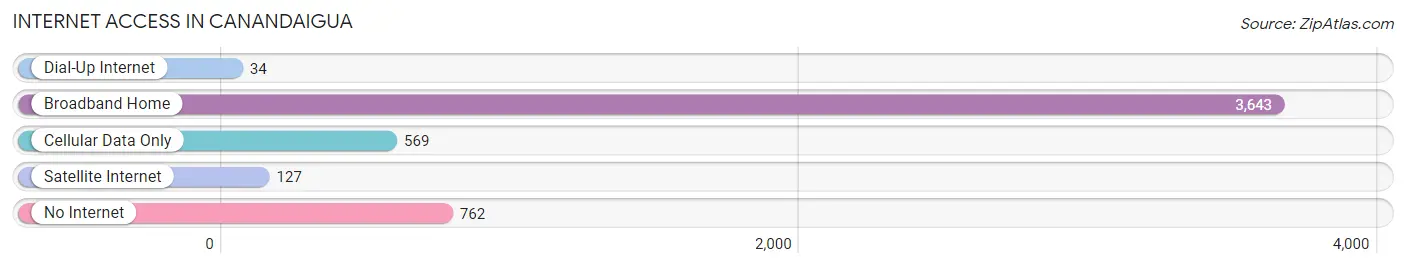
| Internet Type | # Households | % Households |
| Dial-Up Internet | 34 | 0.7% |
| Broadband Home | 3,643 | 71.4% |
| Cellular Data Only | 569 | 11.2% |
| Satellite Internet | 127 | 2.5% |
| No Internet | 762 | 14.9% |
| Total | 5,104 | 100.0% |
Canandaigua Summary
Canandaigua, NY is a small city located in the Finger Lakes region of New York State. It is the county seat of Ontario County and is situated on the north shore of Canandaigua Lake, one of the Finger Lakes. The city has a population of around 10,000 people and is a popular tourist destination due to its proximity to the Finger Lakes and its many attractions.
History
Canandaigua was originally inhabited by the Seneca Nation of the Iroquois Confederacy. The name “Canandaigua” is derived from the Seneca word “Kanandarque”, which means “the chosen spot”. The area was first settled by Europeans in 1789, when the Phelps and Gorham Purchase was made. The city was officially incorporated in 1796 and was named after the lake.
In the 19th century, Canandaigua was an important stop on the Underground Railroad, with many escaped slaves passing through the city on their way to freedom. The city was also home to the Canandaigua Academy, which was founded in 1817 and is the oldest continuously operating school in New York State.
Geography
Canandaigua is located in the Finger Lakes region of New York State, on the north shore of Canandaigua Lake. The city is situated at the intersection of Routes 5 and 20, and is about 30 miles southeast of Rochester. The city is surrounded by rolling hills and is home to several parks and nature preserves.
Economy
Canandaigua’s economy is largely based on tourism, with many visitors coming to the city to enjoy the Finger Lakes and its many attractions. The city is also home to several wineries, breweries, and distilleries, as well as a number of retail stores and restaurants. The city is also home to several manufacturing companies, including a large printing company and a medical device manufacturer.
Demographics
As of the 2010 census, Canandaigua had a population of 10,545 people. The racial makeup of the city was 92.3% White, 4.2% African American, 0.4% Native American, 1.2% Asian, 0.1% Pacific Islander, 0.7% from other races, and 1.1% from two or more races. Hispanic or Latino of any race were 2.7% of the population.
The median household income in Canandaigua was $50,945, and the median family income was $60,945. The per capita income for the city was $25,945. About 8.2% of families and 10.3% of the population were below the poverty line, including 14.2% of those under age 18 and 5.2% of those age 65 or over.
Canandaigua is a small city with a rich history and a vibrant economy. It is a popular tourist destination due to its proximity to the Finger Lakes and its many attractions. The city is home to a diverse population and is a great place to live, work, and play.
Common Questions
What is the Total Population of Canandaigua?
Total Population of Canandaigua is 10,562.
What is the Total Male Population of Canandaigua?
Total Male Population of Canandaigua is 4,939.
What is the Total Female Population of Canandaigua?
Total Female Population of Canandaigua is 5,623.
What is the Ratio of Males per 100 Females in Canandaigua?
There are 87.84 Males per 100 Females in Canandaigua.
What is the Ratio of Females per 100 Males in Canandaigua?
There are 113.85 Females per 100 Males in Canandaigua.
What is the Median Population Age in Canandaigua?
Median Population Age in Canandaigua is 41.8 Years.
What is the Average Family Size in Canandaigua
Average Family Size in Canandaigua is 2.8 People.
What is the Average Household Size in Canandaigua
Average Household Size in Canandaigua is 2.0 People.
What is Per Capita Income in Canandaigua?
Per Capita income in Canandaigua is $40,391.
What is the Median Family Income in Canandaigua?
Median Family Income in Canandaigua is $90,281.
What is the Median Household income in Canandaigua?
Median Household Income in Canandaigua is $59,144.
What is Income or Wage Gap in Canandaigua?
Income or Wage Gap in Canandaigua is 17.7%.
Women in Canandaigua earn 82.3 cents for every dollar earned by a man.
What is Inequality or Gini Index in Canandaigua?
Inequality or Gini Index in Canandaigua is 0.45.
How Large is the Labor Force in Canandaigua?
There are 5,775 People in the Labor Forcein in Canandaigua.
What is the Percentage of People in the Labor Force in Canandaigua?
63.1% of People are in the Labor Force in Canandaigua.
What is the Unemployment Rate in Canandaigua?
Unemployment Rate in Canandaigua is 3.6%.