Roachdale, IN
Roachdale Map
Roachdale Overview
786
TOTAL POPULATION
402
MALE POPULATION
384
FEMALE POPULATION
104.69
MALES / 100 FEMALES
95.52
FEMALES / 100 MALES
32.9
MEDIAN AGE
2.7
AVG FAMILY SIZE
2.3
AVG HOUSEHOLD SIZE
$26,313
PER CAPITA INCOME
$63,640
AVG FAMILY INCOME
$63,088
AVG HOUSEHOLD INCOME
69.2%
WAGE / INCOME GAP [ % ]
30.8¢/ $1
WAGE / INCOME GAP [ $ ]
0.33
INEQUALITY / GINI INDEX
351
LABOR FORCE [ PEOPLE ]
59.3%
PERCENT IN LABOR FORCE
2.0%
UNEMPLOYMENT RATE
Roachdale Zip Codes
Roachdale Area Codes
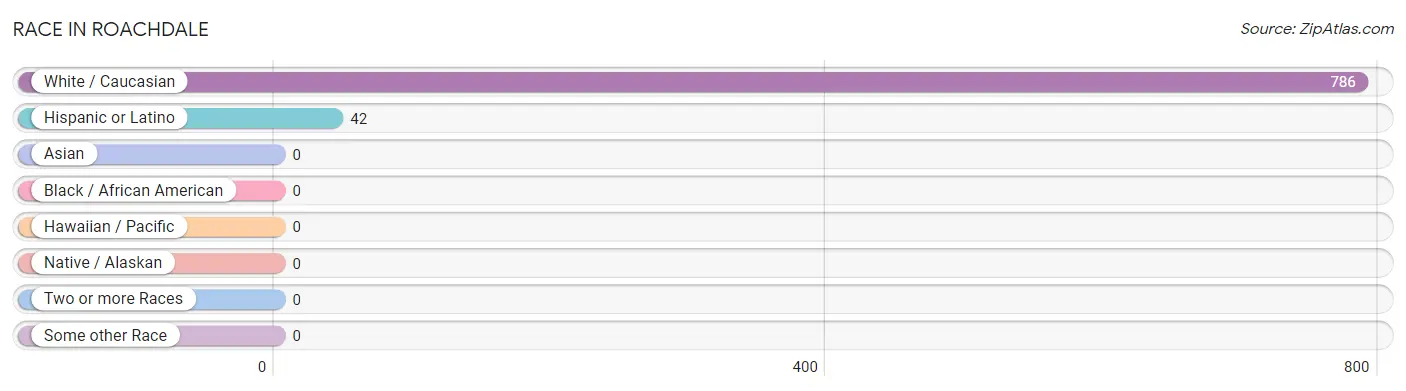
Race in Roachdale
The most populous races in Roachdale are White / Caucasian (786 | 100.0%), and Hispanic or Latino (42 | 5.3%).
| Race | # Population | % Population |
| Asian | 0 | 0.0% |
| Black / African American | 0 | 0.0% |
| Hawaiian / Pacific | 0 | 0.0% |
| Hispanic or Latino | 42 | 5.3% |
| Native / Alaskan | 0 | 0.0% |
| White / Caucasian | 786 | 100.0% |
| Two or more Races | 0 | 0.0% |
| Some other Race | 0 | 0.0% |
| Total | 786 | 100.0% |
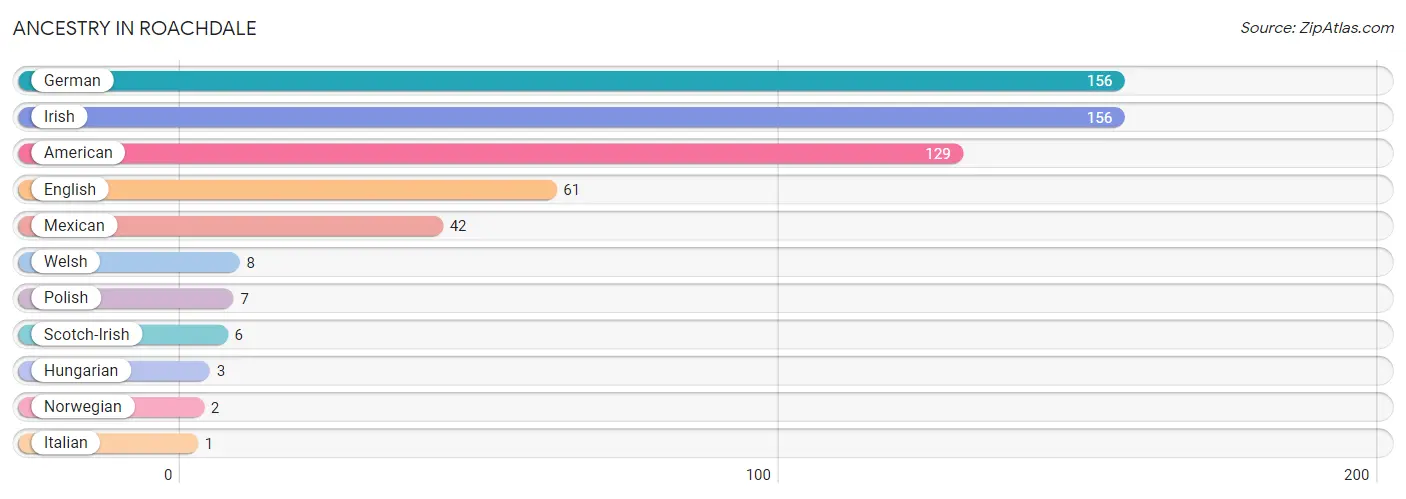
Ancestry in Roachdale
The most populous ancestries reported in Roachdale are German (156 | 19.9%), Irish (156 | 19.9%), American (129 | 16.4%), English (61 | 7.8%), and Mexican (42 | 5.3%), together accounting for 69.2% of all Roachdale residents.
| Ancestry | # Population | % Population |
| American | 129 | 16.4% |
| English | 61 | 7.8% |
| German | 156 | 19.9% |
| Hungarian | 3 | 0.4% |
| Irish | 156 | 19.9% |
| Italian | 1 | 0.1% |
| Mexican | 42 | 5.3% |
| Norwegian | 2 | 0.3% |
| Polish | 7 | 0.9% |
| Scotch-Irish | 6 | 0.8% |
| Welsh | 8 | 1.0% | View All 11 Rows |
Immigrants in Roachdale

| Immigration Origin | # Population | % Population | View All 0 Rows |
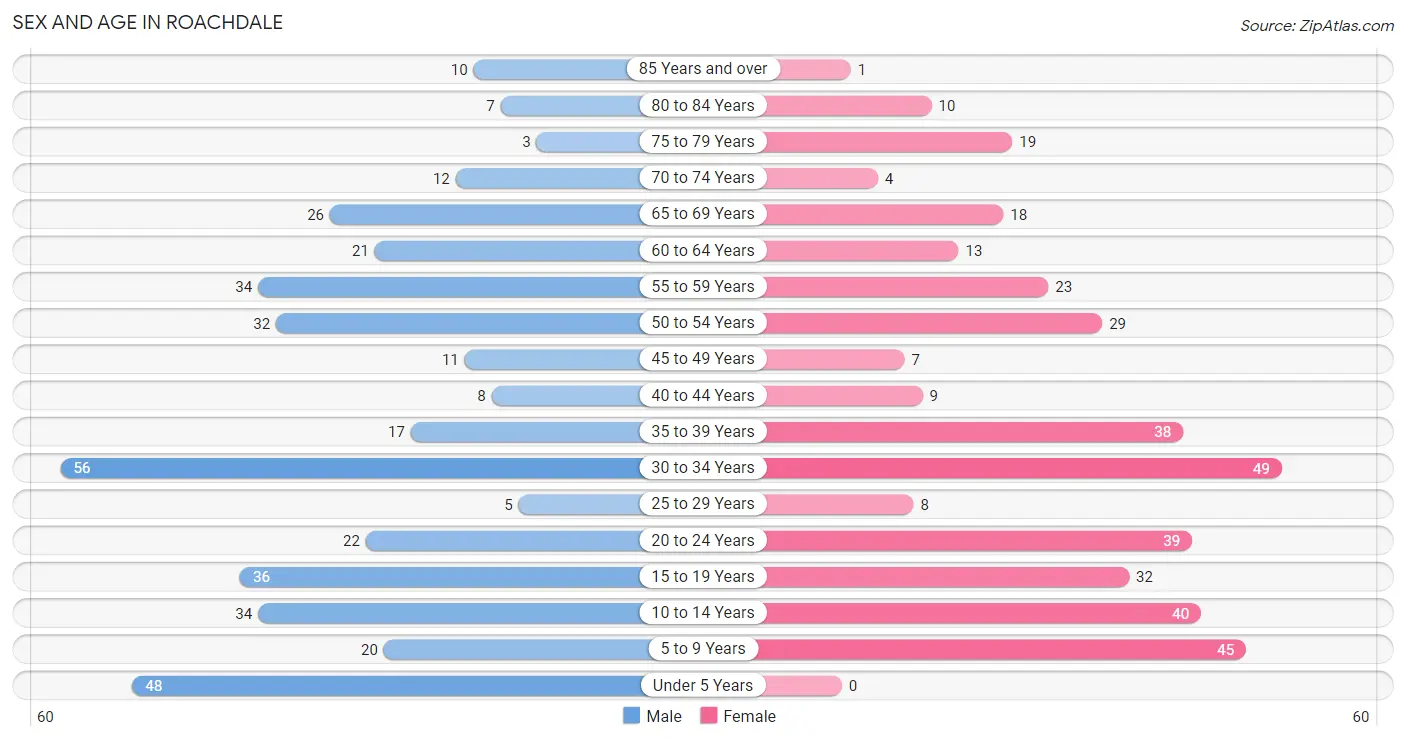
Sex and Age in Roachdale
Sex and Age in Roachdale
The most populous age groups in Roachdale are 30 to 34 Years (56 | 13.9%) for men and 30 to 34 Years (49 | 12.8%) for women.
| Age Bracket | Male | Female |
| Under 5 Years | 48 (11.9%) | 0 (0.0%) |
| 5 to 9 Years | 20 (5.0%) | 45 (11.7%) |
| 10 to 14 Years | 34 (8.5%) | 40 (10.4%) |
| 15 to 19 Years | 36 (9.0%) | 32 (8.3%) |
| 20 to 24 Years | 22 (5.5%) | 39 (10.2%) |
| 25 to 29 Years | 5 (1.2%) | 8 (2.1%) |
| 30 to 34 Years | 56 (13.9%) | 49 (12.8%) |
| 35 to 39 Years | 17 (4.2%) | 38 (9.9%) |
| 40 to 44 Years | 8 (2.0%) | 9 (2.3%) |
| 45 to 49 Years | 11 (2.7%) | 7 (1.8%) |
| 50 to 54 Years | 32 (8.0%) | 29 (7.5%) |
| 55 to 59 Years | 34 (8.5%) | 23 (6.0%) |
| 60 to 64 Years | 21 (5.2%) | 13 (3.4%) |
| 65 to 69 Years | 26 (6.5%) | 18 (4.7%) |
| 70 to 74 Years | 12 (3.0%) | 4 (1.0%) |
| 75 to 79 Years | 3 (0.7%) | 19 (5.0%) |
| 80 to 84 Years | 7 (1.7%) | 10 (2.6%) |
| 85 Years and over | 10 (2.5%) | 1 (0.3%) |
| Total | 402 (100.0%) | 384 (100.0%) |
Families and Households in Roachdale
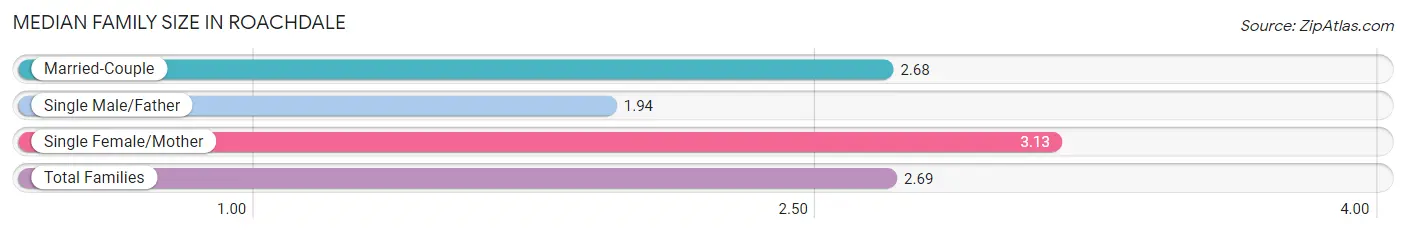
Median Family Size in Roachdale
The median family size in Roachdale is 2.69 persons per family, with single female/mother families (63 | 24.6%) accounting for the largest median family size of 3.13 persons per family. On the other hand, single male/father families (36 | 14.1%) represent the smallest median family size with 1.94 persons per family.
| Family Type | # Families | Family Size |
| Married-Couple | 157 (61.3%) | 2.68 |
| Single Male/Father | 36 (14.1%) | 1.94 |
| Single Female/Mother | 63 (24.6%) | 3.13 |
| Total Families | 256 (100.0%) | 2.69 |
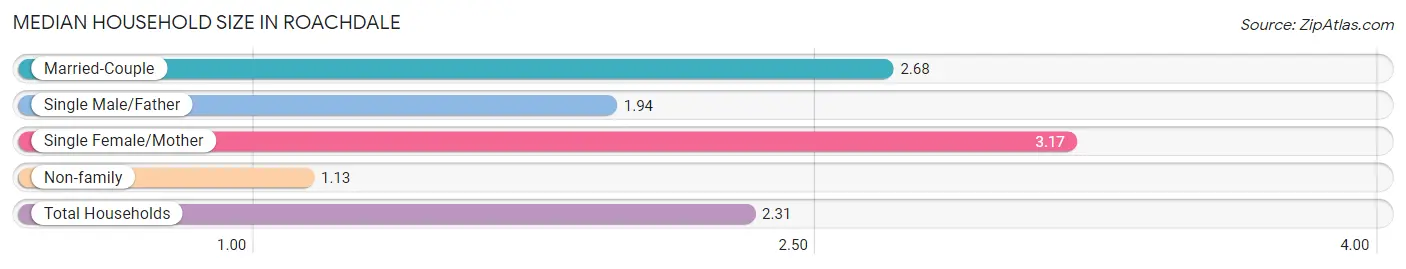
Median Household Size in Roachdale
The median household size in Roachdale is 2.31 persons per household, with single female/mother households (63 | 18.5%) accounting for the largest median household size of 3.17 persons per household. non-family households (84 | 24.7%) represent the smallest median household size with 1.13 persons per household.
| Household Type | # Households | Household Size |
| Married-Couple | 157 (46.2%) | 2.68 |
| Single Male/Father | 36 (10.6%) | 1.94 |
| Single Female/Mother | 63 (18.5%) | 3.17 |
| Non-family | 84 (24.7%) | 1.13 |
| Total Households | 340 (100.0%) | 2.31 |
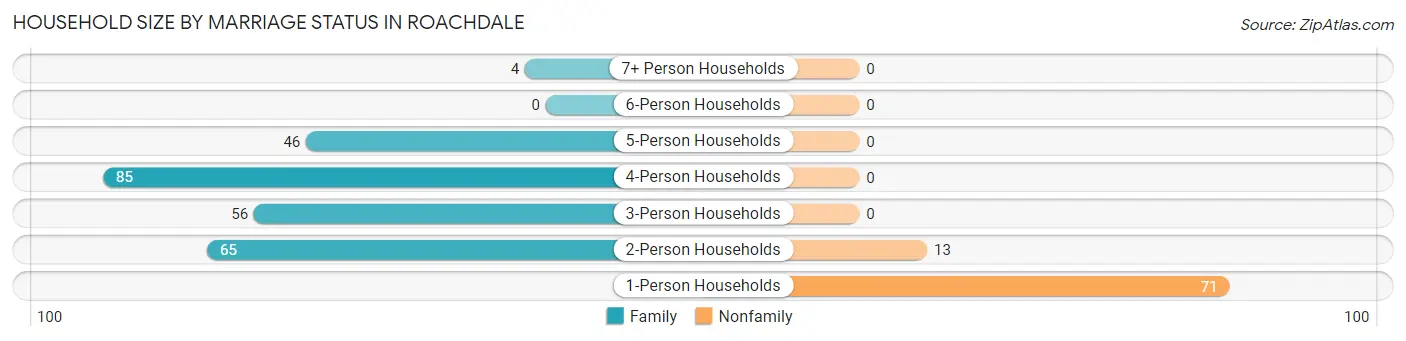
Household Size by Marriage Status in Roachdale
Out of a total of 340 households in Roachdale, 256 (75.3%) are family households, while 84 (24.7%) are nonfamily households. The most numerous type of family households are 4-person households, comprising 85, and the most common type of nonfamily households are 1-person households, comprising 71.
| Household Size | Family Households | Nonfamily Households |
| 1-Person Households | - | 71 (20.9%) |
| 2-Person Households | 65 (19.1%) | 13 (3.8%) |
| 3-Person Households | 56 (16.5%) | 0 (0.0%) |
| 4-Person Households | 85 (25.0%) | 0 (0.0%) |
| 5-Person Households | 46 (13.5%) | 0 (0.0%) |
| 6-Person Households | 0 (0.0%) | 0 (0.0%) |
| 7+ Person Households | 4 (1.2%) | 0 (0.0%) |
| Total | 256 (75.3%) | 84 (24.7%) |
Female Fertility in Roachdale
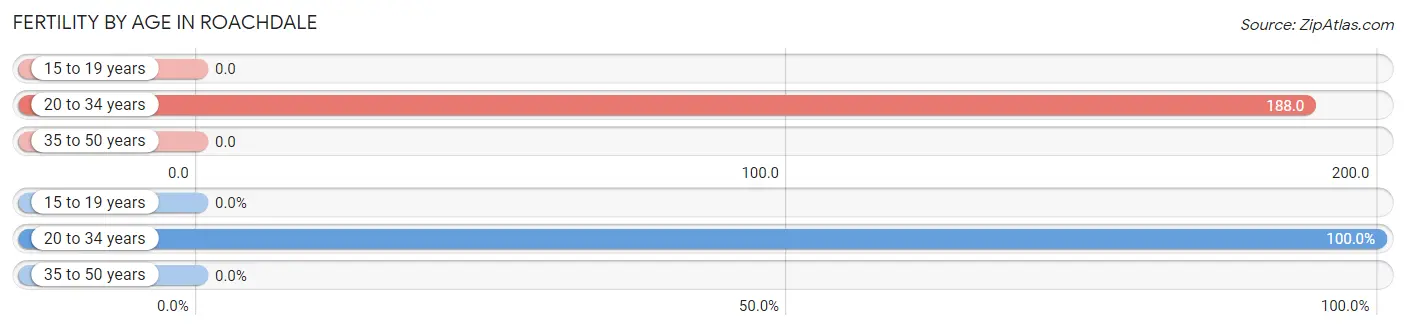
Fertility by Age in Roachdale
Average fertility rate in Roachdale is 97.0 births per 1,000 women. Women in the age bracket of 20 to 34 years have the highest fertility rate with 188.0 births per 1,000 women. Women in the age bracket of 20 to 34 years acount for 100.0% of all women with births.
| Age Bracket | Women with Births | Births / 1,000 Women |
| 15 to 19 years | 0 (0.0%) | 0.0 |
| 20 to 34 years | 18 (100.0%) | 188.0 |
| 35 to 50 years | 0 (0.0%) | 0.0 |
| Total | 18 (100.0%) | 97.0 |
Fertility by Age by Marriage Status in Roachdale
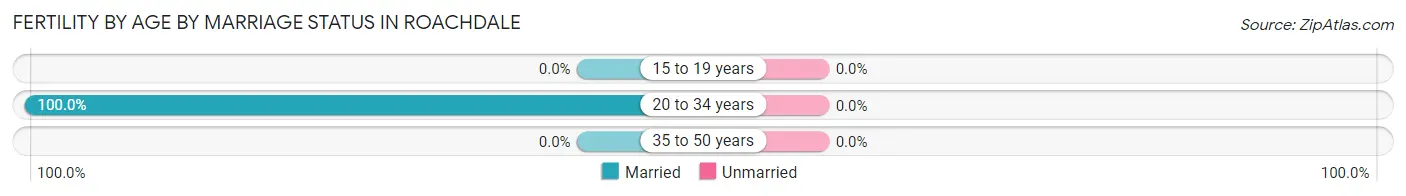
| Age Bracket | Married | Unmarried |
| 15 to 19 years | 0 (0.0%) | 0 (0.0%) |
| 20 to 34 years | 18 (100.0%) | 0 (0.0%) |
| 35 to 50 years | 0 (0.0%) | 0 (0.0%) |
| Total | 18 (100.0%) | 0 (0.0%) |
Fertility by Education in Roachdale
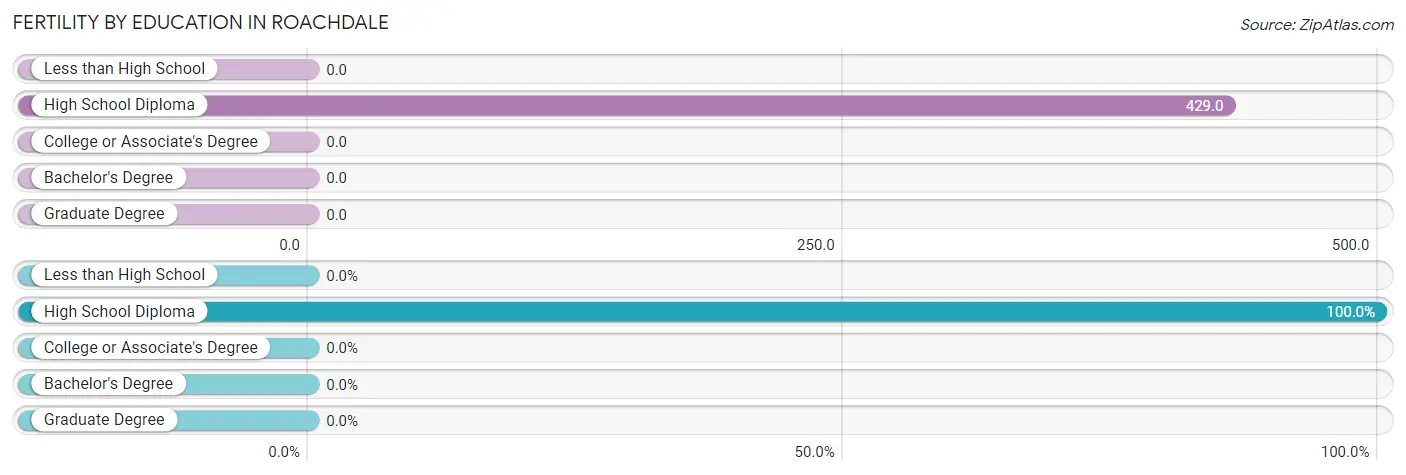
| Educational Attainment | Women with Births | Births / 1,000 Women |
| Less than High School | 0 (0.0%) | 0.0 |
| High School Diploma | 18 (100.0%) | 429.0 |
| College or Associate's Degree | 0 (0.0%) | 0.0 |
| Bachelor's Degree | 0 (0.0%) | 0.0 |
| Graduate Degree | 0 (0.0%) | 0.0 |
| Total | 18 (100.0%) | 97.0 |
Fertility by Education by Marriage Status in Roachdale
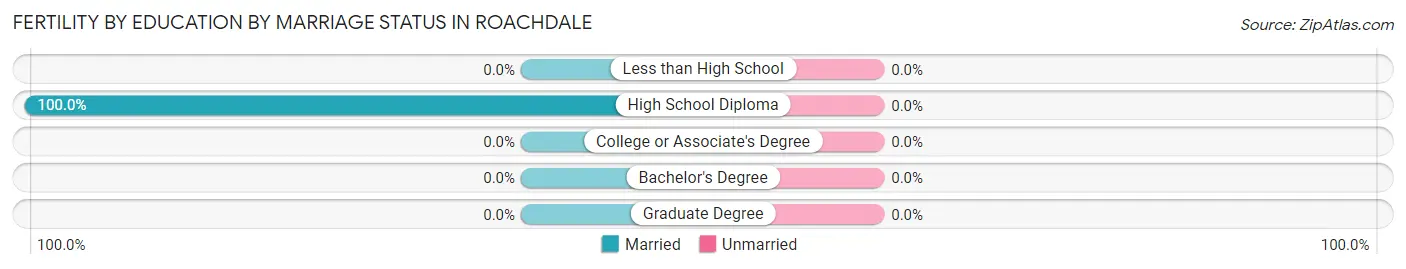
| Educational Attainment | Married | Unmarried |
| Less than High School | 0 (0.0%) | 0 (0.0%) |
| High School Diploma | 18 (100.0%) | 0 (0.0%) |
| College or Associate's Degree | 0 (0.0%) | 0 (0.0%) |
| Bachelor's Degree | 0 (0.0%) | 0 (0.0%) |
| Graduate Degree | 0 (0.0%) | 0 (0.0%) |
| Total | 18 (100.0%) | 0 (0.0%) |
Income in Roachdale
Income Overview in Roachdale
Per Capita Income in Roachdale is $26,313, while median incomes of families and households are $63,640 and $63,088 respectively.
| Characteristic | Number | Measure |
| Per Capita Income | 786 | $26,313 |
| Median Family Income | 256 | $63,640 |
| Mean Family Income | 256 | $67,697 |
| Median Household Income | 340 | $63,088 |
| Mean Household Income | 340 | $64,459 |
| Income Deficit | 256 | $0 |
| Wage / Income Gap (%) | 786 | 69.23% |
| Wage / Income Gap ($) | 786 | 30.77¢ per $1 |
| Gini / Inequality Index | 786 | 0.33 |
Earnings by Sex in Roachdale
Average Earnings in Roachdale are $36,500, $63,045 for men and $19,397 for women, a difference of 69.2%.
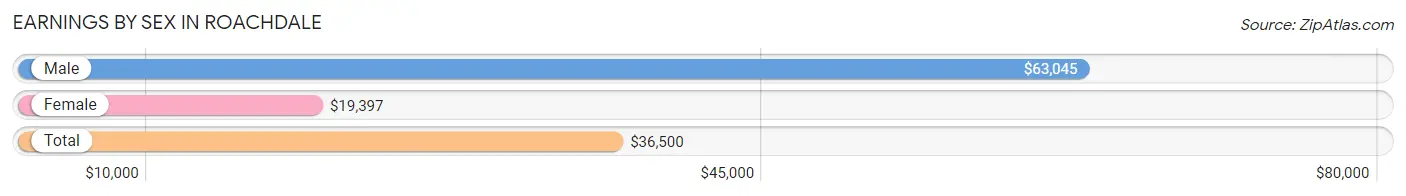
| Sex | Number | Average Earnings |
| Male | 198 (54.1%) | $63,045 |
| Female | 168 (45.9%) | $19,397 |
| Total | 366 (100.0%) | $36,500 |
Earnings by Sex by Income Bracket in Roachdale
The most common earnings brackets in Roachdale are $55,000 to $64,999 for men (59 | 29.8%) and $17,500 to $19,999 for women (58 | 34.5%).
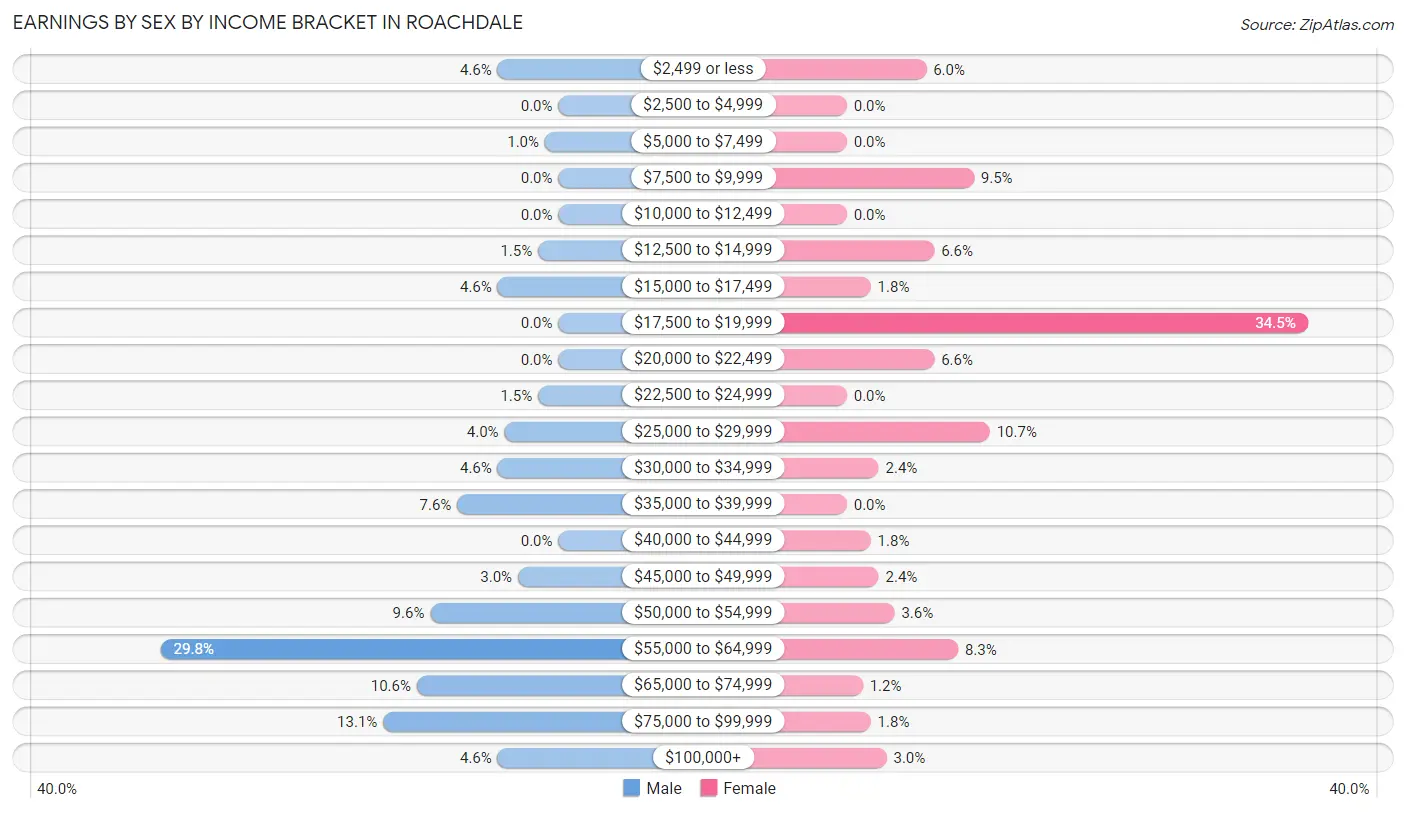
| Income | Male | Female |
| $2,499 or less | 9 (4.5%) | 10 (5.9%) |
| $2,500 to $4,999 | 0 (0.0%) | 0 (0.0%) |
| $5,000 to $7,499 | 2 (1.0%) | 0 (0.0%) |
| $7,500 to $9,999 | 0 (0.0%) | 16 (9.5%) |
| $10,000 to $12,499 | 0 (0.0%) | 0 (0.0%) |
| $12,500 to $14,999 | 3 (1.5%) | 11 (6.6%) |
| $15,000 to $17,499 | 9 (4.5%) | 3 (1.8%) |
| $17,500 to $19,999 | 0 (0.0%) | 58 (34.5%) |
| $20,000 to $22,499 | 0 (0.0%) | 11 (6.6%) |
| $22,500 to $24,999 | 3 (1.5%) | 0 (0.0%) |
| $25,000 to $29,999 | 8 (4.0%) | 18 (10.7%) |
| $30,000 to $34,999 | 9 (4.5%) | 4 (2.4%) |
| $35,000 to $39,999 | 15 (7.6%) | 0 (0.0%) |
| $40,000 to $44,999 | 0 (0.0%) | 3 (1.8%) |
| $45,000 to $49,999 | 6 (3.0%) | 4 (2.4%) |
| $50,000 to $54,999 | 19 (9.6%) | 6 (3.6%) |
| $55,000 to $64,999 | 59 (29.8%) | 14 (8.3%) |
| $65,000 to $74,999 | 21 (10.6%) | 2 (1.2%) |
| $75,000 to $99,999 | 26 (13.1%) | 3 (1.8%) |
| $100,000+ | 9 (4.5%) | 5 (3.0%) |
| Total | 198 (100.0%) | 168 (100.0%) |
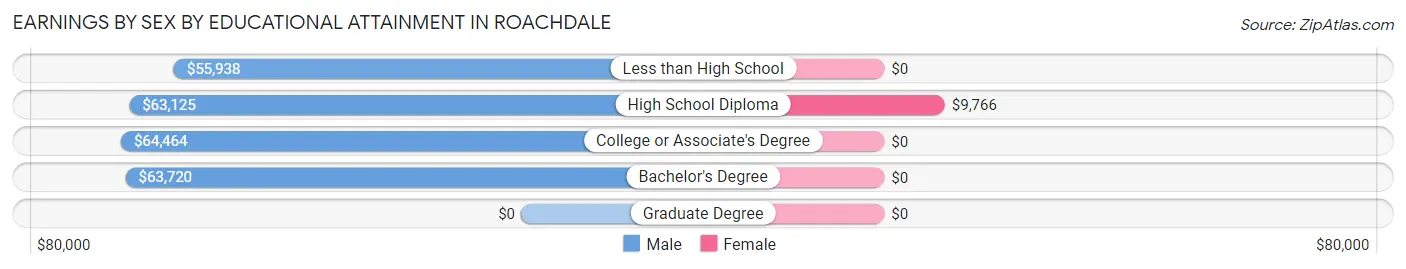
Earnings by Sex by Educational Attainment in Roachdale
Average earnings in Roachdale are $63,636 for men and $18,822 for women, a difference of 70.4%. Men with an educational attainment of college or associate's degree enjoy the highest average annual earnings of $64,464, while those with less than high school education earn the least with $55,938. Women with an educational attainment of high school diploma earn the most with the average annual earnings of $9,766, while those with high school diploma education have the smallest earnings of $9,766.
| Educational Attainment | Male Income | Female Income |
| Less than High School | $55,938 | $0 |
| High School Diploma | $63,125 | $9,766 |
| College or Associate's Degree | $64,464 | $0 |
| Bachelor's Degree | $63,720 | $0 |
| Graduate Degree | - | - |
| Total | $63,636 | $18,822 |
Family Income in Roachdale
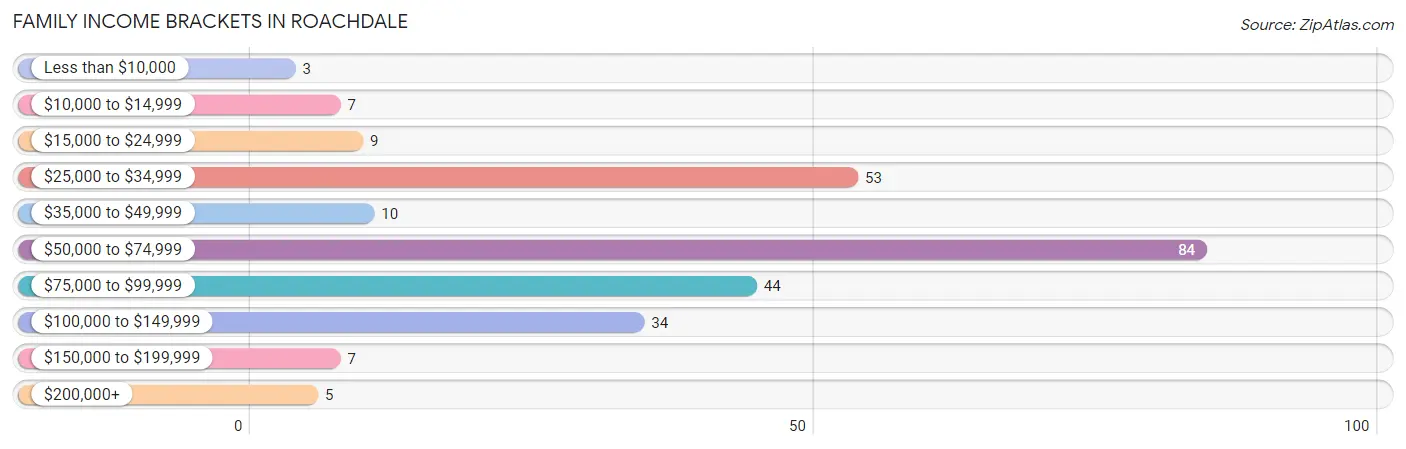
Family Income Brackets in Roachdale
According to the Roachdale family income data, there are 84 families falling into the $50,000 to $74,999 income range, which is the most common income bracket and makes up 32.8% of all families. Conversely, the less than $10,000 income bracket is the least frequent group with only 3 families (1.2%) belonging to this category.
| Income Bracket | # Families | % Families |
| Less than $10,000 | 3 | 1.2% |
| $10,000 to $14,999 | 7 | 2.7% |
| $15,000 to $24,999 | 9 | 3.5% |
| $25,000 to $34,999 | 53 | 20.7% |
| $35,000 to $49,999 | 10 | 3.9% |
| $50,000 to $74,999 | 84 | 32.8% |
| $75,000 to $99,999 | 44 | 17.2% |
| $100,000 to $149,999 | 34 | 13.3% |
| $150,000 to $199,999 | 7 | 2.7% |
| $200,000+ | 5 | 2.0% |
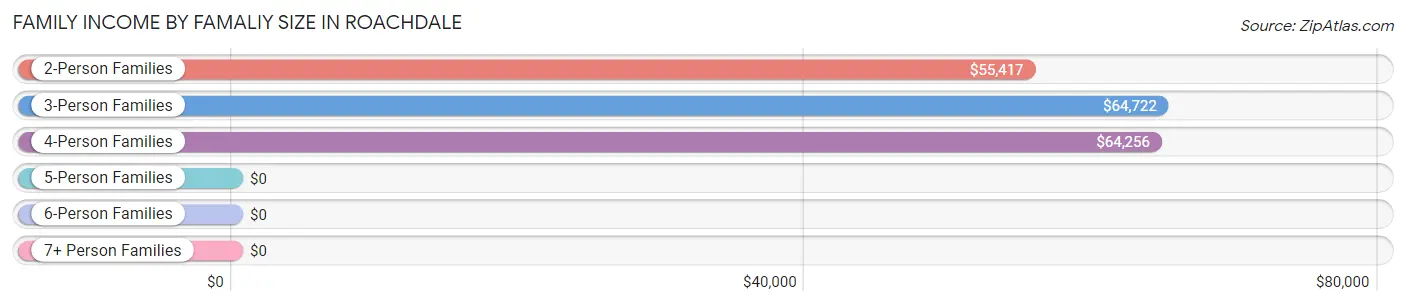
Family Income by Famaliy Size in Roachdale
3-person families (60 | 23.4%) account for the highest median family income in Roachdale with $64,722 per family, while 2-person families (65 | 25.4%) have the highest median income of $27,708 per family member.
| Income Bracket | # Families | Median Income |
| 2-Person Families | 65 (25.4%) | $55,417 |
| 3-Person Families | 60 (23.4%) | $64,722 |
| 4-Person Families | 81 (31.6%) | $64,256 |
| 5-Person Families | 46 (18.0%) | $0 |
| 6-Person Families | 0 (0.0%) | $0 |
| 7+ Person Families | 4 (1.6%) | $0 |
| Total | 256 (100.0%) | $63,640 |
Family Income by Number of Earners in Roachdale
The median family income in Roachdale is $63,640, with families comprising 3+ earners (23) having the highest median family income of $107,321, while families with no earners (41) have the lowest median family income of $34,063, accounting for 9.0% and 16.0% of families, respectively.
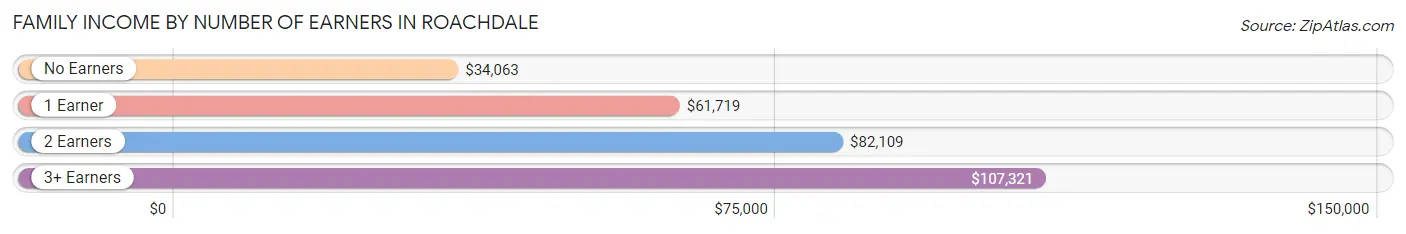
| Number of Earners | # Families | Median Income |
| No Earners | 41 (16.0%) | $34,063 |
| 1 Earner | 105 (41.0%) | $61,719 |
| 2 Earners | 87 (34.0%) | $82,109 |
| 3+ Earners | 23 (9.0%) | $107,321 |
| Total | 256 (100.0%) | $63,640 |
Household Income in Roachdale
Household Income Brackets in Roachdale
With 90 households falling in the category, the $50,000 to $74,999 income range is the most frequent in Roachdale, accounting for 26.5% of all households. In contrast, only 3 households (0.9%) fall into the less than $10,000 income bracket, making it the least populous group.
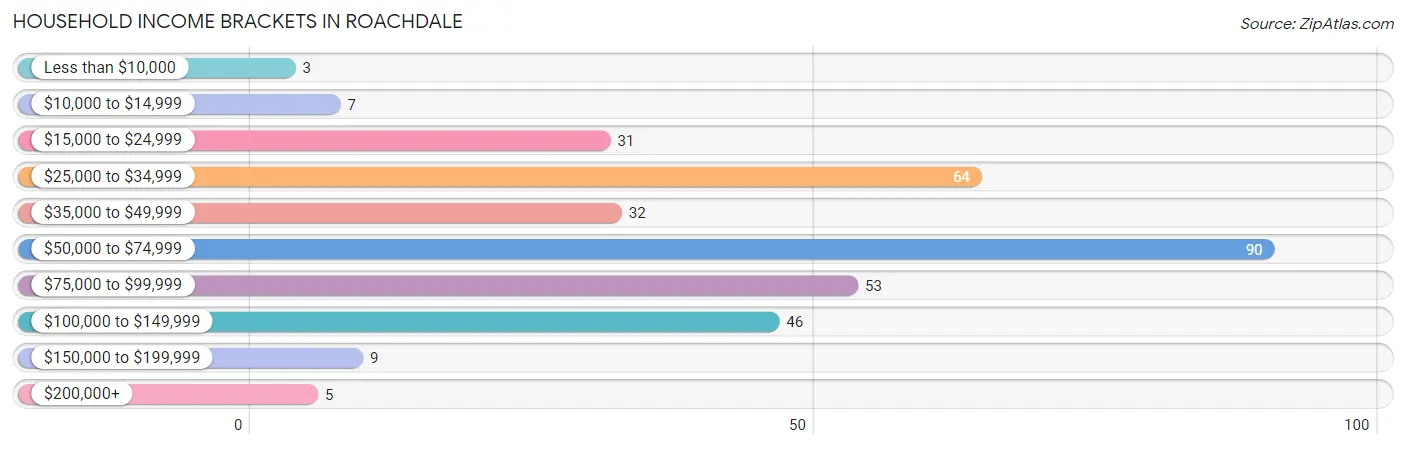
| Income Bracket | # Households | % Households |
| Less than $10,000 | 3 | 0.9% |
| $10,000 to $14,999 | 7 | 2.1% |
| $15,000 to $24,999 | 31 | 9.1% |
| $25,000 to $34,999 | 64 | 18.8% |
| $35,000 to $49,999 | 32 | 9.4% |
| $50,000 to $74,999 | 90 | 26.5% |
| $75,000 to $99,999 | 53 | 15.6% |
| $100,000 to $149,999 | 46 | 13.5% |
| $150,000 to $199,999 | 9 | 2.6% |
| $200,000+ | 5 | 1.5% |
Household Income by Householder Age in Roachdale
The median household income in Roachdale is $63,088, with the highest median household income of $89,485 found in the 45 to 64 years age bracket for the primary householder. A total of 111 households (32.7%) fall into this category. Meanwhile, the 15 to 24 years age bracket for the primary householder has the lowest median household income of $0, with 24 households (7.1%) in this group.
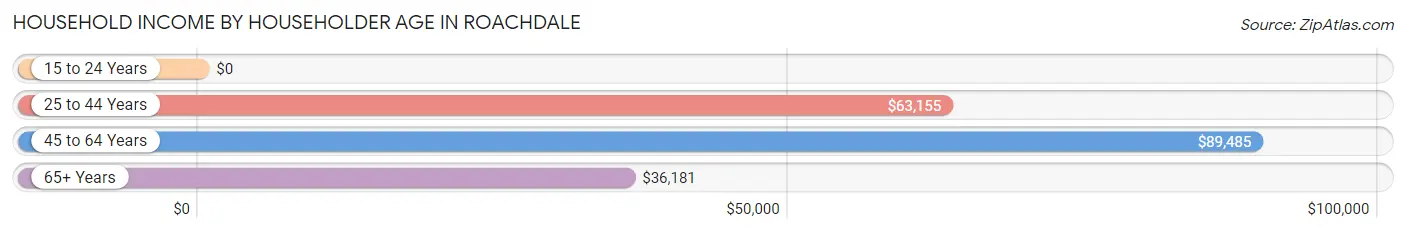
| Income Bracket | # Households | Median Income |
| 15 to 24 Years | 24 (7.1%) | $0 |
| 25 to 44 Years | 124 (36.5%) | $63,155 |
| 45 to 64 Years | 111 (32.7%) | $89,485 |
| 65+ Years | 81 (23.8%) | $36,181 |
| Total | 340 (100.0%) | $63,088 |
Poverty in Roachdale
Income Below Poverty by Sex and Age in Roachdale
With 11.0% poverty level for males and 33.3% for females among the residents of Roachdale, 15 year old males and 12 to 14 year old females are the most vulnerable to poverty, with 7 males (100.0%) and 18 females (85.7%) in their respective age groups living below the poverty level.
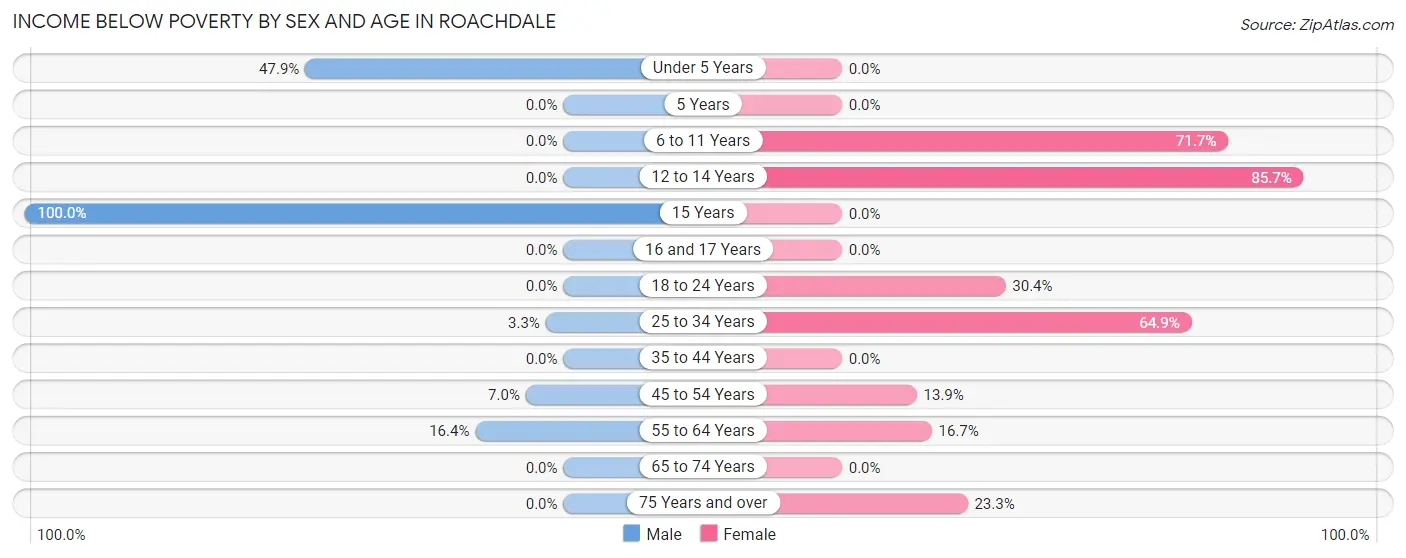
| Age Bracket | Male | Female |
| Under 5 Years | 23 (47.9%) | 0 (0.0%) |
| 5 Years | 0 (0.0%) | 0 (0.0%) |
| 6 to 11 Years | 0 (0.0%) | 38 (71.7%) |
| 12 to 14 Years | 0 (0.0%) | 18 (85.7%) |
| 15 Years | 7 (100.0%) | 0 (0.0%) |
| 16 and 17 Years | 0 (0.0%) | 0 (0.0%) |
| 18 to 24 Years | 0 (0.0%) | 17 (30.4%) |
| 25 to 34 Years | 2 (3.3%) | 37 (64.9%) |
| 35 to 44 Years | 0 (0.0%) | 0 (0.0%) |
| 45 to 54 Years | 3 (7.0%) | 5 (13.9%) |
| 55 to 64 Years | 9 (16.4%) | 6 (16.7%) |
| 65 to 74 Years | 0 (0.0%) | 0 (0.0%) |
| 75 Years and over | 0 (0.0%) | 7 (23.3%) |
| Total | 44 (11.0%) | 128 (33.3%) |
Income Above Poverty by Sex and Age in Roachdale
According to the poverty statistics in Roachdale, males aged 6 to 11 years and females aged 5 years are the age groups that are most secure financially, with 100.0% of males and 100.0% of females in these age groups living above the poverty line.
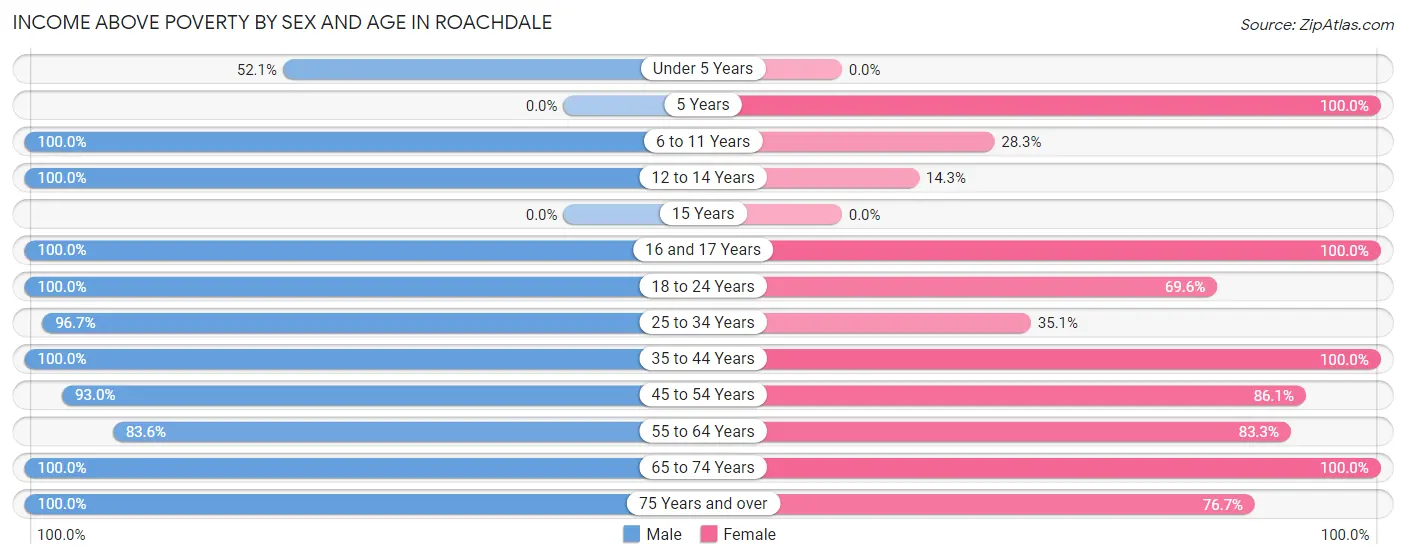
| Age Bracket | Male | Female |
| Under 5 Years | 25 (52.1%) | 0 (0.0%) |
| 5 Years | 0 (0.0%) | 11 (100.0%) |
| 6 to 11 Years | 32 (100.0%) | 15 (28.3%) |
| 12 to 14 Years | 22 (100.0%) | 3 (14.3%) |
| 15 Years | 0 (0.0%) | 0 (0.0%) |
| 16 and 17 Years | 10 (100.0%) | 15 (100.0%) |
| 18 to 24 Years | 41 (100.0%) | 39 (69.6%) |
| 25 to 34 Years | 59 (96.7%) | 20 (35.1%) |
| 35 to 44 Years | 25 (100.0%) | 47 (100.0%) |
| 45 to 54 Years | 40 (93.0%) | 31 (86.1%) |
| 55 to 64 Years | 46 (83.6%) | 30 (83.3%) |
| 65 to 74 Years | 38 (100.0%) | 22 (100.0%) |
| 75 Years and over | 20 (100.0%) | 23 (76.7%) |
| Total | 358 (89.0%) | 256 (66.7%) |
Income Below Poverty Among Married-Couple Families in Roachdale
The poverty statistics for married-couple families in Roachdale show that 3.2% or 5 of the total 157 families live below the poverty line. Families with no children have the highest poverty rate of 3.5%, comprising of 2 families. On the other hand, families with 3 or 4 children have the lowest poverty rate of 0.0%, which includes 0 families.
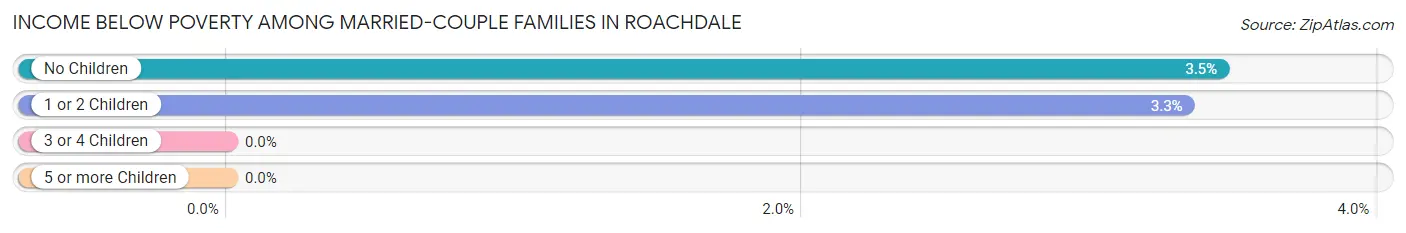
| Children | Above Poverty | Below Poverty |
| No Children | 56 (96.6%) | 2 (3.5%) |
| 1 or 2 Children | 87 (96.7%) | 3 (3.3%) |
| 3 or 4 Children | 9 (100.0%) | 0 (0.0%) |
| 5 or more Children | 0 (0.0%) | 0 (0.0%) |
| Total | 152 (96.8%) | 5 (3.2%) |
Income Below Poverty Among Single-Parent Households in Roachdale
According to the poverty data in Roachdale, 19.4% or 7 single-father households and 69.8% or 44 single-mother households are living below the poverty line. Among single-father households, those with 1 or 2 children have the highest poverty rate, with 7 households (77.8%) experiencing poverty. Likewise, among single-mother households, those with 3 or 4 children have the highest poverty rate, with 37 households (82.2%) falling below the poverty line.
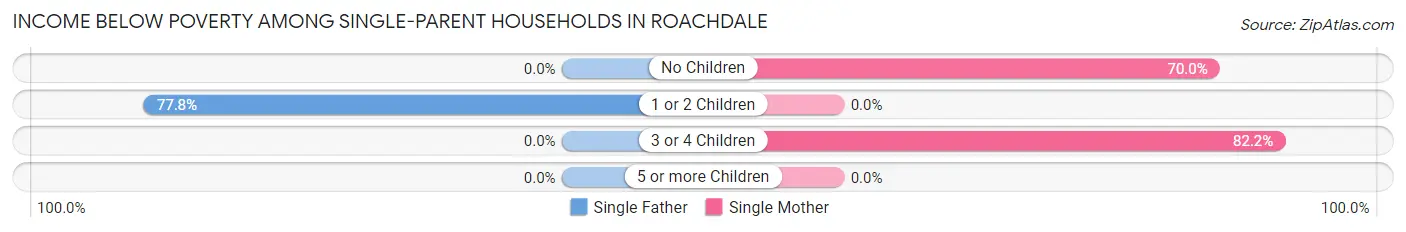
| Children | Single Father | Single Mother |
| No Children | 0 (0.0%) | 7 (70.0%) |
| 1 or 2 Children | 7 (77.8%) | 0 (0.0%) |
| 3 or 4 Children | 0 (0.0%) | 37 (82.2%) |
| 5 or more Children | 0 (0.0%) | 0 (0.0%) |
| Total | 7 (19.4%) | 44 (69.8%) |
Income Below Poverty Among Married-Couple vs Single-Parent Households in Roachdale
The poverty data for Roachdale shows that 5 of the married-couple family households (3.2%) and 51 of the single-parent households (51.5%) are living below the poverty level. Within the married-couple family households, those with no children have the highest poverty rate, with 2 households (3.5%) falling below the poverty line. Among the single-parent households, those with 3 or 4 children have the highest poverty rate, with 37 household (82.2%) living below poverty.
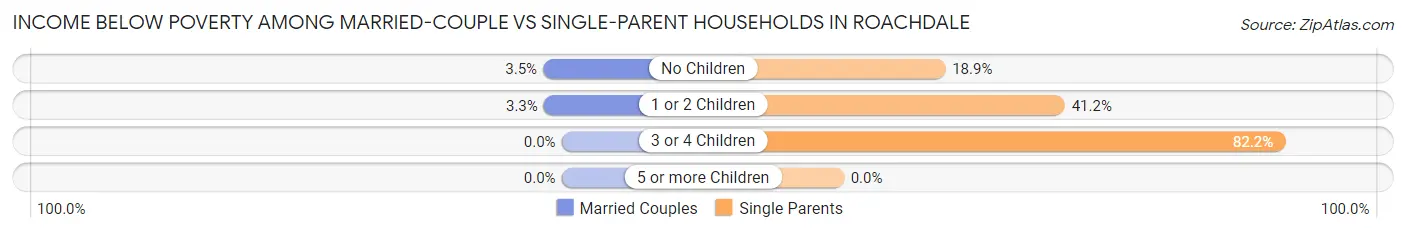
| Children | Married-Couple Families | Single-Parent Households |
| No Children | 2 (3.5%) | 7 (18.9%) |
| 1 or 2 Children | 3 (3.3%) | 7 (41.2%) |
| 3 or 4 Children | 0 (0.0%) | 37 (82.2%) |
| 5 or more Children | 0 (0.0%) | 0 (0.0%) |
| Total | 5 (3.2%) | 51 (51.5%) |
Employment Characteristics in Roachdale
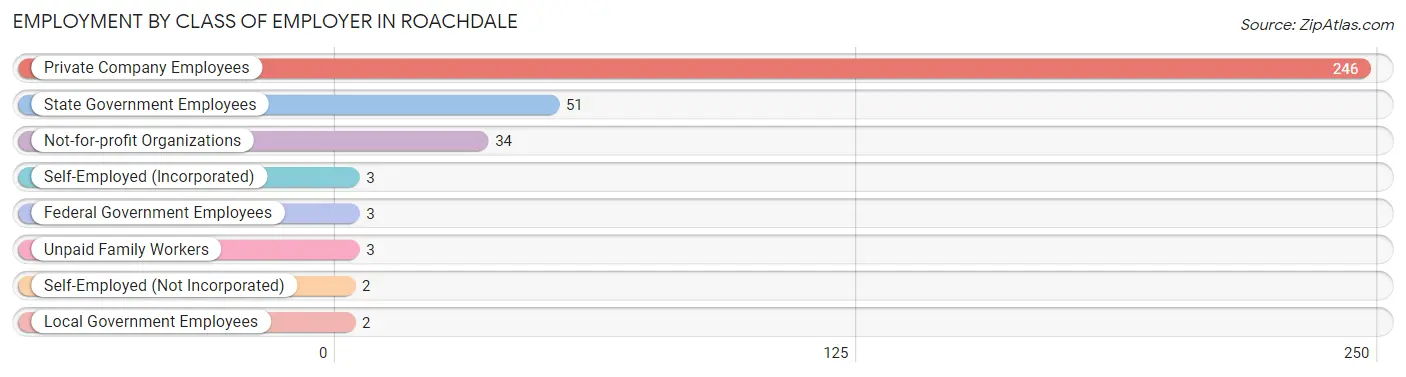
Employment by Class of Employer in Roachdale
Among the 344 employed individuals in Roachdale, private company employees (246 | 71.5%), state government employees (51 | 14.8%), and not-for-profit organizations (34 | 9.9%) make up the most common classes of employment.
| Employer Class | # Employees | % Employees |
| Private Company Employees | 246 | 71.5% |
| Self-Employed (Incorporated) | 3 | 0.9% |
| Self-Employed (Not Incorporated) | 2 | 0.6% |
| Not-for-profit Organizations | 34 | 9.9% |
| Local Government Employees | 2 | 0.6% |
| State Government Employees | 51 | 14.8% |
| Federal Government Employees | 3 | 0.9% |
| Unpaid Family Workers | 3 | 0.9% |
| Total | 344 | 100.0% |
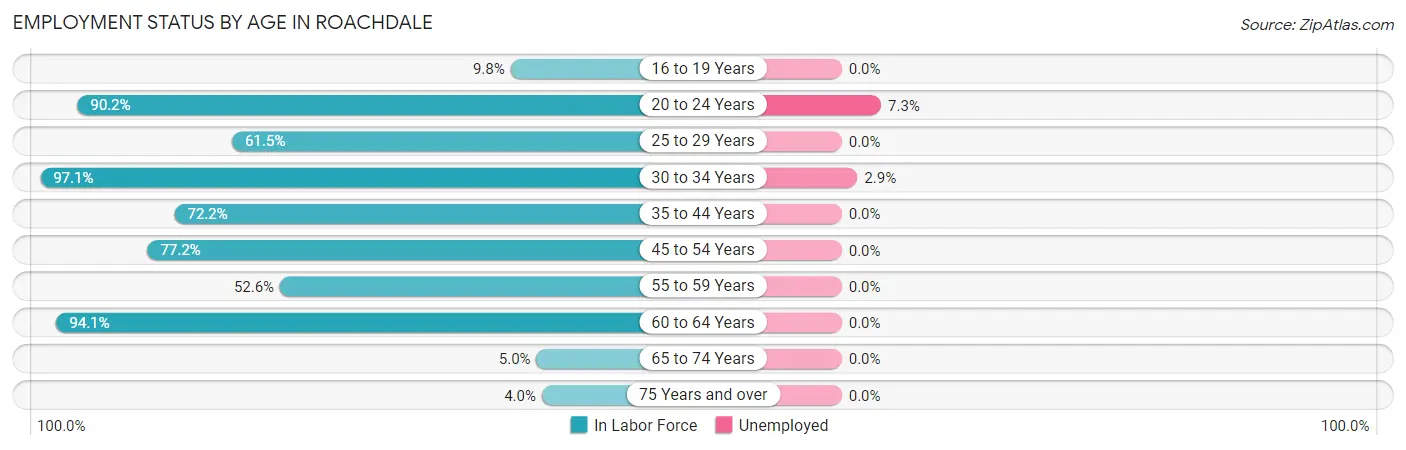
Employment Status by Age in Roachdale
According to the labor force statistics for Roachdale, out of the total population over 16 years of age (592), 59.3% or 351 individuals are in the labor force, with 2.0% or 7 of them unemployed. The age group with the highest labor force participation rate is 30 to 34 years, with 97.1% or 102 individuals in the labor force. Within the labor force, the 20 to 24 years age range has the highest percentage of unemployed individuals, with 7.3% or 4 of them being unemployed.
| Age Bracket | In Labor Force | Unemployed |
| 16 to 19 Years | 6 (9.8%) | 0 (0.0%) |
| 20 to 24 Years | 55 (90.2%) | 4 (7.3%) |
| 25 to 29 Years | 8 (61.5%) | 0 (0.0%) |
| 30 to 34 Years | 102 (97.1%) | 3 (2.9%) |
| 35 to 44 Years | 52 (72.2%) | 0 (0.0%) |
| 45 to 54 Years | 61 (77.2%) | 0 (0.0%) |
| 55 to 59 Years | 30 (52.6%) | 0 (0.0%) |
| 60 to 64 Years | 32 (94.1%) | 0 (0.0%) |
| 65 to 74 Years | 3 (5.0%) | 0 (0.0%) |
| 75 Years and over | 2 (4.0%) | 0 (0.0%) |
| Total | 351 (59.3%) | 7 (2.0%) |
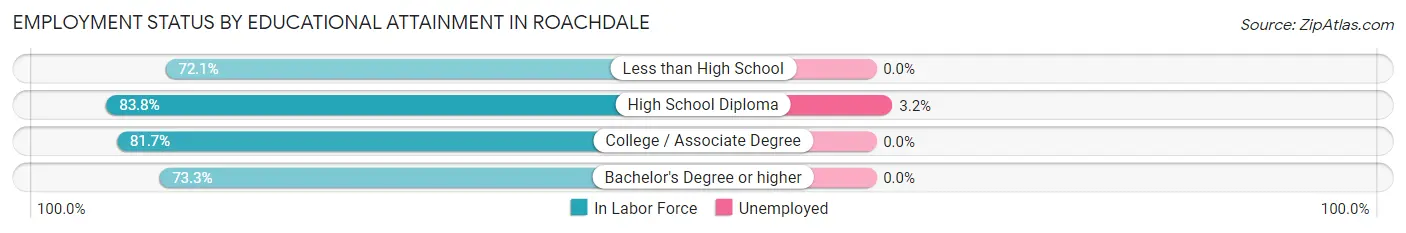
Employment Status by Educational Attainment in Roachdale
According to labor force statistics for Roachdale, 79.2% of individuals (285) out of the total population between 25 and 64 years of age (360) are in the labor force, with 1.1% or 3 of them being unemployed. The group with the highest labor force participation rate are those with the educational attainment of high school diploma, with 83.8% or 93 individuals in the labor force. Within the labor force, individuals with high school diploma education have the highest percentage of unemployment, with 3.2% or 3 of them being unemployed.
| Educational Attainment | In Labor Force | Unemployed |
| Less than High School | 31 (72.1%) | 0 (0.0%) |
| High School Diploma | 93 (83.8%) | 4 (3.2%) |
| College / Associate Degree | 98 (81.7%) | 0 (0.0%) |
| Bachelor's Degree or higher | 63 (73.3%) | 0 (0.0%) |
| Total | 285 (79.2%) | 4 (1.1%) |
Employment Occupations by Sex in Roachdale
Management, Business, Science and Arts Occupations
The most common Management, Business, Science and Arts occupations in Roachdale are Management (33 | 9.6%), Health Diagnosing & Treating (16 | 4.6%), Health Technologists (13 | 3.8%), Computers, Engineering & Science (9 | 2.6%), and Life, Physical & Social Science (9 | 2.6%).
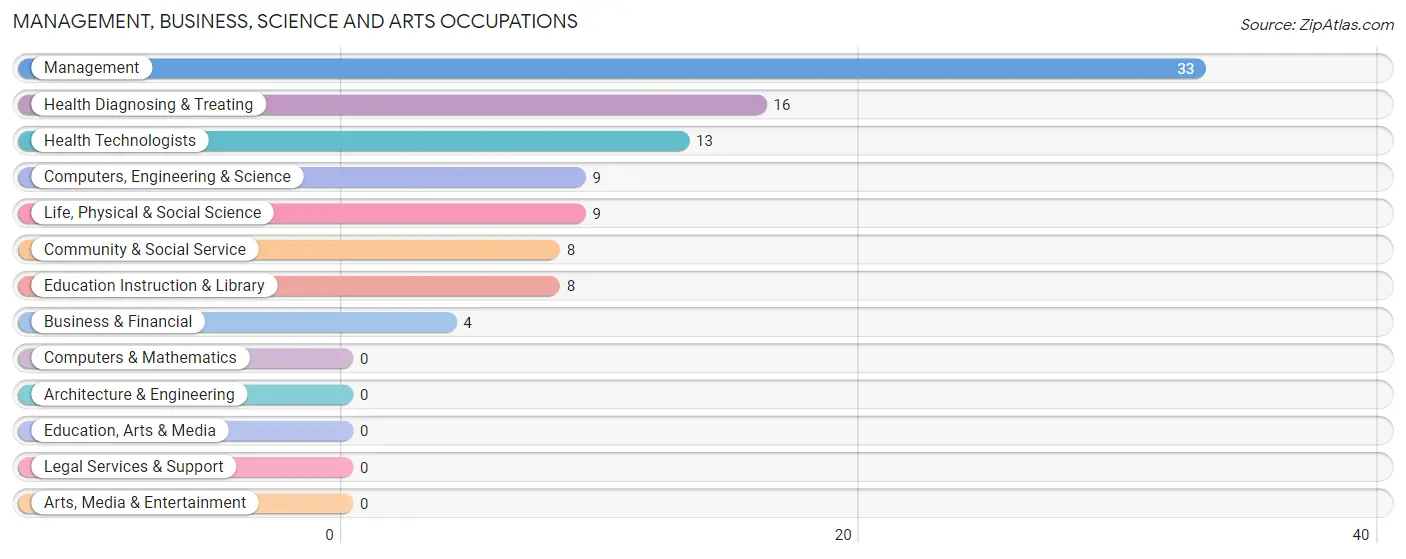
Management, Business, Science and Arts Occupations by Sex
Within the Management, Business, Science and Arts occupations in Roachdale, the most male-oriented occupations are Computers, Engineering & Science (100.0%), Life, Physical & Social Science (100.0%), and Management (72.7%), while the most female-oriented occupations are Business & Financial (100.0%), Community & Social Service (100.0%), and Education Instruction & Library (100.0%).
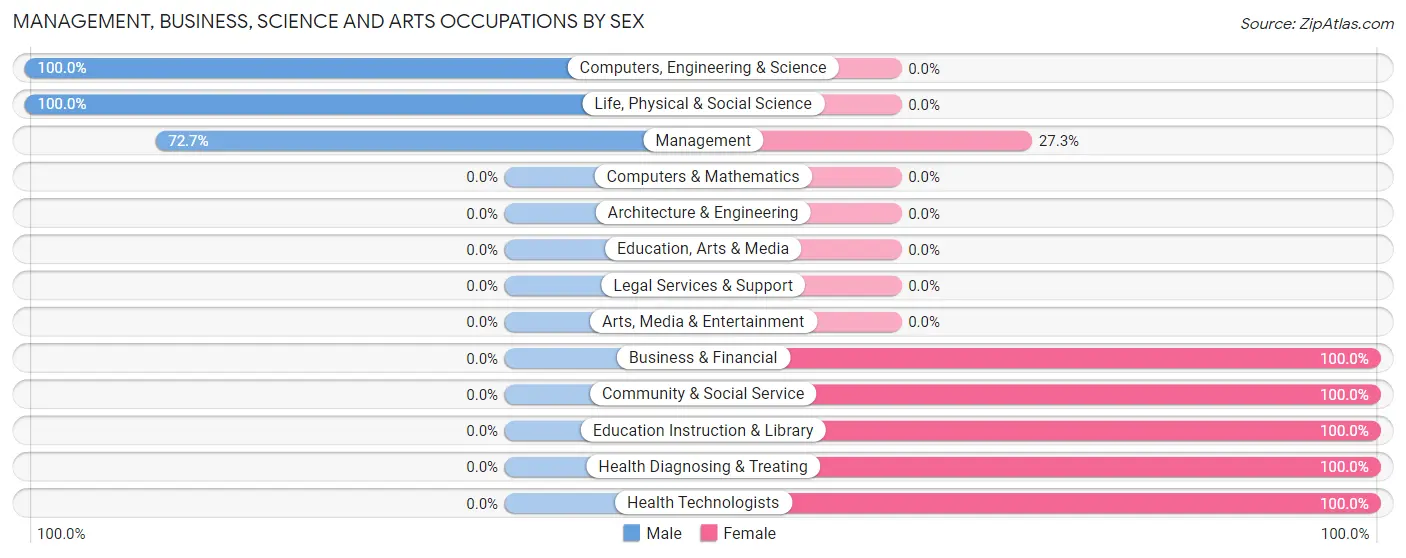
| Occupation | Male | Female |
| Management | 24 (72.7%) | 9 (27.3%) |
| Business & Financial | 0 (0.0%) | 4 (100.0%) |
| Computers, Engineering & Science | 9 (100.0%) | 0 (0.0%) |
| Computers & Mathematics | 0 (0.0%) | 0 (0.0%) |
| Architecture & Engineering | 0 (0.0%) | 0 (0.0%) |
| Life, Physical & Social Science | 9 (100.0%) | 0 (0.0%) |
| Community & Social Service | 0 (0.0%) | 8 (100.0%) |
| Education, Arts & Media | 0 (0.0%) | 0 (0.0%) |
| Legal Services & Support | 0 (0.0%) | 0 (0.0%) |
| Education Instruction & Library | 0 (0.0%) | 8 (100.0%) |
| Arts, Media & Entertainment | 0 (0.0%) | 0 (0.0%) |
| Health Diagnosing & Treating | 0 (0.0%) | 16 (100.0%) |
| Health Technologists | 0 (0.0%) | 13 (100.0%) |
| Total (Category) | 33 (47.1%) | 37 (52.9%) |
| Total (Overall) | 185 (53.8%) | 159 (46.2%) |
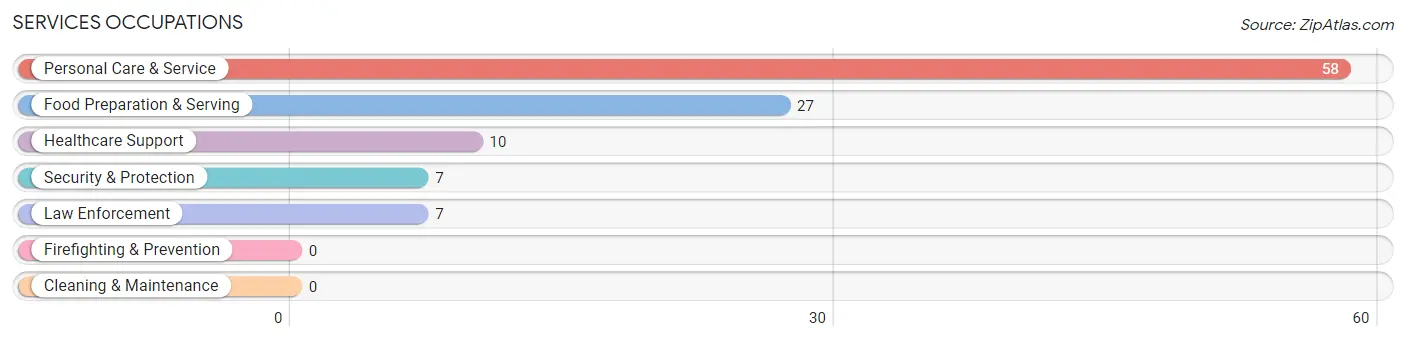
Services Occupations
The most common Services occupations in Roachdale are Personal Care & Service (58 | 16.9%), Food Preparation & Serving (27 | 7.9%), Healthcare Support (10 | 2.9%), Security & Protection (7 | 2.0%), and Law Enforcement (7 | 2.0%).
Services Occupations by Sex
Within the Services occupations in Roachdale, the most male-oriented occupations are Security & Protection (100.0%), Law Enforcement (100.0%), and Healthcare Support (30.0%), while the most female-oriented occupations are Personal Care & Service (94.8%), Food Preparation & Serving (88.9%), and Healthcare Support (70.0%).
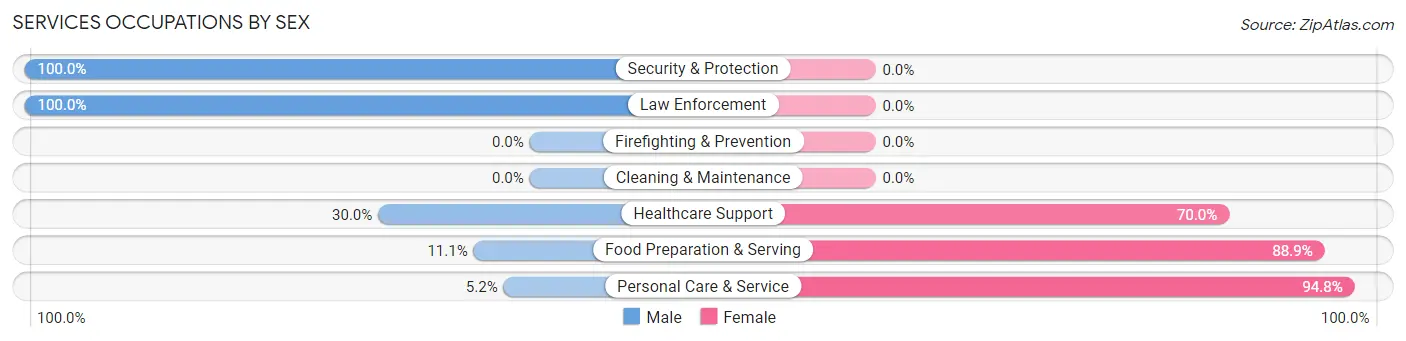
| Occupation | Male | Female |
| Healthcare Support | 3 (30.0%) | 7 (70.0%) |
| Security & Protection | 7 (100.0%) | 0 (0.0%) |
| Firefighting & Prevention | 0 (0.0%) | 0 (0.0%) |
| Law Enforcement | 7 (100.0%) | 0 (0.0%) |
| Food Preparation & Serving | 3 (11.1%) | 24 (88.9%) |
| Cleaning & Maintenance | 0 (0.0%) | 0 (0.0%) |
| Personal Care & Service | 3 (5.2%) | 55 (94.8%) |
| Total (Category) | 16 (15.7%) | 86 (84.3%) |
| Total (Overall) | 185 (53.8%) | 159 (46.2%) |
Sales and Office Occupations
The most common Sales and Office occupations in Roachdale are Office & Administration (73 | 21.2%), and Sales & Related (24 | 7.0%).
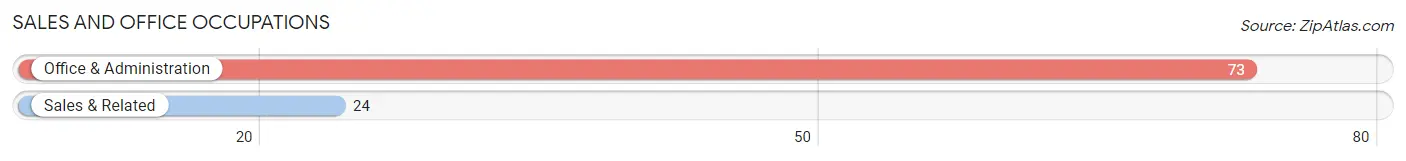
Sales and Office Occupations by Sex
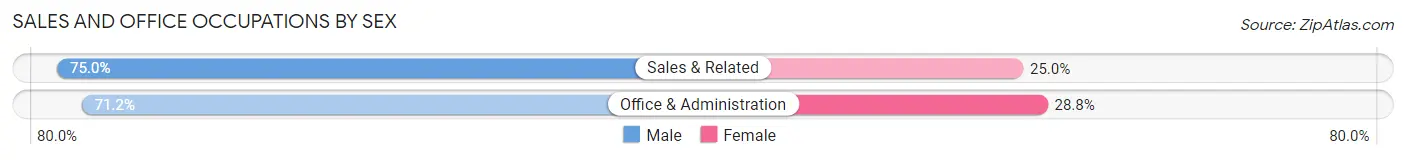
| Occupation | Male | Female |
| Sales & Related | 18 (75.0%) | 6 (25.0%) |
| Office & Administration | 52 (71.2%) | 21 (28.8%) |
| Total (Category) | 70 (72.2%) | 27 (27.8%) |
| Total (Overall) | 185 (53.8%) | 159 (46.2%) |
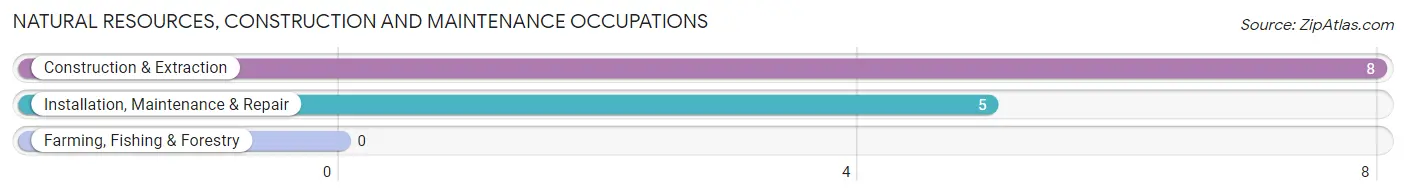
Natural Resources, Construction and Maintenance Occupations
The most common Natural Resources, Construction and Maintenance occupations in Roachdale are Construction & Extraction (8 | 2.3%), and Installation, Maintenance & Repair (5 | 1.5%).
Natural Resources, Construction and Maintenance Occupations by Sex
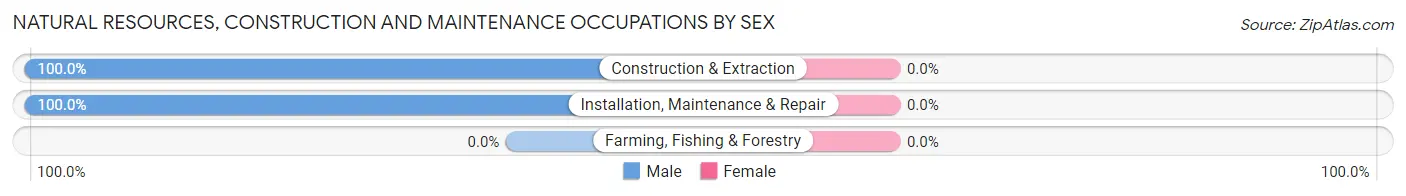
| Occupation | Male | Female |
| Farming, Fishing & Forestry | 0 (0.0%) | 0 (0.0%) |
| Construction & Extraction | 8 (100.0%) | 0 (0.0%) |
| Installation, Maintenance & Repair | 5 (100.0%) | 0 (0.0%) |
| Total (Category) | 13 (100.0%) | 0 (0.0%) |
| Total (Overall) | 185 (53.8%) | 159 (46.2%) |
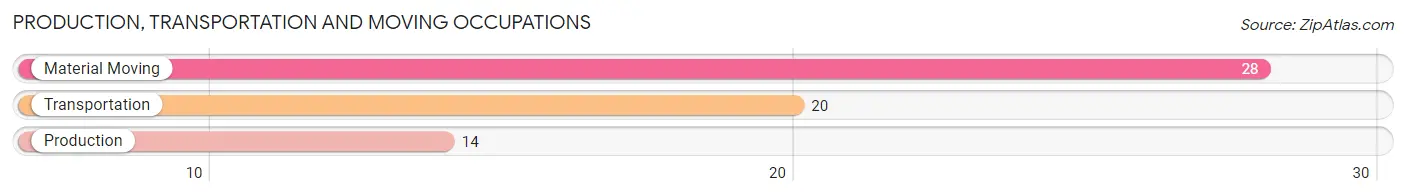
Production, Transportation and Moving Occupations
The most common Production, Transportation and Moving occupations in Roachdale are Material Moving (28 | 8.1%), Transportation (20 | 5.8%), and Production (14 | 4.1%).
Production, Transportation and Moving Occupations by Sex
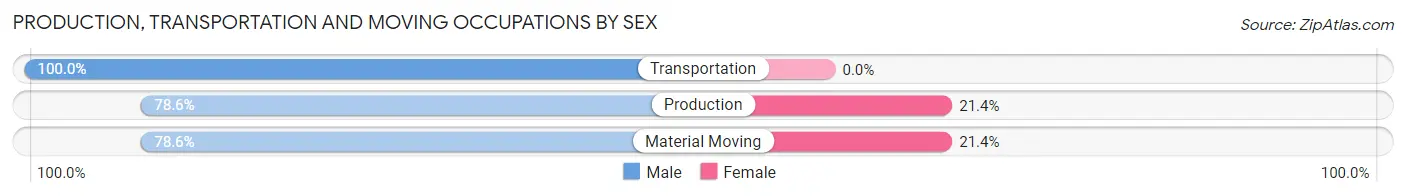
| Occupation | Male | Female |
| Production | 11 (78.6%) | 3 (21.4%) |
| Transportation | 20 (100.0%) | 0 (0.0%) |
| Material Moving | 22 (78.6%) | 6 (21.4%) |
| Total (Category) | 53 (85.5%) | 9 (14.5%) |
| Total (Overall) | 185 (53.8%) | 159 (46.2%) |
Employment Industries by Sex in Roachdale
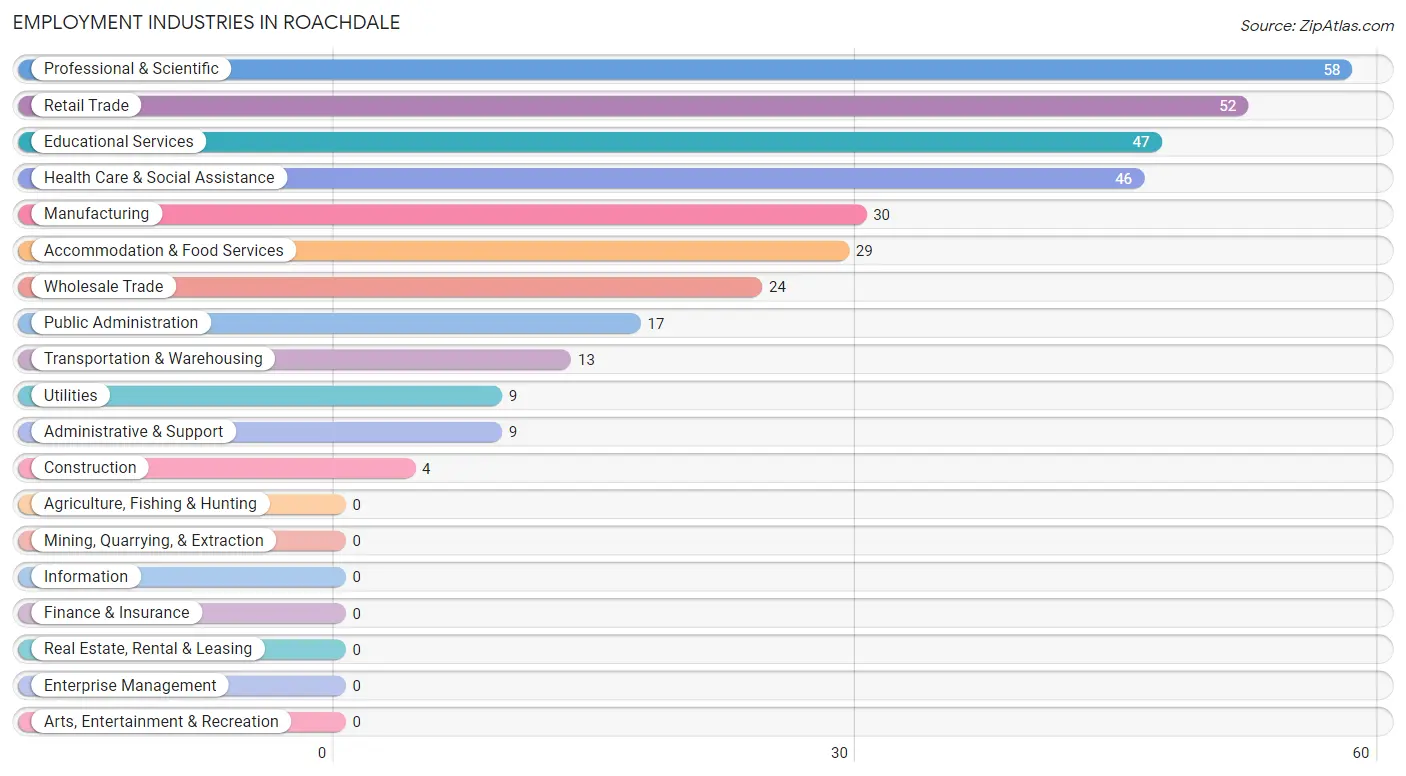
Employment Industries in Roachdale
The major employment industries in Roachdale include Professional & Scientific (58 | 16.9%), Retail Trade (52 | 15.1%), Educational Services (47 | 13.7%), Health Care & Social Assistance (46 | 13.4%), and Manufacturing (30 | 8.7%).
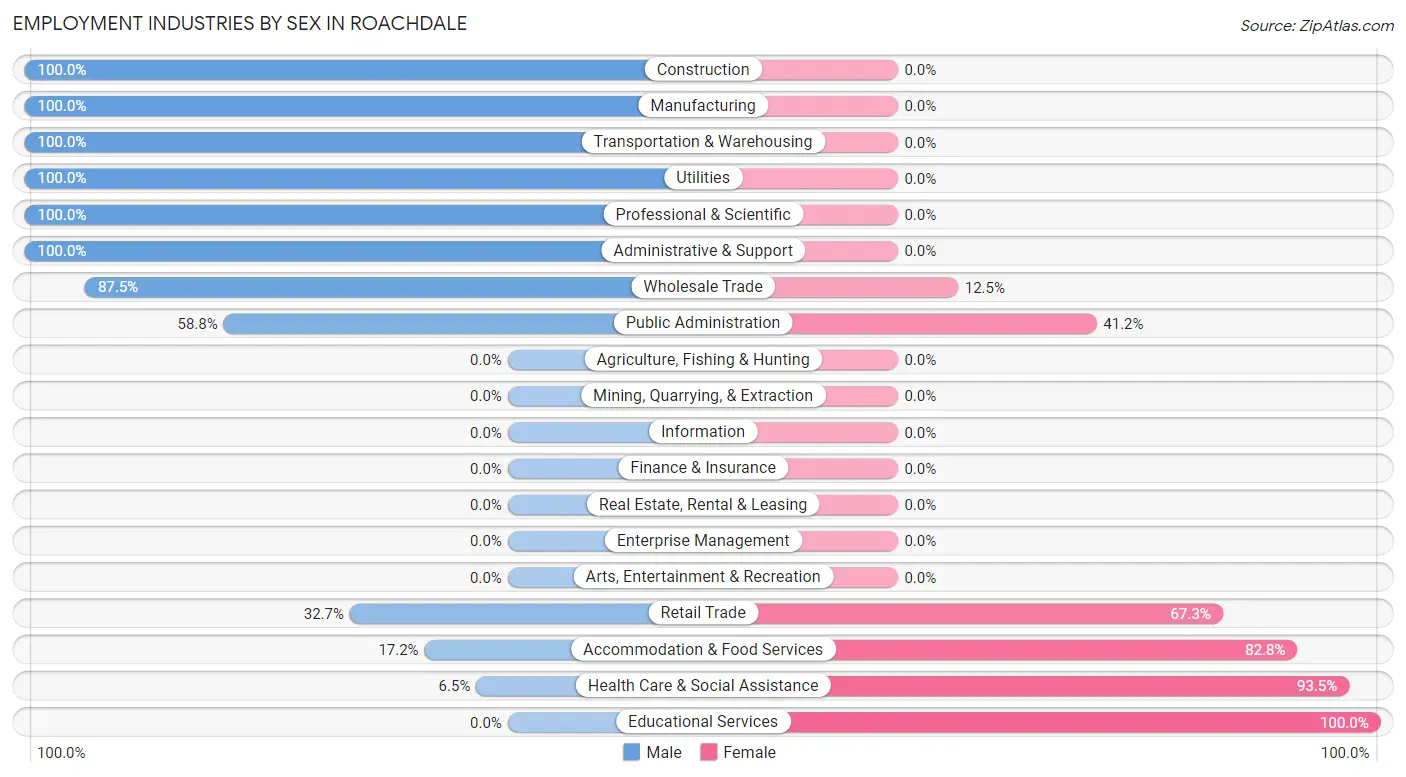
Employment Industries by Sex in Roachdale
The Roachdale industries that see more men than women are Construction (100.0%), Manufacturing (100.0%), and Transportation & Warehousing (100.0%), whereas the industries that tend to have a higher number of women are Educational Services (100.0%), Health Care & Social Assistance (93.5%), and Accommodation & Food Services (82.8%).
| Industry | Male | Female |
| Agriculture, Fishing & Hunting | 0 (0.0%) | 0 (0.0%) |
| Mining, Quarrying, & Extraction | 0 (0.0%) | 0 (0.0%) |
| Construction | 4 (100.0%) | 0 (0.0%) |
| Manufacturing | 30 (100.0%) | 0 (0.0%) |
| Wholesale Trade | 21 (87.5%) | 3 (12.5%) |
| Retail Trade | 17 (32.7%) | 35 (67.3%) |
| Transportation & Warehousing | 13 (100.0%) | 0 (0.0%) |
| Utilities | 9 (100.0%) | 0 (0.0%) |
| Information | 0 (0.0%) | 0 (0.0%) |
| Finance & Insurance | 0 (0.0%) | 0 (0.0%) |
| Real Estate, Rental & Leasing | 0 (0.0%) | 0 (0.0%) |
| Professional & Scientific | 58 (100.0%) | 0 (0.0%) |
| Enterprise Management | 0 (0.0%) | 0 (0.0%) |
| Administrative & Support | 9 (100.0%) | 0 (0.0%) |
| Educational Services | 0 (0.0%) | 47 (100.0%) |
| Health Care & Social Assistance | 3 (6.5%) | 43 (93.5%) |
| Arts, Entertainment & Recreation | 0 (0.0%) | 0 (0.0%) |
| Accommodation & Food Services | 5 (17.2%) | 24 (82.8%) |
| Public Administration | 10 (58.8%) | 7 (41.2%) |
| Total | 185 (53.8%) | 159 (46.2%) |
Education in Roachdale
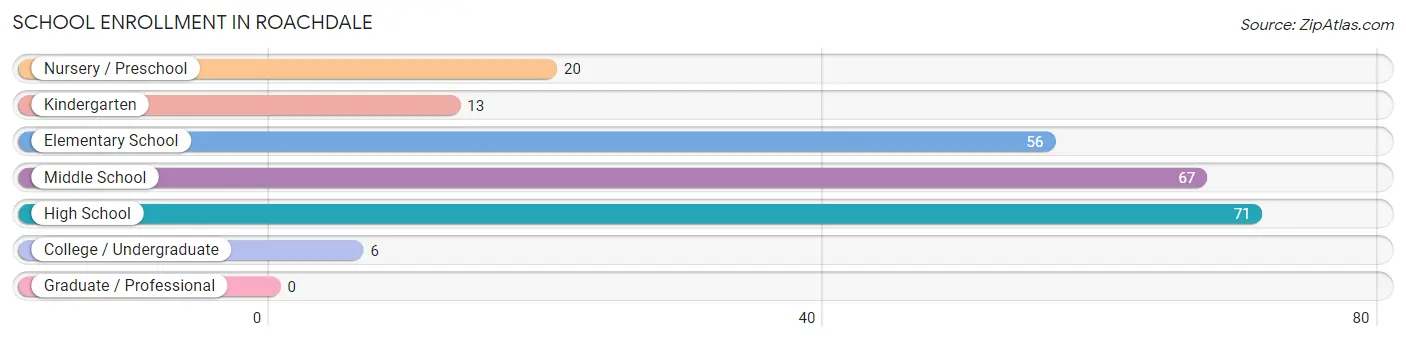
School Enrollment in Roachdale
The most common levels of schooling among the 233 students in Roachdale are high school (71 | 30.5%), middle school (67 | 28.8%), and elementary school (56 | 24.0%).
| School Level | # Students | % Students |
| Nursery / Preschool | 20 | 8.6% |
| Kindergarten | 13 | 5.6% |
| Elementary School | 56 | 24.0% |
| Middle School | 67 | 28.8% |
| High School | 71 | 30.5% |
| College / Undergraduate | 6 | 2.6% |
| Graduate / Professional | 0 | 0.0% |
| Total | 233 | 100.0% |
School Enrollment by Age by Funding Source in Roachdale
Out of a total of 233 students who are enrolled in schools in Roachdale, 13 (5.6%) attend a private institution, while the remaining 220 (94.4%) are enrolled in public schools. The age group of 5 to 9 year old has the highest likelihood of being enrolled in private schools, with 11 (16.9% in the age bracket) enrolled. Conversely, the age group of 3 to 4 year olds has the lowest likelihood of being enrolled in a private school, with 20 (100.0% in the age bracket) attending a public institution.
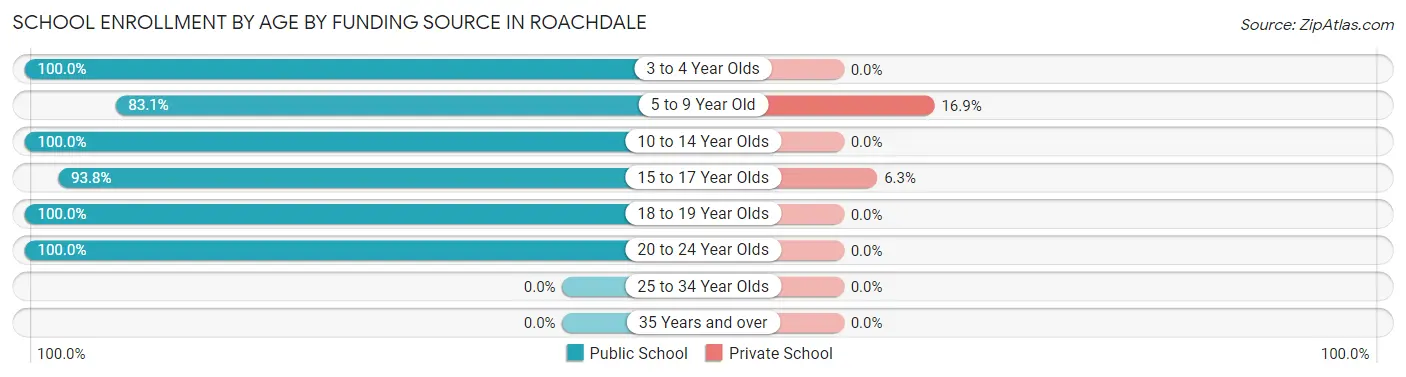
| Age Bracket | Public School | Private School |
| 3 to 4 Year Olds | 20 (100.0%) | 0 (0.0%) |
| 5 to 9 Year Old | 54 (83.1%) | 11 (16.9%) |
| 10 to 14 Year Olds | 74 (100.0%) | 0 (0.0%) |
| 15 to 17 Year Olds | 30 (93.8%) | 2 (6.2%) |
| 18 to 19 Year Olds | 36 (100.0%) | 0 (0.0%) |
| 20 to 24 Year Olds | 6 (100.0%) | 0 (0.0%) |
| 25 to 34 Year Olds | 0 (0.0%) | 0 (0.0%) |
| 35 Years and over | 0 (0.0%) | 0 (0.0%) |
| Total | 220 (94.4%) | 13 (5.6%) |
Educational Attainment by Field of Study in Roachdale
Business (57 | 58.8%), education (18 | 18.6%), engineering (7 | 7.2%), physical & health sciences (6 | 6.2%), and science & technology (5 | 5.1%) are the most common fields of study among 97 individuals in Roachdale who have obtained a bachelor's degree or higher.
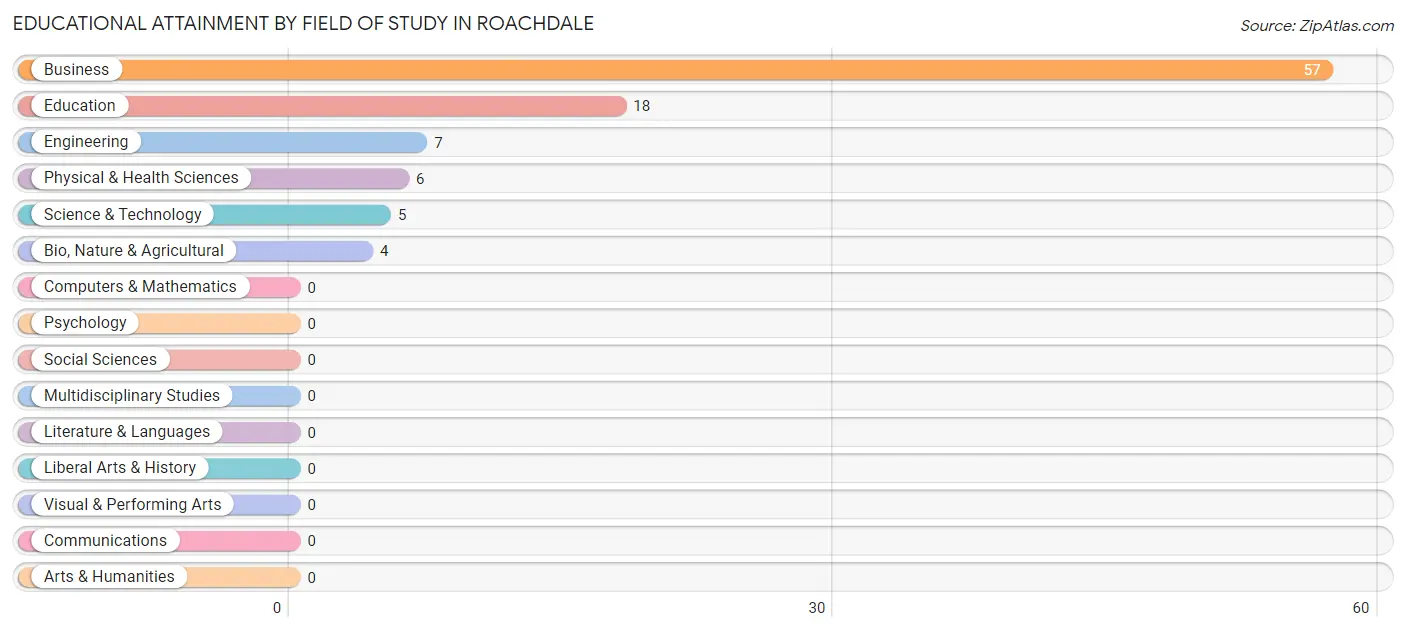
| Field of Study | # Graduates | % Graduates |
| Computers & Mathematics | 0 | 0.0% |
| Bio, Nature & Agricultural | 4 | 4.1% |
| Physical & Health Sciences | 6 | 6.2% |
| Psychology | 0 | 0.0% |
| Social Sciences | 0 | 0.0% |
| Engineering | 7 | 7.2% |
| Multidisciplinary Studies | 0 | 0.0% |
| Science & Technology | 5 | 5.1% |
| Business | 57 | 58.8% |
| Education | 18 | 18.6% |
| Literature & Languages | 0 | 0.0% |
| Liberal Arts & History | 0 | 0.0% |
| Visual & Performing Arts | 0 | 0.0% |
| Communications | 0 | 0.0% |
| Arts & Humanities | 0 | 0.0% |
| Total | 97 | 100.0% |
Transportation & Commute in Roachdale
Vehicle Availability by Sex in Roachdale
The most prevalent vehicle ownership categories in Roachdale are males with 2 vehicles (110, accounting for 59.5%) and females with 2 vehicles (67, making up 69.2%).
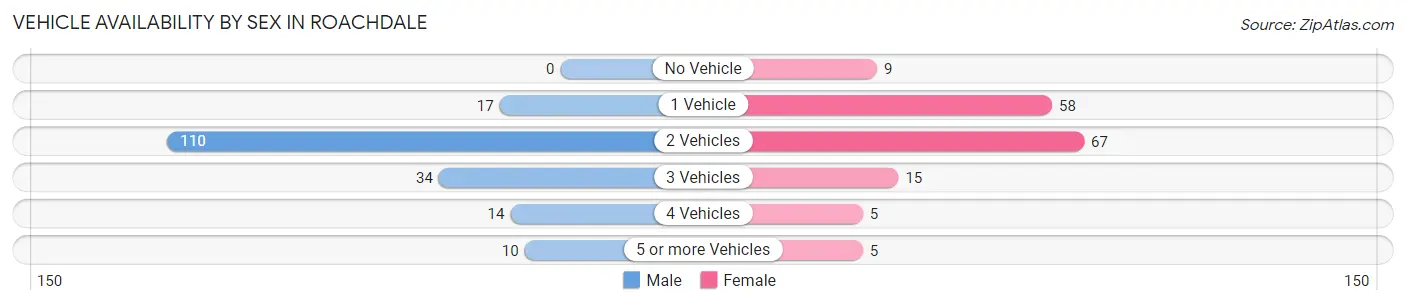
| Vehicles Available | Male | Female |
| No Vehicle | 0 (0.0%) | 9 (5.7%) |
| 1 Vehicle | 17 (9.2%) | 58 (36.5%) |
| 2 Vehicles | 110 (59.5%) | 67 (42.1%) |
| 3 Vehicles | 34 (18.4%) | 15 (9.4%) |
| 4 Vehicles | 14 (7.6%) | 5 (3.1%) |
| 5 or more Vehicles | 10 (5.4%) | 5 (3.1%) |
| Total | 185 (100.0%) | 159 (100.0%) |
Commute Time in Roachdale
The most frequently occuring commute durations in Roachdale are 45 to 59 minutes (71 commuters, 20.9%), 30 to 34 minutes (55 commuters, 16.2%), and 10 to 14 minutes (41 commuters, 12.1%).
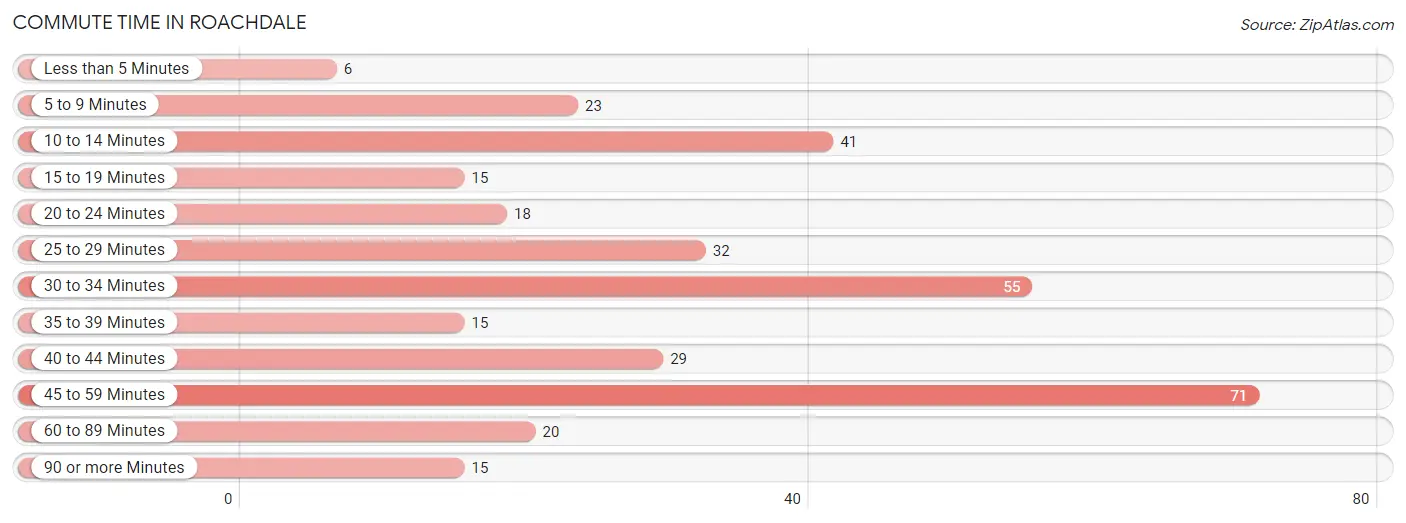
| Commute Time | # Commuters | % Commuters |
| Less than 5 Minutes | 6 | 1.8% |
| 5 to 9 Minutes | 23 | 6.8% |
| 10 to 14 Minutes | 41 | 12.1% |
| 15 to 19 Minutes | 15 | 4.4% |
| 20 to 24 Minutes | 18 | 5.3% |
| 25 to 29 Minutes | 32 | 9.4% |
| 30 to 34 Minutes | 55 | 16.2% |
| 35 to 39 Minutes | 15 | 4.4% |
| 40 to 44 Minutes | 29 | 8.5% |
| 45 to 59 Minutes | 71 | 20.9% |
| 60 to 89 Minutes | 20 | 5.9% |
| 90 or more Minutes | 15 | 4.4% |
Commute Time by Sex in Roachdale
The most common commute times in Roachdale are 45 to 59 minutes (67 commuters, 36.2%) for males and 10 to 14 minutes (41 commuters, 26.5%) for females.
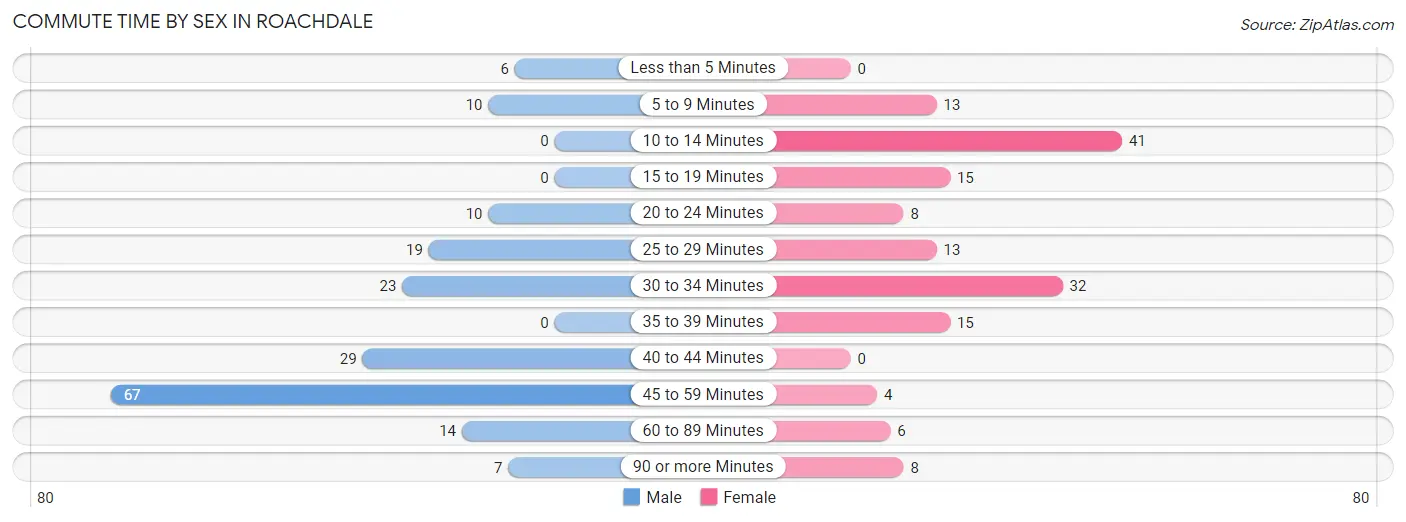
| Commute Time | Male | Female |
| Less than 5 Minutes | 6 (3.2%) | 0 (0.0%) |
| 5 to 9 Minutes | 10 (5.4%) | 13 (8.4%) |
| 10 to 14 Minutes | 0 (0.0%) | 41 (26.5%) |
| 15 to 19 Minutes | 0 (0.0%) | 15 (9.7%) |
| 20 to 24 Minutes | 10 (5.4%) | 8 (5.2%) |
| 25 to 29 Minutes | 19 (10.3%) | 13 (8.4%) |
| 30 to 34 Minutes | 23 (12.4%) | 32 (20.6%) |
| 35 to 39 Minutes | 0 (0.0%) | 15 (9.7%) |
| 40 to 44 Minutes | 29 (15.7%) | 0 (0.0%) |
| 45 to 59 Minutes | 67 (36.2%) | 4 (2.6%) |
| 60 to 89 Minutes | 14 (7.6%) | 6 (3.9%) |
| 90 or more Minutes | 7 (3.8%) | 8 (5.2%) |
Time of Departure to Work by Sex in Roachdale
The most frequent times of departure to work in Roachdale are 6:00 AM to 6:29 AM (92, 49.7%) for males and 8:30 AM to 8:59 AM (41, 26.5%) for females.
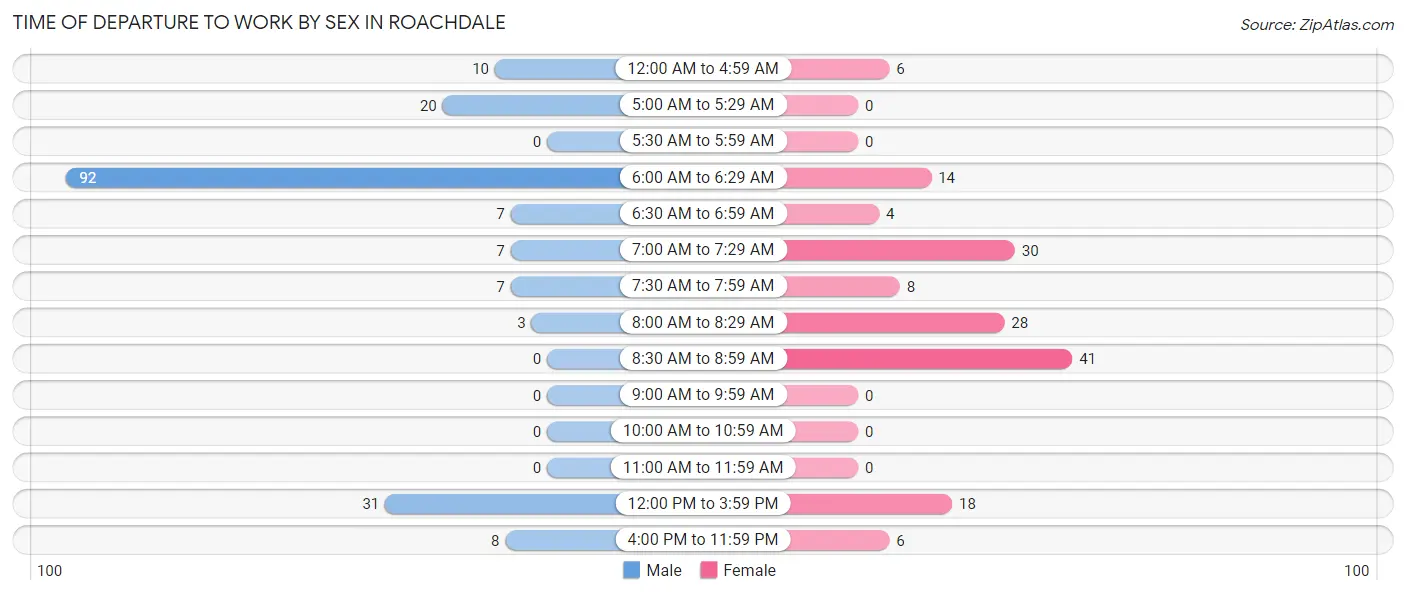
| Time of Departure | Male | Female |
| 12:00 AM to 4:59 AM | 10 (5.4%) | 6 (3.9%) |
| 5:00 AM to 5:29 AM | 20 (10.8%) | 0 (0.0%) |
| 5:30 AM to 5:59 AM | 0 (0.0%) | 0 (0.0%) |
| 6:00 AM to 6:29 AM | 92 (49.7%) | 14 (9.0%) |
| 6:30 AM to 6:59 AM | 7 (3.8%) | 4 (2.6%) |
| 7:00 AM to 7:29 AM | 7 (3.8%) | 30 (19.4%) |
| 7:30 AM to 7:59 AM | 7 (3.8%) | 8 (5.2%) |
| 8:00 AM to 8:29 AM | 3 (1.6%) | 28 (18.1%) |
| 8:30 AM to 8:59 AM | 0 (0.0%) | 41 (26.5%) |
| 9:00 AM to 9:59 AM | 0 (0.0%) | 0 (0.0%) |
| 10:00 AM to 10:59 AM | 0 (0.0%) | 0 (0.0%) |
| 11:00 AM to 11:59 AM | 0 (0.0%) | 0 (0.0%) |
| 12:00 PM to 3:59 PM | 31 (16.8%) | 18 (11.6%) |
| 4:00 PM to 11:59 PM | 8 (4.3%) | 6 (3.9%) |
| Total | 185 (100.0%) | 155 (100.0%) |
Housing Occupancy in Roachdale
Occupancy by Ownership in Roachdale
Of the total 340 dwellings in Roachdale, owner-occupied units account for 229 (67.3%), while renter-occupied units make up 111 (32.7%).
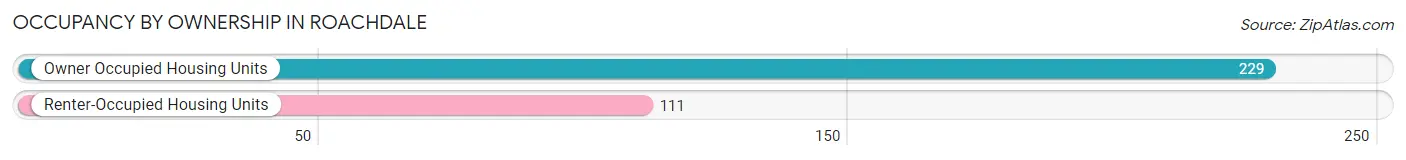
| Occupancy | # Housing Units | % Housing Units |
| Owner Occupied Housing Units | 229 | 67.3% |
| Renter-Occupied Housing Units | 111 | 32.7% |
| Total Occupied Housing Units | 340 | 100.0% |
Occupancy by Household Size in Roachdale
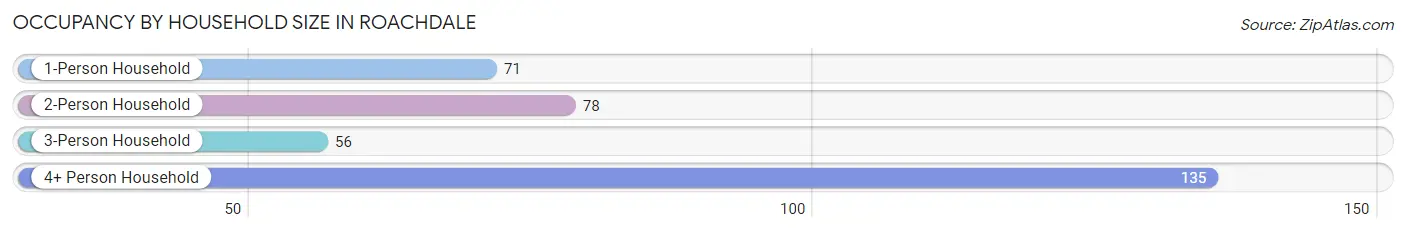
| Household Size | # Housing Units | % Housing Units |
| 1-Person Household | 71 | 20.9% |
| 2-Person Household | 78 | 22.9% |
| 3-Person Household | 56 | 16.5% |
| 4+ Person Household | 135 | 39.7% |
| Total Housing Units | 340 | 100.0% |
Occupancy by Ownership by Household Size in Roachdale
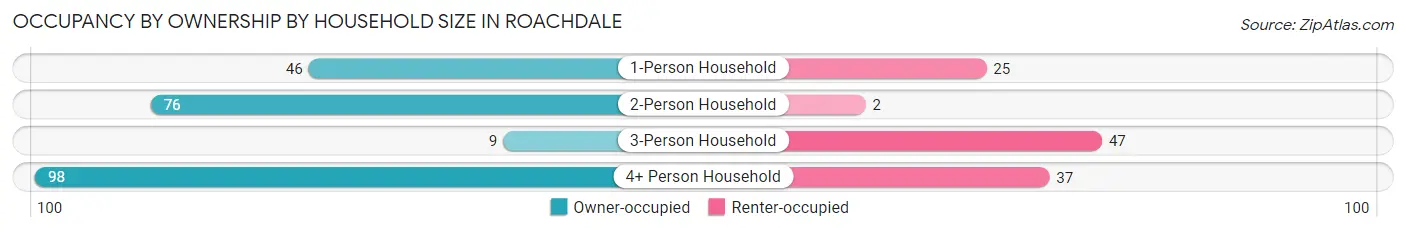
| Household Size | Owner-occupied | Renter-occupied |
| 1-Person Household | 46 (64.8%) | 25 (35.2%) |
| 2-Person Household | 76 (97.4%) | 2 (2.6%) |
| 3-Person Household | 9 (16.1%) | 47 (83.9%) |
| 4+ Person Household | 98 (72.6%) | 37 (27.4%) |
| Total Housing Units | 229 (67.3%) | 111 (32.7%) |
Occupancy by Educational Attainment in Roachdale
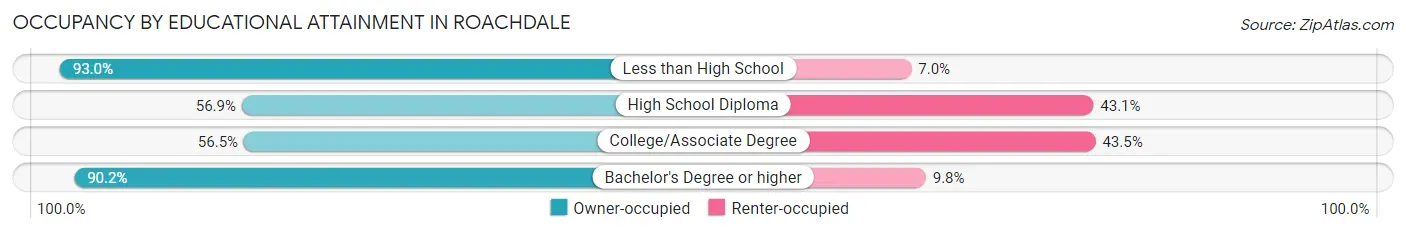
| Household Size | Owner-occupied | Renter-occupied |
| Less than High School | 40 (93.0%) | 3 (7.0%) |
| High School Diploma | 82 (56.9%) | 62 (43.1%) |
| College/Associate Degree | 52 (56.5%) | 40 (43.5%) |
| Bachelor's Degree or higher | 55 (90.2%) | 6 (9.8%) |
Occupancy by Age of Householder in Roachdale
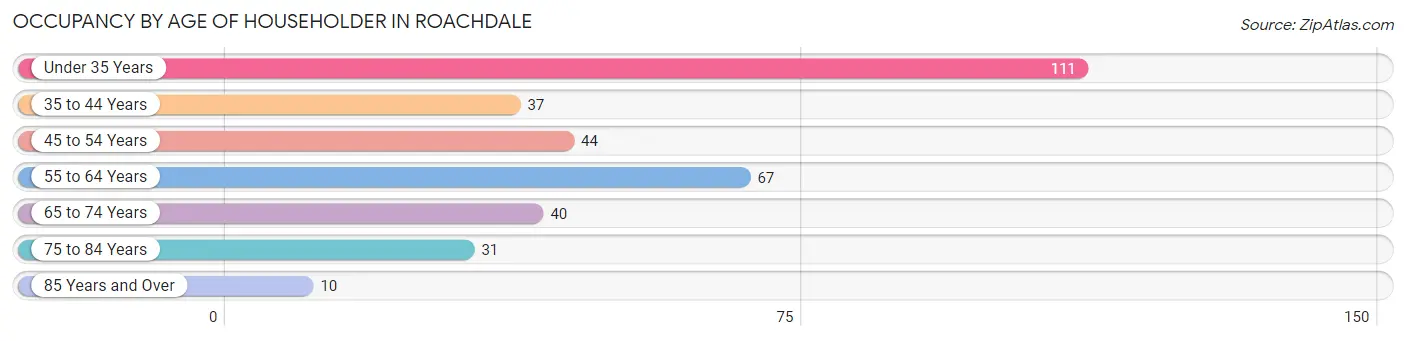
| Age Bracket | # Households | % Households |
| Under 35 Years | 111 | 32.7% |
| 35 to 44 Years | 37 | 10.9% |
| 45 to 54 Years | 44 | 12.9% |
| 55 to 64 Years | 67 | 19.7% |
| 65 to 74 Years | 40 | 11.8% |
| 75 to 84 Years | 31 | 9.1% |
| 85 Years and Over | 10 | 2.9% |
| Total | 340 | 100.0% |
Housing Finances in Roachdale
Median Income by Occupancy in Roachdale
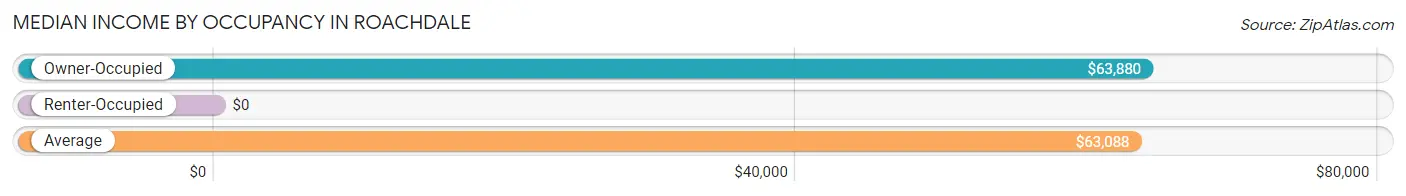
| Occupancy Type | # Households | Median Income |
| Owner-Occupied | 229 (67.3%) | $63,880 |
| Renter-Occupied | 111 (32.7%) | $0 |
| Average | 340 (100.0%) | $63,088 |
Occupancy by Householder Income Bracket in Roachdale
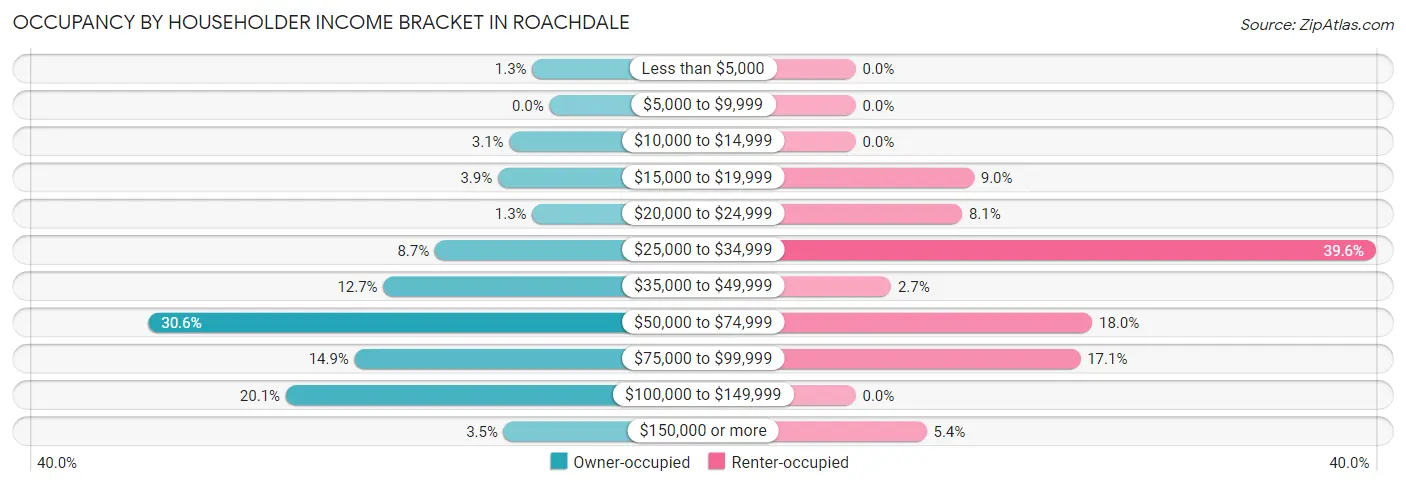
| Income Bracket | Owner-occupied | Renter-occupied |
| Less than $5,000 | 3 (1.3%) | 0 (0.0%) |
| $5,000 to $9,999 | 0 (0.0%) | 0 (0.0%) |
| $10,000 to $14,999 | 7 (3.1%) | 0 (0.0%) |
| $15,000 to $19,999 | 9 (3.9%) | 10 (9.0%) |
| $20,000 to $24,999 | 3 (1.3%) | 9 (8.1%) |
| $25,000 to $34,999 | 20 (8.7%) | 44 (39.6%) |
| $35,000 to $49,999 | 29 (12.7%) | 3 (2.7%) |
| $50,000 to $74,999 | 70 (30.6%) | 20 (18.0%) |
| $75,000 to $99,999 | 34 (14.8%) | 19 (17.1%) |
| $100,000 to $149,999 | 46 (20.1%) | 0 (0.0%) |
| $150,000 or more | 8 (3.5%) | 6 (5.4%) |
| Total | 229 (100.0%) | 111 (100.0%) |
Monthly Housing Cost Tiers in Roachdale
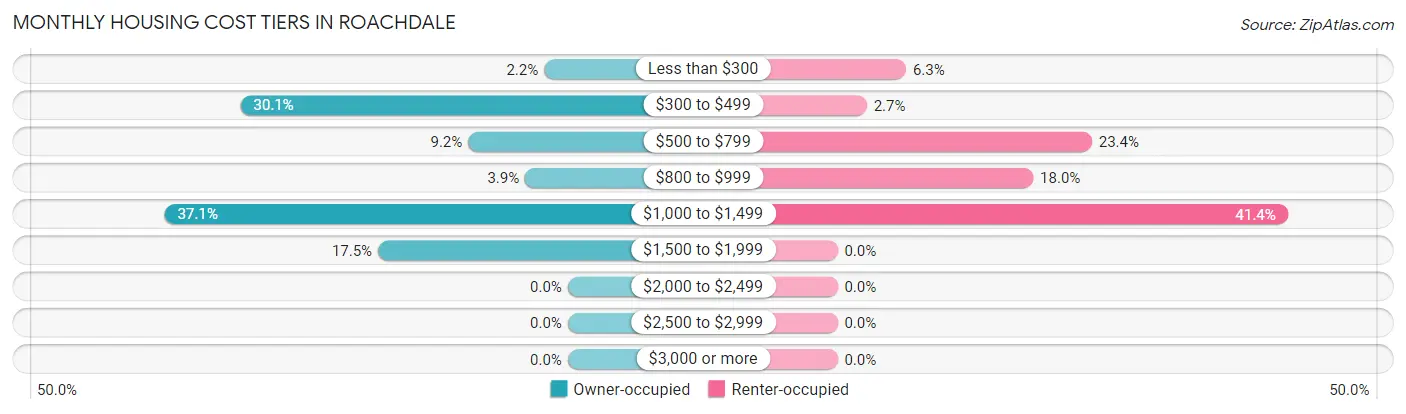
| Monthly Cost | Owner-occupied | Renter-occupied |
| Less than $300 | 5 (2.2%) | 7 (6.3%) |
| $300 to $499 | 69 (30.1%) | 3 (2.7%) |
| $500 to $799 | 21 (9.2%) | 26 (23.4%) |
| $800 to $999 | 9 (3.9%) | 20 (18.0%) |
| $1,000 to $1,499 | 85 (37.1%) | 46 (41.4%) |
| $1,500 to $1,999 | 40 (17.5%) | 0 (0.0%) |
| $2,000 to $2,499 | 0 (0.0%) | 0 (0.0%) |
| $2,500 to $2,999 | 0 (0.0%) | 0 (0.0%) |
| $3,000 or more | 0 (0.0%) | 0 (0.0%) |
| Total | 229 (100.0%) | 111 (100.0%) |
Physical Housing Characteristics in Roachdale
Housing Structures in Roachdale
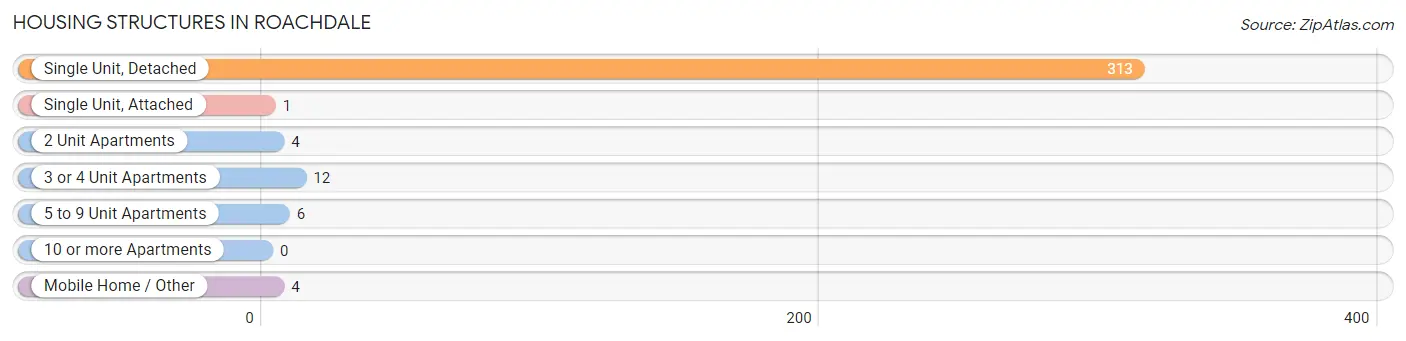
| Structure Type | # Housing Units | % Housing Units |
| Single Unit, Detached | 313 | 92.1% |
| Single Unit, Attached | 1 | 0.3% |
| 2 Unit Apartments | 4 | 1.2% |
| 3 or 4 Unit Apartments | 12 | 3.5% |
| 5 to 9 Unit Apartments | 6 | 1.8% |
| 10 or more Apartments | 0 | 0.0% |
| Mobile Home / Other | 4 | 1.2% |
| Total | 340 | 100.0% |
Housing Structures by Occupancy in Roachdale
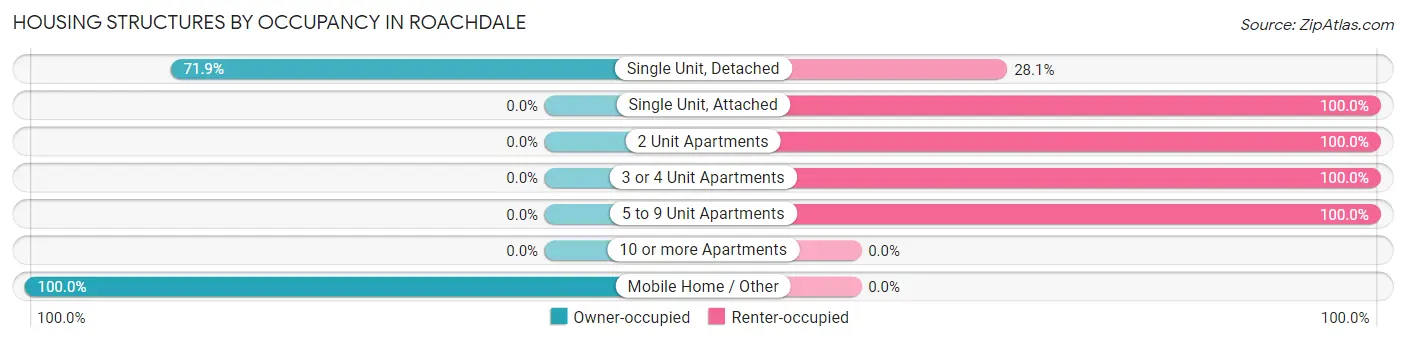
| Structure Type | Owner-occupied | Renter-occupied |
| Single Unit, Detached | 225 (71.9%) | 88 (28.1%) |
| Single Unit, Attached | 0 (0.0%) | 1 (100.0%) |
| 2 Unit Apartments | 0 (0.0%) | 4 (100.0%) |
| 3 or 4 Unit Apartments | 0 (0.0%) | 12 (100.0%) |
| 5 to 9 Unit Apartments | 0 (0.0%) | 6 (100.0%) |
| 10 or more Apartments | 0 (0.0%) | 0 (0.0%) |
| Mobile Home / Other | 4 (100.0%) | 0 (0.0%) |
| Total | 229 (67.3%) | 111 (32.7%) |
Housing Structures by Number of Rooms in Roachdale
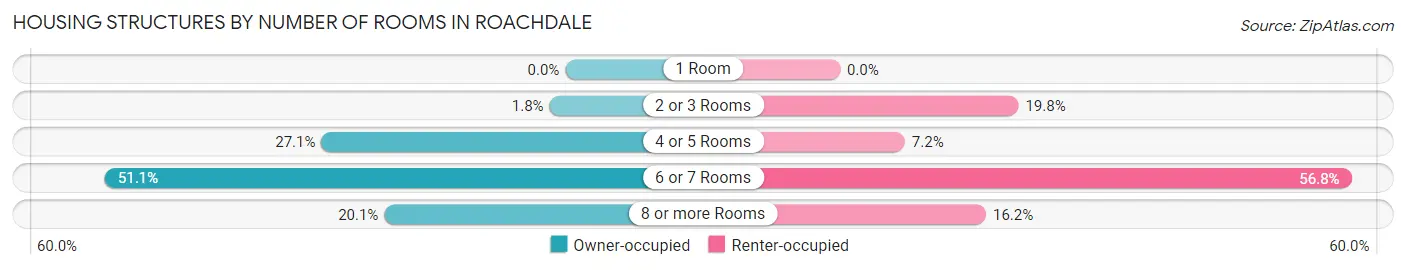
| Number of Rooms | Owner-occupied | Renter-occupied |
| 1 Room | 0 (0.0%) | 0 (0.0%) |
| 2 or 3 Rooms | 4 (1.8%) | 22 (19.8%) |
| 4 or 5 Rooms | 62 (27.1%) | 8 (7.2%) |
| 6 or 7 Rooms | 117 (51.1%) | 63 (56.8%) |
| 8 or more Rooms | 46 (20.1%) | 18 (16.2%) |
| Total | 229 (100.0%) | 111 (100.0%) |
Housing Structure by Heating Type in Roachdale
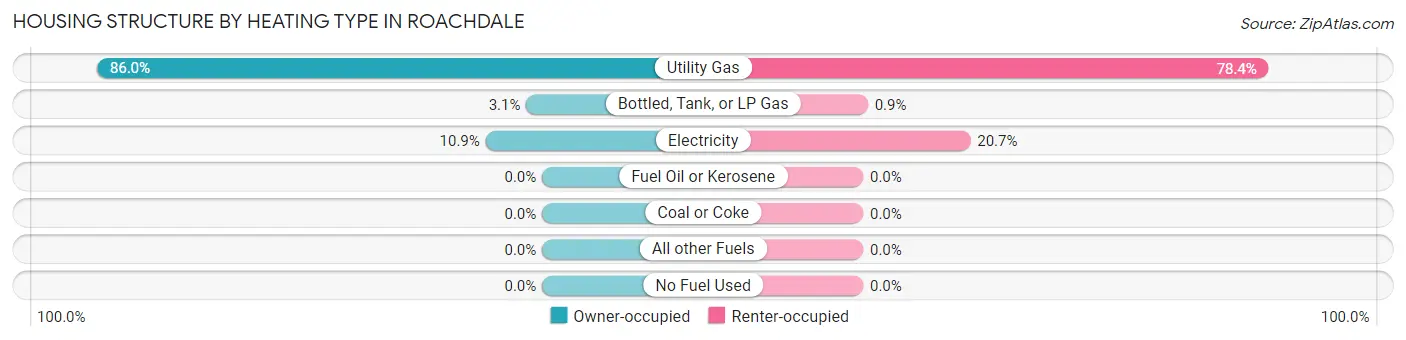
| Heating Type | Owner-occupied | Renter-occupied |
| Utility Gas | 197 (86.0%) | 87 (78.4%) |
| Bottled, Tank, or LP Gas | 7 (3.1%) | 1 (0.9%) |
| Electricity | 25 (10.9%) | 23 (20.7%) |
| Fuel Oil or Kerosene | 0 (0.0%) | 0 (0.0%) |
| Coal or Coke | 0 (0.0%) | 0 (0.0%) |
| All other Fuels | 0 (0.0%) | 0 (0.0%) |
| No Fuel Used | 0 (0.0%) | 0 (0.0%) |
| Total | 229 (100.0%) | 111 (100.0%) |
Household Vehicle Usage in Roachdale
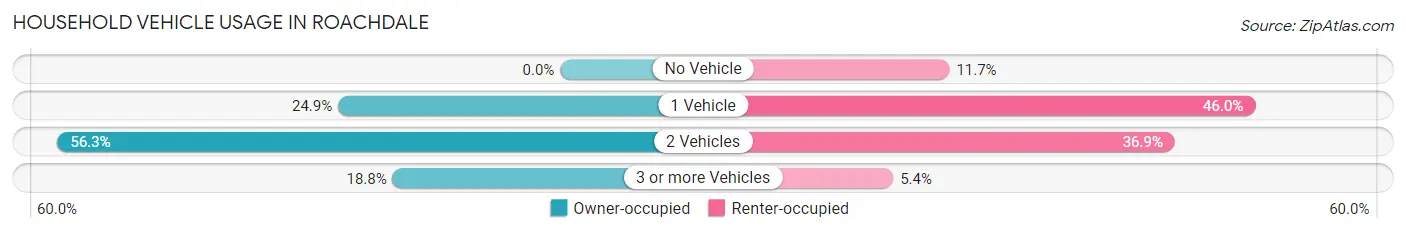
| Vehicles per Household | Owner-occupied | Renter-occupied |
| No Vehicle | 0 (0.0%) | 13 (11.7%) |
| 1 Vehicle | 57 (24.9%) | 51 (46.0%) |
| 2 Vehicles | 129 (56.3%) | 41 (36.9%) |
| 3 or more Vehicles | 43 (18.8%) | 6 (5.4%) |
| Total | 229 (100.0%) | 111 (100.0%) |
Real Estate & Mortgages in Roachdale
Real Estate and Mortgage Overview in Roachdale
| Characteristic | Without Mortgage | With Mortgage |
| Housing Units | 85 | 144 |
| Median Property Value | $91,500 | $140,400 |
| Median Household Income | $43,393 | $8 |
| Monthly Housing Costs | $417 | $0 |
| Real Estate Taxes | $526 | $0 |
Property Value by Mortgage Status in Roachdale
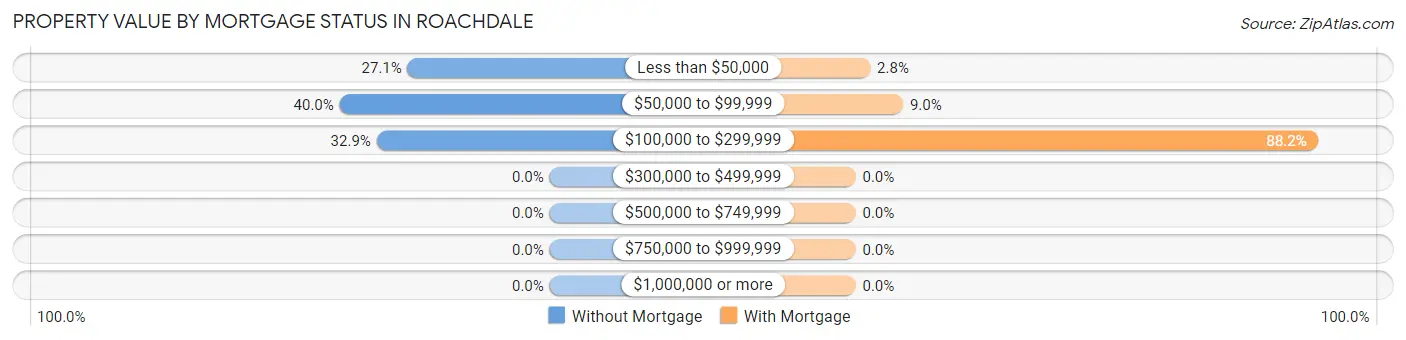
| Property Value | Without Mortgage | With Mortgage |
| Less than $50,000 | 23 (27.1%) | 4 (2.8%) |
| $50,000 to $99,999 | 34 (40.0%) | 13 (9.0%) |
| $100,000 to $299,999 | 28 (32.9%) | 127 (88.2%) |
| $300,000 to $499,999 | 0 (0.0%) | 0 (0.0%) |
| $500,000 to $749,999 | 0 (0.0%) | 0 (0.0%) |
| $750,000 to $999,999 | 0 (0.0%) | 0 (0.0%) |
| $1,000,000 or more | 0 (0.0%) | 0 (0.0%) |
| Total | 85 (100.0%) | 144 (100.0%) |
Household Income by Mortgage Status in Roachdale
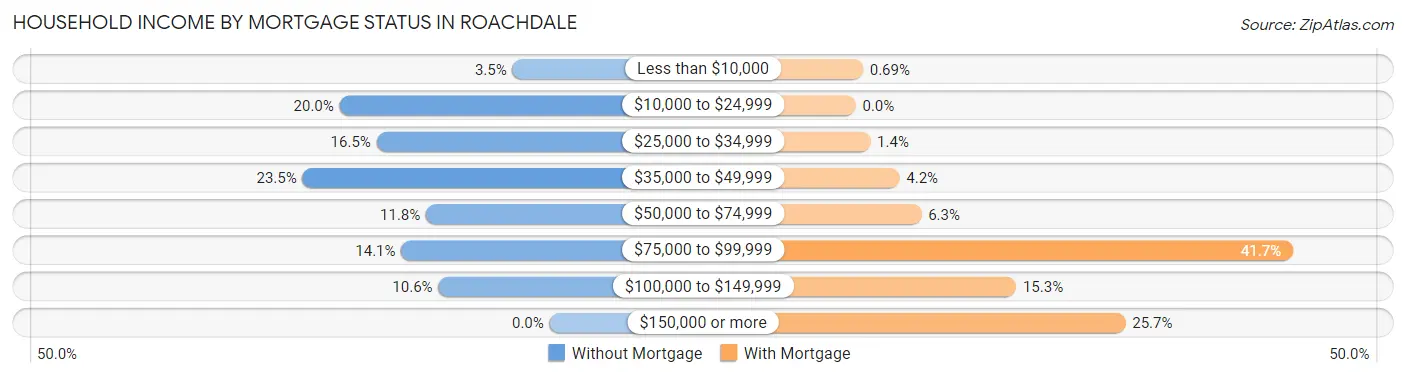
| Household Income | Without Mortgage | With Mortgage |
| Less than $10,000 | 3 (3.5%) | 1 (0.7%) |
| $10,000 to $24,999 | 17 (20.0%) | 0 (0.0%) |
| $25,000 to $34,999 | 14 (16.5%) | 2 (1.4%) |
| $35,000 to $49,999 | 20 (23.5%) | 6 (4.2%) |
| $50,000 to $74,999 | 10 (11.8%) | 9 (6.2%) |
| $75,000 to $99,999 | 12 (14.1%) | 60 (41.7%) |
| $100,000 to $149,999 | 9 (10.6%) | 22 (15.3%) |
| $150,000 or more | 0 (0.0%) | 37 (25.7%) |
| Total | 85 (100.0%) | 144 (100.0%) |
Property Value to Household Income Ratio in Roachdale
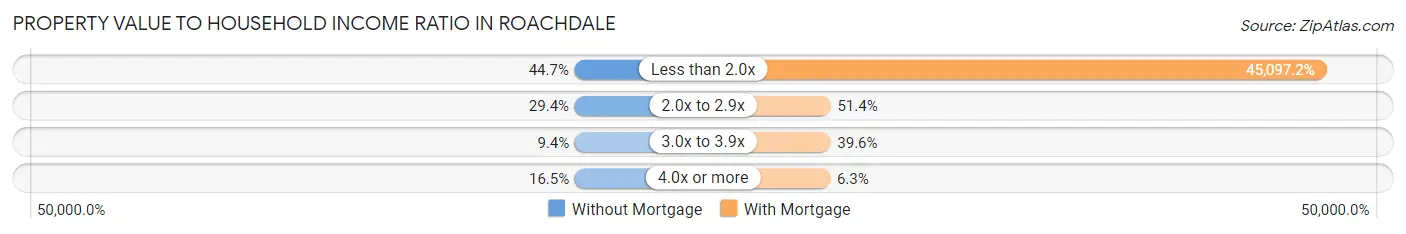
| Value-to-Income Ratio | Without Mortgage | With Mortgage |
| Less than 2.0x | 38 (44.7%) | 64,940 (45,097.2%) |
| 2.0x to 2.9x | 25 (29.4%) | 74 (51.4%) |
| 3.0x to 3.9x | 8 (9.4%) | 57 (39.6%) |
| 4.0x or more | 14 (16.5%) | 9 (6.2%) |
| Total | 85 (100.0%) | 144 (100.0%) |
Real Estate Taxes by Mortgage Status in Roachdale
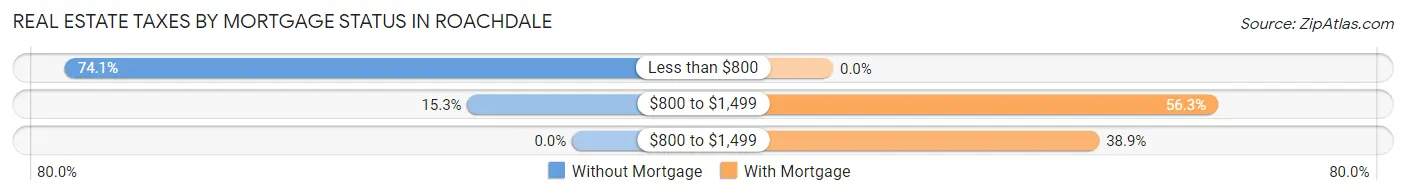
| Property Taxes | Without Mortgage | With Mortgage |
| Less than $800 | 63 (74.1%) | 0 (0.0%) |
| $800 to $1,499 | 13 (15.3%) | 81 (56.2%) |
| $800 to $1,499 | 0 (0.0%) | 56 (38.9%) |
| Total | 85 (100.0%) | 144 (100.0%) |
Health & Disability in Roachdale
Health Insurance Coverage by Age in Roachdale
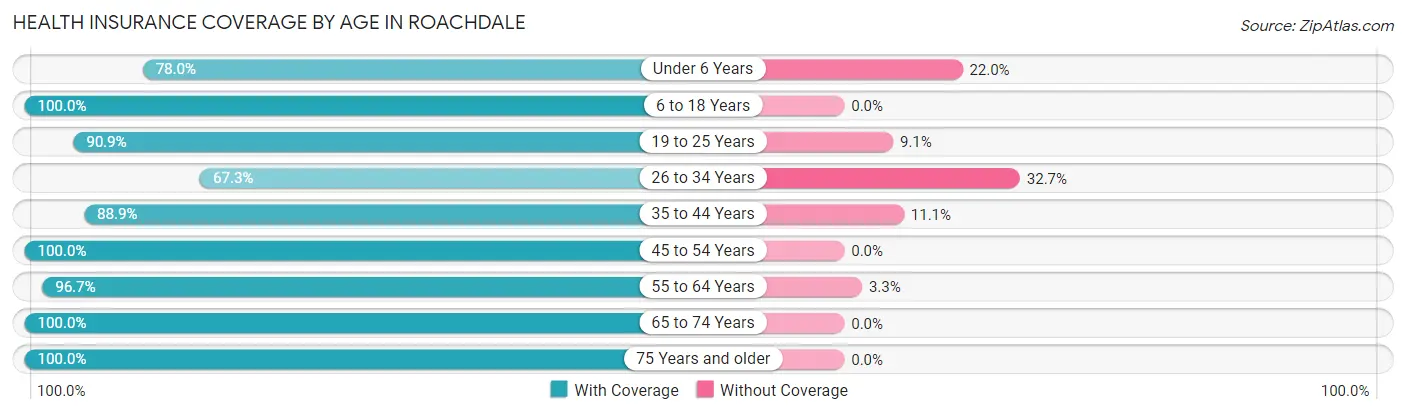
| Age Bracket | With Coverage | Without Coverage |
| Under 6 Years | 46 (78.0%) | 13 (22.0%) |
| 6 to 18 Years | 196 (100.0%) | 0 (0.0%) |
| 19 to 25 Years | 60 (90.9%) | 6 (9.1%) |
| 26 to 34 Years | 76 (67.3%) | 37 (32.7%) |
| 35 to 44 Years | 64 (88.9%) | 8 (11.1%) |
| 45 to 54 Years | 79 (100.0%) | 0 (0.0%) |
| 55 to 64 Years | 88 (96.7%) | 3 (3.3%) |
| 65 to 74 Years | 60 (100.0%) | 0 (0.0%) |
| 75 Years and older | 50 (100.0%) | 0 (0.0%) |
| Total | 719 (91.5%) | 67 (8.5%) |
Health Insurance Coverage by Citizenship Status in Roachdale
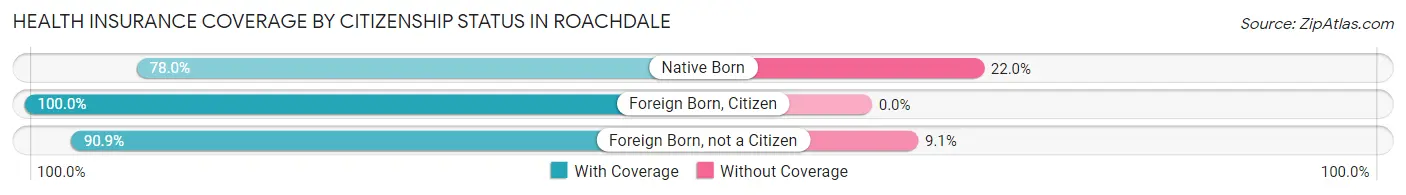
| Citizenship Status | With Coverage | Without Coverage |
| Native Born | 46 (78.0%) | 13 (22.0%) |
| Foreign Born, Citizen | 196 (100.0%) | 0 (0.0%) |
| Foreign Born, not a Citizen | 60 (90.9%) | 6 (9.1%) |
Health Insurance Coverage by Household Income in Roachdale
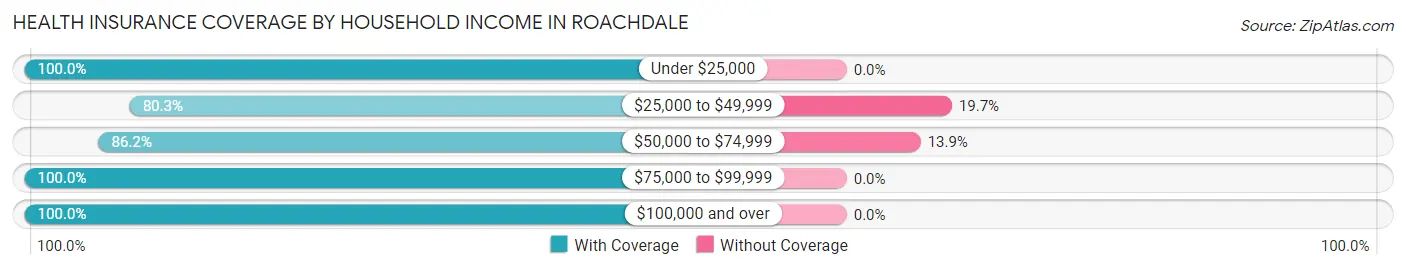
| Household Income | With Coverage | Without Coverage |
| Under $25,000 | 75 (100.0%) | 0 (0.0%) |
| $25,000 to $49,999 | 163 (80.3%) | 40 (19.7%) |
| $50,000 to $74,999 | 168 (86.2%) | 27 (13.9%) |
| $75,000 to $99,999 | 148 (100.0%) | 0 (0.0%) |
| $100,000 and over | 165 (100.0%) | 0 (0.0%) |
Public vs Private Health Insurance Coverage by Age in Roachdale
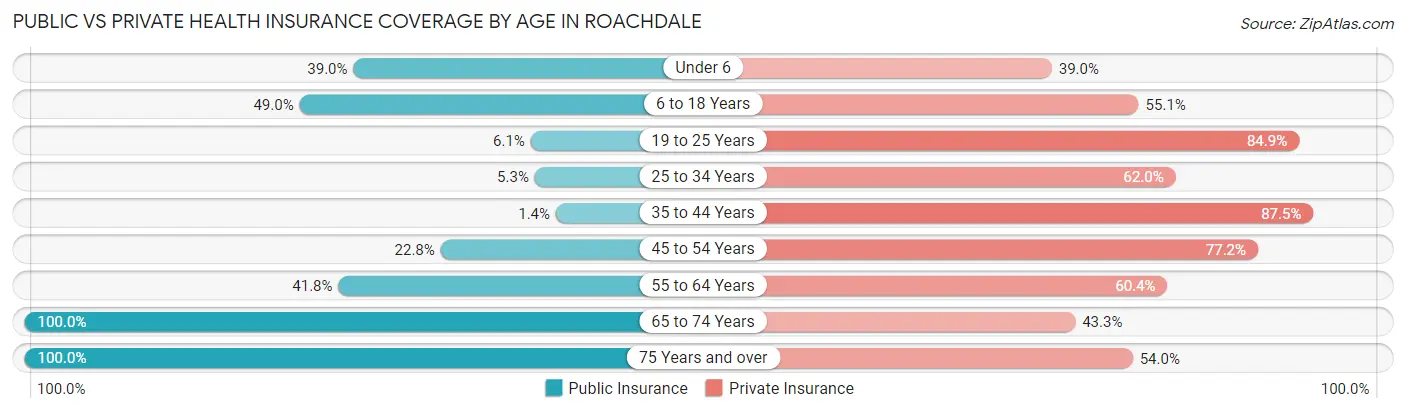
| Age Bracket | Public Insurance | Private Insurance |
| Under 6 | 23 (39.0%) | 23 (39.0%) |
| 6 to 18 Years | 96 (49.0%) | 108 (55.1%) |
| 19 to 25 Years | 4 (6.1%) | 56 (84.9%) |
| 25 to 34 Years | 6 (5.3%) | 70 (62.0%) |
| 35 to 44 Years | 1 (1.4%) | 63 (87.5%) |
| 45 to 54 Years | 18 (22.8%) | 61 (77.2%) |
| 55 to 64 Years | 38 (41.8%) | 55 (60.4%) |
| 65 to 74 Years | 60 (100.0%) | 26 (43.3%) |
| 75 Years and over | 50 (100.0%) | 27 (54.0%) |
| Total | 296 (37.7%) | 489 (62.2%) |
Disability Status by Sex by Age in Roachdale
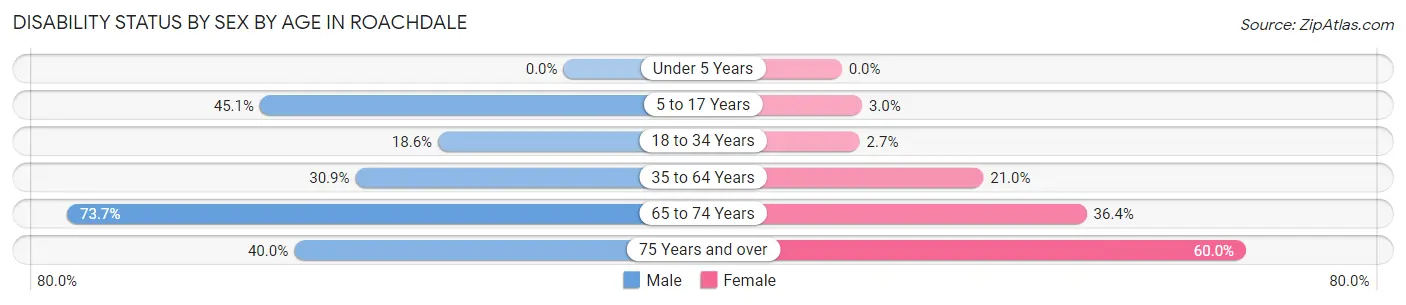
| Age Bracket | Male | Female |
| Under 5 Years | 0 (0.0%) | 0 (0.0%) |
| 5 to 17 Years | 32 (45.1%) | 3 (3.0%) |
| 18 to 34 Years | 19 (18.6%) | 3 (2.6%) |
| 35 to 64 Years | 38 (30.9%) | 25 (21.0%) |
| 65 to 74 Years | 28 (73.7%) | 8 (36.4%) |
| 75 Years and over | 8 (40.0%) | 18 (60.0%) |
Disability Class by Sex by Age in Roachdale
Disability Class: Hearing Difficulty
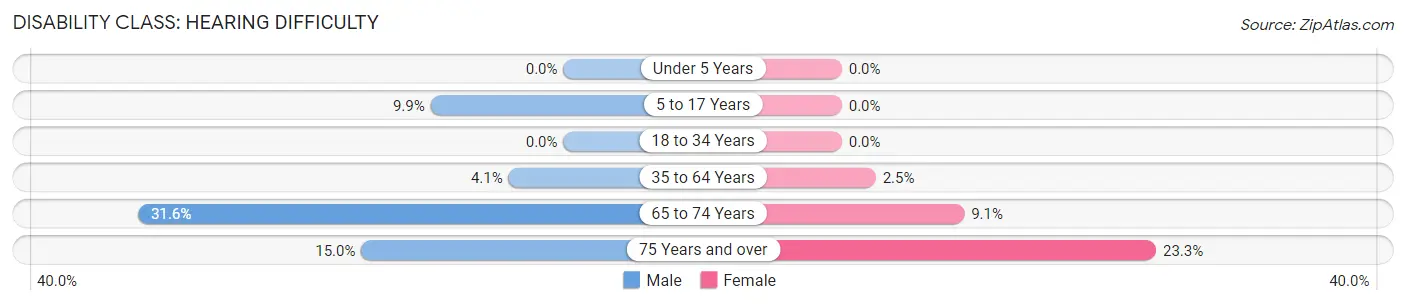
| Age Bracket | Male | Female |
| Under 5 Years | 0 (0.0%) | 0 (0.0%) |
| 5 to 17 Years | 7 (9.9%) | 0 (0.0%) |
| 18 to 34 Years | 0 (0.0%) | 0 (0.0%) |
| 35 to 64 Years | 5 (4.1%) | 3 (2.5%) |
| 65 to 74 Years | 12 (31.6%) | 2 (9.1%) |
| 75 Years and over | 3 (15.0%) | 7 (23.3%) |
Disability Class: Vision Difficulty
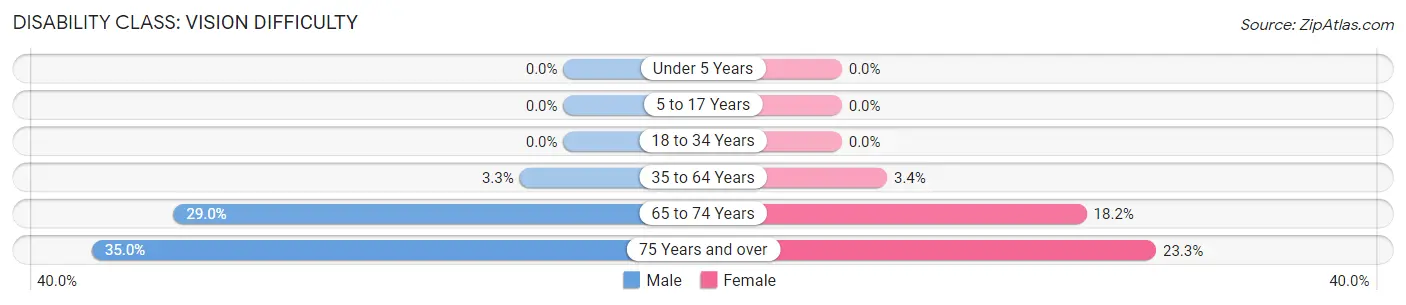
| Age Bracket | Male | Female |
| Under 5 Years | 0 (0.0%) | 0 (0.0%) |
| 5 to 17 Years | 0 (0.0%) | 0 (0.0%) |
| 18 to 34 Years | 0 (0.0%) | 0 (0.0%) |
| 35 to 64 Years | 4 (3.3%) | 4 (3.4%) |
| 65 to 74 Years | 11 (28.9%) | 4 (18.2%) |
| 75 Years and over | 7 (35.0%) | 7 (23.3%) |
Disability Class: Cognitive Difficulty
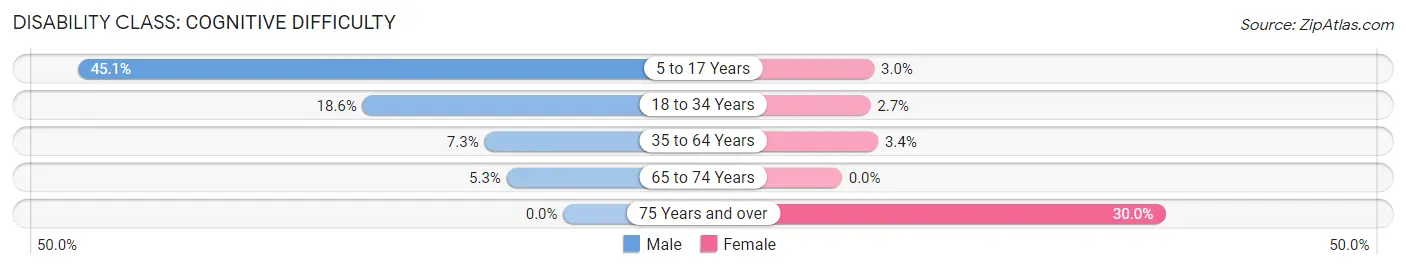
| Age Bracket | Male | Female |
| 5 to 17 Years | 32 (45.1%) | 3 (3.0%) |
| 18 to 34 Years | 19 (18.6%) | 3 (2.6%) |
| 35 to 64 Years | 9 (7.3%) | 4 (3.4%) |
| 65 to 74 Years | 2 (5.3%) | 0 (0.0%) |
| 75 Years and over | 0 (0.0%) | 9 (30.0%) |
Disability Class: Ambulatory Difficulty
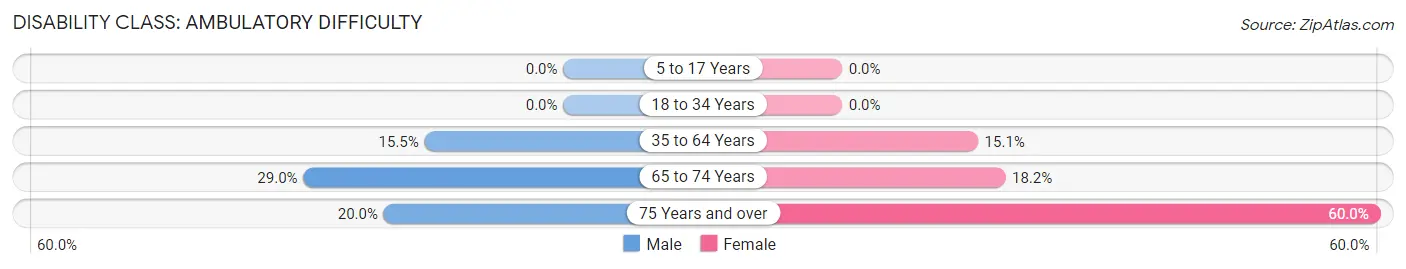
| Age Bracket | Male | Female |
| 5 to 17 Years | 0 (0.0%) | 0 (0.0%) |
| 18 to 34 Years | 0 (0.0%) | 0 (0.0%) |
| 35 to 64 Years | 19 (15.4%) | 18 (15.1%) |
| 65 to 74 Years | 11 (28.9%) | 4 (18.2%) |
| 75 Years and over | 4 (20.0%) | 18 (60.0%) |
Disability Class: Self-Care Difficulty
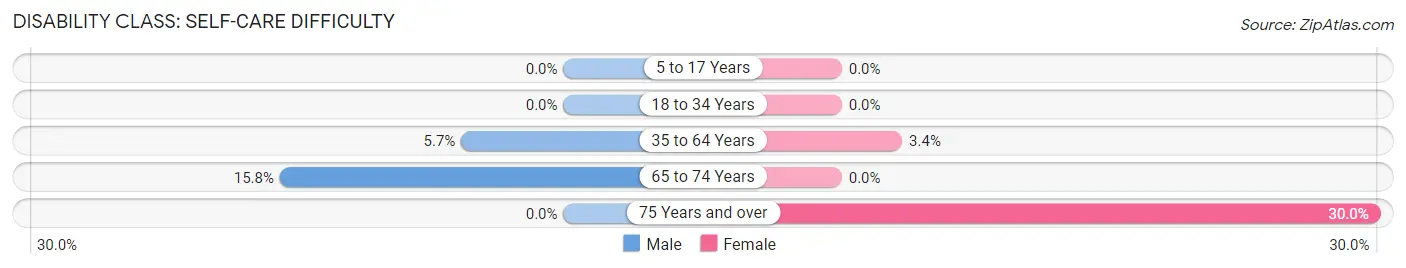
| Age Bracket | Male | Female |
| 5 to 17 Years | 0 (0.0%) | 0 (0.0%) |
| 18 to 34 Years | 0 (0.0%) | 0 (0.0%) |
| 35 to 64 Years | 7 (5.7%) | 4 (3.4%) |
| 65 to 74 Years | 6 (15.8%) | 0 (0.0%) |
| 75 Years and over | 0 (0.0%) | 9 (30.0%) |
Technology Access in Roachdale
Computing Device Access in Roachdale
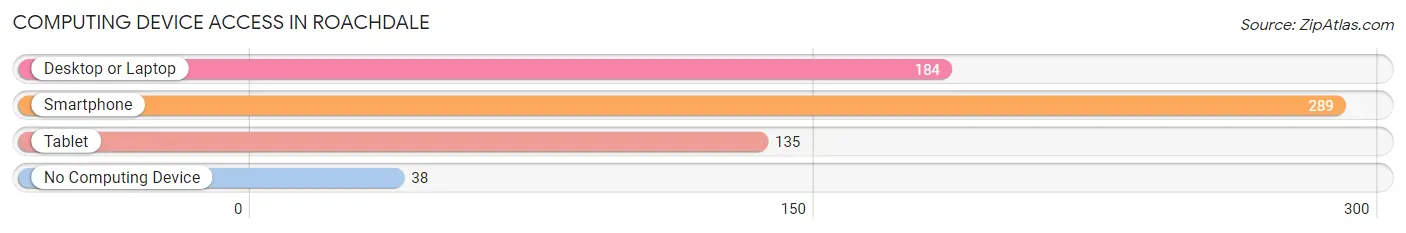
| Device Type | # Households | % Households |
| Desktop or Laptop | 184 | 54.1% |
| Smartphone | 289 | 85.0% |
| Tablet | 135 | 39.7% |
| No Computing Device | 38 | 11.2% |
| Total | 340 | 100.0% |
Internet Access in Roachdale
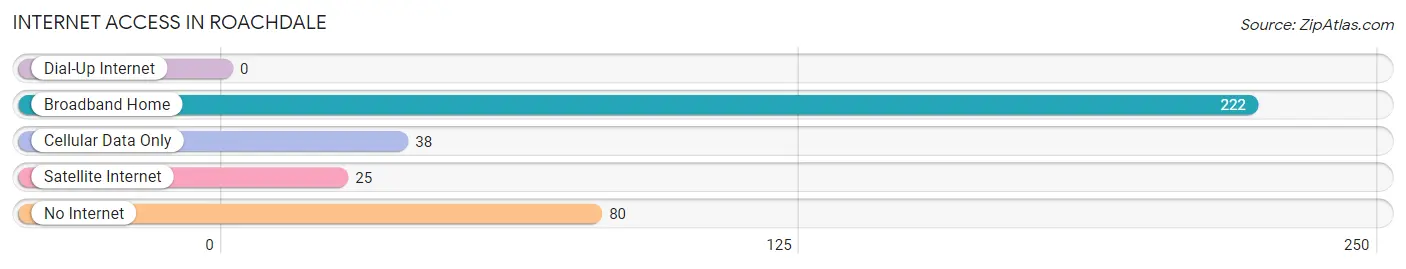
| Internet Type | # Households | % Households |
| Dial-Up Internet | 0 | 0.0% |
| Broadband Home | 222 | 65.3% |
| Cellular Data Only | 38 | 11.2% |
| Satellite Internet | 25 | 7.3% |
| No Internet | 80 | 23.5% |
| Total | 340 | 100.0% |
Roachdale Summary
Roachdale, Indiana is a small town located in Putnam County, Indiana. It is situated in the western part of the state, about 40 miles west of Indianapolis. The town has a population of approximately 1,000 people and is part of the Greater Indianapolis Metropolitan Area.
History
The town of Roachdale was founded in 1837 by William Roach, a local farmer. Roach had purchased the land from the federal government and named the town after himself. The town was incorporated in 1845 and has remained a small, rural community ever since.
The town was originally a farming community, with the main crops being corn, wheat, and oats. In the late 19th century, the town began to diversify its economy with the addition of a sawmill, a grist mill, and a brickyard. The town also had a few small businesses, such as a general store and a blacksmith shop.
In the early 20th century, the town began to experience a period of growth. The population increased from around 500 in 1900 to over 1,000 by the 1950s. This growth was due in part to the construction of a railroad line that ran through the town. The railroad allowed for the transportation of goods and people to and from the town, which helped to spur economic growth.
Geography
Roachdale is located in the western part of Putnam County, Indiana. It is situated in the Wabash Valley, which is part of the larger Midwest region. The town is located on the banks of the Wabash River, which provides a natural border between Indiana and Illinois.
The town is surrounded by rolling hills and farmland. The terrain is mostly flat, with some areas of higher elevation. The climate is humid continental, with hot summers and cold winters.
Economy
The economy of Roachdale is largely based on agriculture. The town is home to several farms, which produce corn, wheat, oats, and other crops. The town also has a few small businesses, such as a general store and a blacksmith shop.
The town is also home to a few manufacturing companies, such as a furniture factory and a plastics factory. These companies provide employment opportunities for the local population.
Demographics
As of the 2010 census, the population of Roachdale was 1,039. The racial makeup of the town was 97.3% White, 0.7% African American, 0.3% Native American, 0.2% Asian, and 1.5% from other races. The median household income was $41,250, and the median family income was $50,000.
The town is home to a variety of religious denominations, including Baptist, Methodist, and Catholic. The town also has a few churches, including the Roachdale United Methodist Church and the Roachdale Baptist Church.
Roachdale is a small, rural town with a rich history and a diverse population. The town has a strong agricultural base and is home to a few small businesses. The town is also home to a variety of religious denominations and churches. The town is a great place to live and work, and is a great example of small-town America.
Common Questions
What is the Total Population of Roachdale?
Total Population of Roachdale is 786.
What is the Total Male Population of Roachdale?
Total Male Population of Roachdale is 402.
What is the Total Female Population of Roachdale?
Total Female Population of Roachdale is 384.
What is the Ratio of Males per 100 Females in Roachdale?
There are 104.69 Males per 100 Females in Roachdale.
What is the Ratio of Females per 100 Males in Roachdale?
There are 95.52 Females per 100 Males in Roachdale.
What is the Median Population Age in Roachdale?
Median Population Age in Roachdale is 32.9 Years.
What is the Average Family Size in Roachdale
Average Family Size in Roachdale is 2.7 People.
What is the Average Household Size in Roachdale
Average Household Size in Roachdale is 2.3 People.
What is Per Capita Income in Roachdale?
Per Capita income in Roachdale is $26,313.
What is the Median Family Income in Roachdale?
Median Family Income in Roachdale is $63,640.
What is the Median Household income in Roachdale?
Median Household Income in Roachdale is $63,088.
What is Income or Wage Gap in Roachdale?
Income or Wage Gap in Roachdale is 69.2%.
Women in Roachdale earn 30.8 cents for every dollar earned by a man.
What is Inequality or Gini Index in Roachdale?
Inequality or Gini Index in Roachdale is 0.33.
How Large is the Labor Force in Roachdale?
There are 351 People in the Labor Forcein in Roachdale.
What is the Percentage of People in the Labor Force in Roachdale?
59.3% of People are in the Labor Force in Roachdale.
What is the Unemployment Rate in Roachdale?
Unemployment Rate in Roachdale is 2.0%.