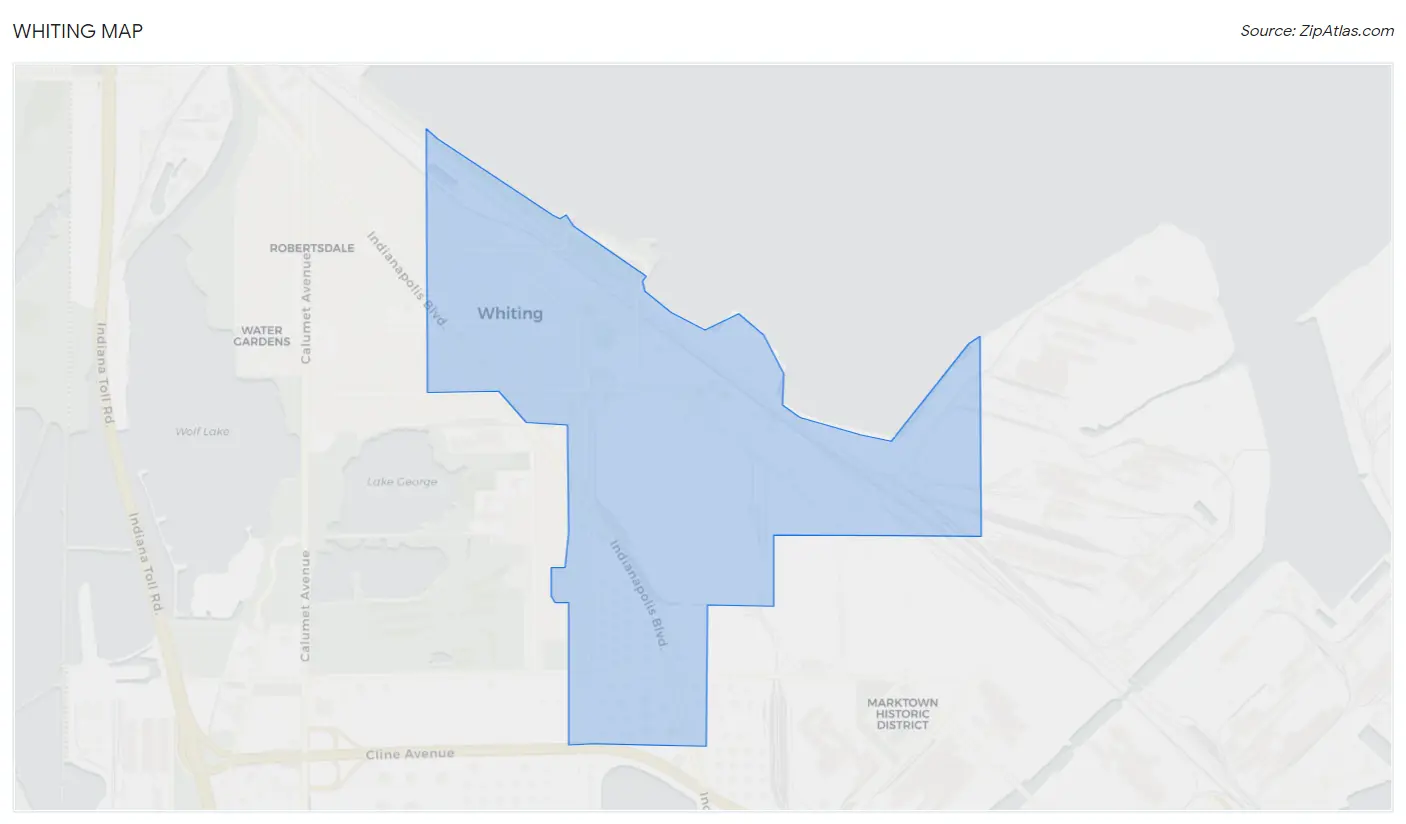
Whiting, IN
Whiting Map
Whiting Overview
4,574
TOTAL POPULATION
2,135
MALE POPULATION
2,439
FEMALE POPULATION
87.54
MALES / 100 FEMALES
114.24
FEMALES / 100 MALES
34.6
MEDIAN AGE
3.4
AVG FAMILY SIZE
2.9
AVG HOUSEHOLD SIZE
$29,836
PER CAPITA INCOME
$72,422
AVG FAMILY INCOME
$59,740
AVG HOUSEHOLD INCOME
36.9%
WAGE / INCOME GAP [ % ]
63.1¢/ $1
WAGE / INCOME GAP [ $ ]
0.47
INEQUALITY / GINI INDEX
2,046
LABOR FORCE [ PEOPLE ]
58.3%
PERCENT IN LABOR FORCE
8.9%
UNEMPLOYMENT RATE
Whiting Zip Codes
Whiting Area Codes
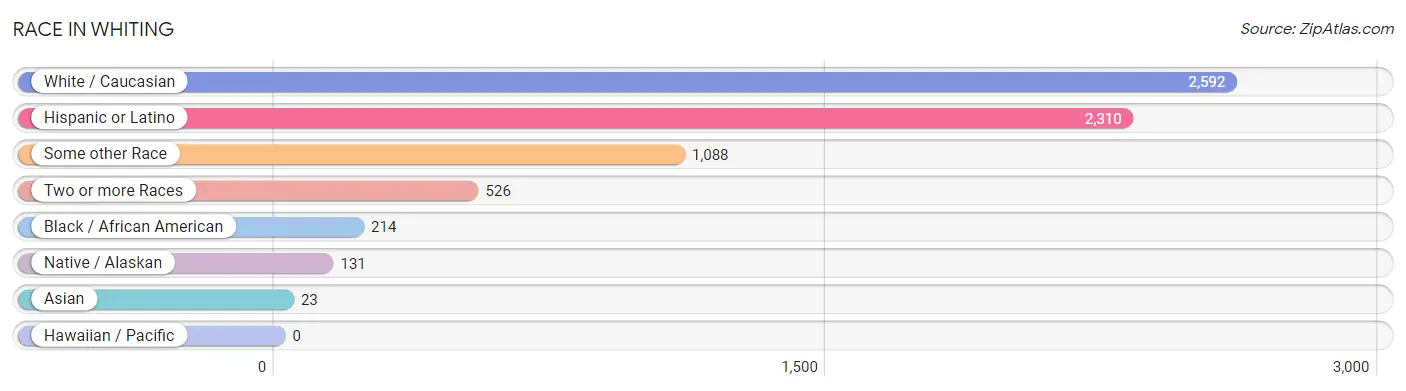
Race in Whiting
The most populous races in Whiting are White / Caucasian (2,592 | 56.7%), Hispanic or Latino (2,310 | 50.5%), and Some other Race (1,088 | 23.8%).
| Race | # Population | % Population |
| Asian | 23 | 0.5% |
| Black / African American | 214 | 4.7% |
| Hawaiian / Pacific | 0 | 0.0% |
| Hispanic or Latino | 2,310 | 50.5% |
| Native / Alaskan | 131 | 2.9% |
| White / Caucasian | 2,592 | 56.7% |
| Two or more Races | 526 | 11.5% |
| Some other Race | 1,088 | 23.8% |
| Total | 4,574 | 100.0% |
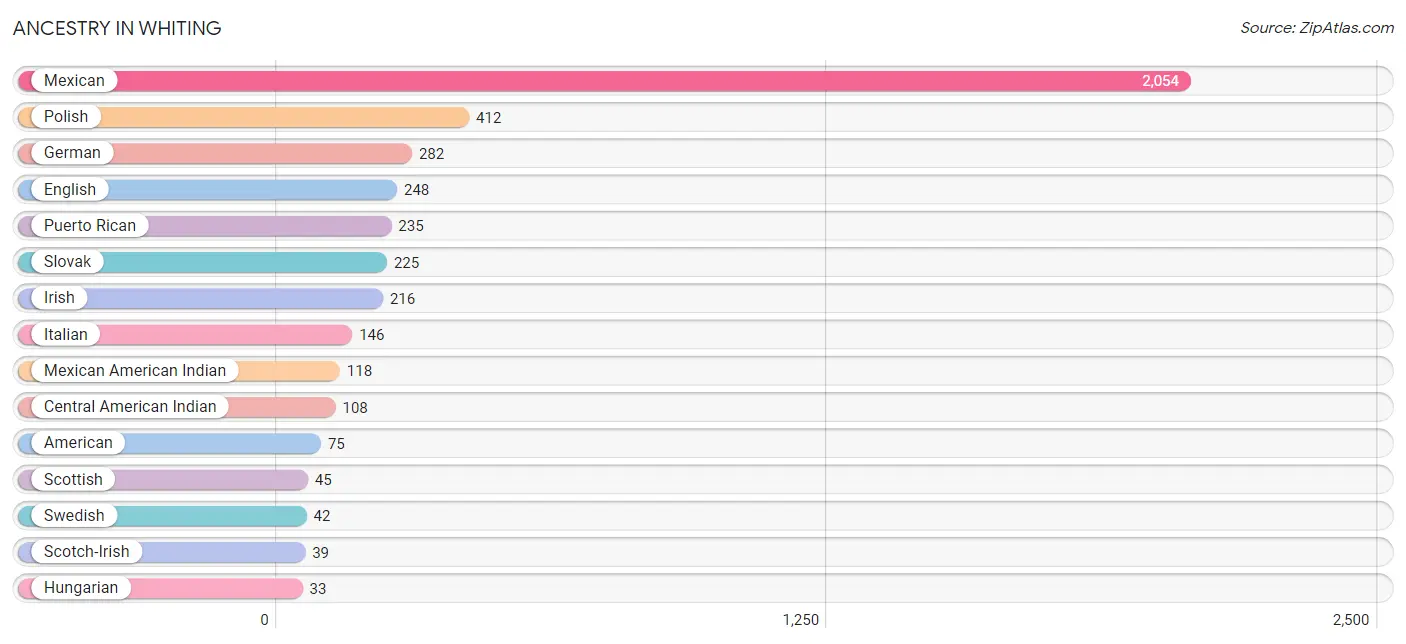
Ancestry in Whiting
The most populous ancestries reported in Whiting are Mexican (2,054 | 44.9%), Polish (412 | 9.0%), German (282 | 6.2%), English (248 | 5.4%), and Puerto Rican (235 | 5.1%), together accounting for 70.7% of all Whiting residents.
| Ancestry | # Population | % Population |
| African | 8 | 0.2% |
| American | 75 | 1.6% |
| Austrian | 11 | 0.2% |
| Bulgarian | 9 | 0.2% |
| Central American | 8 | 0.2% |
| Central American Indian | 108 | 2.4% |
| Colombian | 11 | 0.2% |
| Croatian | 18 | 0.4% |
| Czech | 11 | 0.2% |
| Danish | 7 | 0.2% |
| Dutch | 17 | 0.4% |
| English | 248 | 5.4% |
| European | 14 | 0.3% |
| French | 16 | 0.4% |
| German | 282 | 6.2% |
| Guatemalan | 8 | 0.2% |
| Hungarian | 33 | 0.7% |
| Irish | 216 | 4.7% |
| Italian | 146 | 3.2% |
| Japanese | 23 | 0.5% |
| Lithuanian | 14 | 0.3% |
| Mexican | 2,054 | 44.9% |
| Mexican American Indian | 118 | 2.6% |
| Navajo | 23 | 0.5% |
| Polish | 412 | 9.0% |
| Puerto Rican | 235 | 5.1% |
| Romanian | 9 | 0.2% |
| Russian | 9 | 0.2% |
| Scotch-Irish | 39 | 0.9% |
| Scottish | 45 | 1.0% |
| Slovak | 225 | 4.9% |
| South American | 11 | 0.2% |
| Subsaharan African | 8 | 0.2% |
| Swedish | 42 | 0.9% |
| Thai | 17 | 0.4% |
| West Indian | 18 | 0.4% | View All 36 Rows |
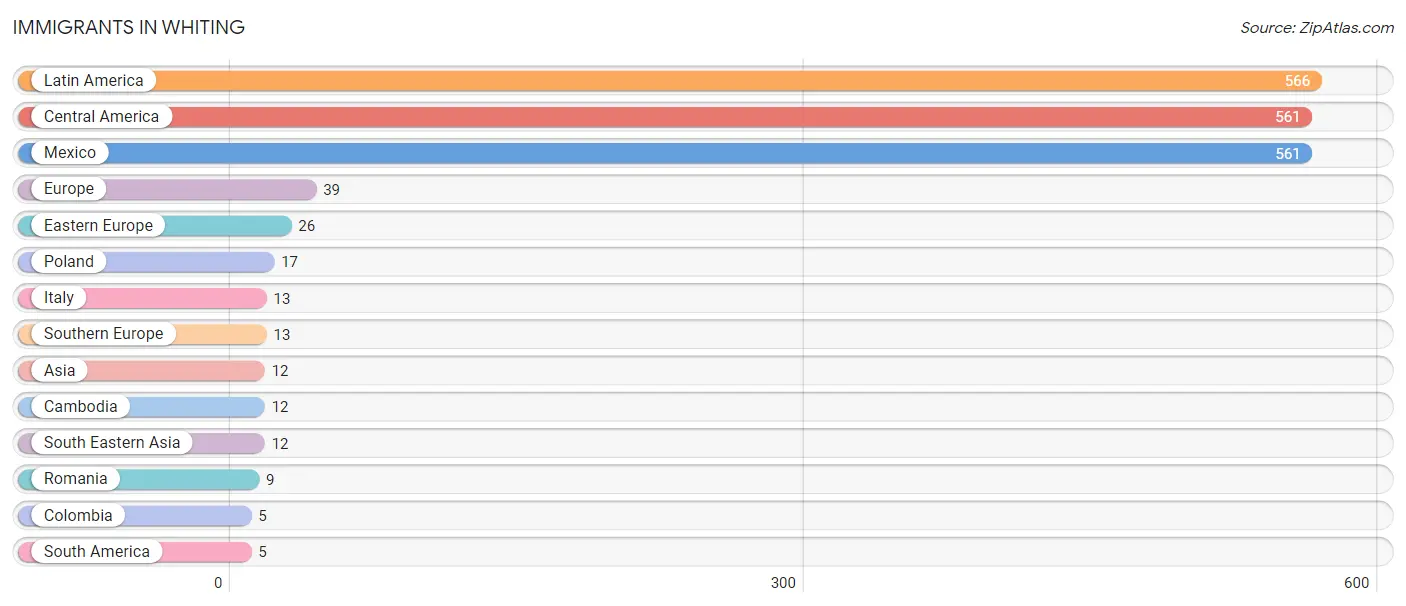
Immigrants in Whiting
The most numerous immigrant groups reported in Whiting came from Latin America (566 | 12.4%), Central America (561 | 12.3%), Mexico (561 | 12.3%), Europe (39 | 0.9%), and Eastern Europe (26 | 0.6%), together accounting for 38.3% of all Whiting residents.
| Immigration Origin | # Population | % Population |
| Asia | 12 | 0.3% |
| Cambodia | 12 | 0.3% |
| Central America | 561 | 12.3% |
| Colombia | 5 | 0.1% |
| Eastern Europe | 26 | 0.6% |
| Europe | 39 | 0.9% |
| Italy | 13 | 0.3% |
| Latin America | 566 | 12.4% |
| Mexico | 561 | 12.3% |
| Poland | 17 | 0.4% |
| Romania | 9 | 0.2% |
| South America | 5 | 0.1% |
| South Eastern Asia | 12 | 0.3% |
| Southern Europe | 13 | 0.3% | View All 14 Rows |
Sex and Age in Whiting
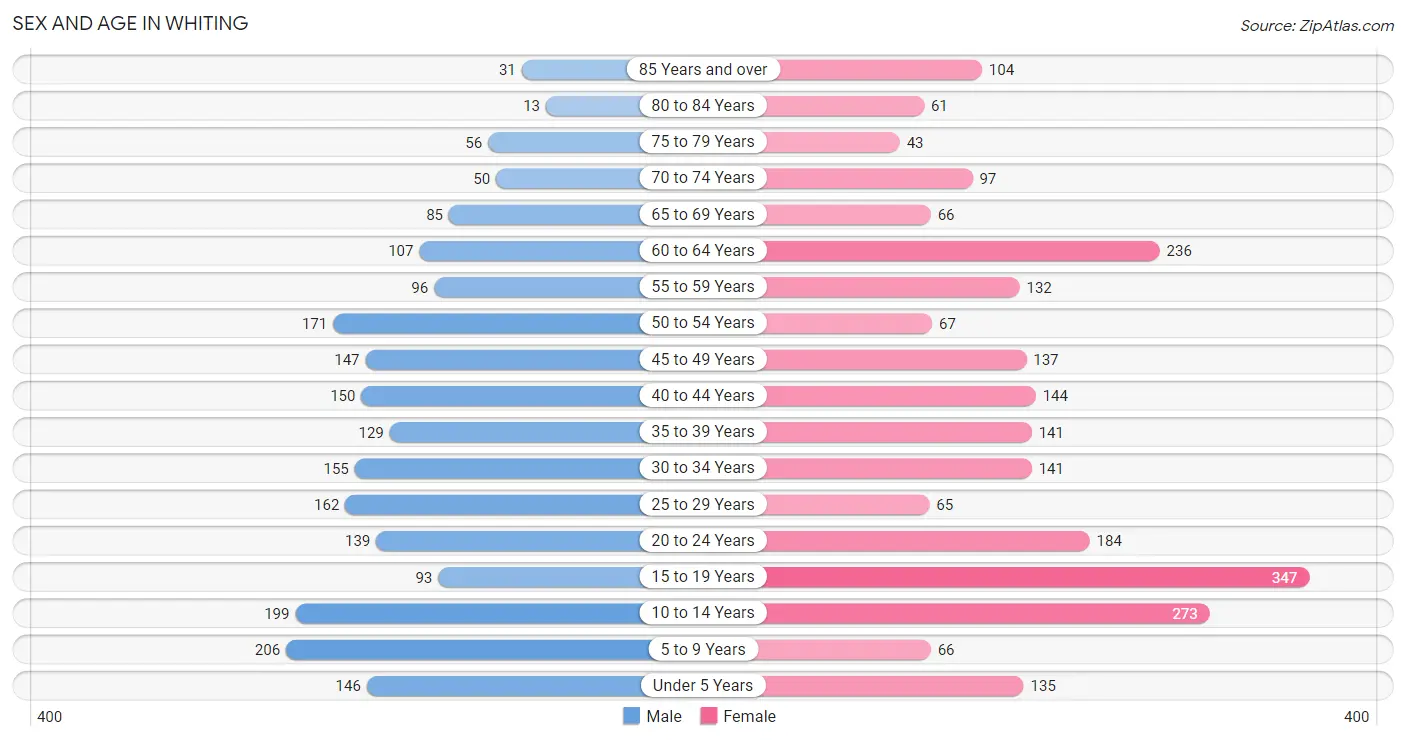
Sex and Age in Whiting
The most populous age groups in Whiting are 5 to 9 Years (206 | 9.7%) for men and 15 to 19 Years (347 | 14.2%) for women.
| Age Bracket | Male | Female |
| Under 5 Years | 146 (6.8%) | 135 (5.5%) |
| 5 to 9 Years | 206 (9.7%) | 66 (2.7%) |
| 10 to 14 Years | 199 (9.3%) | 273 (11.2%) |
| 15 to 19 Years | 93 (4.4%) | 347 (14.2%) |
| 20 to 24 Years | 139 (6.5%) | 184 (7.5%) |
| 25 to 29 Years | 162 (7.6%) | 65 (2.7%) |
| 30 to 34 Years | 155 (7.3%) | 141 (5.8%) |
| 35 to 39 Years | 129 (6.0%) | 141 (5.8%) |
| 40 to 44 Years | 150 (7.0%) | 144 (5.9%) |
| 45 to 49 Years | 147 (6.9%) | 137 (5.6%) |
| 50 to 54 Years | 171 (8.0%) | 67 (2.8%) |
| 55 to 59 Years | 96 (4.5%) | 132 (5.4%) |
| 60 to 64 Years | 107 (5.0%) | 236 (9.7%) |
| 65 to 69 Years | 85 (4.0%) | 66 (2.7%) |
| 70 to 74 Years | 50 (2.3%) | 97 (4.0%) |
| 75 to 79 Years | 56 (2.6%) | 43 (1.8%) |
| 80 to 84 Years | 13 (0.6%) | 61 (2.5%) |
| 85 Years and over | 31 (1.5%) | 104 (4.3%) |
| Total | 2,135 (100.0%) | 2,439 (100.0%) |
Families and Households in Whiting
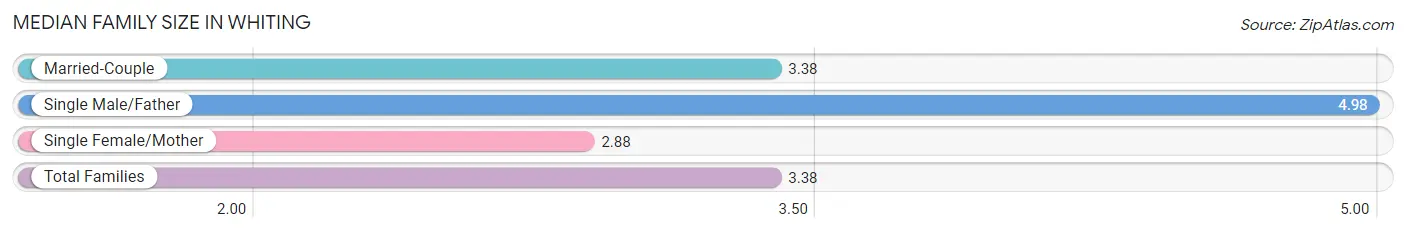
Median Family Size in Whiting
The median family size in Whiting is 3.38 persons per family, with single male/father families (100 | 9.3%) accounting for the largest median family size of 4.98 persons per family. On the other hand, single female/mother families (321 | 29.9%) represent the smallest median family size with 2.88 persons per family.
| Family Type | # Families | Family Size |
| Married-Couple | 654 (60.8%) | 3.38 |
| Single Male/Father | 100 (9.3%) | 4.98 |
| Single Female/Mother | 321 (29.9%) | 2.88 |
| Total Families | 1,075 (100.0%) | 3.38 |
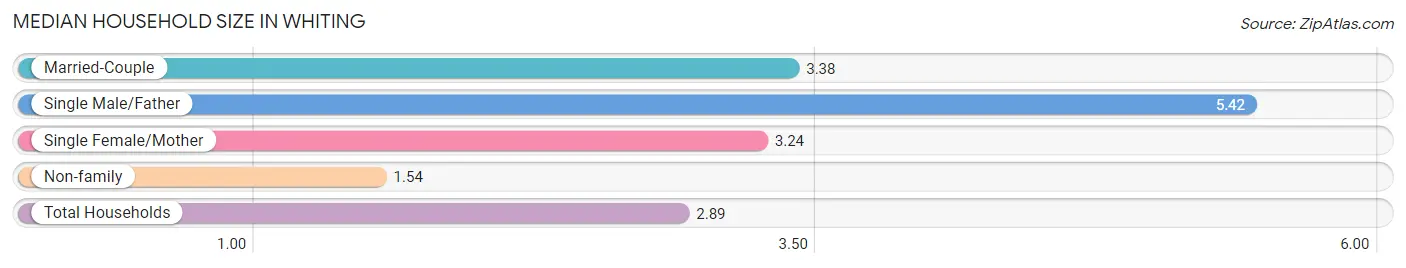
Median Household Size in Whiting
The median household size in Whiting is 2.89 persons per household, with single male/father households (100 | 6.3%) accounting for the largest median household size of 5.42 persons per household. non-family households (505 | 32.0%) represent the smallest median household size with 1.54 persons per household.
| Household Type | # Households | Household Size |
| Married-Couple | 654 (41.4%) | 3.38 |
| Single Male/Father | 100 (6.3%) | 5.42 |
| Single Female/Mother | 321 (20.3%) | 3.24 |
| Non-family | 505 (32.0%) | 1.54 |
| Total Households | 1,580 (100.0%) | 2.89 |
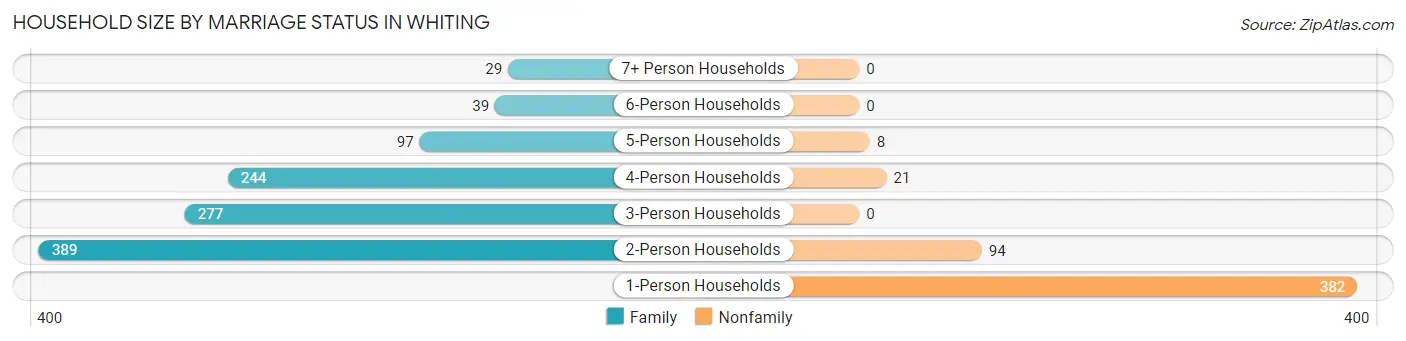
Household Size by Marriage Status in Whiting
Out of a total of 1,580 households in Whiting, 1,075 (68.0%) are family households, while 505 (32.0%) are nonfamily households. The most numerous type of family households are 2-person households, comprising 389, and the most common type of nonfamily households are 1-person households, comprising 382.
| Household Size | Family Households | Nonfamily Households |
| 1-Person Households | - | 382 (24.2%) |
| 2-Person Households | 389 (24.6%) | 94 (5.9%) |
| 3-Person Households | 277 (17.5%) | 0 (0.0%) |
| 4-Person Households | 244 (15.4%) | 21 (1.3%) |
| 5-Person Households | 97 (6.1%) | 8 (0.5%) |
| 6-Person Households | 39 (2.5%) | 0 (0.0%) |
| 7+ Person Households | 29 (1.8%) | 0 (0.0%) |
| Total | 1,075 (68.0%) | 505 (32.0%) |
Female Fertility in Whiting
Fertility by Age in Whiting
Average fertility rate in Whiting is 43.0 births per 1,000 women. Women in the age bracket of 20 to 34 years have the highest fertility rate with 105.0 births per 1,000 women. Women in the age bracket of 20 to 34 years acount for 82.0% of all women with births.
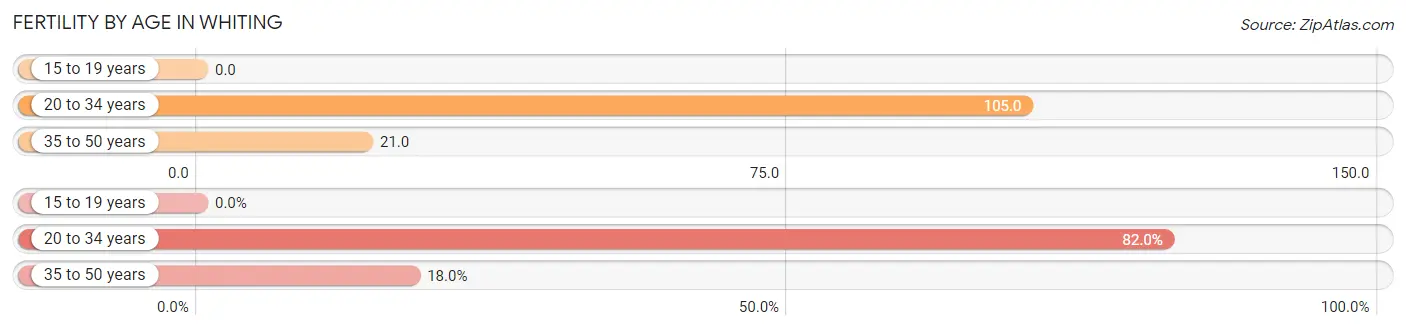
| Age Bracket | Women with Births | Births / 1,000 Women |
| 15 to 19 years | 0 (0.0%) | 0.0 |
| 20 to 34 years | 41 (82.0%) | 105.0 |
| 35 to 50 years | 9 (18.0%) | 21.0 |
| Total | 50 (100.0%) | 43.0 |
Fertility by Age by Marriage Status in Whiting
70.0% of women with births (50) in Whiting are married. The highest percentage of unmarried women with births falls into 20 to 34 years age bracket with 36.6% of them unmarried at the time of birth, while the lowest percentage of unmarried women with births belong to 35 to 50 years age bracket with 0.0% of them unmarried.
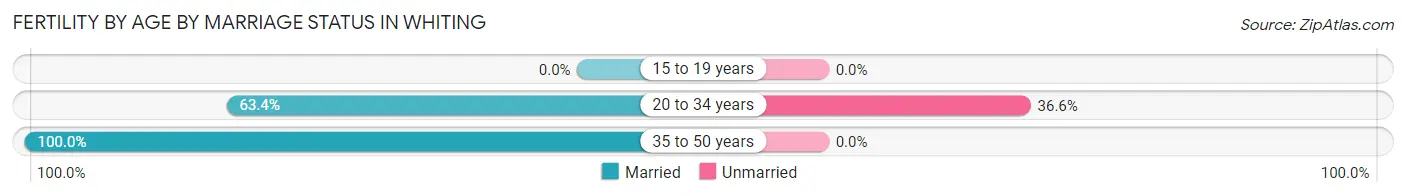
| Age Bracket | Married | Unmarried |
| 15 to 19 years | 0 (0.0%) | 0 (0.0%) |
| 20 to 34 years | 26 (63.4%) | 15 (36.6%) |
| 35 to 50 years | 9 (100.0%) | 0 (0.0%) |
| Total | 35 (70.0%) | 15 (30.0%) |
Fertility by Education in Whiting
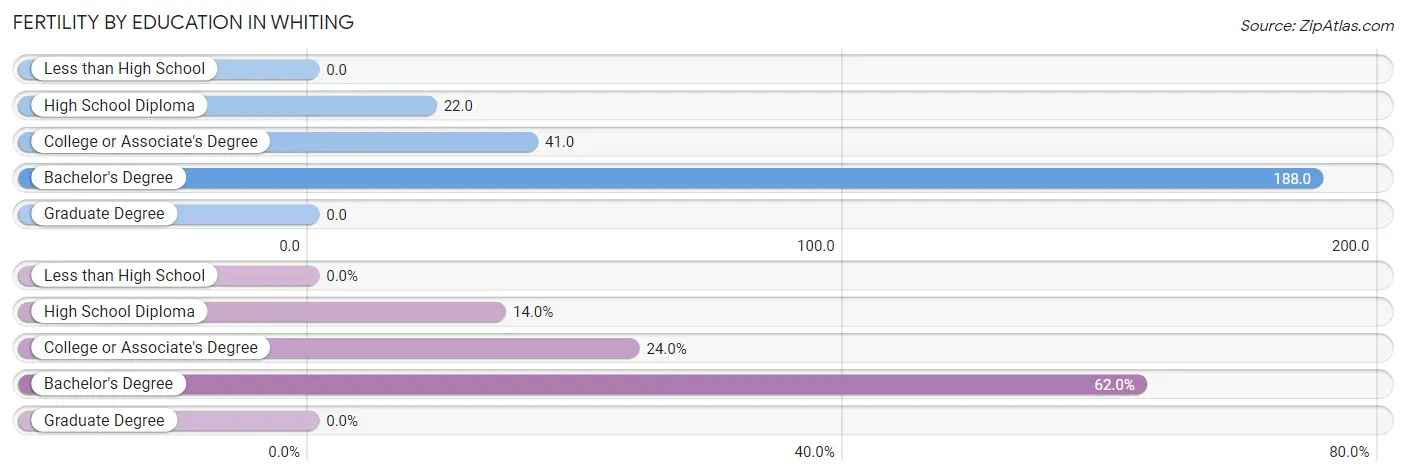
| Educational Attainment | Women with Births | Births / 1,000 Women |
| Less than High School | 0 (0.0%) | 0.0 |
| High School Diploma | 7 (14.0%) | 22.0 |
| College or Associate's Degree | 12 (24.0%) | 41.0 |
| Bachelor's Degree | 31 (62.0%) | 188.0 |
| Graduate Degree | 0 (0.0%) | 0.0 |
| Total | 50 (100.0%) | 43.0 |
Fertility by Education by Marriage Status in Whiting
30.0% of women with births in Whiting are unmarried. Women with the educational attainment of bachelor's degree are most likely to be married with 100.0% of them married at childbirth, while women with the educational attainment of high school diploma are least likely to be married with 100.0% of them unmarried at childbirth.
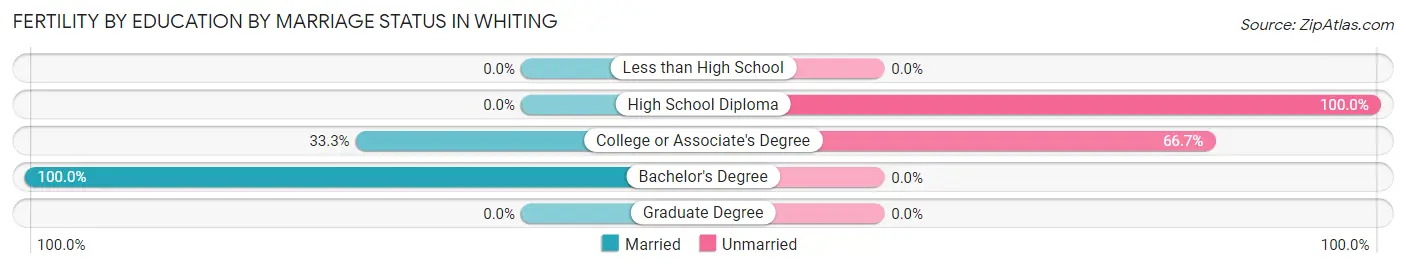
| Educational Attainment | Married | Unmarried |
| Less than High School | 0 (0.0%) | 0 (0.0%) |
| High School Diploma | 0 (0.0%) | 7 (100.0%) |
| College or Associate's Degree | 4 (33.3%) | 8 (66.7%) |
| Bachelor's Degree | 31 (100.0%) | 0 (0.0%) |
| Graduate Degree | 0 (0.0%) | 0 (0.0%) |
| Total | 35 (70.0%) | 15 (30.0%) |
Income in Whiting
Income Overview in Whiting
Per Capita Income in Whiting is $29,836, while median incomes of families and households are $72,422 and $59,740 respectively.
| Characteristic | Number | Measure |
| Per Capita Income | 4,574 | $29,836 |
| Median Family Income | 1,075 | $72,422 |
| Mean Family Income | 1,075 | $88,478 |
| Median Household Income | 1,580 | $59,740 |
| Mean Household Income | 1,580 | $82,082 |
| Income Deficit | 1,075 | $0 |
| Wage / Income Gap (%) | 4,574 | 36.91% |
| Wage / Income Gap ($) | 4,574 | 63.09¢ per $1 |
| Gini / Inequality Index | 4,574 | 0.47 |
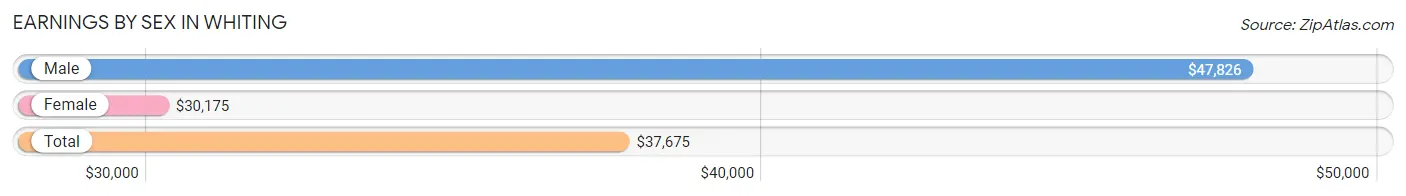
Earnings by Sex in Whiting
Average Earnings in Whiting are $37,675, $47,826 for men and $30,175 for women, a difference of 36.9%.
| Sex | Number | Average Earnings |
| Male | 1,046 (49.2%) | $47,826 |
| Female | 1,080 (50.8%) | $30,175 |
| Total | 2,126 (100.0%) | $37,675 |
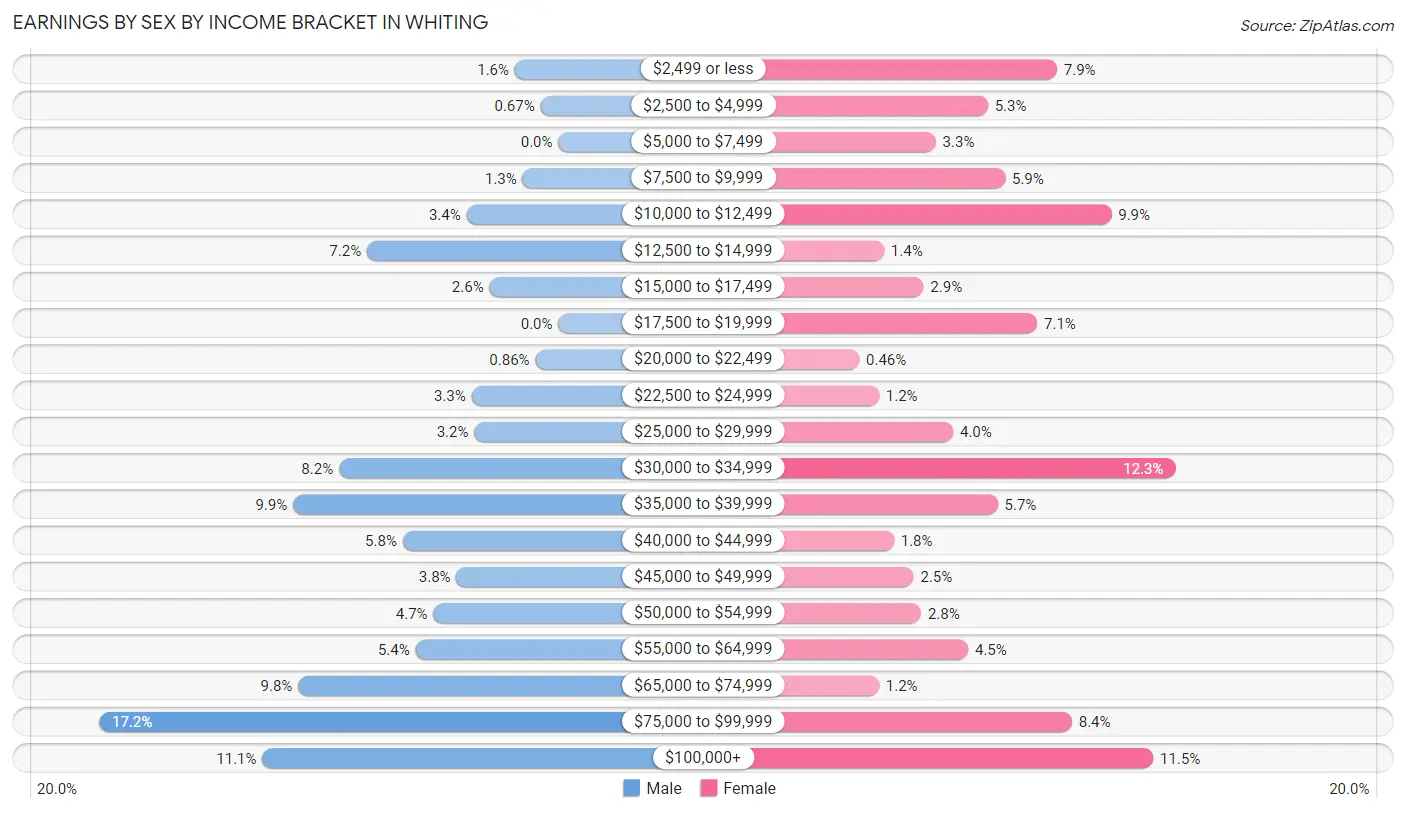
Earnings by Sex by Income Bracket in Whiting
The most common earnings brackets in Whiting are $75,000 to $99,999 for men (180 | 17.2%) and $30,000 to $34,999 for women (133 | 12.3%).
| Income | Male | Female |
| $2,499 or less | 17 (1.6%) | 85 (7.9%) |
| $2,500 to $4,999 | 7 (0.7%) | 57 (5.3%) |
| $5,000 to $7,499 | 0 (0.0%) | 36 (3.3%) |
| $7,500 to $9,999 | 14 (1.3%) | 64 (5.9%) |
| $10,000 to $12,499 | 36 (3.4%) | 107 (9.9%) |
| $12,500 to $14,999 | 75 (7.2%) | 15 (1.4%) |
| $15,000 to $17,499 | 27 (2.6%) | 31 (2.9%) |
| $17,500 to $19,999 | 0 (0.0%) | 77 (7.1%) |
| $20,000 to $22,499 | 9 (0.9%) | 5 (0.5%) |
| $22,500 to $24,999 | 34 (3.3%) | 13 (1.2%) |
| $25,000 to $29,999 | 33 (3.2%) | 43 (4.0%) |
| $30,000 to $34,999 | 86 (8.2%) | 133 (12.3%) |
| $35,000 to $39,999 | 104 (9.9%) | 61 (5.7%) |
| $40,000 to $44,999 | 61 (5.8%) | 19 (1.8%) |
| $45,000 to $49,999 | 40 (3.8%) | 27 (2.5%) |
| $50,000 to $54,999 | 49 (4.7%) | 30 (2.8%) |
| $55,000 to $64,999 | 56 (5.3%) | 49 (4.5%) |
| $65,000 to $74,999 | 102 (9.8%) | 13 (1.2%) |
| $75,000 to $99,999 | 180 (17.2%) | 91 (8.4%) |
| $100,000+ | 116 (11.1%) | 124 (11.5%) |
| Total | 1,046 (100.0%) | 1,080 (100.0%) |
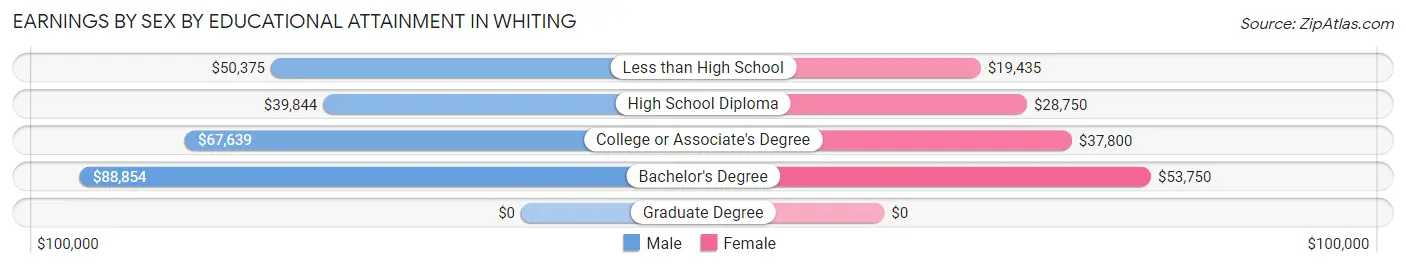
Earnings by Sex by Educational Attainment in Whiting
Average earnings in Whiting are $51,173 for men and $31,891 for women, a difference of 37.7%. Men with an educational attainment of bachelor's degree enjoy the highest average annual earnings of $88,854, while those with high school diploma education earn the least with $39,844. Women with an educational attainment of bachelor's degree earn the most with the average annual earnings of $53,750, while those with less than high school education have the smallest earnings of $19,435.
| Educational Attainment | Male Income | Female Income |
| Less than High School | $50,375 | $19,435 |
| High School Diploma | $39,844 | $28,750 |
| College or Associate's Degree | $67,639 | $37,800 |
| Bachelor's Degree | $88,854 | $53,750 |
| Graduate Degree | - | - |
| Total | $51,173 | $31,891 |
Family Income in Whiting
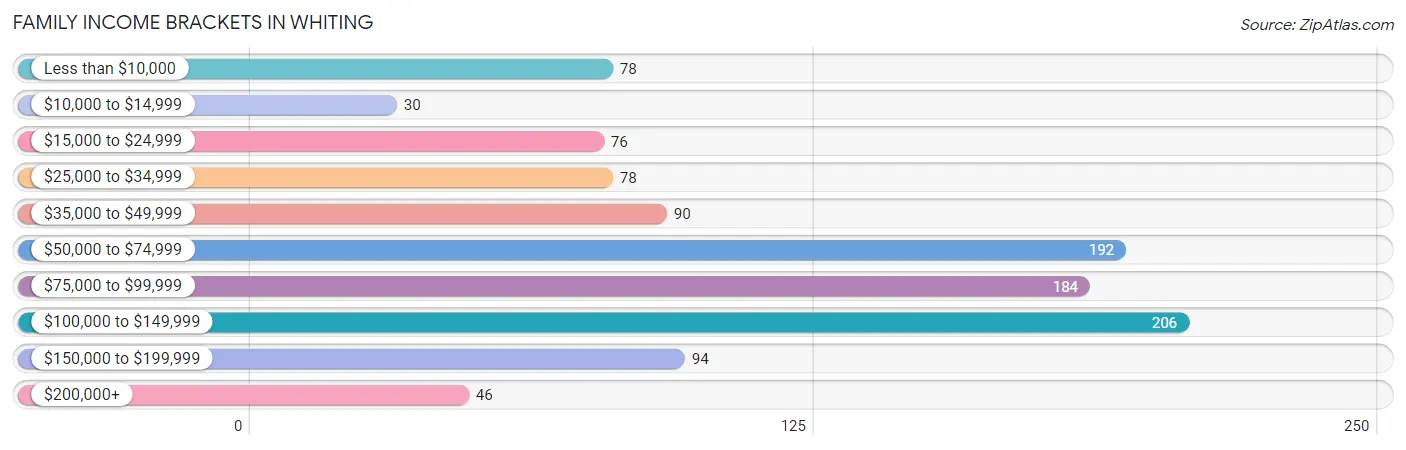
Family Income Brackets in Whiting
According to the Whiting family income data, there are 206 families falling into the $100,000 to $149,999 income range, which is the most common income bracket and makes up 19.2% of all families. Conversely, the $10,000 to $14,999 income bracket is the least frequent group with only 30 families (2.8%) belonging to this category.
| Income Bracket | # Families | % Families |
| Less than $10,000 | 78 | 7.3% |
| $10,000 to $14,999 | 30 | 2.8% |
| $15,000 to $24,999 | 76 | 7.1% |
| $25,000 to $34,999 | 78 | 7.3% |
| $35,000 to $49,999 | 90 | 8.4% |
| $50,000 to $74,999 | 192 | 17.9% |
| $75,000 to $99,999 | 184 | 17.1% |
| $100,000 to $149,999 | 206 | 19.2% |
| $150,000 to $199,999 | 94 | 8.7% |
| $200,000+ | 46 | 4.3% |
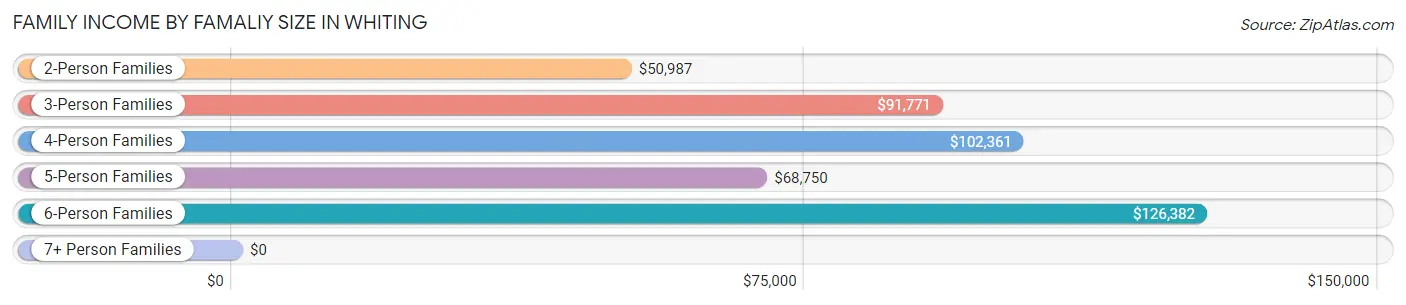
Family Income by Famaliy Size in Whiting
6-person families (39 | 3.6%) account for the highest median family income in Whiting with $126,382 per family, while 3-person families (258 | 24.0%) have the highest median income of $30,590 per family member.
| Income Bracket | # Families | Median Income |
| 2-Person Families | 491 (45.7%) | $50,987 |
| 3-Person Families | 258 (24.0%) | $91,771 |
| 4-Person Families | 161 (15.0%) | $102,361 |
| 5-Person Families | 97 (9.0%) | $68,750 |
| 6-Person Families | 39 (3.6%) | $126,382 |
| 7+ Person Families | 29 (2.7%) | $0 |
| Total | 1,075 (100.0%) | $72,422 |
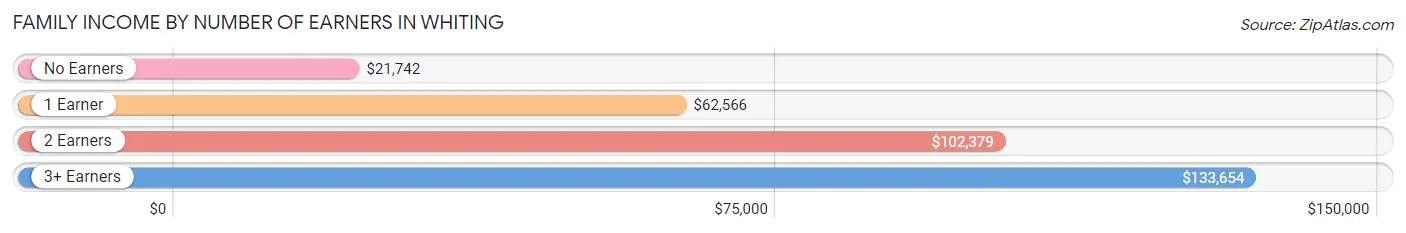
Family Income by Number of Earners in Whiting
The median family income in Whiting is $72,422, with families comprising 3+ earners (68) having the highest median family income of $133,654, while families with no earners (188) have the lowest median family income of $21,742, accounting for 6.3% and 17.5% of families, respectively.
| Number of Earners | # Families | Median Income |
| No Earners | 188 (17.5%) | $21,742 |
| 1 Earner | 426 (39.6%) | $62,566 |
| 2 Earners | 393 (36.6%) | $102,379 |
| 3+ Earners | 68 (6.3%) | $133,654 |
| Total | 1,075 (100.0%) | $72,422 |
Household Income in Whiting
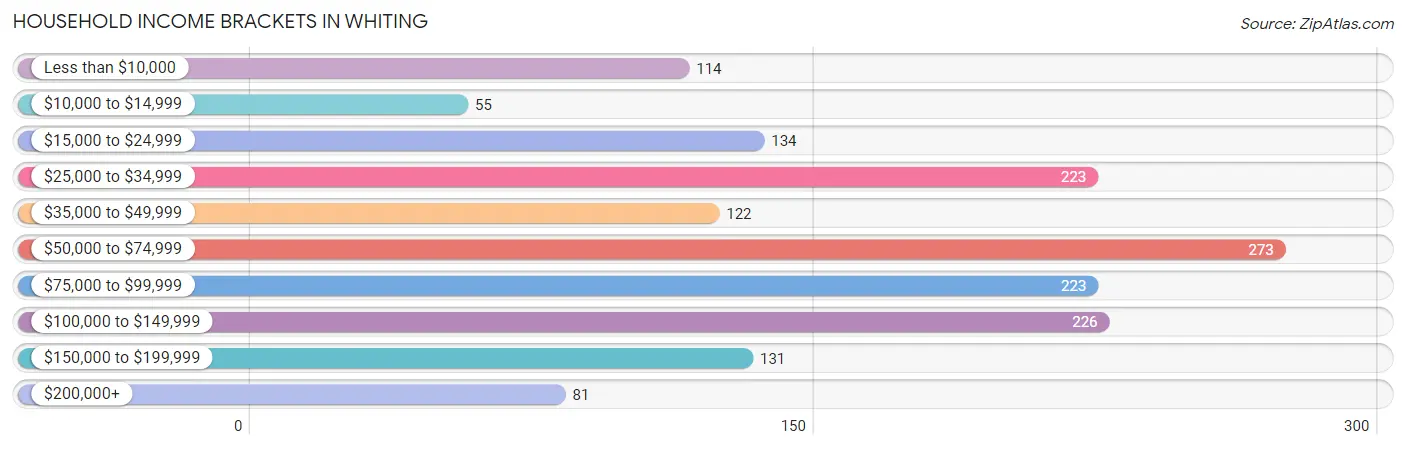
Household Income Brackets in Whiting
With 273 households falling in the category, the $50,000 to $74,999 income range is the most frequent in Whiting, accounting for 17.3% of all households. In contrast, only 55 households (3.5%) fall into the $10,000 to $14,999 income bracket, making it the least populous group.
| Income Bracket | # Households | % Households |
| Less than $10,000 | 114 | 7.2% |
| $10,000 to $14,999 | 55 | 3.5% |
| $15,000 to $24,999 | 134 | 8.5% |
| $25,000 to $34,999 | 223 | 14.1% |
| $35,000 to $49,999 | 122 | 7.7% |
| $50,000 to $74,999 | 273 | 17.3% |
| $75,000 to $99,999 | 223 | 14.1% |
| $100,000 to $149,999 | 226 | 14.3% |
| $150,000 to $199,999 | 131 | 8.3% |
| $200,000+ | 81 | 5.1% |
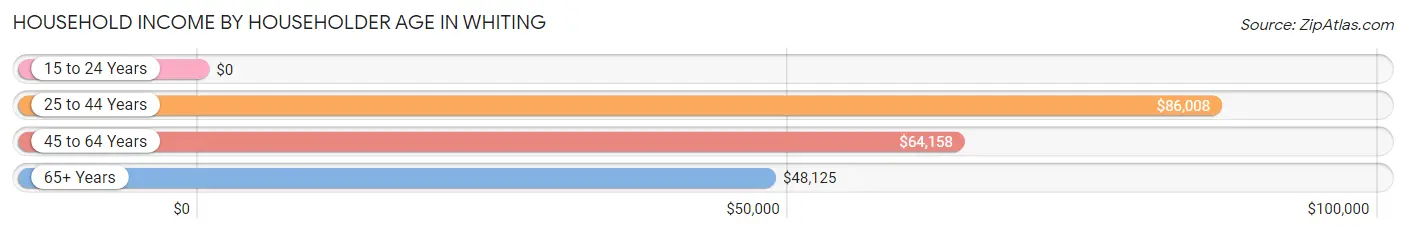
Household Income by Householder Age in Whiting
The median household income in Whiting is $59,740, with the highest median household income of $86,008 found in the 25 to 44 years age bracket for the primary householder. A total of 453 households (28.7%) fall into this category. Meanwhile, the 15 to 24 years age bracket for the primary householder has the lowest median household income of $0, with 127 households (8.0%) in this group.
| Income Bracket | # Households | Median Income |
| 15 to 24 Years | 127 (8.0%) | $0 |
| 25 to 44 Years | 453 (28.7%) | $86,008 |
| 45 to 64 Years | 635 (40.2%) | $64,158 |
| 65+ Years | 365 (23.1%) | $48,125 |
| Total | 1,580 (100.0%) | $59,740 |
Poverty in Whiting
Income Below Poverty by Sex and Age in Whiting
With 9.3% poverty level for males and 24.6% for females among the residents of Whiting, 18 to 24 year old males and 15 year old females are the most vulnerable to poverty, with 46 males (33.1%) and 17 females (100.0%) in their respective age groups living below the poverty level.
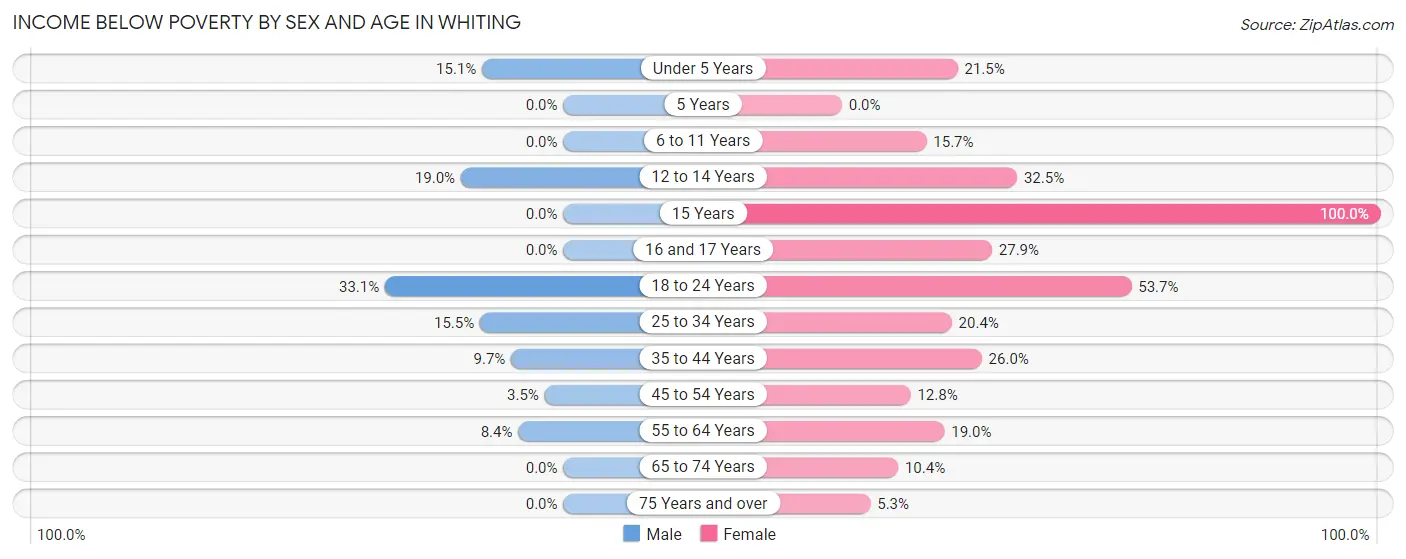
| Age Bracket | Male | Female |
| Under 5 Years | 22 (15.1%) | 29 (21.5%) |
| 5 Years | 0 (0.0%) | 0 (0.0%) |
| 6 to 11 Years | 0 (0.0%) | 19 (15.7%) |
| 12 to 14 Years | 27 (19.0%) | 53 (32.5%) |
| 15 Years | 0 (0.0%) | 17 (100.0%) |
| 16 and 17 Years | 0 (0.0%) | 39 (27.9%) |
| 18 to 24 Years | 46 (33.1%) | 201 (53.7%) |
| 25 to 34 Years | 49 (15.5%) | 42 (20.4%) |
| 35 to 44 Years | 27 (9.7%) | 74 (26.0%) |
| 45 to 54 Years | 11 (3.5%) | 26 (12.8%) |
| 55 to 64 Years | 17 (8.4%) | 70 (19.0%) |
| 65 to 74 Years | 0 (0.0%) | 17 (10.4%) |
| 75 Years and over | 0 (0.0%) | 11 (5.3%) |
| Total | 199 (9.3%) | 598 (24.6%) |
Income Above Poverty by Sex and Age in Whiting
According to the poverty statistics in Whiting, males aged 5 years and females aged 5 years are the age groups that are most secure financially, with 100.0% of males and 100.0% of females in these age groups living above the poverty line.
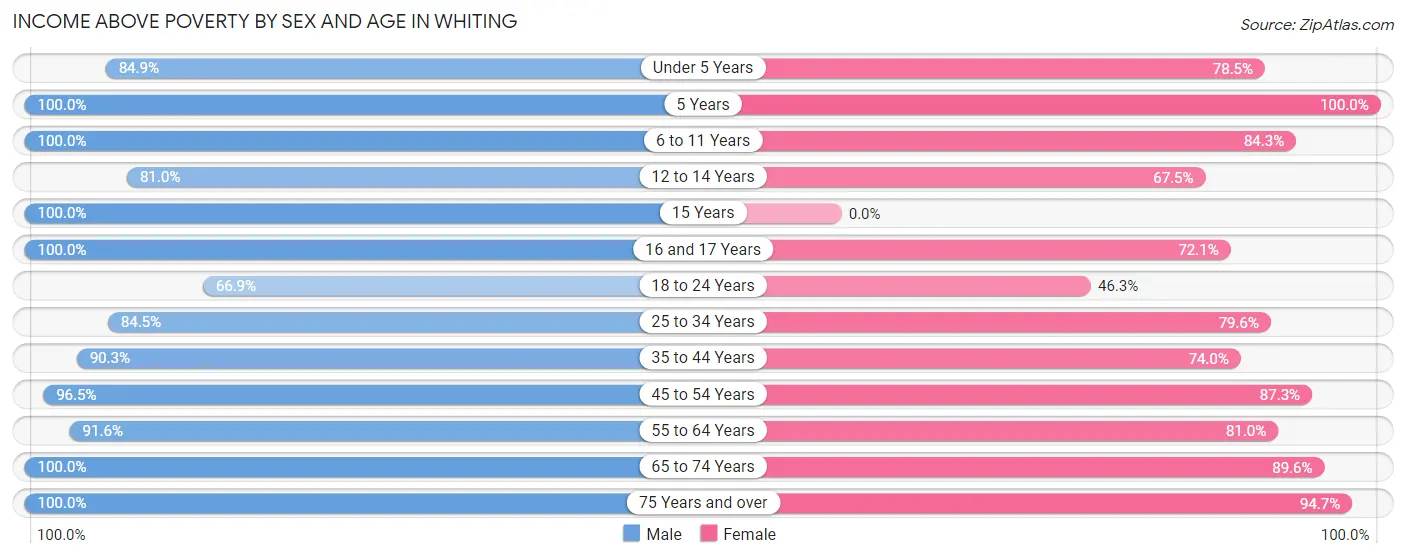
| Age Bracket | Male | Female |
| Under 5 Years | 124 (84.9%) | 106 (78.5%) |
| 5 Years | 75 (100.0%) | 42 (100.0%) |
| 6 to 11 Years | 188 (100.0%) | 102 (84.3%) |
| 12 to 14 Years | 115 (81.0%) | 110 (67.5%) |
| 15 Years | 23 (100.0%) | 0 (0.0%) |
| 16 and 17 Years | 70 (100.0%) | 101 (72.1%) |
| 18 to 24 Years | 93 (66.9%) | 173 (46.3%) |
| 25 to 34 Years | 268 (84.5%) | 164 (79.6%) |
| 35 to 44 Years | 252 (90.3%) | 211 (74.0%) |
| 45 to 54 Years | 307 (96.5%) | 178 (87.3%) |
| 55 to 64 Years | 186 (91.6%) | 298 (81.0%) |
| 65 to 74 Years | 135 (100.0%) | 146 (89.6%) |
| 75 Years and over | 100 (100.0%) | 197 (94.7%) |
| Total | 1,936 (90.7%) | 1,828 (75.3%) |
Income Below Poverty Among Married-Couple Families in Whiting
The poverty statistics for married-couple families in Whiting show that 8.4% or 55 of the total 654 families live below the poverty line. Families with 1 or 2 children have the highest poverty rate of 14.4%, comprising of 38 families. On the other hand, families with 3 or 4 children have the lowest poverty rate of 0.0%, which includes 0 families.
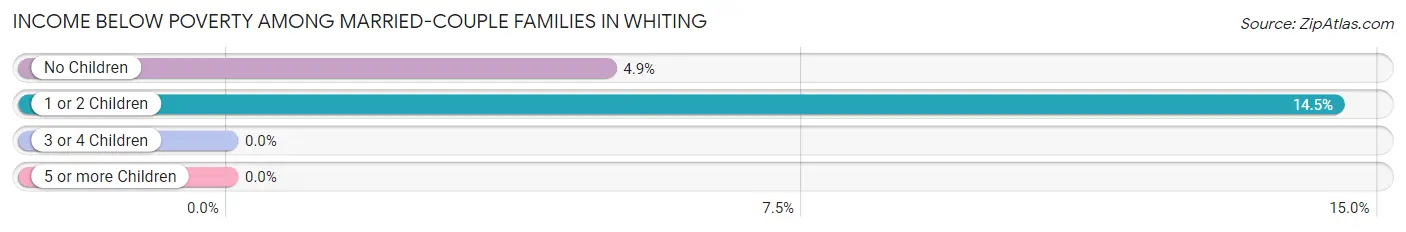
| Children | Above Poverty | Below Poverty |
| No Children | 327 (95.1%) | 17 (4.9%) |
| 1 or 2 Children | 225 (85.6%) | 38 (14.4%) |
| 3 or 4 Children | 47 (100.0%) | 0 (0.0%) |
| 5 or more Children | 0 (0.0%) | 0 (0.0%) |
| Total | 599 (91.6%) | 55 (8.4%) |
Income Below Poverty Among Single-Parent Households in Whiting
According to the poverty data in Whiting, 26.0% or 26 single-father households and 23.4% or 75 single-mother households are living below the poverty line. Among single-father households, those with 1 or 2 children have the highest poverty rate, with 26 households (50.0%) experiencing poverty. Likewise, among single-mother households, those with 1 or 2 children have the highest poverty rate, with 75 households (48.7%) falling below the poverty line.
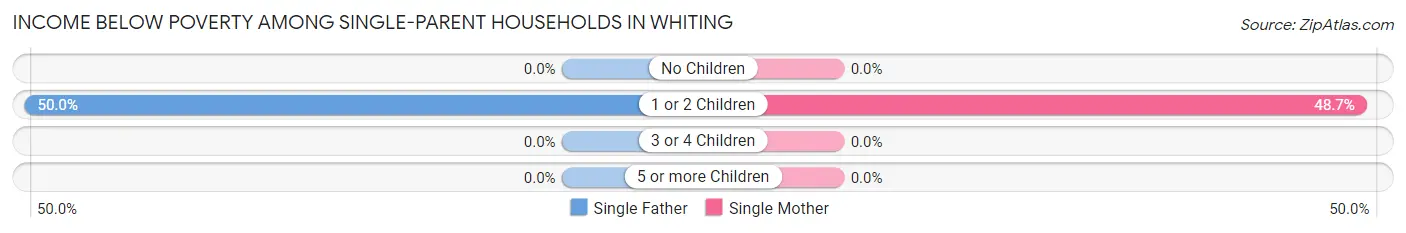
| Children | Single Father | Single Mother |
| No Children | 0 (0.0%) | 0 (0.0%) |
| 1 or 2 Children | 26 (50.0%) | 75 (48.7%) |
| 3 or 4 Children | 0 (0.0%) | 0 (0.0%) |
| 5 or more Children | 0 (0.0%) | 0 (0.0%) |
| Total | 26 (26.0%) | 75 (23.4%) |
Income Below Poverty Among Married-Couple vs Single-Parent Households in Whiting
The poverty data for Whiting shows that 55 of the married-couple family households (8.4%) and 101 of the single-parent households (24.0%) are living below the poverty level. Within the married-couple family households, those with 1 or 2 children have the highest poverty rate, with 38 households (14.4%) falling below the poverty line. Among the single-parent households, those with 1 or 2 children have the highest poverty rate, with 101 household (49.0%) living below poverty.
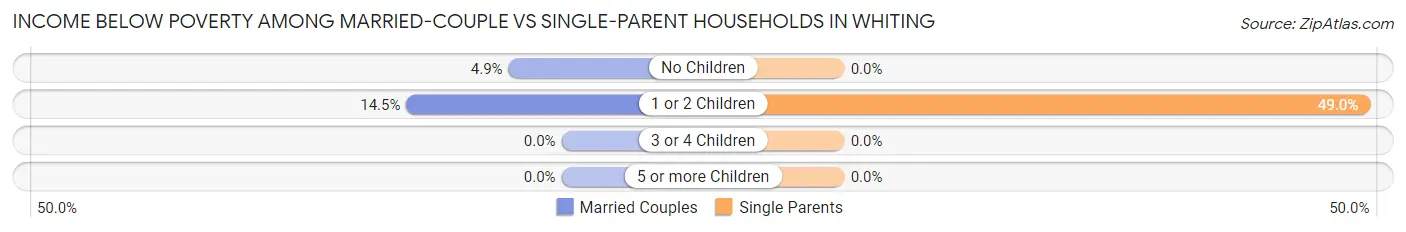
| Children | Married-Couple Families | Single-Parent Households |
| No Children | 17 (4.9%) | 0 (0.0%) |
| 1 or 2 Children | 38 (14.4%) | 101 (49.0%) |
| 3 or 4 Children | 0 (0.0%) | 0 (0.0%) |
| 5 or more Children | 0 (0.0%) | 0 (0.0%) |
| Total | 55 (8.4%) | 101 (24.0%) |
Employment Characteristics in Whiting
Employment by Class of Employer in Whiting
Among the 1,841 employed individuals in Whiting, private company employees (1,365 | 74.1%), not-for-profit organizations (157 | 8.5%), and local government employees (150 | 8.2%) make up the most common classes of employment.
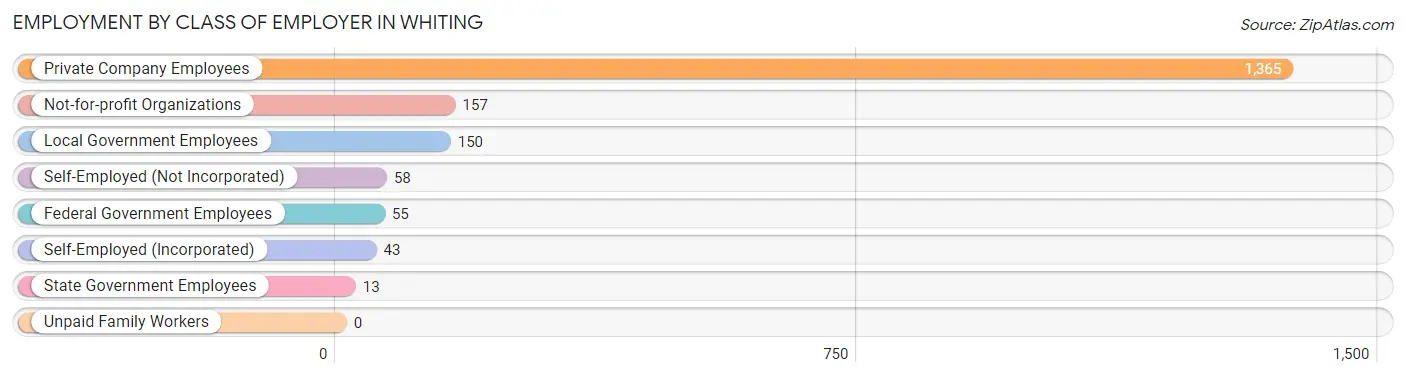
| Employer Class | # Employees | % Employees |
| Private Company Employees | 1,365 | 74.1% |
| Self-Employed (Incorporated) | 43 | 2.3% |
| Self-Employed (Not Incorporated) | 58 | 3.2% |
| Not-for-profit Organizations | 157 | 8.5% |
| Local Government Employees | 150 | 8.2% |
| State Government Employees | 13 | 0.7% |
| Federal Government Employees | 55 | 3.0% |
| Unpaid Family Workers | 0 | 0.0% |
| Total | 1,841 | 100.0% |
Employment Status by Age in Whiting
According to the labor force statistics for Whiting, out of the total population over 16 years of age (3,509), 58.3% or 2,046 individuals are in the labor force, with 8.9% or 182 of them unemployed. The age group with the highest labor force participation rate is 35 to 44 years, with 89.2% or 503 individuals in the labor force. Within the labor force, the 20 to 24 years age range has the highest percentage of unemployed individuals, with 29.5% or 61 of them being unemployed.
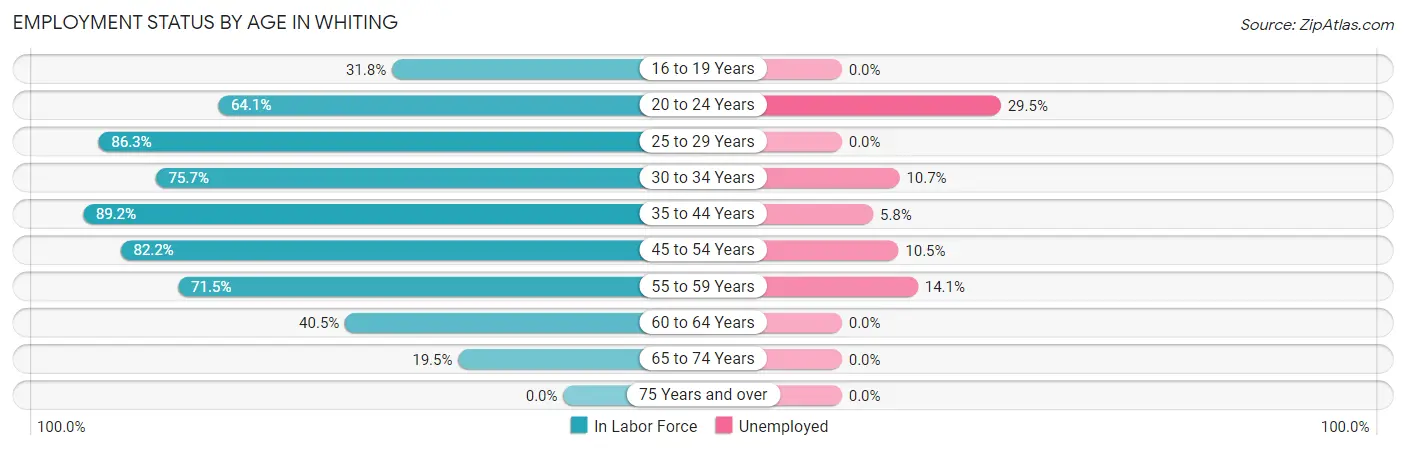
| Age Bracket | In Labor Force | Unemployed |
| 16 to 19 Years | 127 (31.8%) | 0 (0.0%) |
| 20 to 24 Years | 207 (64.1%) | 61 (29.5%) |
| 25 to 29 Years | 196 (86.3%) | 0 (0.0%) |
| 30 to 34 Years | 224 (75.7%) | 24 (10.7%) |
| 35 to 44 Years | 503 (89.2%) | 29 (5.8%) |
| 45 to 54 Years | 429 (82.2%) | 45 (10.5%) |
| 55 to 59 Years | 163 (71.5%) | 23 (14.1%) |
| 60 to 64 Years | 139 (40.5%) | 0 (0.0%) |
| 65 to 74 Years | 58 (19.5%) | 0 (0.0%) |
| 75 Years and over | 0 (0.0%) | 0 (0.0%) |
| Total | 2,046 (58.3%) | 182 (8.9%) |
Employment Status by Educational Attainment in Whiting
According to labor force statistics for Whiting, 75.9% of individuals (1,655) out of the total population between 25 and 64 years of age (2,180) are in the labor force, with 7.3% or 121 of them being unemployed. The group with the highest labor force participation rate are those with the educational attainment of bachelor's degree or higher, with 88.3% or 462 individuals in the labor force. Within the labor force, individuals with high school diploma education have the highest percentage of unemployment, with 10.8% or 62 of them being unemployed.
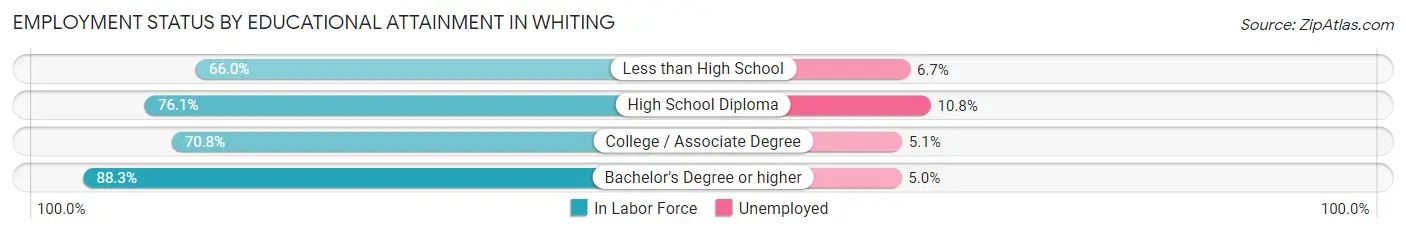
| Educational Attainment | In Labor Force | Unemployed |
| Less than High School | 285 (66.0%) | 29 (6.7%) |
| High School Diploma | 573 (76.1%) | 81 (10.8%) |
| College / Associate Degree | 334 (70.8%) | 24 (5.1%) |
| Bachelor's Degree or higher | 462 (88.3%) | 26 (5.0%) |
| Total | 1,655 (75.9%) | 159 (7.3%) |
Employment Occupations by Sex in Whiting
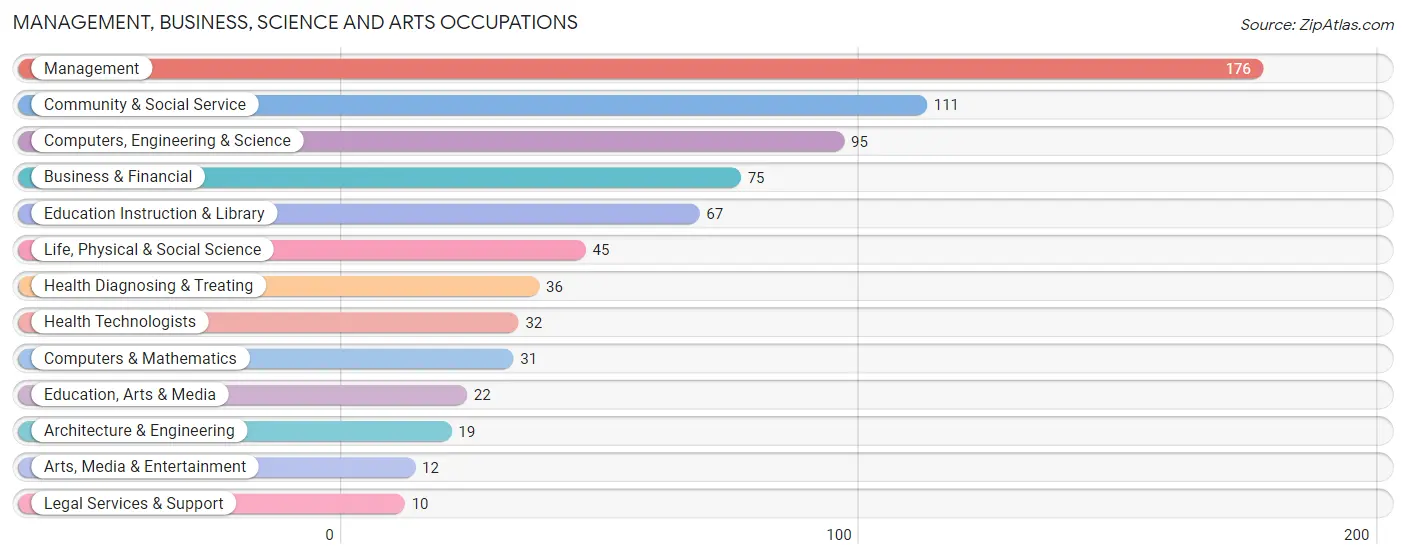
Management, Business, Science and Arts Occupations
The most common Management, Business, Science and Arts occupations in Whiting are Management (176 | 9.4%), Community & Social Service (111 | 5.9%), Computers, Engineering & Science (95 | 5.1%), Business & Financial (75 | 4.0%), and Education Instruction & Library (67 | 3.6%).
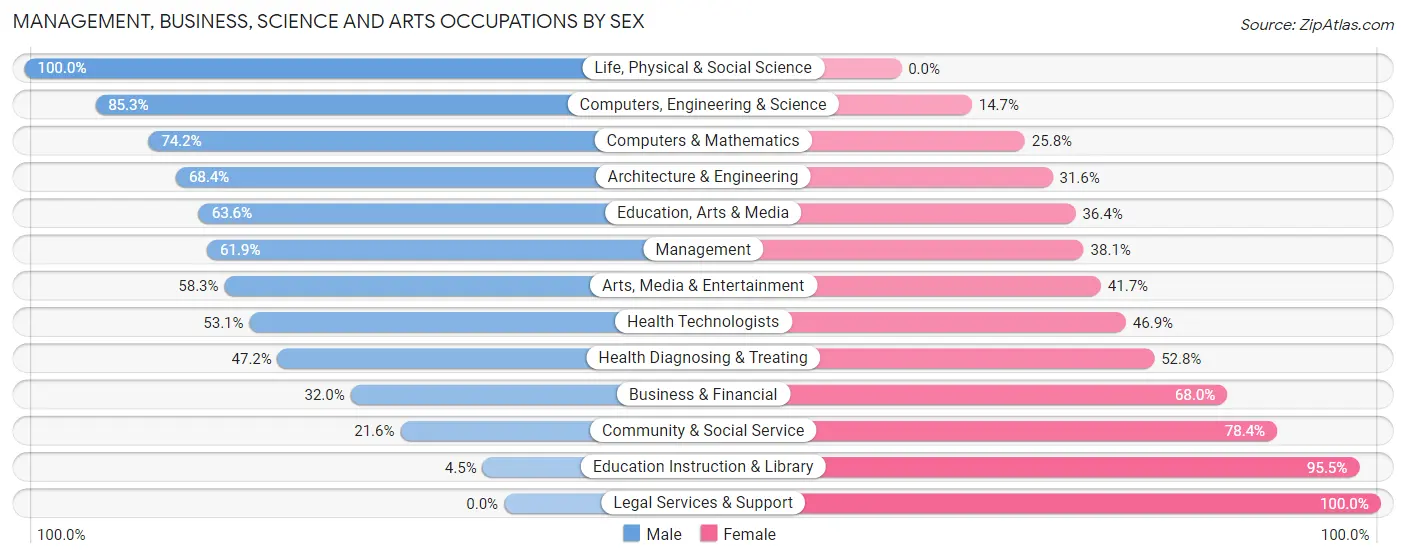
Management, Business, Science and Arts Occupations by Sex
Within the Management, Business, Science and Arts occupations in Whiting, the most male-oriented occupations are Life, Physical & Social Science (100.0%), Computers, Engineering & Science (85.3%), and Computers & Mathematics (74.2%), while the most female-oriented occupations are Legal Services & Support (100.0%), Education Instruction & Library (95.5%), and Community & Social Service (78.4%).
| Occupation | Male | Female |
| Management | 109 (61.9%) | 67 (38.1%) |
| Business & Financial | 24 (32.0%) | 51 (68.0%) |
| Computers, Engineering & Science | 81 (85.3%) | 14 (14.7%) |
| Computers & Mathematics | 23 (74.2%) | 8 (25.8%) |
| Architecture & Engineering | 13 (68.4%) | 6 (31.6%) |
| Life, Physical & Social Science | 45 (100.0%) | 0 (0.0%) |
| Community & Social Service | 24 (21.6%) | 87 (78.4%) |
| Education, Arts & Media | 14 (63.6%) | 8 (36.4%) |
| Legal Services & Support | 0 (0.0%) | 10 (100.0%) |
| Education Instruction & Library | 3 (4.5%) | 64 (95.5%) |
| Arts, Media & Entertainment | 7 (58.3%) | 5 (41.7%) |
| Health Diagnosing & Treating | 17 (47.2%) | 19 (52.8%) |
| Health Technologists | 17 (53.1%) | 15 (46.9%) |
| Total (Category) | 255 (51.7%) | 238 (48.3%) |
| Total (Overall) | 987 (52.9%) | 877 (47.0%) |
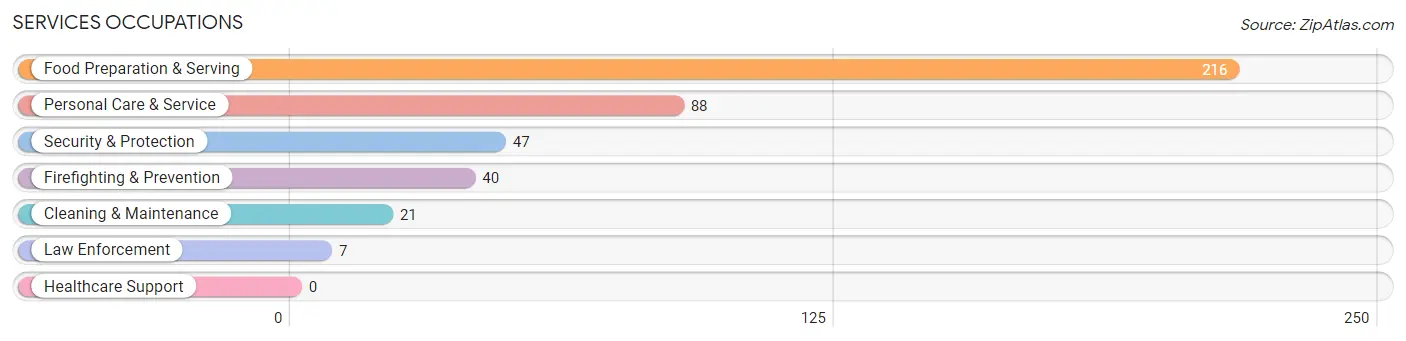
Services Occupations
The most common Services occupations in Whiting are Food Preparation & Serving (216 | 11.6%), Personal Care & Service (88 | 4.7%), Security & Protection (47 | 2.5%), Firefighting & Prevention (40 | 2.1%), and Cleaning & Maintenance (21 | 1.1%).
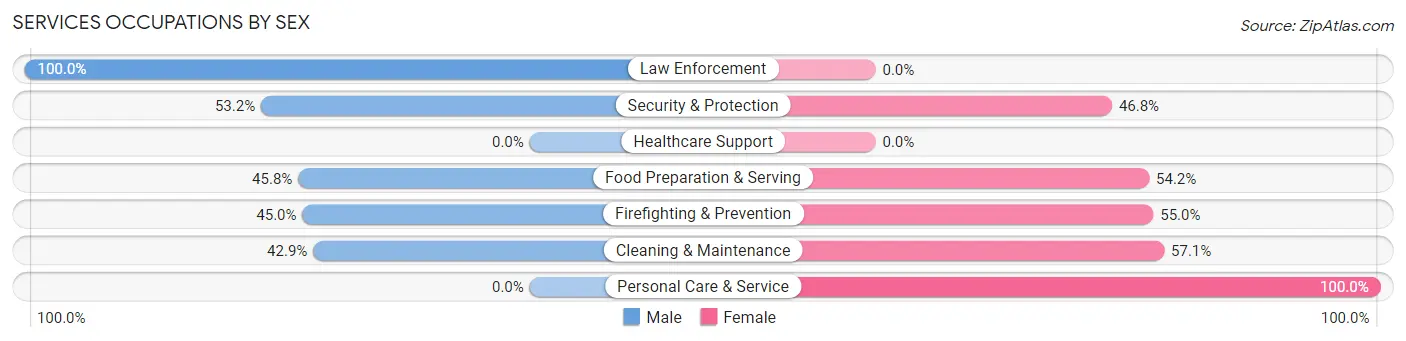
Services Occupations by Sex
Within the Services occupations in Whiting, the most male-oriented occupations are Law Enforcement (100.0%), Security & Protection (53.2%), and Food Preparation & Serving (45.8%), while the most female-oriented occupations are Personal Care & Service (100.0%), Cleaning & Maintenance (57.1%), and Firefighting & Prevention (55.0%).
| Occupation | Male | Female |
| Healthcare Support | 0 (0.0%) | 0 (0.0%) |
| Security & Protection | 25 (53.2%) | 22 (46.8%) |
| Firefighting & Prevention | 18 (45.0%) | 22 (55.0%) |
| Law Enforcement | 7 (100.0%) | 0 (0.0%) |
| Food Preparation & Serving | 99 (45.8%) | 117 (54.2%) |
| Cleaning & Maintenance | 9 (42.9%) | 12 (57.1%) |
| Personal Care & Service | 0 (0.0%) | 88 (100.0%) |
| Total (Category) | 133 (35.7%) | 239 (64.2%) |
| Total (Overall) | 987 (52.9%) | 877 (47.0%) |
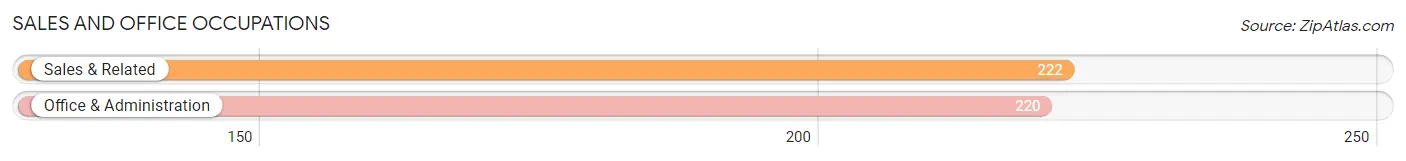
Sales and Office Occupations
The most common Sales and Office occupations in Whiting are Sales & Related (222 | 11.9%), and Office & Administration (220 | 11.8%).
Sales and Office Occupations by Sex
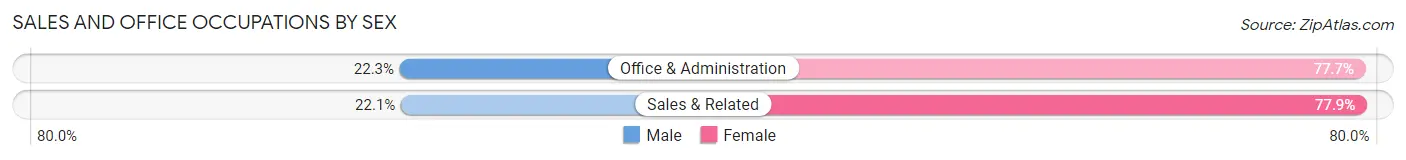
| Occupation | Male | Female |
| Sales & Related | 49 (22.1%) | 173 (77.9%) |
| Office & Administration | 49 (22.3%) | 171 (77.7%) |
| Total (Category) | 98 (22.2%) | 344 (77.8%) |
| Total (Overall) | 987 (52.9%) | 877 (47.0%) |
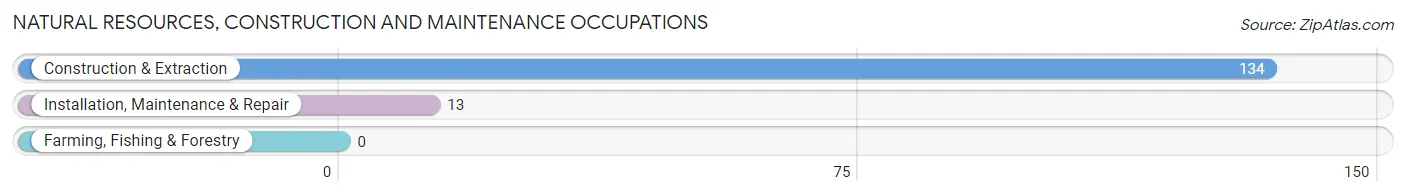
Natural Resources, Construction and Maintenance Occupations
The most common Natural Resources, Construction and Maintenance occupations in Whiting are Construction & Extraction (134 | 7.2%), and Installation, Maintenance & Repair (13 | 0.7%).
Natural Resources, Construction and Maintenance Occupations by Sex
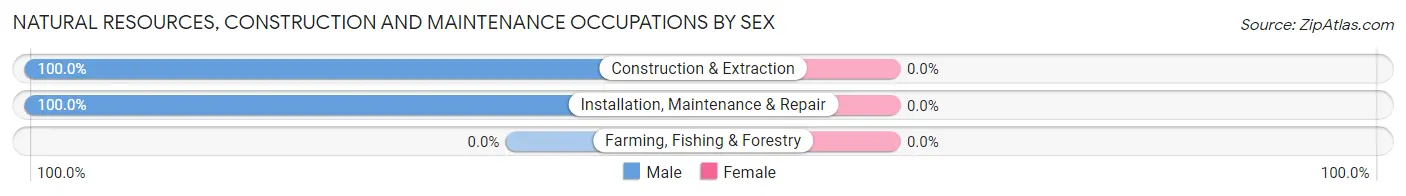
| Occupation | Male | Female |
| Farming, Fishing & Forestry | 0 (0.0%) | 0 (0.0%) |
| Construction & Extraction | 134 (100.0%) | 0 (0.0%) |
| Installation, Maintenance & Repair | 13 (100.0%) | 0 (0.0%) |
| Total (Category) | 147 (100.0%) | 0 (0.0%) |
| Total (Overall) | 987 (52.9%) | 877 (47.0%) |
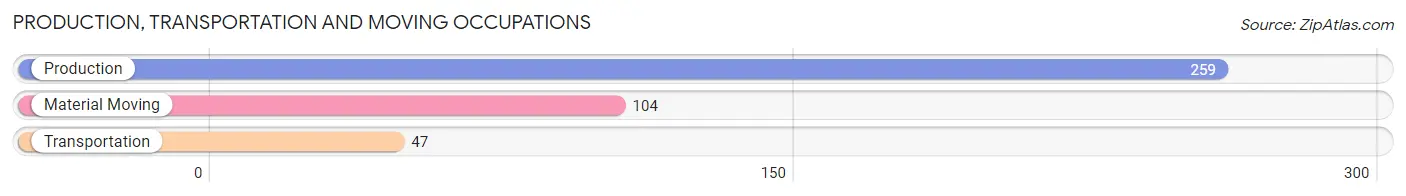
Production, Transportation and Moving Occupations
The most common Production, Transportation and Moving occupations in Whiting are Production (259 | 13.9%), Material Moving (104 | 5.6%), and Transportation (47 | 2.5%).
Production, Transportation and Moving Occupations by Sex
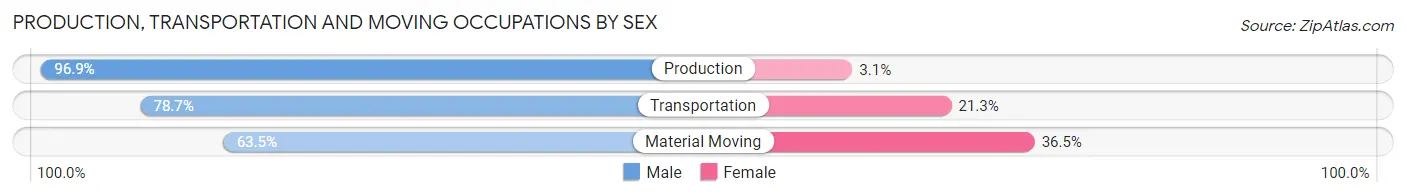
| Occupation | Male | Female |
| Production | 251 (96.9%) | 8 (3.1%) |
| Transportation | 37 (78.7%) | 10 (21.3%) |
| Material Moving | 66 (63.5%) | 38 (36.5%) |
| Total (Category) | 354 (86.3%) | 56 (13.7%) |
| Total (Overall) | 987 (52.9%) | 877 (47.0%) |
Employment Industries by Sex in Whiting
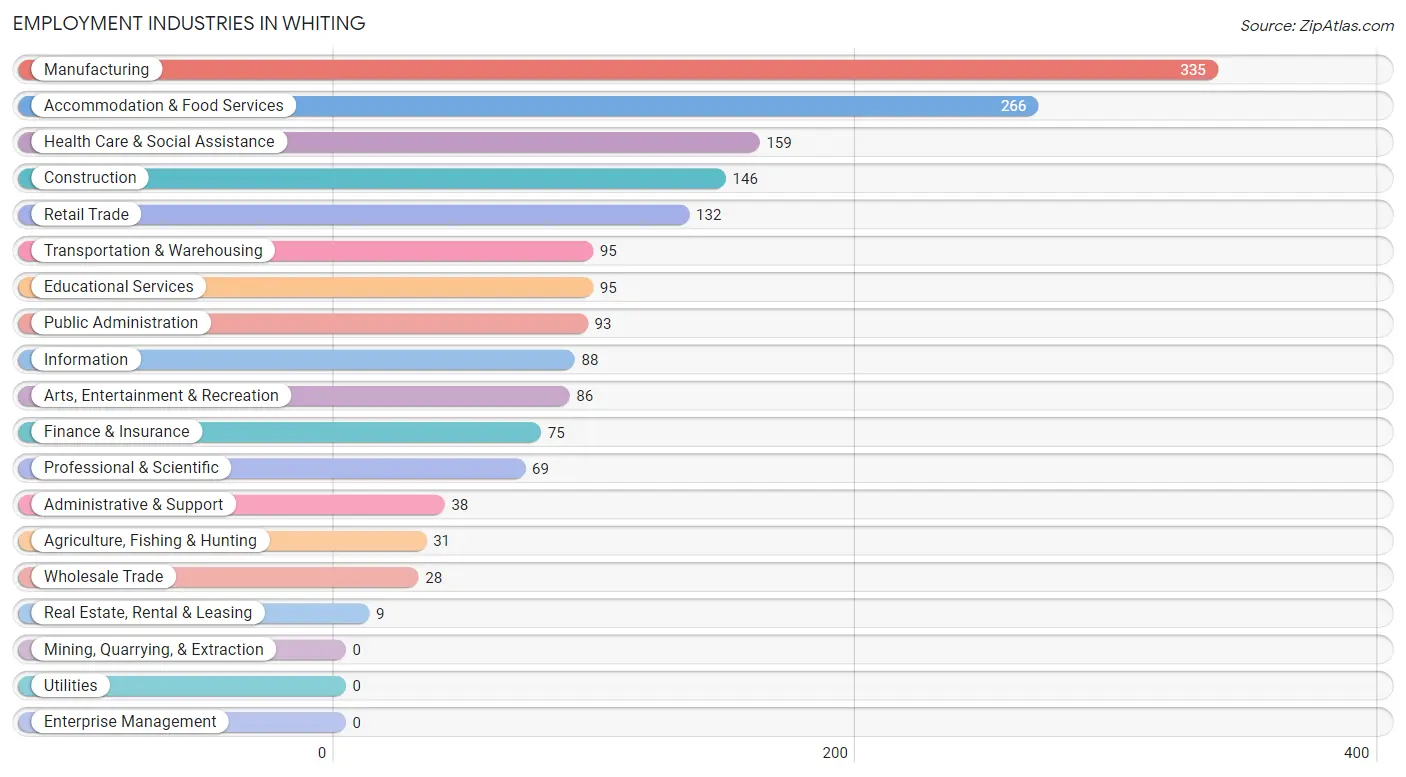
Employment Industries in Whiting
The major employment industries in Whiting include Manufacturing (335 | 18.0%), Accommodation & Food Services (266 | 14.3%), Health Care & Social Assistance (159 | 8.5%), Construction (146 | 7.8%), and Retail Trade (132 | 7.1%).
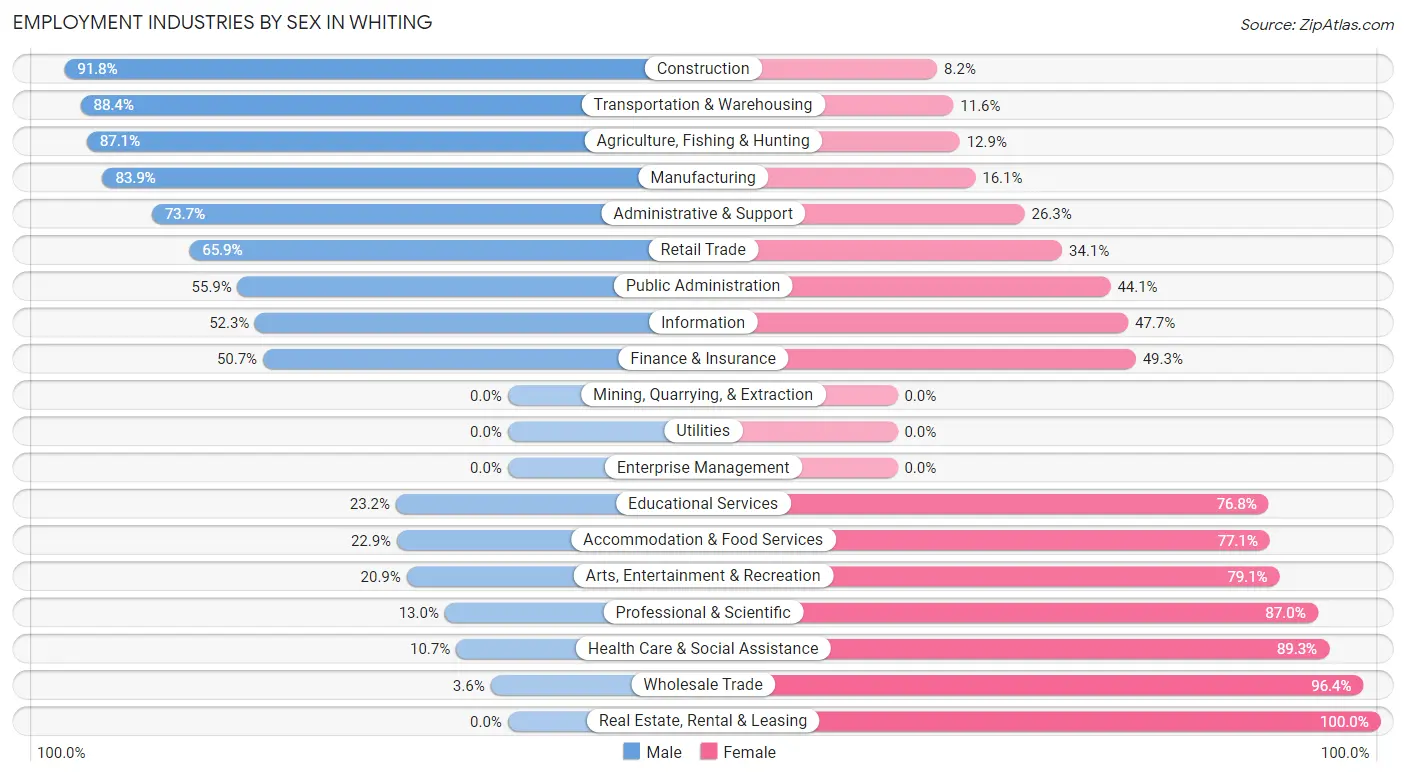
Employment Industries by Sex in Whiting
The Whiting industries that see more men than women are Construction (91.8%), Transportation & Warehousing (88.4%), and Agriculture, Fishing & Hunting (87.1%), whereas the industries that tend to have a higher number of women are Real Estate, Rental & Leasing (100.0%), Wholesale Trade (96.4%), and Health Care & Social Assistance (89.3%).
| Industry | Male | Female |
| Agriculture, Fishing & Hunting | 27 (87.1%) | 4 (12.9%) |
| Mining, Quarrying, & Extraction | 0 (0.0%) | 0 (0.0%) |
| Construction | 134 (91.8%) | 12 (8.2%) |
| Manufacturing | 281 (83.9%) | 54 (16.1%) |
| Wholesale Trade | 1 (3.6%) | 27 (96.4%) |
| Retail Trade | 87 (65.9%) | 45 (34.1%) |
| Transportation & Warehousing | 84 (88.4%) | 11 (11.6%) |
| Utilities | 0 (0.0%) | 0 (0.0%) |
| Information | 46 (52.3%) | 42 (47.7%) |
| Finance & Insurance | 38 (50.7%) | 37 (49.3%) |
| Real Estate, Rental & Leasing | 0 (0.0%) | 9 (100.0%) |
| Professional & Scientific | 9 (13.0%) | 60 (87.0%) |
| Enterprise Management | 0 (0.0%) | 0 (0.0%) |
| Administrative & Support | 28 (73.7%) | 10 (26.3%) |
| Educational Services | 22 (23.2%) | 73 (76.8%) |
| Health Care & Social Assistance | 17 (10.7%) | 142 (89.3%) |
| Arts, Entertainment & Recreation | 18 (20.9%) | 68 (79.1%) |
| Accommodation & Food Services | 61 (22.9%) | 205 (77.1%) |
| Public Administration | 52 (55.9%) | 41 (44.1%) |
| Total | 987 (52.9%) | 877 (47.0%) |
Education in Whiting
School Enrollment in Whiting
The most common levels of schooling among the 1,238 students in Whiting are middle school (397 | 32.1%), high school (335 | 27.1%), and elementary school (165 | 13.3%).
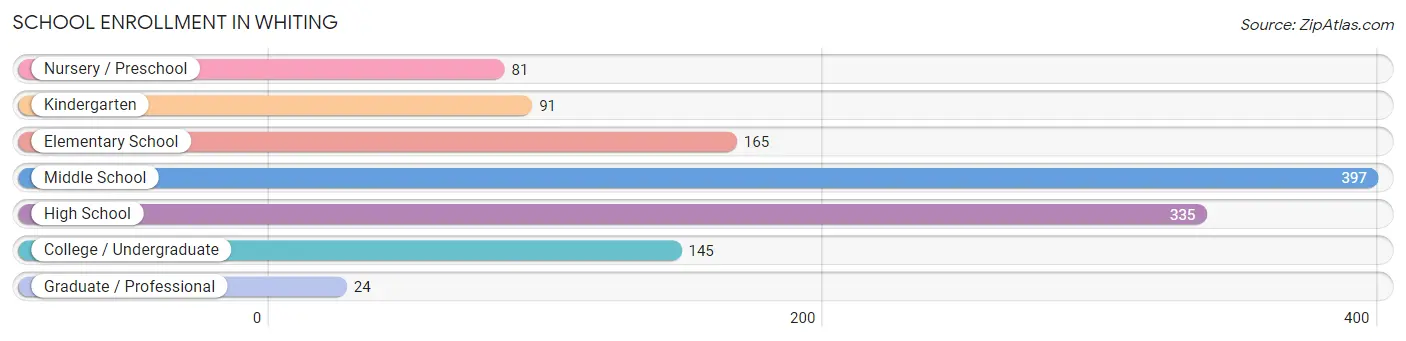
| School Level | # Students | % Students |
| Nursery / Preschool | 81 | 6.5% |
| Kindergarten | 91 | 7.3% |
| Elementary School | 165 | 13.3% |
| Middle School | 397 | 32.1% |
| High School | 335 | 27.1% |
| College / Undergraduate | 145 | 11.7% |
| Graduate / Professional | 24 | 1.9% |
| Total | 1,238 | 100.0% |
School Enrollment by Age by Funding Source in Whiting
Out of a total of 1,238 students who are enrolled in schools in Whiting, 162 (13.1%) attend a private institution, while the remaining 1,076 (86.9%) are enrolled in public schools. The age group of 25 to 34 year olds has the highest likelihood of being enrolled in private schools, with 10 (52.6% in the age bracket) enrolled. Conversely, the age group of 15 to 17 year olds has the lowest likelihood of being enrolled in a private school, with 250 (100.0% in the age bracket) attending a public institution.
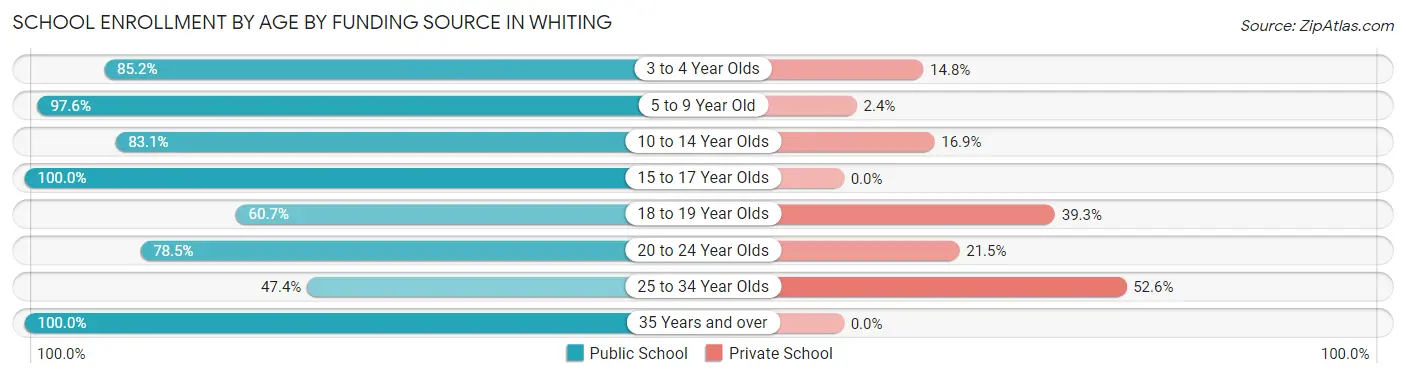
| Age Bracket | Public School | Private School |
| 3 to 4 Year Olds | 46 (85.2%) | 8 (14.8%) |
| 5 to 9 Year Old | 243 (97.6%) | 6 (2.4%) |
| 10 to 14 Year Olds | 384 (83.1%) | 78 (16.9%) |
| 15 to 17 Year Olds | 250 (100.0%) | 0 (0.0%) |
| 18 to 19 Year Olds | 71 (60.7%) | 46 (39.3%) |
| 20 to 24 Year Olds | 51 (78.5%) | 14 (21.5%) |
| 25 to 34 Year Olds | 9 (47.4%) | 10 (52.6%) |
| 35 Years and over | 22 (100.0%) | 0 (0.0%) |
| Total | 1,076 (86.9%) | 162 (13.1%) |
Educational Attainment by Field of Study in Whiting
Business (143 | 23.0%), bio, nature & agricultural (113 | 18.2%), science & technology (58 | 9.3%), computers & mathematics (53 | 8.5%), and social sciences (40 | 6.4%) are the most common fields of study among 622 individuals in Whiting who have obtained a bachelor's degree or higher.
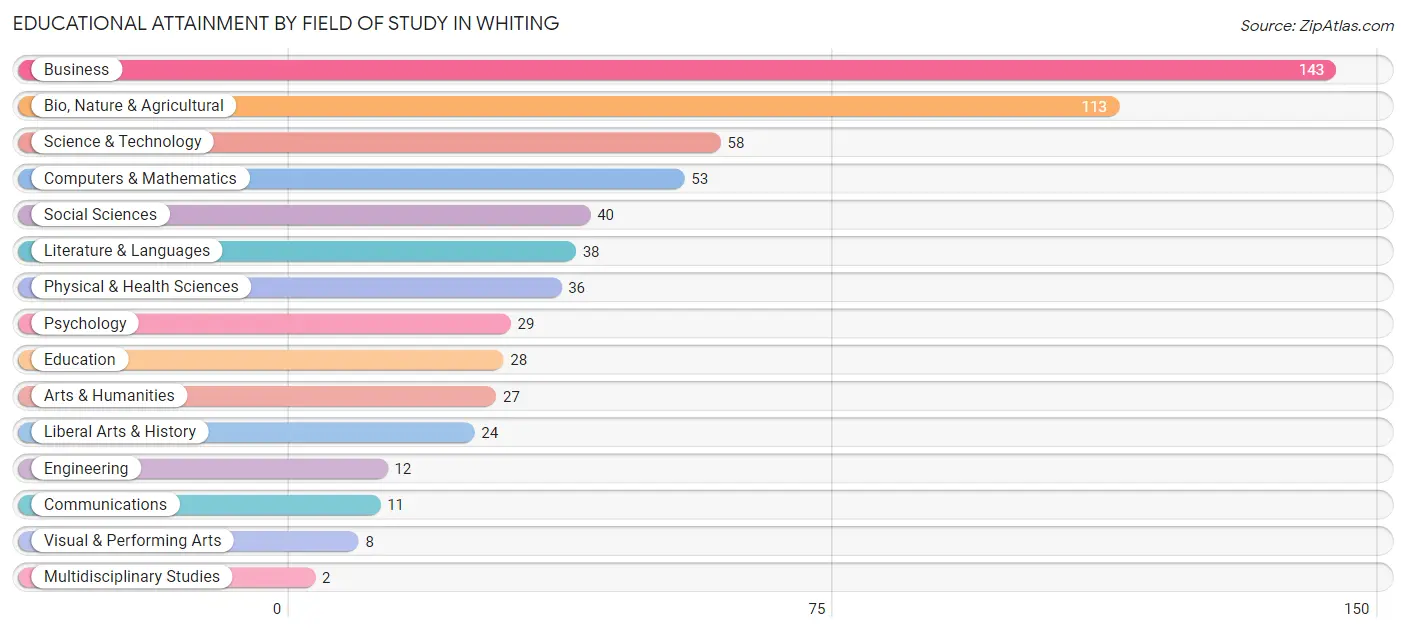
| Field of Study | # Graduates | % Graduates |
| Computers & Mathematics | 53 | 8.5% |
| Bio, Nature & Agricultural | 113 | 18.2% |
| Physical & Health Sciences | 36 | 5.8% |
| Psychology | 29 | 4.7% |
| Social Sciences | 40 | 6.4% |
| Engineering | 12 | 1.9% |
| Multidisciplinary Studies | 2 | 0.3% |
| Science & Technology | 58 | 9.3% |
| Business | 143 | 23.0% |
| Education | 28 | 4.5% |
| Literature & Languages | 38 | 6.1% |
| Liberal Arts & History | 24 | 3.9% |
| Visual & Performing Arts | 8 | 1.3% |
| Communications | 11 | 1.8% |
| Arts & Humanities | 27 | 4.3% |
| Total | 622 | 100.0% |
Transportation & Commute in Whiting
Vehicle Availability by Sex in Whiting
The most prevalent vehicle ownership categories in Whiting are males with 2 vehicles (373, accounting for 37.8%) and females with 2 vehicles (282, making up 43.7%).
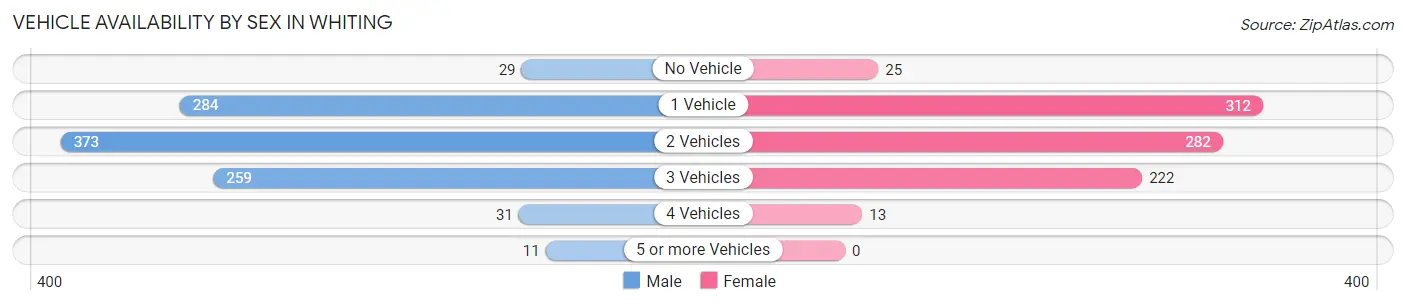
| Vehicles Available | Male | Female |
| No Vehicle | 29 (2.9%) | 25 (2.9%) |
| 1 Vehicle | 284 (28.8%) | 312 (36.5%) |
| 2 Vehicles | 373 (37.8%) | 282 (33.0%) |
| 3 Vehicles | 259 (26.2%) | 222 (26.0%) |
| 4 Vehicles | 31 (3.1%) | 13 (1.5%) |
| 5 or more Vehicles | 11 (1.1%) | 0 (0.0%) |
| Total | 987 (100.0%) | 854 (100.0%) |
Commute Time in Whiting
The most frequently occuring commute durations in Whiting are 30 to 34 minutes (336 commuters, 19.8%), 45 to 59 minutes (246 commuters, 14.5%), and 5 to 9 minutes (242 commuters, 14.2%).
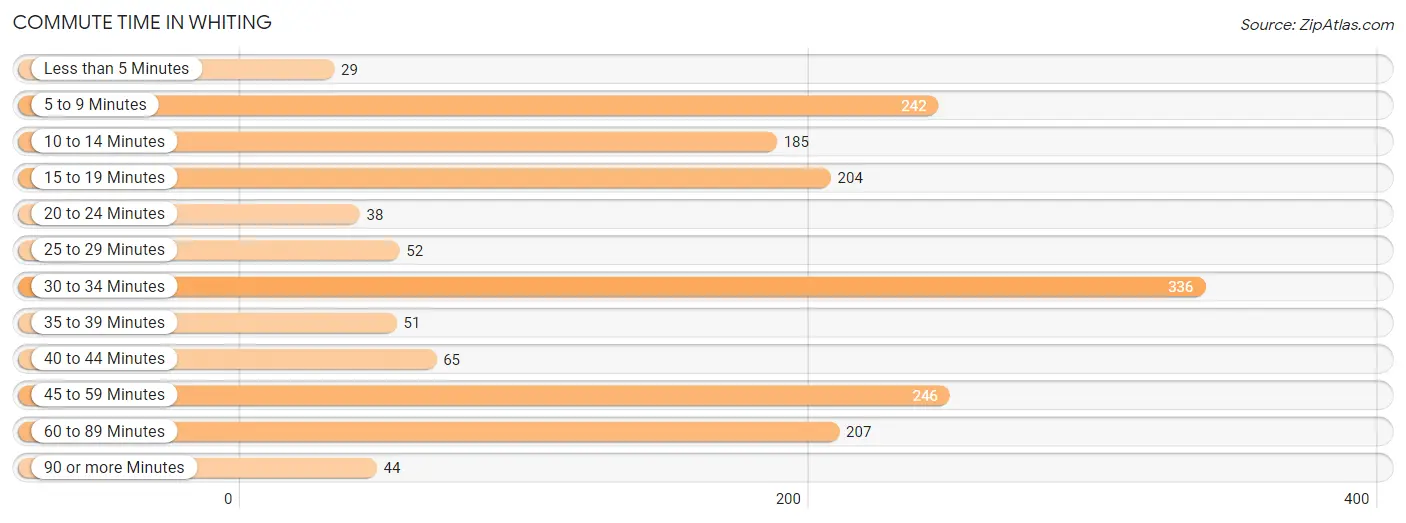
| Commute Time | # Commuters | % Commuters |
| Less than 5 Minutes | 29 | 1.7% |
| 5 to 9 Minutes | 242 | 14.2% |
| 10 to 14 Minutes | 185 | 10.9% |
| 15 to 19 Minutes | 204 | 12.0% |
| 20 to 24 Minutes | 38 | 2.2% |
| 25 to 29 Minutes | 52 | 3.1% |
| 30 to 34 Minutes | 336 | 19.8% |
| 35 to 39 Minutes | 51 | 3.0% |
| 40 to 44 Minutes | 65 | 3.8% |
| 45 to 59 Minutes | 246 | 14.5% |
| 60 to 89 Minutes | 207 | 12.2% |
| 90 or more Minutes | 44 | 2.6% |
Commute Time by Sex in Whiting
The most common commute times in Whiting are 30 to 34 minutes (259 commuters, 27.3%) for males and 45 to 59 minutes (144 commuters, 19.2%) for females.
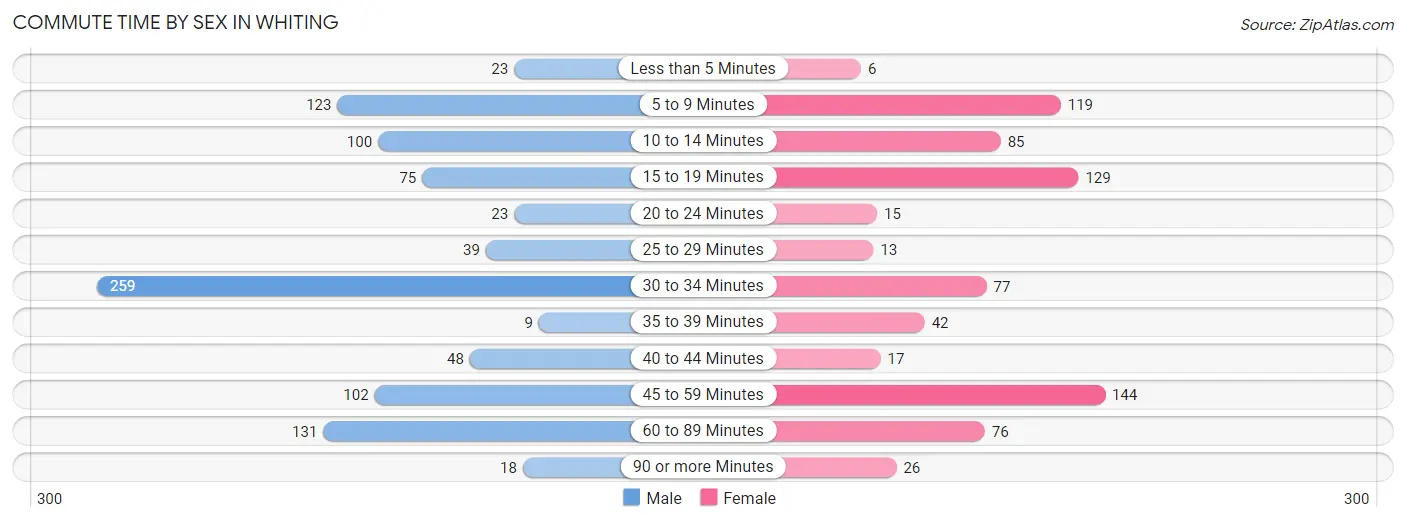
| Commute Time | Male | Female |
| Less than 5 Minutes | 23 (2.4%) | 6 (0.8%) |
| 5 to 9 Minutes | 123 (13.0%) | 119 (15.9%) |
| 10 to 14 Minutes | 100 (10.5%) | 85 (11.4%) |
| 15 to 19 Minutes | 75 (7.9%) | 129 (17.2%) |
| 20 to 24 Minutes | 23 (2.4%) | 15 (2.0%) |
| 25 to 29 Minutes | 39 (4.1%) | 13 (1.7%) |
| 30 to 34 Minutes | 259 (27.3%) | 77 (10.3%) |
| 35 to 39 Minutes | 9 (0.9%) | 42 (5.6%) |
| 40 to 44 Minutes | 48 (5.1%) | 17 (2.3%) |
| 45 to 59 Minutes | 102 (10.7%) | 144 (19.2%) |
| 60 to 89 Minutes | 131 (13.8%) | 76 (10.2%) |
| 90 or more Minutes | 18 (1.9%) | 26 (3.5%) |
Time of Departure to Work by Sex in Whiting
The most frequent times of departure to work in Whiting are 7:00 AM to 7:29 AM (239, 25.2%) for males and 8:00 AM to 8:29 AM (138, 18.4%) for females.
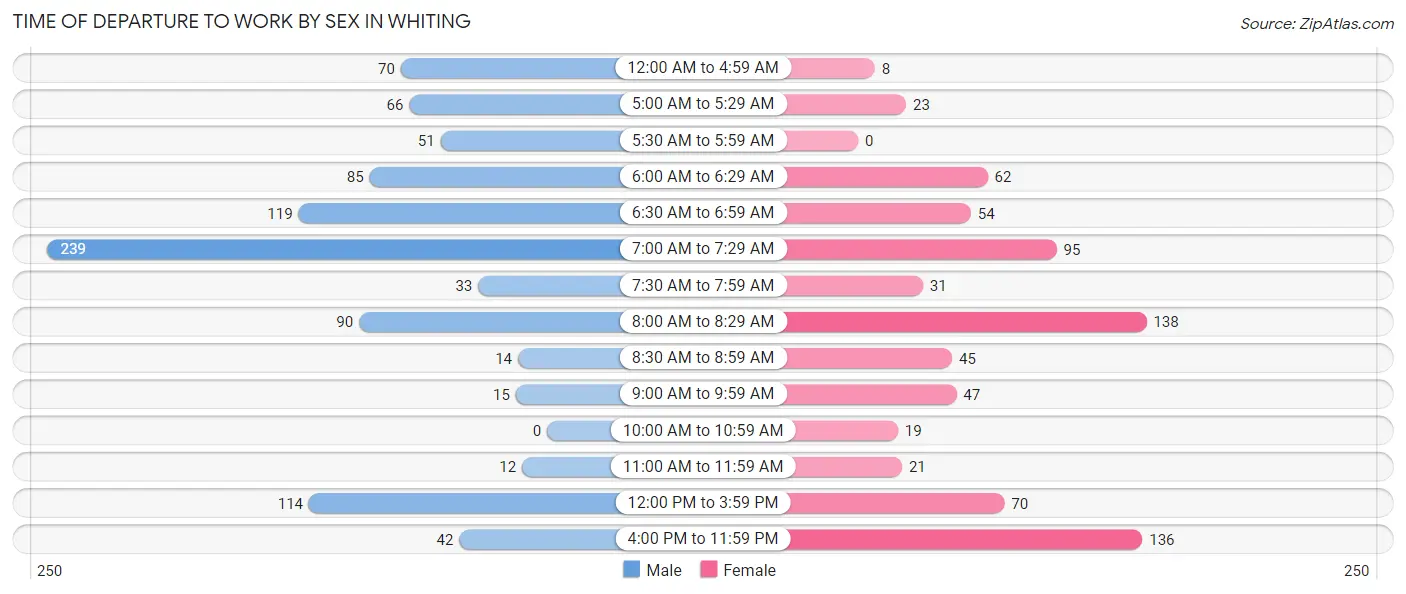
| Time of Departure | Male | Female |
| 12:00 AM to 4:59 AM | 70 (7.4%) | 8 (1.1%) |
| 5:00 AM to 5:29 AM | 66 (7.0%) | 23 (3.1%) |
| 5:30 AM to 5:59 AM | 51 (5.4%) | 0 (0.0%) |
| 6:00 AM to 6:29 AM | 85 (8.9%) | 62 (8.3%) |
| 6:30 AM to 6:59 AM | 119 (12.5%) | 54 (7.2%) |
| 7:00 AM to 7:29 AM | 239 (25.2%) | 95 (12.7%) |
| 7:30 AM to 7:59 AM | 33 (3.5%) | 31 (4.1%) |
| 8:00 AM to 8:29 AM | 90 (9.5%) | 138 (18.4%) |
| 8:30 AM to 8:59 AM | 14 (1.5%) | 45 (6.0%) |
| 9:00 AM to 9:59 AM | 15 (1.6%) | 47 (6.3%) |
| 10:00 AM to 10:59 AM | 0 (0.0%) | 19 (2.5%) |
| 11:00 AM to 11:59 AM | 12 (1.3%) | 21 (2.8%) |
| 12:00 PM to 3:59 PM | 114 (12.0%) | 70 (9.3%) |
| 4:00 PM to 11:59 PM | 42 (4.4%) | 136 (18.2%) |
| Total | 950 (100.0%) | 749 (100.0%) |
Housing Occupancy in Whiting
Occupancy by Ownership in Whiting
Of the total 1,580 dwellings in Whiting, owner-occupied units account for 907 (57.4%), while renter-occupied units make up 673 (42.6%).
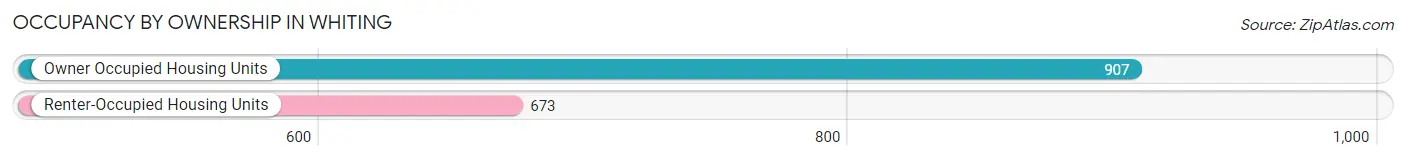
| Occupancy | # Housing Units | % Housing Units |
| Owner Occupied Housing Units | 907 | 57.4% |
| Renter-Occupied Housing Units | 673 | 42.6% |
| Total Occupied Housing Units | 1,580 | 100.0% |
Occupancy by Household Size in Whiting
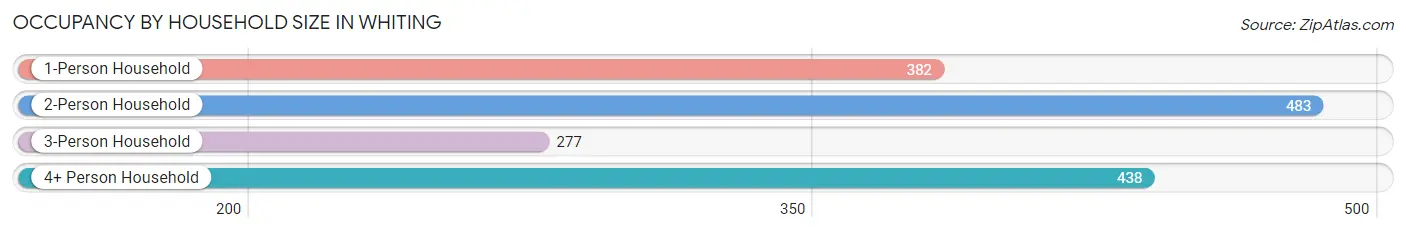
| Household Size | # Housing Units | % Housing Units |
| 1-Person Household | 382 | 24.2% |
| 2-Person Household | 483 | 30.6% |
| 3-Person Household | 277 | 17.5% |
| 4+ Person Household | 438 | 27.7% |
| Total Housing Units | 1,580 | 100.0% |
Occupancy by Ownership by Household Size in Whiting
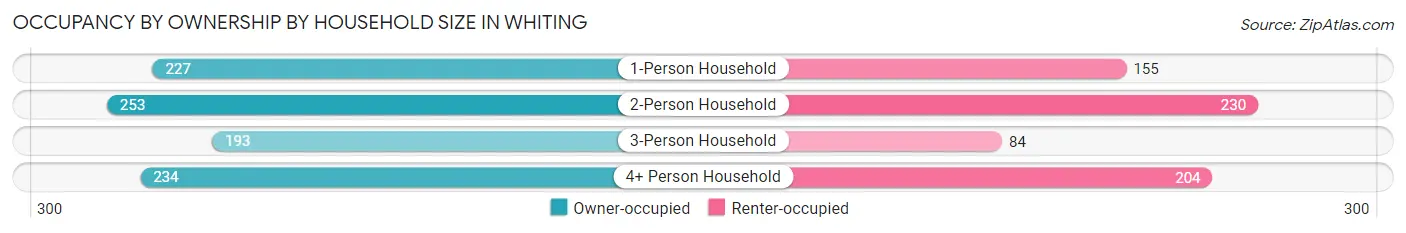
| Household Size | Owner-occupied | Renter-occupied |
| 1-Person Household | 227 (59.4%) | 155 (40.6%) |
| 2-Person Household | 253 (52.4%) | 230 (47.6%) |
| 3-Person Household | 193 (69.7%) | 84 (30.3%) |
| 4+ Person Household | 234 (53.4%) | 204 (46.6%) |
| Total Housing Units | 907 (57.4%) | 673 (42.6%) |
Occupancy by Educational Attainment in Whiting
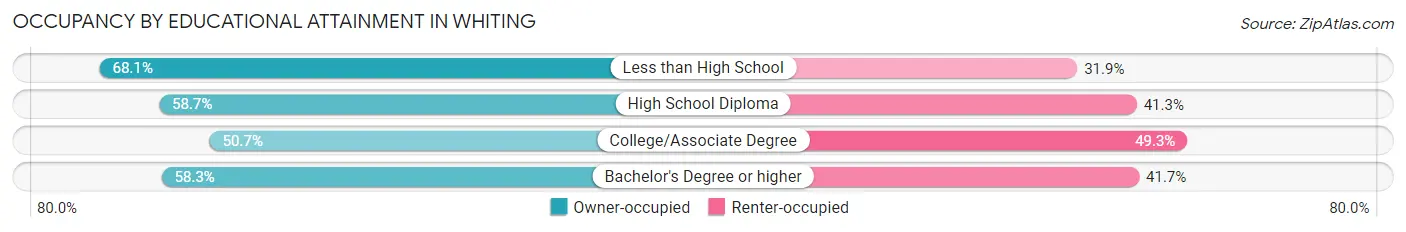
| Household Size | Owner-occupied | Renter-occupied |
| Less than High School | 126 (68.1%) | 59 (31.9%) |
| High School Diploma | 335 (58.7%) | 236 (41.3%) |
| College/Associate Degree | 228 (50.7%) | 222 (49.3%) |
| Bachelor's Degree or higher | 218 (58.3%) | 156 (41.7%) |
Occupancy by Age of Householder in Whiting
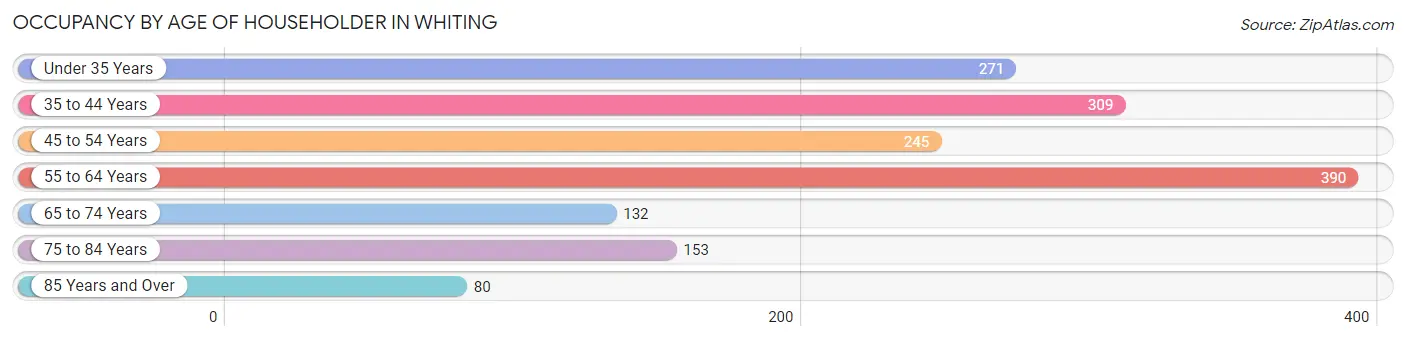
| Age Bracket | # Households | % Households |
| Under 35 Years | 271 | 17.2% |
| 35 to 44 Years | 309 | 19.6% |
| 45 to 54 Years | 245 | 15.5% |
| 55 to 64 Years | 390 | 24.7% |
| 65 to 74 Years | 132 | 8.4% |
| 75 to 84 Years | 153 | 9.7% |
| 85 Years and Over | 80 | 5.1% |
| Total | 1,580 | 100.0% |
Housing Finances in Whiting
Median Income by Occupancy in Whiting
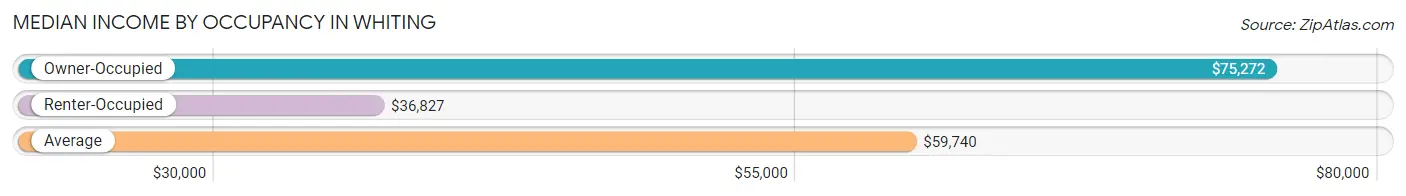
| Occupancy Type | # Households | Median Income |
| Owner-Occupied | 907 (57.4%) | $75,272 |
| Renter-Occupied | 673 (42.6%) | $36,827 |
| Average | 1,580 (100.0%) | $59,740 |
Occupancy by Householder Income Bracket in Whiting
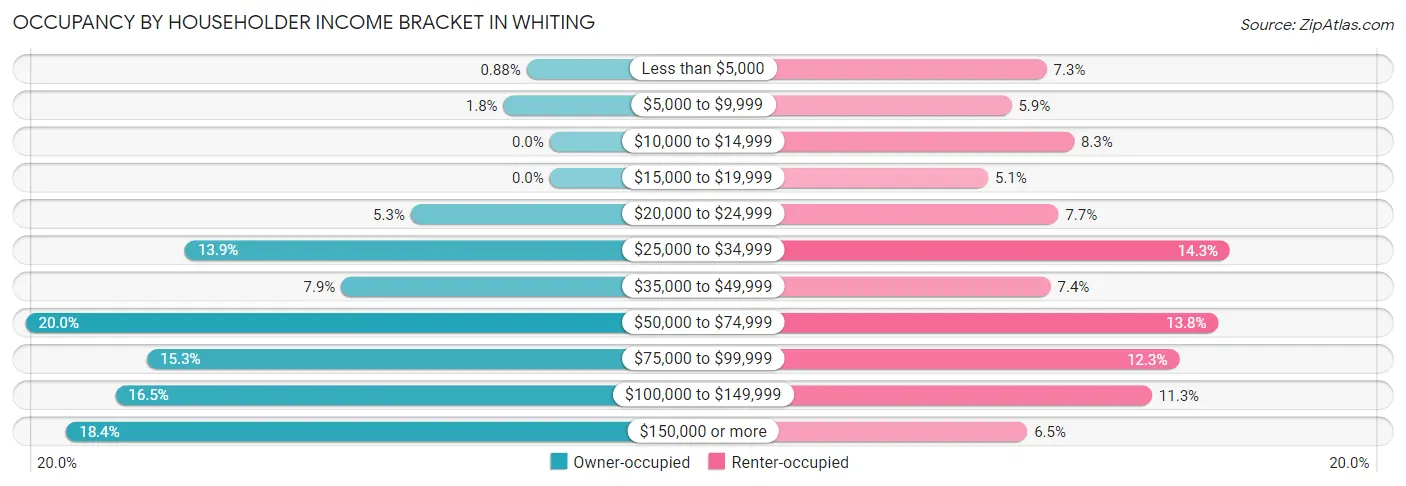
| Income Bracket | Owner-occupied | Renter-occupied |
| Less than $5,000 | 8 (0.9%) | 49 (7.3%) |
| $5,000 to $9,999 | 16 (1.8%) | 40 (5.9%) |
| $10,000 to $14,999 | 0 (0.0%) | 56 (8.3%) |
| $15,000 to $19,999 | 0 (0.0%) | 34 (5.1%) |
| $20,000 to $24,999 | 48 (5.3%) | 52 (7.7%) |
| $25,000 to $34,999 | 126 (13.9%) | 96 (14.3%) |
| $35,000 to $49,999 | 72 (7.9%) | 50 (7.4%) |
| $50,000 to $74,999 | 181 (20.0%) | 93 (13.8%) |
| $75,000 to $99,999 | 139 (15.3%) | 83 (12.3%) |
| $100,000 to $149,999 | 150 (16.5%) | 76 (11.3%) |
| $150,000 or more | 167 (18.4%) | 44 (6.5%) |
| Total | 907 (100.0%) | 673 (100.0%) |
Monthly Housing Cost Tiers in Whiting
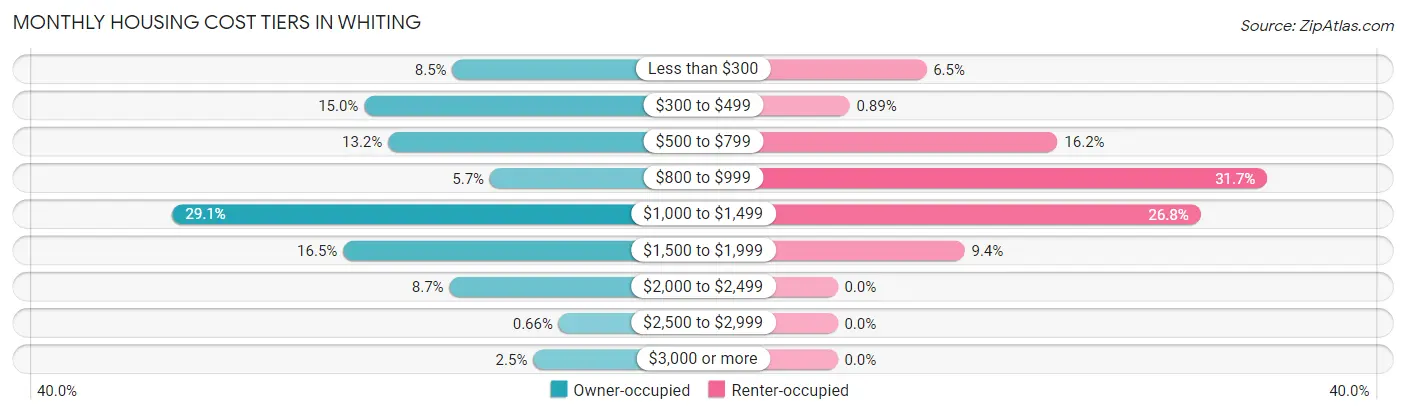
| Monthly Cost | Owner-occupied | Renter-occupied |
| Less than $300 | 77 (8.5%) | 44 (6.5%) |
| $300 to $499 | 136 (15.0%) | 6 (0.9%) |
| $500 to $799 | 120 (13.2%) | 109 (16.2%) |
| $800 to $999 | 52 (5.7%) | 213 (31.7%) |
| $1,000 to $1,499 | 264 (29.1%) | 180 (26.8%) |
| $1,500 to $1,999 | 150 (16.5%) | 63 (9.4%) |
| $2,000 to $2,499 | 79 (8.7%) | 0 (0.0%) |
| $2,500 to $2,999 | 6 (0.7%) | 0 (0.0%) |
| $3,000 or more | 23 (2.5%) | 0 (0.0%) |
| Total | 907 (100.0%) | 673 (100.0%) |
Physical Housing Characteristics in Whiting
Housing Structures in Whiting
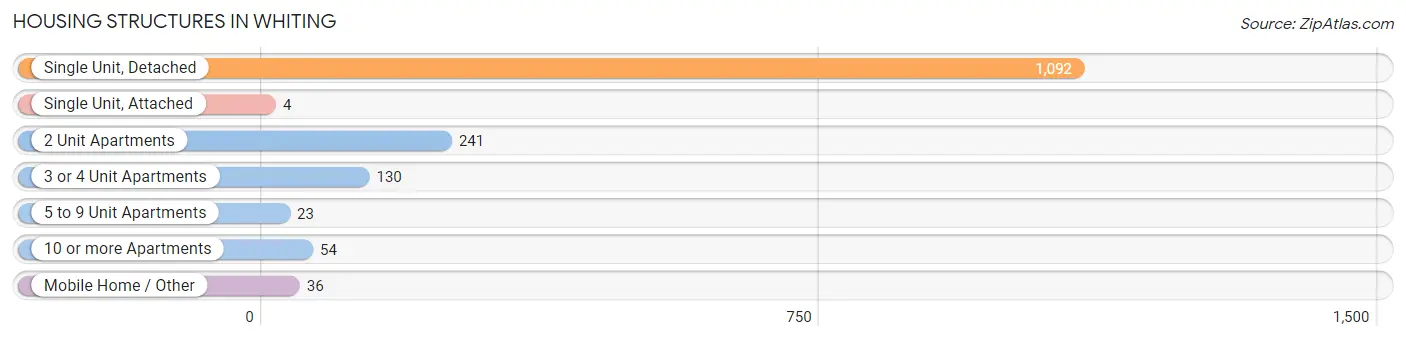
| Structure Type | # Housing Units | % Housing Units |
| Single Unit, Detached | 1,092 | 69.1% |
| Single Unit, Attached | 4 | 0.3% |
| 2 Unit Apartments | 241 | 15.2% |
| 3 or 4 Unit Apartments | 130 | 8.2% |
| 5 to 9 Unit Apartments | 23 | 1.5% |
| 10 or more Apartments | 54 | 3.4% |
| Mobile Home / Other | 36 | 2.3% |
| Total | 1,580 | 100.0% |
Housing Structures by Occupancy in Whiting
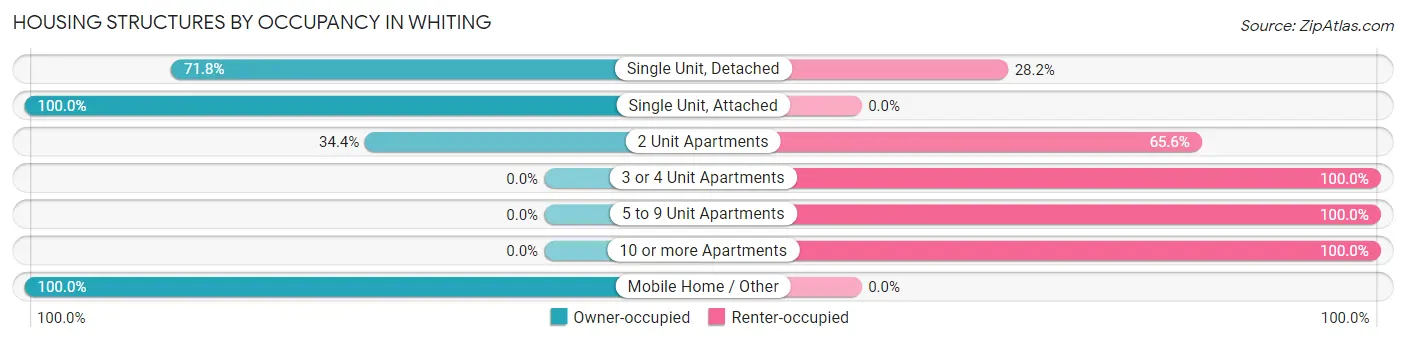
| Structure Type | Owner-occupied | Renter-occupied |
| Single Unit, Detached | 784 (71.8%) | 308 (28.2%) |
| Single Unit, Attached | 4 (100.0%) | 0 (0.0%) |
| 2 Unit Apartments | 83 (34.4%) | 158 (65.6%) |
| 3 or 4 Unit Apartments | 0 (0.0%) | 130 (100.0%) |
| 5 to 9 Unit Apartments | 0 (0.0%) | 23 (100.0%) |
| 10 or more Apartments | 0 (0.0%) | 54 (100.0%) |
| Mobile Home / Other | 36 (100.0%) | 0 (0.0%) |
| Total | 907 (57.4%) | 673 (42.6%) |
Housing Structures by Number of Rooms in Whiting
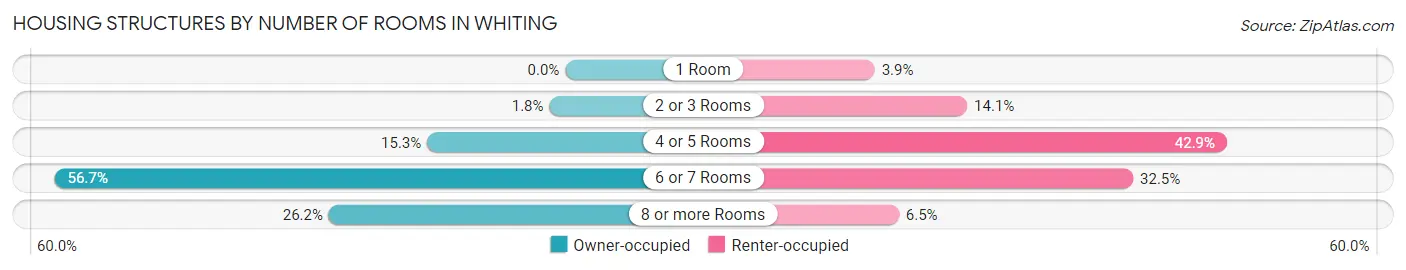
| Number of Rooms | Owner-occupied | Renter-occupied |
| 1 Room | 0 (0.0%) | 26 (3.9%) |
| 2 or 3 Rooms | 16 (1.8%) | 95 (14.1%) |
| 4 or 5 Rooms | 139 (15.3%) | 289 (42.9%) |
| 6 or 7 Rooms | 514 (56.7%) | 219 (32.5%) |
| 8 or more Rooms | 238 (26.2%) | 44 (6.5%) |
| Total | 907 (100.0%) | 673 (100.0%) |
Housing Structure by Heating Type in Whiting
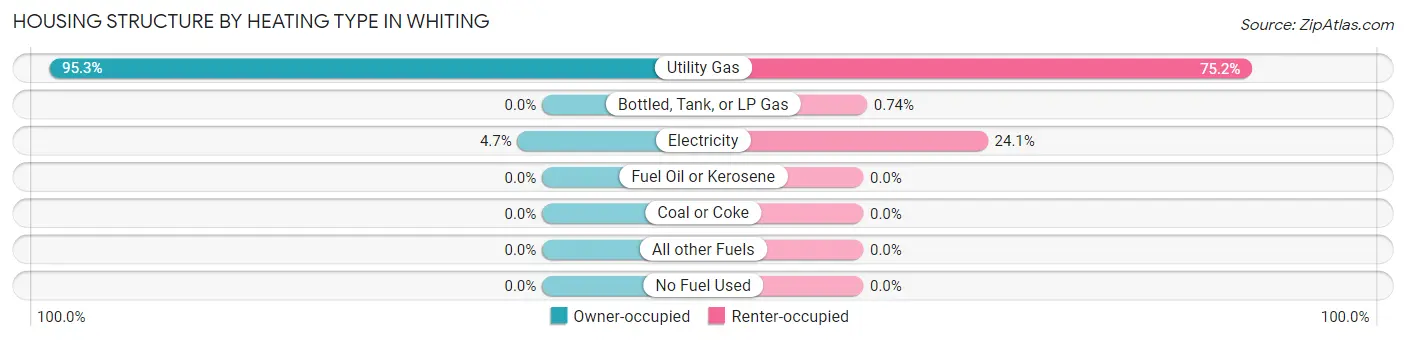
| Heating Type | Owner-occupied | Renter-occupied |
| Utility Gas | 864 (95.3%) | 506 (75.2%) |
| Bottled, Tank, or LP Gas | 0 (0.0%) | 5 (0.7%) |
| Electricity | 43 (4.7%) | 162 (24.1%) |
| Fuel Oil or Kerosene | 0 (0.0%) | 0 (0.0%) |
| Coal or Coke | 0 (0.0%) | 0 (0.0%) |
| All other Fuels | 0 (0.0%) | 0 (0.0%) |
| No Fuel Used | 0 (0.0%) | 0 (0.0%) |
| Total | 907 (100.0%) | 673 (100.0%) |
Household Vehicle Usage in Whiting
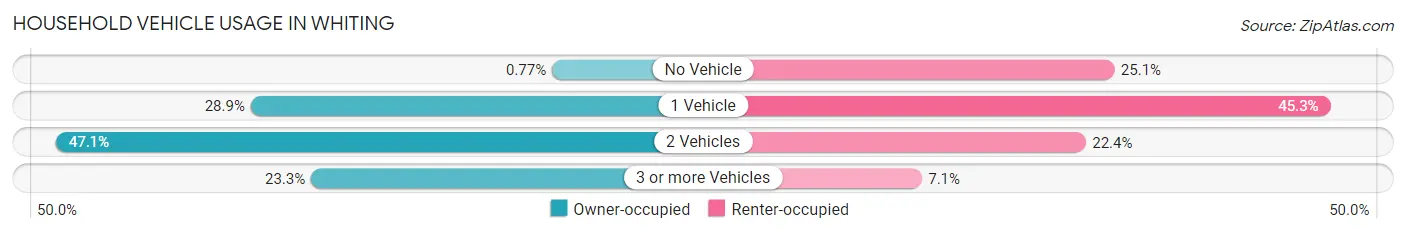
| Vehicles per Household | Owner-occupied | Renter-occupied |
| No Vehicle | 7 (0.8%) | 169 (25.1%) |
| 1 Vehicle | 262 (28.9%) | 305 (45.3%) |
| 2 Vehicles | 427 (47.1%) | 151 (22.4%) |
| 3 or more Vehicles | 211 (23.3%) | 48 (7.1%) |
| Total | 907 (100.0%) | 673 (100.0%) |
Real Estate & Mortgages in Whiting
Real Estate and Mortgage Overview in Whiting
| Characteristic | Without Mortgage | With Mortgage |
| Housing Units | 301 | 606 |
| Median Property Value | $138,300 | $221,300 |
| Median Household Income | $57,250 | $119 |
| Monthly Housing Costs | $404 | $23 |
| Real Estate Taxes | $1,348 | $0 |
Property Value by Mortgage Status in Whiting
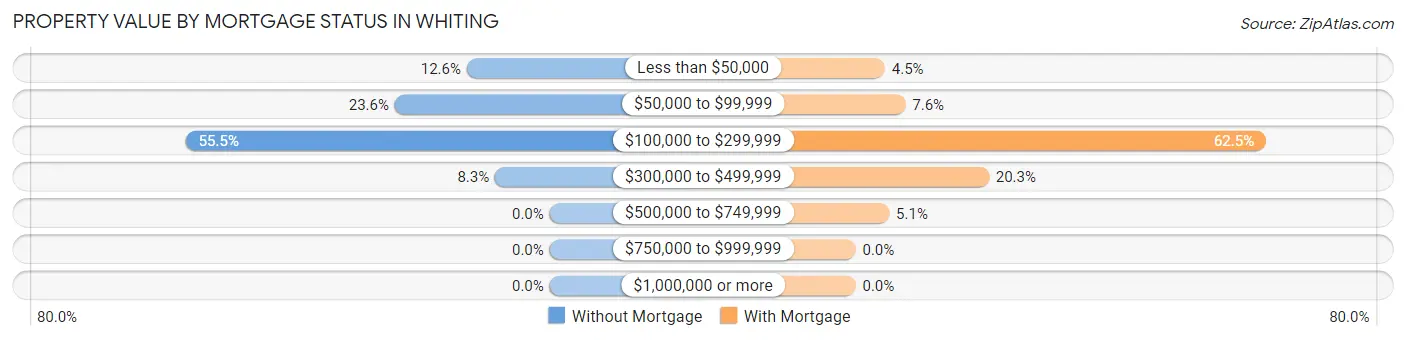
| Property Value | Without Mortgage | With Mortgage |
| Less than $50,000 | 38 (12.6%) | 27 (4.5%) |
| $50,000 to $99,999 | 71 (23.6%) | 46 (7.6%) |
| $100,000 to $299,999 | 167 (55.5%) | 379 (62.5%) |
| $300,000 to $499,999 | 25 (8.3%) | 123 (20.3%) |
| $500,000 to $749,999 | 0 (0.0%) | 31 (5.1%) |
| $750,000 to $999,999 | 0 (0.0%) | 0 (0.0%) |
| $1,000,000 or more | 0 (0.0%) | 0 (0.0%) |
| Total | 301 (100.0%) | 606 (100.0%) |
Household Income by Mortgage Status in Whiting
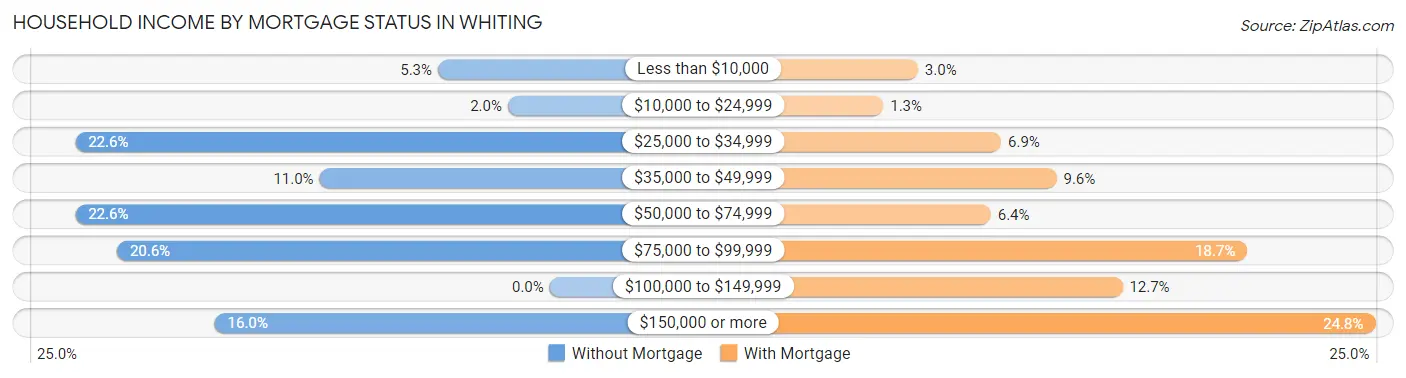
| Household Income | Without Mortgage | With Mortgage |
| Less than $10,000 | 16 (5.3%) | 18 (3.0%) |
| $10,000 to $24,999 | 6 (2.0%) | 8 (1.3%) |
| $25,000 to $34,999 | 68 (22.6%) | 42 (6.9%) |
| $35,000 to $49,999 | 33 (11.0%) | 58 (9.6%) |
| $50,000 to $74,999 | 68 (22.6%) | 39 (6.4%) |
| $75,000 to $99,999 | 62 (20.6%) | 113 (18.6%) |
| $100,000 to $149,999 | 0 (0.0%) | 77 (12.7%) |
| $150,000 or more | 48 (16.0%) | 150 (24.7%) |
| Total | 301 (100.0%) | 606 (100.0%) |
Property Value to Household Income Ratio in Whiting
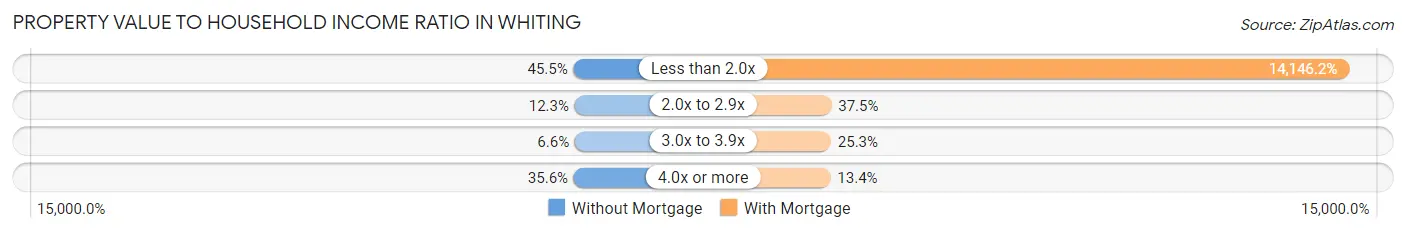
| Value-to-Income Ratio | Without Mortgage | With Mortgage |
| Less than 2.0x | 137 (45.5%) | 85,726 (14,146.2%) |
| 2.0x to 2.9x | 37 (12.3%) | 227 (37.5%) |
| 3.0x to 3.9x | 20 (6.6%) | 153 (25.3%) |
| 4.0x or more | 107 (35.5%) | 81 (13.4%) |
| Total | 301 (100.0%) | 606 (100.0%) |
Real Estate Taxes by Mortgage Status in Whiting
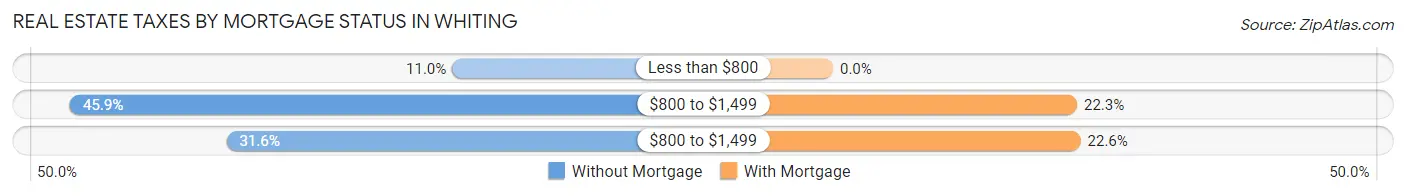
| Property Taxes | Without Mortgage | With Mortgage |
| Less than $800 | 33 (11.0%) | 0 (0.0%) |
| $800 to $1,499 | 138 (45.9%) | 135 (22.3%) |
| $800 to $1,499 | 95 (31.6%) | 137 (22.6%) |
| Total | 301 (100.0%) | 606 (100.0%) |
Health & Disability in Whiting
Health Insurance Coverage by Age in Whiting
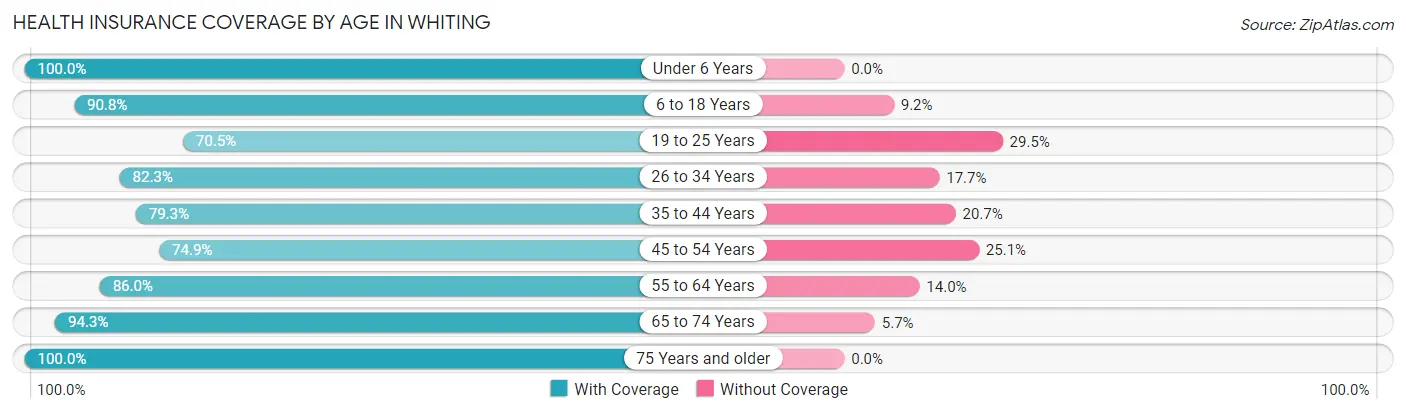
| Age Bracket | With Coverage | Without Coverage |
| Under 6 Years | 398 (100.0%) | 0 (0.0%) |
| 6 to 18 Years | 885 (90.8%) | 90 (9.2%) |
| 19 to 25 Years | 303 (70.5%) | 127 (29.5%) |
| 26 to 34 Years | 418 (82.3%) | 90 (17.7%) |
| 35 to 44 Years | 447 (79.3%) | 117 (20.7%) |
| 45 to 54 Years | 391 (74.9%) | 131 (25.1%) |
| 55 to 64 Years | 491 (86.0%) | 80 (14.0%) |
| 65 to 74 Years | 281 (94.3%) | 17 (5.7%) |
| 75 Years and older | 308 (100.0%) | 0 (0.0%) |
| Total | 3,922 (85.8%) | 652 (14.2%) |
Health Insurance Coverage by Citizenship Status in Whiting
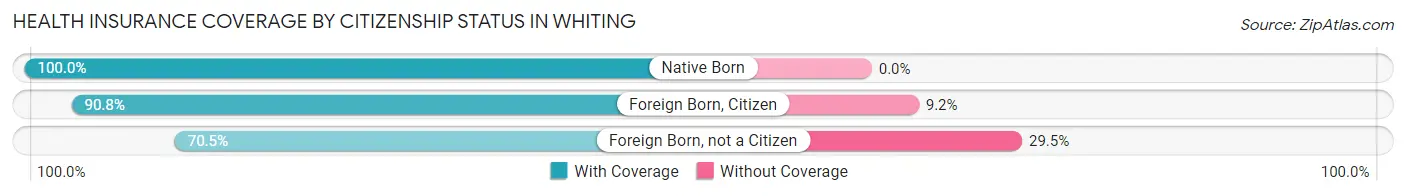
| Citizenship Status | With Coverage | Without Coverage |
| Native Born | 398 (100.0%) | 0 (0.0%) |
| Foreign Born, Citizen | 885 (90.8%) | 90 (9.2%) |
| Foreign Born, not a Citizen | 303 (70.5%) | 127 (29.5%) |
Health Insurance Coverage by Household Income in Whiting
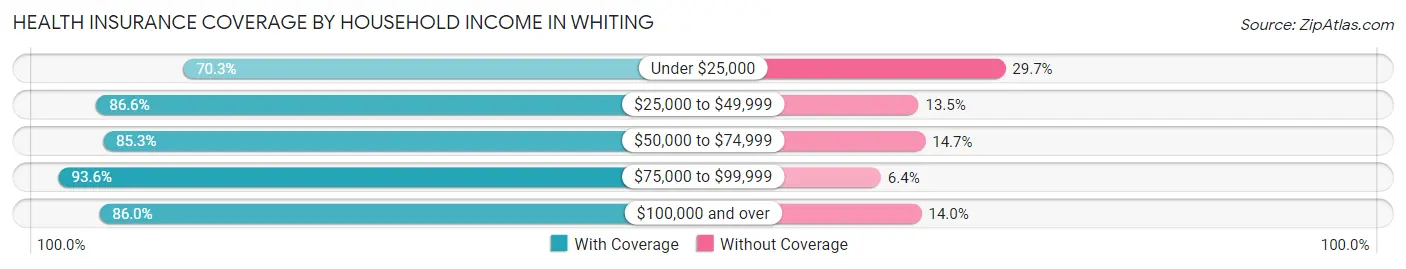
| Household Income | With Coverage | Without Coverage |
| Under $25,000 | 350 (70.3%) | 148 (29.7%) |
| $25,000 to $49,999 | 721 (86.6%) | 112 (13.5%) |
| $50,000 to $74,999 | 696 (85.3%) | 120 (14.7%) |
| $75,000 to $99,999 | 835 (93.6%) | 57 (6.4%) |
| $100,000 and over | 1,320 (86.0%) | 215 (14.0%) |
Public vs Private Health Insurance Coverage by Age in Whiting
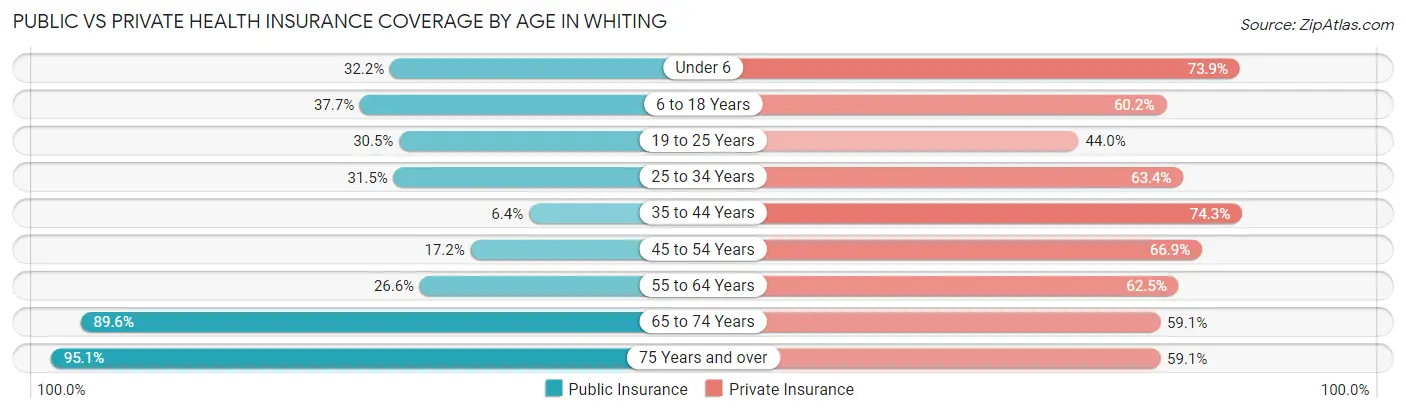
| Age Bracket | Public Insurance | Private Insurance |
| Under 6 | 128 (32.2%) | 294 (73.9%) |
| 6 to 18 Years | 368 (37.7%) | 587 (60.2%) |
| 19 to 25 Years | 131 (30.5%) | 189 (44.0%) |
| 25 to 34 Years | 160 (31.5%) | 322 (63.4%) |
| 35 to 44 Years | 36 (6.4%) | 419 (74.3%) |
| 45 to 54 Years | 90 (17.2%) | 349 (66.9%) |
| 55 to 64 Years | 152 (26.6%) | 357 (62.5%) |
| 65 to 74 Years | 267 (89.6%) | 176 (59.1%) |
| 75 Years and over | 293 (95.1%) | 182 (59.1%) |
| Total | 1,625 (35.5%) | 2,875 (62.9%) |
Disability Status by Sex by Age in Whiting
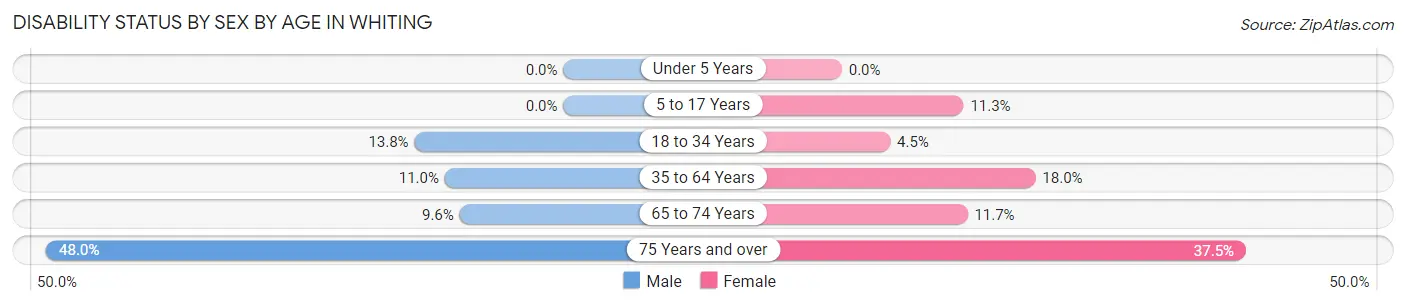
| Age Bracket | Male | Female |
| Under 5 Years | 0 (0.0%) | 0 (0.0%) |
| 5 to 17 Years | 0 (0.0%) | 56 (11.3%) |
| 18 to 34 Years | 63 (13.8%) | 26 (4.5%) |
| 35 to 64 Years | 88 (11.0%) | 154 (18.0%) |
| 65 to 74 Years | 13 (9.6%) | 19 (11.7%) |
| 75 Years and over | 48 (48.0%) | 78 (37.5%) |
Disability Class by Sex by Age in Whiting
Disability Class: Hearing Difficulty
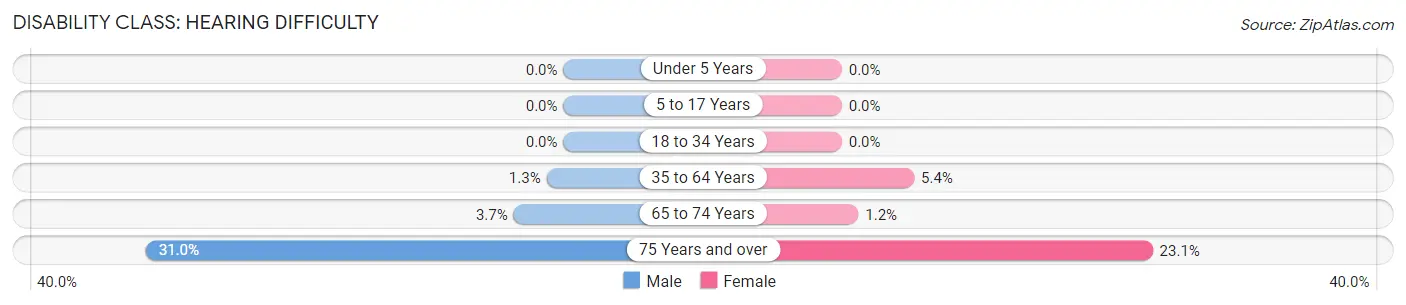
| Age Bracket | Male | Female |
| Under 5 Years | 0 (0.0%) | 0 (0.0%) |
| 5 to 17 Years | 0 (0.0%) | 0 (0.0%) |
| 18 to 34 Years | 0 (0.0%) | 0 (0.0%) |
| 35 to 64 Years | 10 (1.3%) | 46 (5.4%) |
| 65 to 74 Years | 5 (3.7%) | 2 (1.2%) |
| 75 Years and over | 31 (31.0%) | 48 (23.1%) |
Disability Class: Vision Difficulty
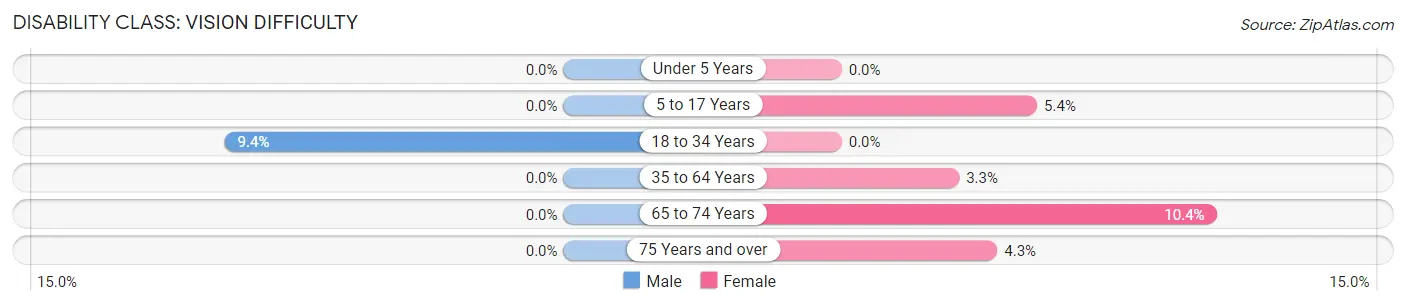
| Age Bracket | Male | Female |
| Under 5 Years | 0 (0.0%) | 0 (0.0%) |
| 5 to 17 Years | 0 (0.0%) | 27 (5.4%) |
| 18 to 34 Years | 43 (9.4%) | 0 (0.0%) |
| 35 to 64 Years | 0 (0.0%) | 28 (3.3%) |
| 65 to 74 Years | 0 (0.0%) | 17 (10.4%) |
| 75 Years and over | 0 (0.0%) | 9 (4.3%) |
Disability Class: Cognitive Difficulty
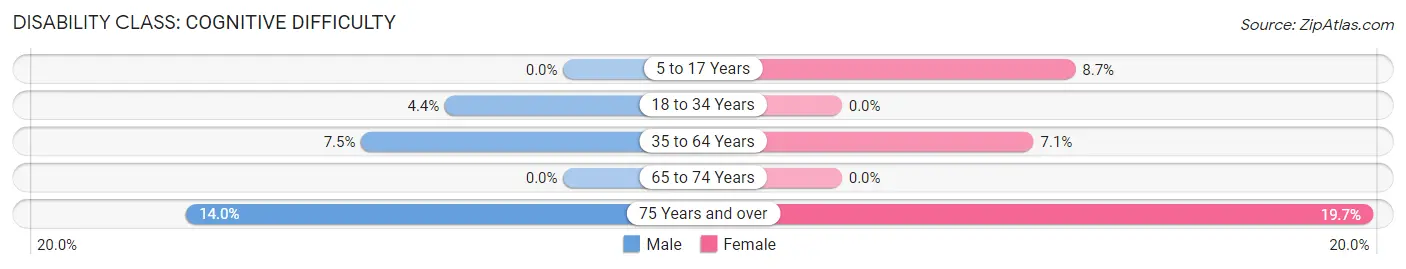
| Age Bracket | Male | Female |
| 5 to 17 Years | 0 (0.0%) | 43 (8.7%) |
| 18 to 34 Years | 20 (4.4%) | 0 (0.0%) |
| 35 to 64 Years | 60 (7.5%) | 61 (7.1%) |
| 65 to 74 Years | 0 (0.0%) | 0 (0.0%) |
| 75 Years and over | 14 (14.0%) | 41 (19.7%) |
Disability Class: Ambulatory Difficulty
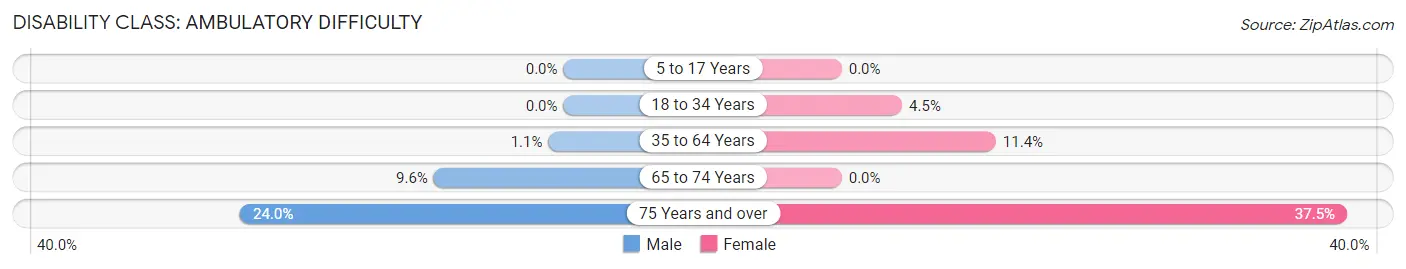
| Age Bracket | Male | Female |
| 5 to 17 Years | 0 (0.0%) | 0 (0.0%) |
| 18 to 34 Years | 0 (0.0%) | 26 (4.5%) |
| 35 to 64 Years | 9 (1.1%) | 98 (11.4%) |
| 65 to 74 Years | 13 (9.6%) | 0 (0.0%) |
| 75 Years and over | 24 (24.0%) | 78 (37.5%) |
Disability Class: Self-Care Difficulty
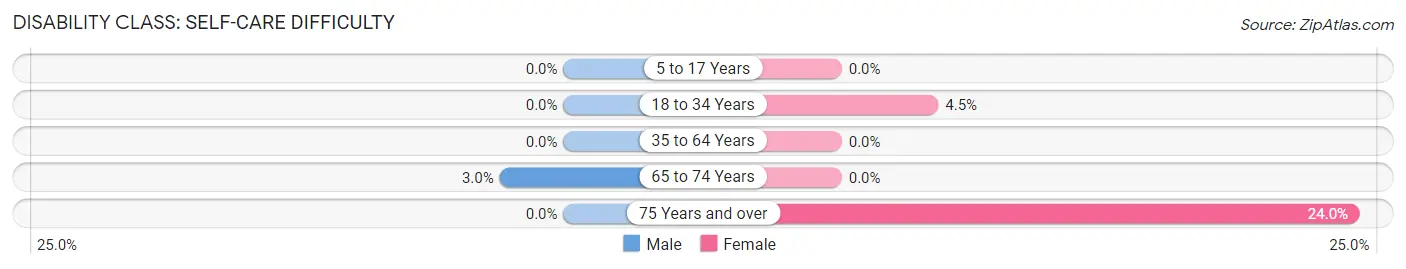
| Age Bracket | Male | Female |
| 5 to 17 Years | 0 (0.0%) | 0 (0.0%) |
| 18 to 34 Years | 0 (0.0%) | 26 (4.5%) |
| 35 to 64 Years | 0 (0.0%) | 0 (0.0%) |
| 65 to 74 Years | 4 (3.0%) | 0 (0.0%) |
| 75 Years and over | 0 (0.0%) | 50 (24.0%) |
Technology Access in Whiting
Computing Device Access in Whiting
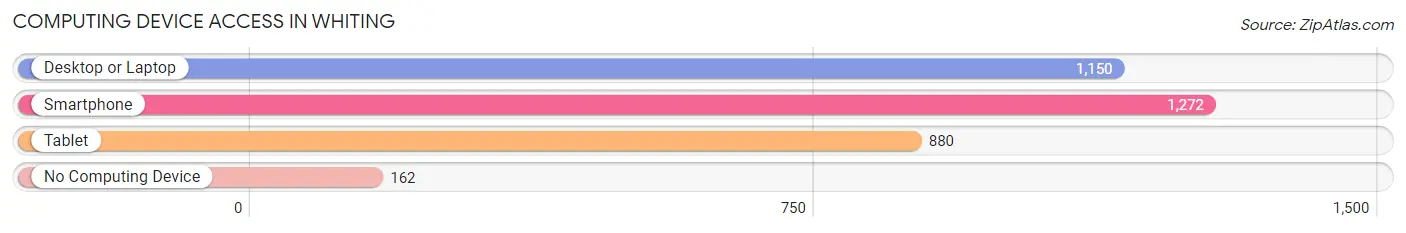
| Device Type | # Households | % Households |
| Desktop or Laptop | 1,150 | 72.8% |
| Smartphone | 1,272 | 80.5% |
| Tablet | 880 | 55.7% |
| No Computing Device | 162 | 10.2% |
| Total | 1,580 | 100.0% |
Internet Access in Whiting
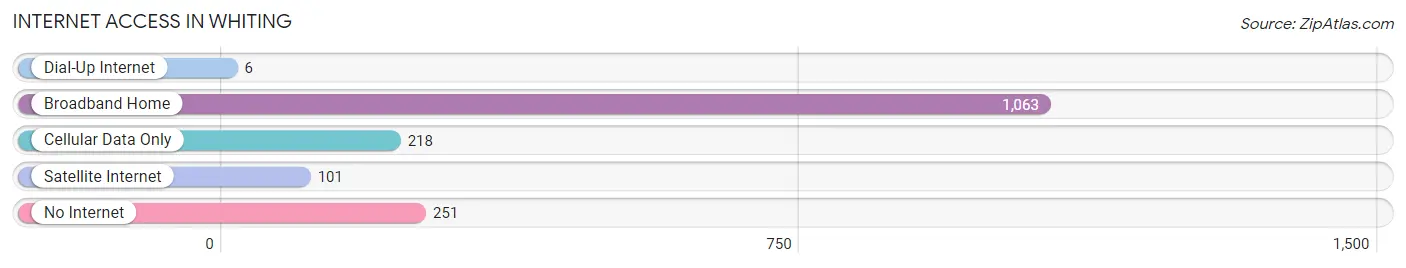
| Internet Type | # Households | % Households |
| Dial-Up Internet | 6 | 0.4% |
| Broadband Home | 1,063 | 67.3% |
| Cellular Data Only | 218 | 13.8% |
| Satellite Internet | 101 | 6.4% |
| No Internet | 251 | 15.9% |
| Total | 1,580 | 100.0% |
Whiting Summary
Whiting, Indiana is a city located in Lake County, Indiana, United States. It is part of the Chicago metropolitan area and is located on the southern shore of Lake Michigan. The population was 4,997 at the 2010 census.
History
Whiting was founded in 1889 by oil magnate John D. Rockefeller. He named the city after his friend, industrialist and philanthropist Charles Whiting. The city was incorporated in 1895.
Whiting was once a major industrial center, with the Standard Oil Company, the Whiting Refinery, and the Whiting Rolling Mill all located in the city. The Whiting Refinery was the largest oil refinery in the world at the time of its construction in 1889. The refinery was the first to use the "cracking" process, which allowed for the production of higher-grade gasoline from crude oil. The refinery was also the first to use the "catalytic cracking" process, which allowed for the production of higher-grade gasoline from crude oil.
The Whiting Rolling Mill was the largest steel mill in the world at the time of its construction in 1889. The mill was the first to use the "open hearth" process, which allowed for the production of higher-grade steel from scrap metal. The mill was also the first to use the "continuous casting" process, which allowed for the production of higher-grade steel from scrap metal.
The city was also home to the Whiting Brothers Manufacturing Company, which produced a variety of products, including bicycles, automobiles, and farm equipment. The company was founded in 1891 and closed in the late 1950s.
Geography
Whiting is located at 41°37′N 87°30′W (41.619, -87.500). According to the 2010 census, the city has a total area of 2.2 square miles (5.7 km2), all land.
Economy
Whiting is home to a variety of businesses, including manufacturing, retail, and service industries. The city is also home to the Whiting Refinery, which is the largest oil refinery in the United States. The refinery is owned by BP and produces gasoline, diesel, jet fuel, and other petroleum products.
The city is also home to the Whiting Rolling Mill, which is the largest steel mill in the United States. The mill is owned by ArcelorMittal and produces steel products for the automotive, construction, and energy industries.
Demographics
As of the 2010 census, there were 4,997 people, 2,072 households, and 1,213 families residing in the city. The population density was 2,269.2 people per square mile (876.3/km2). There were 2,307 housing units at an average density of 1,039.2 per square mile (400.7/km2). The racial makeup of the city was 87.2% White, 5.3% African American, 0.3% Native American, 1.2% Asian, 0.1% Pacific Islander, 3.7% from other races, and 2.4% from two or more races. Hispanic or Latino of any race were 8.7% of the population.
There were 2,072 households, out of which 25.2% had children under the age of 18 living with them, 38.2% were married couples living together, 14.7% had a female householder with no husband present, and 41.7% were non-families. 35.2% of all households were made up of individuals, and 14.2% had someone living alone who was 65 years of age or older. The average household size was 2.37 and the average family size was 3.09.
In the city, the population was spread out, with 23.2% under the age of 18, 8.2% from 18 to 24, 28.2% from 25 to 44, 24.2% from 45 to 64, and 16.2% who were 65 years of age or older. The median age was 38 years. For every 100 females, there were 93.2 males. For every 100 females age 18 and over, there were 89.3 males.
The median income for a household in the city was $37,917, and the median income for a family was $45,938. Males had a median income of $37,917 versus $25,938 for females. The per capita income for the city was $19,945. About 8.2% of families and 10.2% of the population were below the poverty line, including 14.2% of those under age 18 and 8.2% of those age 65 or over.
Common Questions
What is the Total Population of Whiting?
Total Population of Whiting is 4,574.
What is the Total Male Population of Whiting?
Total Male Population of Whiting is 2,135.
What is the Total Female Population of Whiting?
Total Female Population of Whiting is 2,439.
What is the Ratio of Males per 100 Females in Whiting?
There are 87.54 Males per 100 Females in Whiting.
What is the Ratio of Females per 100 Males in Whiting?
There are 114.24 Females per 100 Males in Whiting.
What is the Median Population Age in Whiting?
Median Population Age in Whiting is 34.6 Years.
What is the Average Family Size in Whiting
Average Family Size in Whiting is 3.4 People.
What is the Average Household Size in Whiting
Average Household Size in Whiting is 2.9 People.
What is Per Capita Income in Whiting?
Per Capita income in Whiting is $29,836.
What is the Median Family Income in Whiting?
Median Family Income in Whiting is $72,422.
What is the Median Household income in Whiting?
Median Household Income in Whiting is $59,740.
What is Income or Wage Gap in Whiting?
Income or Wage Gap in Whiting is 36.9%.
Women in Whiting earn 63.1 cents for every dollar earned by a man.
What is Inequality or Gini Index in Whiting?
Inequality or Gini Index in Whiting is 0.47.
How Large is the Labor Force in Whiting?
There are 2,046 People in the Labor Forcein in Whiting.
What is the Percentage of People in the Labor Force in Whiting?
58.3% of People are in the Labor Force in Whiting.
What is the Unemployment Rate in Whiting?
Unemployment Rate in Whiting is 8.9%.