Cities with the Highest Percentage of Population with a Degree in Physical and Health Sciences in Oklahoma
RELATED REPORTS & OPTIONS
Physical and Health Sciences
Oklahoma
Compare Cities
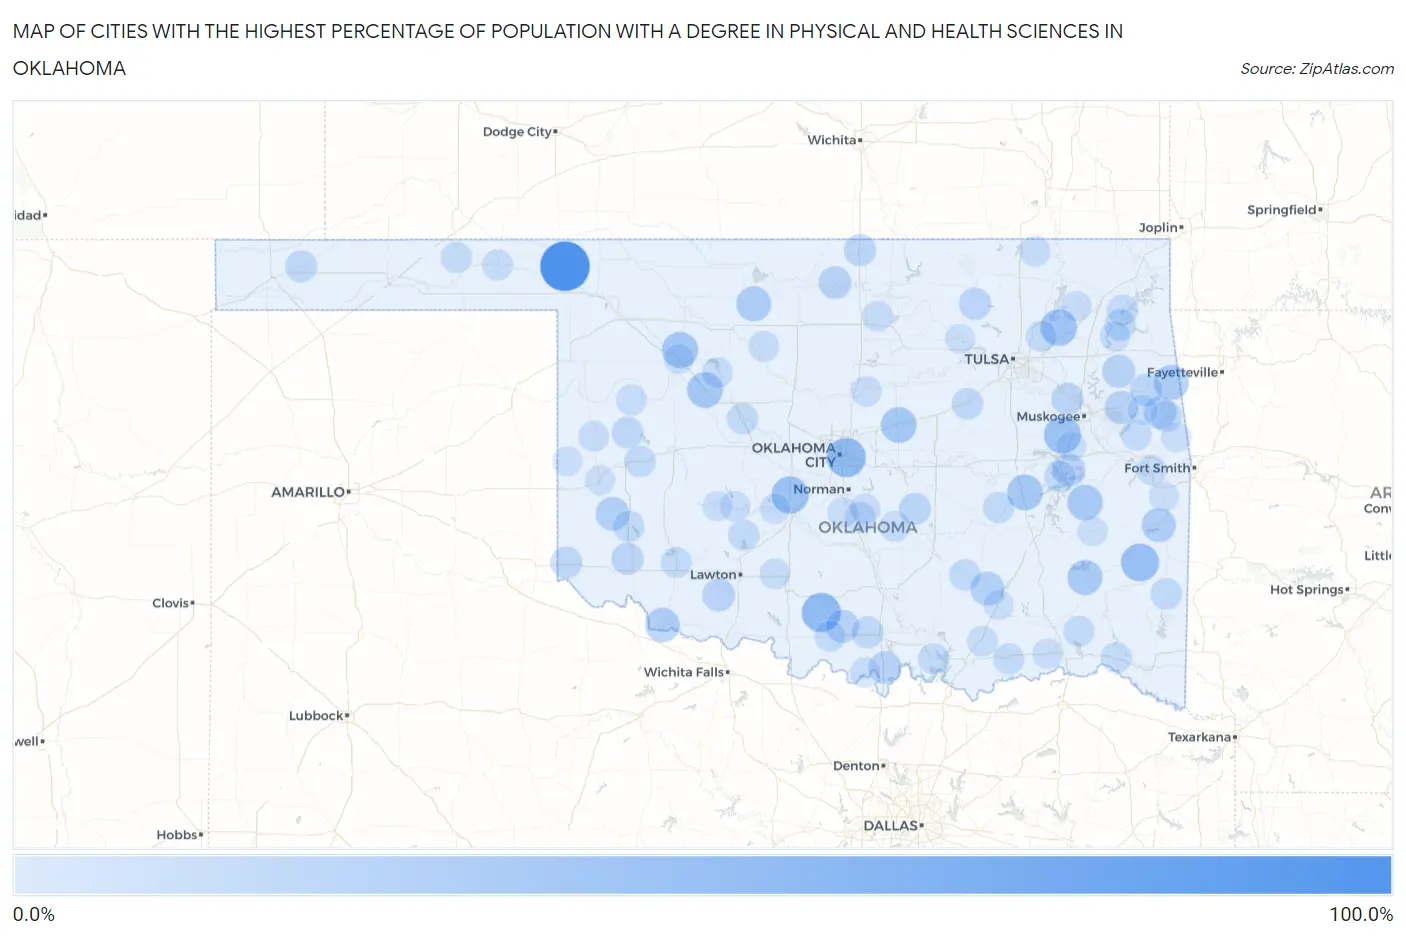
Map of Cities with the Highest Percentage of Population with a Degree in Physical and Health Sciences in Oklahoma
0.0%
100.0%
Cities with the Highest Percentage of Population with a Degree in Physical and Health Sciences in Oklahoma
| City | % Graduates | vs State | vs National | |
| 1. | Rosston | 100.0% | 3.1%(+96.9)#1 | 3.1%(+96.9)#22 |
| 2. | Loco | 50.0% | 3.1%(+46.9)#2 | 3.1%(+46.9)#98 |
| 3. | Smith Village | 50.0% | 3.1%(+46.9)#3 | 3.1%(+46.9)#99 |
| 4. | Moyers | 45.5% | 3.1%(+42.4)#4 | 3.1%(+42.4)#115 |
| 5. | Whitesboro | 43.8% | 3.1%(+40.7)#5 | 3.1%(+40.7)#120 |
| 6. | Pocasset | 40.0% | 3.1%(+36.9)#6 | 3.1%(+36.9)#139 |
| 7. | Wainwright | 40.0% | 3.1%(+36.9)#7 | 3.1%(+36.9)#142 |
| 8. | Sequoyah | 38.0% | 3.1%(+35.0)#8 | 3.1%(+34.9)#164 |
| 9. | Chester | 35.7% | 3.1%(+32.6)#9 | 3.1%(+32.6)#187 |
| 10. | Warwick | 33.3% | 3.1%(+30.2)#10 | 3.1%(+30.2)#207 |
| 11. | Hanna | 33.3% | 3.1%(+30.2)#11 | 3.1%(+30.2)#213 |
| 12. | Oakwood | 33.3% | 3.1%(+30.2)#12 | 3.1%(+30.2)#217 |
| 13. | Quinton | 32.6% | 3.1%(+29.5)#13 | 3.1%(+29.5)#224 |
| 14. | Clayton | 30.0% | 3.1%(+26.9)#14 | 3.1%(+26.9)#256 |
| 15. | Haywood | 30.0% | 3.1%(+26.9)#15 | 3.1%(+26.9)#261 |
| 16. | Helena | 29.8% | 3.1%(+26.7)#16 | 3.1%(+26.7)#265 |
| 17. | Old Green | 29.8% | 3.1%(+26.7)#17 | 3.1%(+26.7)#266 |
| 18. | Davidson | 27.8% | 3.1%(+24.7)#18 | 3.1%(+24.7)#304 |
| 19. | Mcbride | 27.3% | 3.1%(+24.2)#19 | 3.1%(+24.2)#314 |
| 20. | Wister | 26.3% | 3.1%(+23.2)#20 | 3.1%(+23.2)#336 |
| 21. | Willow | 25.0% | 3.1%(+21.9)#21 | 3.1%(+21.9)#378 |
| 22. | Cottonwood | 25.0% | 3.1%(+21.9)#22 | 3.1%(+21.9)#382 |
| 23. | Phillips | 25.0% | 3.1%(+21.9)#23 | 3.1%(+21.9)#384 |
| 24. | Peckham | 25.0% | 3.1%(+21.9)#24 | 3.1%(+21.9)#390 |
| 25. | Peggs | 22.1% | 3.1%(+19.0)#25 | 3.1%(+19.0)#468 |
| 26. | Zeb | 22.1% | 3.1%(+19.0)#26 | 3.1%(+19.0)#470 |
| 27. | Healdton | 21.0% | 3.1%(+17.9)#27 | 3.1%(+17.9)#507 |
| 28. | Lyons Switch | 20.8% | 3.1%(+17.7)#28 | 3.1%(+17.7)#514 |
| 29. | Texanna | 20.7% | 3.1%(+17.6)#29 | 3.1%(+17.6)#516 |
| 30. | Marietta | 20.0% | 3.1%(+16.9)#30 | 3.1%(+16.9)#532 |
| 31. | Tonkawa Tribal Housing | 20.0% | 3.1%(+16.9)#31 | 3.1%(+16.9)#539 |
| 32. | Lamont | 20.0% | 3.1%(+16.9)#32 | 3.1%(+16.9)#541 |
| 33. | Faxon | 20.0% | 3.1%(+16.9)#33 | 3.1%(+16.9)#555 |
| 34. | Eldon | 18.4% | 3.1%(+15.3)#34 | 3.1%(+15.3)#622 |
| 35. | Porter | 16.7% | 3.1%(+13.6)#35 | 3.1%(+13.6)#719 |
| 36. | Wynona | 16.7% | 3.1%(+13.6)#36 | 3.1%(+13.6)#724 |
| 37. | Braman | 16.7% | 3.1%(+13.6)#37 | 3.1%(+13.6)#735 |
| 38. | Martha | 16.7% | 3.1%(+13.6)#38 | 3.1%(+13.6)#737 |
| 39. | St Louis | 16.7% | 3.1%(+13.6)#39 | 3.1%(+13.6)#743 |
| 40. | Keyes | 15.8% | 3.1%(+12.7)#40 | 3.1%(+12.7)#801 |
| 41. | Lone Grove | 15.7% | 3.1%(+12.6)#41 | 3.1%(+12.6)#803 |
| 42. | Hollis | 15.5% | 3.1%(+12.4)#42 | 3.1%(+12.4)#817 |
| 43. | Hammon | 15.2% | 3.1%(+12.1)#43 | 3.1%(+12.1)#854 |
| 44. | Bristow | 14.8% | 3.1%(+11.7)#44 | 3.1%(+11.7)#890 |
| 45. | Cherry Tree | 14.3% | 3.1%(+11.2)#45 | 3.1%(+11.2)#948 |
| 46. | Spavinaw | 14.3% | 3.1%(+11.2)#46 | 3.1%(+11.2)#951 |
| 47. | Tupelo | 14.3% | 3.1%(+11.2)#47 | 3.1%(+11.2)#952 |
| 48. | Greenfield | 14.3% | 3.1%(+11.2)#48 | 3.1%(+11.2)#970 |
| 49. | Smithville | 14.3% | 3.1%(+11.2)#49 | 3.1%(+11.2)#972 |
| 50. | Canute | 13.7% | 3.1%(+10.6)#50 | 3.1%(+10.6)#1,016 |
| 51. | Eufaula | 13.7% | 3.1%(+10.6)#51 | 3.1%(+10.6)#1,020 |
| 52. | Lamar | 13.3% | 3.1%(+10.2)#52 | 3.1%(+10.2)#1,056 |
| 53. | Granite | 13.1% | 3.1%(+10.0)#53 | 3.1%(+10.0)#1,082 |
| 54. | Lowrey | 13.0% | 3.1%(+9.95)#54 | 3.1%(+9.94)#1,093 |
| 55. | Bennington | 13.0% | 3.1%(+9.95)#55 | 3.1%(+9.94)#1,094 |
| 56. | Kingston | 12.9% | 3.1%(+9.78)#56 | 3.1%(+9.77)#1,119 |
| 57. | Turpin | 12.8% | 3.1%(+9.73)#57 | 3.1%(+9.72)#1,123 |
| 58. | Apache | 12.5% | 3.1%(+9.40)#58 | 3.1%(+9.40)#1,154 |
| 59. | Grand Lake Towne | 12.5% | 3.1%(+9.40)#59 | 3.1%(+9.40)#1,160 |
| 60. | Limestone | 12.2% | 3.1%(+9.07)#60 | 3.1%(+9.06)#1,199 |
| 61. | Rattan | 12.1% | 3.1%(+9.03)#61 | 3.1%(+9.02)#1,204 |
| 62. | Cornish | 12.0% | 3.1%(+8.90)#62 | 3.1%(+8.90)#1,221 |
| 63. | Mountain Park | 11.6% | 3.1%(+8.53)#63 | 3.1%(+8.53)#1,276 |
| 64. | Evening Shade | 11.4% | 3.1%(+8.29)#64 | 3.1%(+8.28)#1,315 |
| 65. | Valliant | 11.2% | 3.1%(+8.14)#65 | 3.1%(+8.14)#1,335 |
| 66. | Wann | 11.1% | 3.1%(+8.02)#66 | 3.1%(+8.01)#1,363 |
| 67. | Caddo | 10.9% | 3.1%(+7.76)#67 | 3.1%(+7.76)#1,401 |
| 68. | Cheyenne | 10.8% | 3.1%(+7.75)#68 | 3.1%(+7.74)#1,404 |
| 69. | Beaver | 10.8% | 3.1%(+7.73)#69 | 3.1%(+7.73)#1,410 |
| 70. | Leedey | 10.5% | 3.1%(+7.43)#70 | 3.1%(+7.43)#1,465 |
| 71. | Wanette | 10.5% | 3.1%(+7.43)#71 | 3.1%(+7.43)#1,470 |
| 72. | Ames | 10.5% | 3.1%(+7.43)#72 | 3.1%(+7.43)#1,471 |
| 73. | Lexington | 10.3% | 3.1%(+7.23)#73 | 3.1%(+7.23)#1,518 |
| 74. | Canton | 10.2% | 3.1%(+7.07)#74 | 3.1%(+7.07)#1,567 |
| 75. | Central High | 10.2% | 3.1%(+7.07)#75 | 3.1%(+7.06)#1,568 |
| 76. | Red Rock | 10.0% | 3.1%(+6.90)#76 | 3.1%(+6.90)#1,612 |
| 77. | Washington | 9.8% | 3.1%(+6.66)#77 | 3.1%(+6.66)#1,664 |
| 78. | Burneyville | 9.6% | 3.1%(+6.55)#78 | 3.1%(+6.55)#1,687 |
| 79. | Langston | 9.6% | 3.1%(+6.54)#79 | 3.1%(+6.54)#1,692 |
| 80. | Soper | 9.5% | 3.1%(+6.43)#80 | 3.1%(+6.42)#1,724 |
| 81. | Fort Cobb | 9.5% | 3.1%(+6.38)#81 | 3.1%(+6.37)#1,736 |
| 82. | Chelsea | 9.2% | 3.1%(+6.14)#82 | 3.1%(+6.13)#1,807 |
| 83. | Slaughterville | 9.2% | 3.1%(+6.13)#83 | 3.1%(+6.13)#1,811 |
| 84. | Brent | 9.1% | 3.1%(+6.00)#84 | 3.1%(+5.99)#1,839 |
| 85. | Taylor Ferry | 8.9% | 3.1%(+5.85)#85 | 3.1%(+5.85)#1,906 |
| 86. | Verden | 8.9% | 3.1%(+5.83)#86 | 3.1%(+5.83)#1,909 |
| 87. | Wickliffe | 8.7% | 3.1%(+5.60)#87 | 3.1%(+5.60)#1,977 |
| 88. | Cookson | 8.6% | 3.1%(+5.52)#88 | 3.1%(+5.52)#2,014 |
| 89. | Panama | 8.3% | 3.1%(+5.24)#89 | 3.1%(+5.23)#2,096 |
| 90. | Nicut | 8.3% | 3.1%(+5.24)#90 | 3.1%(+5.23)#2,113 |
| 91. | Seiling | 8.1% | 3.1%(+5.04)#91 | 3.1%(+5.04)#2,172 |
| 92. | Sweetwater | 8.0% | 3.1%(+4.90)#92 | 3.1%(+4.90)#2,249 |
| 93. | Wilburton | 8.0% | 3.1%(+4.88)#93 | 3.1%(+4.88)#2,253 |
| 94. | Carnegie | 8.0% | 3.1%(+4.88)#94 | 3.1%(+4.87)#2,257 |
| 95. | Sayre | 7.9% | 3.1%(+4.81)#95 | 3.1%(+4.80)#2,270 |
| 96. | Tenkiller | 7.9% | 3.1%(+4.80)#96 | 3.1%(+4.80)#2,280 |
| 97. | Cleveland | 7.9% | 3.1%(+4.78)#97 | 3.1%(+4.78)#2,286 |
| 98. | Atoka | 7.8% | 3.1%(+4.73)#98 | 3.1%(+4.72)#2,308 |
| 99. | Pickett | 7.8% | 3.1%(+4.72)#99 | 3.1%(+4.71)#2,318 |
| 100. | Rentiesville | 7.7% | 3.1%(+4.60)#100 | 3.1%(+4.59)#2,393 |
Common Questions
What are the Top 10 Cities with the Highest Percentage of Population with a Degree in Physical and Health Sciences in Oklahoma?
Top 10 Cities with the Highest Percentage of Population with a Degree in Physical and Health Sciences in Oklahoma are:
#1
100.0%
#2
50.0%
#3
50.0%
#4
43.8%
#5
40.0%
#6
40.0%
#7
38.0%
#8
35.7%
#9
33.3%
#10
33.3%
What city has the Highest Percentage of Population with a Degree in Physical and Health Sciences in Oklahoma?
Rosston has the Highest Percentage of Population with a Degree in Physical and Health Sciences in Oklahoma with 100.0%.
What is the Percentage of Population with a Degree in Physical and Health Sciences in the State of Oklahoma?
Percentage of Population with a Degree in Physical and Health Sciences in Oklahoma is 3.1%.
What is the Percentage of Population with a Degree in Physical and Health Sciences in the United States?
Percentage of Population with a Degree in Physical and Health Sciences in the United States is 3.1%.