Spring Lake, IN
Spring Lake Map
Spring Lake Overview
224
TOTAL POPULATION
111
MALE POPULATION
113
FEMALE POPULATION
98.23
MALES / 100 FEMALES
101.80
FEMALES / 100 MALES
64.2
MEDIAN AGE
2.6
AVG FAMILY SIZE
1.7
AVG HOUSEHOLD SIZE
$37,222
PER CAPITA INCOME
$91,071
AVG FAMILY INCOME
$43,958
AVG HOUSEHOLD INCOME
9.8%
WAGE / INCOME GAP [ % ]
90.2¢/ $1
WAGE / INCOME GAP [ $ ]
0.40
INEQUALITY / GINI INDEX
103
LABOR FORCE [ PEOPLE ]
46.8%
PERCENT IN LABOR FORCE
4.9%
UNEMPLOYMENT RATE
Spring Lake Area Codes
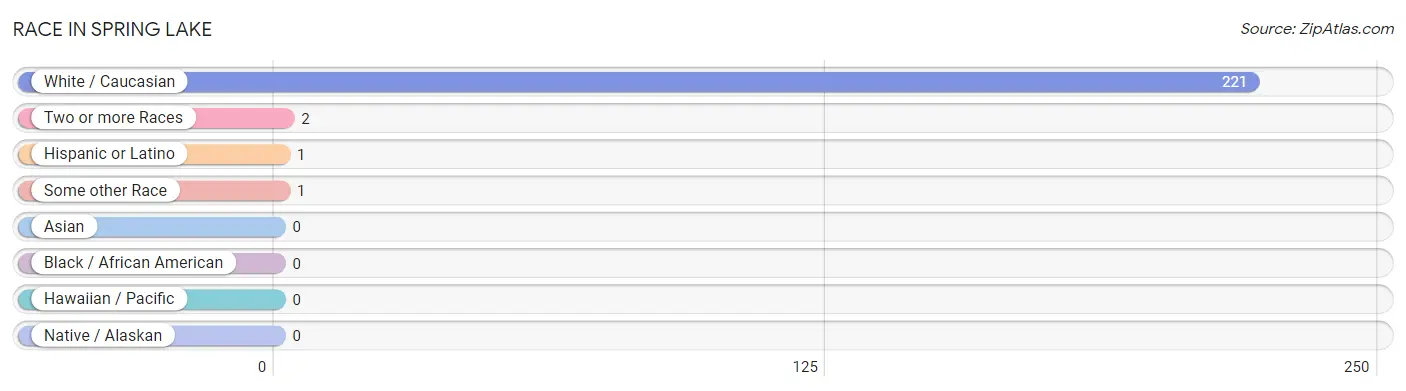
Race in Spring Lake
The most populous races in Spring Lake are White / Caucasian (221 | 98.7%), Two or more Races (2 | 0.9%), and Hispanic or Latino (1 | 0.4%).
| Race | # Population | % Population |
| Asian | 0 | 0.0% |
| Black / African American | 0 | 0.0% |
| Hawaiian / Pacific | 0 | 0.0% |
| Hispanic or Latino | 1 | 0.4% |
| Native / Alaskan | 0 | 0.0% |
| White / Caucasian | 221 | 98.7% |
| Two or more Races | 2 | 0.9% |
| Some other Race | 1 | 0.4% |
| Total | 224 | 100.0% |
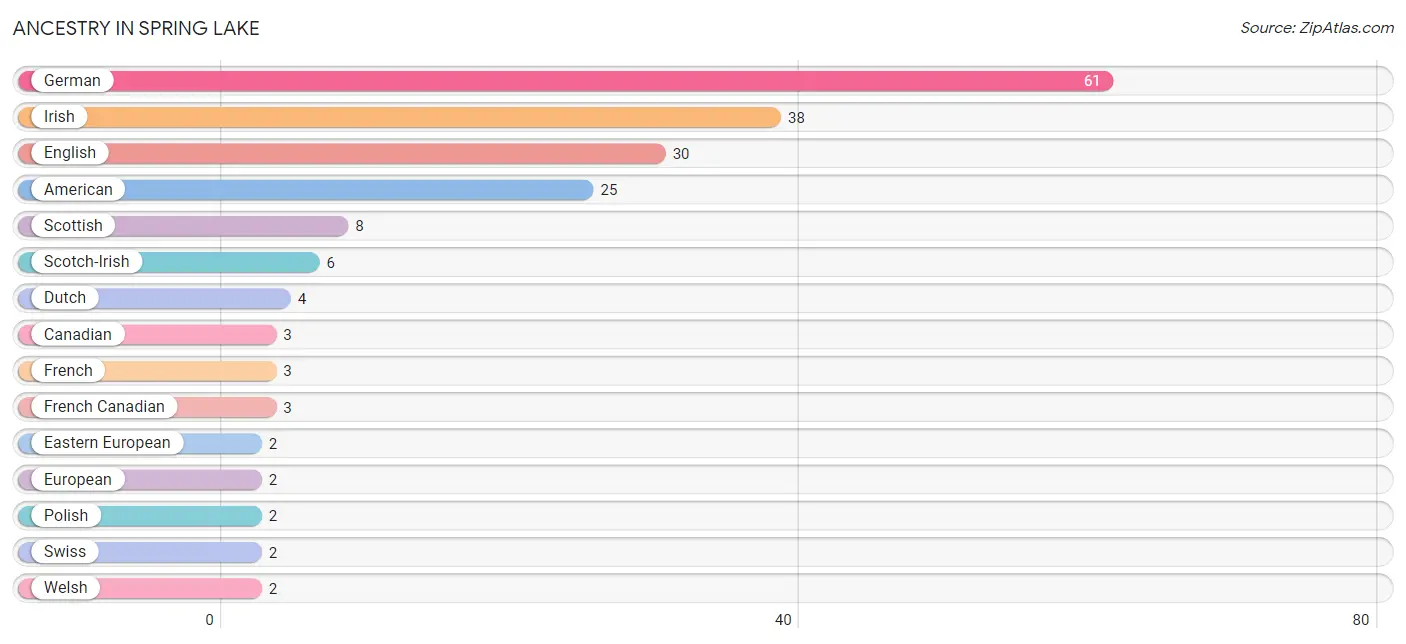
Ancestry in Spring Lake
The most populous ancestries reported in Spring Lake are German (61 | 27.2%), Irish (38 | 17.0%), English (30 | 13.4%), American (25 | 11.2%), and Scottish (8 | 3.6%), together accounting for 72.3% of all Spring Lake residents.
| Ancestry | # Population | % Population |
| American | 25 | 11.2% |
| Canadian | 3 | 1.3% |
| Cuban | 1 | 0.4% |
| Dutch | 4 | 1.8% |
| Eastern European | 2 | 0.9% |
| English | 30 | 13.4% |
| European | 2 | 0.9% |
| French | 3 | 1.3% |
| French Canadian | 3 | 1.3% |
| German | 61 | 27.2% |
| Irish | 38 | 17.0% |
| Polish | 2 | 0.9% |
| Scotch-Irish | 6 | 2.7% |
| Scottish | 8 | 3.6% |
| Swiss | 2 | 0.9% |
| Ukrainian | 1 | 0.4% |
| Welsh | 2 | 0.9% | View All 17 Rows |
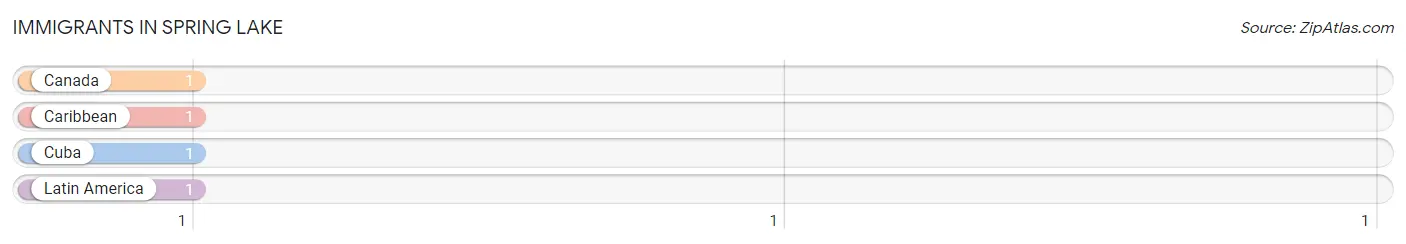
Immigrants in Spring Lake
The most numerous immigrant groups reported in Spring Lake came from Canada (1 | 0.4%), Caribbean (1 | 0.4%), Cuba (1 | 0.4%), and Latin America (1 | 0.4%), together accounting for 1.8% of all Spring Lake residents.
| Immigration Origin | # Population | % Population |
| Canada | 1 | 0.4% |
| Caribbean | 1 | 0.4% |
| Cuba | 1 | 0.4% |
| Latin America | 1 | 0.4% | View All 4 Rows |
Sex and Age in Spring Lake
Sex and Age in Spring Lake
The most populous age groups in Spring Lake are 55 to 59 Years (21 | 18.9%) for men and 65 to 69 Years (41 | 36.3%) for women.
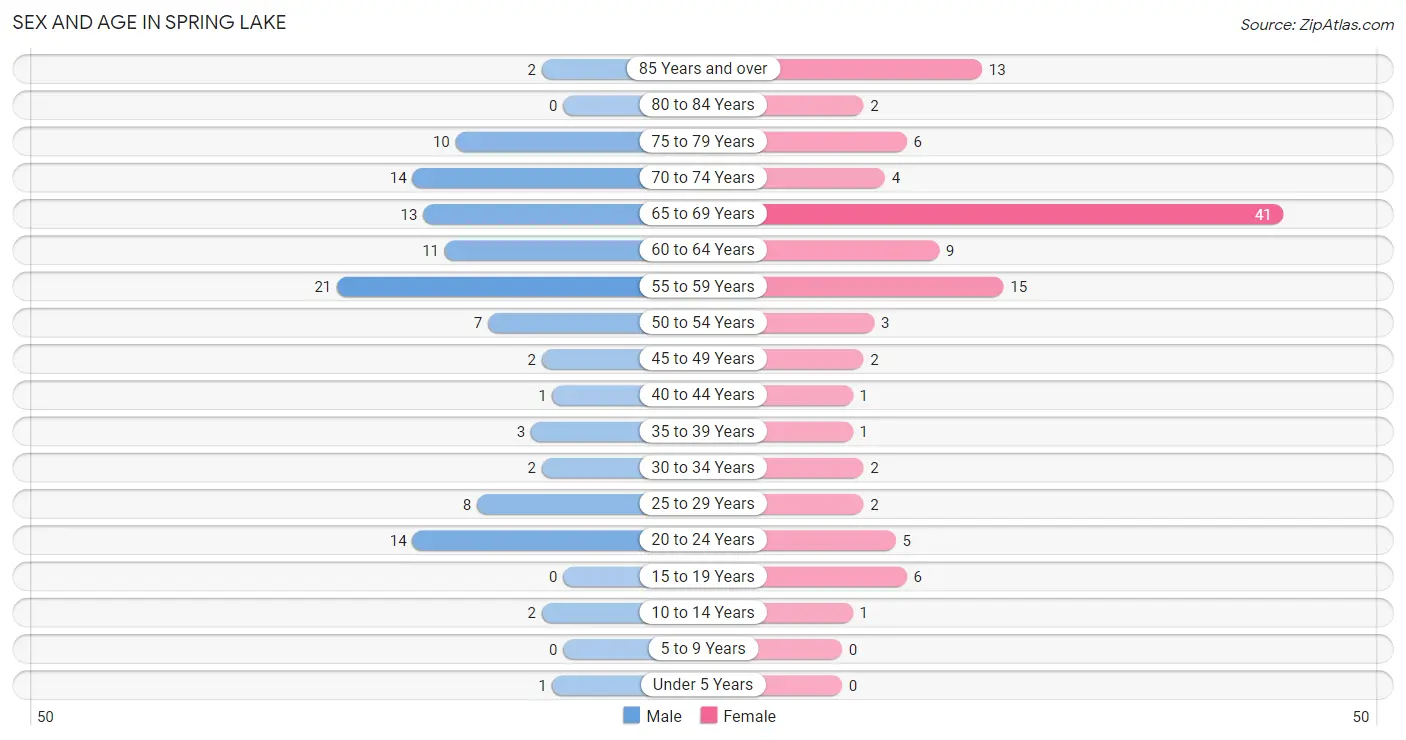
| Age Bracket | Male | Female |
| Under 5 Years | 1 (0.9%) | 0 (0.0%) |
| 5 to 9 Years | 0 (0.0%) | 0 (0.0%) |
| 10 to 14 Years | 2 (1.8%) | 1 (0.9%) |
| 15 to 19 Years | 0 (0.0%) | 6 (5.3%) |
| 20 to 24 Years | 14 (12.6%) | 5 (4.4%) |
| 25 to 29 Years | 8 (7.2%) | 2 (1.8%) |
| 30 to 34 Years | 2 (1.8%) | 2 (1.8%) |
| 35 to 39 Years | 3 (2.7%) | 1 (0.9%) |
| 40 to 44 Years | 1 (0.9%) | 1 (0.9%) |
| 45 to 49 Years | 2 (1.8%) | 2 (1.8%) |
| 50 to 54 Years | 7 (6.3%) | 3 (2.6%) |
| 55 to 59 Years | 21 (18.9%) | 15 (13.3%) |
| 60 to 64 Years | 11 (9.9%) | 9 (8.0%) |
| 65 to 69 Years | 13 (11.7%) | 41 (36.3%) |
| 70 to 74 Years | 14 (12.6%) | 4 (3.5%) |
| 75 to 79 Years | 10 (9.0%) | 6 (5.3%) |
| 80 to 84 Years | 0 (0.0%) | 2 (1.8%) |
| 85 Years and over | 2 (1.8%) | 13 (11.5%) |
| Total | 111 (100.0%) | 113 (100.0%) |
Families and Households in Spring Lake
Median Family Size in Spring Lake
The median family size in Spring Lake is 2.56 persons per family, with married-couple families (43 | 79.6%) accounting for the largest median family size of 2.7 persons per family. On the other hand, single female/mother families (2 | 3.7%) represent the smallest median family size with 1.50 persons per family.
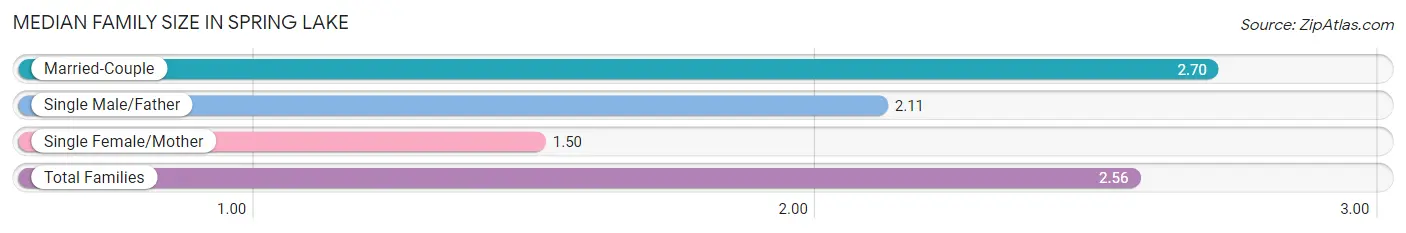
| Family Type | # Families | Family Size |
| Married-Couple | 43 (79.6%) | 2.70 |
| Single Male/Father | 9 (16.7%) | 2.11 |
| Single Female/Mother | 2 (3.7%) | 1.50 |
| Total Families | 54 (100.0%) | 2.56 |
Median Household Size in Spring Lake
The median household size in Spring Lake is 1.71 persons per household, with married-couple households (43 | 32.8%) accounting for the largest median household size of 2.7 persons per household. non-family households (77 | 58.8%) represent the smallest median household size with 1.12 persons per household.
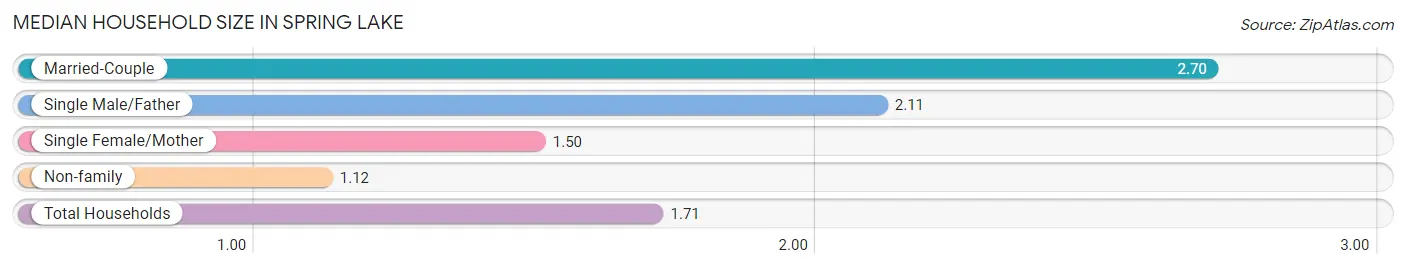
| Household Type | # Households | Household Size |
| Married-Couple | 43 (32.8%) | 2.70 |
| Single Male/Father | 9 (6.9%) | 2.11 |
| Single Female/Mother | 2 (1.5%) | 1.50 |
| Non-family | 77 (58.8%) | 1.12 |
| Total Households | 131 (100.0%) | 1.71 |
Household Size by Marriage Status in Spring Lake
Out of a total of 131 households in Spring Lake, 54 (41.2%) are family households, while 77 (58.8%) are nonfamily households. The most numerous type of family households are 2-person households, comprising 43, and the most common type of nonfamily households are 1-person households, comprising 70.
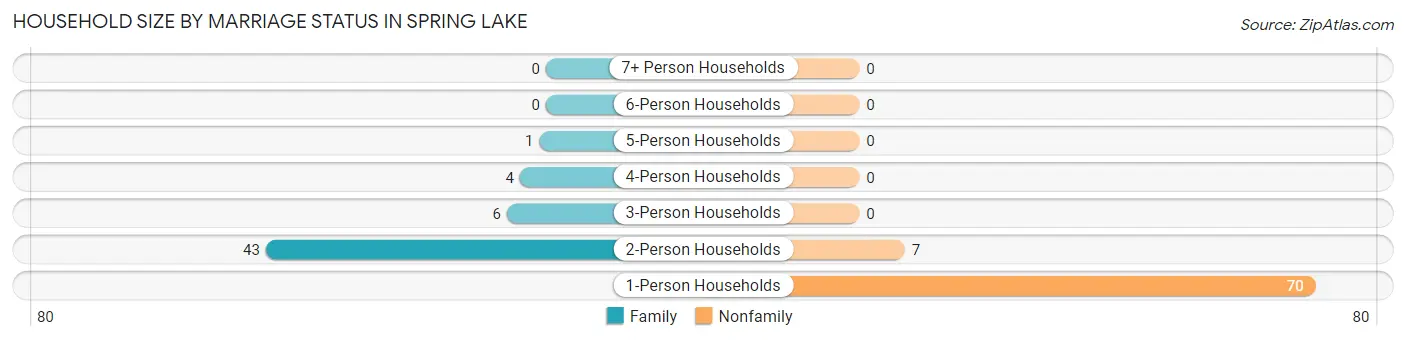
| Household Size | Family Households | Nonfamily Households |
| 1-Person Households | - | 70 (53.4%) |
| 2-Person Households | 43 (32.8%) | 7 (5.3%) |
| 3-Person Households | 6 (4.6%) | 0 (0.0%) |
| 4-Person Households | 4 (3.0%) | 0 (0.0%) |
| 5-Person Households | 1 (0.8%) | 0 (0.0%) |
| 6-Person Households | 0 (0.0%) | 0 (0.0%) |
| 7+ Person Households | 0 (0.0%) | 0 (0.0%) |
| Total | 54 (41.2%) | 77 (58.8%) |
Female Fertility in Spring Lake
Fertility by Age in Spring Lake
| Age Bracket | Women with Births | Births / 1,000 Women |
| 15 to 19 years | 0 (0.0%) | 0.0 |
| 20 to 34 years | 0 (0.0%) | 0.0 |
| 35 to 50 years | 0 (0.0%) | 0.0 |
| Total | 0 (0.0%) | 0.0 |
Fertility by Age by Marriage Status in Spring Lake
| Age Bracket | Married | Unmarried |
| 15 to 19 years | 0 (0.0%) | 0 (0.0%) |
| 20 to 34 years | 0 (0.0%) | 0 (0.0%) |
| 35 to 50 years | 0 (0.0%) | 0 (0.0%) |
| Total | 0 (0.0%) | 0 (0.0%) |
Fertility by Education in Spring Lake
| Educational Attainment | Women with Births | Births / 1,000 Women |
| Less than High School | 0 (0.0%) | 0.0 |
| High School Diploma | 0 (0.0%) | 0.0 |
| College or Associate's Degree | 0 (0.0%) | 0.0 |
| Bachelor's Degree | 0 (0.0%) | 0.0 |
| Graduate Degree | 0 (0.0%) | 0.0 |
| Total | 0 (0.0%) | 0.0 |
Fertility by Education by Marriage Status in Spring Lake
| Educational Attainment | Married | Unmarried |
| Less than High School | 0 (0.0%) | 0 (0.0%) |
| High School Diploma | 0 (0.0%) | 0 (0.0%) |
| College or Associate's Degree | 0 (0.0%) | 0 (0.0%) |
| Bachelor's Degree | 0 (0.0%) | 0 (0.0%) |
| Graduate Degree | 0 (0.0%) | 0 (0.0%) |
| Total | 0 (0.0%) | 0 (0.0%) |
Income in Spring Lake
Income Overview in Spring Lake
Per Capita Income in Spring Lake is $37,222, while median incomes of families and households are $91,071 and $43,958 respectively.
| Characteristic | Number | Measure |
| Per Capita Income | 224 | $37,222 |
| Median Family Income | 54 | $91,071 |
| Mean Family Income | 54 | $95,609 |
| Median Household Income | 131 | $43,958 |
| Mean Household Income | 131 | $61,399 |
| Income Deficit | 54 | $0 |
| Wage / Income Gap (%) | 224 | 9.75% |
| Wage / Income Gap ($) | 224 | 90.25¢ per $1 |
| Gini / Inequality Index | 224 | 0.40 |
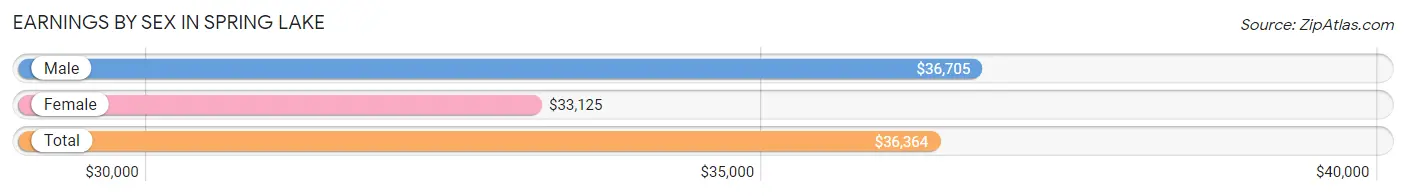
Earnings by Sex in Spring Lake
Average Earnings in Spring Lake are $36,364, $36,705 for men and $33,125 for women, a difference of 9.8%.
| Sex | Number | Average Earnings |
| Male | 69 (65.1%) | $36,705 |
| Female | 37 (34.9%) | $33,125 |
| Total | 106 (100.0%) | $36,364 |
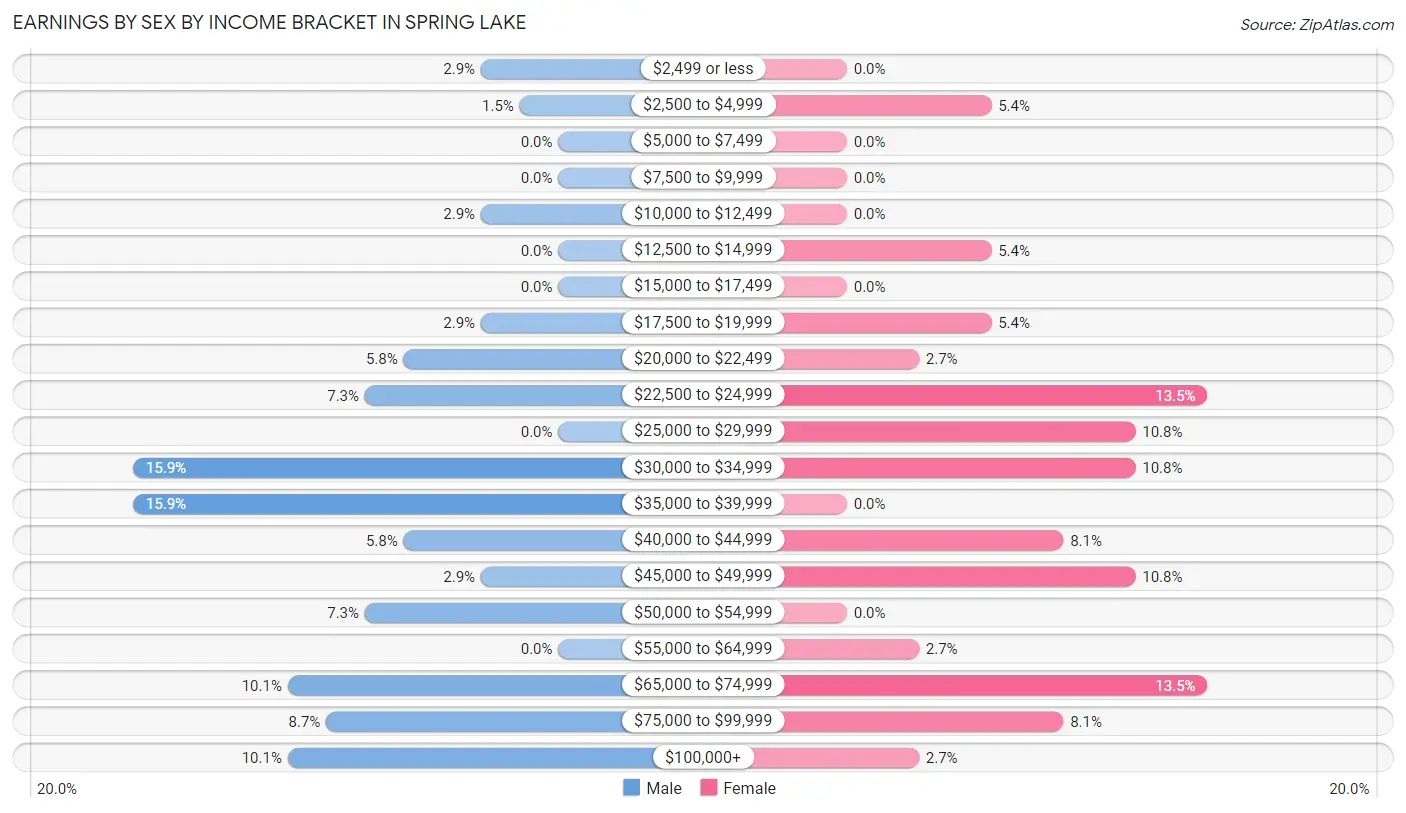
Earnings by Sex by Income Bracket in Spring Lake
The most common earnings brackets in Spring Lake are $30,000 to $34,999 for men (11 | 15.9%) and $22,500 to $24,999 for women (5 | 13.5%).
| Income | Male | Female |
| $2,499 or less | 2 (2.9%) | 0 (0.0%) |
| $2,500 to $4,999 | 1 (1.5%) | 2 (5.4%) |
| $5,000 to $7,499 | 0 (0.0%) | 0 (0.0%) |
| $7,500 to $9,999 | 0 (0.0%) | 0 (0.0%) |
| $10,000 to $12,499 | 2 (2.9%) | 0 (0.0%) |
| $12,500 to $14,999 | 0 (0.0%) | 2 (5.4%) |
| $15,000 to $17,499 | 0 (0.0%) | 0 (0.0%) |
| $17,500 to $19,999 | 2 (2.9%) | 2 (5.4%) |
| $20,000 to $22,499 | 4 (5.8%) | 1 (2.7%) |
| $22,500 to $24,999 | 5 (7.2%) | 5 (13.5%) |
| $25,000 to $29,999 | 0 (0.0%) | 4 (10.8%) |
| $30,000 to $34,999 | 11 (15.9%) | 4 (10.8%) |
| $35,000 to $39,999 | 11 (15.9%) | 0 (0.0%) |
| $40,000 to $44,999 | 4 (5.8%) | 3 (8.1%) |
| $45,000 to $49,999 | 2 (2.9%) | 4 (10.8%) |
| $50,000 to $54,999 | 5 (7.2%) | 0 (0.0%) |
| $55,000 to $64,999 | 0 (0.0%) | 1 (2.7%) |
| $65,000 to $74,999 | 7 (10.1%) | 5 (13.5%) |
| $75,000 to $99,999 | 6 (8.7%) | 3 (8.1%) |
| $100,000+ | 7 (10.1%) | 1 (2.7%) |
| Total | 69 (100.0%) | 37 (100.0%) |
Earnings by Sex by Educational Attainment in Spring Lake
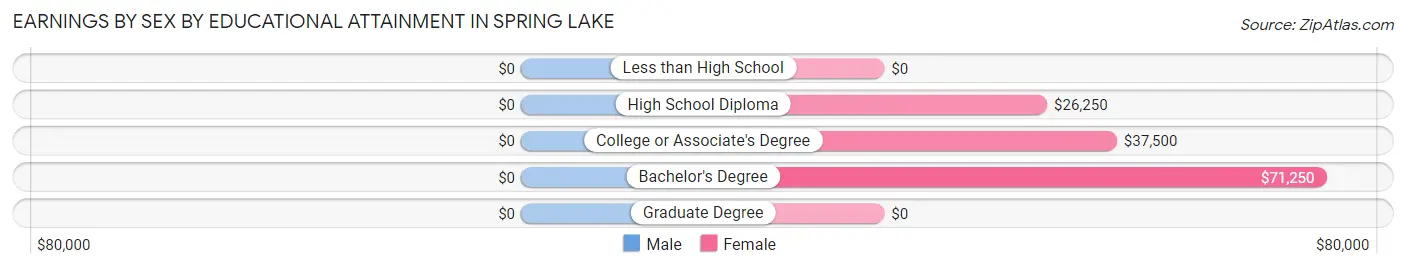
| Educational Attainment | Male Income | Female Income |
| Less than High School | - | - |
| High School Diploma | - | - |
| College or Associate's Degree | - | - |
| Bachelor's Degree | - | - |
| Graduate Degree | - | - |
| Total | - | - |
Family Income in Spring Lake
Family Income Brackets in Spring Lake
According to the Spring Lake family income data, there are 18 families falling into the $75,000 to $99,999 income range, which is the most common income bracket and makes up 33.3% of all families.
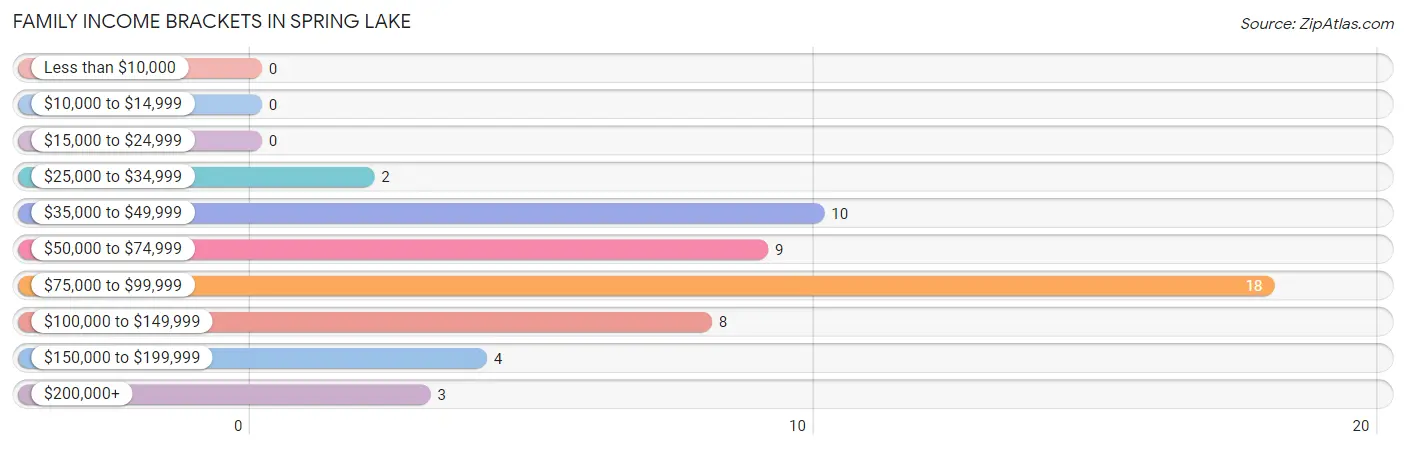
| Income Bracket | # Families | % Families |
| Less than $10,000 | 0 | 0.0% |
| $10,000 to $14,999 | 0 | 0.0% |
| $15,000 to $24,999 | 0 | 0.0% |
| $25,000 to $34,999 | 2 | 3.7% |
| $35,000 to $49,999 | 10 | 18.5% |
| $50,000 to $74,999 | 9 | 16.7% |
| $75,000 to $99,999 | 18 | 33.3% |
| $100,000 to $149,999 | 8 | 14.8% |
| $150,000 to $199,999 | 4 | 7.4% |
| $200,000+ | 3 | 5.6% |
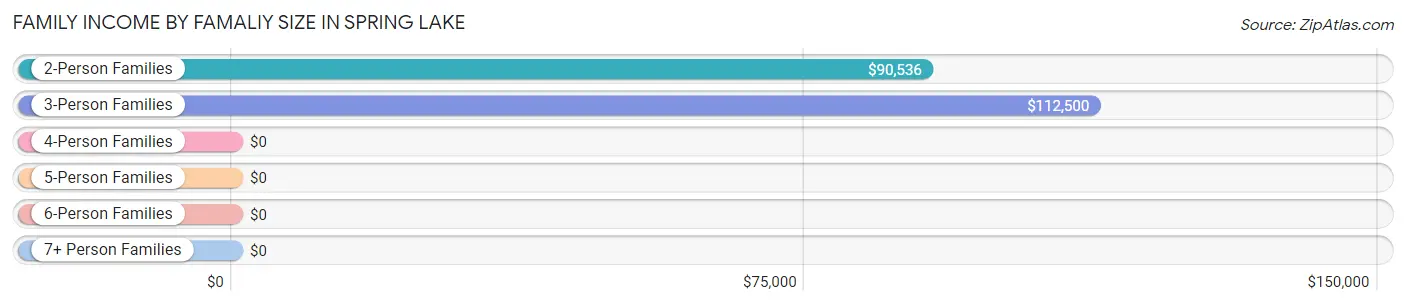
Family Income by Famaliy Size in Spring Lake
3-person families (6 | 11.1%) account for the highest median family income in Spring Lake with $112,500 per family, while 2-person families (43 | 79.6%) have the highest median income of $45,268 per family member.
| Income Bracket | # Families | Median Income |
| 2-Person Families | 43 (79.6%) | $90,536 |
| 3-Person Families | 6 (11.1%) | $112,500 |
| 4-Person Families | 4 (7.4%) | $0 |
| 5-Person Families | 1 (1.8%) | $0 |
| 6-Person Families | 0 (0.0%) | $0 |
| 7+ Person Families | 0 (0.0%) | $0 |
| Total | 54 (100.0%) | $91,071 |
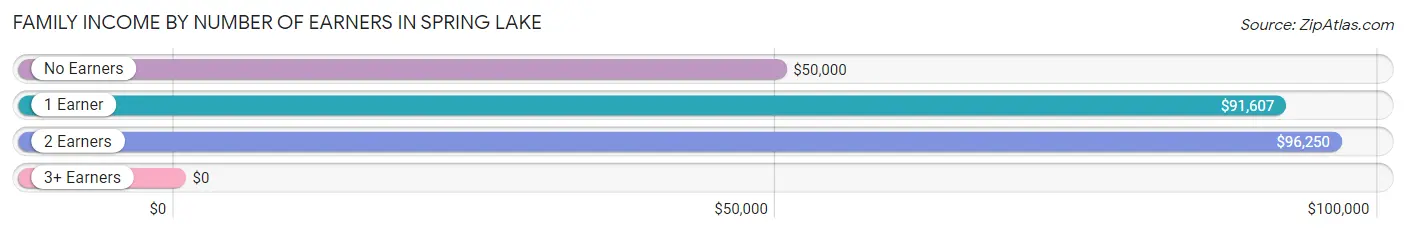
Family Income by Number of Earners in Spring Lake
| Number of Earners | # Families | Median Income |
| No Earners | 14 (25.9%) | $50,000 |
| 1 Earner | 15 (27.8%) | $91,607 |
| 2 Earners | 22 (40.7%) | $96,250 |
| 3+ Earners | 3 (5.6%) | $0 |
| Total | 54 (100.0%) | $91,071 |
Household Income in Spring Lake
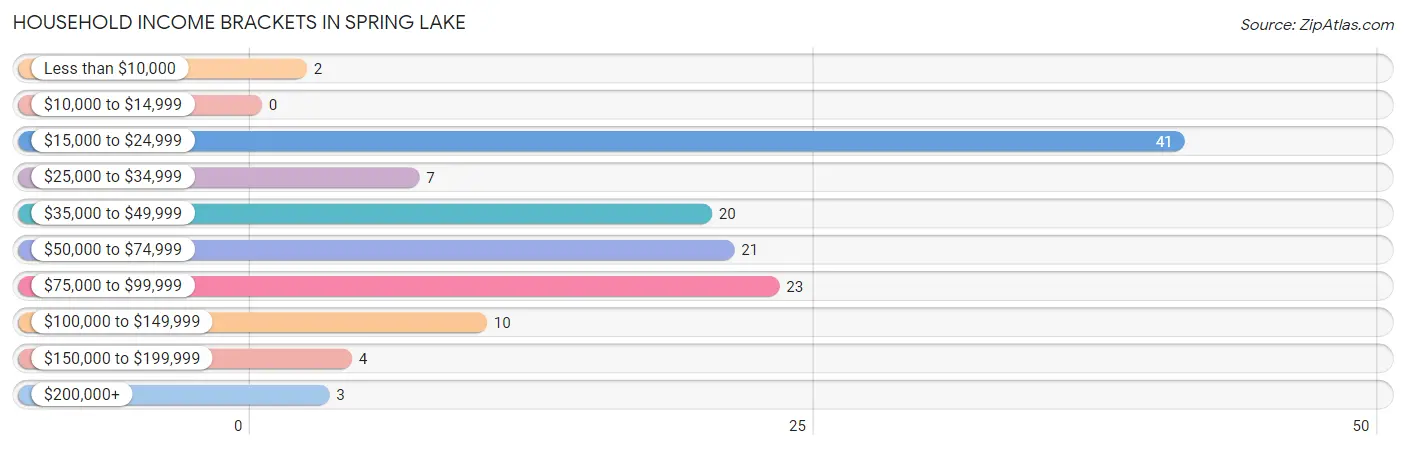
Household Income Brackets in Spring Lake
With 41 households falling in the category, the $15,000 to $24,999 income range is the most frequent in Spring Lake, accounting for 31.3% of all households.
| Income Bracket | # Households | % Households |
| Less than $10,000 | 2 | 1.5% |
| $10,000 to $14,999 | 0 | 0.0% |
| $15,000 to $24,999 | 41 | 31.3% |
| $25,000 to $34,999 | 7 | 5.3% |
| $35,000 to $49,999 | 20 | 15.3% |
| $50,000 to $74,999 | 21 | 16.0% |
| $75,000 to $99,999 | 23 | 17.6% |
| $100,000 to $149,999 | 10 | 7.6% |
| $150,000 to $199,999 | 4 | 3.1% |
| $200,000+ | 3 | 2.3% |
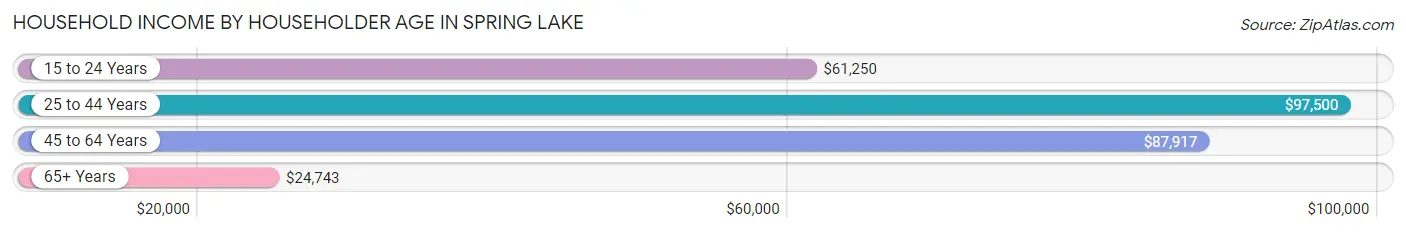
Household Income by Householder Age in Spring Lake
The median household income in Spring Lake is $43,958, with the highest median household income of $97,500 found in the 25 to 44 years age bracket for the primary householder. A total of 6 households (4.6%) fall into this category. Meanwhile, the 65+ years age bracket for the primary householder has the lowest median household income of $24,743, with 79 households (60.3%) in this group.
| Income Bracket | # Households | Median Income |
| 15 to 24 Years | 7 (5.3%) | $61,250 |
| 25 to 44 Years | 6 (4.6%) | $97,500 |
| 45 to 64 Years | 39 (29.8%) | $87,917 |
| 65+ Years | 79 (60.3%) | $24,743 |
| Total | 131 (100.0%) | $43,958 |
Poverty in Spring Lake
Income Below Poverty by Sex and Age in Spring Lake
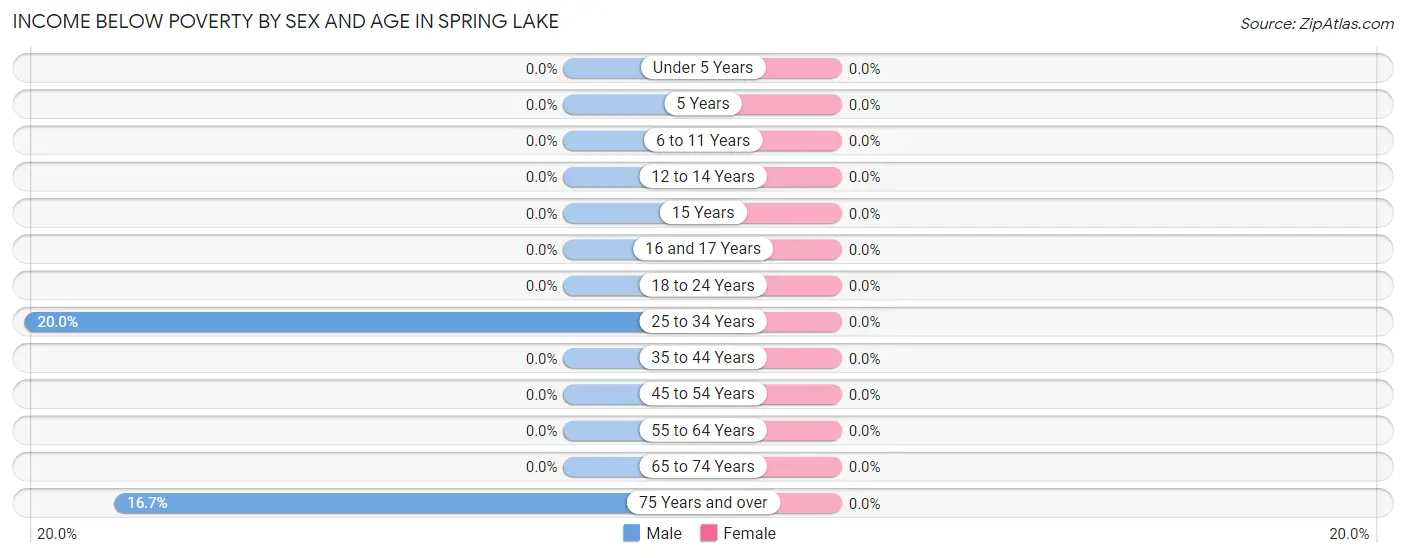
| Age Bracket | Male | Female |
| Under 5 Years | 0 (0.0%) | 0 (0.0%) |
| 5 Years | 0 (0.0%) | 0 (0.0%) |
| 6 to 11 Years | 0 (0.0%) | 0 (0.0%) |
| 12 to 14 Years | 0 (0.0%) | 0 (0.0%) |
| 15 Years | 0 (0.0%) | 0 (0.0%) |
| 16 and 17 Years | 0 (0.0%) | 0 (0.0%) |
| 18 to 24 Years | 0 (0.0%) | 0 (0.0%) |
| 25 to 34 Years | 2 (20.0%) | 0 (0.0%) |
| 35 to 44 Years | 0 (0.0%) | 0 (0.0%) |
| 45 to 54 Years | 0 (0.0%) | 0 (0.0%) |
| 55 to 64 Years | 0 (0.0%) | 0 (0.0%) |
| 65 to 74 Years | 0 (0.0%) | 0 (0.0%) |
| 75 Years and over | 2 (16.7%) | 0 (0.0%) |
| Total | 4 (3.6%) | 0 (0.0%) |
Income Above Poverty by Sex and Age in Spring Lake
According to the poverty statistics in Spring Lake, males aged under 5 years and females aged 6 to 11 years are the age groups that are most secure financially, with 100.0% of males and 100.0% of females in these age groups living above the poverty line.
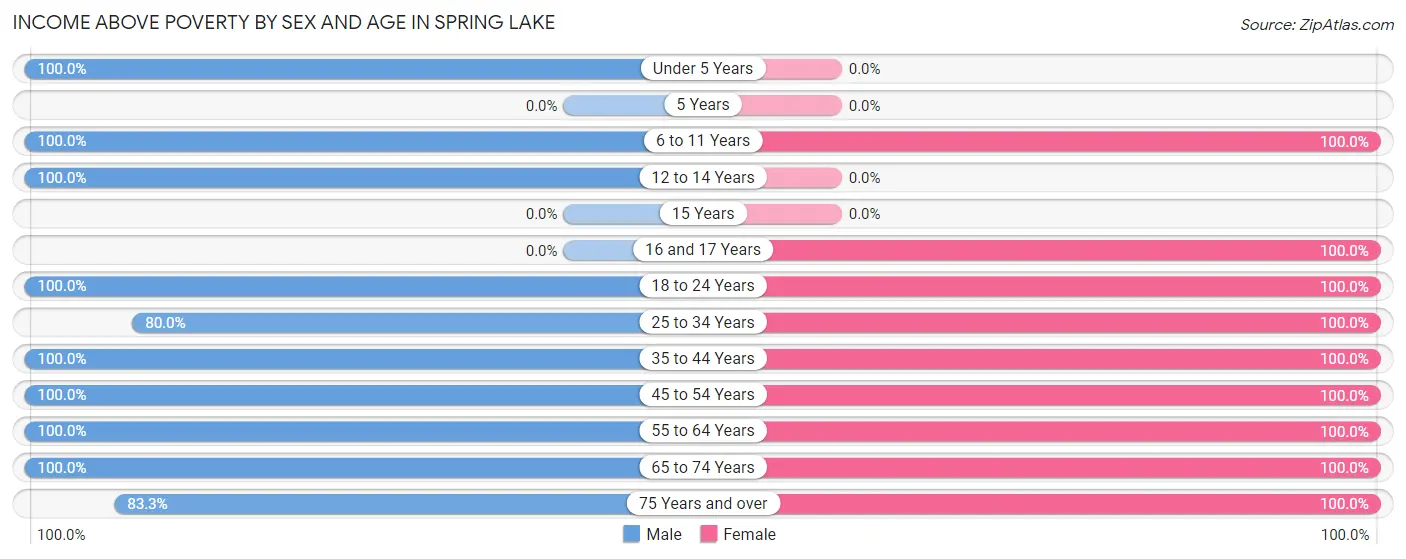
| Age Bracket | Male | Female |
| Under 5 Years | 1 (100.0%) | 0 (0.0%) |
| 5 Years | 0 (0.0%) | 0 (0.0%) |
| 6 to 11 Years | 1 (100.0%) | 1 (100.0%) |
| 12 to 14 Years | 1 (100.0%) | 0 (0.0%) |
| 15 Years | 0 (0.0%) | 0 (0.0%) |
| 16 and 17 Years | 0 (0.0%) | 2 (100.0%) |
| 18 to 24 Years | 14 (100.0%) | 9 (100.0%) |
| 25 to 34 Years | 8 (80.0%) | 4 (100.0%) |
| 35 to 44 Years | 4 (100.0%) | 2 (100.0%) |
| 45 to 54 Years | 9 (100.0%) | 5 (100.0%) |
| 55 to 64 Years | 32 (100.0%) | 24 (100.0%) |
| 65 to 74 Years | 27 (100.0%) | 45 (100.0%) |
| 75 Years and over | 10 (83.3%) | 21 (100.0%) |
| Total | 107 (96.4%) | 113 (100.0%) |
Income Below Poverty Among Married-Couple Families in Spring Lake
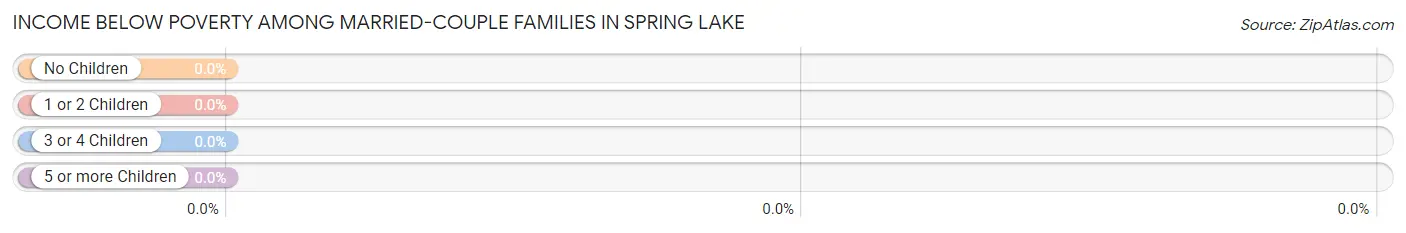
| Children | Above Poverty | Below Poverty |
| No Children | 38 (100.0%) | 0 (0.0%) |
| 1 or 2 Children | 5 (100.0%) | 0 (0.0%) |
| 3 or 4 Children | 0 (0.0%) | 0 (0.0%) |
| 5 or more Children | 0 (0.0%) | 0 (0.0%) |
| Total | 43 (100.0%) | 0 (0.0%) |
Income Below Poverty Among Single-Parent Households in Spring Lake
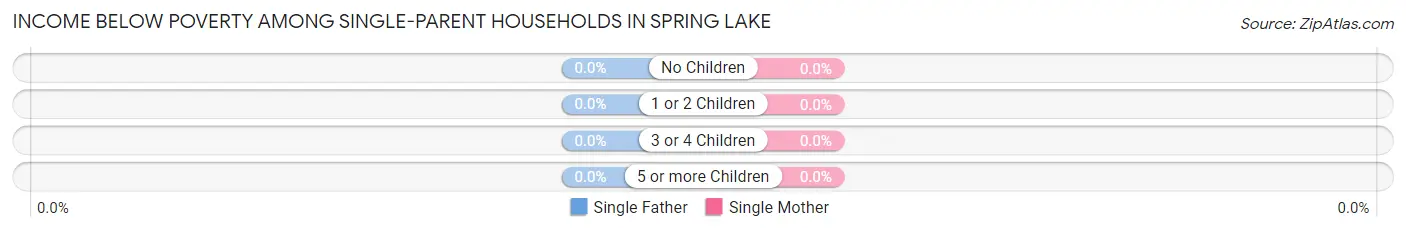
| Children | Single Father | Single Mother |
| No Children | 0 (0.0%) | 0 (0.0%) |
| 1 or 2 Children | 0 (0.0%) | 0 (0.0%) |
| 3 or 4 Children | 0 (0.0%) | 0 (0.0%) |
| 5 or more Children | 0 (0.0%) | 0 (0.0%) |
| Total | 0 (0.0%) | 0 (0.0%) |
Income Below Poverty Among Married-Couple vs Single-Parent Households in Spring Lake
| Children | Married-Couple Families | Single-Parent Households |
| No Children | 0 (0.0%) | 0 (0.0%) |
| 1 or 2 Children | 0 (0.0%) | 0 (0.0%) |
| 3 or 4 Children | 0 (0.0%) | 0 (0.0%) |
| 5 or more Children | 0 (0.0%) | 0 (0.0%) |
| Total | 0 (0.0%) | 0 (0.0%) |
Employment Characteristics in Spring Lake
Employment by Class of Employer in Spring Lake
Among the 97 employed individuals in Spring Lake, private company employees (69 | 71.1%), local government employees (8 | 8.3%), and federal government employees (8 | 8.3%) make up the most common classes of employment.
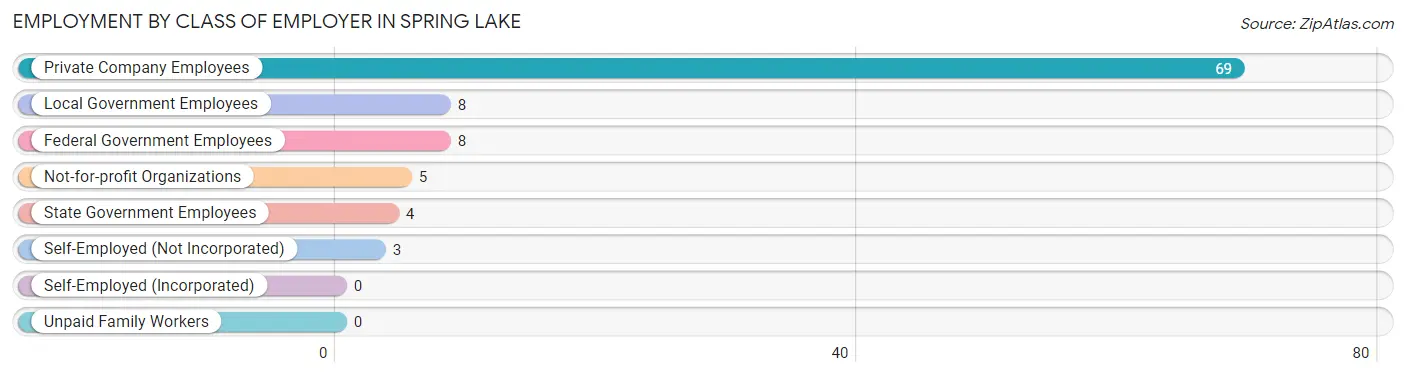
| Employer Class | # Employees | % Employees |
| Private Company Employees | 69 | 71.1% |
| Self-Employed (Incorporated) | 0 | 0.0% |
| Self-Employed (Not Incorporated) | 3 | 3.1% |
| Not-for-profit Organizations | 5 | 5.1% |
| Local Government Employees | 8 | 8.3% |
| State Government Employees | 4 | 4.1% |
| Federal Government Employees | 8 | 8.3% |
| Unpaid Family Workers | 0 | 0.0% |
| Total | 97 | 100.0% |
Employment Status by Age in Spring Lake
According to the labor force statistics for Spring Lake, out of the total population over 16 years of age (220), 46.8% or 103 individuals are in the labor force, with 4.9% or 5 of them unemployed. The age group with the highest labor force participation rate is 20 to 24 years, with 100.0% or 19 individuals in the labor force. Within the labor force, the 65 to 74 years age range has the highest percentage of unemployed individuals, with 20.0% or 2 of them being unemployed.
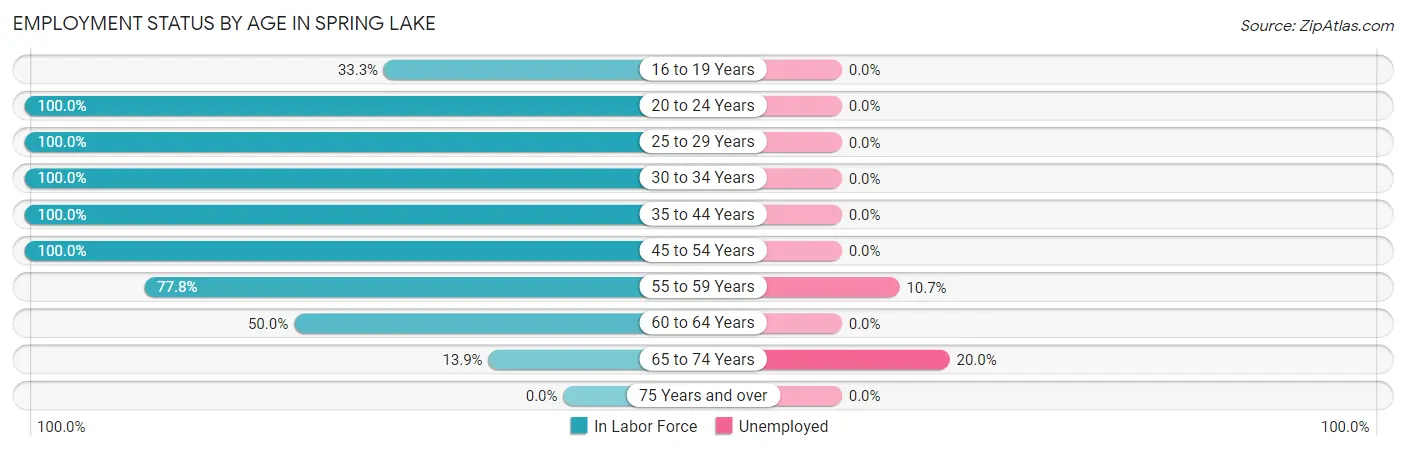
| Age Bracket | In Labor Force | Unemployed |
| 16 to 19 Years | 2 (33.3%) | 0 (0.0%) |
| 20 to 24 Years | 19 (100.0%) | 0 (0.0%) |
| 25 to 29 Years | 10 (100.0%) | 0 (0.0%) |
| 30 to 34 Years | 4 (100.0%) | 0 (0.0%) |
| 35 to 44 Years | 6 (100.0%) | 0 (0.0%) |
| 45 to 54 Years | 14 (100.0%) | 0 (0.0%) |
| 55 to 59 Years | 28 (77.8%) | 3 (10.7%) |
| 60 to 64 Years | 10 (50.0%) | 0 (0.0%) |
| 65 to 74 Years | 10 (13.9%) | 2 (20.0%) |
| 75 Years and over | 0 (0.0%) | 0 (0.0%) |
| Total | 103 (46.8%) | 5 (4.9%) |
Employment Status by Educational Attainment in Spring Lake
According to labor force statistics for Spring Lake, 80.0% of individuals (72) out of the total population between 25 and 64 years of age (90) are in the labor force, with 4.2% or 3 of them being unemployed. The group with the highest labor force participation rate are those with the educational attainment of bachelor's degree or higher, with 94.4% or 17 individuals in the labor force. Within the labor force, individuals with college / associate degree education have the highest percentage of unemployment, with 11.1% or 3 of them being unemployed.
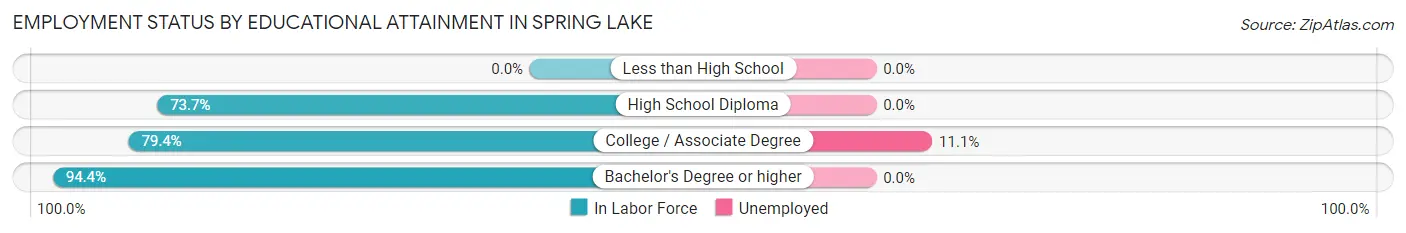
| Educational Attainment | In Labor Force | Unemployed |
| Less than High School | 0 (0.0%) | 0 (0.0%) |
| High School Diploma | 28 (73.7%) | 0 (0.0%) |
| College / Associate Degree | 27 (79.4%) | 4 (11.1%) |
| Bachelor's Degree or higher | 17 (94.4%) | 0 (0.0%) |
| Total | 72 (80.0%) | 4 (4.2%) |
Employment Occupations by Sex in Spring Lake
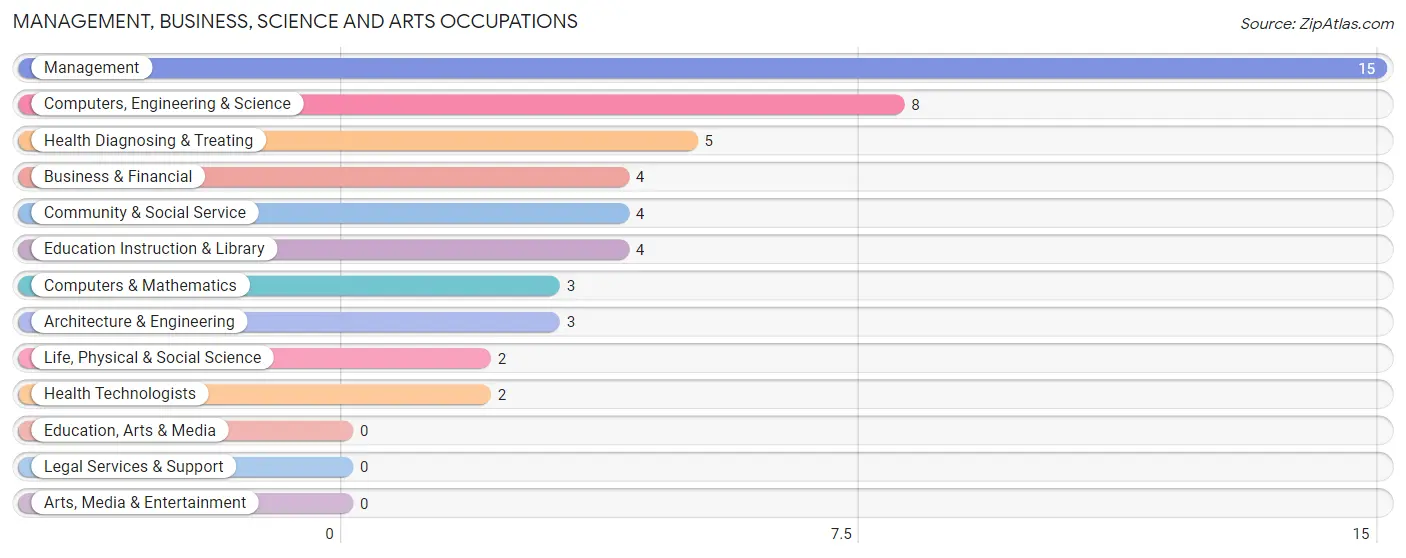
Management, Business, Science and Arts Occupations
The most common Management, Business, Science and Arts occupations in Spring Lake are Management (15 | 15.3%), Computers, Engineering & Science (8 | 8.2%), Health Diagnosing & Treating (5 | 5.1%), Business & Financial (4 | 4.1%), and Community & Social Service (4 | 4.1%).
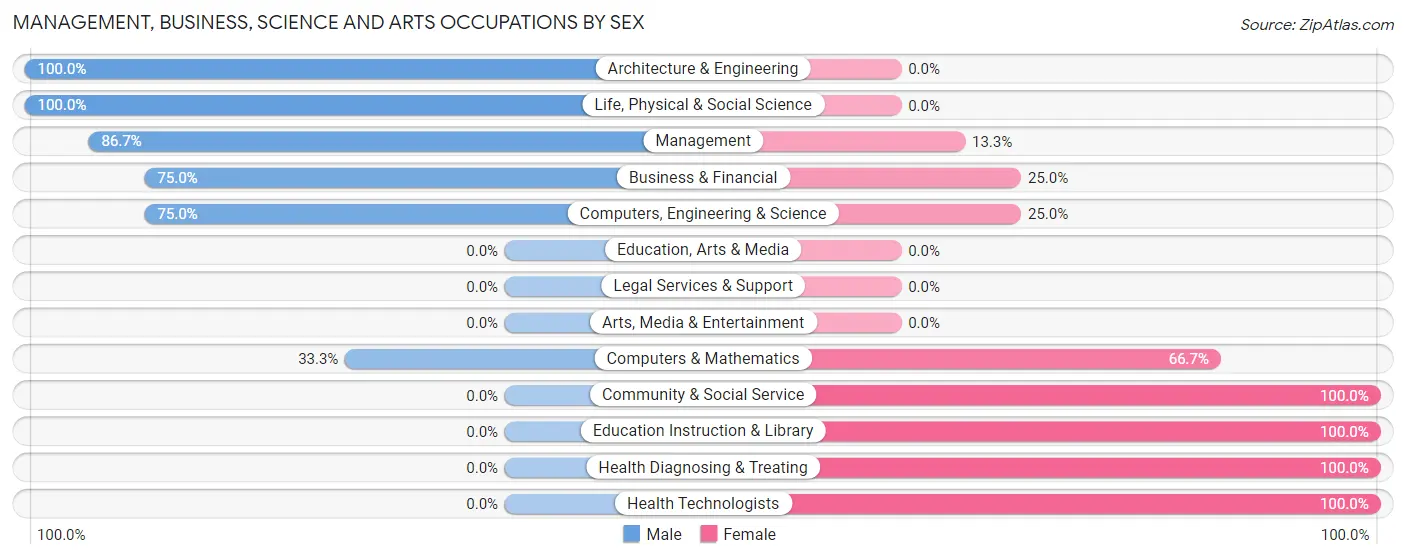
Management, Business, Science and Arts Occupations by Sex
Within the Management, Business, Science and Arts occupations in Spring Lake, the most male-oriented occupations are Architecture & Engineering (100.0%), Life, Physical & Social Science (100.0%), and Management (86.7%), while the most female-oriented occupations are Community & Social Service (100.0%), Education Instruction & Library (100.0%), and Health Diagnosing & Treating (100.0%).
| Occupation | Male | Female |
| Management | 13 (86.7%) | 2 (13.3%) |
| Business & Financial | 3 (75.0%) | 1 (25.0%) |
| Computers, Engineering & Science | 6 (75.0%) | 2 (25.0%) |
| Computers & Mathematics | 1 (33.3%) | 2 (66.7%) |
| Architecture & Engineering | 3 (100.0%) | 0 (0.0%) |
| Life, Physical & Social Science | 2 (100.0%) | 0 (0.0%) |
| Community & Social Service | 0 (0.0%) | 4 (100.0%) |
| Education, Arts & Media | 0 (0.0%) | 0 (0.0%) |
| Legal Services & Support | 0 (0.0%) | 0 (0.0%) |
| Education Instruction & Library | 0 (0.0%) | 4 (100.0%) |
| Arts, Media & Entertainment | 0 (0.0%) | 0 (0.0%) |
| Health Diagnosing & Treating | 0 (0.0%) | 5 (100.0%) |
| Health Technologists | 0 (0.0%) | 2 (100.0%) |
| Total (Category) | 22 (61.1%) | 14 (38.9%) |
| Total (Overall) | 61 (62.2%) | 37 (37.8%) |
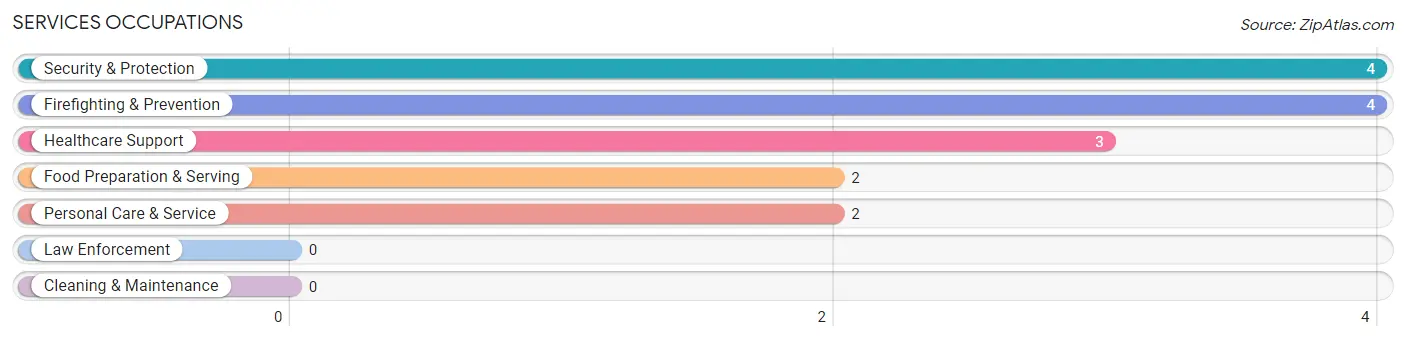
Services Occupations
The most common Services occupations in Spring Lake are Security & Protection (4 | 4.1%), Firefighting & Prevention (4 | 4.1%), Healthcare Support (3 | 3.1%), Food Preparation & Serving (2 | 2.0%), and Personal Care & Service (2 | 2.0%).
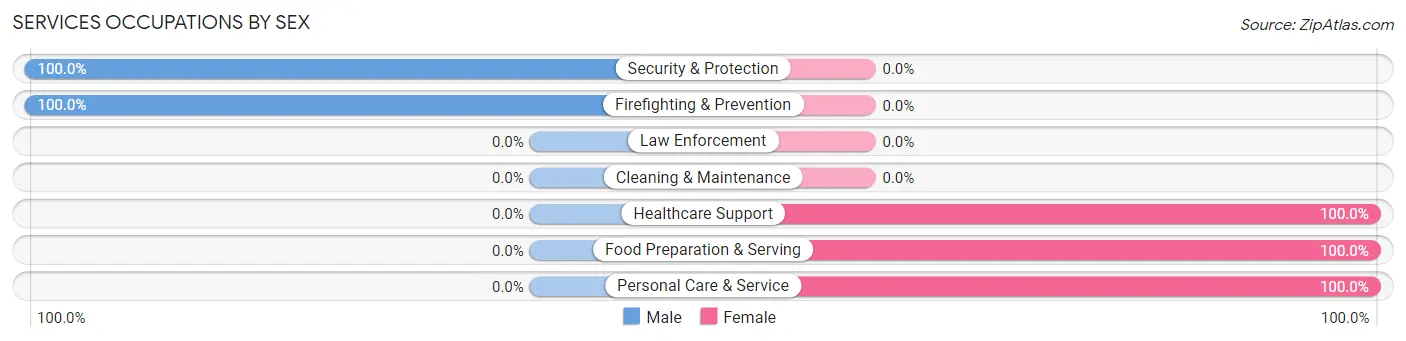
Services Occupations by Sex
Within the Services occupations in Spring Lake, the most male-oriented occupations are Security & Protection (100.0%), and Firefighting & Prevention (100.0%), while the most female-oriented occupations are Healthcare Support (100.0%), Food Preparation & Serving (100.0%), and Personal Care & Service (100.0%).
| Occupation | Male | Female |
| Healthcare Support | 0 (0.0%) | 3 (100.0%) |
| Security & Protection | 4 (100.0%) | 0 (0.0%) |
| Firefighting & Prevention | 4 (100.0%) | 0 (0.0%) |
| Law Enforcement | 0 (0.0%) | 0 (0.0%) |
| Food Preparation & Serving | 0 (0.0%) | 2 (100.0%) |
| Cleaning & Maintenance | 0 (0.0%) | 0 (0.0%) |
| Personal Care & Service | 0 (0.0%) | 2 (100.0%) |
| Total (Category) | 4 (36.4%) | 7 (63.6%) |
| Total (Overall) | 61 (62.2%) | 37 (37.8%) |
Sales and Office Occupations
The most common Sales and Office occupations in Spring Lake are Office & Administration (12 | 12.2%), and Sales & Related (9 | 9.2%).
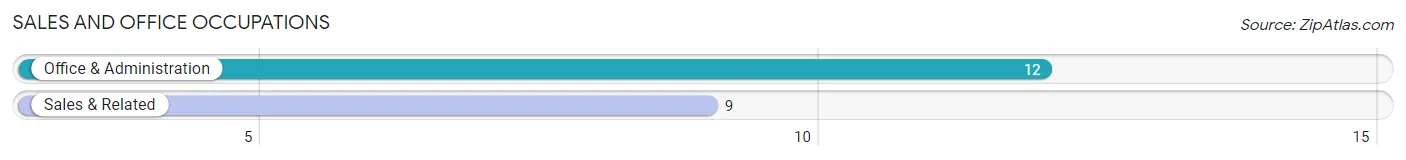
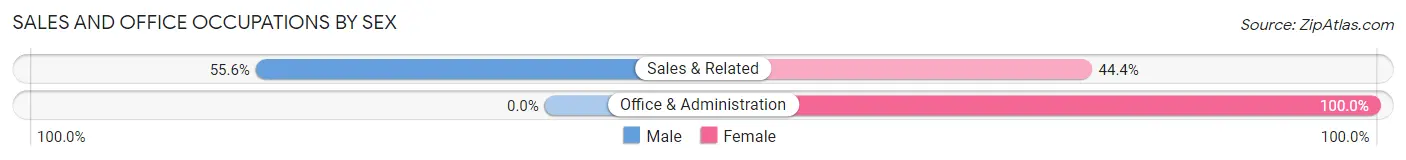
Sales and Office Occupations by Sex
| Occupation | Male | Female |
| Sales & Related | 5 (55.6%) | 4 (44.4%) |
| Office & Administration | 0 (0.0%) | 12 (100.0%) |
| Total (Category) | 5 (23.8%) | 16 (76.2%) |
| Total (Overall) | 61 (62.2%) | 37 (37.8%) |
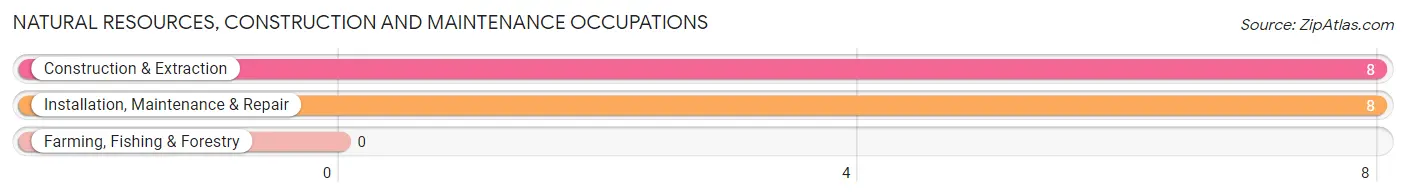
Natural Resources, Construction and Maintenance Occupations
The most common Natural Resources, Construction and Maintenance occupations in Spring Lake are Construction & Extraction (8 | 8.2%), and Installation, Maintenance & Repair (8 | 8.2%).
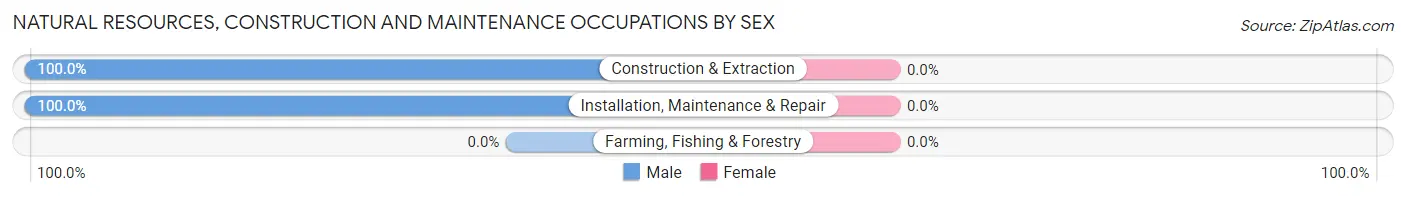
Natural Resources, Construction and Maintenance Occupations by Sex
| Occupation | Male | Female |
| Farming, Fishing & Forestry | 0 (0.0%) | 0 (0.0%) |
| Construction & Extraction | 8 (100.0%) | 0 (0.0%) |
| Installation, Maintenance & Repair | 8 (100.0%) | 0 (0.0%) |
| Total (Category) | 16 (100.0%) | 0 (0.0%) |
| Total (Overall) | 61 (62.2%) | 37 (37.8%) |
Production, Transportation and Moving Occupations
The most common Production, Transportation and Moving occupations in Spring Lake are Transportation (7 | 7.1%), Production (4 | 4.1%), and Material Moving (3 | 3.1%).
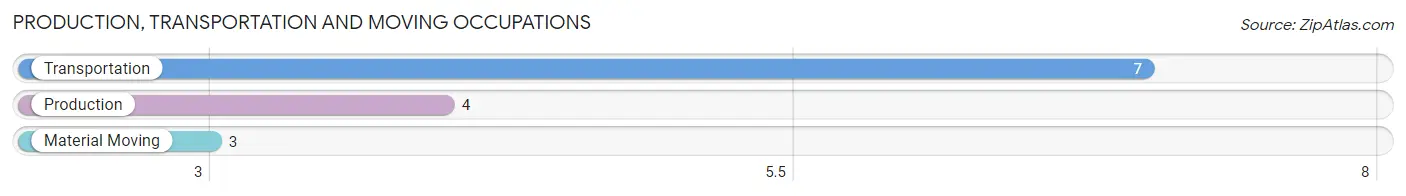
Production, Transportation and Moving Occupations by Sex
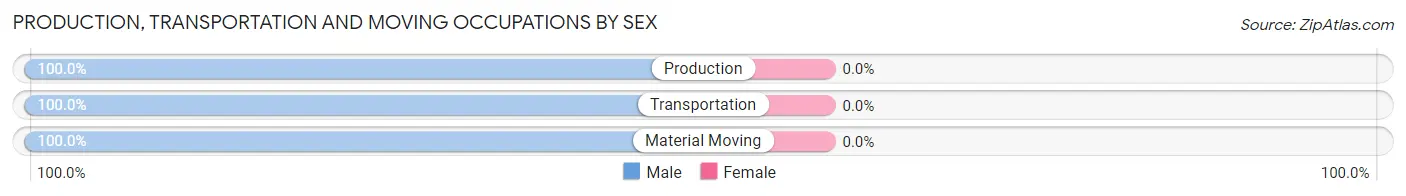
| Occupation | Male | Female |
| Production | 4 (100.0%) | 0 (0.0%) |
| Transportation | 7 (100.0%) | 0 (0.0%) |
| Material Moving | 3 (100.0%) | 0 (0.0%) |
| Total (Category) | 14 (100.0%) | 0 (0.0%) |
| Total (Overall) | 61 (62.2%) | 37 (37.8%) |
Employment Industries by Sex in Spring Lake
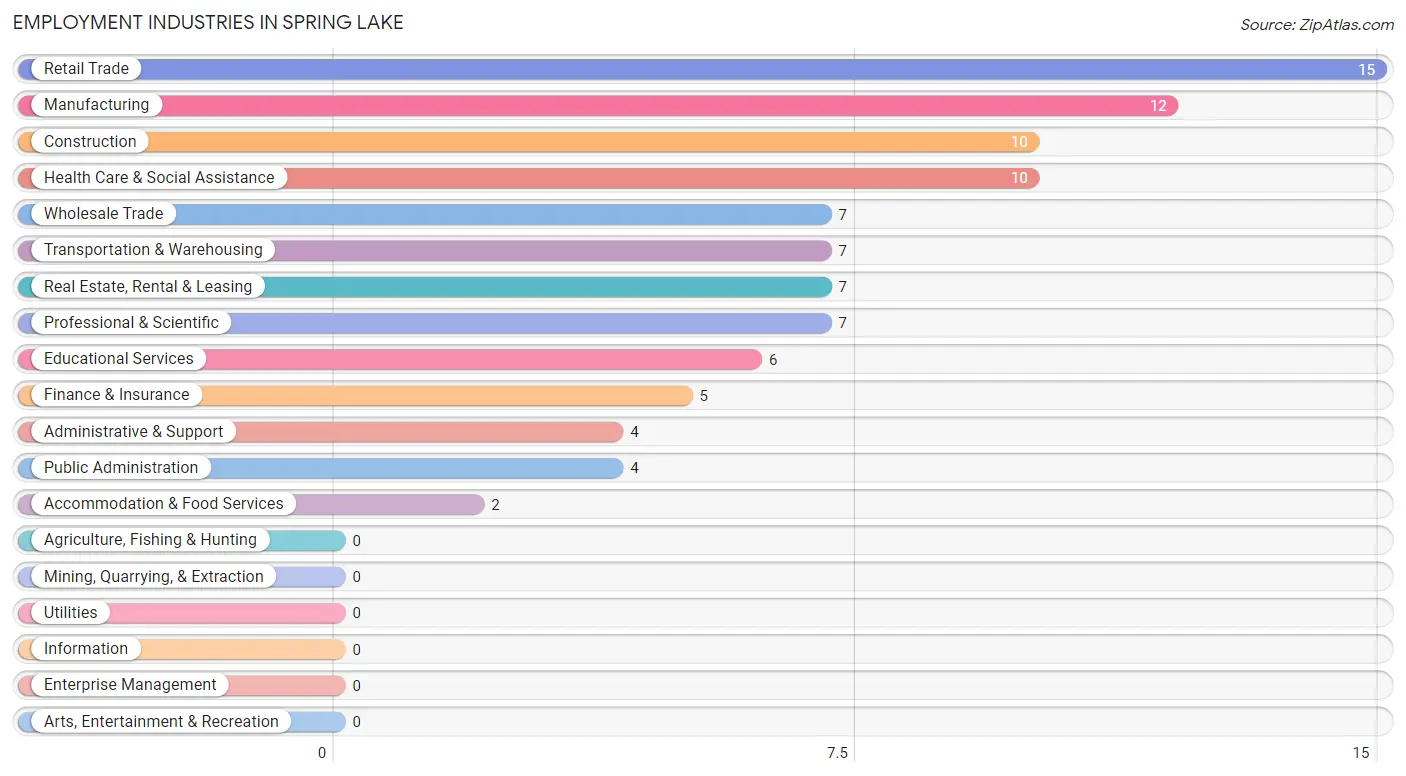
Employment Industries in Spring Lake
The major employment industries in Spring Lake include Retail Trade (15 | 15.3%), Manufacturing (12 | 12.2%), Construction (10 | 10.2%), Health Care & Social Assistance (10 | 10.2%), and Wholesale Trade (7 | 7.1%).
Employment Industries by Sex in Spring Lake
The Spring Lake industries that see more men than women are Transportation & Warehousing (100.0%), Administrative & Support (100.0%), and Public Administration (100.0%), whereas the industries that tend to have a higher number of women are Finance & Insurance (100.0%), Health Care & Social Assistance (100.0%), and Accommodation & Food Services (100.0%).
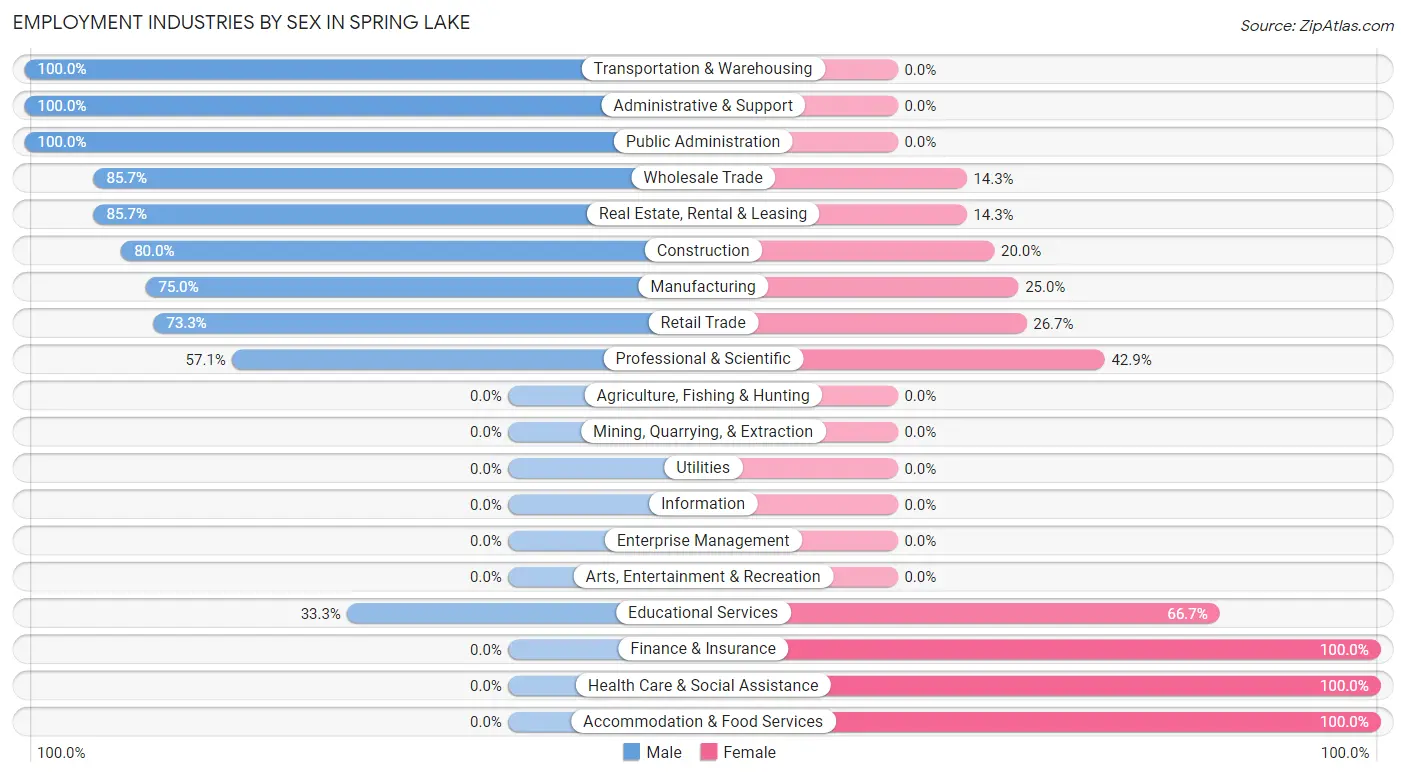
| Industry | Male | Female |
| Agriculture, Fishing & Hunting | 0 (0.0%) | 0 (0.0%) |
| Mining, Quarrying, & Extraction | 0 (0.0%) | 0 (0.0%) |
| Construction | 8 (80.0%) | 2 (20.0%) |
| Manufacturing | 9 (75.0%) | 3 (25.0%) |
| Wholesale Trade | 6 (85.7%) | 1 (14.3%) |
| Retail Trade | 11 (73.3%) | 4 (26.7%) |
| Transportation & Warehousing | 7 (100.0%) | 0 (0.0%) |
| Utilities | 0 (0.0%) | 0 (0.0%) |
| Information | 0 (0.0%) | 0 (0.0%) |
| Finance & Insurance | 0 (0.0%) | 5 (100.0%) |
| Real Estate, Rental & Leasing | 6 (85.7%) | 1 (14.3%) |
| Professional & Scientific | 4 (57.1%) | 3 (42.9%) |
| Enterprise Management | 0 (0.0%) | 0 (0.0%) |
| Administrative & Support | 4 (100.0%) | 0 (0.0%) |
| Educational Services | 2 (33.3%) | 4 (66.7%) |
| Health Care & Social Assistance | 0 (0.0%) | 10 (100.0%) |
| Arts, Entertainment & Recreation | 0 (0.0%) | 0 (0.0%) |
| Accommodation & Food Services | 0 (0.0%) | 2 (100.0%) |
| Public Administration | 4 (100.0%) | 0 (0.0%) |
| Total | 61 (62.2%) | 37 (37.8%) |
Education in Spring Lake
School Enrollment in Spring Lake
The most common levels of schooling among the 9 students in Spring Lake are high school (6 | 66.7%), middle school (2 | 22.2%), and elementary school (1 | 11.1%).
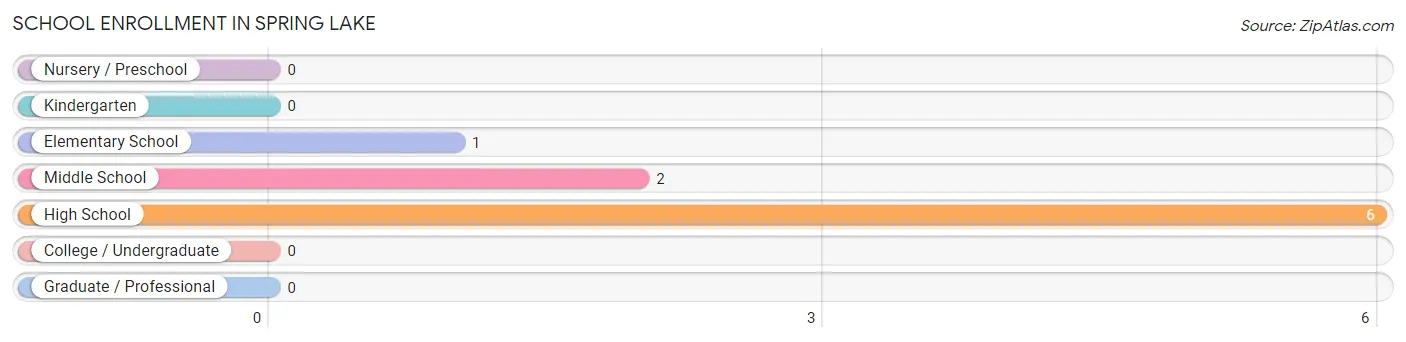
| School Level | # Students | % Students |
| Nursery / Preschool | 0 | 0.0% |
| Kindergarten | 0 | 0.0% |
| Elementary School | 1 | 11.1% |
| Middle School | 2 | 22.2% |
| High School | 6 | 66.7% |
| College / Undergraduate | 0 | 0.0% |
| Graduate / Professional | 0 | 0.0% |
| Total | 9 | 100.0% |
School Enrollment by Age by Funding Source in Spring Lake
Out of a total of 9 students who are enrolled in schools in Spring Lake, 2 (22.2%) attend a private institution, while the remaining 7 (77.8%) are enrolled in public schools. The age group of 18 to 19 year olds has the highest likelihood of being enrolled in private schools, with 2 (50.0% in the age bracket) enrolled. Conversely, the age group of 10 to 14 year olds has the lowest likelihood of being enrolled in a private school, with 3 (100.0% in the age bracket) attending a public institution.
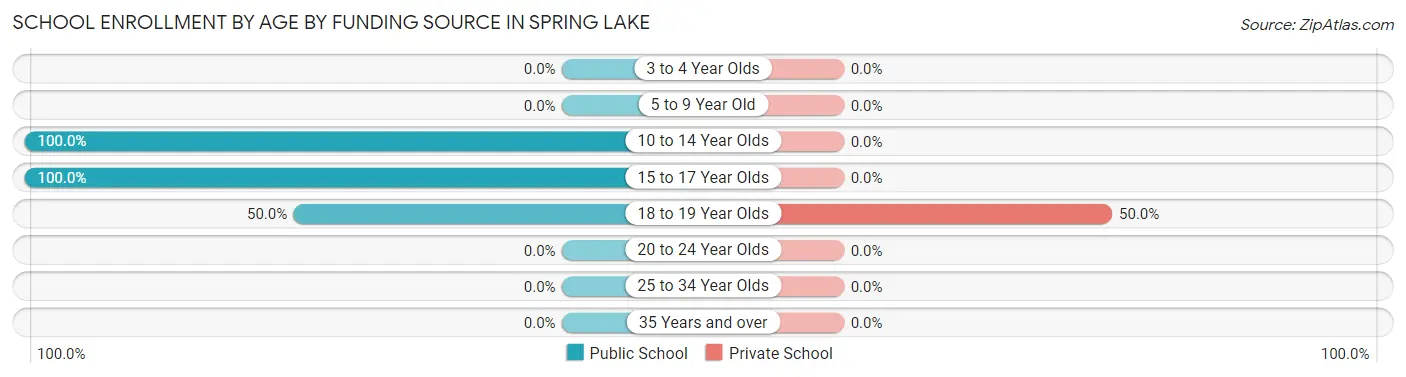
| Age Bracket | Public School | Private School |
| 3 to 4 Year Olds | 0 (0.0%) | 0 (0.0%) |
| 5 to 9 Year Old | 0 (0.0%) | 0 (0.0%) |
| 10 to 14 Year Olds | 3 (100.0%) | 0 (0.0%) |
| 15 to 17 Year Olds | 2 (100.0%) | 0 (0.0%) |
| 18 to 19 Year Olds | 2 (50.0%) | 2 (50.0%) |
| 20 to 24 Year Olds | 0 (0.0%) | 0 (0.0%) |
| 25 to 34 Year Olds | 0 (0.0%) | 0 (0.0%) |
| 35 Years and over | 0 (0.0%) | 0 (0.0%) |
| Total | 7 (77.8%) | 2 (22.2%) |
Educational Attainment by Field of Study in Spring Lake
Business (8 | 33.3%), literature & languages (6 | 25.0%), education (3 | 12.5%), physical & health sciences (2 | 8.3%), and engineering (2 | 8.3%) are the most common fields of study among 24 individuals in Spring Lake who have obtained a bachelor's degree or higher.
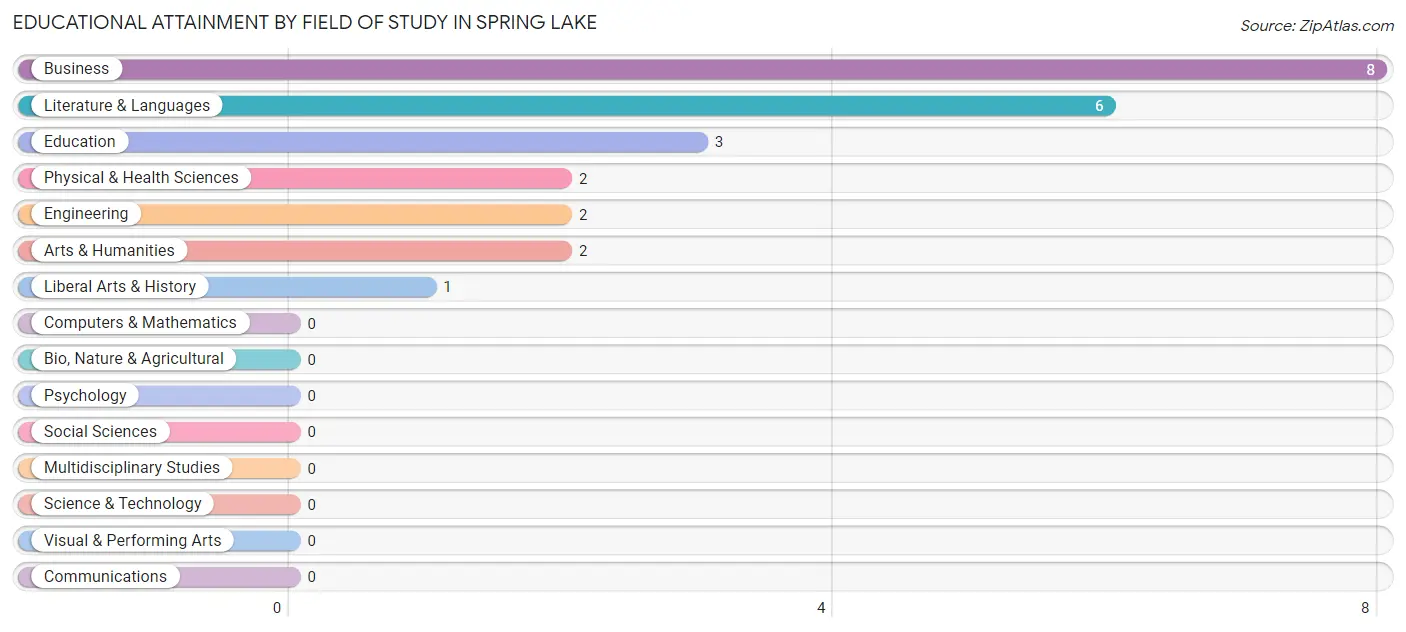
| Field of Study | # Graduates | % Graduates |
| Computers & Mathematics | 0 | 0.0% |
| Bio, Nature & Agricultural | 0 | 0.0% |
| Physical & Health Sciences | 2 | 8.3% |
| Psychology | 0 | 0.0% |
| Social Sciences | 0 | 0.0% |
| Engineering | 2 | 8.3% |
| Multidisciplinary Studies | 0 | 0.0% |
| Science & Technology | 0 | 0.0% |
| Business | 8 | 33.3% |
| Education | 3 | 12.5% |
| Literature & Languages | 6 | 25.0% |
| Liberal Arts & History | 1 | 4.2% |
| Visual & Performing Arts | 0 | 0.0% |
| Communications | 0 | 0.0% |
| Arts & Humanities | 2 | 8.3% |
| Total | 24 | 100.0% |
Transportation & Commute in Spring Lake
Vehicle Availability by Sex in Spring Lake
The most prevalent vehicle ownership categories in Spring Lake are males with 2 vehicles (25, accounting for 41.7%) and females with 2 vehicles (19, making up 67.6%).
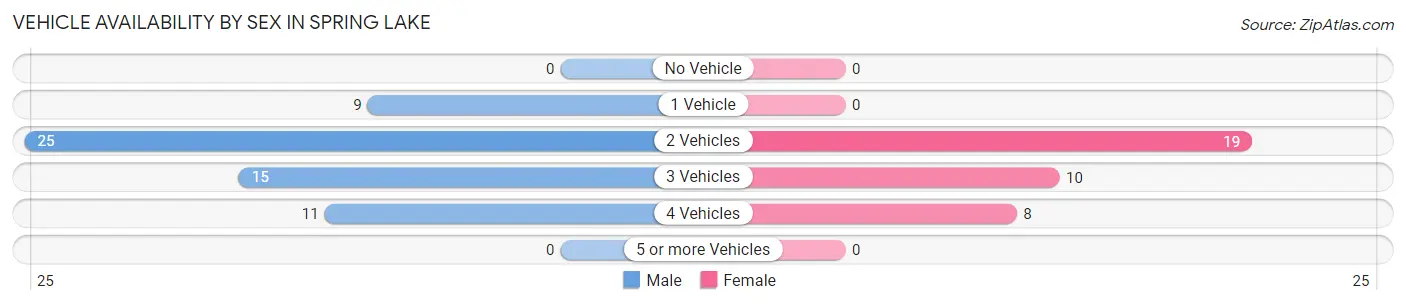
| Vehicles Available | Male | Female |
| No Vehicle | 0 (0.0%) | 0 (0.0%) |
| 1 Vehicle | 9 (15.0%) | 0 (0.0%) |
| 2 Vehicles | 25 (41.7%) | 19 (51.3%) |
| 3 Vehicles | 15 (25.0%) | 10 (27.0%) |
| 4 Vehicles | 11 (18.3%) | 8 (21.6%) |
| 5 or more Vehicles | 0 (0.0%) | 0 (0.0%) |
| Total | 60 (100.0%) | 37 (100.0%) |
Commute Time in Spring Lake
The most frequently occuring commute durations in Spring Lake are 15 to 19 minutes (17 commuters, 19.1%), 30 to 34 minutes (13 commuters, 14.6%), and 5 to 9 minutes (11 commuters, 12.4%).
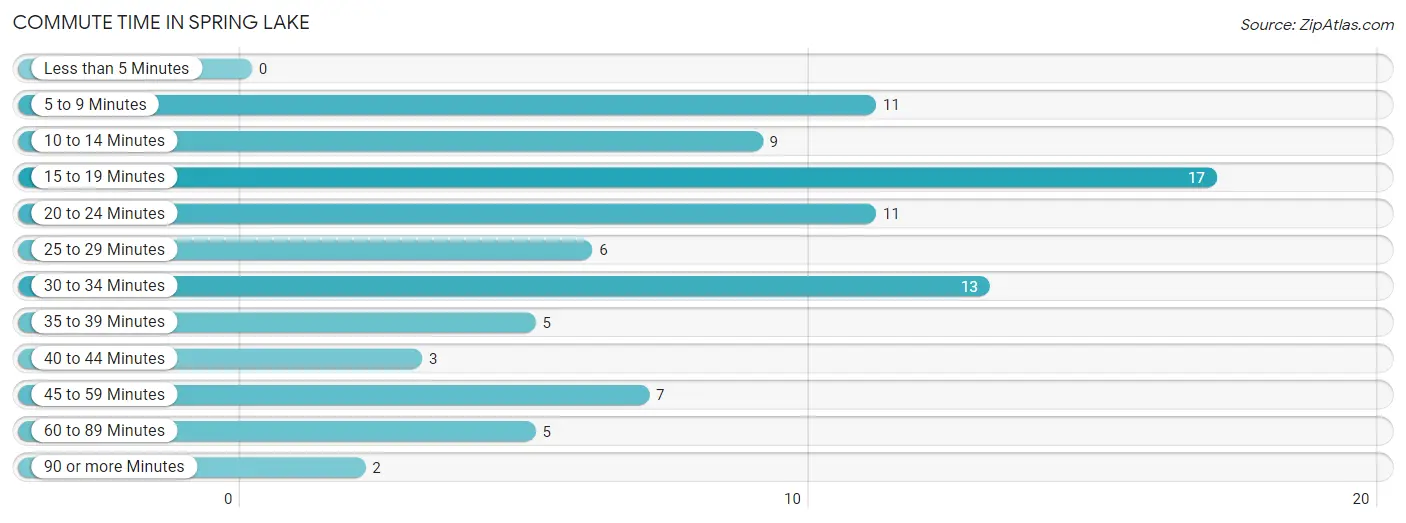
| Commute Time | # Commuters | % Commuters |
| Less than 5 Minutes | 0 | 0.0% |
| 5 to 9 Minutes | 11 | 12.4% |
| 10 to 14 Minutes | 9 | 10.1% |
| 15 to 19 Minutes | 17 | 19.1% |
| 20 to 24 Minutes | 11 | 12.4% |
| 25 to 29 Minutes | 6 | 6.7% |
| 30 to 34 Minutes | 13 | 14.6% |
| 35 to 39 Minutes | 5 | 5.6% |
| 40 to 44 Minutes | 3 | 3.4% |
| 45 to 59 Minutes | 7 | 7.9% |
| 60 to 89 Minutes | 5 | 5.6% |
| 90 or more Minutes | 2 | 2.2% |
Commute Time by Sex in Spring Lake
The most common commute times in Spring Lake are 15 to 19 minutes (13 commuters, 22.8%) for males and 5 to 9 minutes (9 commuters, 28.1%) for females.
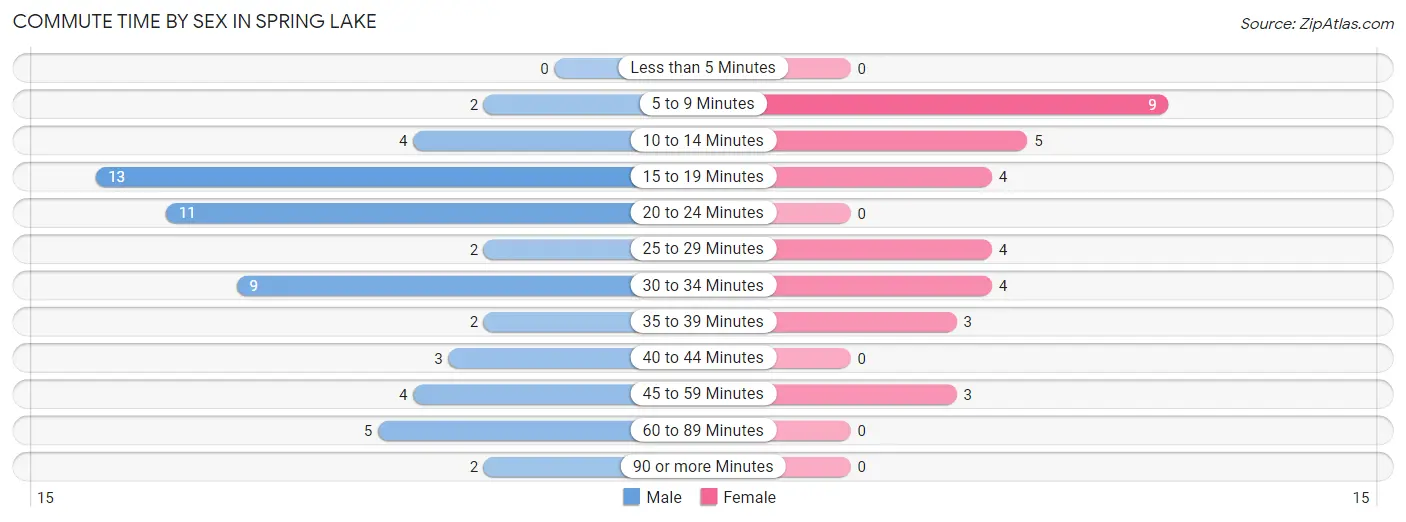
| Commute Time | Male | Female |
| Less than 5 Minutes | 0 (0.0%) | 0 (0.0%) |
| 5 to 9 Minutes | 2 (3.5%) | 9 (28.1%) |
| 10 to 14 Minutes | 4 (7.0%) | 5 (15.6%) |
| 15 to 19 Minutes | 13 (22.8%) | 4 (12.5%) |
| 20 to 24 Minutes | 11 (19.3%) | 0 (0.0%) |
| 25 to 29 Minutes | 2 (3.5%) | 4 (12.5%) |
| 30 to 34 Minutes | 9 (15.8%) | 4 (12.5%) |
| 35 to 39 Minutes | 2 (3.5%) | 3 (9.4%) |
| 40 to 44 Minutes | 3 (5.3%) | 0 (0.0%) |
| 45 to 59 Minutes | 4 (7.0%) | 3 (9.4%) |
| 60 to 89 Minutes | 5 (8.8%) | 0 (0.0%) |
| 90 or more Minutes | 2 (3.5%) | 0 (0.0%) |
Time of Departure to Work by Sex in Spring Lake
The most frequent times of departure to work in Spring Lake are 6:30 AM to 6:59 AM (10, 17.5%) for males and 7:30 AM to 7:59 AM (9, 28.1%) for females.
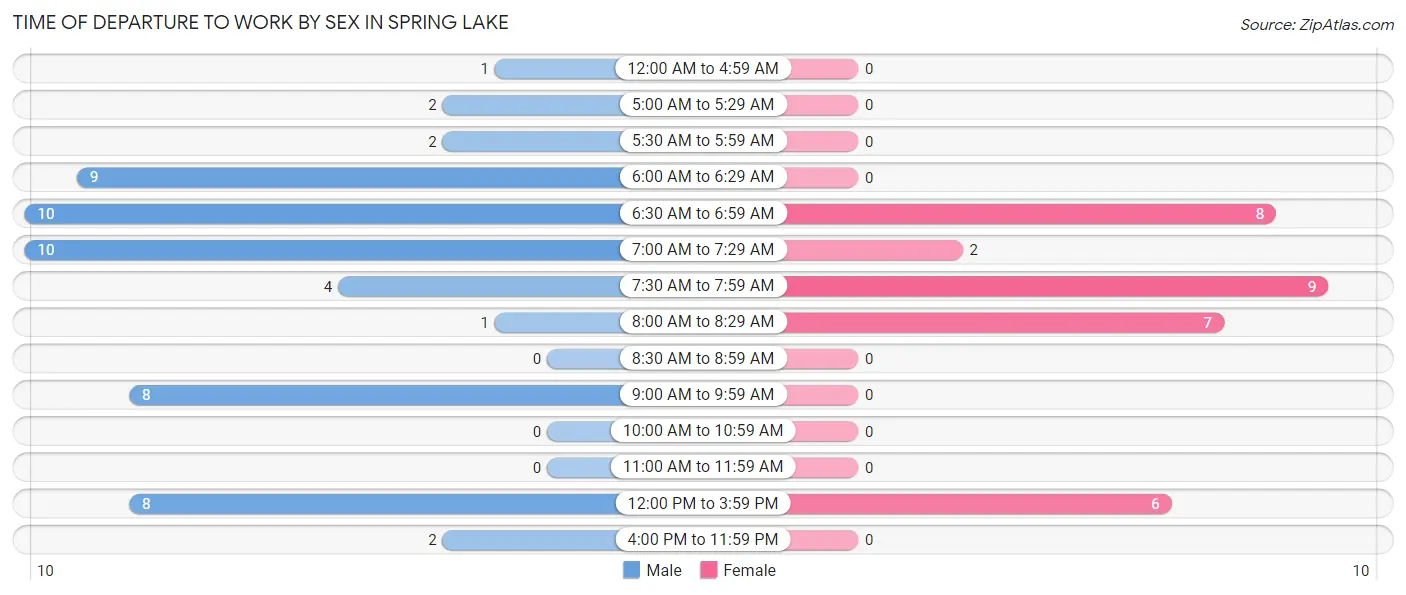
| Time of Departure | Male | Female |
| 12:00 AM to 4:59 AM | 1 (1.8%) | 0 (0.0%) |
| 5:00 AM to 5:29 AM | 2 (3.5%) | 0 (0.0%) |
| 5:30 AM to 5:59 AM | 2 (3.5%) | 0 (0.0%) |
| 6:00 AM to 6:29 AM | 9 (15.8%) | 0 (0.0%) |
| 6:30 AM to 6:59 AM | 10 (17.5%) | 8 (25.0%) |
| 7:00 AM to 7:29 AM | 10 (17.5%) | 2 (6.2%) |
| 7:30 AM to 7:59 AM | 4 (7.0%) | 9 (28.1%) |
| 8:00 AM to 8:29 AM | 1 (1.8%) | 7 (21.9%) |
| 8:30 AM to 8:59 AM | 0 (0.0%) | 0 (0.0%) |
| 9:00 AM to 9:59 AM | 8 (14.0%) | 0 (0.0%) |
| 10:00 AM to 10:59 AM | 0 (0.0%) | 0 (0.0%) |
| 11:00 AM to 11:59 AM | 0 (0.0%) | 0 (0.0%) |
| 12:00 PM to 3:59 PM | 8 (14.0%) | 6 (18.8%) |
| 4:00 PM to 11:59 PM | 2 (3.5%) | 0 (0.0%) |
| Total | 57 (100.0%) | 32 (100.0%) |
Housing Occupancy in Spring Lake
Occupancy by Ownership in Spring Lake
Of the total 131 dwellings in Spring Lake, owner-occupied units account for 125 (95.4%), while renter-occupied units make up 6 (4.6%).
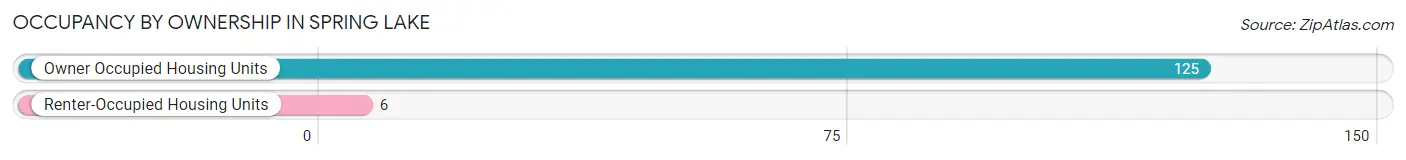
| Occupancy | # Housing Units | % Housing Units |
| Owner Occupied Housing Units | 125 | 95.4% |
| Renter-Occupied Housing Units | 6 | 4.6% |
| Total Occupied Housing Units | 131 | 100.0% |
Occupancy by Household Size in Spring Lake
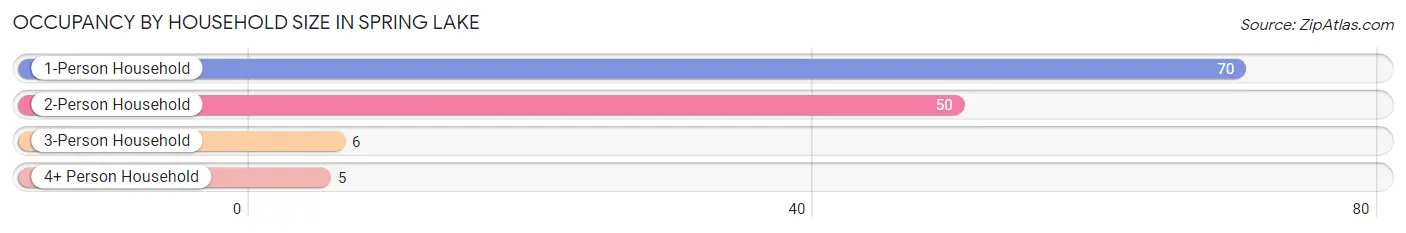
| Household Size | # Housing Units | % Housing Units |
| 1-Person Household | 70 | 53.4% |
| 2-Person Household | 50 | 38.2% |
| 3-Person Household | 6 | 4.6% |
| 4+ Person Household | 5 | 3.8% |
| Total Housing Units | 131 | 100.0% |
Occupancy by Ownership by Household Size in Spring Lake
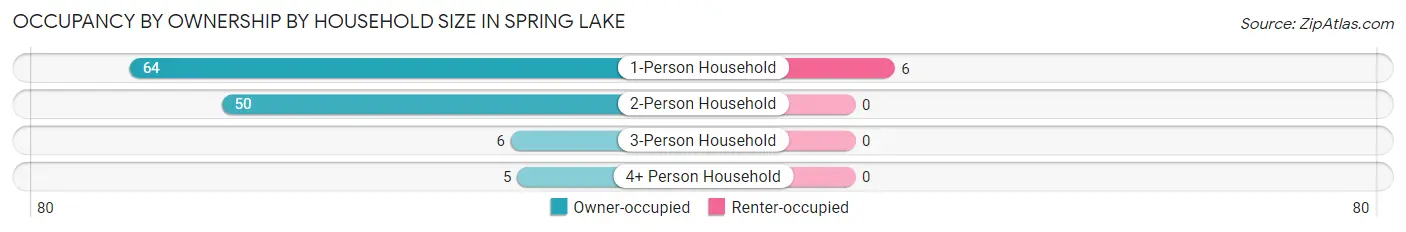
| Household Size | Owner-occupied | Renter-occupied |
| 1-Person Household | 64 (91.4%) | 6 (8.6%) |
| 2-Person Household | 50 (100.0%) | 0 (0.0%) |
| 3-Person Household | 6 (100.0%) | 0 (0.0%) |
| 4+ Person Household | 5 (100.0%) | 0 (0.0%) |
| Total Housing Units | 125 (95.4%) | 6 (4.6%) |
Occupancy by Educational Attainment in Spring Lake
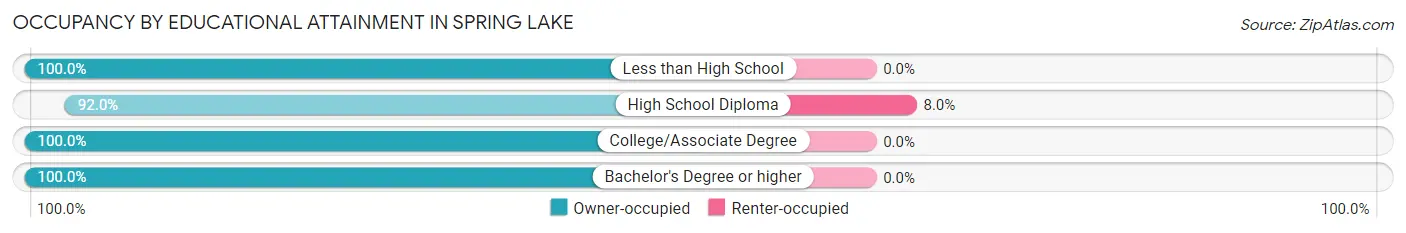
| Household Size | Owner-occupied | Renter-occupied |
| Less than High School | 4 (100.0%) | 0 (0.0%) |
| High School Diploma | 69 (92.0%) | 6 (8.0%) |
| College/Associate Degree | 37 (100.0%) | 0 (0.0%) |
| Bachelor's Degree or higher | 15 (100.0%) | 0 (0.0%) |
Occupancy by Age of Householder in Spring Lake
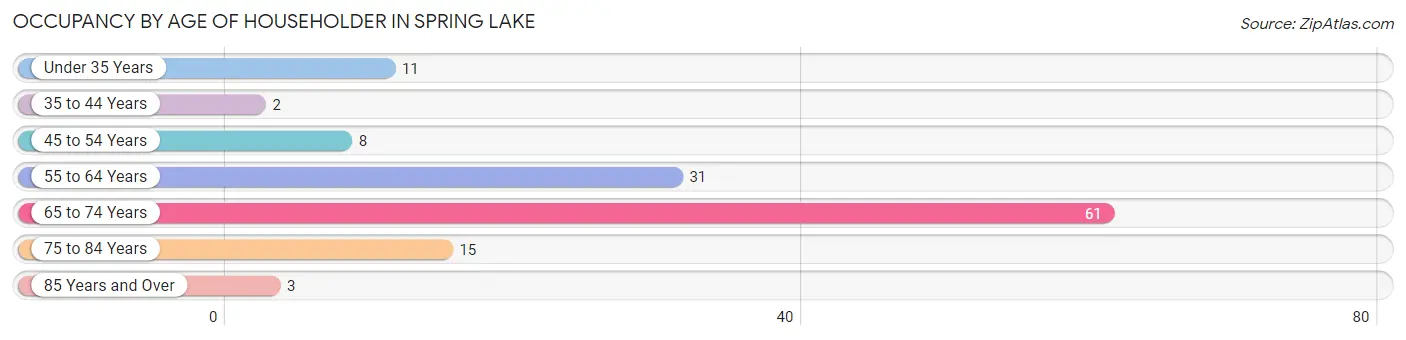
| Age Bracket | # Households | % Households |
| Under 35 Years | 11 | 8.4% |
| 35 to 44 Years | 2 | 1.5% |
| 45 to 54 Years | 8 | 6.1% |
| 55 to 64 Years | 31 | 23.7% |
| 65 to 74 Years | 61 | 46.6% |
| 75 to 84 Years | 15 | 11.5% |
| 85 Years and Over | 3 | 2.3% |
| Total | 131 | 100.0% |
Housing Finances in Spring Lake
Median Income by Occupancy in Spring Lake
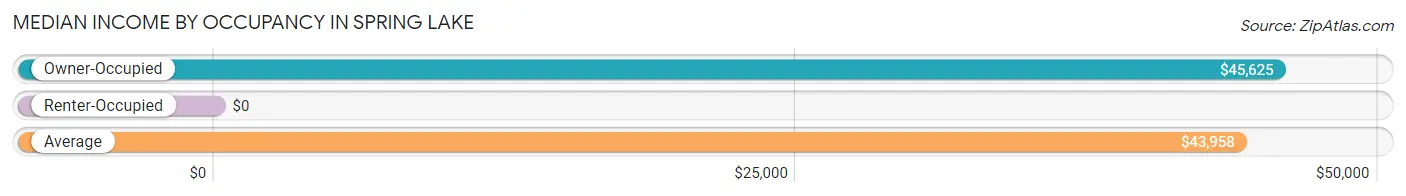
| Occupancy Type | # Households | Median Income |
| Owner-Occupied | 125 (95.4%) | $45,625 |
| Renter-Occupied | 6 (4.6%) | $0 |
| Average | 131 (100.0%) | $43,958 |
Occupancy by Householder Income Bracket in Spring Lake
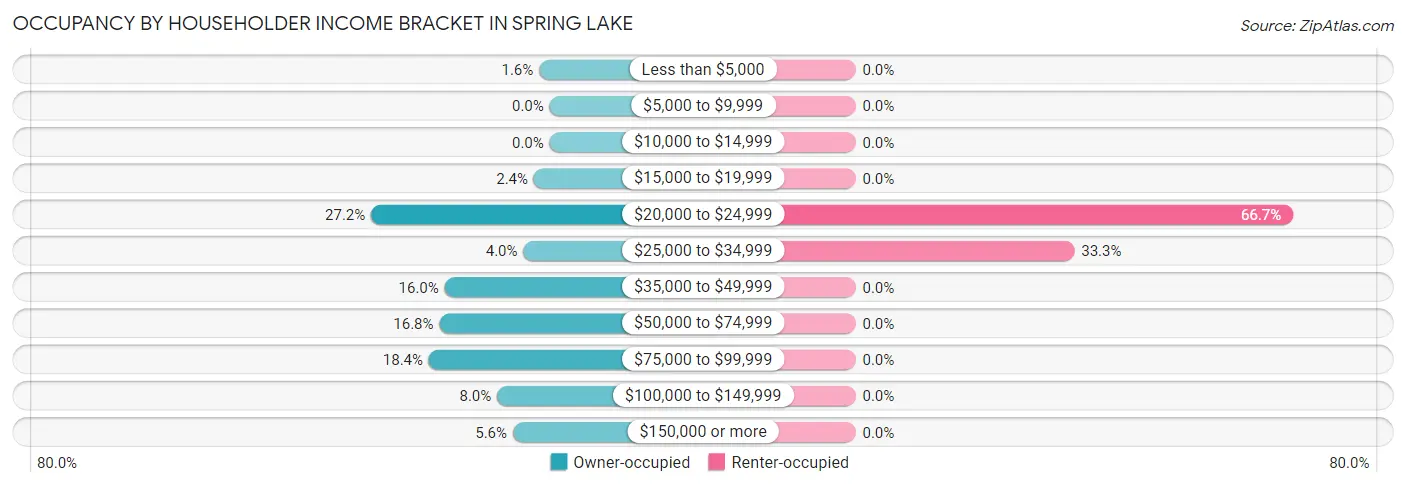
| Income Bracket | Owner-occupied | Renter-occupied |
| Less than $5,000 | 2 (1.6%) | 0 (0.0%) |
| $5,000 to $9,999 | 0 (0.0%) | 0 (0.0%) |
| $10,000 to $14,999 | 0 (0.0%) | 0 (0.0%) |
| $15,000 to $19,999 | 3 (2.4%) | 0 (0.0%) |
| $20,000 to $24,999 | 34 (27.2%) | 4 (66.7%) |
| $25,000 to $34,999 | 5 (4.0%) | 2 (33.3%) |
| $35,000 to $49,999 | 20 (16.0%) | 0 (0.0%) |
| $50,000 to $74,999 | 21 (16.8%) | 0 (0.0%) |
| $75,000 to $99,999 | 23 (18.4%) | 0 (0.0%) |
| $100,000 to $149,999 | 10 (8.0%) | 0 (0.0%) |
| $150,000 or more | 7 (5.6%) | 0 (0.0%) |
| Total | 125 (100.0%) | 6 (100.0%) |
Monthly Housing Cost Tiers in Spring Lake
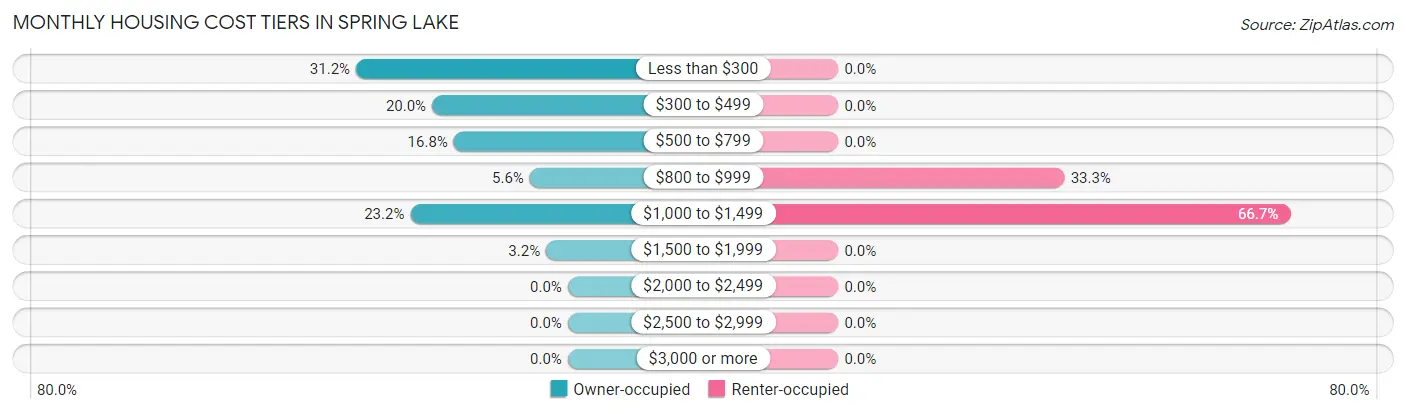
| Monthly Cost | Owner-occupied | Renter-occupied |
| Less than $300 | 39 (31.2%) | 0 (0.0%) |
| $300 to $499 | 25 (20.0%) | 0 (0.0%) |
| $500 to $799 | 21 (16.8%) | 0 (0.0%) |
| $800 to $999 | 7 (5.6%) | 2 (33.3%) |
| $1,000 to $1,499 | 29 (23.2%) | 4 (66.7%) |
| $1,500 to $1,999 | 4 (3.2%) | 0 (0.0%) |
| $2,000 to $2,499 | 0 (0.0%) | 0 (0.0%) |
| $2,500 to $2,999 | 0 (0.0%) | 0 (0.0%) |
| $3,000 or more | 0 (0.0%) | 0 (0.0%) |
| Total | 125 (100.0%) | 6 (100.0%) |
Physical Housing Characteristics in Spring Lake
Housing Structures in Spring Lake
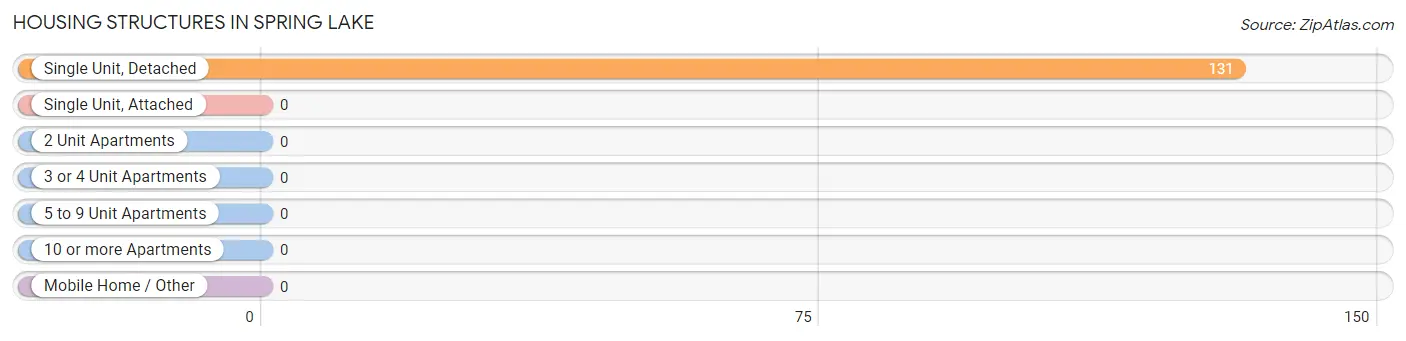
| Structure Type | # Housing Units | % Housing Units |
| Single Unit, Detached | 131 | 100.0% |
| Single Unit, Attached | 0 | 0.0% |
| 2 Unit Apartments | 0 | 0.0% |
| 3 or 4 Unit Apartments | 0 | 0.0% |
| 5 to 9 Unit Apartments | 0 | 0.0% |
| 10 or more Apartments | 0 | 0.0% |
| Mobile Home / Other | 0 | 0.0% |
| Total | 131 | 100.0% |
Housing Structures by Occupancy in Spring Lake
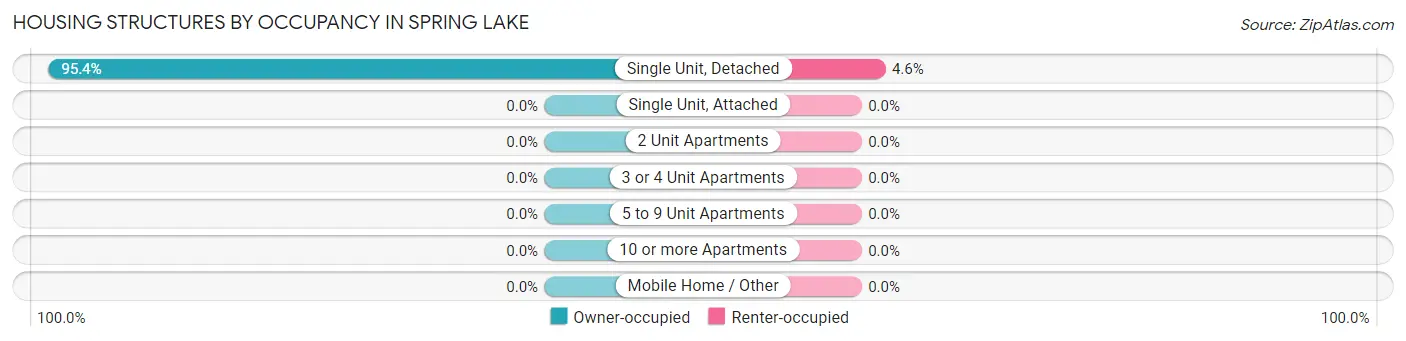
| Structure Type | Owner-occupied | Renter-occupied |
| Single Unit, Detached | 125 (95.4%) | 6 (4.6%) |
| Single Unit, Attached | 0 (0.0%) | 0 (0.0%) |
| 2 Unit Apartments | 0 (0.0%) | 0 (0.0%) |
| 3 or 4 Unit Apartments | 0 (0.0%) | 0 (0.0%) |
| 5 to 9 Unit Apartments | 0 (0.0%) | 0 (0.0%) |
| 10 or more Apartments | 0 (0.0%) | 0 (0.0%) |
| Mobile Home / Other | 0 (0.0%) | 0 (0.0%) |
| Total | 125 (95.4%) | 6 (4.6%) |
Housing Structures by Number of Rooms in Spring Lake
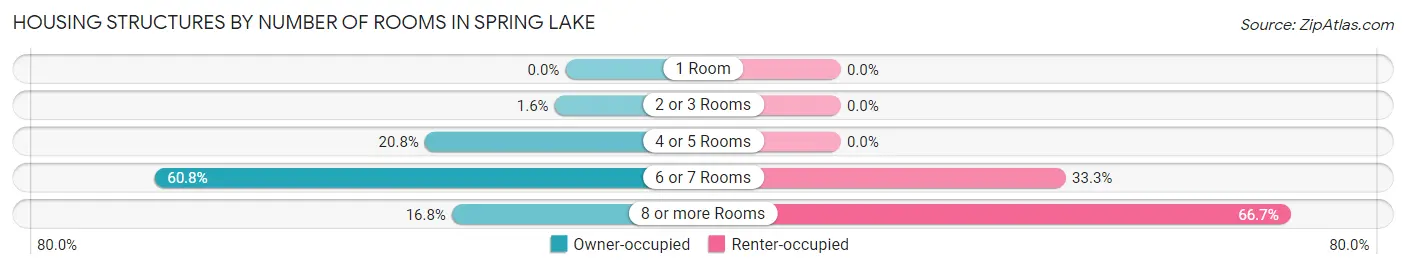
| Number of Rooms | Owner-occupied | Renter-occupied |
| 1 Room | 0 (0.0%) | 0 (0.0%) |
| 2 or 3 Rooms | 2 (1.6%) | 0 (0.0%) |
| 4 or 5 Rooms | 26 (20.8%) | 0 (0.0%) |
| 6 or 7 Rooms | 76 (60.8%) | 2 (33.3%) |
| 8 or more Rooms | 21 (16.8%) | 4 (66.7%) |
| Total | 125 (100.0%) | 6 (100.0%) |
Housing Structure by Heating Type in Spring Lake
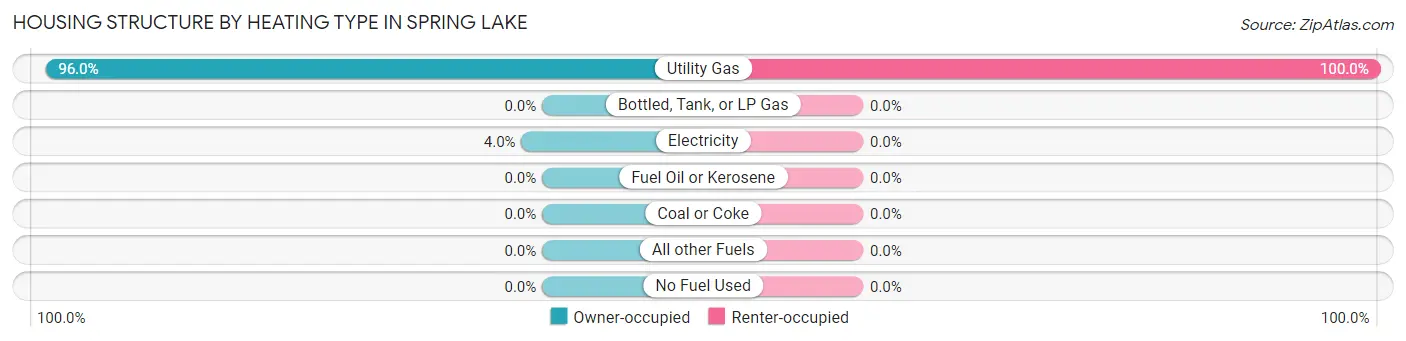
| Heating Type | Owner-occupied | Renter-occupied |
| Utility Gas | 120 (96.0%) | 6 (100.0%) |
| Bottled, Tank, or LP Gas | 0 (0.0%) | 0 (0.0%) |
| Electricity | 5 (4.0%) | 0 (0.0%) |
| Fuel Oil or Kerosene | 0 (0.0%) | 0 (0.0%) |
| Coal or Coke | 0 (0.0%) | 0 (0.0%) |
| All other Fuels | 0 (0.0%) | 0 (0.0%) |
| No Fuel Used | 0 (0.0%) | 0 (0.0%) |
| Total | 125 (100.0%) | 6 (100.0%) |
Household Vehicle Usage in Spring Lake
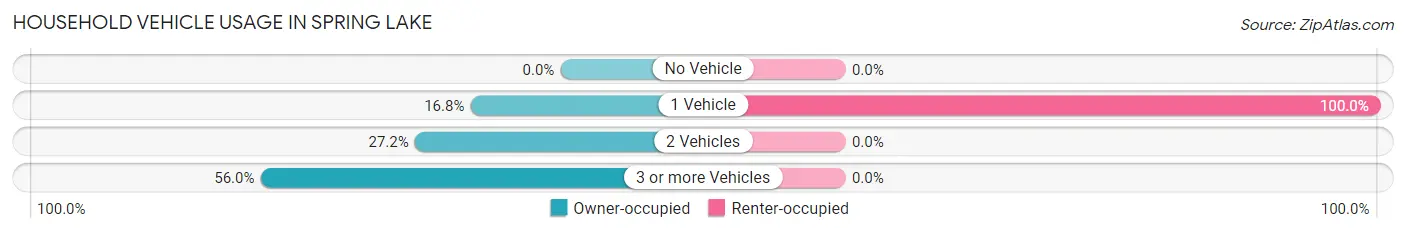
| Vehicles per Household | Owner-occupied | Renter-occupied |
| No Vehicle | 0 (0.0%) | 0 (0.0%) |
| 1 Vehicle | 21 (16.8%) | 6 (100.0%) |
| 2 Vehicles | 34 (27.2%) | 0 (0.0%) |
| 3 or more Vehicles | 70 (56.0%) | 0 (0.0%) |
| Total | 125 (100.0%) | 6 (100.0%) |
Real Estate & Mortgages in Spring Lake
Real Estate and Mortgage Overview in Spring Lake
| Characteristic | Without Mortgage | With Mortgage |
| Housing Units | 69 | 56 |
| Median Property Value | $98,500 | $168,800 |
| Median Household Income | - | - |
| Monthly Housing Costs | $294 | $0 |
| Real Estate Taxes | $544 | $7 |
Property Value by Mortgage Status in Spring Lake
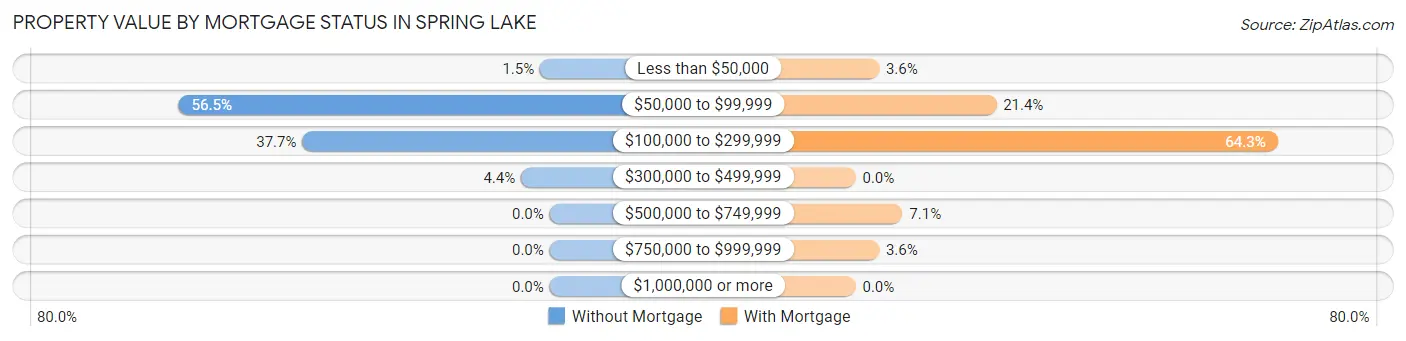
| Property Value | Without Mortgage | With Mortgage |
| Less than $50,000 | 1 (1.5%) | 2 (3.6%) |
| $50,000 to $99,999 | 39 (56.5%) | 12 (21.4%) |
| $100,000 to $299,999 | 26 (37.7%) | 36 (64.3%) |
| $300,000 to $499,999 | 3 (4.3%) | 0 (0.0%) |
| $500,000 to $749,999 | 0 (0.0%) | 4 (7.1%) |
| $750,000 to $999,999 | 0 (0.0%) | 2 (3.6%) |
| $1,000,000 or more | 0 (0.0%) | 0 (0.0%) |
| Total | 69 (100.0%) | 56 (100.0%) |
Household Income by Mortgage Status in Spring Lake
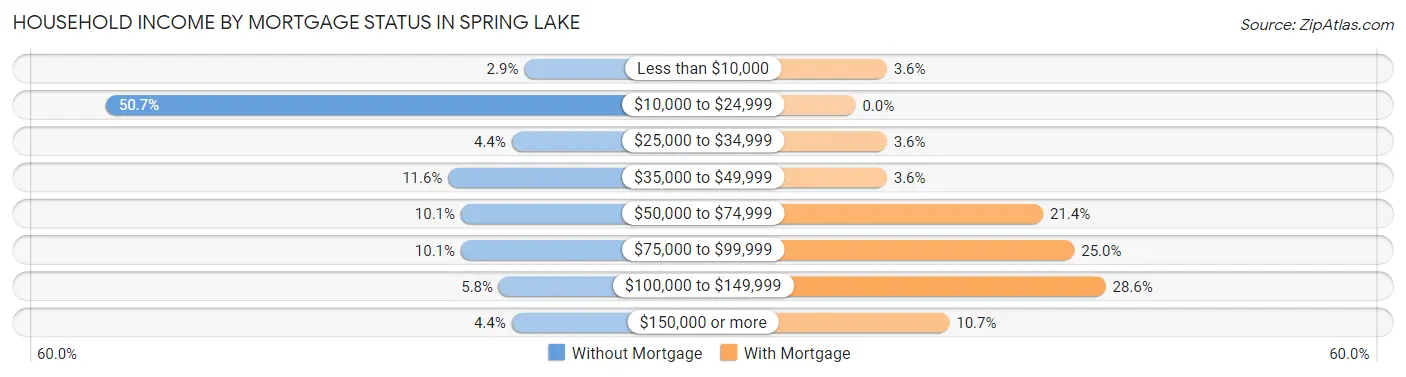
| Household Income | Without Mortgage | With Mortgage |
| Less than $10,000 | 2 (2.9%) | 2 (3.6%) |
| $10,000 to $24,999 | 35 (50.7%) | 0 (0.0%) |
| $25,000 to $34,999 | 3 (4.3%) | 2 (3.6%) |
| $35,000 to $49,999 | 8 (11.6%) | 2 (3.6%) |
| $50,000 to $74,999 | 7 (10.1%) | 12 (21.4%) |
| $75,000 to $99,999 | 7 (10.1%) | 14 (25.0%) |
| $100,000 to $149,999 | 4 (5.8%) | 16 (28.6%) |
| $150,000 or more | 3 (4.3%) | 6 (10.7%) |
| Total | 69 (100.0%) | 56 (100.0%) |
Property Value to Household Income Ratio in Spring Lake
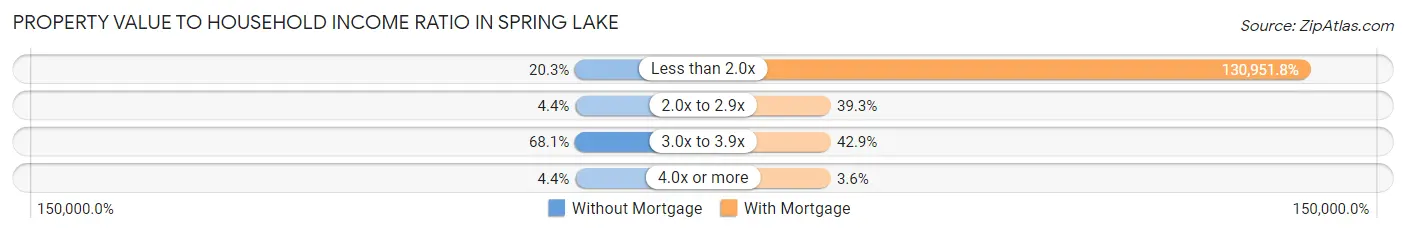
| Value-to-Income Ratio | Without Mortgage | With Mortgage |
| Less than 2.0x | 14 (20.3%) | 73,333 (130,951.8%) |
| 2.0x to 2.9x | 3 (4.3%) | 22 (39.3%) |
| 3.0x to 3.9x | 47 (68.1%) | 24 (42.9%) |
| 4.0x or more | 3 (4.3%) | 2 (3.6%) |
| Total | 69 (100.0%) | 56 (100.0%) |
Real Estate Taxes by Mortgage Status in Spring Lake
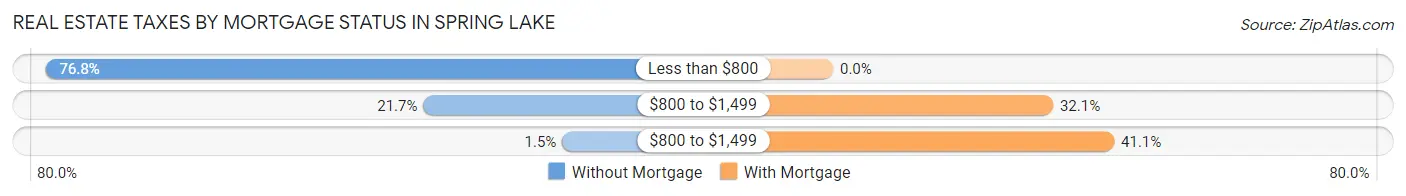
| Property Taxes | Without Mortgage | With Mortgage |
| Less than $800 | 53 (76.8%) | 0 (0.0%) |
| $800 to $1,499 | 15 (21.7%) | 18 (32.1%) |
| $800 to $1,499 | 1 (1.5%) | 23 (41.1%) |
| Total | 69 (100.0%) | 56 (100.0%) |
Health & Disability in Spring Lake
Health Insurance Coverage by Age in Spring Lake
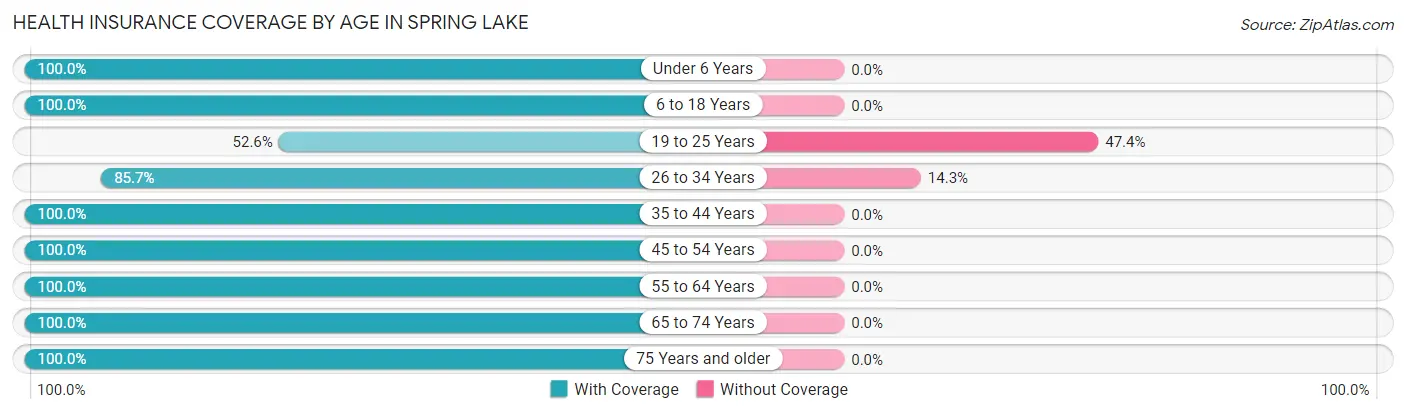
| Age Bracket | With Coverage | Without Coverage |
| Under 6 Years | 1 (100.0%) | 0 (0.0%) |
| 6 to 18 Years | 9 (100.0%) | 0 (0.0%) |
| 19 to 25 Years | 10 (52.6%) | 9 (47.4%) |
| 26 to 34 Years | 12 (85.7%) | 2 (14.3%) |
| 35 to 44 Years | 6 (100.0%) | 0 (0.0%) |
| 45 to 54 Years | 14 (100.0%) | 0 (0.0%) |
| 55 to 64 Years | 56 (100.0%) | 0 (0.0%) |
| 65 to 74 Years | 72 (100.0%) | 0 (0.0%) |
| 75 Years and older | 33 (100.0%) | 0 (0.0%) |
| Total | 213 (95.1%) | 11 (4.9%) |
Health Insurance Coverage by Citizenship Status in Spring Lake
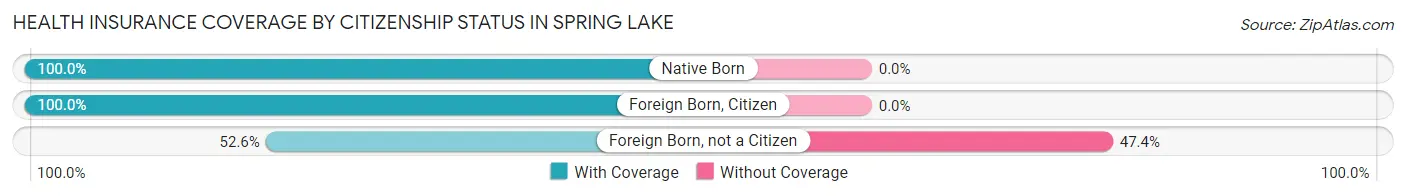
| Citizenship Status | With Coverage | Without Coverage |
| Native Born | 1 (100.0%) | 0 (0.0%) |
| Foreign Born, Citizen | 9 (100.0%) | 0 (0.0%) |
| Foreign Born, not a Citizen | 10 (52.6%) | 9 (47.4%) |
Health Insurance Coverage by Household Income in Spring Lake
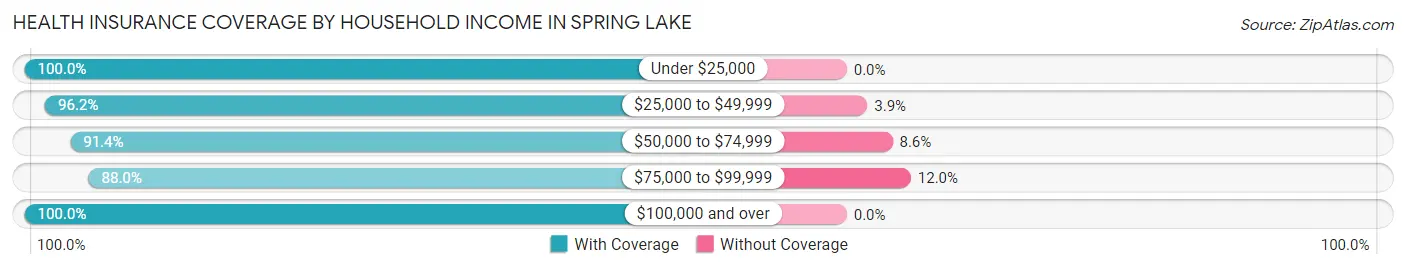
| Household Income | With Coverage | Without Coverage |
| Under $25,000 | 43 (100.0%) | 0 (0.0%) |
| $25,000 to $49,999 | 50 (96.2%) | 2 (3.8%) |
| $50,000 to $74,999 | 32 (91.4%) | 3 (8.6%) |
| $75,000 to $99,999 | 44 (88.0%) | 6 (12.0%) |
| $100,000 and over | 44 (100.0%) | 0 (0.0%) |
Public vs Private Health Insurance Coverage by Age in Spring Lake
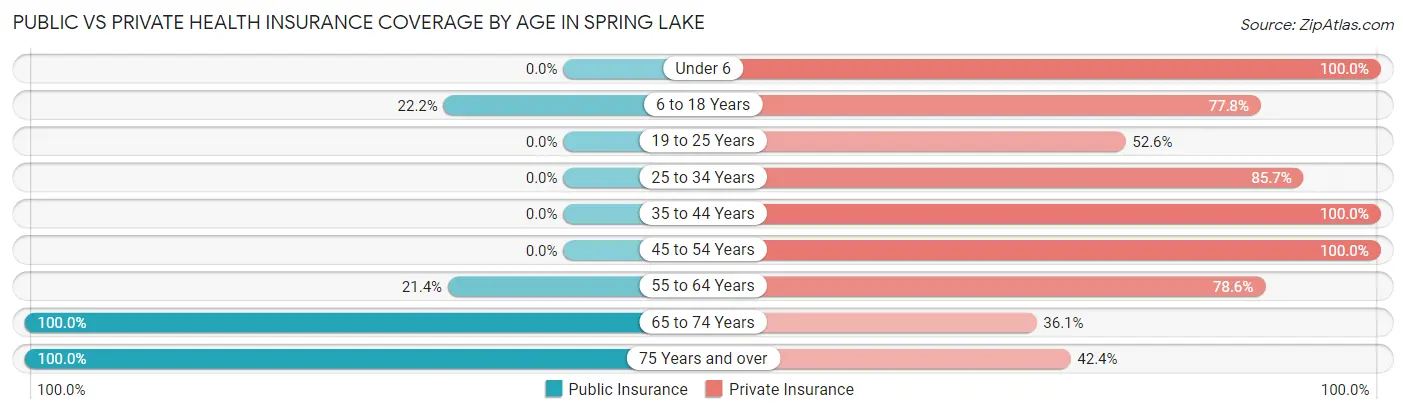
| Age Bracket | Public Insurance | Private Insurance |
| Under 6 | 0 (0.0%) | 1 (100.0%) |
| 6 to 18 Years | 2 (22.2%) | 7 (77.8%) |
| 19 to 25 Years | 0 (0.0%) | 10 (52.6%) |
| 25 to 34 Years | 0 (0.0%) | 12 (85.7%) |
| 35 to 44 Years | 0 (0.0%) | 6 (100.0%) |
| 45 to 54 Years | 0 (0.0%) | 14 (100.0%) |
| 55 to 64 Years | 12 (21.4%) | 44 (78.6%) |
| 65 to 74 Years | 72 (100.0%) | 26 (36.1%) |
| 75 Years and over | 33 (100.0%) | 14 (42.4%) |
| Total | 119 (53.1%) | 134 (59.8%) |
Disability Status by Sex by Age in Spring Lake
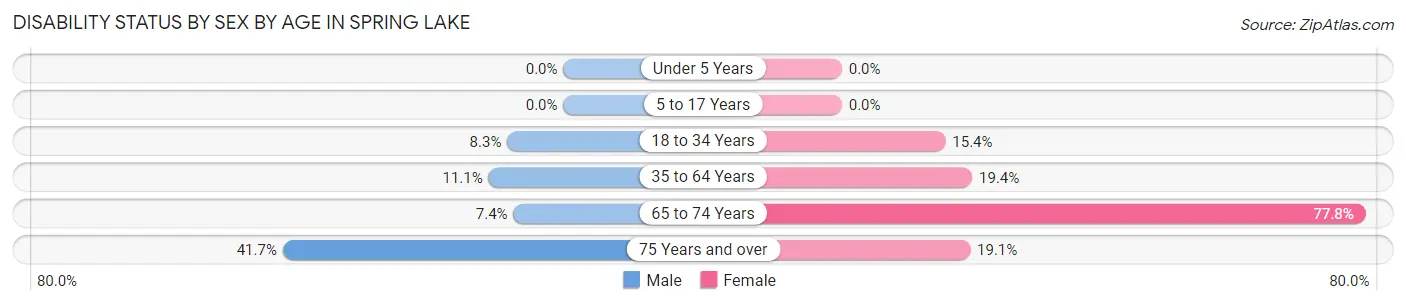
| Age Bracket | Male | Female |
| Under 5 Years | 0 (0.0%) | 0 (0.0%) |
| 5 to 17 Years | 0 (0.0%) | 0 (0.0%) |
| 18 to 34 Years | 2 (8.3%) | 2 (15.4%) |
| 35 to 64 Years | 5 (11.1%) | 6 (19.4%) |
| 65 to 74 Years | 2 (7.4%) | 35 (77.8%) |
| 75 Years and over | 5 (41.7%) | 4 (19.1%) |
Disability Class by Sex by Age in Spring Lake
Disability Class: Hearing Difficulty
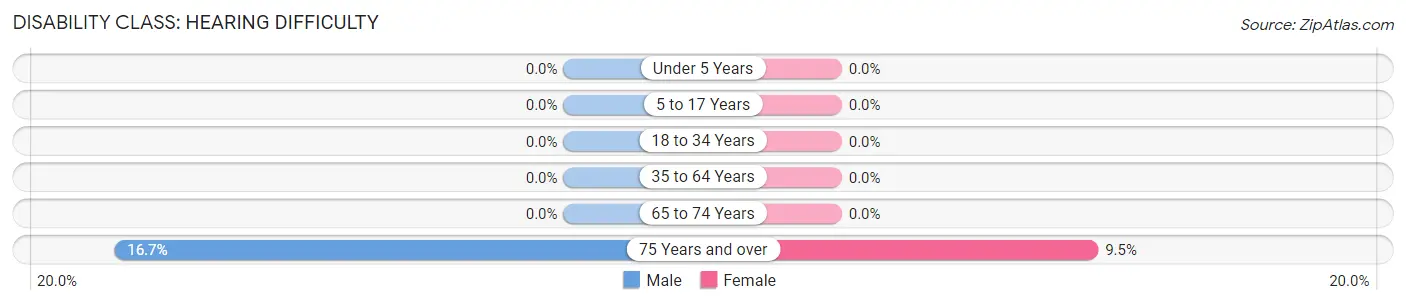
| Age Bracket | Male | Female |
| Under 5 Years | 0 (0.0%) | 0 (0.0%) |
| 5 to 17 Years | 0 (0.0%) | 0 (0.0%) |
| 18 to 34 Years | 0 (0.0%) | 0 (0.0%) |
| 35 to 64 Years | 0 (0.0%) | 0 (0.0%) |
| 65 to 74 Years | 0 (0.0%) | 0 (0.0%) |
| 75 Years and over | 2 (16.7%) | 2 (9.5%) |
Disability Class: Vision Difficulty
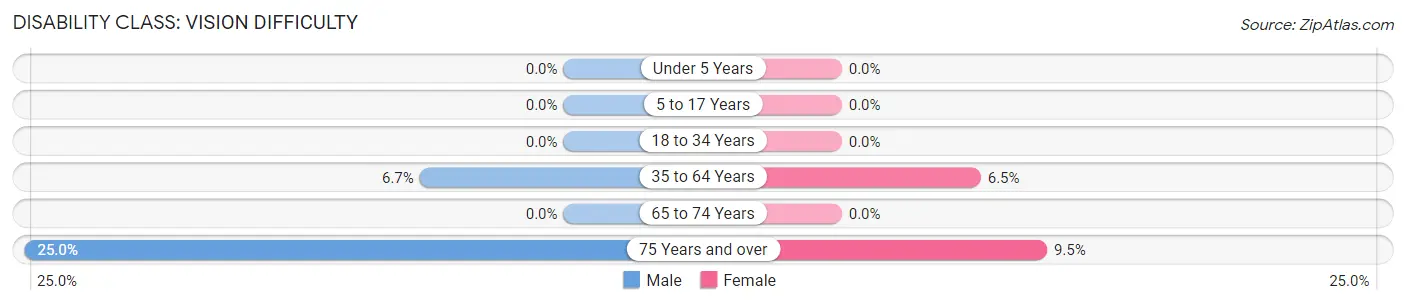
| Age Bracket | Male | Female |
| Under 5 Years | 0 (0.0%) | 0 (0.0%) |
| 5 to 17 Years | 0 (0.0%) | 0 (0.0%) |
| 18 to 34 Years | 0 (0.0%) | 0 (0.0%) |
| 35 to 64 Years | 3 (6.7%) | 2 (6.5%) |
| 65 to 74 Years | 0 (0.0%) | 0 (0.0%) |
| 75 Years and over | 3 (25.0%) | 2 (9.5%) |
Disability Class: Cognitive Difficulty
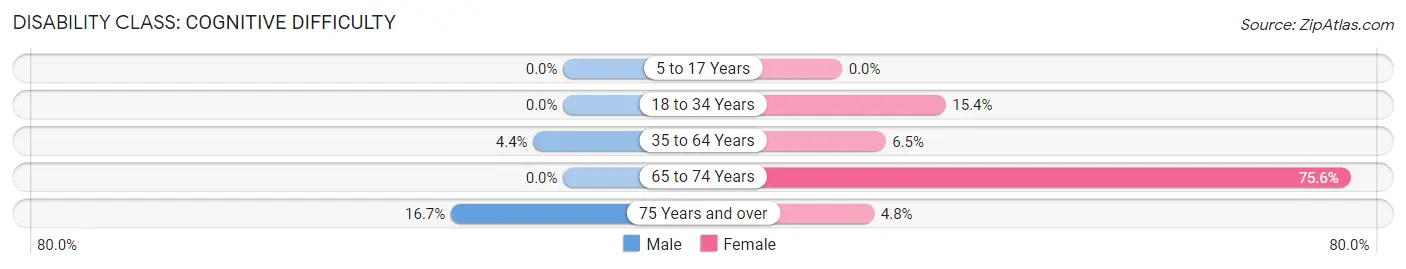
| Age Bracket | Male | Female |
| 5 to 17 Years | 0 (0.0%) | 0 (0.0%) |
| 18 to 34 Years | 0 (0.0%) | 2 (15.4%) |
| 35 to 64 Years | 2 (4.4%) | 2 (6.5%) |
| 65 to 74 Years | 0 (0.0%) | 34 (75.6%) |
| 75 Years and over | 2 (16.7%) | 1 (4.8%) |
Disability Class: Ambulatory Difficulty
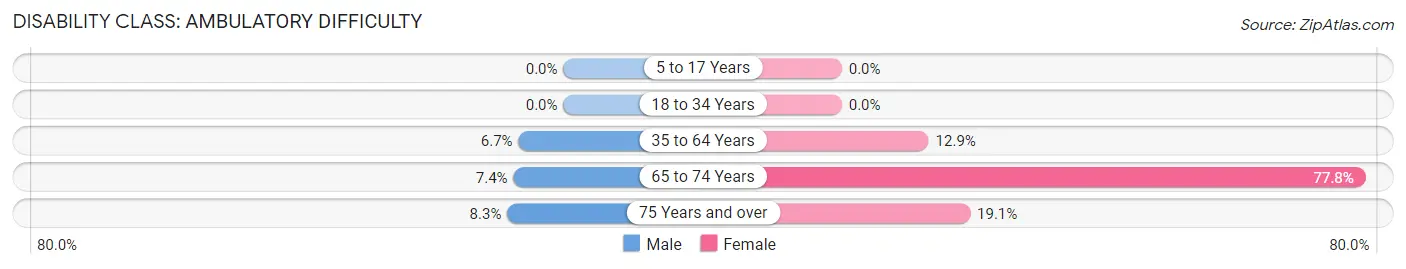
| Age Bracket | Male | Female |
| 5 to 17 Years | 0 (0.0%) | 0 (0.0%) |
| 18 to 34 Years | 0 (0.0%) | 0 (0.0%) |
| 35 to 64 Years | 3 (6.7%) | 4 (12.9%) |
| 65 to 74 Years | 2 (7.4%) | 35 (77.8%) |
| 75 Years and over | 1 (8.3%) | 4 (19.1%) |
Disability Class: Self-Care Difficulty
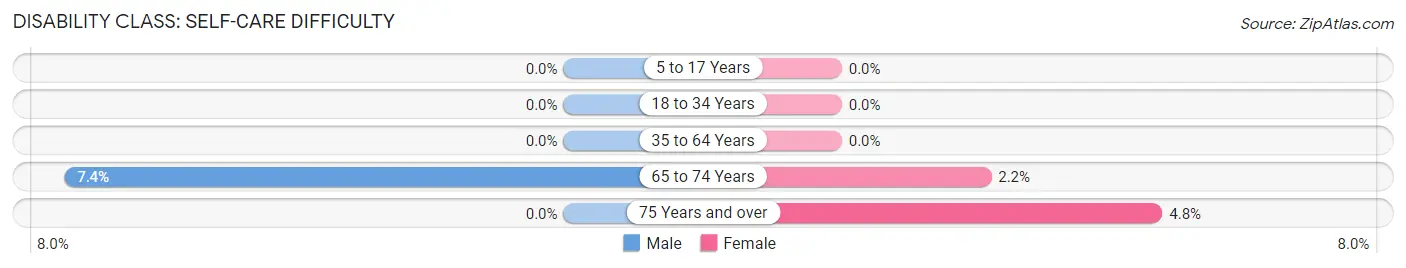
| Age Bracket | Male | Female |
| 5 to 17 Years | 0 (0.0%) | 0 (0.0%) |
| 18 to 34 Years | 0 (0.0%) | 0 (0.0%) |
| 35 to 64 Years | 0 (0.0%) | 0 (0.0%) |
| 65 to 74 Years | 2 (7.4%) | 1 (2.2%) |
| 75 Years and over | 0 (0.0%) | 1 (4.8%) |
Technology Access in Spring Lake
Computing Device Access in Spring Lake
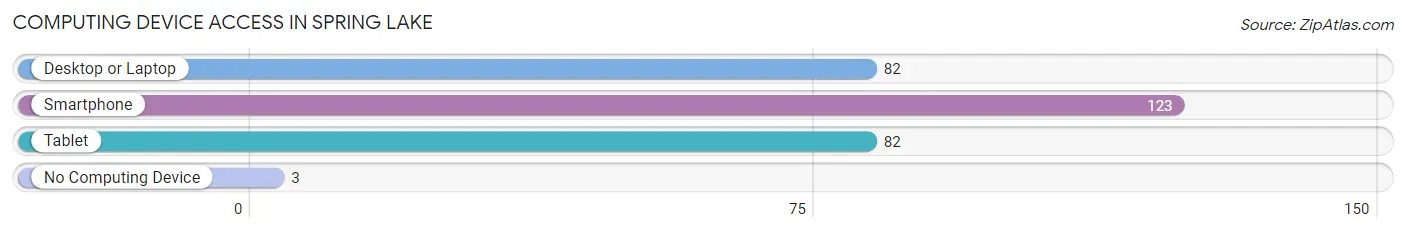
| Device Type | # Households | % Households |
| Desktop or Laptop | 82 | 62.6% |
| Smartphone | 123 | 93.9% |
| Tablet | 82 | 62.6% |
| No Computing Device | 3 | 2.3% |
| Total | 131 | 100.0% |
Internet Access in Spring Lake
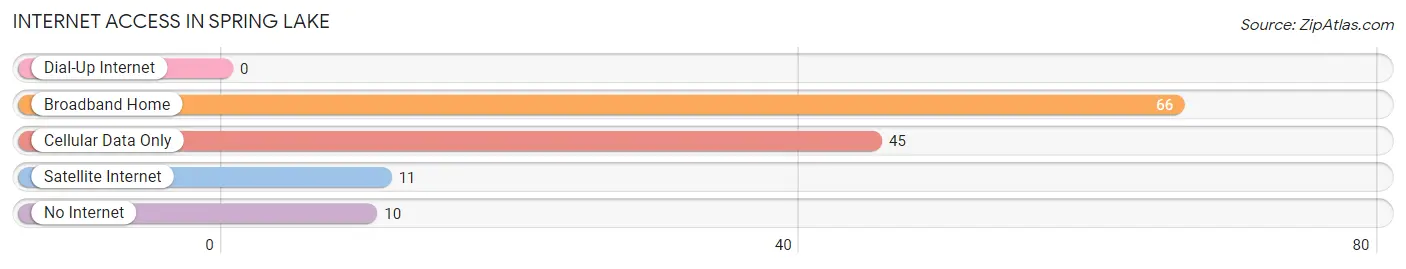
| Internet Type | # Households | % Households |
| Dial-Up Internet | 0 | 0.0% |
| Broadband Home | 66 | 50.4% |
| Cellular Data Only | 45 | 34.4% |
| Satellite Internet | 11 | 8.4% |
| No Internet | 10 | 7.6% |
| Total | 131 | 100.0% |
Spring Lake Summary
History
Spring Lake, Indiana is a small town located in the northwest corner of the state, just south of the Michigan border. It is part of the Grand Rapids metropolitan area and is home to a population of just over 2,000 people. The town was founded in 1837 by a group of settlers from New York and Pennsylvania who were looking for a place to settle and start a new life. The town was named after the nearby lake, which was named for the abundance of springs that fed it.
The town was originally a farming community, but in the late 19th century, it began to develop into a manufacturing center. The first major industry to come to the area was the Spring Lake Iron Works, which opened in 1883. This company produced a variety of products, including stoves, boilers, and other metal products. The company was eventually sold to the American Seating Company in the early 20th century, and the factory was closed in the 1950s.
In the early 20th century, the town also saw the development of several other industries, including a furniture factory, a canning factory, and a brickyard. These industries provided employment for many of the town’s residents and helped to make Spring Lake a thriving community.
Geography
Spring Lake is located in the northwest corner of Indiana, just south of the Michigan border. It is part of the Grand Rapids metropolitan area and is situated on the banks of the Grand River. The town is surrounded by rolling hills and farmland, and is home to several small lakes, including Spring Lake, which gives the town its name.
The town is located about 25 miles from the city of Grand Rapids, and is accessible by both Interstate 96 and US Highway 131. The nearest major airport is Gerald R. Ford International Airport, located about 40 miles away in Grand Rapids.
Economy
The economy of Spring Lake is largely based on agriculture and manufacturing. The town is home to several small businesses, including a furniture factory, a canning factory, and a brickyard. The town also has a number of retail stores, restaurants, and other services.
The town is also home to a number of small farms, which produce a variety of crops, including corn, soybeans, and wheat. The town is also home to a number of wineries, which produce a variety of wines.
Demographics
As of the 2010 census, the population of Spring Lake was 2,072. The town is predominantly white, with a small African American population. The median household income is $45,000, and the median home value is $125,000. The town has a low unemployment rate of 4.2%.
Conclusion
Spring Lake, Indiana is a small town located in the northwest corner of the state, just south of the Michigan border. It is part of the Grand Rapids metropolitan area and is home to a population of just over 2,000 people. The town was founded in 1837 by a group of settlers from New York and Pennsylvania who were looking for a place to settle and start a new life. The town’s economy is largely based on agriculture and manufacturing, and it is home to several small businesses, farms, and wineries. The town is predominantly white, with a small African American population, and the median household income is $45,000.
Common Questions
What is the Total Population of Spring Lake?
Total Population of Spring Lake is 224.
What is the Total Male Population of Spring Lake?
Total Male Population of Spring Lake is 111.
What is the Total Female Population of Spring Lake?
Total Female Population of Spring Lake is 113.
What is the Ratio of Males per 100 Females in Spring Lake?
There are 98.23 Males per 100 Females in Spring Lake.
What is the Ratio of Females per 100 Males in Spring Lake?
There are 101.80 Females per 100 Males in Spring Lake.
What is the Median Population Age in Spring Lake?
Median Population Age in Spring Lake is 64.2 Years.
What is the Average Family Size in Spring Lake
Average Family Size in Spring Lake is 2.6 People.
What is the Average Household Size in Spring Lake
Average Household Size in Spring Lake is 1.7 People.
What is Per Capita Income in Spring Lake?
Per Capita income in Spring Lake is $37,222.
What is the Median Family Income in Spring Lake?
Median Family Income in Spring Lake is $91,071.
What is the Median Household income in Spring Lake?
Median Household Income in Spring Lake is $43,958.
What is Income or Wage Gap in Spring Lake?
Income or Wage Gap in Spring Lake is 9.8%.
Women in Spring Lake earn 90.2 cents for every dollar earned by a man.
What is Inequality or Gini Index in Spring Lake?
Inequality or Gini Index in Spring Lake is 0.40.
How Large is the Labor Force in Spring Lake?
There are 103 People in the Labor Forcein in Spring Lake.
What is the Percentage of People in the Labor Force in Spring Lake?
46.8% of People are in the Labor Force in Spring Lake.
What is the Unemployment Rate in Spring Lake?
Unemployment Rate in Spring Lake is 4.9%.