St Paul, IN
St Paul Map
St Paul Overview
934
TOTAL POPULATION
428
MALE POPULATION
506
FEMALE POPULATION
84.58
MALES / 100 FEMALES
118.22
FEMALES / 100 MALES
29.4
MEDIAN AGE
3.3
AVG FAMILY SIZE
3.0
AVG HOUSEHOLD SIZE
$24,123
PER CAPITA INCOME
$75,500
AVG FAMILY INCOME
$63,333
AVG HOUSEHOLD INCOME
42.5%
WAGE / INCOME GAP [ % ]
57.5¢/ $1
WAGE / INCOME GAP [ $ ]
0.35
INEQUALITY / GINI INDEX
396
LABOR FORCE [ PEOPLE ]
62.5%
PERCENT IN LABOR FORCE
3.8%
UNEMPLOYMENT RATE
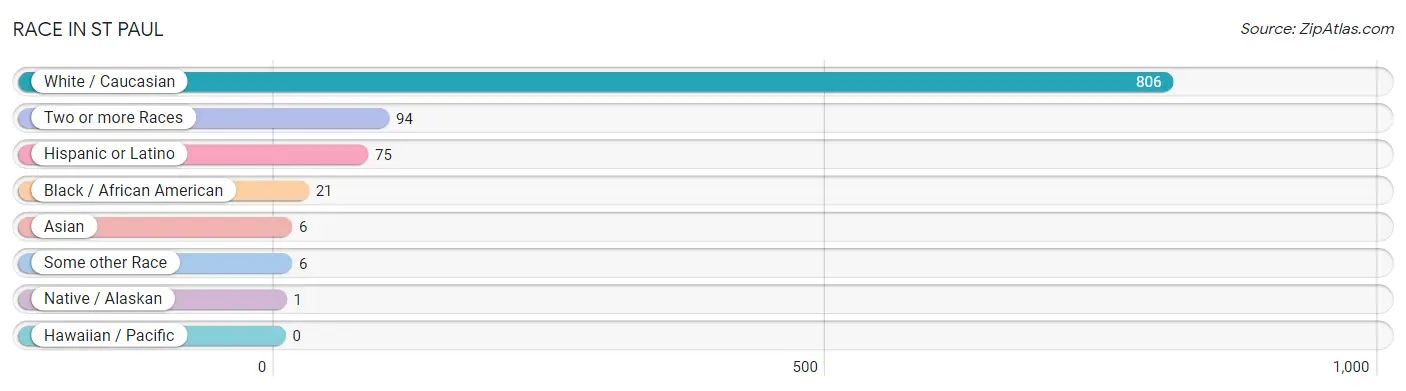
Race in St Paul
The most populous races in St Paul are White / Caucasian (806 | 86.3%), Two or more Races (94 | 10.1%), and Hispanic or Latino (75 | 8.0%).
| Race | # Population | % Population |
| Asian | 6 | 0.6% |
| Black / African American | 21 | 2.2% |
| Hawaiian / Pacific | 0 | 0.0% |
| Hispanic or Latino | 75 | 8.0% |
| Native / Alaskan | 1 | 0.1% |
| White / Caucasian | 806 | 86.3% |
| Two or more Races | 94 | 10.1% |
| Some other Race | 6 | 0.6% |
| Total | 934 | 100.0% |
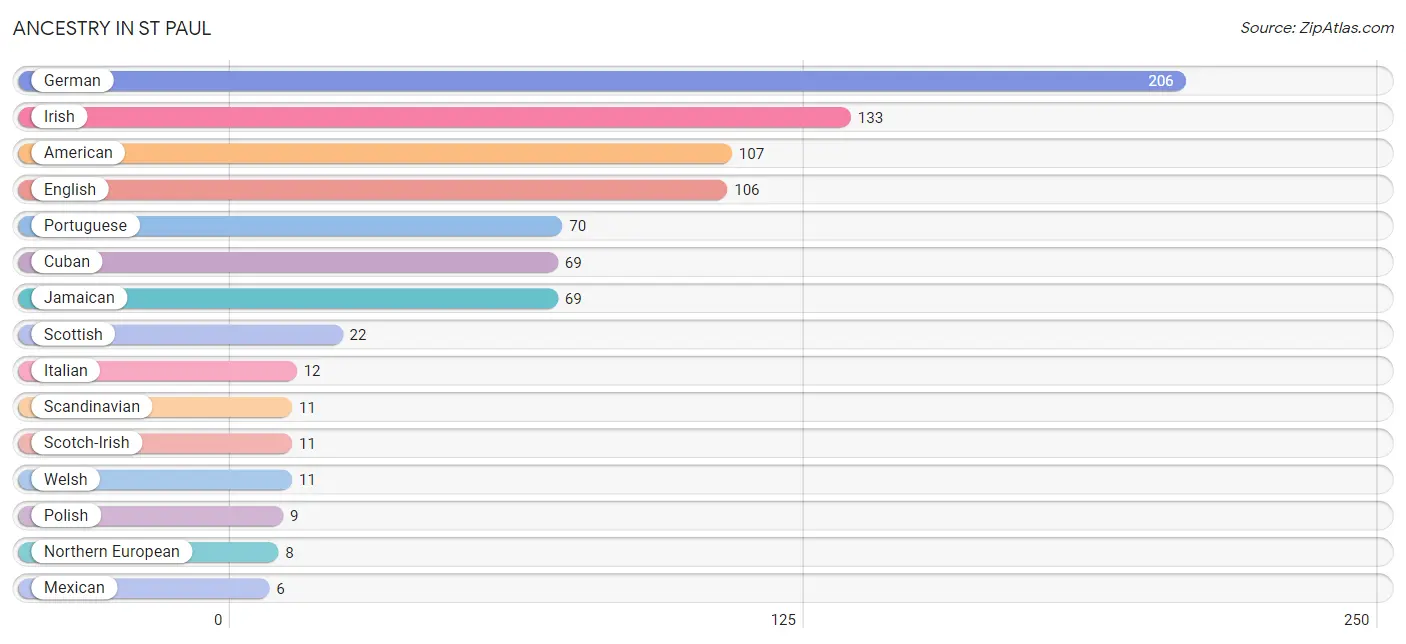
Ancestry in St Paul
The most populous ancestries reported in St Paul are German (206 | 22.1%), Irish (133 | 14.2%), American (107 | 11.5%), English (106 | 11.4%), and Portuguese (70 | 7.5%), together accounting for 66.6% of all St Paul residents.
| Ancestry | # Population | % Population |
| American | 107 | 11.5% |
| British | 3 | 0.3% |
| Cuban | 69 | 7.4% |
| Dutch | 4 | 0.4% |
| English | 106 | 11.4% |
| European | 3 | 0.3% |
| German | 206 | 22.1% |
| Irish | 133 | 14.2% |
| Iroquois | 1 | 0.1% |
| Italian | 12 | 1.3% |
| Jamaican | 69 | 7.4% |
| Japanese | 1 | 0.1% |
| Mexican | 6 | 0.6% |
| Northern European | 8 | 0.9% |
| Polish | 9 | 1.0% |
| Portuguese | 70 | 7.5% |
| Scandinavian | 11 | 1.2% |
| Scotch-Irish | 11 | 1.2% |
| Scottish | 22 | 2.4% |
| Welsh | 11 | 1.2% | View All 20 Rows |
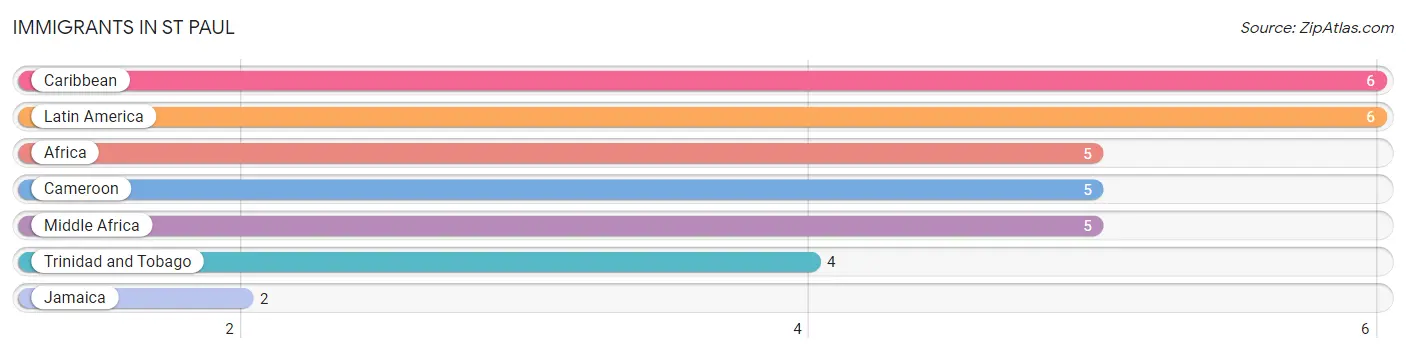
Immigrants in St Paul
The most numerous immigrant groups reported in St Paul came from Caribbean (6 | 0.6%), Latin America (6 | 0.6%), Africa (5 | 0.5%), Cameroon (5 | 0.5%), and Middle Africa (5 | 0.5%), together accounting for 2.9% of all St Paul residents.
| Immigration Origin | # Population | % Population |
| Africa | 5 | 0.5% |
| Cameroon | 5 | 0.5% |
| Caribbean | 6 | 0.6% |
| Jamaica | 2 | 0.2% |
| Latin America | 6 | 0.6% |
| Middle Africa | 5 | 0.5% |
| Trinidad and Tobago | 4 | 0.4% | View All 7 Rows |
Sex and Age in St Paul
Sex and Age in St Paul
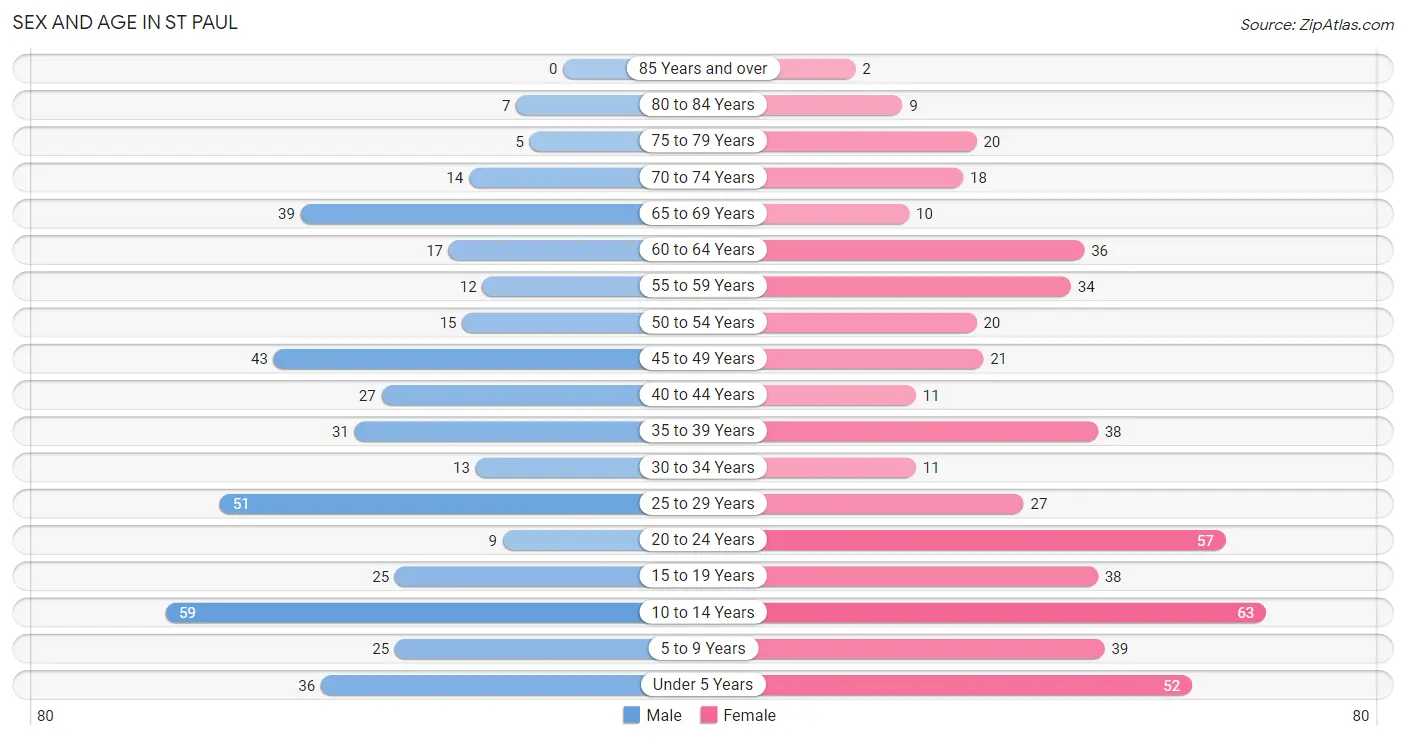
The most populous age groups in St Paul are 10 to 14 Years (59 | 13.8%) for men and 10 to 14 Years (63 | 12.4%) for women.
| Age Bracket | Male | Female |
| Under 5 Years | 36 (8.4%) | 52 (10.3%) |
| 5 to 9 Years | 25 (5.8%) | 39 (7.7%) |
| 10 to 14 Years | 59 (13.8%) | 63 (12.4%) |
| 15 to 19 Years | 25 (5.8%) | 38 (7.5%) |
| 20 to 24 Years | 9 (2.1%) | 57 (11.3%) |
| 25 to 29 Years | 51 (11.9%) | 27 (5.3%) |
| 30 to 34 Years | 13 (3.0%) | 11 (2.2%) |
| 35 to 39 Years | 31 (7.2%) | 38 (7.5%) |
| 40 to 44 Years | 27 (6.3%) | 11 (2.2%) |
| 45 to 49 Years | 43 (10.1%) | 21 (4.2%) |
| 50 to 54 Years | 15 (3.5%) | 20 (4.0%) |
| 55 to 59 Years | 12 (2.8%) | 34 (6.7%) |
| 60 to 64 Years | 17 (4.0%) | 36 (7.1%) |
| 65 to 69 Years | 39 (9.1%) | 10 (2.0%) |
| 70 to 74 Years | 14 (3.3%) | 18 (3.6%) |
| 75 to 79 Years | 5 (1.2%) | 20 (4.0%) |
| 80 to 84 Years | 7 (1.6%) | 9 (1.8%) |
| 85 Years and over | 0 (0.0%) | 2 (0.4%) |
| Total | 428 (100.0%) | 506 (100.0%) |
Families and Households in St Paul
Median Family Size in St Paul
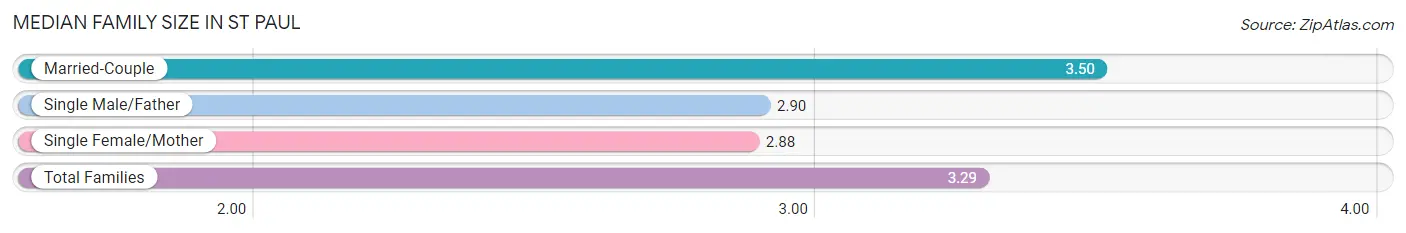
The median family size in St Paul is 3.29 persons per family, with married-couple families (159 | 65.7%) accounting for the largest median family size of 3.5 persons per family. On the other hand, single female/mother families (34 | 14.1%) represent the smallest median family size with 2.88 persons per family.
| Family Type | # Families | Family Size |
| Married-Couple | 159 (65.7%) | 3.50 |
| Single Male/Father | 49 (20.3%) | 2.90 |
| Single Female/Mother | 34 (14.1%) | 2.88 |
| Total Families | 242 (100.0%) | 3.29 |
Median Household Size in St Paul
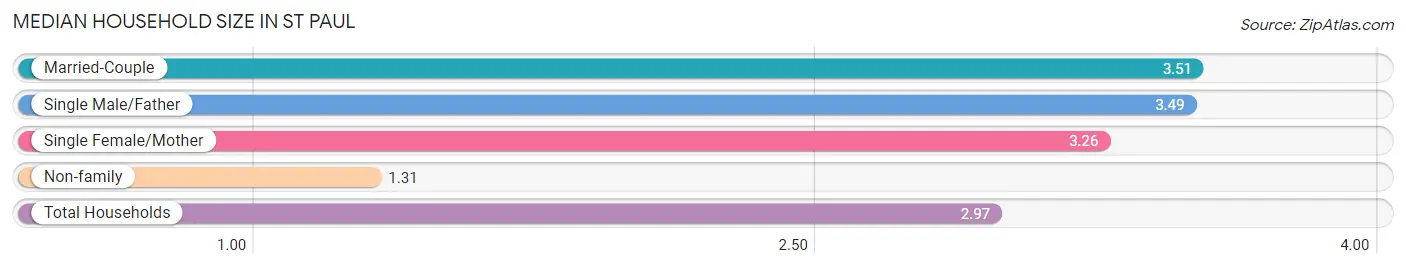
The median household size in St Paul is 2.97 persons per household, with married-couple households (159 | 50.6%) accounting for the largest median household size of 3.51 persons per household. non-family households (72 | 22.9%) represent the smallest median household size with 1.31 persons per household.
| Household Type | # Households | Household Size |
| Married-Couple | 159 (50.6%) | 3.51 |
| Single Male/Father | 49 (15.6%) | 3.49 |
| Single Female/Mother | 34 (10.8%) | 3.26 |
| Non-family | 72 (22.9%) | 1.31 |
| Total Households | 314 (100.0%) | 2.97 |
Household Size by Marriage Status in St Paul
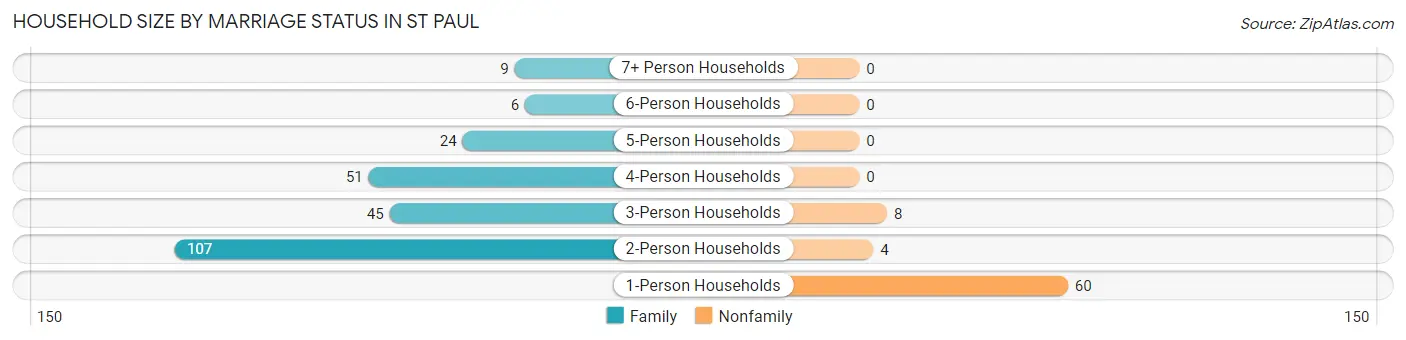
Out of a total of 314 households in St Paul, 242 (77.1%) are family households, while 72 (22.9%) are nonfamily households. The most numerous type of family households are 2-person households, comprising 107, and the most common type of nonfamily households are 1-person households, comprising 60.
| Household Size | Family Households | Nonfamily Households |
| 1-Person Households | - | 60 (19.1%) |
| 2-Person Households | 107 (34.1%) | 4 (1.3%) |
| 3-Person Households | 45 (14.3%) | 8 (2.5%) |
| 4-Person Households | 51 (16.2%) | 0 (0.0%) |
| 5-Person Households | 24 (7.6%) | 0 (0.0%) |
| 6-Person Households | 6 (1.9%) | 0 (0.0%) |
| 7+ Person Households | 9 (2.9%) | 0 (0.0%) |
| Total | 242 (77.1%) | 72 (22.9%) |
Female Fertility in St Paul
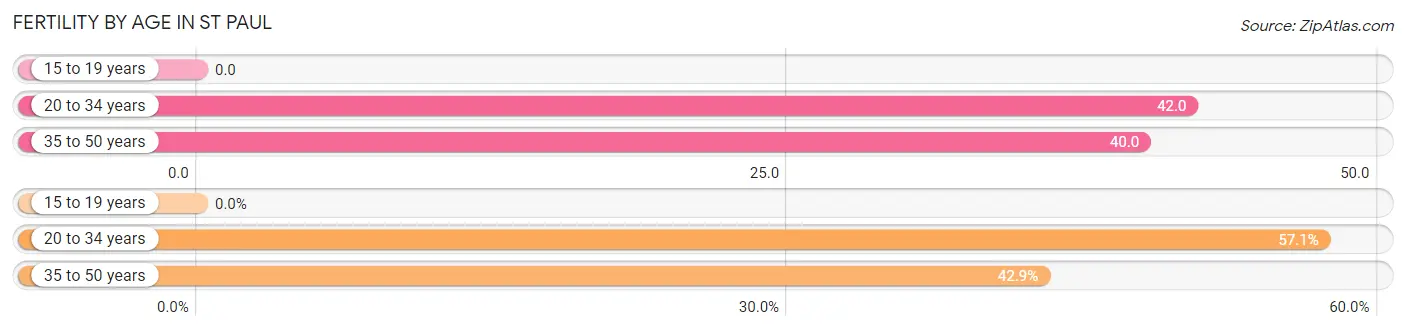
Fertility by Age in St Paul
Average fertility rate in St Paul is 34.0 births per 1,000 women. Women in the age bracket of 20 to 34 years have the highest fertility rate with 42.0 births per 1,000 women. Women in the age bracket of 20 to 34 years acount for 57.1% of all women with births.
| Age Bracket | Women with Births | Births / 1,000 Women |
| 15 to 19 years | 0 (0.0%) | 0.0 |
| 20 to 34 years | 4 (57.1%) | 42.0 |
| 35 to 50 years | 3 (42.9%) | 40.0 |
| Total | 7 (100.0%) | 34.0 |
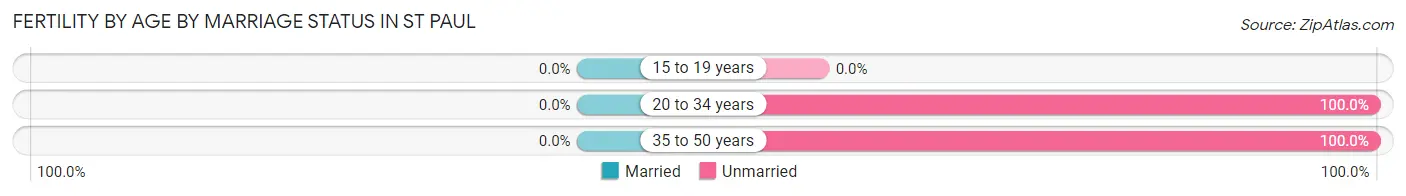
Fertility by Age by Marriage Status in St Paul
| Age Bracket | Married | Unmarried |
| 15 to 19 years | 0 (0.0%) | 0 (0.0%) |
| 20 to 34 years | 0 (0.0%) | 4 (100.0%) |
| 35 to 50 years | 0 (0.0%) | 3 (100.0%) |
| Total | 0 (0.0%) | 7 (100.0%) |
Fertility by Education in St Paul
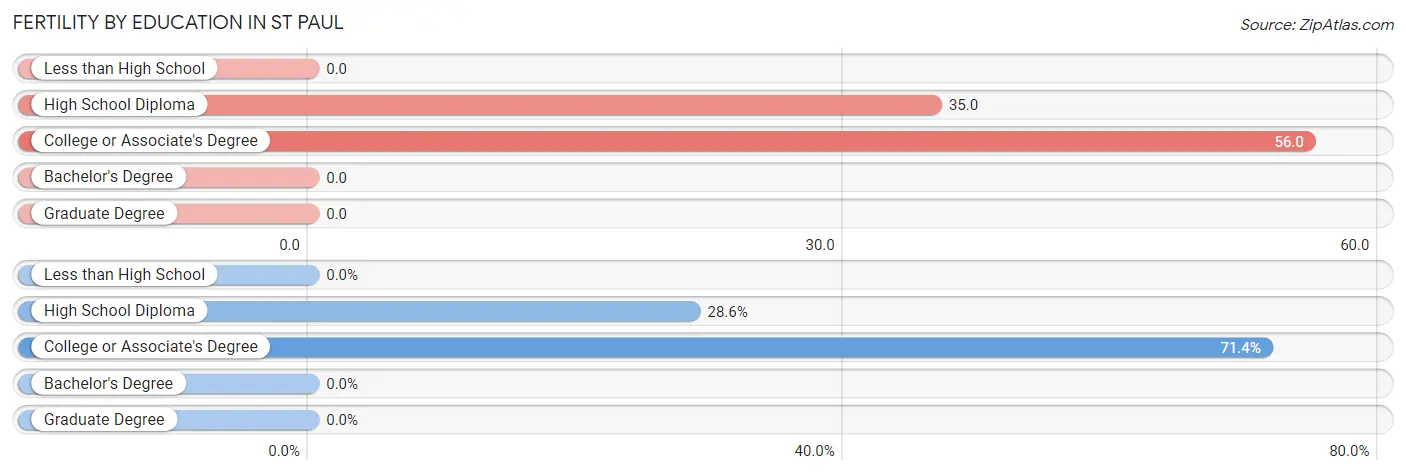
| Educational Attainment | Women with Births | Births / 1,000 Women |
| Less than High School | 0 (0.0%) | 0.0 |
| High School Diploma | 2 (28.6%) | 35.0 |
| College or Associate's Degree | 5 (71.4%) | 56.0 |
| Bachelor's Degree | 0 (0.0%) | 0.0 |
| Graduate Degree | 0 (0.0%) | 0.0 |
| Total | 7 (100.0%) | 34.0 |
Fertility by Education by Marriage Status in St Paul
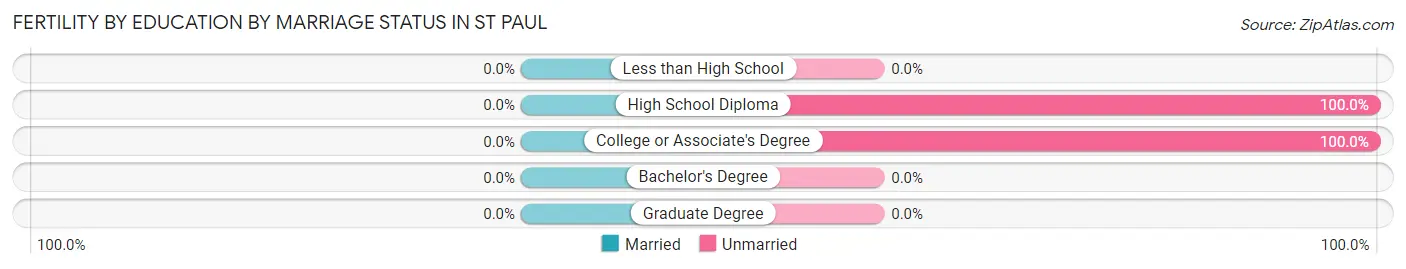
| Educational Attainment | Married | Unmarried |
| Less than High School | 0 (0.0%) | 0 (0.0%) |
| High School Diploma | 0 (0.0%) | 2 (100.0%) |
| College or Associate's Degree | 0 (0.0%) | 5 (100.0%) |
| Bachelor's Degree | 0 (0.0%) | 0 (0.0%) |
| Graduate Degree | 0 (0.0%) | 0 (0.0%) |
| Total | 0 (0.0%) | 7 (100.0%) |
Income in St Paul
Income Overview in St Paul
Per Capita Income in St Paul is $24,123, while median incomes of families and households are $75,500 and $63,333 respectively.
| Characteristic | Number | Measure |
| Per Capita Income | 934 | $24,123 |
| Median Family Income | 242 | $75,500 |
| Mean Family Income | 242 | $77,492 |
| Median Household Income | 314 | $63,333 |
| Mean Household Income | 314 | $72,178 |
| Income Deficit | 242 | $0 |
| Wage / Income Gap (%) | 934 | 42.48% |
| Wage / Income Gap ($) | 934 | 57.52¢ per $1 |
| Gini / Inequality Index | 934 | 0.35 |
Earnings by Sex in St Paul
Average Earnings in St Paul are $38,472, $50,625 for men and $29,118 for women, a difference of 42.5%.
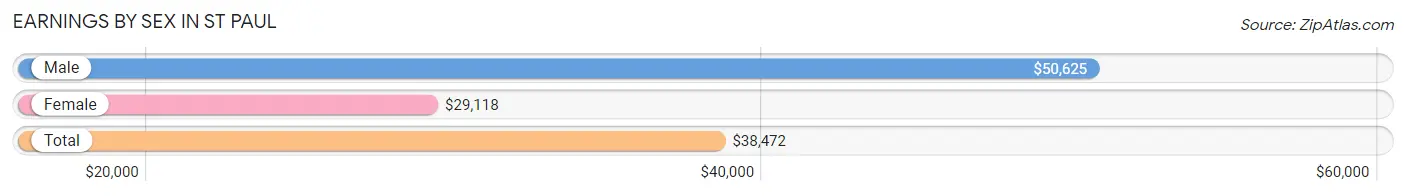
| Sex | Number | Average Earnings |
| Male | 239 (53.5%) | $50,625 |
| Female | 208 (46.5%) | $29,118 |
| Total | 447 (100.0%) | $38,472 |
Earnings by Sex by Income Bracket in St Paul
The most common earnings brackets in St Paul are $75,000 to $99,999 for men (41 | 17.2%) and $5,000 to $7,499 for women (40 | 19.2%).
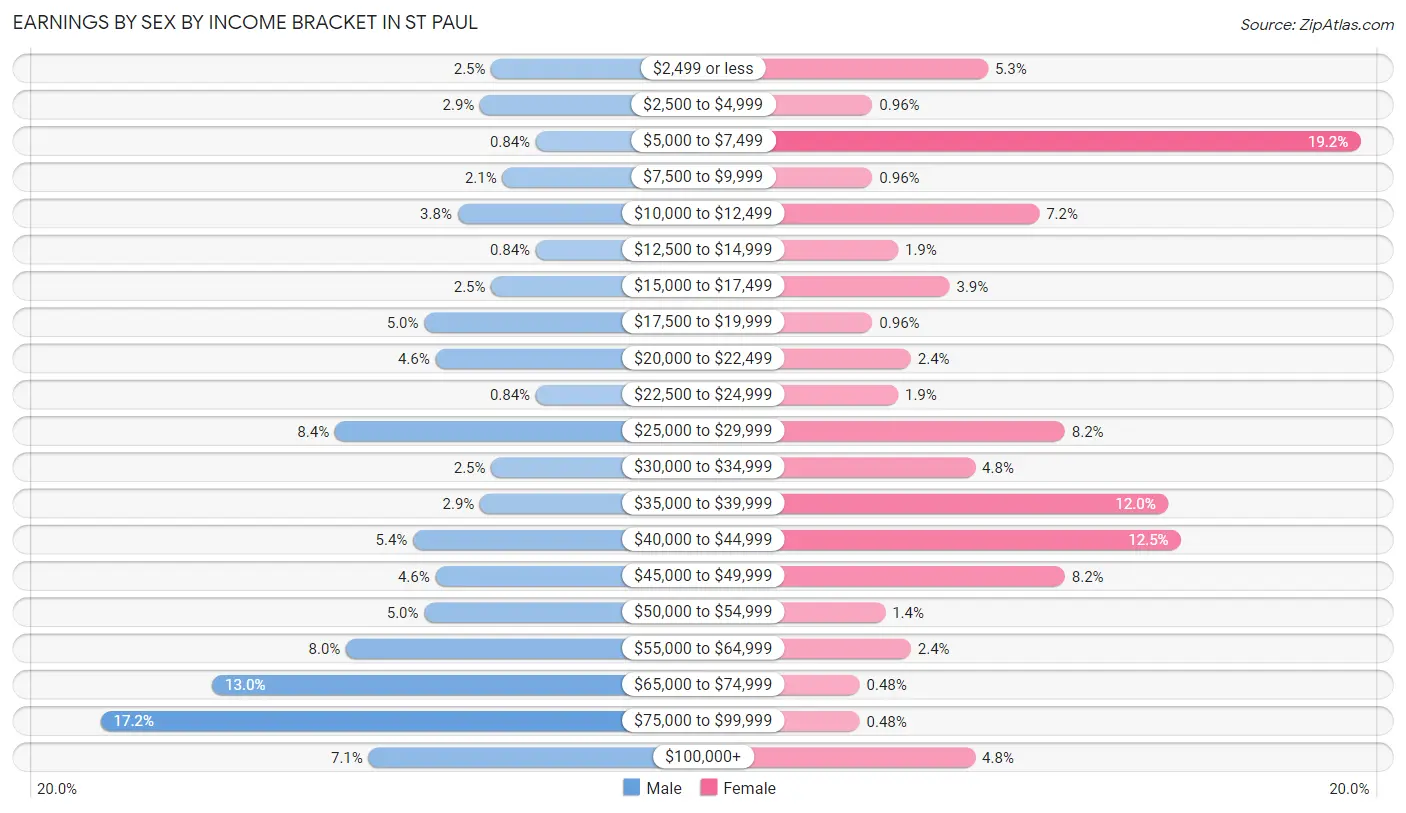
| Income | Male | Female |
| $2,499 or less | 6 (2.5%) | 11 (5.3%) |
| $2,500 to $4,999 | 7 (2.9%) | 2 (1.0%) |
| $5,000 to $7,499 | 2 (0.8%) | 40 (19.2%) |
| $7,500 to $9,999 | 5 (2.1%) | 2 (1.0%) |
| $10,000 to $12,499 | 9 (3.8%) | 15 (7.2%) |
| $12,500 to $14,999 | 2 (0.8%) | 4 (1.9%) |
| $15,000 to $17,499 | 6 (2.5%) | 8 (3.8%) |
| $17,500 to $19,999 | 12 (5.0%) | 2 (1.0%) |
| $20,000 to $22,499 | 11 (4.6%) | 5 (2.4%) |
| $22,500 to $24,999 | 2 (0.8%) | 4 (1.9%) |
| $25,000 to $29,999 | 20 (8.4%) | 17 (8.2%) |
| $30,000 to $34,999 | 6 (2.5%) | 10 (4.8%) |
| $35,000 to $39,999 | 7 (2.9%) | 25 (12.0%) |
| $40,000 to $44,999 | 13 (5.4%) | 26 (12.5%) |
| $45,000 to $49,999 | 11 (4.6%) | 17 (8.2%) |
| $50,000 to $54,999 | 12 (5.0%) | 3 (1.4%) |
| $55,000 to $64,999 | 19 (8.0%) | 5 (2.4%) |
| $65,000 to $74,999 | 31 (13.0%) | 1 (0.5%) |
| $75,000 to $99,999 | 41 (17.2%) | 1 (0.5%) |
| $100,000+ | 17 (7.1%) | 10 (4.8%) |
| Total | 239 (100.0%) | 208 (100.0%) |
Earnings by Sex by Educational Attainment in St Paul
Average earnings in St Paul are $53,625 for men and $38,350 for women, a difference of 28.5%. Men with an educational attainment of less than high school enjoy the highest average annual earnings of $66,250, while those with high school diploma education earn the least with $42,750. Women with an educational attainment of college or associate's degree earn the most with the average annual earnings of $39,375, while those with high school diploma education have the smallest earnings of $31,250.
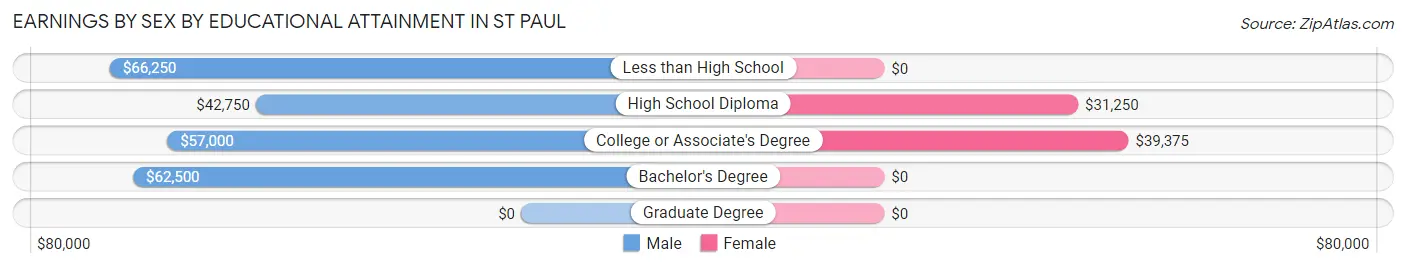
| Educational Attainment | Male Income | Female Income |
| Less than High School | $66,250 | $0 |
| High School Diploma | $42,750 | $31,250 |
| College or Associate's Degree | $57,000 | $39,375 |
| Bachelor's Degree | $62,500 | $0 |
| Graduate Degree | - | - |
| Total | $53,625 | $38,350 |
Family Income in St Paul
Family Income Brackets in St Paul
According to the St Paul family income data, there are 59 families falling into the $100,000 to $149,999 income range, which is the most common income bracket and makes up 24.4% of all families.
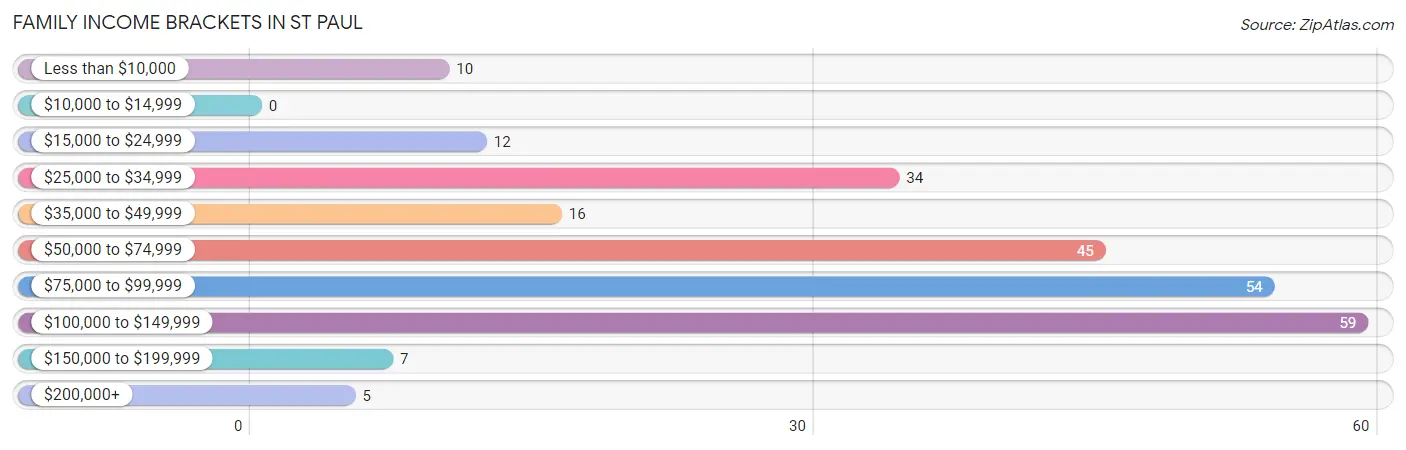
| Income Bracket | # Families | % Families |
| Less than $10,000 | 10 | 4.1% |
| $10,000 to $14,999 | 0 | 0.0% |
| $15,000 to $24,999 | 12 | 5.0% |
| $25,000 to $34,999 | 34 | 14.0% |
| $35,000 to $49,999 | 16 | 6.6% |
| $50,000 to $74,999 | 45 | 18.6% |
| $75,000 to $99,999 | 54 | 22.3% |
| $100,000 to $149,999 | 59 | 24.4% |
| $150,000 to $199,999 | 7 | 2.9% |
| $200,000+ | 5 | 2.1% |
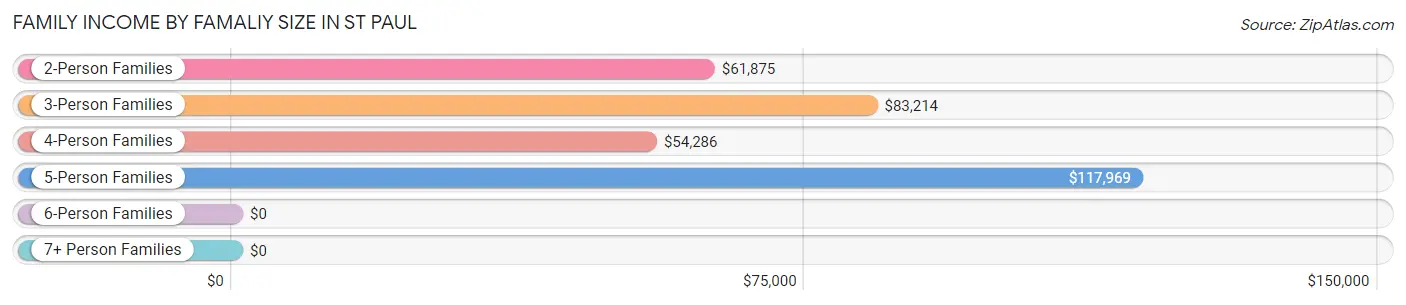
Family Income by Famaliy Size in St Paul
5-person families (23 | 9.5%) account for the highest median family income in St Paul with $117,969 per family, while 2-person families (115 | 47.5%) have the highest median income of $30,938 per family member.
| Income Bracket | # Families | Median Income |
| 2-Person Families | 115 (47.5%) | $61,875 |
| 3-Person Families | 62 (25.6%) | $83,214 |
| 4-Person Families | 30 (12.4%) | $54,286 |
| 5-Person Families | 23 (9.5%) | $117,969 |
| 6-Person Families | 3 (1.2%) | $0 |
| 7+ Person Families | 9 (3.7%) | $0 |
| Total | 242 (100.0%) | $75,500 |
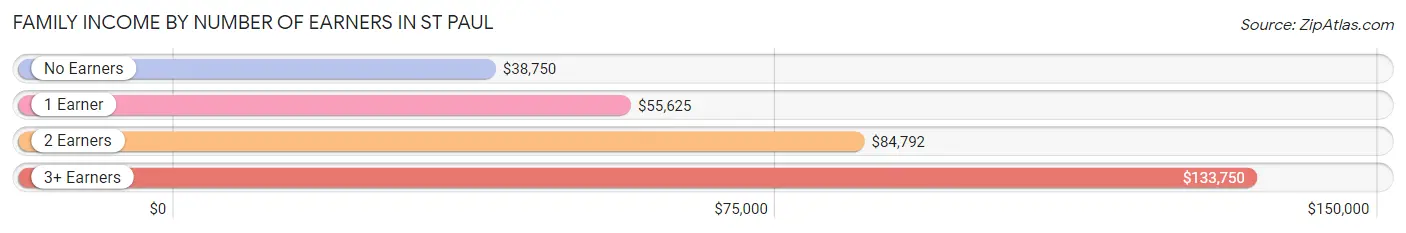
Family Income by Number of Earners in St Paul
The median family income in St Paul is $75,500, with families comprising 3+ earners (13) having the highest median family income of $133,750, while families with no earners (22) have the lowest median family income of $38,750, accounting for 5.4% and 9.1% of families, respectively.
| Number of Earners | # Families | Median Income |
| No Earners | 22 (9.1%) | $38,750 |
| 1 Earner | 119 (49.2%) | $55,625 |
| 2 Earners | 88 (36.4%) | $84,792 |
| 3+ Earners | 13 (5.4%) | $133,750 |
| Total | 242 (100.0%) | $75,500 |
Household Income in St Paul
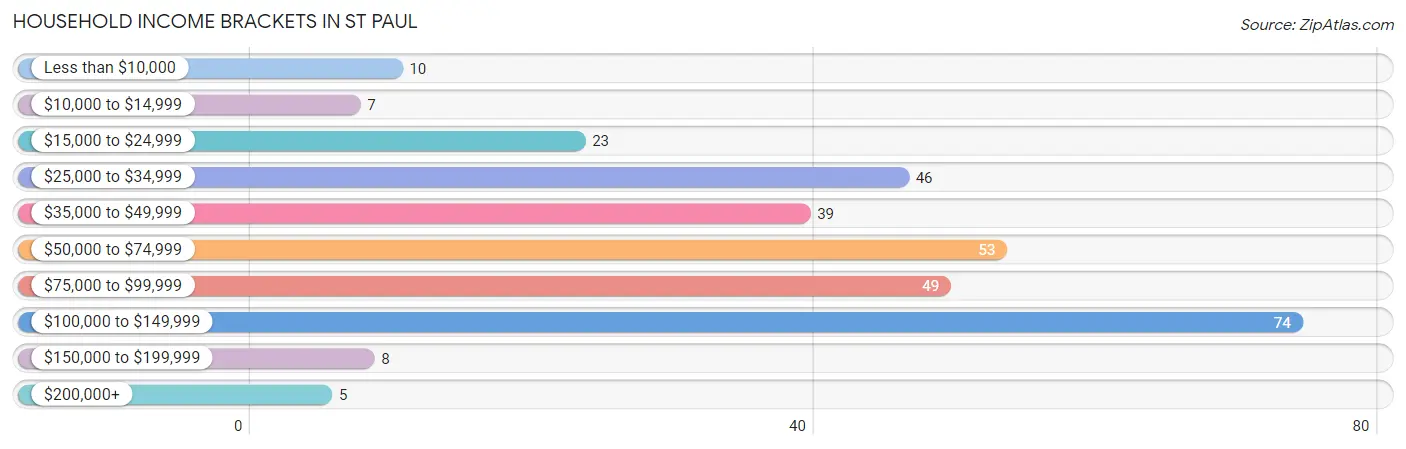
Household Income Brackets in St Paul
With 74 households falling in the category, the $100,000 to $149,999 income range is the most frequent in St Paul, accounting for 23.6% of all households. In contrast, only 5 households (1.6%) fall into the $200,000+ income bracket, making it the least populous group.
| Income Bracket | # Households | % Households |
| Less than $10,000 | 10 | 3.2% |
| $10,000 to $14,999 | 7 | 2.2% |
| $15,000 to $24,999 | 23 | 7.3% |
| $25,000 to $34,999 | 46 | 14.6% |
| $35,000 to $49,999 | 39 | 12.4% |
| $50,000 to $74,999 | 53 | 16.9% |
| $75,000 to $99,999 | 49 | 15.6% |
| $100,000 to $149,999 | 74 | 23.6% |
| $150,000 to $199,999 | 8 | 2.5% |
| $200,000+ | 5 | 1.6% |
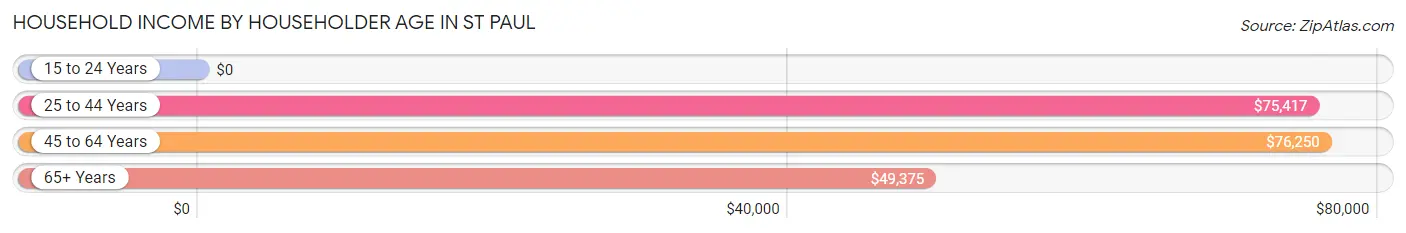
Household Income by Householder Age in St Paul
The median household income in St Paul is $63,333, with the highest median household income of $76,250 found in the 45 to 64 years age bracket for the primary householder. A total of 112 households (35.7%) fall into this category. Meanwhile, the 15 to 24 years age bracket for the primary householder has the lowest median household income of $0, with 5 households (1.6%) in this group.
| Income Bracket | # Households | Median Income |
| 15 to 24 Years | 5 (1.6%) | $0 |
| 25 to 44 Years | 106 (33.8%) | $75,417 |
| 45 to 64 Years | 112 (35.7%) | $76,250 |
| 65+ Years | 91 (29.0%) | $49,375 |
| Total | 314 (100.0%) | $63,333 |
Poverty in St Paul
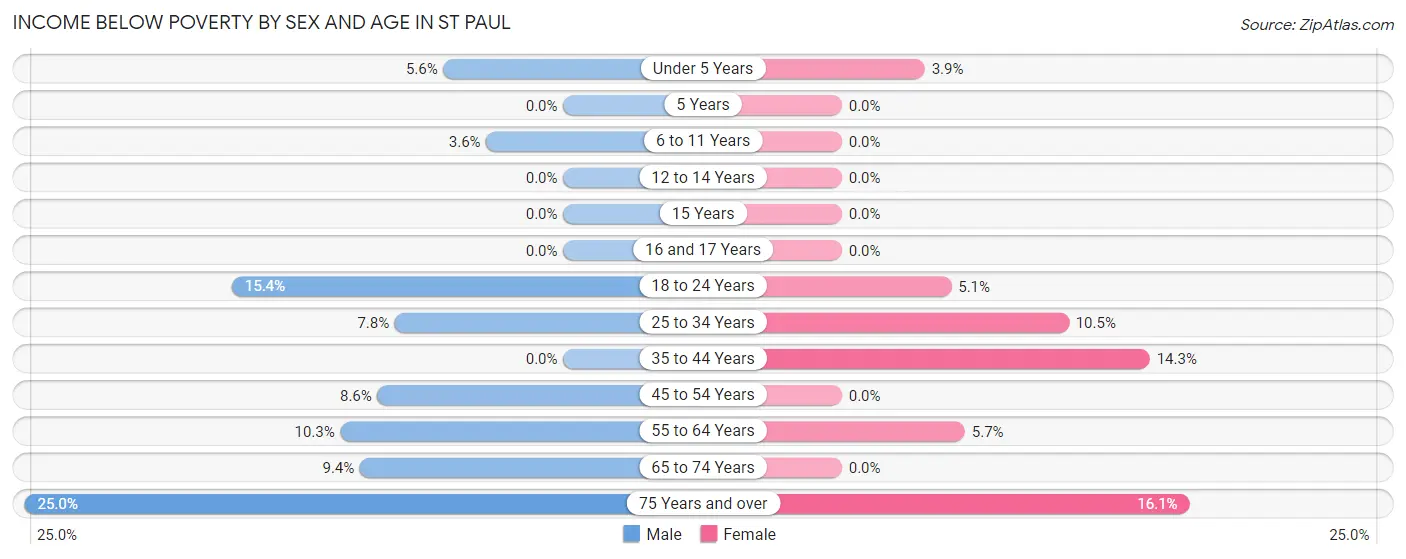
Income Below Poverty by Sex and Age in St Paul
With 6.4% poverty level for males and 5.0% for females among the residents of St Paul, 75 year old and over males and 75 year old and over females are the most vulnerable to poverty, with 3 males (25.0%) and 5 females (16.1%) in their respective age groups living below the poverty level.
| Age Bracket | Male | Female |
| Under 5 Years | 2 (5.6%) | 2 (3.8%) |
| 5 Years | 0 (0.0%) | 0 (0.0%) |
| 6 to 11 Years | 2 (3.6%) | 0 (0.0%) |
| 12 to 14 Years | 0 (0.0%) | 0 (0.0%) |
| 15 Years | 0 (0.0%) | 0 (0.0%) |
| 16 and 17 Years | 0 (0.0%) | 0 (0.0%) |
| 18 to 24 Years | 2 (15.4%) | 3 (5.1%) |
| 25 to 34 Years | 5 (7.8%) | 4 (10.5%) |
| 35 to 44 Years | 0 (0.0%) | 7 (14.3%) |
| 45 to 54 Years | 5 (8.6%) | 0 (0.0%) |
| 55 to 64 Years | 3 (10.3%) | 4 (5.7%) |
| 65 to 74 Years | 5 (9.4%) | 0 (0.0%) |
| 75 Years and over | 3 (25.0%) | 5 (16.1%) |
| Total | 27 (6.4%) | 25 (5.0%) |
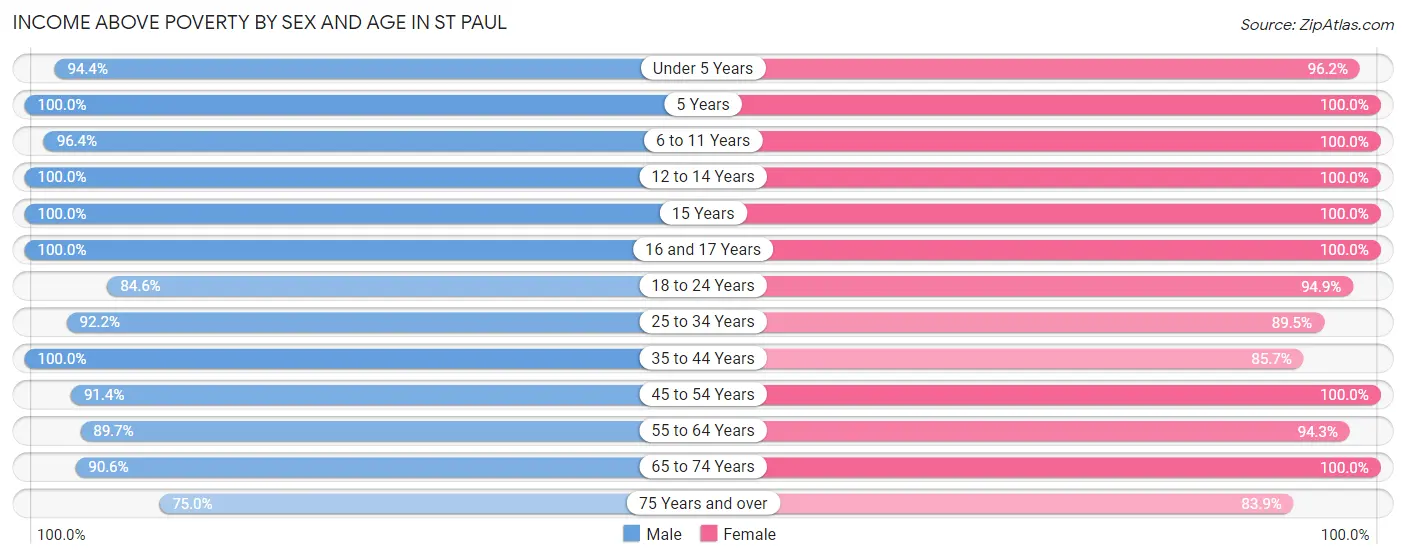
Income Above Poverty by Sex and Age in St Paul
According to the poverty statistics in St Paul, males aged 5 years and females aged 5 years are the age groups that are most secure financially, with 100.0% of males and 100.0% of females in these age groups living above the poverty line.
| Age Bracket | Male | Female |
| Under 5 Years | 34 (94.4%) | 50 (96.2%) |
| 5 Years | 2 (100.0%) | 2 (100.0%) |
| 6 to 11 Years | 54 (96.4%) | 52 (100.0%) |
| 12 to 14 Years | 22 (100.0%) | 39 (100.0%) |
| 15 Years | 12 (100.0%) | 14 (100.0%) |
| 16 and 17 Years | 9 (100.0%) | 22 (100.0%) |
| 18 to 24 Years | 11 (84.6%) | 56 (94.9%) |
| 25 to 34 Years | 59 (92.2%) | 34 (89.5%) |
| 35 to 44 Years | 58 (100.0%) | 42 (85.7%) |
| 45 to 54 Years | 53 (91.4%) | 41 (100.0%) |
| 55 to 64 Years | 26 (89.7%) | 66 (94.3%) |
| 65 to 74 Years | 48 (90.6%) | 28 (100.0%) |
| 75 Years and over | 9 (75.0%) | 26 (83.9%) |
| Total | 397 (93.6%) | 472 (95.0%) |
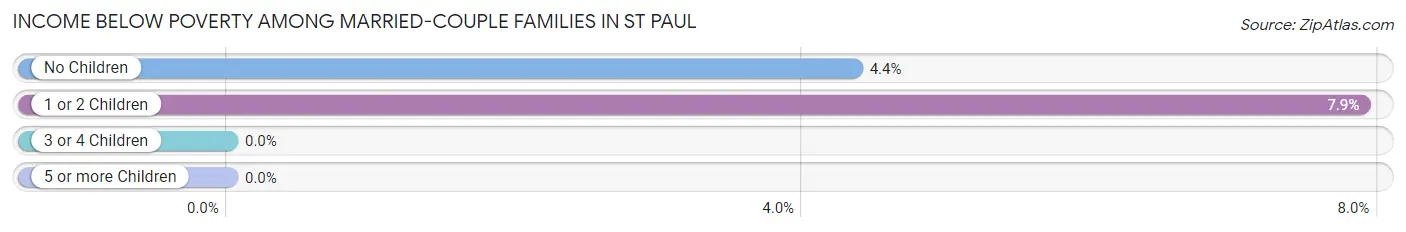
Income Below Poverty Among Married-Couple Families in St Paul
The poverty statistics for married-couple families in St Paul show that 4.4% or 7 of the total 159 families live below the poverty line. Families with 1 or 2 children have the highest poverty rate of 7.9%, comprising of 3 families. On the other hand, families with 3 or 4 children have the lowest poverty rate of 0.0%, which includes 0 families.
| Children | Above Poverty | Below Poverty |
| No Children | 88 (95.7%) | 4 (4.3%) |
| 1 or 2 Children | 35 (92.1%) | 3 (7.9%) |
| 3 or 4 Children | 20 (100.0%) | 0 (0.0%) |
| 5 or more Children | 9 (100.0%) | 0 (0.0%) |
| Total | 152 (95.6%) | 7 (4.4%) |
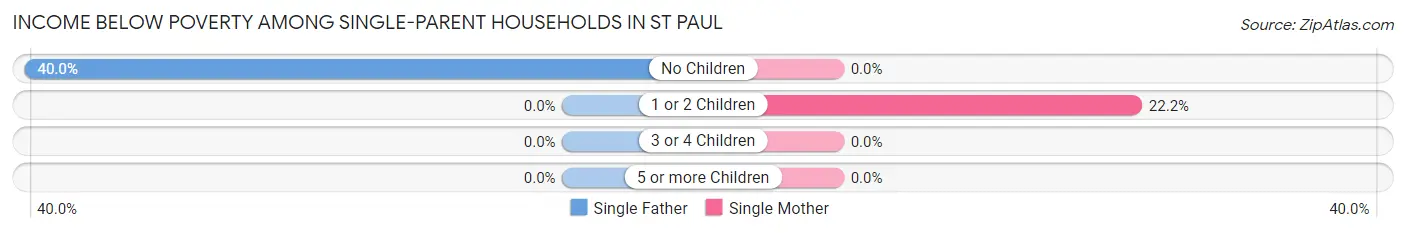
Income Below Poverty Among Single-Parent Households in St Paul
According to the poverty data in St Paul, 4.1% or 2 single-father households and 11.8% or 4 single-mother households are living below the poverty line. Among single-father households, those with no children have the highest poverty rate, with 2 households (40.0%) experiencing poverty. Likewise, among single-mother households, those with 1 or 2 children have the highest poverty rate, with 4 households (22.2%) falling below the poverty line.
| Children | Single Father | Single Mother |
| No Children | 2 (40.0%) | 0 (0.0%) |
| 1 or 2 Children | 0 (0.0%) | 4 (22.2%) |
| 3 or 4 Children | 0 (0.0%) | 0 (0.0%) |
| 5 or more Children | 0 (0.0%) | 0 (0.0%) |
| Total | 2 (4.1%) | 4 (11.8%) |
Income Below Poverty Among Married-Couple vs Single-Parent Households in St Paul
The poverty data for St Paul shows that 7 of the married-couple family households (4.4%) and 6 of the single-parent households (7.2%) are living below the poverty level. Within the married-couple family households, those with 1 or 2 children have the highest poverty rate, with 3 households (7.9%) falling below the poverty line. Among the single-parent households, those with no children have the highest poverty rate, with 2 household (18.2%) living below poverty.
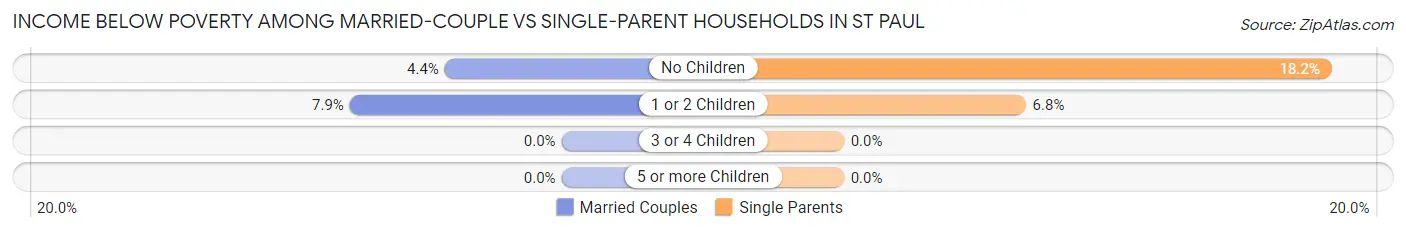
| Children | Married-Couple Families | Single-Parent Households |
| No Children | 4 (4.3%) | 2 (18.2%) |
| 1 or 2 Children | 3 (7.9%) | 4 (6.8%) |
| 3 or 4 Children | 0 (0.0%) | 0 (0.0%) |
| 5 or more Children | 0 (0.0%) | 0 (0.0%) |
| Total | 7 (4.4%) | 6 (7.2%) |
Employment Characteristics in St Paul
Employment by Class of Employer in St Paul
Among the 375 employed individuals in St Paul, private company employees (299 | 79.7%), local government employees (25 | 6.7%), and not-for-profit organizations (17 | 4.5%) make up the most common classes of employment.
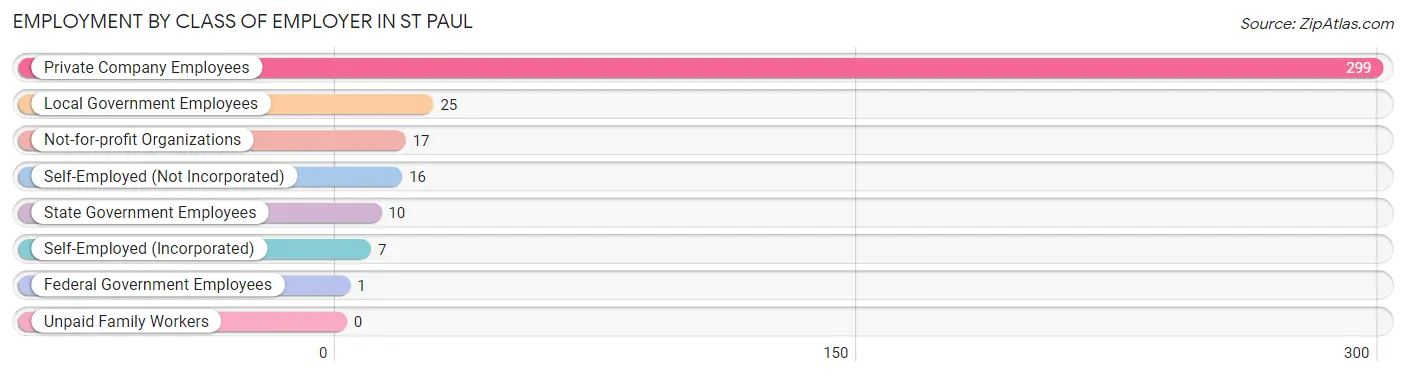
| Employer Class | # Employees | % Employees |
| Private Company Employees | 299 | 79.7% |
| Self-Employed (Incorporated) | 7 | 1.9% |
| Self-Employed (Not Incorporated) | 16 | 4.3% |
| Not-for-profit Organizations | 17 | 4.5% |
| Local Government Employees | 25 | 6.7% |
| State Government Employees | 10 | 2.7% |
| Federal Government Employees | 1 | 0.3% |
| Unpaid Family Workers | 0 | 0.0% |
| Total | 375 | 100.0% |
Employment Status by Age in St Paul
According to the labor force statistics for St Paul, out of the total population over 16 years of age (634), 62.5% or 396 individuals are in the labor force, with 3.8% or 15 of them unemployed. The age group with the highest labor force participation rate is 35 to 44 years, with 91.6% or 98 individuals in the labor force. Within the labor force, the 20 to 24 years age range has the highest percentage of unemployed individuals, with 11.8% or 2 of them being unemployed.
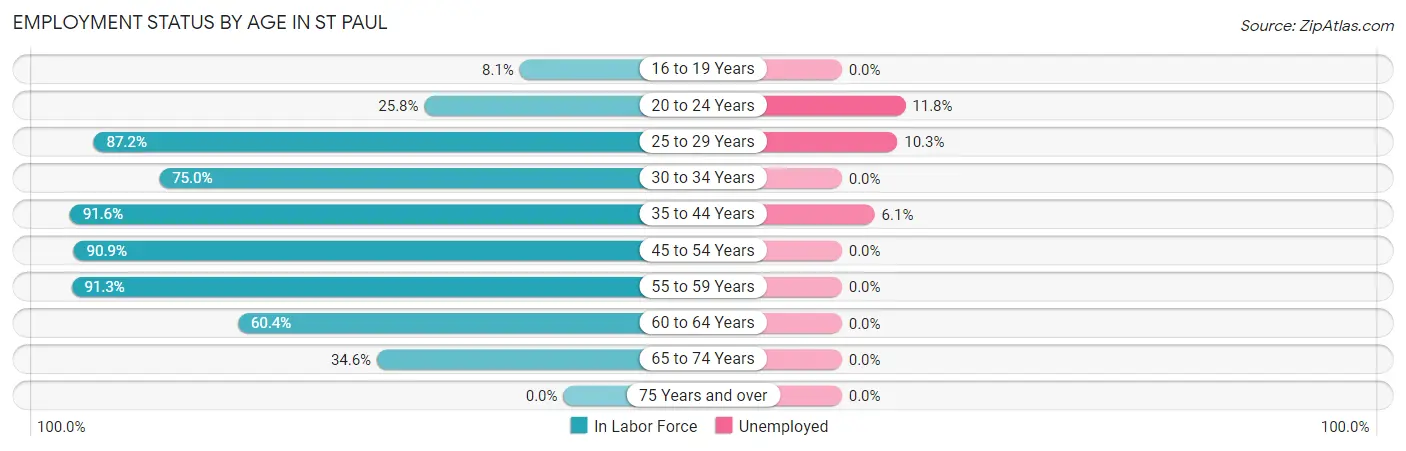
| Age Bracket | In Labor Force | Unemployed |
| 16 to 19 Years | 3 (8.1%) | 0 (0.0%) |
| 20 to 24 Years | 17 (25.8%) | 2 (11.8%) |
| 25 to 29 Years | 68 (87.2%) | 7 (10.3%) |
| 30 to 34 Years | 18 (75.0%) | 0 (0.0%) |
| 35 to 44 Years | 98 (91.6%) | 6 (6.1%) |
| 45 to 54 Years | 90 (90.9%) | 0 (0.0%) |
| 55 to 59 Years | 42 (91.3%) | 0 (0.0%) |
| 60 to 64 Years | 32 (60.4%) | 0 (0.0%) |
| 65 to 74 Years | 28 (34.6%) | 0 (0.0%) |
| 75 Years and over | 0 (0.0%) | 0 (0.0%) |
| Total | 396 (62.5%) | 15 (3.8%) |
Employment Status by Educational Attainment in St Paul
According to labor force statistics for St Paul, 85.5% of individuals (348) out of the total population between 25 and 64 years of age (407) are in the labor force, with 3.7% or 13 of them being unemployed. The group with the highest labor force participation rate are those with the educational attainment of college / associate degree, with 88.9% or 120 individuals in the labor force. Within the labor force, individuals with college / associate degree education have the highest percentage of unemployment, with 10.8% or 13 of them being unemployed.
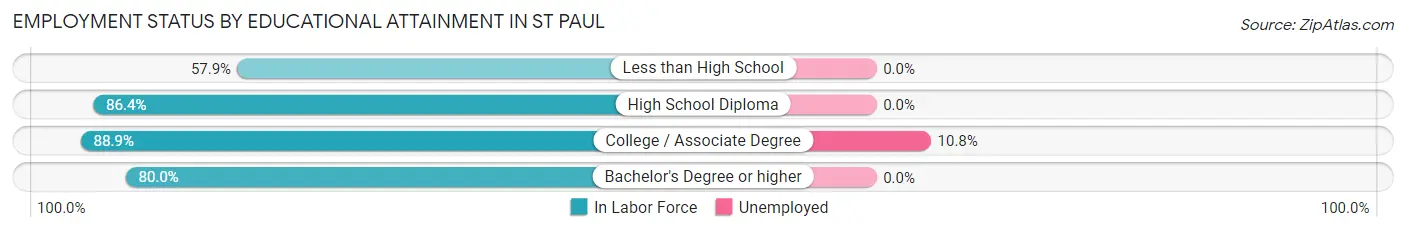
| Educational Attainment | In Labor Force | Unemployed |
| Less than High School | 11 (57.9%) | 0 (0.0%) |
| High School Diploma | 197 (86.4%) | 0 (0.0%) |
| College / Associate Degree | 120 (88.9%) | 15 (10.8%) |
| Bachelor's Degree or higher | 20 (80.0%) | 0 (0.0%) |
| Total | 348 (85.5%) | 15 (3.7%) |
Employment Occupations by Sex in St Paul
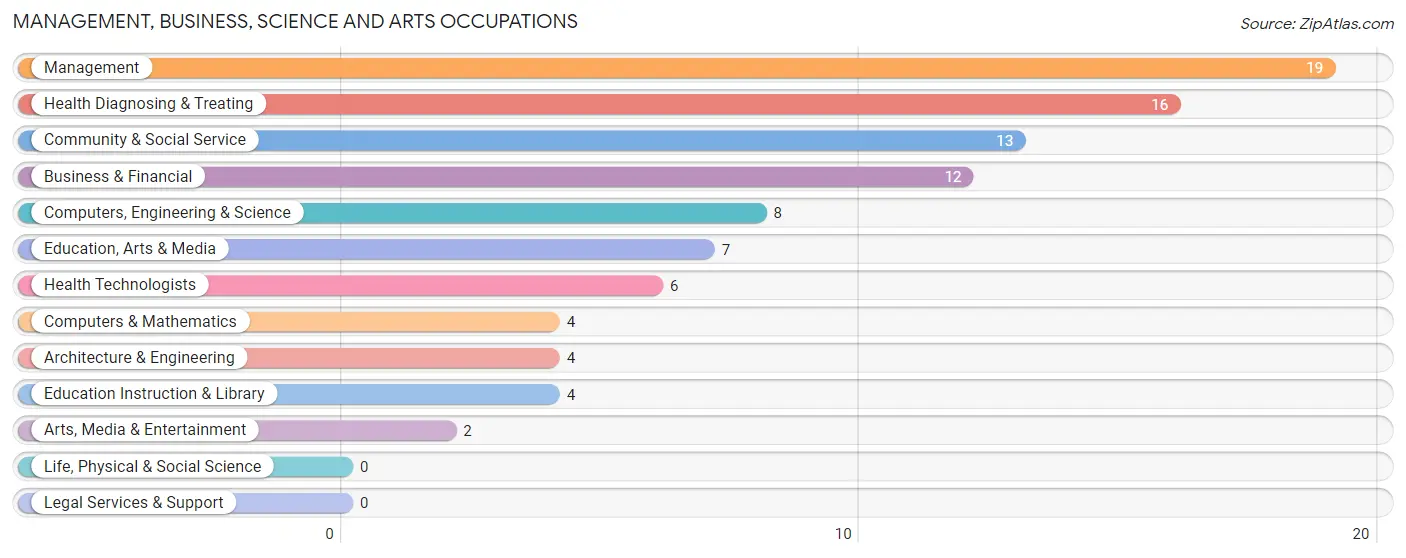
Management, Business, Science and Arts Occupations
The most common Management, Business, Science and Arts occupations in St Paul are Management (19 | 5.0%), Health Diagnosing & Treating (16 | 4.2%), Community & Social Service (13 | 3.4%), Business & Financial (12 | 3.2%), and Computers, Engineering & Science (8 | 2.1%).
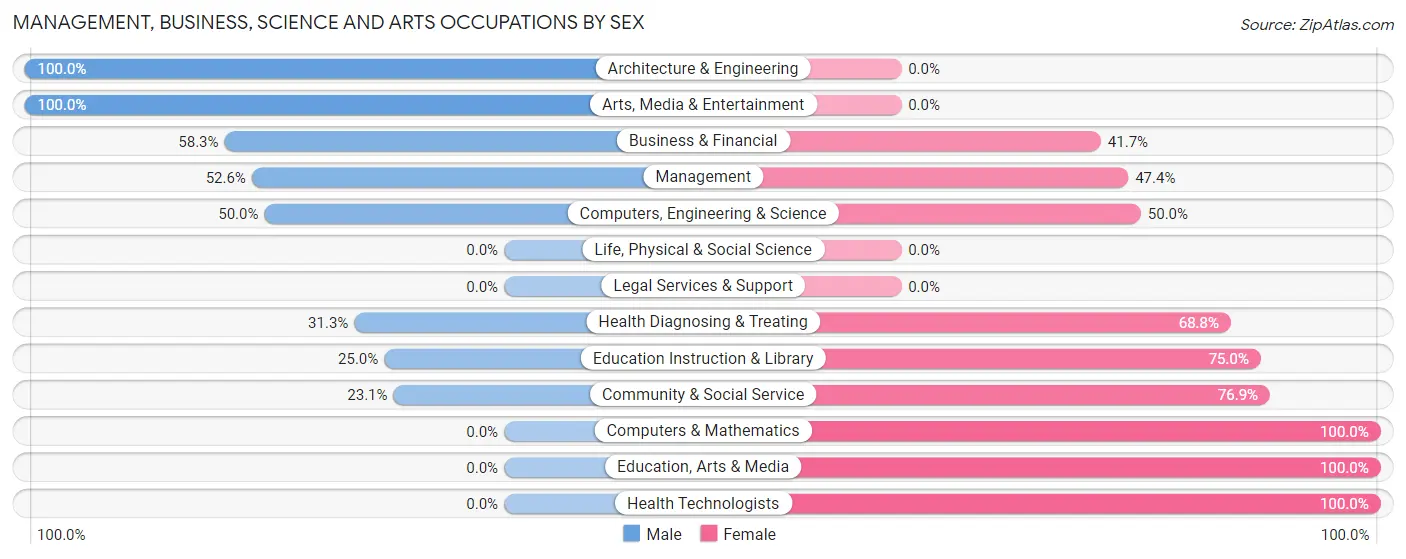
Management, Business, Science and Arts Occupations by Sex
Within the Management, Business, Science and Arts occupations in St Paul, the most male-oriented occupations are Architecture & Engineering (100.0%), Arts, Media & Entertainment (100.0%), and Business & Financial (58.3%), while the most female-oriented occupations are Computers & Mathematics (100.0%), Education, Arts & Media (100.0%), and Health Technologists (100.0%).
| Occupation | Male | Female |
| Management | 10 (52.6%) | 9 (47.4%) |
| Business & Financial | 7 (58.3%) | 5 (41.7%) |
| Computers, Engineering & Science | 4 (50.0%) | 4 (50.0%) |
| Computers & Mathematics | 0 (0.0%) | 4 (100.0%) |
| Architecture & Engineering | 4 (100.0%) | 0 (0.0%) |
| Life, Physical & Social Science | 0 (0.0%) | 0 (0.0%) |
| Community & Social Service | 3 (23.1%) | 10 (76.9%) |
| Education, Arts & Media | 0 (0.0%) | 7 (100.0%) |
| Legal Services & Support | 0 (0.0%) | 0 (0.0%) |
| Education Instruction & Library | 1 (25.0%) | 3 (75.0%) |
| Arts, Media & Entertainment | 2 (100.0%) | 0 (0.0%) |
| Health Diagnosing & Treating | 5 (31.2%) | 11 (68.8%) |
| Health Technologists | 0 (0.0%) | 6 (100.0%) |
| Total (Category) | 29 (42.6%) | 39 (57.4%) |
| Total (Overall) | 220 (57.7%) | 161 (42.3%) |
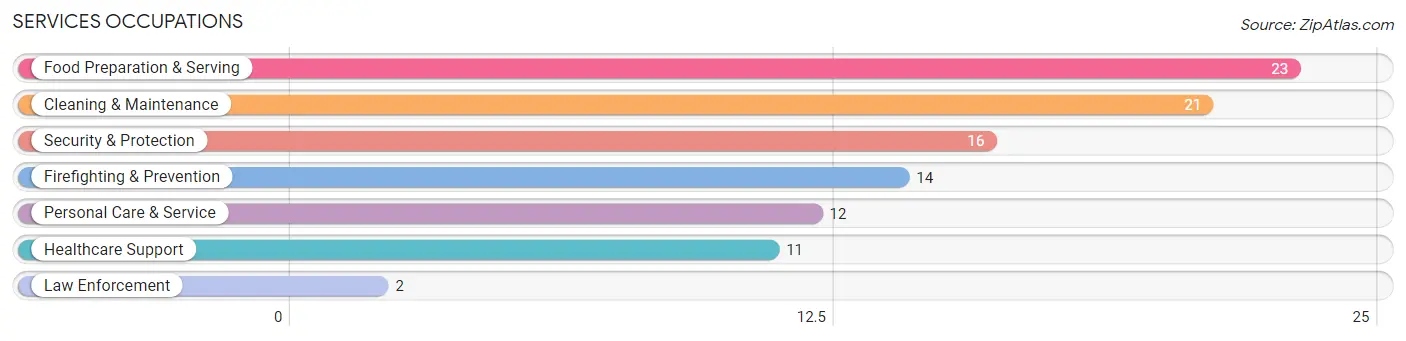
Services Occupations
The most common Services occupations in St Paul are Food Preparation & Serving (23 | 6.0%), Cleaning & Maintenance (21 | 5.5%), Security & Protection (16 | 4.2%), Firefighting & Prevention (14 | 3.7%), and Personal Care & Service (12 | 3.2%).
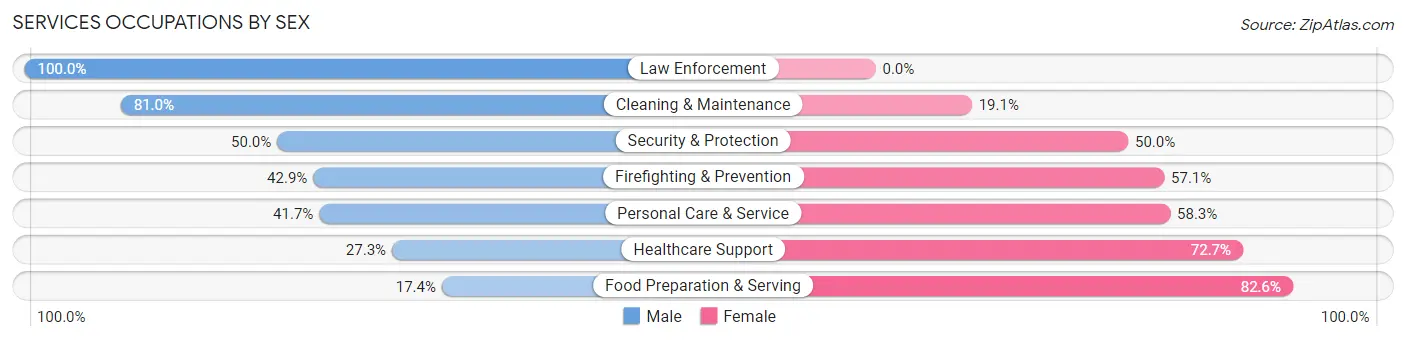
Services Occupations by Sex
Within the Services occupations in St Paul, the most male-oriented occupations are Law Enforcement (100.0%), Cleaning & Maintenance (80.9%), and Security & Protection (50.0%), while the most female-oriented occupations are Food Preparation & Serving (82.6%), Healthcare Support (72.7%), and Personal Care & Service (58.3%).
| Occupation | Male | Female |
| Healthcare Support | 3 (27.3%) | 8 (72.7%) |
| Security & Protection | 8 (50.0%) | 8 (50.0%) |
| Firefighting & Prevention | 6 (42.9%) | 8 (57.1%) |
| Law Enforcement | 2 (100.0%) | 0 (0.0%) |
| Food Preparation & Serving | 4 (17.4%) | 19 (82.6%) |
| Cleaning & Maintenance | 17 (80.9%) | 4 (19.1%) |
| Personal Care & Service | 5 (41.7%) | 7 (58.3%) |
| Total (Category) | 37 (44.6%) | 46 (55.4%) |
| Total (Overall) | 220 (57.7%) | 161 (42.3%) |
Sales and Office Occupations
The most common Sales and Office occupations in St Paul are Sales & Related (45 | 11.8%), and Office & Administration (24 | 6.3%).
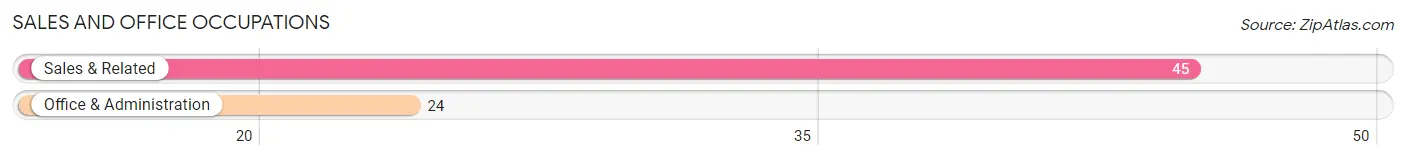
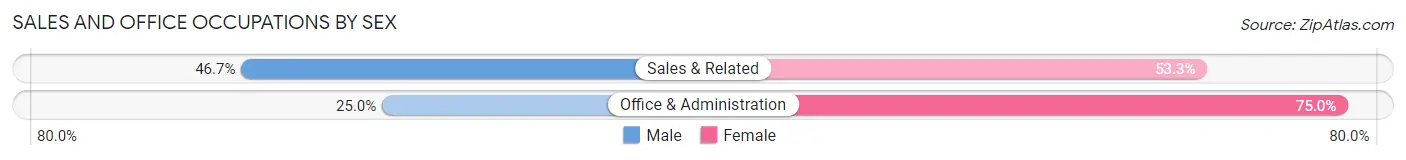
Sales and Office Occupations by Sex
| Occupation | Male | Female |
| Sales & Related | 21 (46.7%) | 24 (53.3%) |
| Office & Administration | 6 (25.0%) | 18 (75.0%) |
| Total (Category) | 27 (39.1%) | 42 (60.9%) |
| Total (Overall) | 220 (57.7%) | 161 (42.3%) |
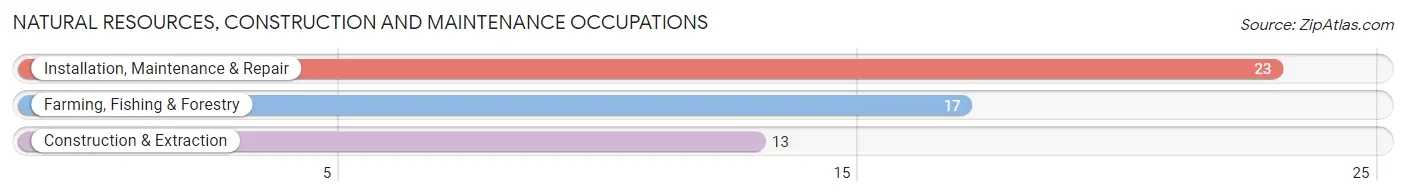
Natural Resources, Construction and Maintenance Occupations
The most common Natural Resources, Construction and Maintenance occupations in St Paul are Installation, Maintenance & Repair (23 | 6.0%), Farming, Fishing & Forestry (17 | 4.5%), and Construction & Extraction (13 | 3.4%).
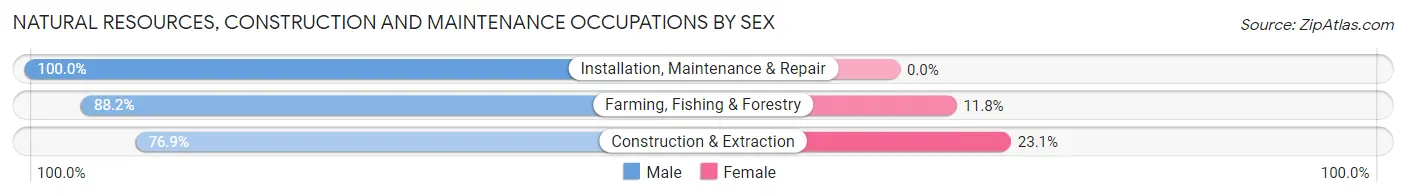
Natural Resources, Construction and Maintenance Occupations by Sex
| Occupation | Male | Female |
| Farming, Fishing & Forestry | 15 (88.2%) | 2 (11.8%) |
| Construction & Extraction | 10 (76.9%) | 3 (23.1%) |
| Installation, Maintenance & Repair | 23 (100.0%) | 0 (0.0%) |
| Total (Category) | 48 (90.6%) | 5 (9.4%) |
| Total (Overall) | 220 (57.7%) | 161 (42.3%) |
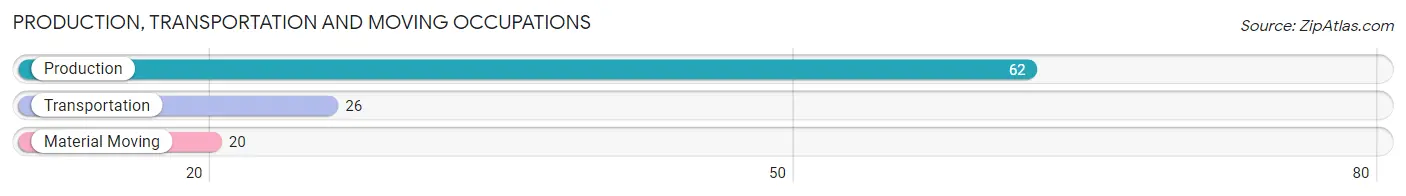
Production, Transportation and Moving Occupations
The most common Production, Transportation and Moving occupations in St Paul are Production (62 | 16.3%), Transportation (26 | 6.8%), and Material Moving (20 | 5.2%).
Production, Transportation and Moving Occupations by Sex
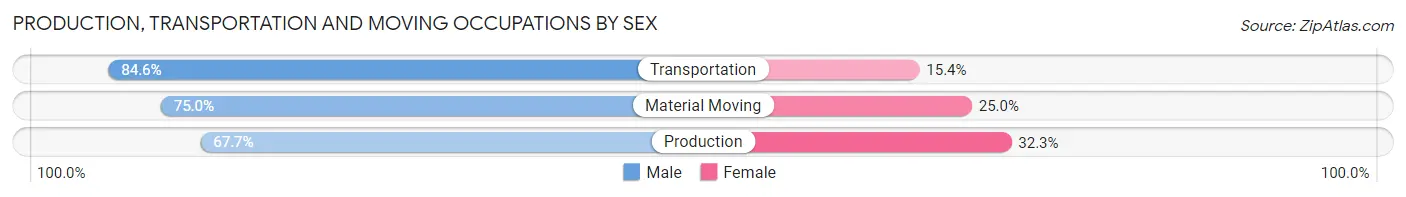
| Occupation | Male | Female |
| Production | 42 (67.7%) | 20 (32.3%) |
| Transportation | 22 (84.6%) | 4 (15.4%) |
| Material Moving | 15 (75.0%) | 5 (25.0%) |
| Total (Category) | 79 (73.2%) | 29 (26.9%) |
| Total (Overall) | 220 (57.7%) | 161 (42.3%) |
Employment Industries by Sex in St Paul
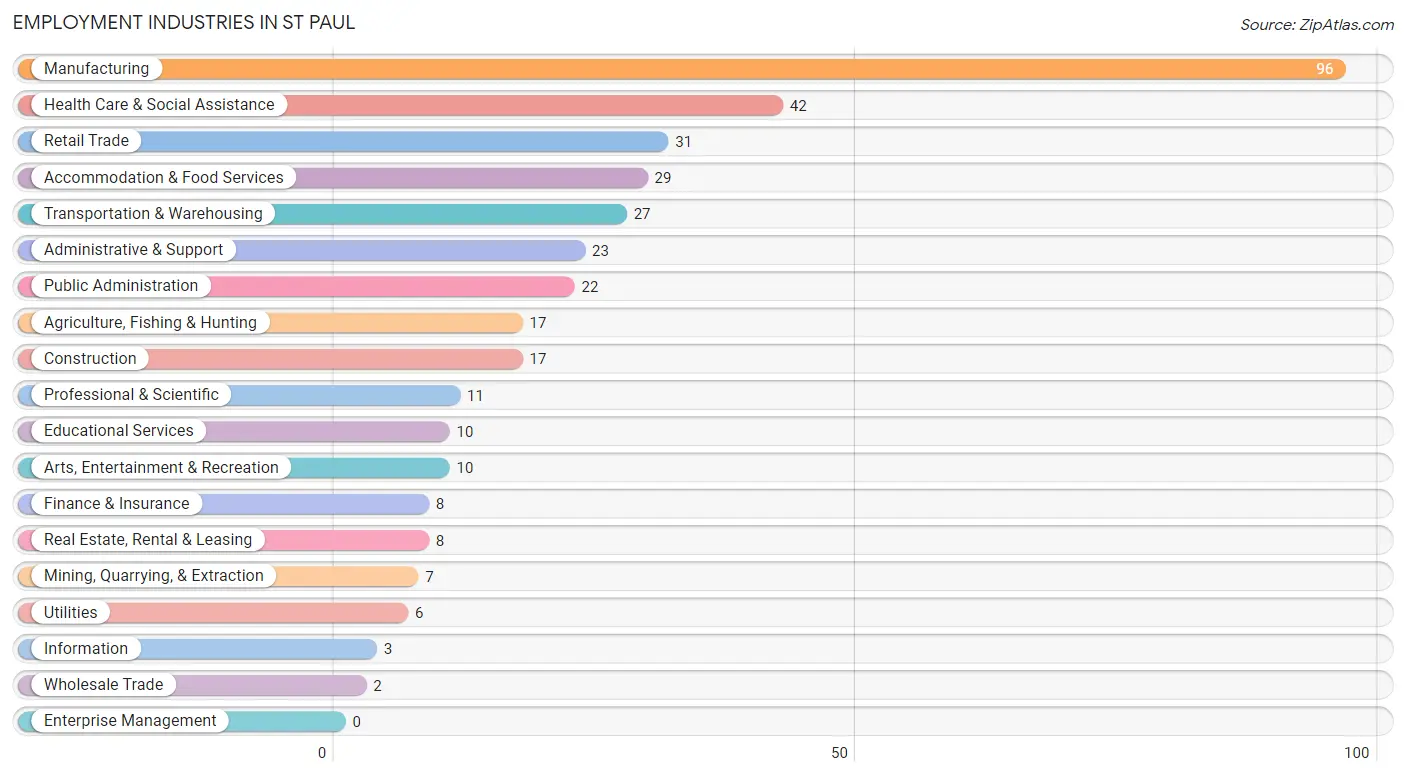
Employment Industries in St Paul
The major employment industries in St Paul include Manufacturing (96 | 25.2%), Health Care & Social Assistance (42 | 11.0%), Retail Trade (31 | 8.1%), Accommodation & Food Services (29 | 7.6%), and Transportation & Warehousing (27 | 7.1%).
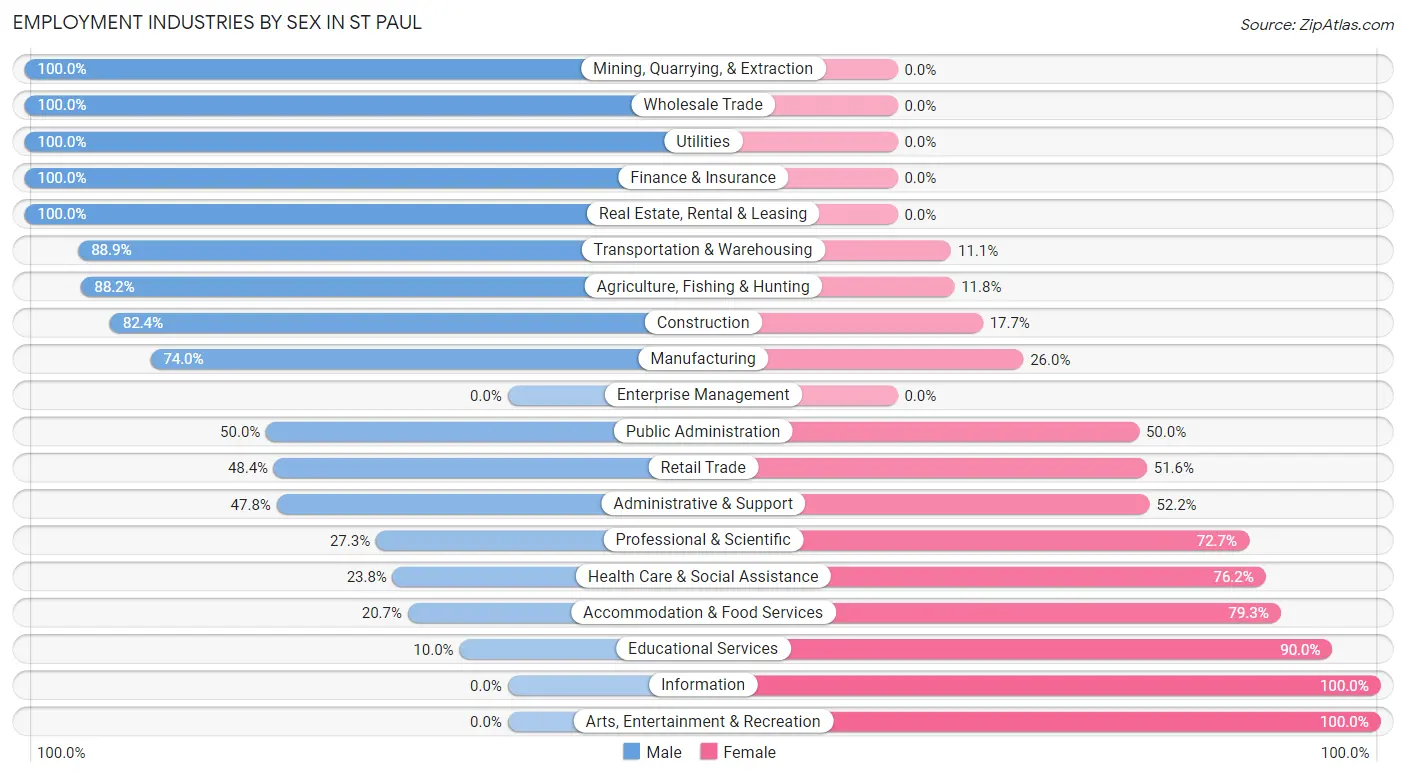
Employment Industries by Sex in St Paul
The St Paul industries that see more men than women are Mining, Quarrying, & Extraction (100.0%), Wholesale Trade (100.0%), and Utilities (100.0%), whereas the industries that tend to have a higher number of women are Information (100.0%), Arts, Entertainment & Recreation (100.0%), and Educational Services (90.0%).
| Industry | Male | Female |
| Agriculture, Fishing & Hunting | 15 (88.2%) | 2 (11.8%) |
| Mining, Quarrying, & Extraction | 7 (100.0%) | 0 (0.0%) |
| Construction | 14 (82.4%) | 3 (17.6%) |
| Manufacturing | 71 (74.0%) | 25 (26.0%) |
| Wholesale Trade | 2 (100.0%) | 0 (0.0%) |
| Retail Trade | 15 (48.4%) | 16 (51.6%) |
| Transportation & Warehousing | 24 (88.9%) | 3 (11.1%) |
| Utilities | 6 (100.0%) | 0 (0.0%) |
| Information | 0 (0.0%) | 3 (100.0%) |
| Finance & Insurance | 8 (100.0%) | 0 (0.0%) |
| Real Estate, Rental & Leasing | 8 (100.0%) | 0 (0.0%) |
| Professional & Scientific | 3 (27.3%) | 8 (72.7%) |
| Enterprise Management | 0 (0.0%) | 0 (0.0%) |
| Administrative & Support | 11 (47.8%) | 12 (52.2%) |
| Educational Services | 1 (10.0%) | 9 (90.0%) |
| Health Care & Social Assistance | 10 (23.8%) | 32 (76.2%) |
| Arts, Entertainment & Recreation | 0 (0.0%) | 10 (100.0%) |
| Accommodation & Food Services | 6 (20.7%) | 23 (79.3%) |
| Public Administration | 11 (50.0%) | 11 (50.0%) |
| Total | 220 (57.7%) | 161 (42.3%) |
Education in St Paul
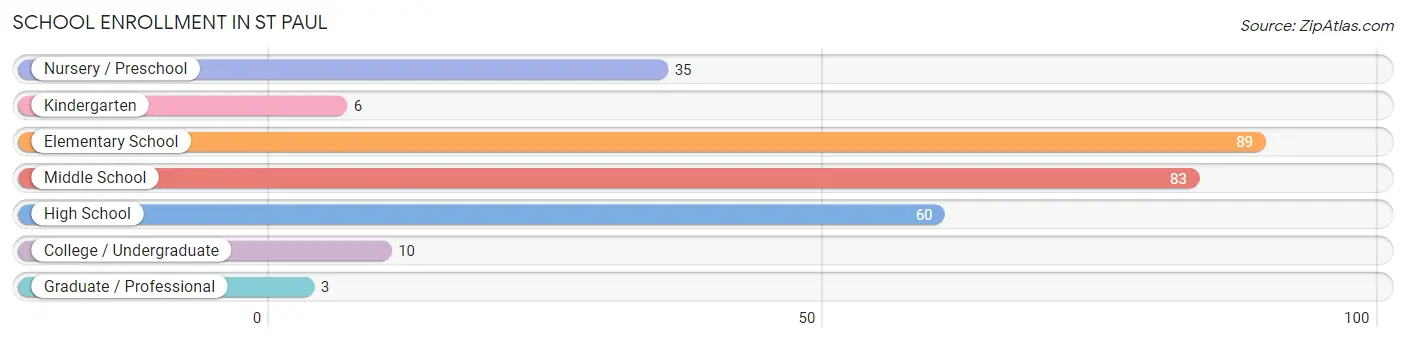
School Enrollment in St Paul
The most common levels of schooling among the 286 students in St Paul are elementary school (89 | 31.1%), middle school (83 | 29.0%), and high school (60 | 21.0%).
| School Level | # Students | % Students |
| Nursery / Preschool | 35 | 12.2% |
| Kindergarten | 6 | 2.1% |
| Elementary School | 89 | 31.1% |
| Middle School | 83 | 29.0% |
| High School | 60 | 21.0% |
| College / Undergraduate | 10 | 3.5% |
| Graduate / Professional | 3 | 1.1% |
| Total | 286 | 100.0% |
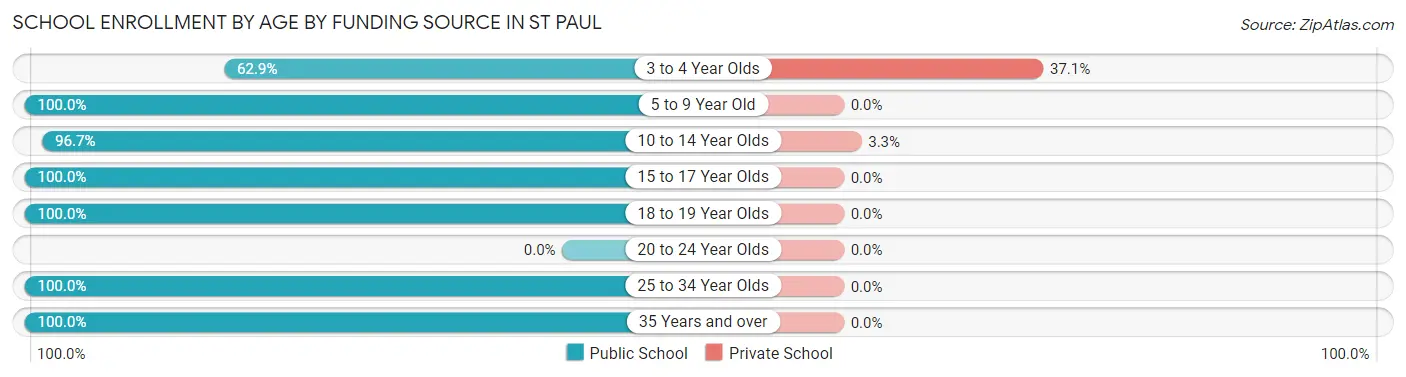
School Enrollment by Age by Funding Source in St Paul
Out of a total of 286 students who are enrolled in schools in St Paul, 17 (5.9%) attend a private institution, while the remaining 269 (94.1%) are enrolled in public schools. The age group of 3 to 4 year olds has the highest likelihood of being enrolled in private schools, with 13 (37.1% in the age bracket) enrolled. Conversely, the age group of 5 to 9 year old has the lowest likelihood of being enrolled in a private school, with 60 (100.0% in the age bracket) attending a public institution.
| Age Bracket | Public School | Private School |
| 3 to 4 Year Olds | 22 (62.9%) | 13 (37.1%) |
| 5 to 9 Year Old | 60 (100.0%) | 0 (0.0%) |
| 10 to 14 Year Olds | 118 (96.7%) | 4 (3.3%) |
| 15 to 17 Year Olds | 53 (100.0%) | 0 (0.0%) |
| 18 to 19 Year Olds | 4 (100.0%) | 0 (0.0%) |
| 20 to 24 Year Olds | 0 (0.0%) | 0 (0.0%) |
| 25 to 34 Year Olds | 3 (100.0%) | 0 (0.0%) |
| 35 Years and over | 9 (100.0%) | 0 (0.0%) |
| Total | 269 (94.1%) | 17 (5.9%) |
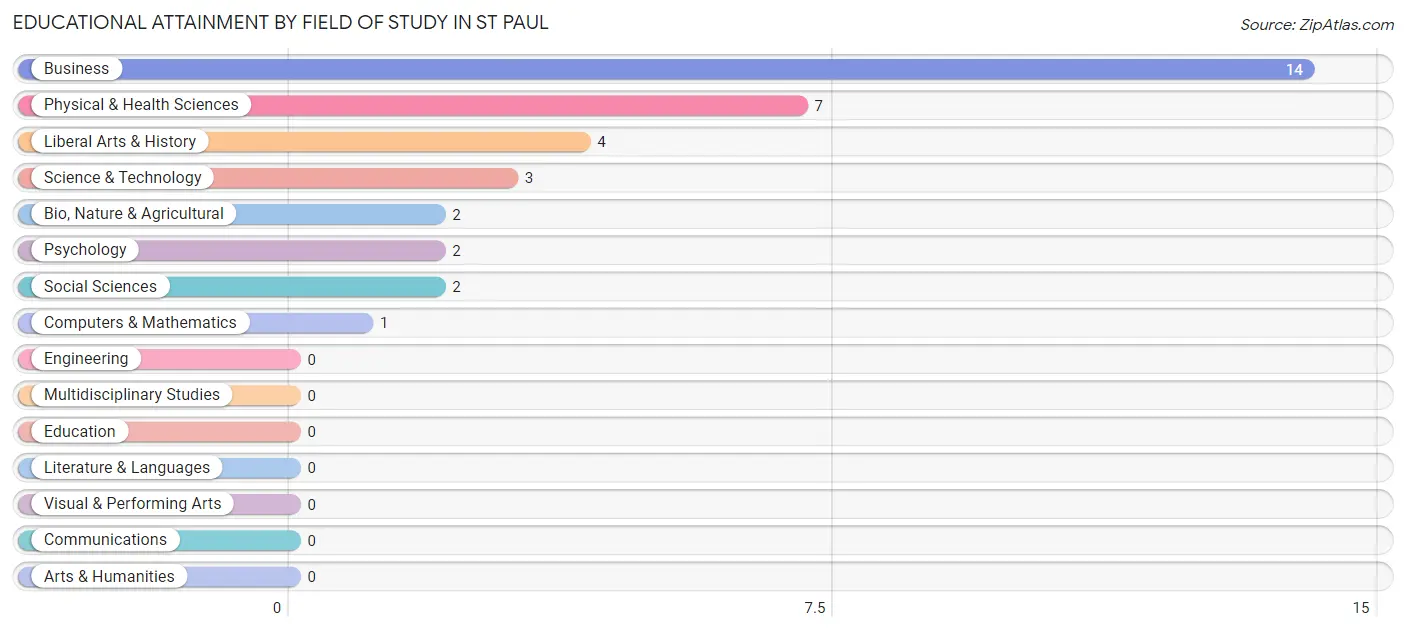
Educational Attainment by Field of Study in St Paul
Business (14 | 40.0%), physical & health sciences (7 | 20.0%), liberal arts & history (4 | 11.4%), science & technology (3 | 8.6%), and bio, nature & agricultural (2 | 5.7%) are the most common fields of study among 35 individuals in St Paul who have obtained a bachelor's degree or higher.
| Field of Study | # Graduates | % Graduates |
| Computers & Mathematics | 1 | 2.9% |
| Bio, Nature & Agricultural | 2 | 5.7% |
| Physical & Health Sciences | 7 | 20.0% |
| Psychology | 2 | 5.7% |
| Social Sciences | 2 | 5.7% |
| Engineering | 0 | 0.0% |
| Multidisciplinary Studies | 0 | 0.0% |
| Science & Technology | 3 | 8.6% |
| Business | 14 | 40.0% |
| Education | 0 | 0.0% |
| Literature & Languages | 0 | 0.0% |
| Liberal Arts & History | 4 | 11.4% |
| Visual & Performing Arts | 0 | 0.0% |
| Communications | 0 | 0.0% |
| Arts & Humanities | 0 | 0.0% |
| Total | 35 | 100.0% |
Transportation & Commute in St Paul
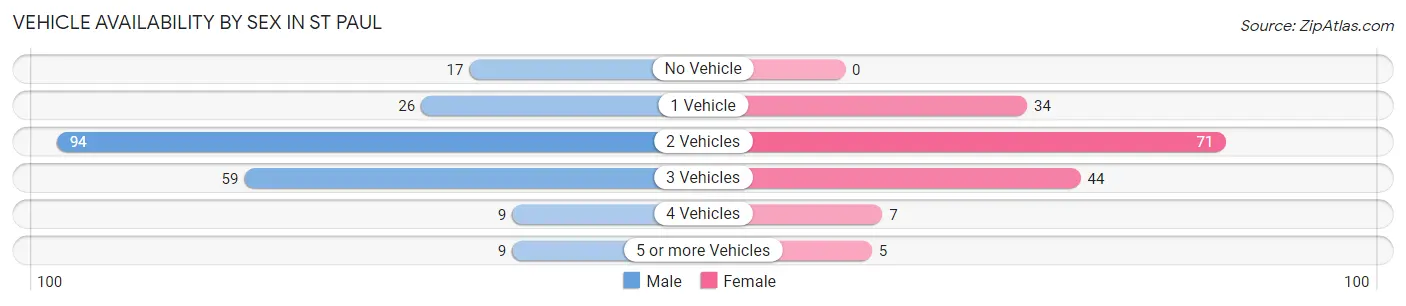
Vehicle Availability by Sex in St Paul
The most prevalent vehicle ownership categories in St Paul are males with 2 vehicles (94, accounting for 43.9%) and females with 2 vehicles (71, making up 58.4%).
| Vehicles Available | Male | Female |
| No Vehicle | 17 (7.9%) | 0 (0.0%) |
| 1 Vehicle | 26 (12.1%) | 34 (21.1%) |
| 2 Vehicles | 94 (43.9%) | 71 (44.1%) |
| 3 Vehicles | 59 (27.6%) | 44 (27.3%) |
| 4 Vehicles | 9 (4.2%) | 7 (4.3%) |
| 5 or more Vehicles | 9 (4.2%) | 5 (3.1%) |
| Total | 214 (100.0%) | 161 (100.0%) |
Commute Time in St Paul
The most frequently occuring commute durations in St Paul are 20 to 24 minutes (74 commuters, 20.2%), 15 to 19 minutes (61 commuters, 16.7%), and 10 to 14 minutes (56 commuters, 15.3%).
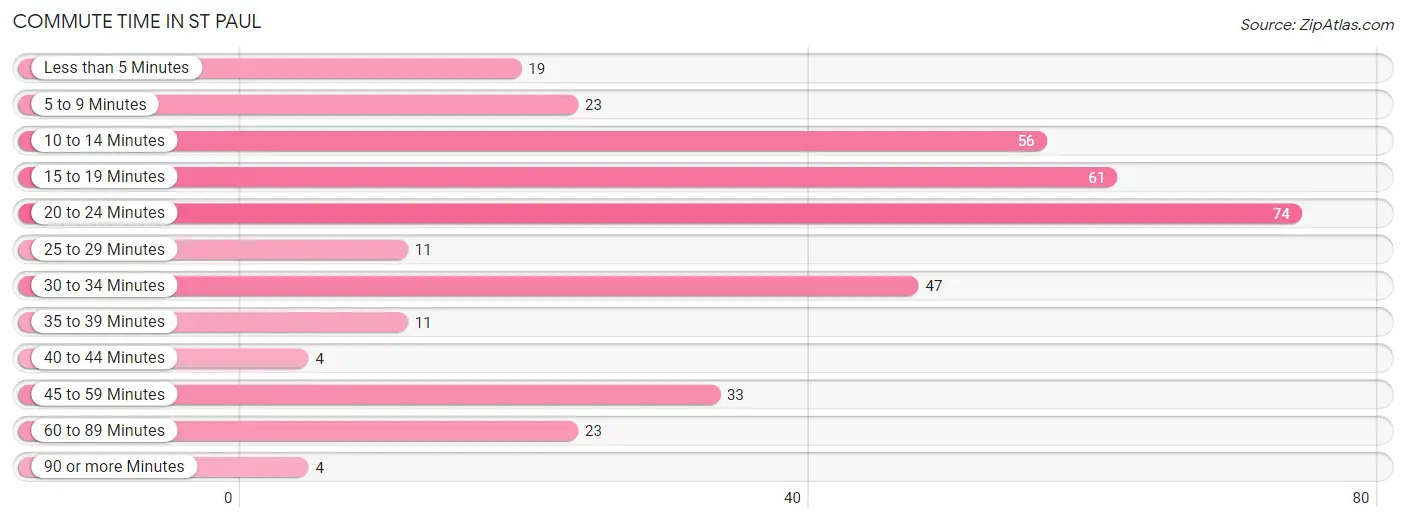
| Commute Time | # Commuters | % Commuters |
| Less than 5 Minutes | 19 | 5.2% |
| 5 to 9 Minutes | 23 | 6.3% |
| 10 to 14 Minutes | 56 | 15.3% |
| 15 to 19 Minutes | 61 | 16.7% |
| 20 to 24 Minutes | 74 | 20.2% |
| 25 to 29 Minutes | 11 | 3.0% |
| 30 to 34 Minutes | 47 | 12.8% |
| 35 to 39 Minutes | 11 | 3.0% |
| 40 to 44 Minutes | 4 | 1.1% |
| 45 to 59 Minutes | 33 | 9.0% |
| 60 to 89 Minutes | 23 | 6.3% |
| 90 or more Minutes | 4 | 1.1% |
Commute Time by Sex in St Paul
The most common commute times in St Paul are 20 to 24 minutes (42 commuters, 19.8%) for males and 20 to 24 minutes (32 commuters, 20.8%) for females.
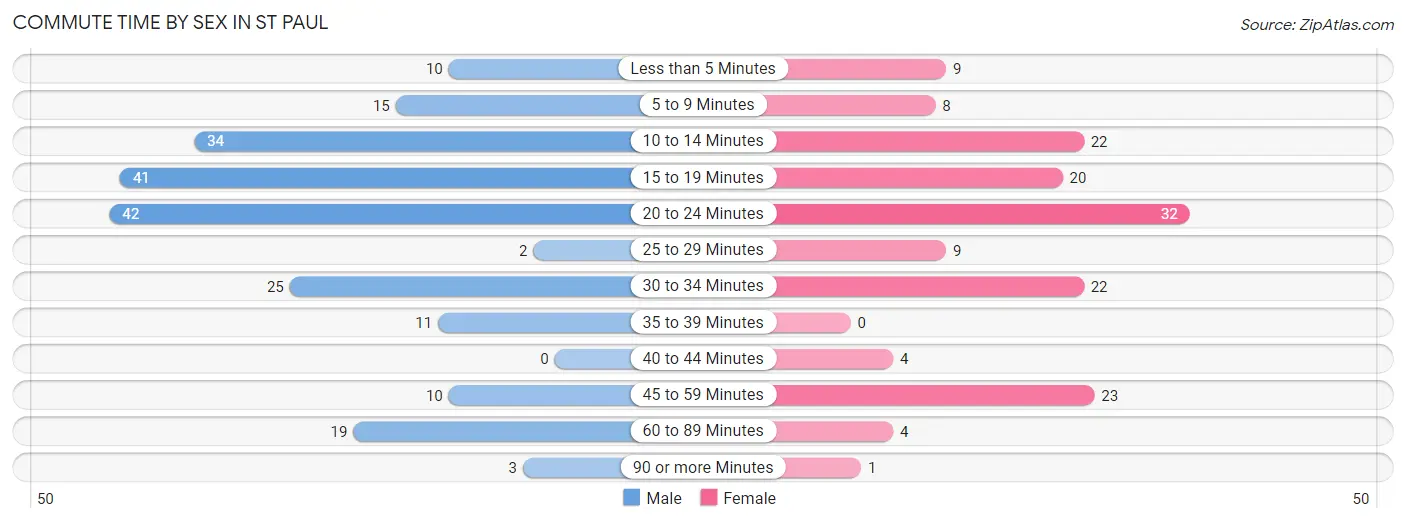
| Commute Time | Male | Female |
| Less than 5 Minutes | 10 (4.7%) | 9 (5.8%) |
| 5 to 9 Minutes | 15 (7.1%) | 8 (5.2%) |
| 10 to 14 Minutes | 34 (16.0%) | 22 (14.3%) |
| 15 to 19 Minutes | 41 (19.3%) | 20 (13.0%) |
| 20 to 24 Minutes | 42 (19.8%) | 32 (20.8%) |
| 25 to 29 Minutes | 2 (0.9%) | 9 (5.8%) |
| 30 to 34 Minutes | 25 (11.8%) | 22 (14.3%) |
| 35 to 39 Minutes | 11 (5.2%) | 0 (0.0%) |
| 40 to 44 Minutes | 0 (0.0%) | 4 (2.6%) |
| 45 to 59 Minutes | 10 (4.7%) | 23 (14.9%) |
| 60 to 89 Minutes | 19 (9.0%) | 4 (2.6%) |
| 90 or more Minutes | 3 (1.4%) | 1 (0.6%) |
Time of Departure to Work by Sex in St Paul
The most frequent times of departure to work in St Paul are 5:30 AM to 5:59 AM (37, 17.4%) for males and 4:00 PM to 11:59 PM (42, 27.3%) for females.
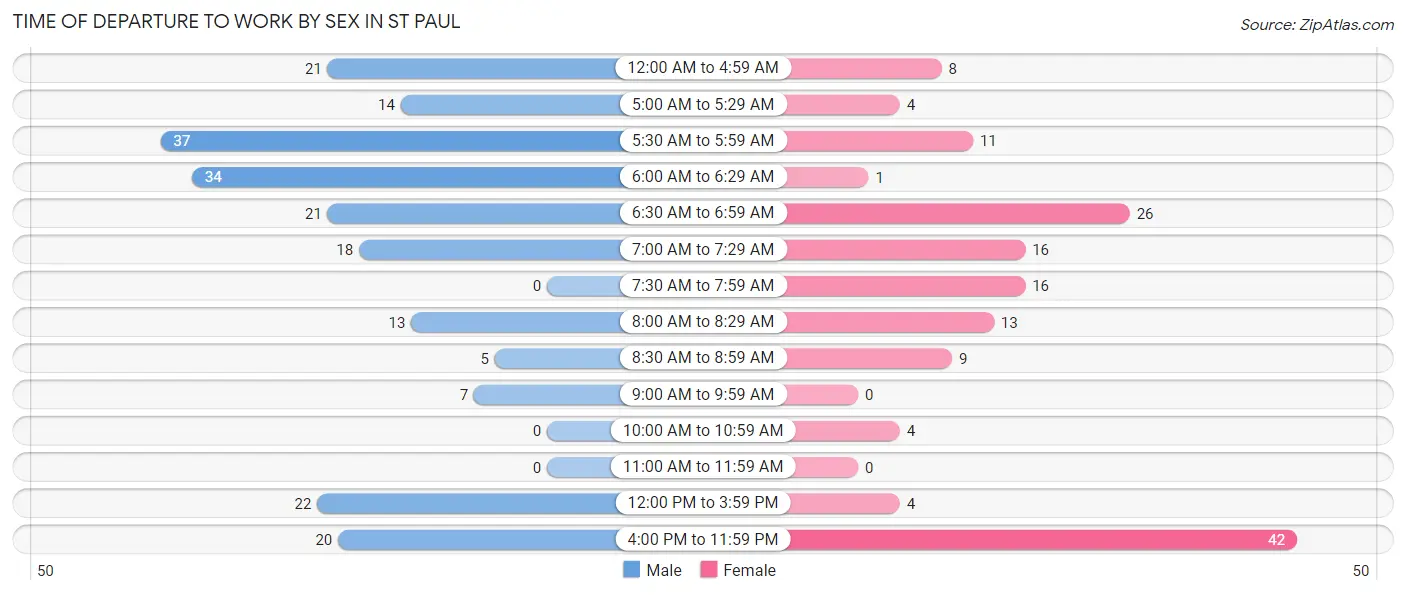
| Time of Departure | Male | Female |
| 12:00 AM to 4:59 AM | 21 (9.9%) | 8 (5.2%) |
| 5:00 AM to 5:29 AM | 14 (6.6%) | 4 (2.6%) |
| 5:30 AM to 5:59 AM | 37 (17.4%) | 11 (7.1%) |
| 6:00 AM to 6:29 AM | 34 (16.0%) | 1 (0.6%) |
| 6:30 AM to 6:59 AM | 21 (9.9%) | 26 (16.9%) |
| 7:00 AM to 7:29 AM | 18 (8.5%) | 16 (10.4%) |
| 7:30 AM to 7:59 AM | 0 (0.0%) | 16 (10.4%) |
| 8:00 AM to 8:29 AM | 13 (6.1%) | 13 (8.4%) |
| 8:30 AM to 8:59 AM | 5 (2.4%) | 9 (5.8%) |
| 9:00 AM to 9:59 AM | 7 (3.3%) | 0 (0.0%) |
| 10:00 AM to 10:59 AM | 0 (0.0%) | 4 (2.6%) |
| 11:00 AM to 11:59 AM | 0 (0.0%) | 0 (0.0%) |
| 12:00 PM to 3:59 PM | 22 (10.4%) | 4 (2.6%) |
| 4:00 PM to 11:59 PM | 20 (9.4%) | 42 (27.3%) |
| Total | 212 (100.0%) | 154 (100.0%) |
Housing Occupancy in St Paul
Occupancy by Ownership in St Paul
Of the total 314 dwellings in St Paul, owner-occupied units account for 227 (72.3%), while renter-occupied units make up 87 (27.7%).
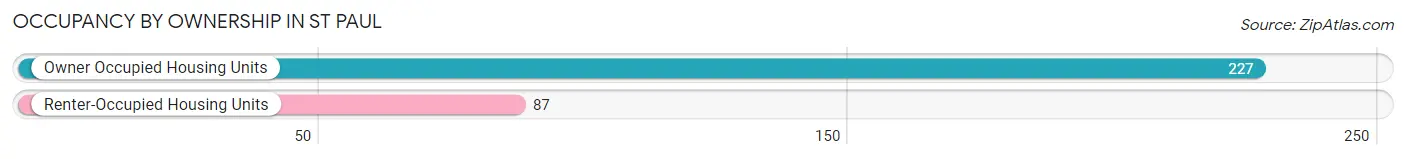
| Occupancy | # Housing Units | % Housing Units |
| Owner Occupied Housing Units | 227 | 72.3% |
| Renter-Occupied Housing Units | 87 | 27.7% |
| Total Occupied Housing Units | 314 | 100.0% |
Occupancy by Household Size in St Paul
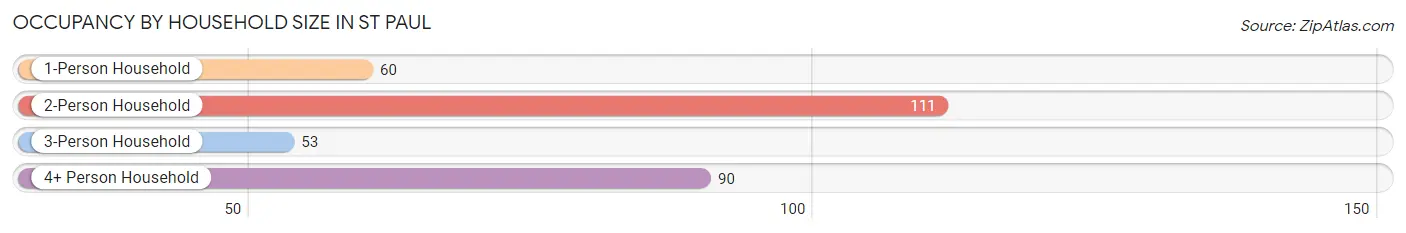
| Household Size | # Housing Units | % Housing Units |
| 1-Person Household | 60 | 19.1% |
| 2-Person Household | 111 | 35.3% |
| 3-Person Household | 53 | 16.9% |
| 4+ Person Household | 90 | 28.7% |
| Total Housing Units | 314 | 100.0% |
Occupancy by Ownership by Household Size in St Paul
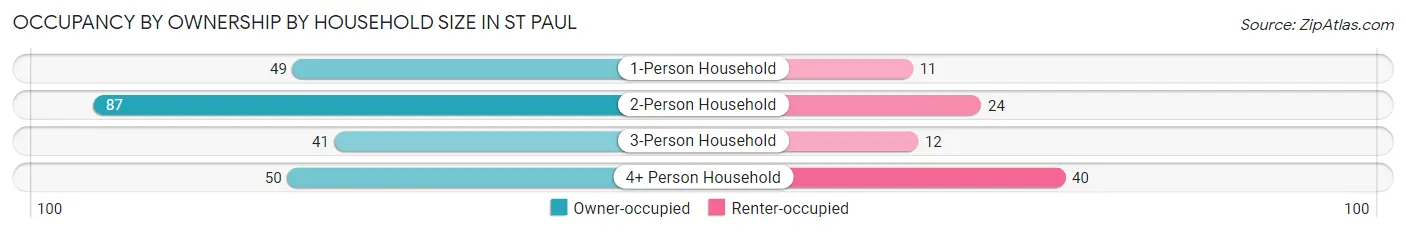
| Household Size | Owner-occupied | Renter-occupied |
| 1-Person Household | 49 (81.7%) | 11 (18.3%) |
| 2-Person Household | 87 (78.4%) | 24 (21.6%) |
| 3-Person Household | 41 (77.4%) | 12 (22.6%) |
| 4+ Person Household | 50 (55.6%) | 40 (44.4%) |
| Total Housing Units | 227 (72.3%) | 87 (27.7%) |
Occupancy by Educational Attainment in St Paul
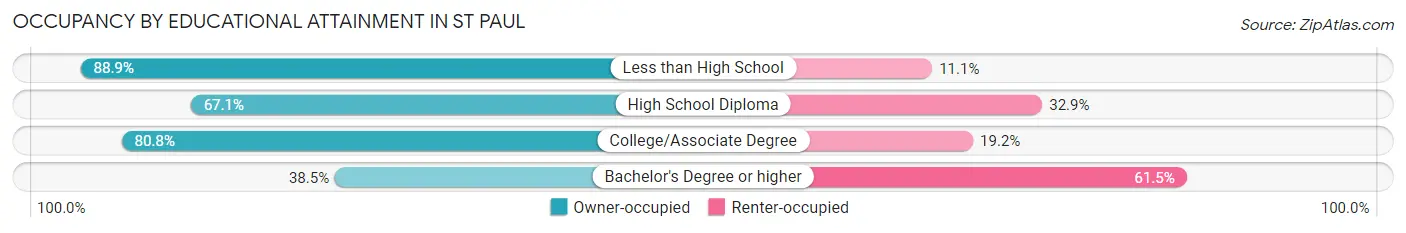
| Household Size | Owner-occupied | Renter-occupied |
| Less than High School | 24 (88.9%) | 3 (11.1%) |
| High School Diploma | 114 (67.1%) | 56 (32.9%) |
| College/Associate Degree | 84 (80.8%) | 20 (19.2%) |
| Bachelor's Degree or higher | 5 (38.5%) | 8 (61.5%) |
Occupancy by Age of Householder in St Paul
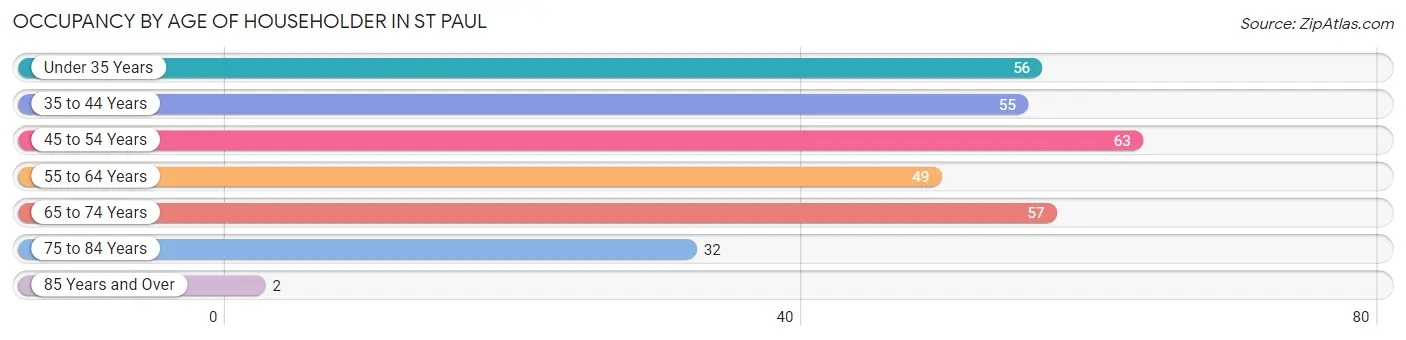
| Age Bracket | # Households | % Households |
| Under 35 Years | 56 | 17.8% |
| 35 to 44 Years | 55 | 17.5% |
| 45 to 54 Years | 63 | 20.1% |
| 55 to 64 Years | 49 | 15.6% |
| 65 to 74 Years | 57 | 18.1% |
| 75 to 84 Years | 32 | 10.2% |
| 85 Years and Over | 2 | 0.6% |
| Total | 314 | 100.0% |
Housing Finances in St Paul
Median Income by Occupancy in St Paul
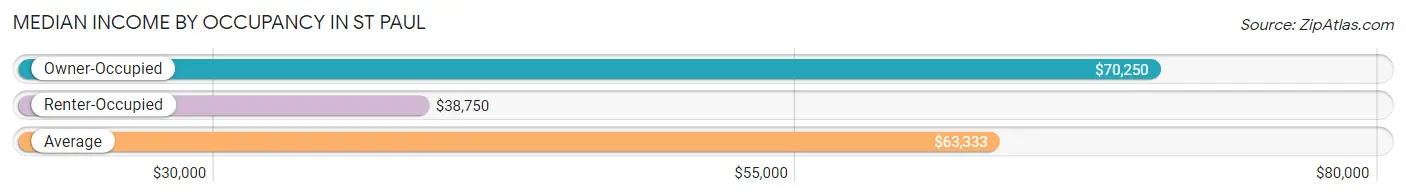
| Occupancy Type | # Households | Median Income |
| Owner-Occupied | 227 (72.3%) | $70,250 |
| Renter-Occupied | 87 (27.7%) | $38,750 |
| Average | 314 (100.0%) | $63,333 |
Occupancy by Householder Income Bracket in St Paul
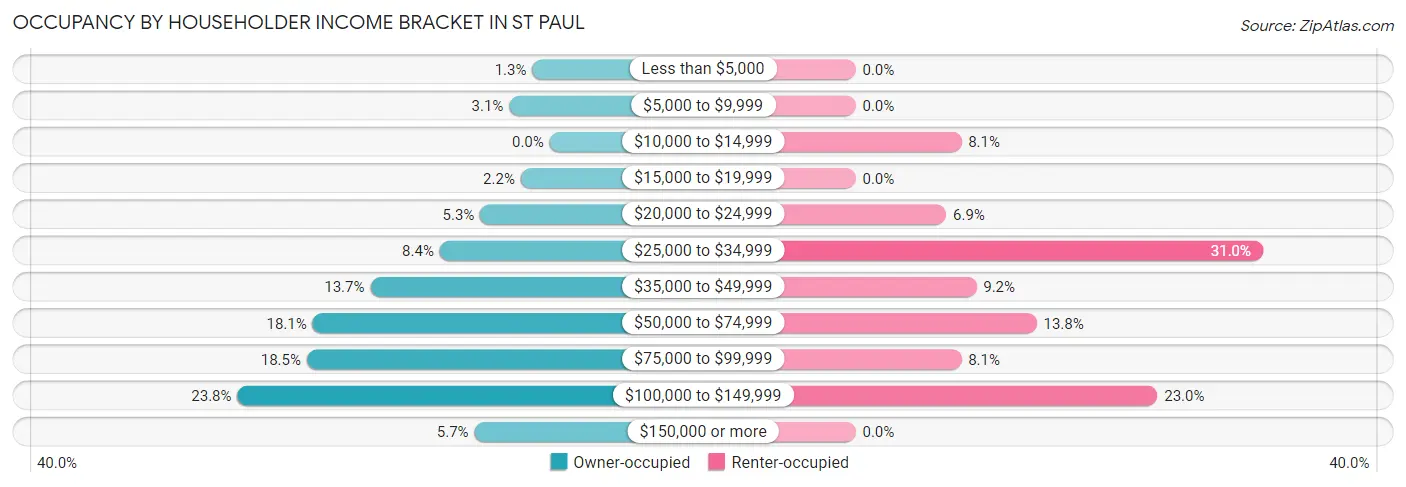
| Income Bracket | Owner-occupied | Renter-occupied |
| Less than $5,000 | 3 (1.3%) | 0 (0.0%) |
| $5,000 to $9,999 | 7 (3.1%) | 0 (0.0%) |
| $10,000 to $14,999 | 0 (0.0%) | 7 (8.1%) |
| $15,000 to $19,999 | 5 (2.2%) | 0 (0.0%) |
| $20,000 to $24,999 | 12 (5.3%) | 6 (6.9%) |
| $25,000 to $34,999 | 19 (8.4%) | 27 (31.0%) |
| $35,000 to $49,999 | 31 (13.7%) | 8 (9.2%) |
| $50,000 to $74,999 | 41 (18.1%) | 12 (13.8%) |
| $75,000 to $99,999 | 42 (18.5%) | 7 (8.1%) |
| $100,000 to $149,999 | 54 (23.8%) | 20 (23.0%) |
| $150,000 or more | 13 (5.7%) | 0 (0.0%) |
| Total | 227 (100.0%) | 87 (100.0%) |
Monthly Housing Cost Tiers in St Paul
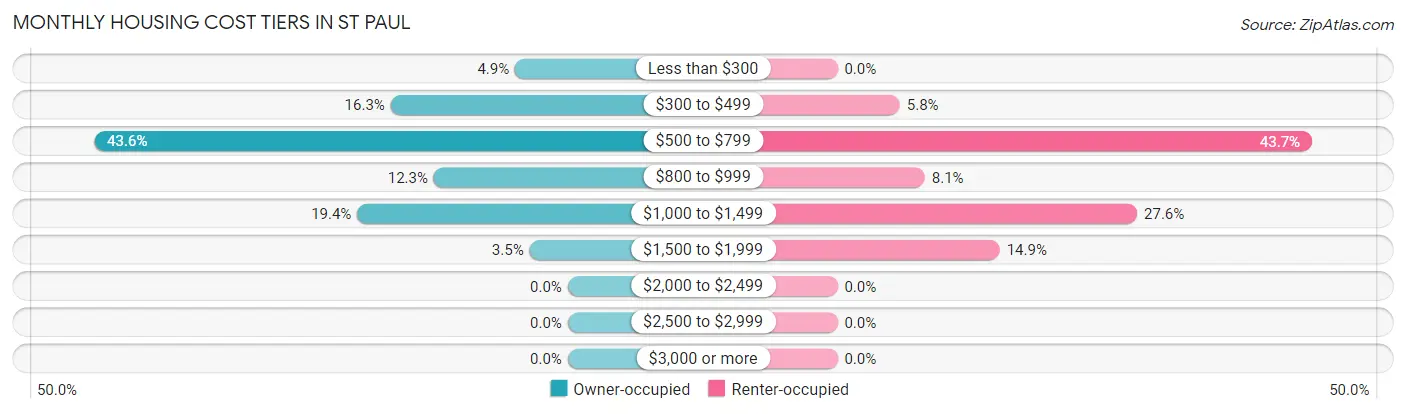
| Monthly Cost | Owner-occupied | Renter-occupied |
| Less than $300 | 11 (4.9%) | 0 (0.0%) |
| $300 to $499 | 37 (16.3%) | 5 (5.8%) |
| $500 to $799 | 99 (43.6%) | 38 (43.7%) |
| $800 to $999 | 28 (12.3%) | 7 (8.1%) |
| $1,000 to $1,499 | 44 (19.4%) | 24 (27.6%) |
| $1,500 to $1,999 | 8 (3.5%) | 13 (14.9%) |
| $2,000 to $2,499 | 0 (0.0%) | 0 (0.0%) |
| $2,500 to $2,999 | 0 (0.0%) | 0 (0.0%) |
| $3,000 or more | 0 (0.0%) | 0 (0.0%) |
| Total | 227 (100.0%) | 87 (100.0%) |
Physical Housing Characteristics in St Paul
Housing Structures in St Paul
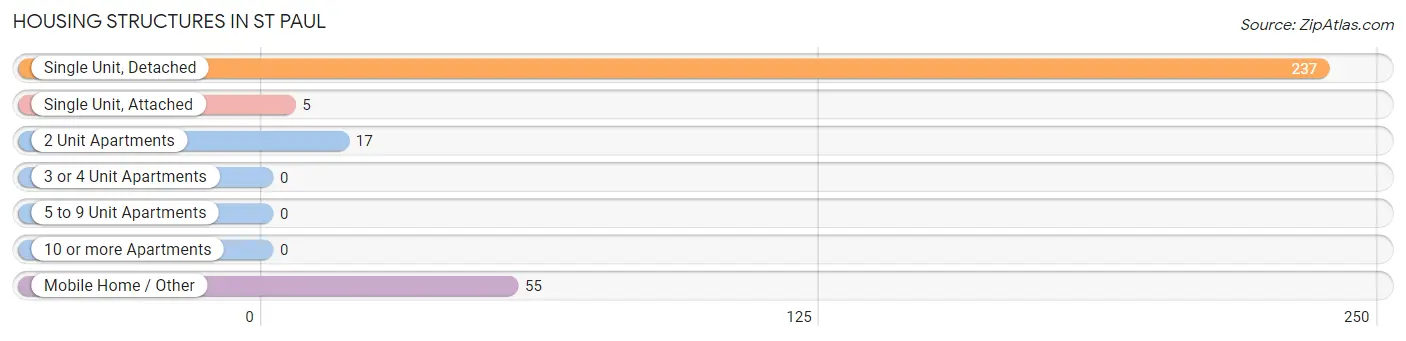
| Structure Type | # Housing Units | % Housing Units |
| Single Unit, Detached | 237 | 75.5% |
| Single Unit, Attached | 5 | 1.6% |
| 2 Unit Apartments | 17 | 5.4% |
| 3 or 4 Unit Apartments | 0 | 0.0% |
| 5 to 9 Unit Apartments | 0 | 0.0% |
| 10 or more Apartments | 0 | 0.0% |
| Mobile Home / Other | 55 | 17.5% |
| Total | 314 | 100.0% |
Housing Structures by Occupancy in St Paul
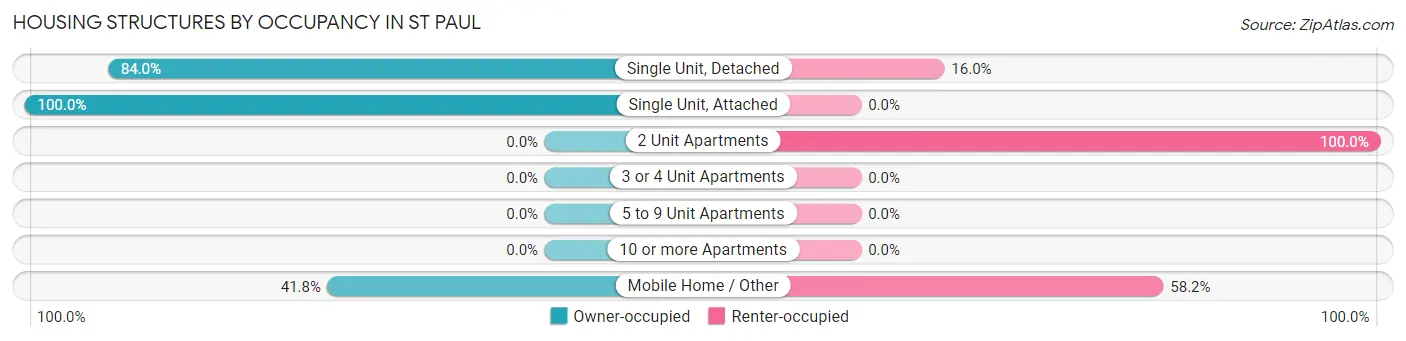
| Structure Type | Owner-occupied | Renter-occupied |
| Single Unit, Detached | 199 (84.0%) | 38 (16.0%) |
| Single Unit, Attached | 5 (100.0%) | 0 (0.0%) |
| 2 Unit Apartments | 0 (0.0%) | 17 (100.0%) |
| 3 or 4 Unit Apartments | 0 (0.0%) | 0 (0.0%) |
| 5 to 9 Unit Apartments | 0 (0.0%) | 0 (0.0%) |
| 10 or more Apartments | 0 (0.0%) | 0 (0.0%) |
| Mobile Home / Other | 23 (41.8%) | 32 (58.2%) |
| Total | 227 (72.3%) | 87 (27.7%) |
Housing Structures by Number of Rooms in St Paul
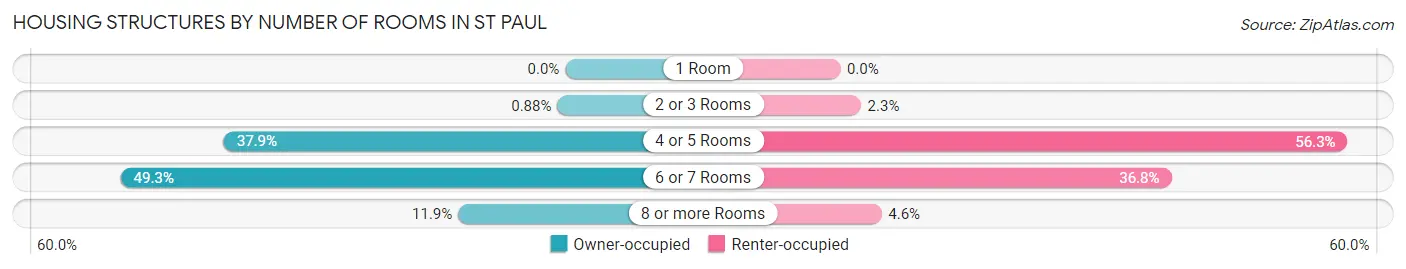
| Number of Rooms | Owner-occupied | Renter-occupied |
| 1 Room | 0 (0.0%) | 0 (0.0%) |
| 2 or 3 Rooms | 2 (0.9%) | 2 (2.3%) |
| 4 or 5 Rooms | 86 (37.9%) | 49 (56.3%) |
| 6 or 7 Rooms | 112 (49.3%) | 32 (36.8%) |
| 8 or more Rooms | 27 (11.9%) | 4 (4.6%) |
| Total | 227 (100.0%) | 87 (100.0%) |
Housing Structure by Heating Type in St Paul
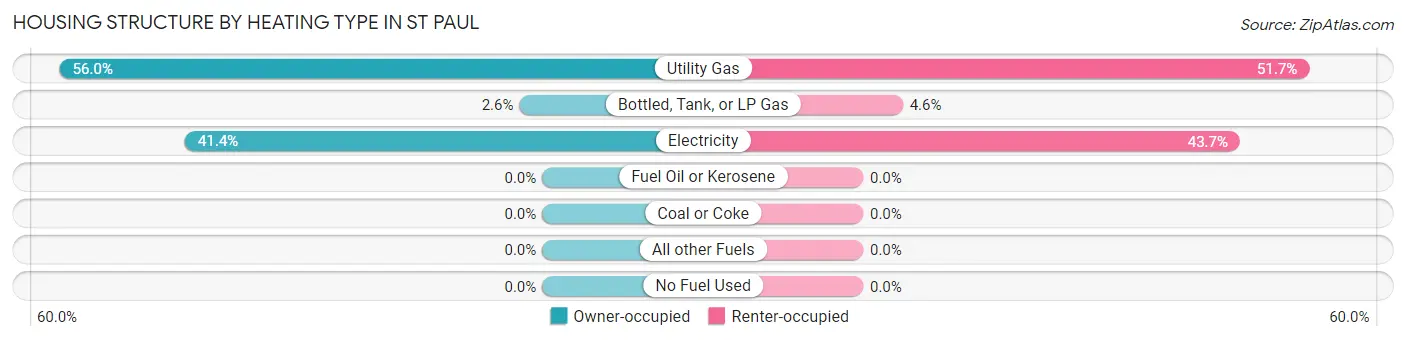
| Heating Type | Owner-occupied | Renter-occupied |
| Utility Gas | 127 (55.9%) | 45 (51.7%) |
| Bottled, Tank, or LP Gas | 6 (2.6%) | 4 (4.6%) |
| Electricity | 94 (41.4%) | 38 (43.7%) |
| Fuel Oil or Kerosene | 0 (0.0%) | 0 (0.0%) |
| Coal or Coke | 0 (0.0%) | 0 (0.0%) |
| All other Fuels | 0 (0.0%) | 0 (0.0%) |
| No Fuel Used | 0 (0.0%) | 0 (0.0%) |
| Total | 227 (100.0%) | 87 (100.0%) |
Household Vehicle Usage in St Paul
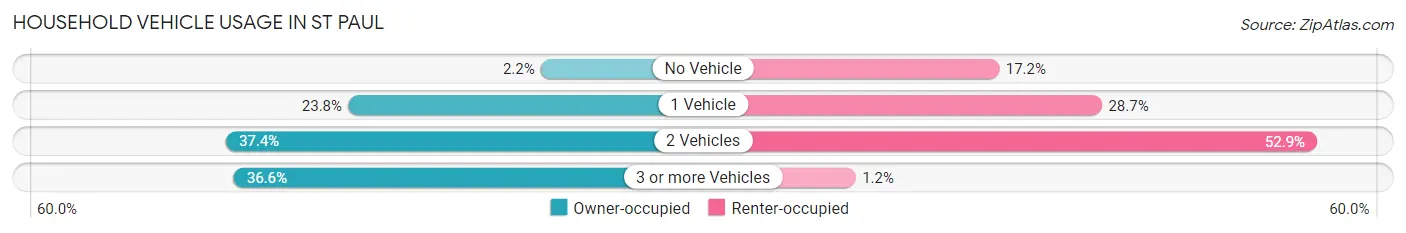
| Vehicles per Household | Owner-occupied | Renter-occupied |
| No Vehicle | 5 (2.2%) | 15 (17.2%) |
| 1 Vehicle | 54 (23.8%) | 25 (28.7%) |
| 2 Vehicles | 85 (37.4%) | 46 (52.9%) |
| 3 or more Vehicles | 83 (36.6%) | 1 (1.1%) |
| Total | 227 (100.0%) | 87 (100.0%) |
Real Estate & Mortgages in St Paul
Real Estate and Mortgage Overview in St Paul
| Characteristic | Without Mortgage | With Mortgage |
| Housing Units | 74 | 153 |
| Median Property Value | $87,300 | $96,800 |
| Median Household Income | $53,750 | $6 |
| Monthly Housing Costs | $443 | $0 |
| Real Estate Taxes | $513 | $10 |
Property Value by Mortgage Status in St Paul
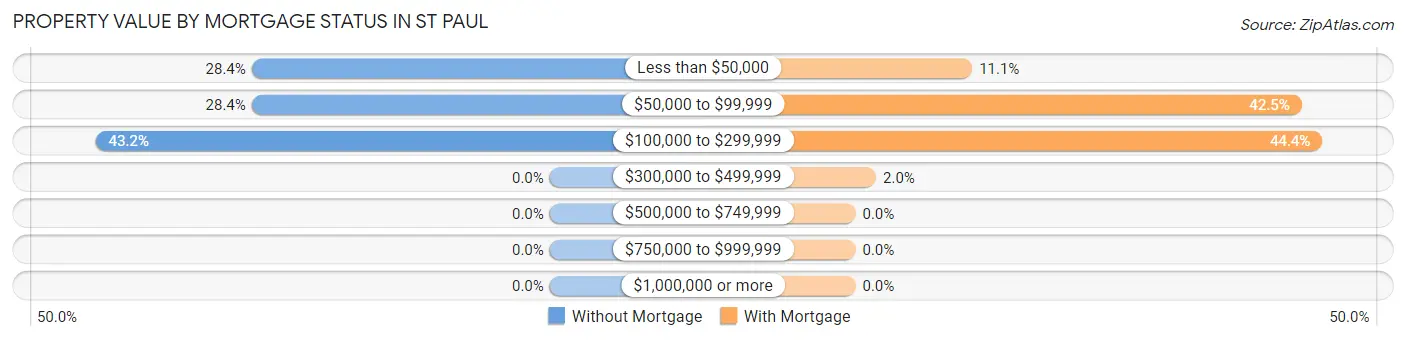
| Property Value | Without Mortgage | With Mortgage |
| Less than $50,000 | 21 (28.4%) | 17 (11.1%) |
| $50,000 to $99,999 | 21 (28.4%) | 65 (42.5%) |
| $100,000 to $299,999 | 32 (43.2%) | 68 (44.4%) |
| $300,000 to $499,999 | 0 (0.0%) | 3 (2.0%) |
| $500,000 to $749,999 | 0 (0.0%) | 0 (0.0%) |
| $750,000 to $999,999 | 0 (0.0%) | 0 (0.0%) |
| $1,000,000 or more | 0 (0.0%) | 0 (0.0%) |
| Total | 74 (100.0%) | 153 (100.0%) |
Household Income by Mortgage Status in St Paul
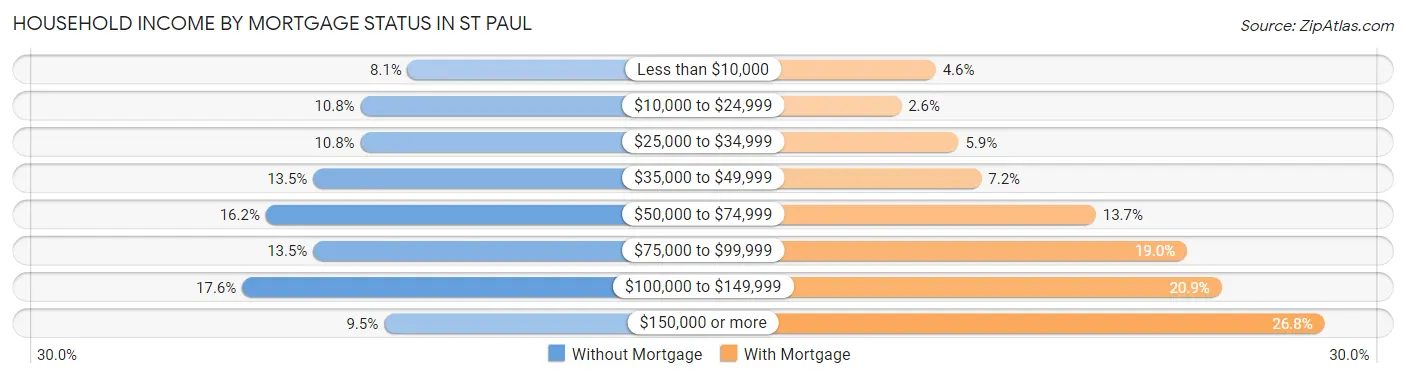
| Household Income | Without Mortgage | With Mortgage |
| Less than $10,000 | 6 (8.1%) | 7 (4.6%) |
| $10,000 to $24,999 | 8 (10.8%) | 4 (2.6%) |
| $25,000 to $34,999 | 8 (10.8%) | 9 (5.9%) |
| $35,000 to $49,999 | 10 (13.5%) | 11 (7.2%) |
| $50,000 to $74,999 | 12 (16.2%) | 21 (13.7%) |
| $75,000 to $99,999 | 10 (13.5%) | 29 (19.0%) |
| $100,000 to $149,999 | 13 (17.6%) | 32 (20.9%) |
| $150,000 or more | 7 (9.5%) | 41 (26.8%) |
| Total | 74 (100.0%) | 153 (100.0%) |
Property Value to Household Income Ratio in St Paul
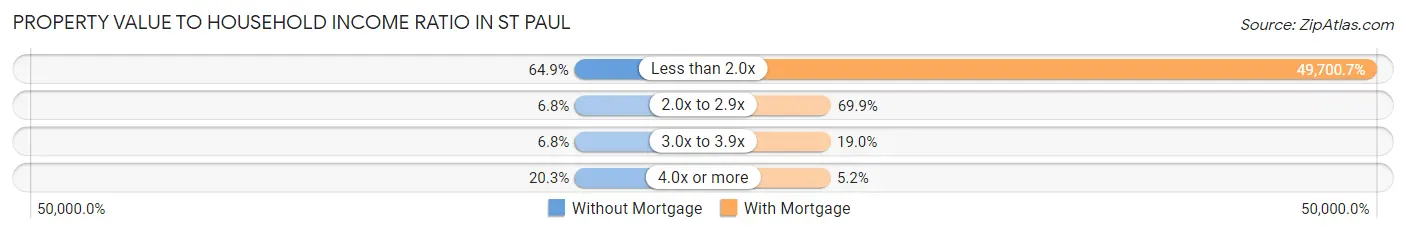
| Value-to-Income Ratio | Without Mortgage | With Mortgage |
| Less than 2.0x | 48 (64.9%) | 76,042 (49,700.7%) |
| 2.0x to 2.9x | 5 (6.8%) | 107 (69.9%) |
| 3.0x to 3.9x | 5 (6.8%) | 29 (19.0%) |
| 4.0x or more | 15 (20.3%) | 8 (5.2%) |
| Total | 74 (100.0%) | 153 (100.0%) |
Real Estate Taxes by Mortgage Status in St Paul
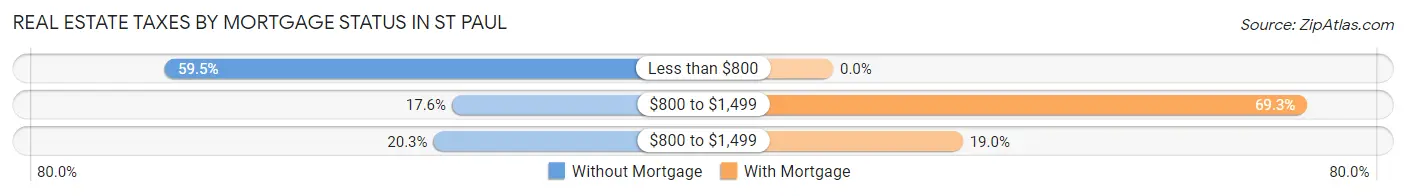
| Property Taxes | Without Mortgage | With Mortgage |
| Less than $800 | 44 (59.5%) | 0 (0.0%) |
| $800 to $1,499 | 13 (17.6%) | 106 (69.3%) |
| $800 to $1,499 | 15 (20.3%) | 29 (19.0%) |
| Total | 74 (100.0%) | 153 (100.0%) |
Health & Disability in St Paul
Health Insurance Coverage by Age in St Paul
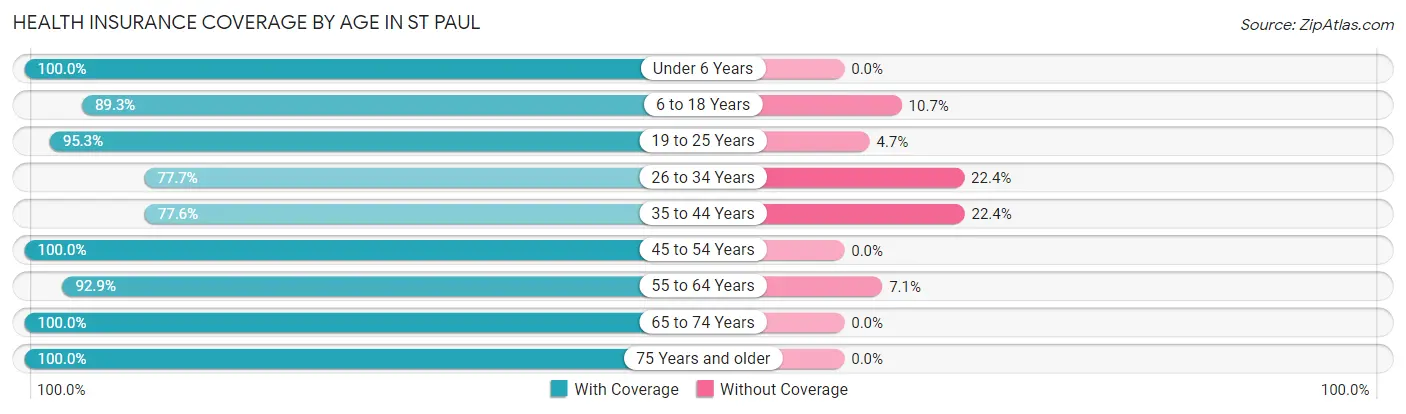
| Age Bracket | With Coverage | Without Coverage |
| Under 6 Years | 92 (100.0%) | 0 (0.0%) |
| 6 to 18 Years | 217 (89.3%) | 26 (10.7%) |
| 19 to 25 Years | 81 (95.3%) | 4 (4.7%) |
| 26 to 34 Years | 66 (77.6%) | 19 (22.4%) |
| 35 to 44 Years | 83 (77.6%) | 24 (22.4%) |
| 45 to 54 Years | 99 (100.0%) | 0 (0.0%) |
| 55 to 64 Years | 92 (92.9%) | 7 (7.1%) |
| 65 to 74 Years | 81 (100.0%) | 0 (0.0%) |
| 75 Years and older | 43 (100.0%) | 0 (0.0%) |
| Total | 854 (91.4%) | 80 (8.6%) |
Health Insurance Coverage by Citizenship Status in St Paul
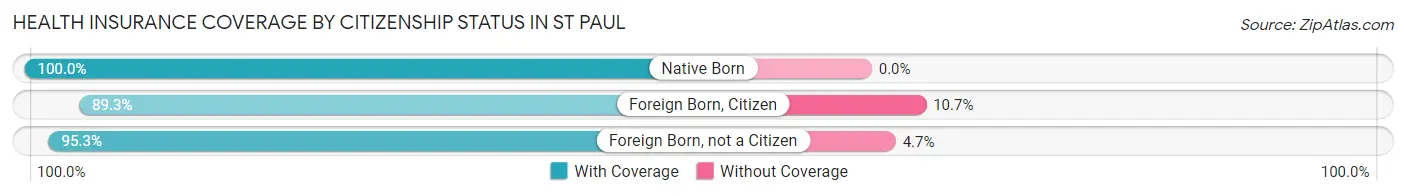
| Citizenship Status | With Coverage | Without Coverage |
| Native Born | 92 (100.0%) | 0 (0.0%) |
| Foreign Born, Citizen | 217 (89.3%) | 26 (10.7%) |
| Foreign Born, not a Citizen | 81 (95.3%) | 4 (4.7%) |
Health Insurance Coverage by Household Income in St Paul
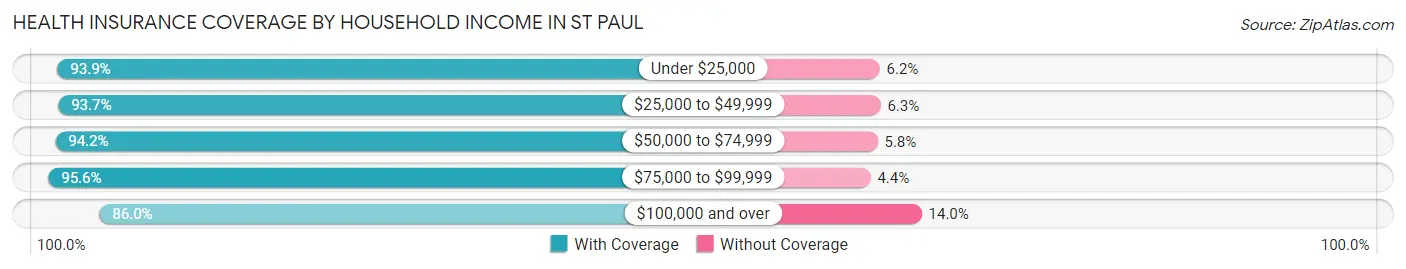
| Household Income | With Coverage | Without Coverage |
| Under $25,000 | 61 (93.9%) | 4 (6.1%) |
| $25,000 to $49,999 | 208 (93.7%) | 14 (6.3%) |
| $50,000 to $74,999 | 131 (94.2%) | 8 (5.8%) |
| $75,000 to $99,999 | 172 (95.6%) | 8 (4.4%) |
| $100,000 and over | 282 (86.0%) | 46 (14.0%) |
Public vs Private Health Insurance Coverage by Age in St Paul
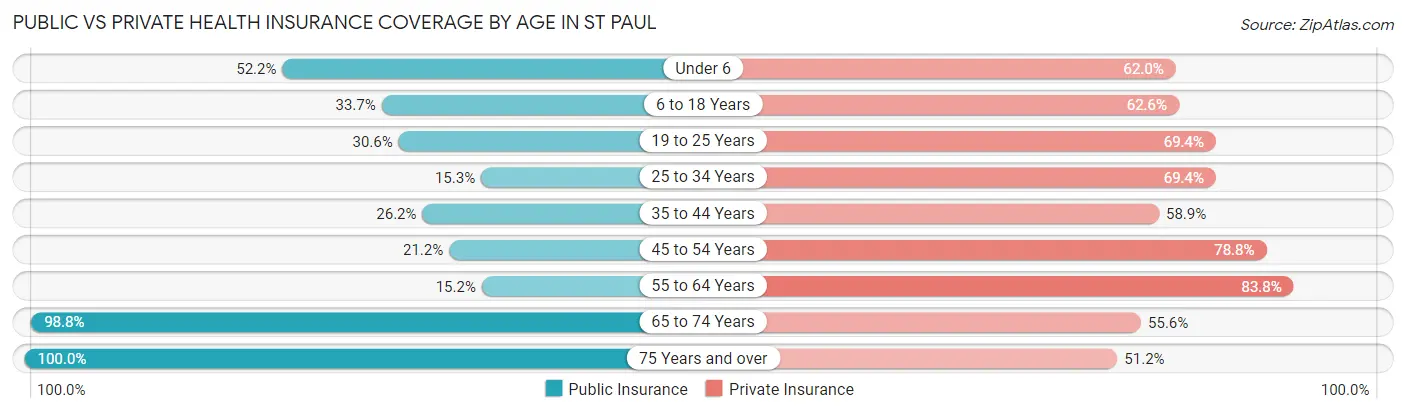
| Age Bracket | Public Insurance | Private Insurance |
| Under 6 | 48 (52.2%) | 57 (62.0%) |
| 6 to 18 Years | 82 (33.7%) | 152 (62.5%) |
| 19 to 25 Years | 26 (30.6%) | 59 (69.4%) |
| 25 to 34 Years | 13 (15.3%) | 59 (69.4%) |
| 35 to 44 Years | 28 (26.2%) | 63 (58.9%) |
| 45 to 54 Years | 21 (21.2%) | 78 (78.8%) |
| 55 to 64 Years | 15 (15.1%) | 83 (83.8%) |
| 65 to 74 Years | 80 (98.8%) | 45 (55.6%) |
| 75 Years and over | 43 (100.0%) | 22 (51.2%) |
| Total | 356 (38.1%) | 618 (66.2%) |
Disability Status by Sex by Age in St Paul
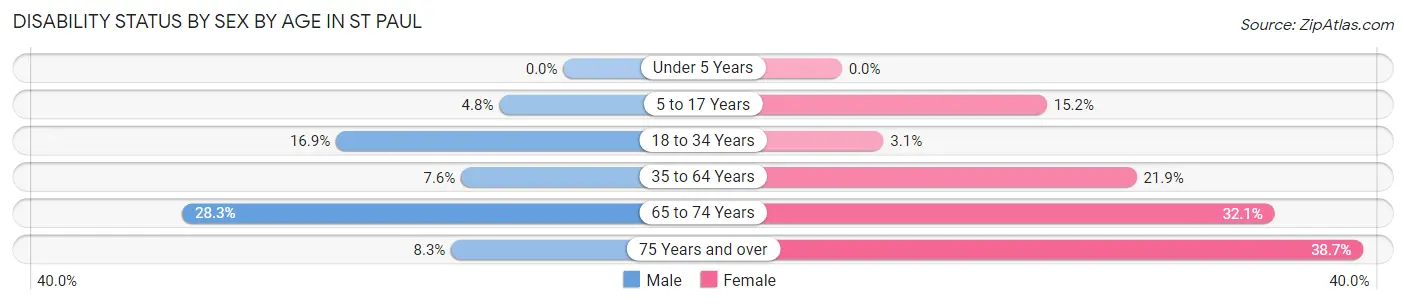
| Age Bracket | Male | Female |
| Under 5 Years | 0 (0.0%) | 0 (0.0%) |
| 5 to 17 Years | 5 (4.8%) | 21 (15.2%) |
| 18 to 34 Years | 13 (16.9%) | 3 (3.1%) |
| 35 to 64 Years | 11 (7.6%) | 35 (21.9%) |
| 65 to 74 Years | 15 (28.3%) | 9 (32.1%) |
| 75 Years and over | 1 (8.3%) | 12 (38.7%) |
Disability Class by Sex by Age in St Paul
Disability Class: Hearing Difficulty
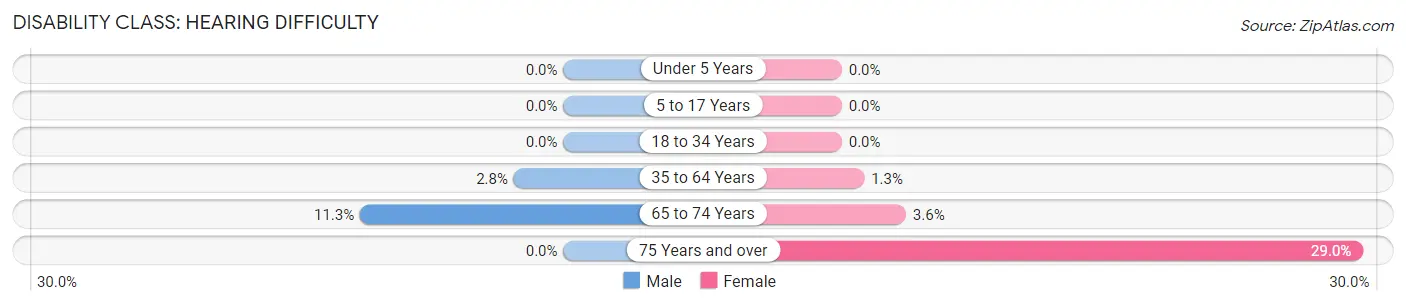
| Age Bracket | Male | Female |
| Under 5 Years | 0 (0.0%) | 0 (0.0%) |
| 5 to 17 Years | 0 (0.0%) | 0 (0.0%) |
| 18 to 34 Years | 0 (0.0%) | 0 (0.0%) |
| 35 to 64 Years | 4 (2.8%) | 2 (1.3%) |
| 65 to 74 Years | 6 (11.3%) | 1 (3.6%) |
| 75 Years and over | 0 (0.0%) | 9 (29.0%) |
Disability Class: Vision Difficulty
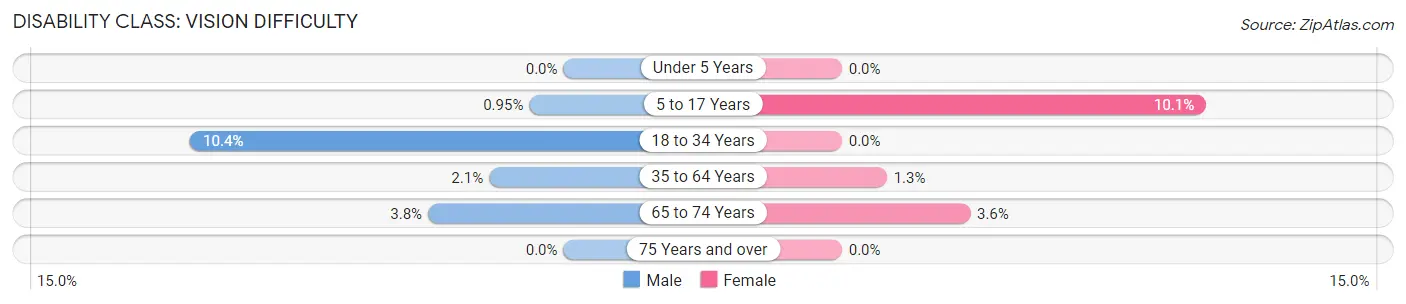
| Age Bracket | Male | Female |
| Under 5 Years | 0 (0.0%) | 0 (0.0%) |
| 5 to 17 Years | 1 (0.9%) | 14 (10.1%) |
| 18 to 34 Years | 8 (10.4%) | 0 (0.0%) |
| 35 to 64 Years | 3 (2.1%) | 2 (1.3%) |
| 65 to 74 Years | 2 (3.8%) | 1 (3.6%) |
| 75 Years and over | 0 (0.0%) | 0 (0.0%) |
Disability Class: Cognitive Difficulty
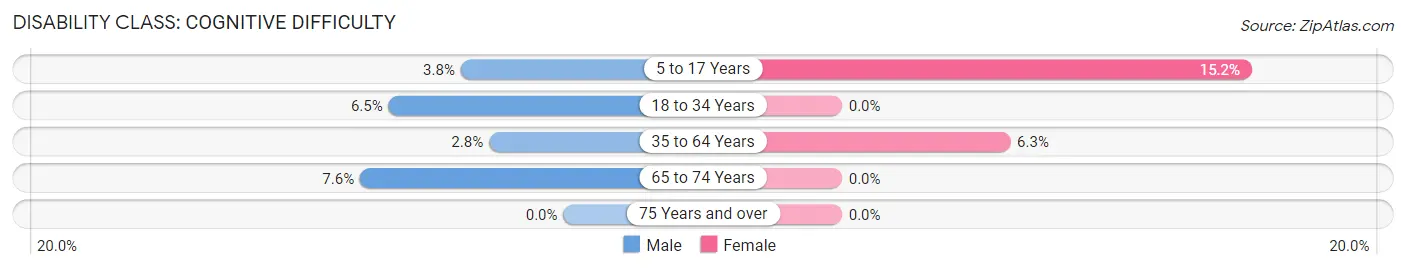
| Age Bracket | Male | Female |
| 5 to 17 Years | 4 (3.8%) | 21 (15.2%) |
| 18 to 34 Years | 5 (6.5%) | 0 (0.0%) |
| 35 to 64 Years | 4 (2.8%) | 10 (6.2%) |
| 65 to 74 Years | 4 (7.5%) | 0 (0.0%) |
| 75 Years and over | 0 (0.0%) | 0 (0.0%) |
Disability Class: Ambulatory Difficulty
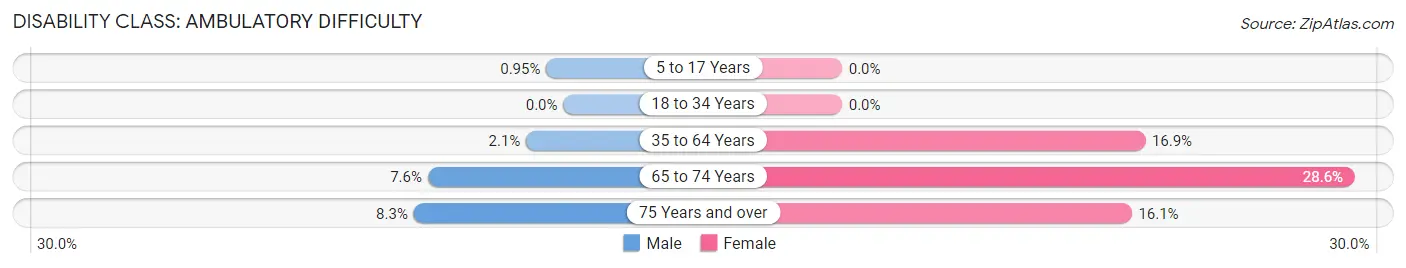
| Age Bracket | Male | Female |
| 5 to 17 Years | 1 (0.9%) | 0 (0.0%) |
| 18 to 34 Years | 0 (0.0%) | 0 (0.0%) |
| 35 to 64 Years | 3 (2.1%) | 27 (16.9%) |
| 65 to 74 Years | 4 (7.5%) | 8 (28.6%) |
| 75 Years and over | 1 (8.3%) | 5 (16.1%) |
Disability Class: Self-Care Difficulty
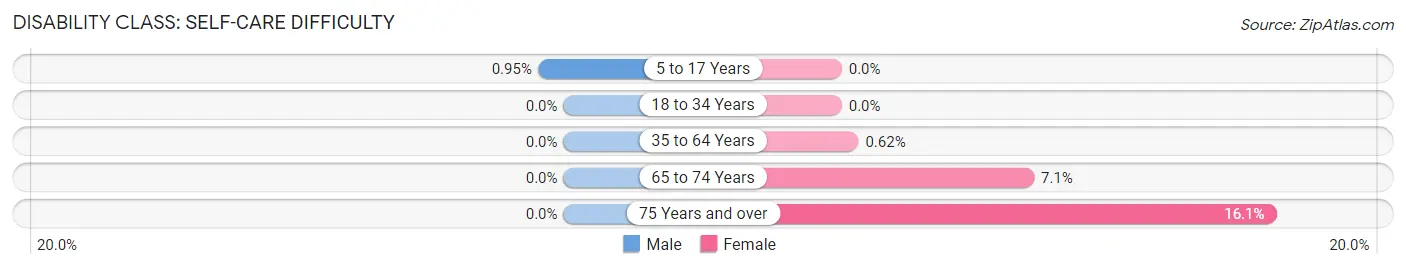
| Age Bracket | Male | Female |
| 5 to 17 Years | 1 (0.9%) | 0 (0.0%) |
| 18 to 34 Years | 0 (0.0%) | 0 (0.0%) |
| 35 to 64 Years | 0 (0.0%) | 1 (0.6%) |
| 65 to 74 Years | 0 (0.0%) | 2 (7.1%) |
| 75 Years and over | 0 (0.0%) | 5 (16.1%) |
Technology Access in St Paul
Computing Device Access in St Paul
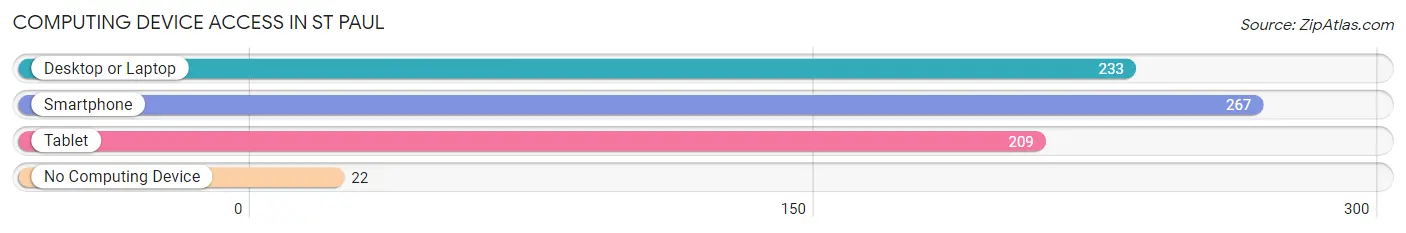
| Device Type | # Households | % Households |
| Desktop or Laptop | 233 | 74.2% |
| Smartphone | 267 | 85.0% |
| Tablet | 209 | 66.6% |
| No Computing Device | 22 | 7.0% |
| Total | 314 | 100.0% |
Internet Access in St Paul
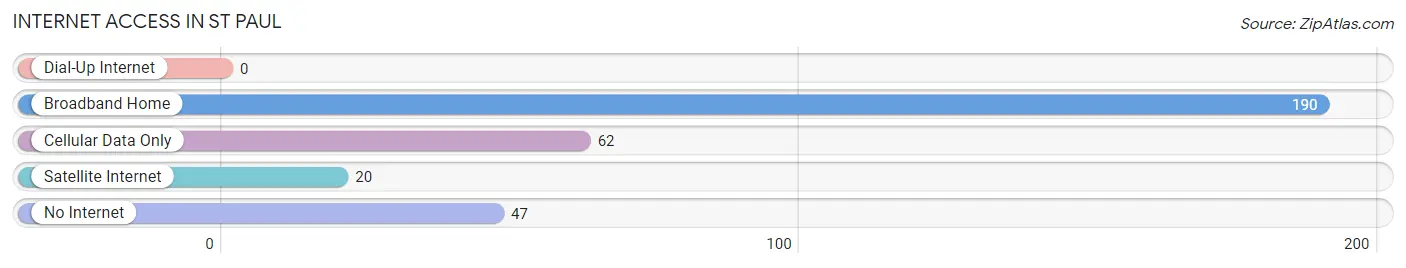
| Internet Type | # Households | % Households |
| Dial-Up Internet | 0 | 0.0% |
| Broadband Home | 190 | 60.5% |
| Cellular Data Only | 62 | 19.8% |
| Satellite Internet | 20 | 6.4% |
| No Internet | 47 | 15.0% |
| Total | 314 | 100.0% |
St Paul Summary
St. Paul is a small town located in the state of Indiana, in the United States. It is situated in the northern part of the state, in the county of Jasper. The town has a population of around 1,500 people, and is part of the Jasper-Newton-Dubois Combined Statistical Area.
Geography
St. Paul is located in the northern part of Indiana, in the county of Jasper. It is situated at an elevation of 845 feet above sea level. The town is located on the banks of the Patoka River, and is surrounded by rolling hills and woodlands. The town is located in the Central Till Plains region of Indiana, and is part of the Kankakee-Iroquois National Wildlife Refuge. The town is located approximately 40 miles from the city of Indianapolis.
Climate
St. Paul has a humid continental climate, with hot summers and cold winters. The average temperature in the summer months is around 75°F, while in the winter months it is around 35°F. The town receives an average of 40 inches of precipitation per year, with most of it falling in the spring and summer months.
Demographics
As of the 2010 census, St. Paul had a population of 1,500 people. The racial makeup of the town was 97.3% White, 0.7% African American, 0.3% Native American, 0.3% Asian, and 1.3% from other races. The median household income was $37,500, and the median family income was $45,000. The per capita income was $17,000.
Economy
St. Paul’s economy is largely based on agriculture and manufacturing. The town is home to several small businesses, including a feed mill, a lumber yard, and a grain elevator. The town is also home to a number of small farms, which produce corn, soybeans, and wheat. The town is also home to a number of small manufacturing companies, which produce a variety of products, including furniture, clothing, and automotive parts.
History
St. Paul was founded in 1837 by a group of settlers from Ohio. The town was named after the nearby St. Paul’s Church, which was built in 1838. The town grew slowly over the years, and by the early 1900s, it had become a thriving agricultural community. The town was also home to a number of small businesses, including a feed mill, a lumber yard, and a grain elevator.
In the late 20th century, St. Paul began to experience a decline in population, as many of its residents moved away in search of better job opportunities. Despite this, the town has managed to remain a vibrant community, and continues to be a popular destination for visitors.
Conclusion
St. Paul is a small town located in the northern part of Indiana, in the county of Jasper. The town has a population of around 1,500 people, and is part of the Jasper-Newton-Dubois Combined Statistical Area. The town’s economy is largely based on agriculture and manufacturing, and it is home to a number of small businesses. St. Paul was founded in 1837, and has managed to remain a vibrant community despite its declining population.
Common Questions
What is the Total Population of St Paul?
Total Population of St Paul is 934.
What is the Total Male Population of St Paul?
Total Male Population of St Paul is 428.
What is the Total Female Population of St Paul?
Total Female Population of St Paul is 506.
What is the Ratio of Males per 100 Females in St Paul?
There are 84.58 Males per 100 Females in St Paul.
What is the Ratio of Females per 100 Males in St Paul?
There are 118.22 Females per 100 Males in St Paul.
What is the Median Population Age in St Paul?
Median Population Age in St Paul is 29.4 Years.
What is the Average Family Size in St Paul
Average Family Size in St Paul is 3.3 People.
What is the Average Household Size in St Paul
Average Household Size in St Paul is 3.0 People.
What is Per Capita Income in St Paul?
Per Capita income in St Paul is $24,123.
What is the Median Family Income in St Paul?
Median Family Income in St Paul is $75,500.
What is the Median Household income in St Paul?
Median Household Income in St Paul is $63,333.
What is Income or Wage Gap in St Paul?
Income or Wage Gap in St Paul is 42.5%.
Women in St Paul earn 57.5 cents for every dollar earned by a man.
What is Inequality or Gini Index in St Paul?
Inequality or Gini Index in St Paul is 0.35.
How Large is the Labor Force in St Paul?
There are 396 People in the Labor Forcein in St Paul.
What is the Percentage of People in the Labor Force in St Paul?
62.5% of People are in the Labor Force in St Paul.
What is the Unemployment Rate in St Paul?
Unemployment Rate in St Paul is 3.8%.