Cities with the Highest Percentage of Population with a Degree in Physical and Health Sciences in Louisiana
RELATED REPORTS & OPTIONS
Physical and Health Sciences
Louisiana
Compare Cities
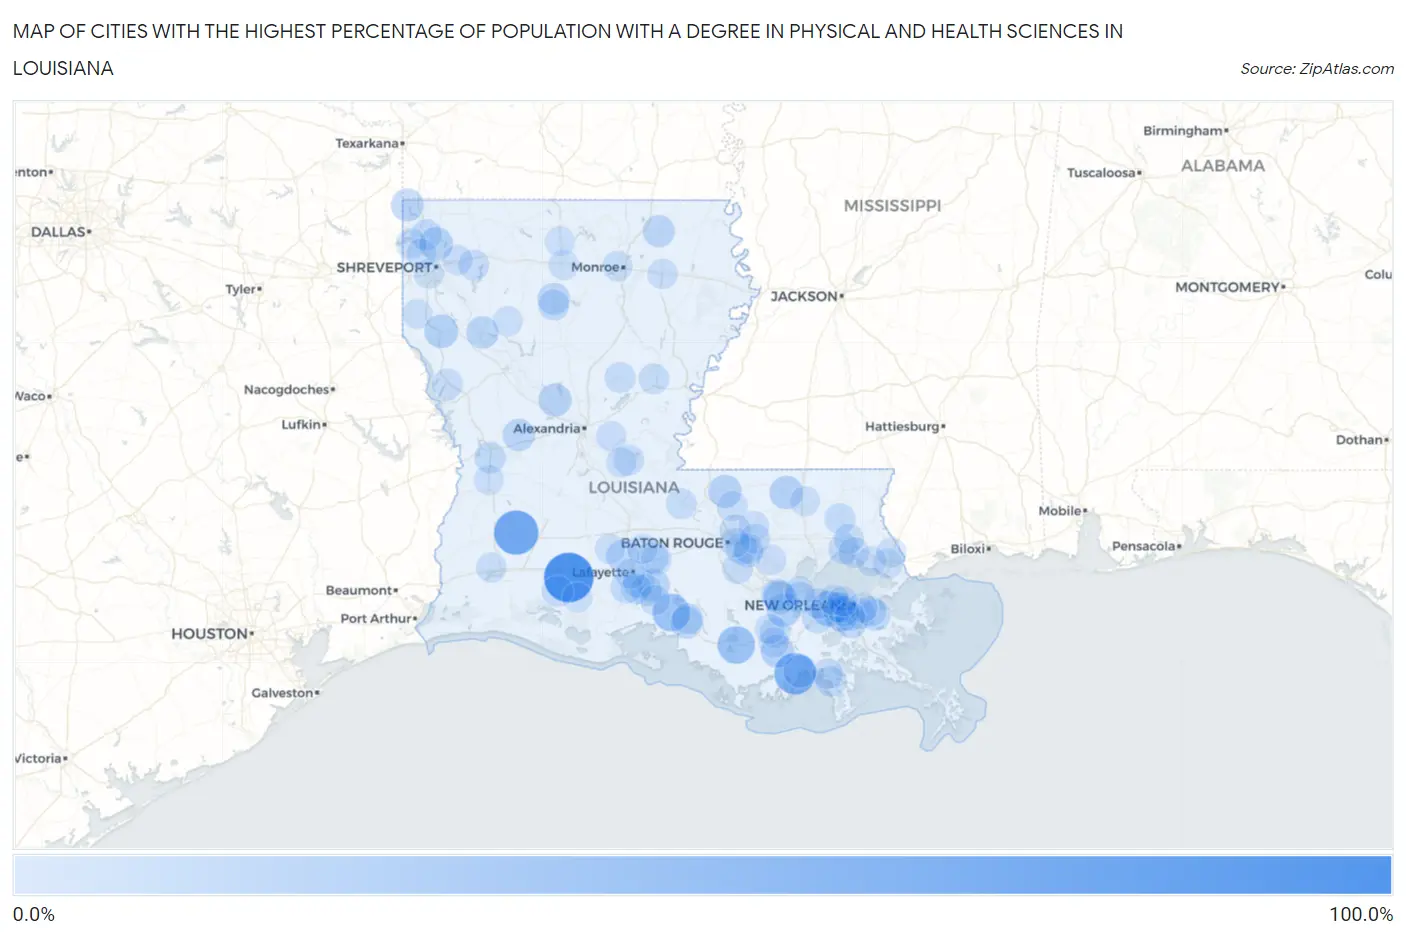
Map of Cities with the Highest Percentage of Population with a Degree in Physical and Health Sciences in Louisiana
0.0%
100.0%
Cities with the Highest Percentage of Population with a Degree in Physical and Health Sciences in Louisiana
| City | % Graduates | vs State | vs National | |
| 1. | Mermentau | 84.5% | 3.1%(+81.4)#1 | 3.1%(+81.4)#27 |
| 2. | Reeves | 61.5% | 3.1%(+58.5)#2 | 3.1%(+58.4)#49 |
| 3. | Chauvin | 50.0% | 3.1%(+46.9)#3 | 3.1%(+46.9)#79 |
| 4. | Jeanerette | 33.6% | 3.1%(+30.5)#4 | 3.1%(+30.5)#200 |
| 5. | Amelia | 33.3% | 3.1%(+30.2)#5 | 3.1%(+30.2)#201 |
| 6. | Ama | 24.8% | 3.1%(+21.7)#6 | 3.1%(+21.7)#395 |
| 7. | Avondale | 24.1% | 3.1%(+21.0)#7 | 3.1%(+21.0)#411 |
| 8. | South Vacherie | 18.9% | 3.1%(+15.8)#8 | 3.1%(+15.8)#594 |
| 9. | Mansfield | 17.9% | 3.1%(+14.8)#9 | 3.1%(+14.8)#647 |
| 10. | Benton | 16.5% | 3.1%(+13.4)#10 | 3.1%(+13.4)#750 |
| 11. | Greensburg | 16.5% | 3.1%(+13.4)#11 | 3.1%(+13.4)#752 |
| 12. | Paulina | 16.2% | 3.1%(+13.1)#12 | 3.1%(+13.1)#772 |
| 13. | Bayou Cane | 15.8% | 3.1%(+12.7)#13 | 3.1%(+12.7)#802 |
| 14. | Montegut | 15.7% | 3.1%(+12.6)#14 | 3.1%(+12.6)#809 |
| 15. | Jackson | 15.2% | 3.1%(+12.1)#15 | 3.1%(+12.1)#852 |
| 16. | Colfax | 15.1% | 3.1%(+12.0)#16 | 3.1%(+12.0)#861 |
| 17. | Rodessa | 14.3% | 3.1%(+11.2)#17 | 3.1%(+11.2)#966 |
| 18. | Coushatta | 12.8% | 3.1%(+9.73)#18 | 3.1%(+9.72)#1,121 |
| 19. | Cankton | 12.5% | 3.1%(+9.41)#19 | 3.1%(+9.40)#1,155 |
| 20. | Simpson | 12.5% | 3.1%(+9.41)#20 | 3.1%(+9.40)#1,158 |
| 21. | Grand Point | 12.2% | 3.1%(+9.09)#21 | 3.1%(+9.08)#1,197 |
| 22. | Mer Rouge | 12.0% | 3.1%(+8.96)#22 | 3.1%(+8.95)#1,213 |
| 23. | East Hodge | 11.9% | 3.1%(+8.82)#23 | 3.1%(+8.81)#1,234 |
| 24. | Baldwin | 11.9% | 3.1%(+8.78)#24 | 3.1%(+8.76)#1,236 |
| 25. | St Martinville | 11.6% | 3.1%(+8.52)#25 | 3.1%(+8.50)#1,281 |
| 26. | Centerville | 9.6% | 3.1%(+6.56)#26 | 3.1%(+6.55)#1,690 |
| 27. | Estelle | 9.4% | 3.1%(+6.33)#27 | 3.1%(+6.31)#1,749 |
| 28. | Milton | 9.4% | 3.1%(+6.32)#28 | 3.1%(+6.31)#1,751 |
| 29. | Cade | 9.3% | 3.1%(+6.22)#29 | 3.1%(+6.20)#1,780 |
| 30. | Cecilia | 9.2% | 3.1%(+6.16)#30 | 3.1%(+6.15)#1,804 |
| 31. | Edgard | 9.2% | 3.1%(+6.11)#31 | 3.1%(+6.10)#1,815 |
| 32. | Inniswold | 8.9% | 3.1%(+5.83)#32 | 3.1%(+5.81)#1,915 |
| 33. | Violet | 8.7% | 3.1%(+5.63)#33 | 3.1%(+5.62)#1,970 |
| 34. | New Llano | 8.7% | 3.1%(+5.63)#34 | 3.1%(+5.61)#1,972 |
| 35. | Boutte | 8.3% | 3.1%(+5.25)#35 | 3.1%(+5.23)#2,095 |
| 36. | Belcher | 8.3% | 3.1%(+5.25)#36 | 3.1%(+5.23)#2,116 |
| 37. | Broussard | 8.2% | 3.1%(+5.12)#37 | 3.1%(+5.11)#2,148 |
| 38. | Lake Arthur | 8.1% | 3.1%(+4.97)#38 | 3.1%(+4.95)#2,210 |
| 39. | Jonesboro | 7.4% | 3.1%(+4.35)#39 | 3.1%(+4.34)#2,506 |
| 40. | Charenton | 7.3% | 3.1%(+4.23)#40 | 3.1%(+4.22)#2,567 |
| 41. | Golden Meadow | 7.3% | 3.1%(+4.17)#41 | 3.1%(+4.15)#2,613 |
| 42. | Folsom | 7.1% | 3.1%(+4.01)#42 | 3.1%(+3.99)#2,726 |
| 43. | Madisonville | 7.0% | 3.1%(+3.88)#43 | 3.1%(+3.87)#2,801 |
| 44. | Lafourche Crossing | 6.7% | 3.1%(+3.61)#44 | 3.1%(+3.59)#2,966 |
| 45. | Henderson | 6.7% | 3.1%(+3.58)#45 | 3.1%(+3.57)#2,976 |
| 46. | Mandeville | 6.6% | 3.1%(+3.53)#46 | 3.1%(+3.52)#3,021 |
| 47. | Jena | 6.3% | 3.1%(+3.25)#47 | 3.1%(+3.23)#3,202 |
| 48. | Terrytown | 6.3% | 3.1%(+3.24)#48 | 3.1%(+3.23)#3,207 |
| 49. | Wallace Ridge | 6.3% | 3.1%(+3.23)#49 | 3.1%(+3.22)#3,212 |
| 50. | Doyline | 6.2% | 3.1%(+3.16)#50 | 3.1%(+3.15)#3,250 |
| 51. | Morganza | 6.2% | 3.1%(+3.16)#51 | 3.1%(+3.15)#3,251 |
| 52. | New Sarpy | 6.1% | 3.1%(+2.97)#52 | 3.1%(+2.96)#3,409 |
| 53. | Mansura | 6.0% | 3.1%(+2.88)#53 | 3.1%(+2.87)#3,483 |
| 54. | St Gabriel | 6.0% | 3.1%(+2.87)#54 | 3.1%(+2.85)#3,502 |
| 55. | Brownfields | 5.9% | 3.1%(+2.84)#55 | 3.1%(+2.82)#3,523 |
| 56. | Zwolle | 5.8% | 3.1%(+2.75)#56 | 3.1%(+2.73)#3,605 |
| 57. | Elmwood | 5.8% | 3.1%(+2.73)#57 | 3.1%(+2.71)#3,619 |
| 58. | Youngsville | 5.6% | 3.1%(+2.55)#58 | 3.1%(+2.53)#3,767 |
| 59. | Bridge City | 5.6% | 3.1%(+2.49)#59 | 3.1%(+2.48)#3,815 |
| 60. | Mooringsport | 5.6% | 3.1%(+2.47)#60 | 3.1%(+2.46)#3,837 |
| 61. | Meraux | 5.5% | 3.1%(+2.37)#61 | 3.1%(+2.36)#3,935 |
| 62. | Watson | 5.3% | 3.1%(+2.20)#62 | 3.1%(+2.19)#4,119 |
| 63. | River Ridge | 5.1% | 3.1%(+1.98)#63 | 3.1%(+1.97)#4,382 |
| 64. | Gray | 5.0% | 3.1%(+1.94)#64 | 3.1%(+1.92)#4,426 |
| 65. | Galliano | 5.0% | 3.1%(+1.87)#65 | 3.1%(+1.86)#4,497 |
| 66. | Rayville | 4.9% | 3.1%(+1.83)#66 | 3.1%(+1.82)#4,543 |
| 67. | Reserve | 4.8% | 3.1%(+1.69)#67 | 3.1%(+1.68)#4,724 |
| 68. | Old Jefferson | 4.8% | 3.1%(+1.68)#68 | 3.1%(+1.66)#4,737 |
| 69. | Denham Springs | 4.7% | 3.1%(+1.61)#69 | 3.1%(+1.60)#4,847 |
| 70. | Center Point | 4.5% | 3.1%(+1.46)#70 | 3.1%(+1.45)#5,082 |
| 71. | Kenner | 4.5% | 3.1%(+1.46)#71 | 3.1%(+1.45)#5,096 |
| 72. | Shenandoah | 4.5% | 3.1%(+1.44)#72 | 3.1%(+1.42)#5,119 |
| 73. | Westlake | 4.5% | 3.1%(+1.36)#73 | 3.1%(+1.35)#5,228 |
| 74. | Eastwood | 4.4% | 3.1%(+1.34)#74 | 3.1%(+1.32)#5,275 |
| 75. | Arnaudville | 4.3% | 3.1%(+1.26)#75 | 3.1%(+1.25)#5,386 |
| 76. | West Monroe | 4.3% | 3.1%(+1.25)#76 | 3.1%(+1.24)#5,420 |
| 77. | French Settlement | 4.3% | 3.1%(+1.20)#77 | 3.1%(+1.19)#5,493 |
| 78. | Arabi | 4.3% | 3.1%(+1.20)#78 | 3.1%(+1.18)#5,496 |
| 79. | New Iberia | 4.2% | 3.1%(+1.13)#79 | 3.1%(+1.12)#5,591 |
| 80. | Hessmer | 4.2% | 3.1%(+1.08)#80 | 3.1%(+1.07)#5,681 |
| 81. | Covington | 4.1% | 3.1%(+1.05)#81 | 3.1%(+1.04)#5,731 |
| 82. | Lafayette | 4.1% | 3.1%(+0.978)#82 | 3.1%(+0.964)#5,851 |
| 83. | Gueydan | 4.1% | 3.1%(+0.968)#83 | 3.1%(+0.954)#5,872 |
| 84. | Metairie | 4.0% | 3.1%(+0.914)#84 | 3.1%(+0.901)#5,959 |
| 85. | Blanchard | 4.0% | 3.1%(+0.914)#85 | 3.1%(+0.900)#5,964 |
| 86. | Ruston | 4.0% | 3.1%(+0.896)#86 | 3.1%(+0.883)#6,011 |
| 87. | Slidell | 4.0% | 3.1%(+0.892)#87 | 3.1%(+0.879)#6,020 |
| 88. | Slaughter | 3.9% | 3.1%(+0.810)#88 | 3.1%(+0.796)#6,187 |
| 89. | Pearl River | 3.8% | 3.1%(+0.749)#89 | 3.1%(+0.735)#6,309 |
| 90. | Marrero | 3.7% | 3.1%(+0.586)#90 | 3.1%(+0.573)#6,640 |
| 91. | Roseland | 3.6% | 3.1%(+0.550)#91 | 3.1%(+0.537)#6,698 |
| 92. | Dubach | 3.6% | 3.1%(+0.528)#92 | 3.1%(+0.515)#6,753 |
| 93. | Baton Rouge | 3.6% | 3.1%(+0.525)#93 | 3.1%(+0.512)#6,762 |
| 94. | Rosepine | 3.6% | 3.1%(+0.522)#94 | 3.1%(+0.509)#6,771 |
| 95. | Keachi | 3.6% | 3.1%(+0.485)#95 | 3.1%(+0.472)#6,874 |
| 96. | Ashland | 3.6% | 3.1%(+0.485)#96 | 3.1%(+0.472)#6,876 |
| 97. | Lacombe | 3.5% | 3.1%(+0.422)#97 | 3.1%(+0.408)#7,011 |
| 98. | Church Point | 3.5% | 3.1%(+0.382)#98 | 3.1%(+0.368)#7,098 |
| 99. | Shreveport | 3.5% | 3.1%(+0.364)#99 | 3.1%(+0.351)#7,130 |
| 100. | Thibodaux | 3.4% | 3.1%(+0.331)#100 | 3.1%(+0.317)#7,232 |
Common Questions
What are the Top 10 Cities with the Highest Percentage of Population with a Degree in Physical and Health Sciences in Louisiana?
Top 10 Cities with the Highest Percentage of Population with a Degree in Physical and Health Sciences in Louisiana are:
#1
84.5%
#2
61.5%
#3
50.0%
#4
33.6%
#5
33.3%
#6
24.8%
#7
24.1%
#8
18.9%
#9
17.9%
#10
16.5%
What city has the Highest Percentage of Population with a Degree in Physical and Health Sciences in Louisiana?
Mermentau has the Highest Percentage of Population with a Degree in Physical and Health Sciences in Louisiana with 84.5%.
What is the Percentage of Population with a Degree in Physical and Health Sciences in the State of Louisiana?
Percentage of Population with a Degree in Physical and Health Sciences in Louisiana is 3.1%.
What is the Percentage of Population with a Degree in Physical and Health Sciences in the United States?
Percentage of Population with a Degree in Physical and Health Sciences in the United States is 3.1%.