Leavenworth, IN
Leavenworth Map
Leavenworth Overview
328
TOTAL POPULATION
152
MALE POPULATION
176
FEMALE POPULATION
86.36
MALES / 100 FEMALES
115.79
FEMALES / 100 MALES
64.3
MEDIAN AGE
2.2
AVG FAMILY SIZE
1.9
AVG HOUSEHOLD SIZE
$20,925
PER CAPITA INCOME
$54,943
AVG FAMILY INCOME
$53,385
AVG HOUSEHOLD INCOME
5.5%
WAGE / INCOME GAP [ % ]
94.5¢/ $1
WAGE / INCOME GAP [ $ ]
$10,390
FAMILY INCOME DEFICIT
0.35
INEQUALITY / GINI INDEX
127
LABOR FORCE [ PEOPLE ]
42.8%
PERCENT IN LABOR FORCE
25.2%
UNEMPLOYMENT RATE
Leavenworth Zip Codes
Leavenworth Area Codes
Race in Leavenworth
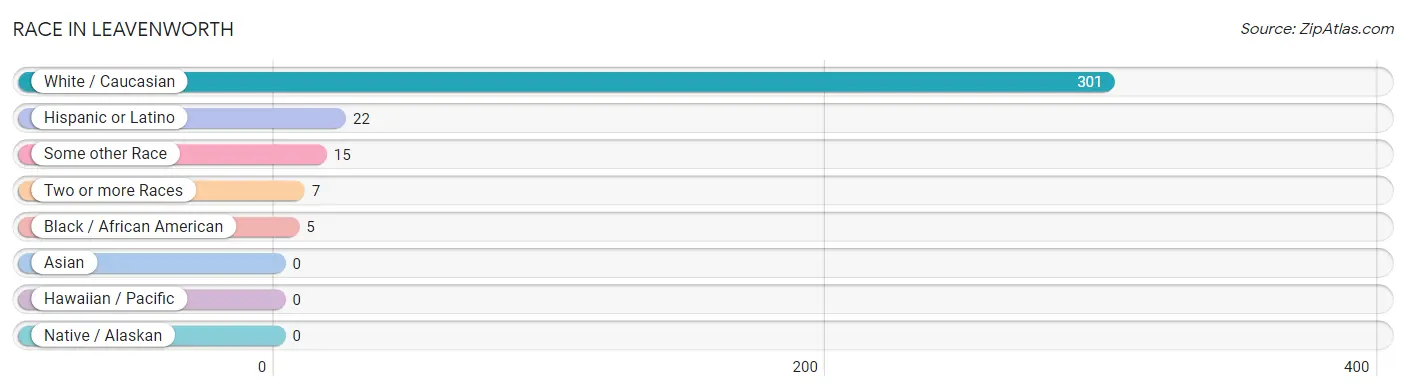
The most populous races in Leavenworth are White / Caucasian (301 | 91.8%), Hispanic or Latino (22 | 6.7%), and Some other Race (15 | 4.6%).
| Race | # Population | % Population |
| Asian | 0 | 0.0% |
| Black / African American | 5 | 1.5% |
| Hawaiian / Pacific | 0 | 0.0% |
| Hispanic or Latino | 22 | 6.7% |
| Native / Alaskan | 0 | 0.0% |
| White / Caucasian | 301 | 91.8% |
| Two or more Races | 7 | 2.1% |
| Some other Race | 15 | 4.6% |
| Total | 328 | 100.0% |
Ancestry in Leavenworth
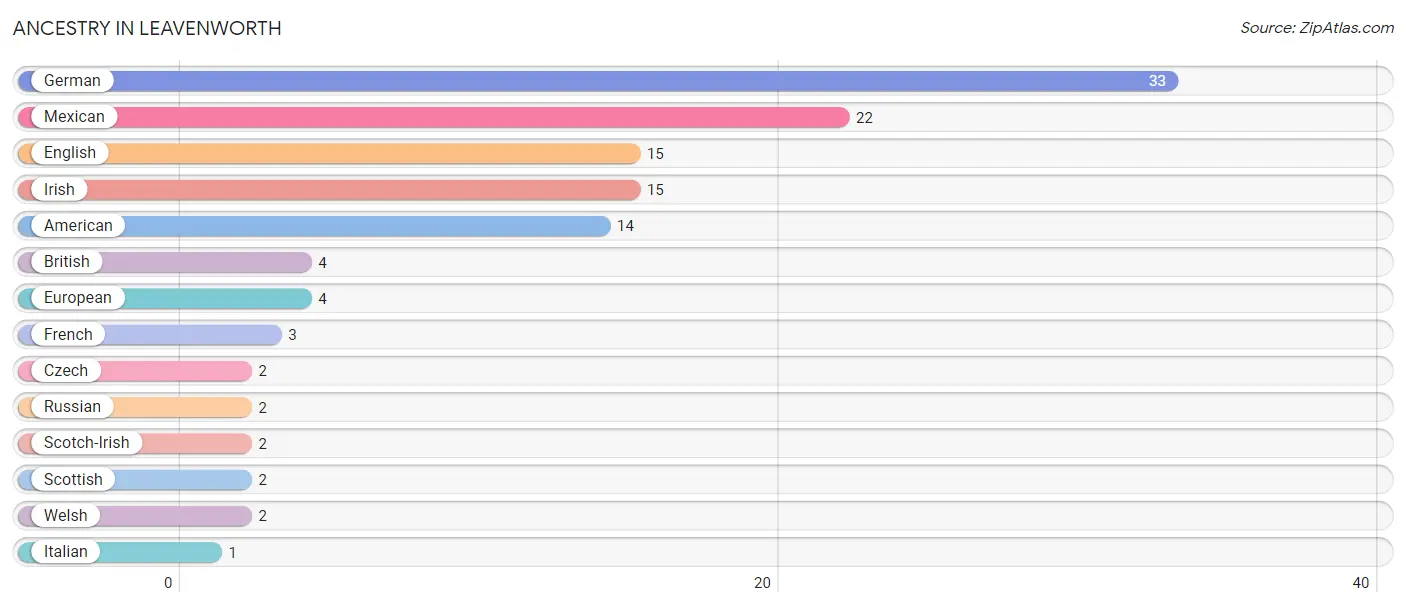
The most populous ancestries reported in Leavenworth are German (33 | 10.1%), Mexican (22 | 6.7%), English (15 | 4.6%), Irish (15 | 4.6%), and American (14 | 4.3%), together accounting for 30.2% of all Leavenworth residents.
| Ancestry | # Population | % Population |
| American | 14 | 4.3% |
| British | 4 | 1.2% |
| Czech | 2 | 0.6% |
| English | 15 | 4.6% |
| European | 4 | 1.2% |
| French | 3 | 0.9% |
| German | 33 | 10.1% |
| Irish | 15 | 4.6% |
| Italian | 1 | 0.3% |
| Mexican | 22 | 6.7% |
| Russian | 2 | 0.6% |
| Scotch-Irish | 2 | 0.6% |
| Scottish | 2 | 0.6% |
| Welsh | 2 | 0.6% | View All 14 Rows |
Immigrants in Leavenworth

| Immigration Origin | # Population | % Population | View All 0 Rows |
Sex and Age in Leavenworth
Sex and Age in Leavenworth
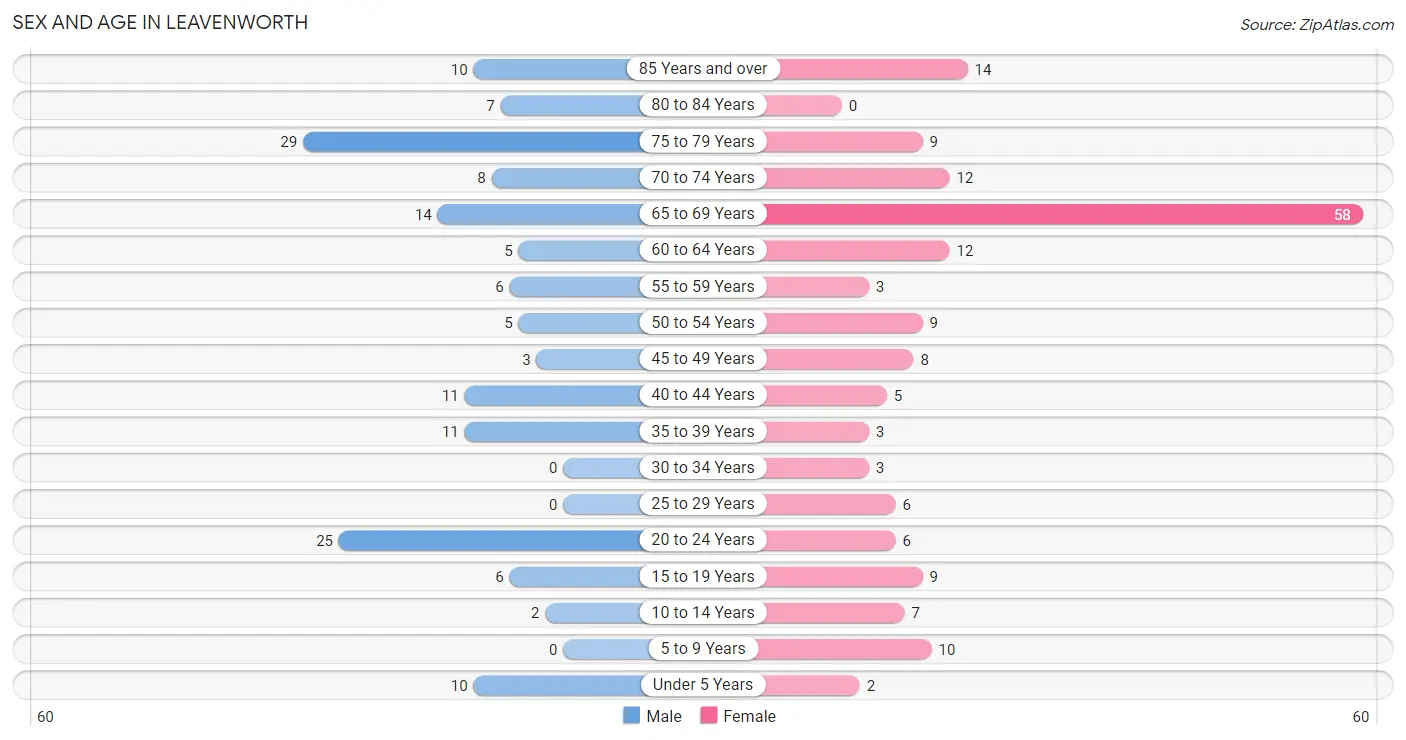
The most populous age groups in Leavenworth are 75 to 79 Years (29 | 19.1%) for men and 65 to 69 Years (58 | 33.0%) for women.
| Age Bracket | Male | Female |
| Under 5 Years | 10 (6.6%) | 2 (1.1%) |
| 5 to 9 Years | 0 (0.0%) | 10 (5.7%) |
| 10 to 14 Years | 2 (1.3%) | 7 (4.0%) |
| 15 to 19 Years | 6 (4.0%) | 9 (5.1%) |
| 20 to 24 Years | 25 (16.5%) | 6 (3.4%) |
| 25 to 29 Years | 0 (0.0%) | 6 (3.4%) |
| 30 to 34 Years | 0 (0.0%) | 3 (1.7%) |
| 35 to 39 Years | 11 (7.2%) | 3 (1.7%) |
| 40 to 44 Years | 11 (7.2%) | 5 (2.8%) |
| 45 to 49 Years | 3 (2.0%) | 8 (4.5%) |
| 50 to 54 Years | 5 (3.3%) | 9 (5.1%) |
| 55 to 59 Years | 6 (4.0%) | 3 (1.7%) |
| 60 to 64 Years | 5 (3.3%) | 12 (6.8%) |
| 65 to 69 Years | 14 (9.2%) | 58 (33.0%) |
| 70 to 74 Years | 8 (5.3%) | 12 (6.8%) |
| 75 to 79 Years | 29 (19.1%) | 9 (5.1%) |
| 80 to 84 Years | 7 (4.6%) | 0 (0.0%) |
| 85 Years and over | 10 (6.6%) | 14 (8.0%) |
| Total | 152 (100.0%) | 176 (100.0%) |
Families and Households in Leavenworth
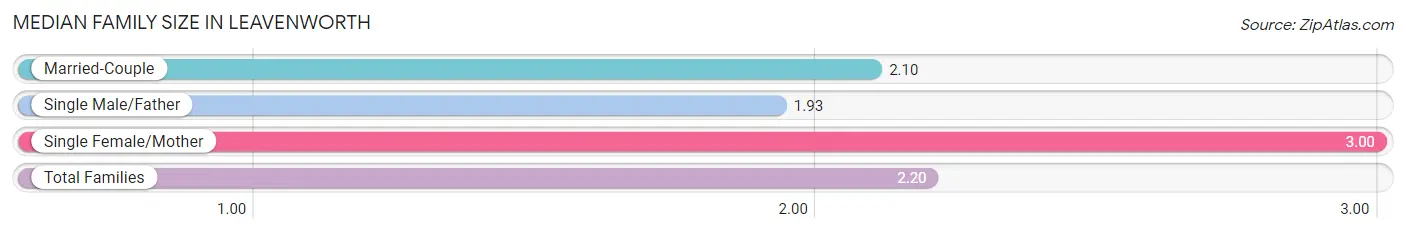
Median Family Size in Leavenworth
The median family size in Leavenworth is 2.20 persons per family, with single female/mother families (13 | 13.4%) accounting for the largest median family size of 3 persons per family. On the other hand, single male/father families (14 | 14.4%) represent the smallest median family size with 1.93 persons per family.
| Family Type | # Families | Family Size |
| Married-Couple | 70 (72.2%) | 2.10 |
| Single Male/Father | 14 (14.4%) | 1.93 |
| Single Female/Mother | 13 (13.4%) | 3.00 |
| Total Families | 97 (100.0%) | 2.20 |
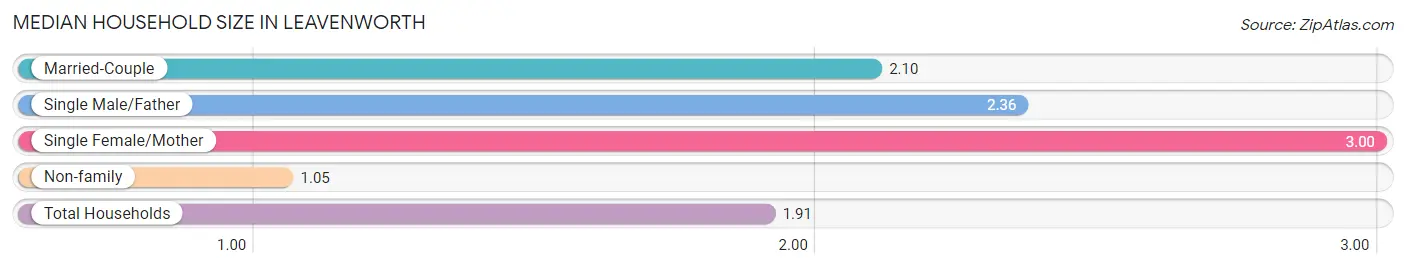
Median Household Size in Leavenworth
The median household size in Leavenworth is 1.91 persons per household, with single female/mother households (13 | 9.5%) accounting for the largest median household size of 3 persons per household. non-family households (40 | 29.2%) represent the smallest median household size with 1.05 persons per household.
| Household Type | # Households | Household Size |
| Married-Couple | 70 (51.1%) | 2.10 |
| Single Male/Father | 14 (10.2%) | 2.36 |
| Single Female/Mother | 13 (9.5%) | 3.00 |
| Non-family | 40 (29.2%) | 1.05 |
| Total Households | 137 (100.0%) | 1.91 |
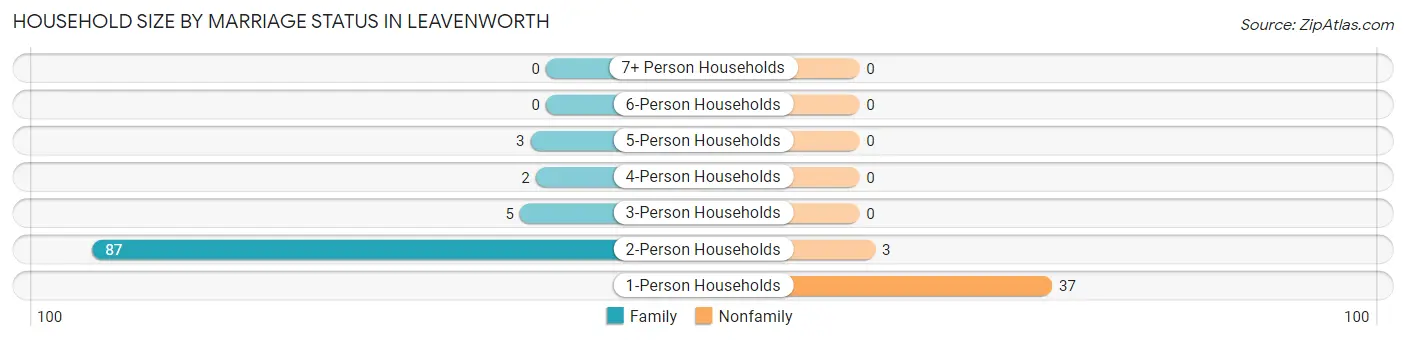
Household Size by Marriage Status in Leavenworth
Out of a total of 137 households in Leavenworth, 97 (70.8%) are family households, while 40 (29.2%) are nonfamily households. The most numerous type of family households are 2-person households, comprising 87, and the most common type of nonfamily households are 1-person households, comprising 37.
| Household Size | Family Households | Nonfamily Households |
| 1-Person Households | - | 37 (27.0%) |
| 2-Person Households | 87 (63.5%) | 3 (2.2%) |
| 3-Person Households | 5 (3.6%) | 0 (0.0%) |
| 4-Person Households | 2 (1.5%) | 0 (0.0%) |
| 5-Person Households | 3 (2.2%) | 0 (0.0%) |
| 6-Person Households | 0 (0.0%) | 0 (0.0%) |
| 7+ Person Households | 0 (0.0%) | 0 (0.0%) |
| Total | 97 (70.8%) | 40 (29.2%) |
Female Fertility in Leavenworth
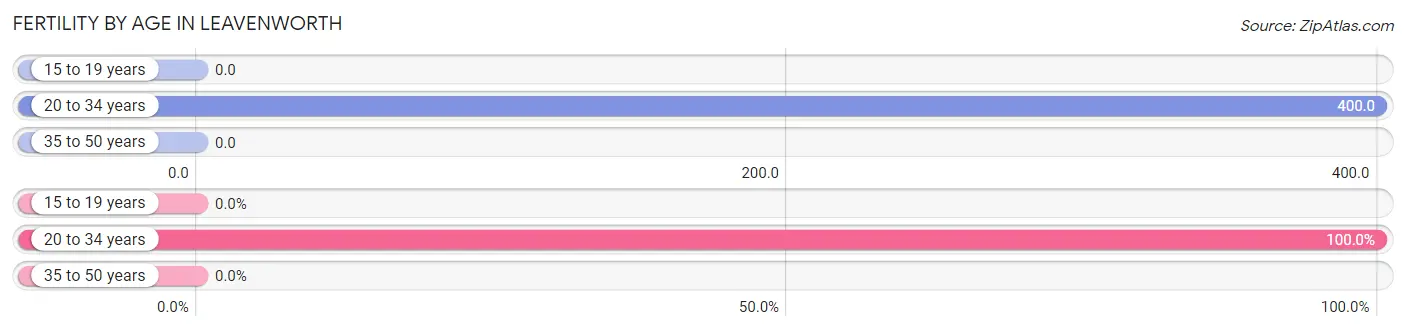
Fertility by Age in Leavenworth
Average fertility rate in Leavenworth is 150.0 births per 1,000 women. Women in the age bracket of 20 to 34 years have the highest fertility rate with 400.0 births per 1,000 women. Women in the age bracket of 20 to 34 years acount for 100.0% of all women with births.
| Age Bracket | Women with Births | Births / 1,000 Women |
| 15 to 19 years | 0 (0.0%) | 0.0 |
| 20 to 34 years | 6 (100.0%) | 400.0 |
| 35 to 50 years | 0 (0.0%) | 0.0 |
| Total | 6 (100.0%) | 150.0 |
Fertility by Age by Marriage Status in Leavenworth
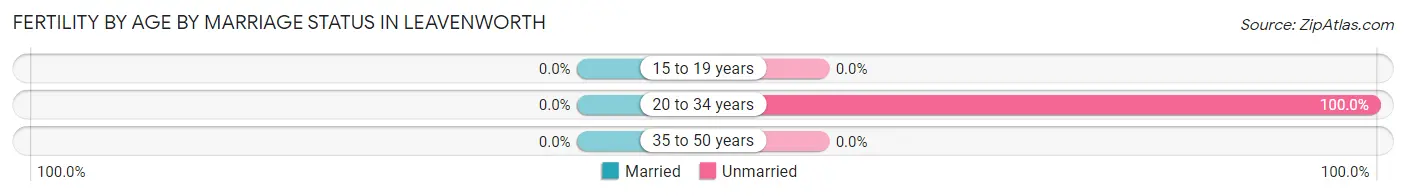
| Age Bracket | Married | Unmarried |
| 15 to 19 years | 0 (0.0%) | 0 (0.0%) |
| 20 to 34 years | 0 (0.0%) | 6 (100.0%) |
| 35 to 50 years | 0 (0.0%) | 0 (0.0%) |
| Total | 0 (0.0%) | 6 (100.0%) |
Fertility by Education in Leavenworth
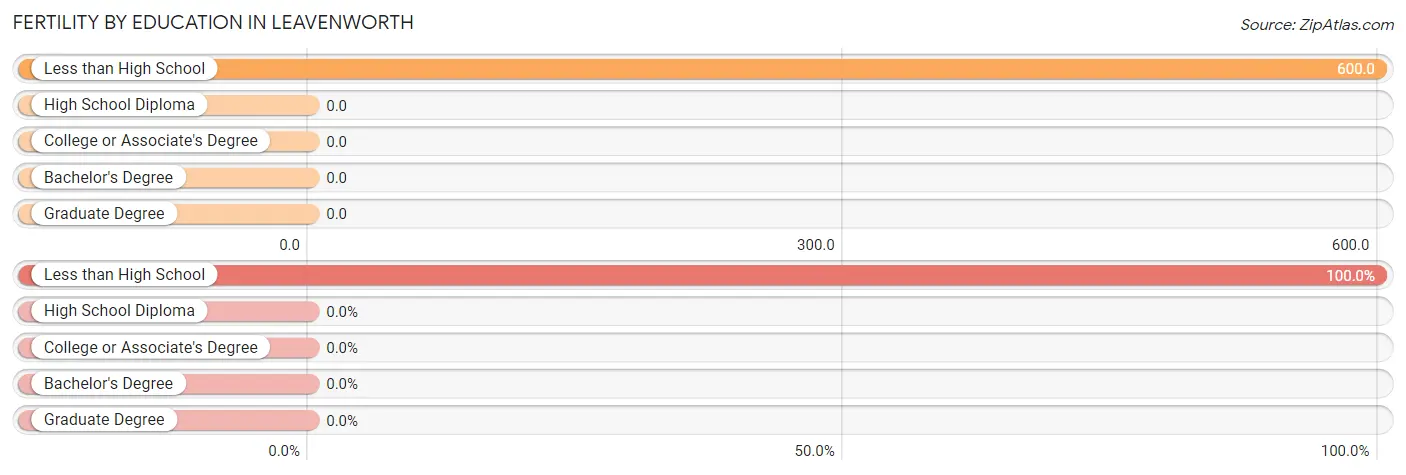
| Educational Attainment | Women with Births | Births / 1,000 Women |
| Less than High School | 6 (100.0%) | 600.0 |
| High School Diploma | 0 (0.0%) | 0.0 |
| College or Associate's Degree | 0 (0.0%) | 0.0 |
| Bachelor's Degree | 0 (0.0%) | 0.0 |
| Graduate Degree | 0 (0.0%) | 0.0 |
| Total | 6 (100.0%) | 150.0 |
Fertility by Education by Marriage Status in Leavenworth
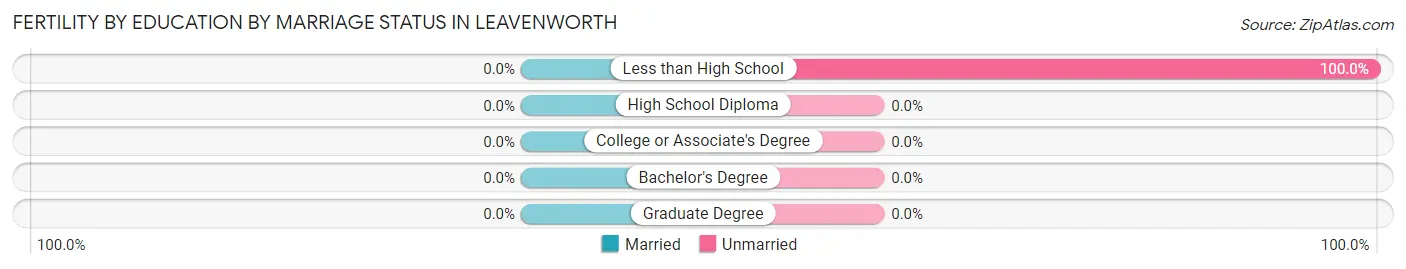
| Educational Attainment | Married | Unmarried |
| Less than High School | 0 (0.0%) | 6 (100.0%) |
| High School Diploma | 0 (0.0%) | 0 (0.0%) |
| College or Associate's Degree | 0 (0.0%) | 0 (0.0%) |
| Bachelor's Degree | 0 (0.0%) | 0 (0.0%) |
| Graduate Degree | 0 (0.0%) | 0 (0.0%) |
| Total | 0 (0.0%) | 6 (100.0%) |
Income in Leavenworth
Income Overview in Leavenworth
Per Capita Income in Leavenworth is $20,925, while median incomes of families and households are $54,943 and $53,385 respectively.
| Characteristic | Number | Measure |
| Per Capita Income | 328 | $20,925 |
| Median Family Income | 97 | $54,943 |
| Mean Family Income | 97 | $59,354 |
| Median Household Income | 137 | $53,385 |
| Mean Household Income | 137 | $52,404 |
| Income Deficit | 97 | $10,390 |
| Wage / Income Gap (%) | 328 | 5.46% |
| Wage / Income Gap ($) | 328 | 94.54¢ per $1 |
| Gini / Inequality Index | 328 | 0.35 |
Earnings by Sex in Leavenworth
Average Earnings in Leavenworth are $26,029, $24,712 for men and $26,140 for women, a difference of 5.5%.
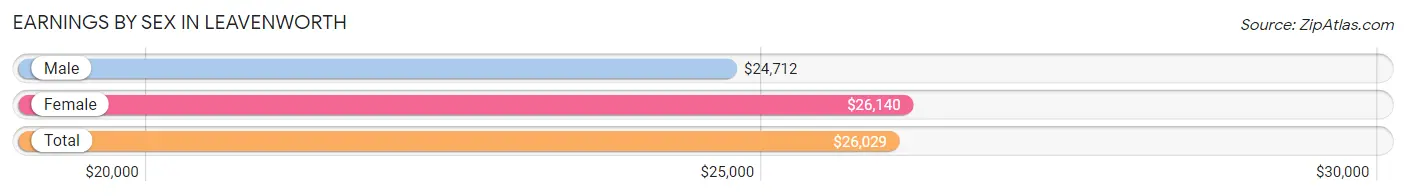
| Sex | Number | Average Earnings |
| Male | 49 (40.2%) | $24,712 |
| Female | 73 (59.8%) | $26,140 |
| Total | 122 (100.0%) | $26,029 |
Earnings by Sex by Income Bracket in Leavenworth
The most common earnings brackets in Leavenworth are $35,000 to $39,999 for men (15 | 30.6%) and $25,000 to $29,999 for women (34 | 46.6%).
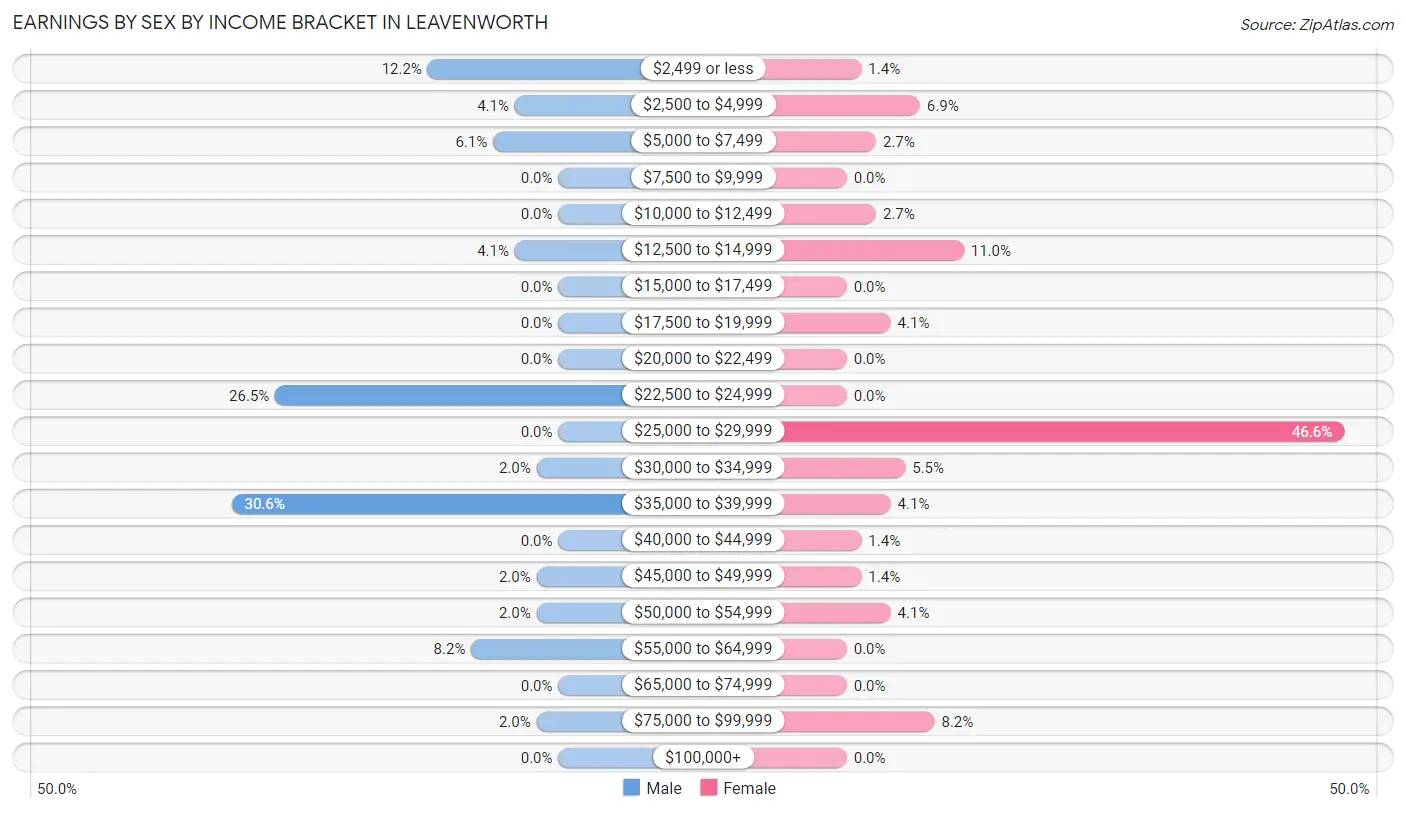
| Income | Male | Female |
| $2,499 or less | 6 (12.2%) | 1 (1.4%) |
| $2,500 to $4,999 | 2 (4.1%) | 5 (6.9%) |
| $5,000 to $7,499 | 3 (6.1%) | 2 (2.7%) |
| $7,500 to $9,999 | 0 (0.0%) | 0 (0.0%) |
| $10,000 to $12,499 | 0 (0.0%) | 2 (2.7%) |
| $12,500 to $14,999 | 2 (4.1%) | 8 (11.0%) |
| $15,000 to $17,499 | 0 (0.0%) | 0 (0.0%) |
| $17,500 to $19,999 | 0 (0.0%) | 3 (4.1%) |
| $20,000 to $22,499 | 0 (0.0%) | 0 (0.0%) |
| $22,500 to $24,999 | 13 (26.5%) | 0 (0.0%) |
| $25,000 to $29,999 | 0 (0.0%) | 34 (46.6%) |
| $30,000 to $34,999 | 1 (2.0%) | 4 (5.5%) |
| $35,000 to $39,999 | 15 (30.6%) | 3 (4.1%) |
| $40,000 to $44,999 | 0 (0.0%) | 1 (1.4%) |
| $45,000 to $49,999 | 1 (2.0%) | 1 (1.4%) |
| $50,000 to $54,999 | 1 (2.0%) | 3 (4.1%) |
| $55,000 to $64,999 | 4 (8.2%) | 0 (0.0%) |
| $65,000 to $74,999 | 0 (0.0%) | 0 (0.0%) |
| $75,000 to $99,999 | 1 (2.0%) | 6 (8.2%) |
| $100,000+ | 0 (0.0%) | 0 (0.0%) |
| Total | 49 (100.0%) | 73 (100.0%) |
Earnings by Sex by Educational Attainment in Leavenworth
Average earnings in Leavenworth are $23,854 for men and $26,544 for women, a difference of 10.1%. Men with an educational attainment of high school diploma enjoy the highest average annual earnings of $23,958, while those with high school diploma education earn the least with $23,958. Women with an educational attainment of high school diploma earn the most with the average annual earnings of $26,434, while those with high school diploma education have the smallest earnings of $26,434.
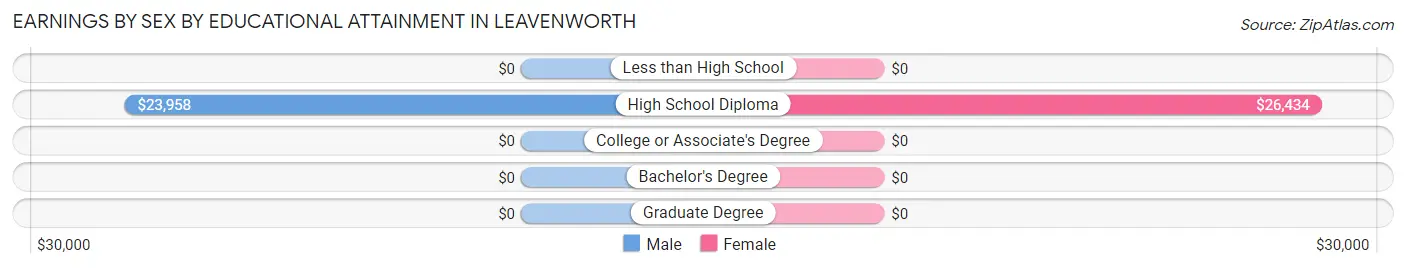
| Educational Attainment | Male Income | Female Income |
| Less than High School | - | - |
| High School Diploma | $23,958 | $26,434 |
| College or Associate's Degree | - | - |
| Bachelor's Degree | - | - |
| Graduate Degree | - | - |
| Total | $23,854 | $26,544 |
Family Income in Leavenworth
Family Income Brackets in Leavenworth
According to the Leavenworth family income data, there are 50 families falling into the $50,000 to $74,999 income range, which is the most common income bracket and makes up 51.5% of all families.
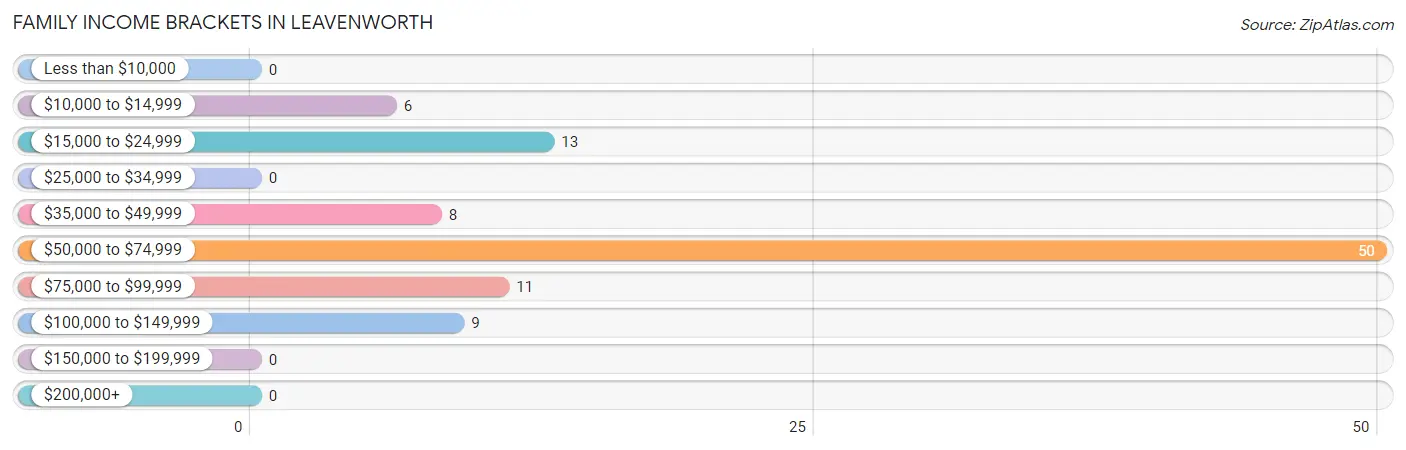
| Income Bracket | # Families | % Families |
| Less than $10,000 | 0 | 0.0% |
| $10,000 to $14,999 | 6 | 6.2% |
| $15,000 to $24,999 | 13 | 13.4% |
| $25,000 to $34,999 | 0 | 0.0% |
| $35,000 to $49,999 | 8 | 8.2% |
| $50,000 to $74,999 | 50 | 51.5% |
| $75,000 to $99,999 | 11 | 11.3% |
| $100,000 to $149,999 | 9 | 9.3% |
| $150,000 to $199,999 | 0 | 0.0% |
| $200,000+ | 0 | 0.0% |
Family Income by Famaliy Size in Leavenworth
2-person families (90 | 92.8%) account for the highest median family income in Leavenworth with $58,750 per family, while 2-person families (90 | 92.8%) have the highest median income of $29,375 per family member.
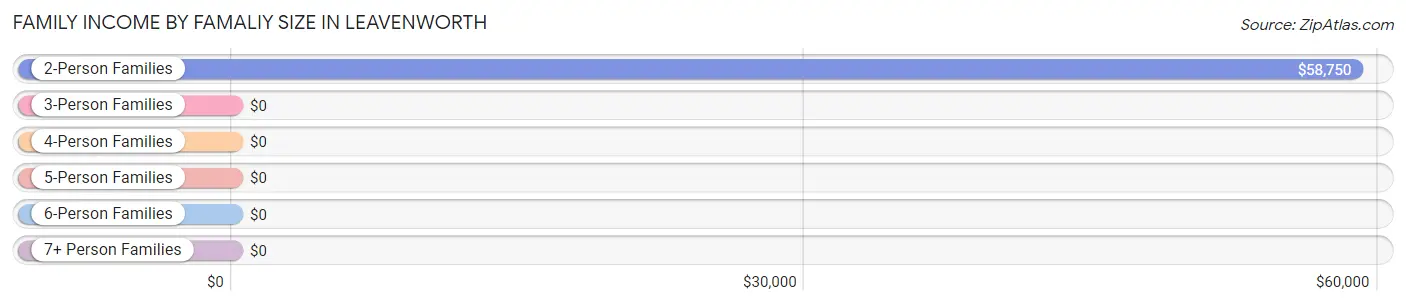
| Income Bracket | # Families | Median Income |
| 2-Person Families | 90 (92.8%) | $58,750 |
| 3-Person Families | 2 (2.1%) | $0 |
| 4-Person Families | 2 (2.1%) | $0 |
| 5-Person Families | 3 (3.1%) | $0 |
| 6-Person Families | 0 (0.0%) | $0 |
| 7+ Person Families | 0 (0.0%) | $0 |
| Total | 97 (100.0%) | $54,943 |
Family Income by Number of Earners in Leavenworth
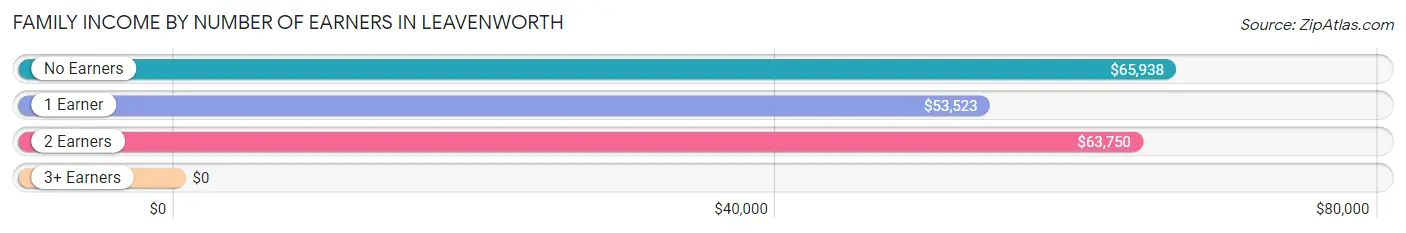
| Number of Earners | # Families | Median Income |
| No Earners | 27 (27.8%) | $65,938 |
| 1 Earner | 48 (49.5%) | $53,523 |
| 2 Earners | 21 (21.6%) | $63,750 |
| 3+ Earners | 1 (1.0%) | $0 |
| Total | 97 (100.0%) | $54,943 |
Household Income in Leavenworth
Household Income Brackets in Leavenworth
With 52 households falling in the category, the $50,000 to $74,999 income range is the most frequent in Leavenworth, accounting for 38.0% of all households.
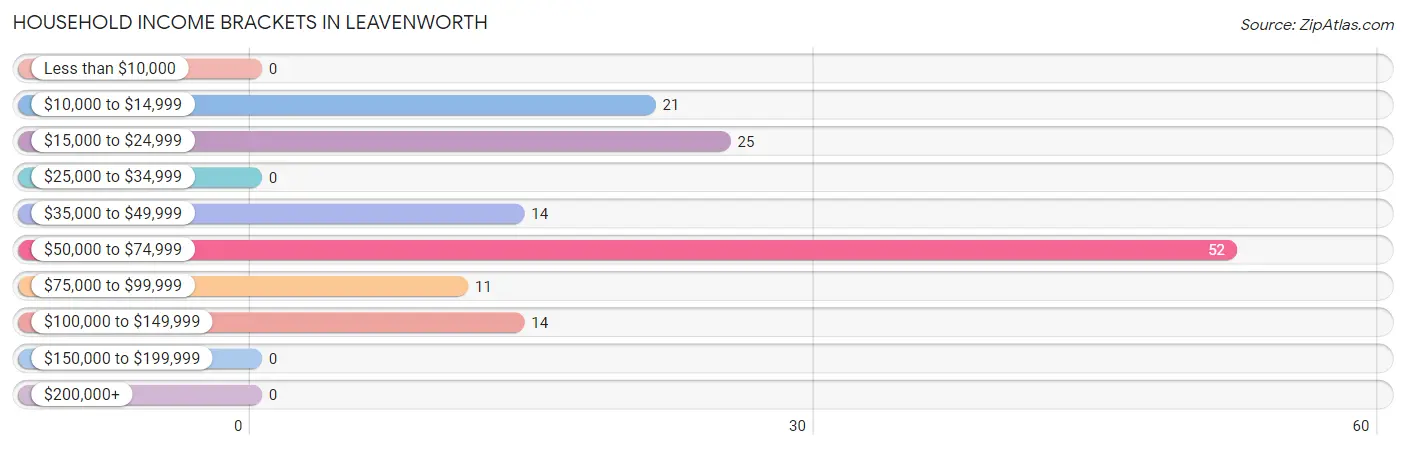
| Income Bracket | # Households | % Households |
| Less than $10,000 | 0 | 0.0% |
| $10,000 to $14,999 | 21 | 15.3% |
| $15,000 to $24,999 | 25 | 18.2% |
| $25,000 to $34,999 | 0 | 0.0% |
| $35,000 to $49,999 | 14 | 10.2% |
| $50,000 to $74,999 | 52 | 38.0% |
| $75,000 to $99,999 | 11 | 8.0% |
| $100,000 to $149,999 | 14 | 10.2% |
| $150,000 to $199,999 | 0 | 0.0% |
| $200,000+ | 0 | 0.0% |
Household Income by Householder Age in Leavenworth
The median household income in Leavenworth is $53,385, with the highest median household income of $53,958 found in the 65+ years age bracket for the primary householder. A total of 60 households (43.8%) fall into this category. Meanwhile, the 15 to 24 years age bracket for the primary householder has the lowest median household income of $0, with 32 households (23.4%) in this group.
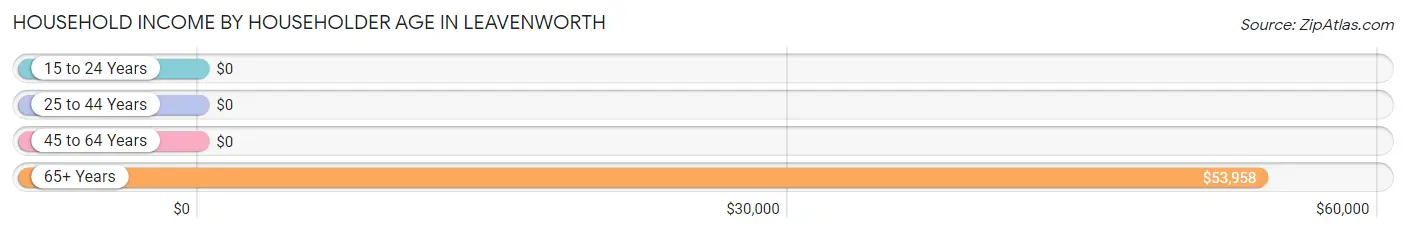
| Income Bracket | # Households | Median Income |
| 15 to 24 Years | 32 (23.4%) | $0 |
| 25 to 44 Years | 13 (9.5%) | $0 |
| 45 to 64 Years | 32 (23.4%) | $0 |
| 65+ Years | 60 (43.8%) | $53,958 |
| Total | 137 (100.0%) | $53,385 |
Poverty in Leavenworth
Income Below Poverty by Sex and Age in Leavenworth
With 12.3% poverty level for males and 26.6% for females among the residents of Leavenworth, 12 to 14 year old males and under 5 year old females are the most vulnerable to poverty, with 2 males (100.0%) and 2 females (100.0%) in their respective age groups living below the poverty level.
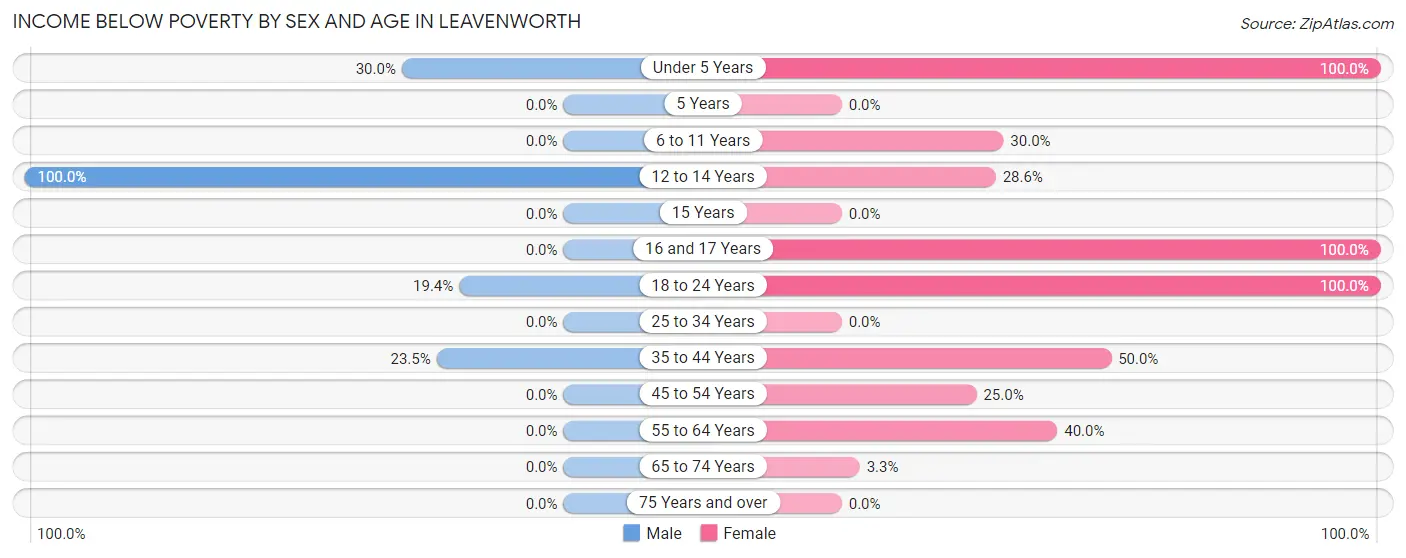
| Age Bracket | Male | Female |
| Under 5 Years | 3 (30.0%) | 2 (100.0%) |
| 5 Years | 0 (0.0%) | 0 (0.0%) |
| 6 to 11 Years | 0 (0.0%) | 3 (30.0%) |
| 12 to 14 Years | 2 (100.0%) | 2 (28.6%) |
| 15 Years | 0 (0.0%) | 0 (0.0%) |
| 16 and 17 Years | 0 (0.0%) | 2 (100.0%) |
| 18 to 24 Years | 6 (19.4%) | 13 (100.0%) |
| 25 to 34 Years | 0 (0.0%) | 0 (0.0%) |
| 35 to 44 Years | 4 (23.5%) | 4 (50.0%) |
| 45 to 54 Years | 0 (0.0%) | 3 (25.0%) |
| 55 to 64 Years | 0 (0.0%) | 6 (40.0%) |
| 65 to 74 Years | 0 (0.0%) | 2 (3.3%) |
| 75 Years and over | 0 (0.0%) | 0 (0.0%) |
| Total | 15 (12.3%) | 37 (26.6%) |
Income Above Poverty by Sex and Age in Leavenworth
According to the poverty statistics in Leavenworth, males aged 45 to 54 years and females aged 25 to 34 years are the age groups that are most secure financially, with 100.0% of males and 100.0% of females in these age groups living above the poverty line.
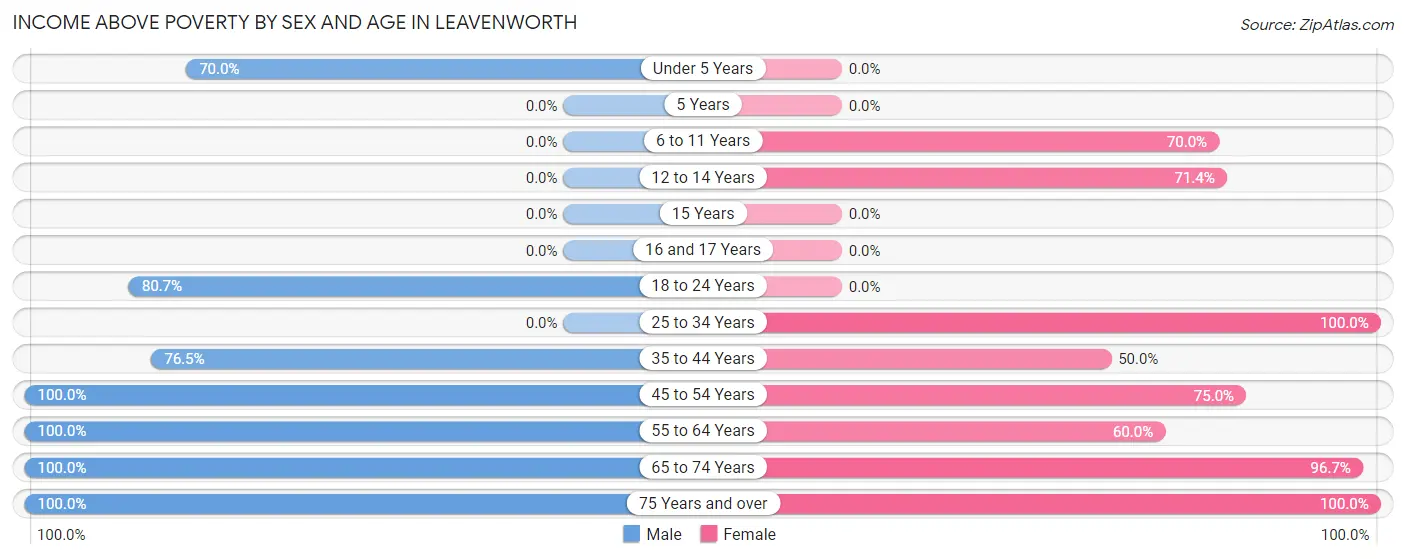
| Age Bracket | Male | Female |
| Under 5 Years | 7 (70.0%) | 0 (0.0%) |
| 5 Years | 0 (0.0%) | 0 (0.0%) |
| 6 to 11 Years | 0 (0.0%) | 7 (70.0%) |
| 12 to 14 Years | 0 (0.0%) | 5 (71.4%) |
| 15 Years | 0 (0.0%) | 0 (0.0%) |
| 16 and 17 Years | 0 (0.0%) | 0 (0.0%) |
| 18 to 24 Years | 25 (80.6%) | 0 (0.0%) |
| 25 to 34 Years | 0 (0.0%) | 9 (100.0%) |
| 35 to 44 Years | 13 (76.5%) | 4 (50.0%) |
| 45 to 54 Years | 8 (100.0%) | 9 (75.0%) |
| 55 to 64 Years | 11 (100.0%) | 9 (60.0%) |
| 65 to 74 Years | 12 (100.0%) | 58 (96.7%) |
| 75 Years and over | 31 (100.0%) | 1 (100.0%) |
| Total | 107 (87.7%) | 102 (73.4%) |
Income Below Poverty Among Married-Couple Families in Leavenworth
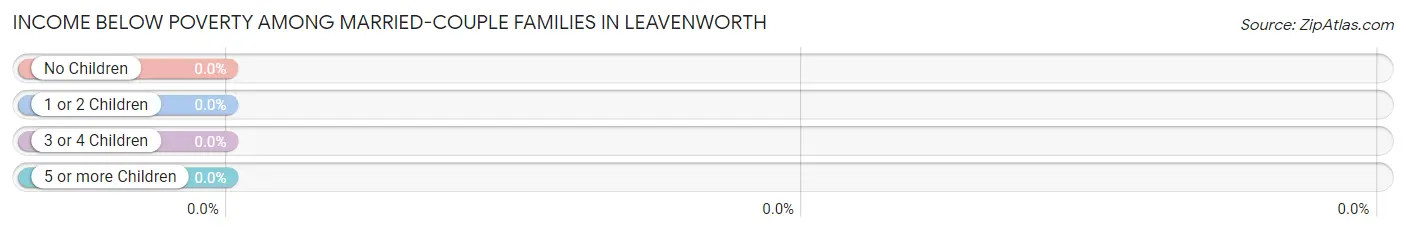
| Children | Above Poverty | Below Poverty |
| No Children | 69 (100.0%) | 0 (0.0%) |
| 1 or 2 Children | 0 (0.0%) | 0 (0.0%) |
| 3 or 4 Children | 1 (100.0%) | 0 (0.0%) |
| 5 or more Children | 0 (0.0%) | 0 (0.0%) |
| Total | 70 (100.0%) | 0 (0.0%) |
Income Below Poverty Among Single-Parent Households in Leavenworth
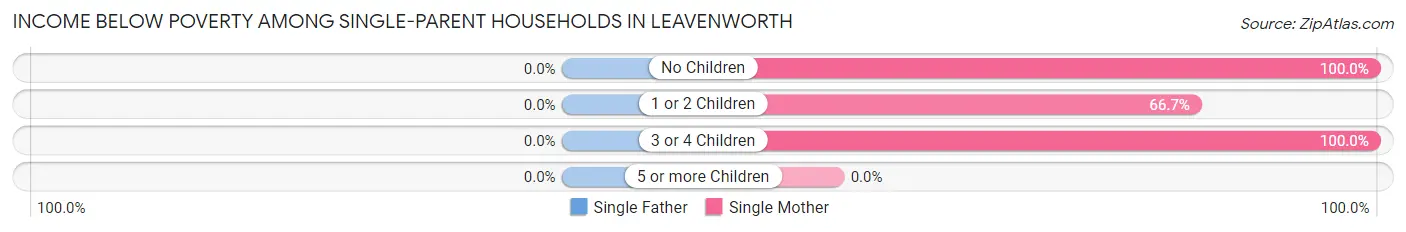
| Children | Single Father | Single Mother |
| No Children | 0 (0.0%) | 2 (100.0%) |
| 1 or 2 Children | 0 (0.0%) | 6 (66.7%) |
| 3 or 4 Children | 0 (0.0%) | 2 (100.0%) |
| 5 or more Children | 0 (0.0%) | 0 (0.0%) |
| Total | 0 (0.0%) | 10 (76.9%) |
Income Below Poverty Among Married-Couple vs Single-Parent Households in Leavenworth
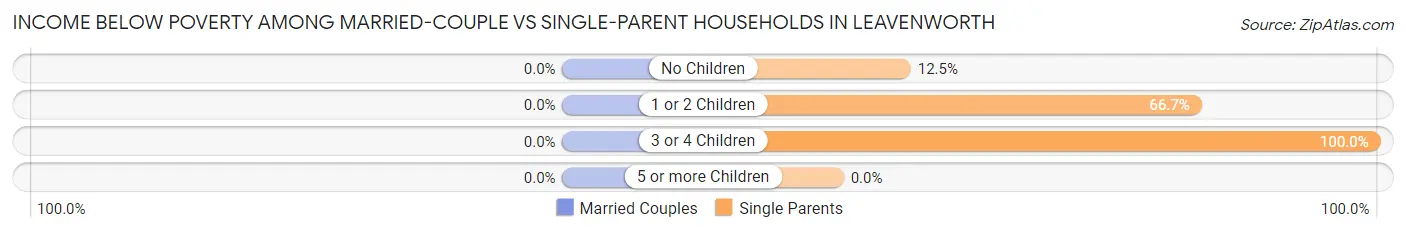
| Children | Married-Couple Families | Single-Parent Households |
| No Children | 0 (0.0%) | 2 (12.5%) |
| 1 or 2 Children | 0 (0.0%) | 6 (66.7%) |
| 3 or 4 Children | 0 (0.0%) | 2 (100.0%) |
| 5 or more Children | 0 (0.0%) | 0 (0.0%) |
| Total | 0 (0.0%) | 10 (37.0%) |
Employment Characteristics in Leavenworth
Employment by Class of Employer in Leavenworth
Among the 93 employed individuals in Leavenworth, private company employees (85 | 91.4%), local government employees (3 | 3.2%), and self-employed (not incorporated) (2 | 2.1%) make up the most common classes of employment.
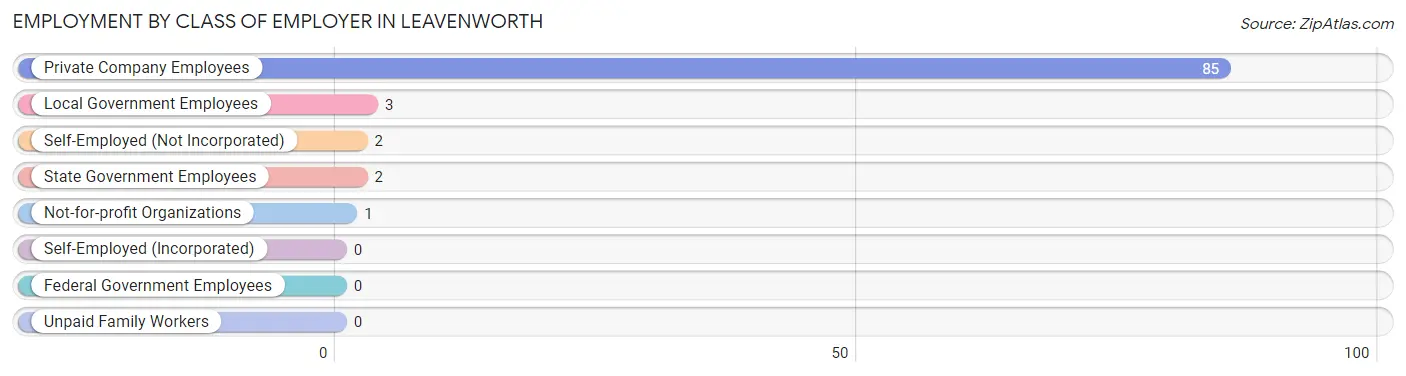
| Employer Class | # Employees | % Employees |
| Private Company Employees | 85 | 91.4% |
| Self-Employed (Incorporated) | 0 | 0.0% |
| Self-Employed (Not Incorporated) | 2 | 2.1% |
| Not-for-profit Organizations | 1 | 1.1% |
| Local Government Employees | 3 | 3.2% |
| State Government Employees | 2 | 2.1% |
| Federal Government Employees | 0 | 0.0% |
| Unpaid Family Workers | 0 | 0.0% |
| Total | 93 | 100.0% |
Employment Status by Age in Leavenworth
According to the labor force statistics for Leavenworth, out of the total population over 16 years of age (297), 42.8% or 127 individuals are in the labor force, with 25.2% or 32 of them unemployed. The age group with the highest labor force participation rate is 16 to 19 years, with 100.0% or 15 individuals in the labor force. Within the labor force, the 20 to 24 years age range has the highest percentage of unemployed individuals, with 96.3% or 26 of them being unemployed.
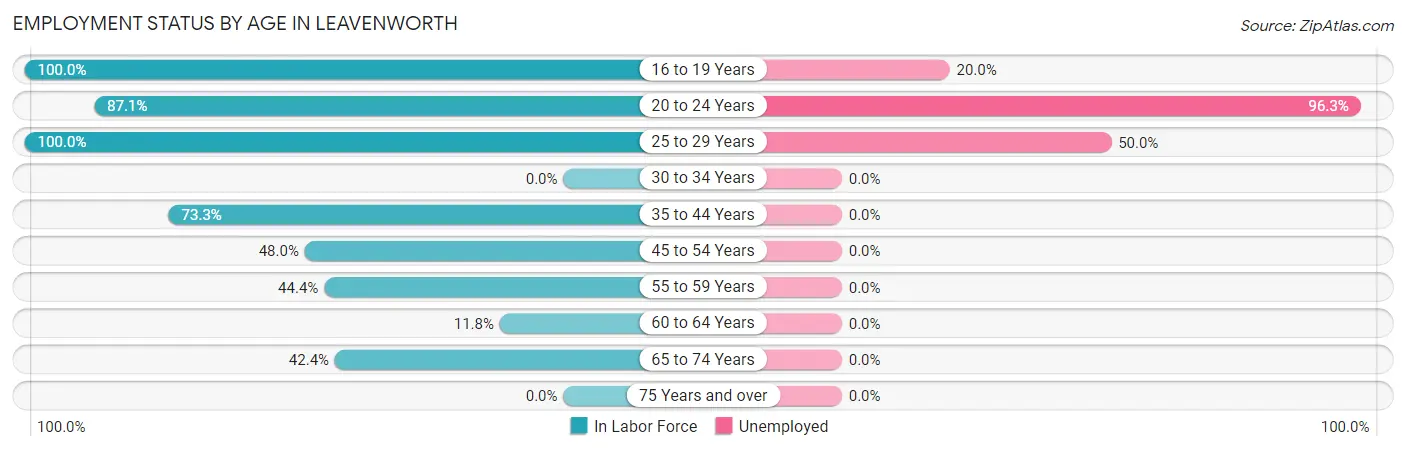
| Age Bracket | In Labor Force | Unemployed |
| 16 to 19 Years | 15 (100.0%) | 3 (20.0%) |
| 20 to 24 Years | 27 (87.1%) | 26 (96.3%) |
| 25 to 29 Years | 6 (100.0%) | 3 (50.0%) |
| 30 to 34 Years | 0 (0.0%) | 0 (0.0%) |
| 35 to 44 Years | 22 (73.3%) | 0 (0.0%) |
| 45 to 54 Years | 12 (48.0%) | 0 (0.0%) |
| 55 to 59 Years | 4 (44.4%) | 0 (0.0%) |
| 60 to 64 Years | 2 (11.8%) | 0 (0.0%) |
| 65 to 74 Years | 39 (42.4%) | 0 (0.0%) |
| 75 Years and over | 0 (0.0%) | 0 (0.0%) |
| Total | 127 (42.8%) | 32 (25.2%) |
Employment Status by Educational Attainment in Leavenworth
According to labor force statistics for Leavenworth, 51.1% of individuals (46) out of the total population between 25 and 64 years of age (90) are in the labor force, with 6.5% or 3 of them being unemployed. The group with the highest labor force participation rate are those with the educational attainment of bachelor's degree or higher, with 71.4% or 5 individuals in the labor force. Within the labor force, individuals with college / associate degree education have the highest percentage of unemployment, with 25.0% or 3 of them being unemployed.
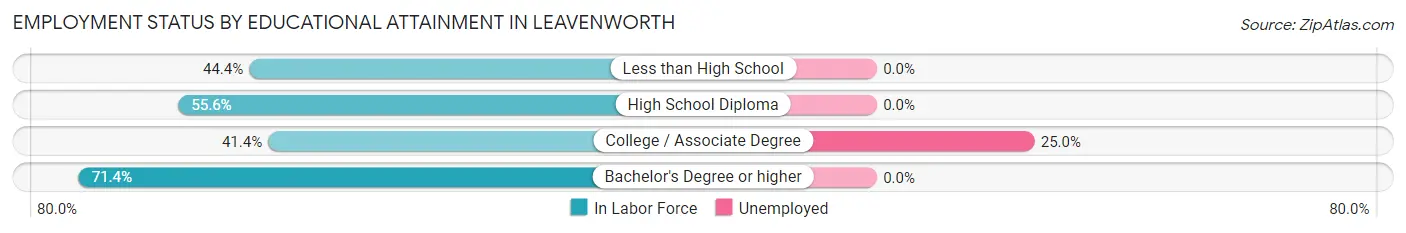
| Educational Attainment | In Labor Force | Unemployed |
| Less than High School | 4 (44.4%) | 0 (0.0%) |
| High School Diploma | 25 (55.6%) | 0 (0.0%) |
| College / Associate Degree | 12 (41.4%) | 7 (25.0%) |
| Bachelor's Degree or higher | 5 (71.4%) | 0 (0.0%) |
| Total | 46 (51.1%) | 6 (6.5%) |
Employment Occupations by Sex in Leavenworth
Management, Business, Science and Arts Occupations
The most common Management, Business, Science and Arts occupations in Leavenworth are Management (5 | 5.3%), Community & Social Service (4 | 4.2%), Education Instruction & Library (4 | 4.2%), Computers, Engineering & Science (1 | 1.1%), and Architecture & Engineering (1 | 1.1%).
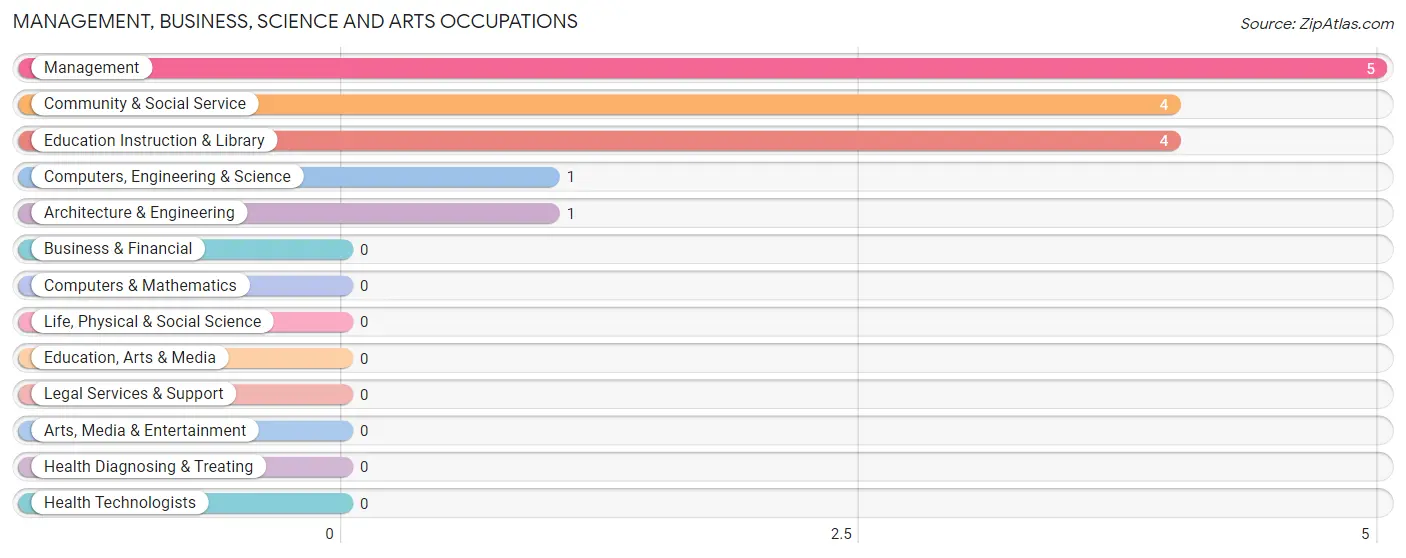
Management, Business, Science and Arts Occupations by Sex
Within the Management, Business, Science and Arts occupations in Leavenworth, the most male-oriented occupations are Computers, Engineering & Science (100.0%), and Architecture & Engineering (100.0%), while the most female-oriented occupations are Management (100.0%), Community & Social Service (100.0%), and Education Instruction & Library (100.0%).
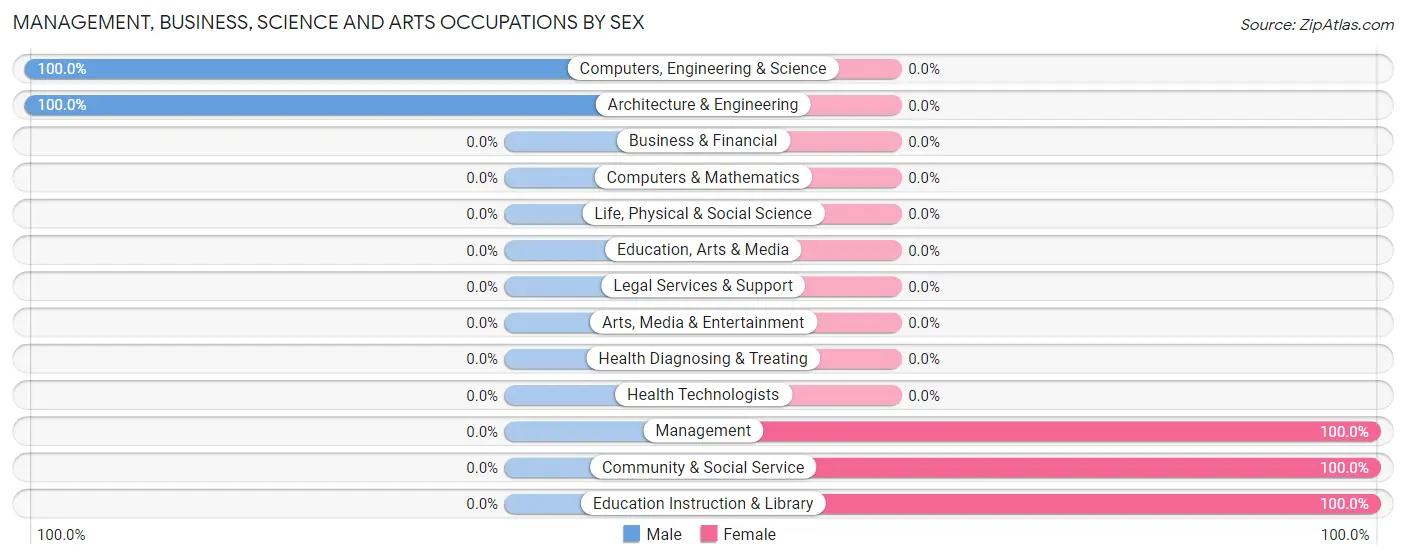
| Occupation | Male | Female |
| Management | 0 (0.0%) | 5 (100.0%) |
| Business & Financial | 0 (0.0%) | 0 (0.0%) |
| Computers, Engineering & Science | 1 (100.0%) | 0 (0.0%) |
| Computers & Mathematics | 0 (0.0%) | 0 (0.0%) |
| Architecture & Engineering | 1 (100.0%) | 0 (0.0%) |
| Life, Physical & Social Science | 0 (0.0%) | 0 (0.0%) |
| Community & Social Service | 0 (0.0%) | 4 (100.0%) |
| Education, Arts & Media | 0 (0.0%) | 0 (0.0%) |
| Legal Services & Support | 0 (0.0%) | 0 (0.0%) |
| Education Instruction & Library | 0 (0.0%) | 4 (100.0%) |
| Arts, Media & Entertainment | 0 (0.0%) | 0 (0.0%) |
| Health Diagnosing & Treating | 0 (0.0%) | 0 (0.0%) |
| Health Technologists | 0 (0.0%) | 0 (0.0%) |
| Total (Category) | 1 (10.0%) | 9 (90.0%) |
| Total (Overall) | 31 (32.6%) | 64 (67.4%) |
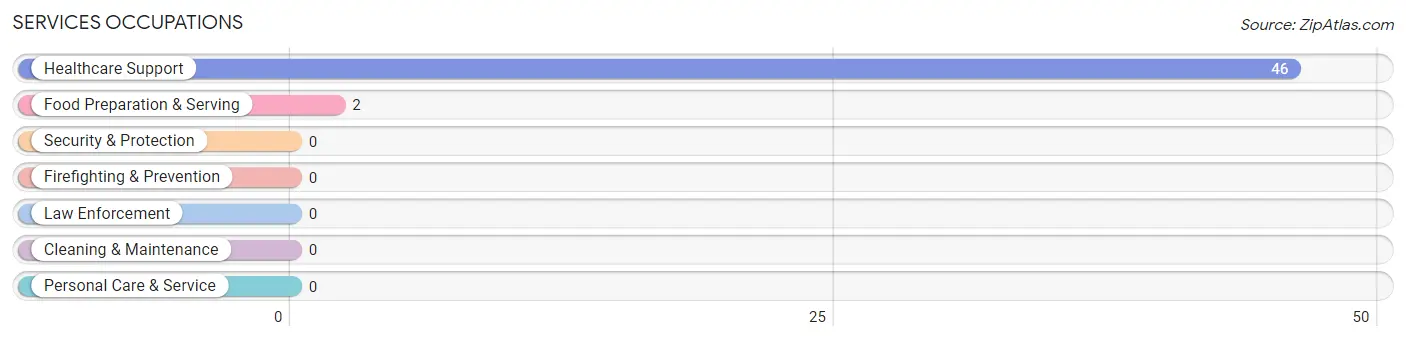
Services Occupations
The most common Services occupations in Leavenworth are Healthcare Support (46 | 48.4%), and Food Preparation & Serving (2 | 2.1%).
Services Occupations by Sex
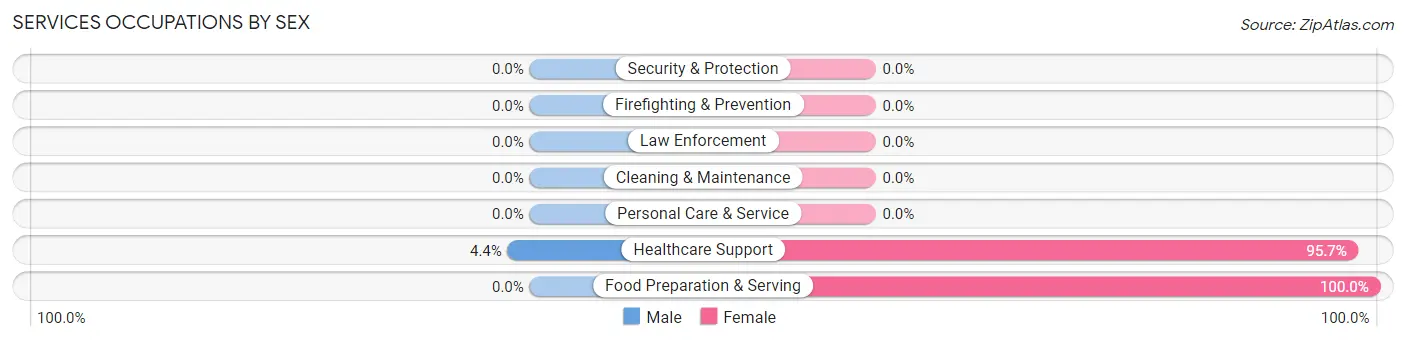
| Occupation | Male | Female |
| Healthcare Support | 2 (4.3%) | 44 (95.7%) |
| Security & Protection | 0 (0.0%) | 0 (0.0%) |
| Firefighting & Prevention | 0 (0.0%) | 0 (0.0%) |
| Law Enforcement | 0 (0.0%) | 0 (0.0%) |
| Food Preparation & Serving | 0 (0.0%) | 2 (100.0%) |
| Cleaning & Maintenance | 0 (0.0%) | 0 (0.0%) |
| Personal Care & Service | 0 (0.0%) | 0 (0.0%) |
| Total (Category) | 2 (4.2%) | 46 (95.8%) |
| Total (Overall) | 31 (32.6%) | 64 (67.4%) |
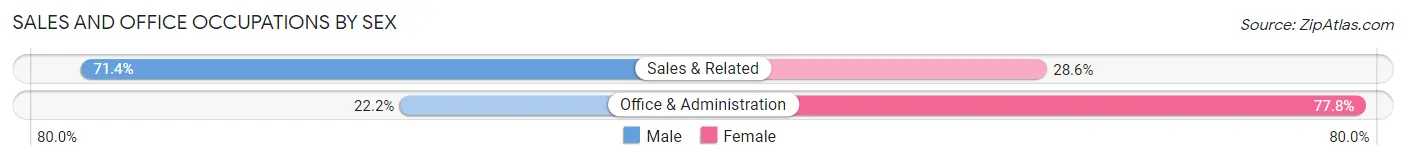
Sales and Office Occupations
The most common Sales and Office occupations in Leavenworth are Office & Administration (9 | 9.5%), and Sales & Related (7 | 7.4%).
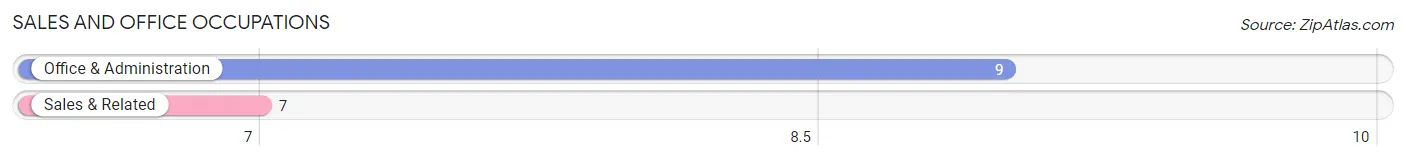
Sales and Office Occupations by Sex
| Occupation | Male | Female |
| Sales & Related | 5 (71.4%) | 2 (28.6%) |
| Office & Administration | 2 (22.2%) | 7 (77.8%) |
| Total (Category) | 7 (43.8%) | 9 (56.2%) |
| Total (Overall) | 31 (32.6%) | 64 (67.4%) |
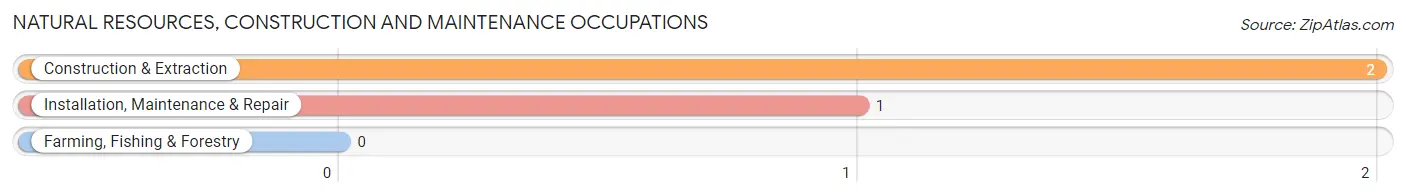
Natural Resources, Construction and Maintenance Occupations
The most common Natural Resources, Construction and Maintenance occupations in Leavenworth are Construction & Extraction (2 | 2.1%), and Installation, Maintenance & Repair (1 | 1.1%).
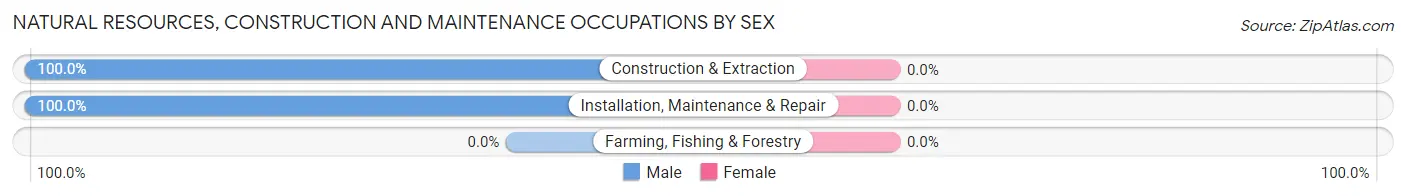
Natural Resources, Construction and Maintenance Occupations by Sex
| Occupation | Male | Female |
| Farming, Fishing & Forestry | 0 (0.0%) | 0 (0.0%) |
| Construction & Extraction | 2 (100.0%) | 0 (0.0%) |
| Installation, Maintenance & Repair | 1 (100.0%) | 0 (0.0%) |
| Total (Category) | 3 (100.0%) | 0 (0.0%) |
| Total (Overall) | 31 (32.6%) | 64 (67.4%) |
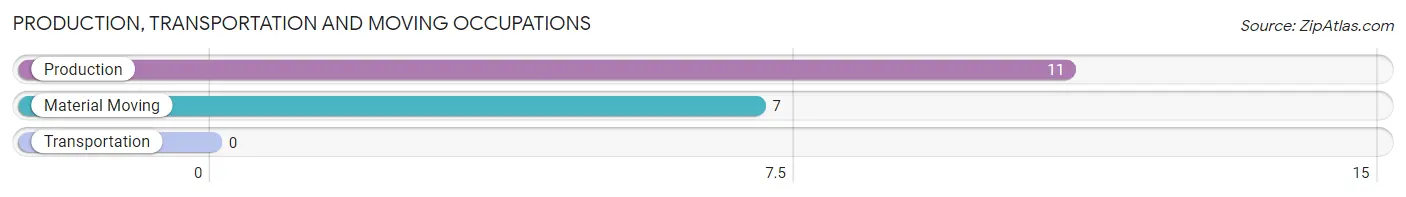
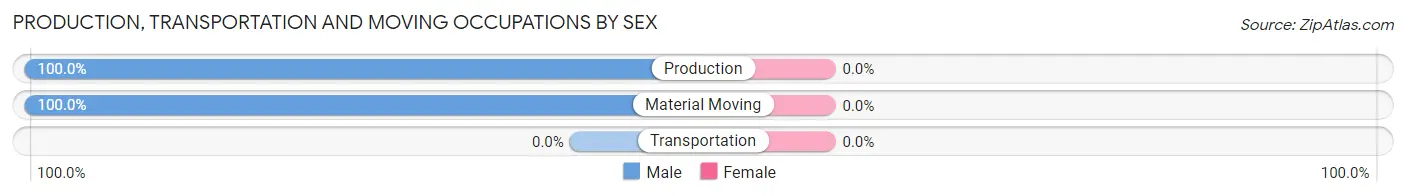
Production, Transportation and Moving Occupations
The most common Production, Transportation and Moving occupations in Leavenworth are Production (11 | 11.6%), and Material Moving (7 | 7.4%).
Production, Transportation and Moving Occupations by Sex
| Occupation | Male | Female |
| Production | 11 (100.0%) | 0 (0.0%) |
| Transportation | 0 (0.0%) | 0 (0.0%) |
| Material Moving | 7 (100.0%) | 0 (0.0%) |
| Total (Category) | 18 (100.0%) | 0 (0.0%) |
| Total (Overall) | 31 (32.6%) | 64 (67.4%) |
Employment Industries by Sex in Leavenworth
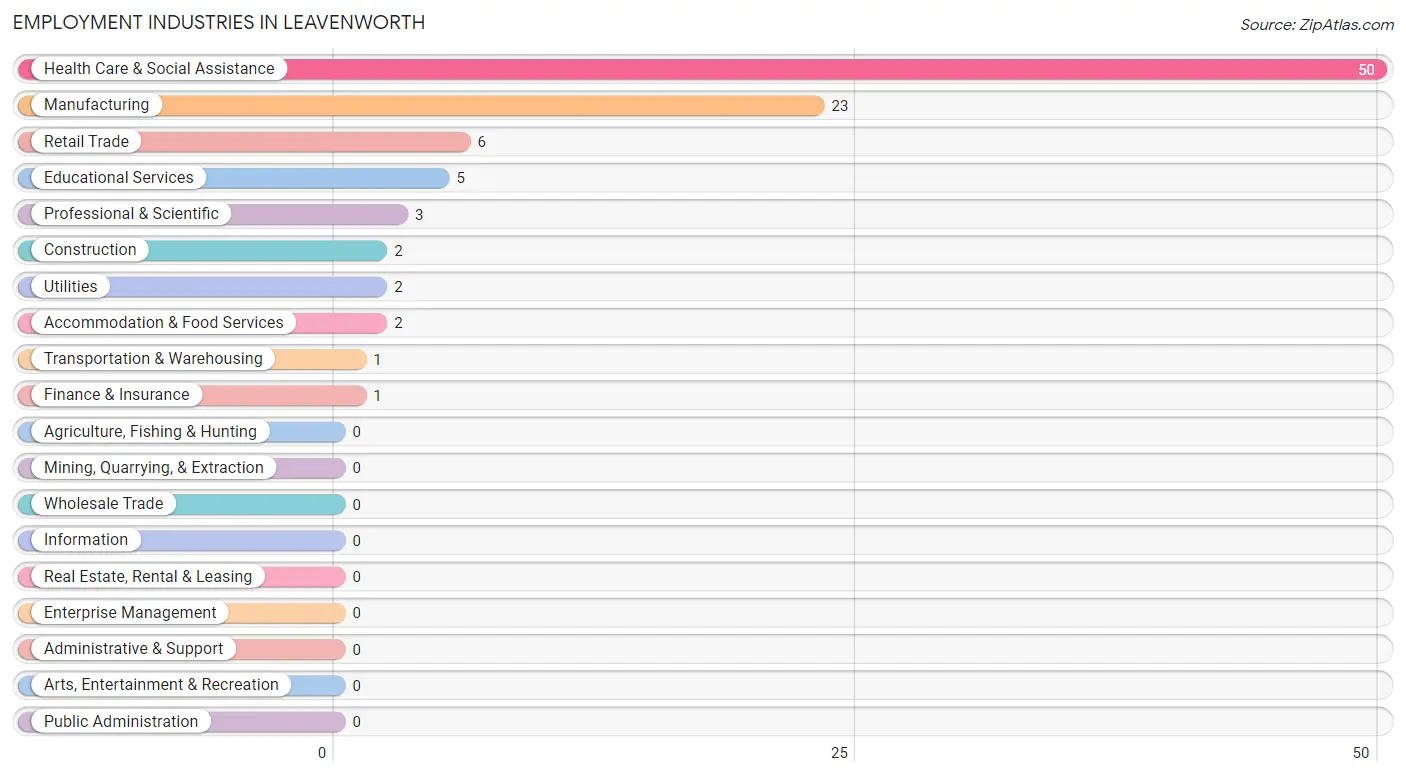
Employment Industries in Leavenworth
The major employment industries in Leavenworth include Health Care & Social Assistance (50 | 52.6%), Manufacturing (23 | 24.2%), Retail Trade (6 | 6.3%), Educational Services (5 | 5.3%), and Professional & Scientific (3 | 3.2%).
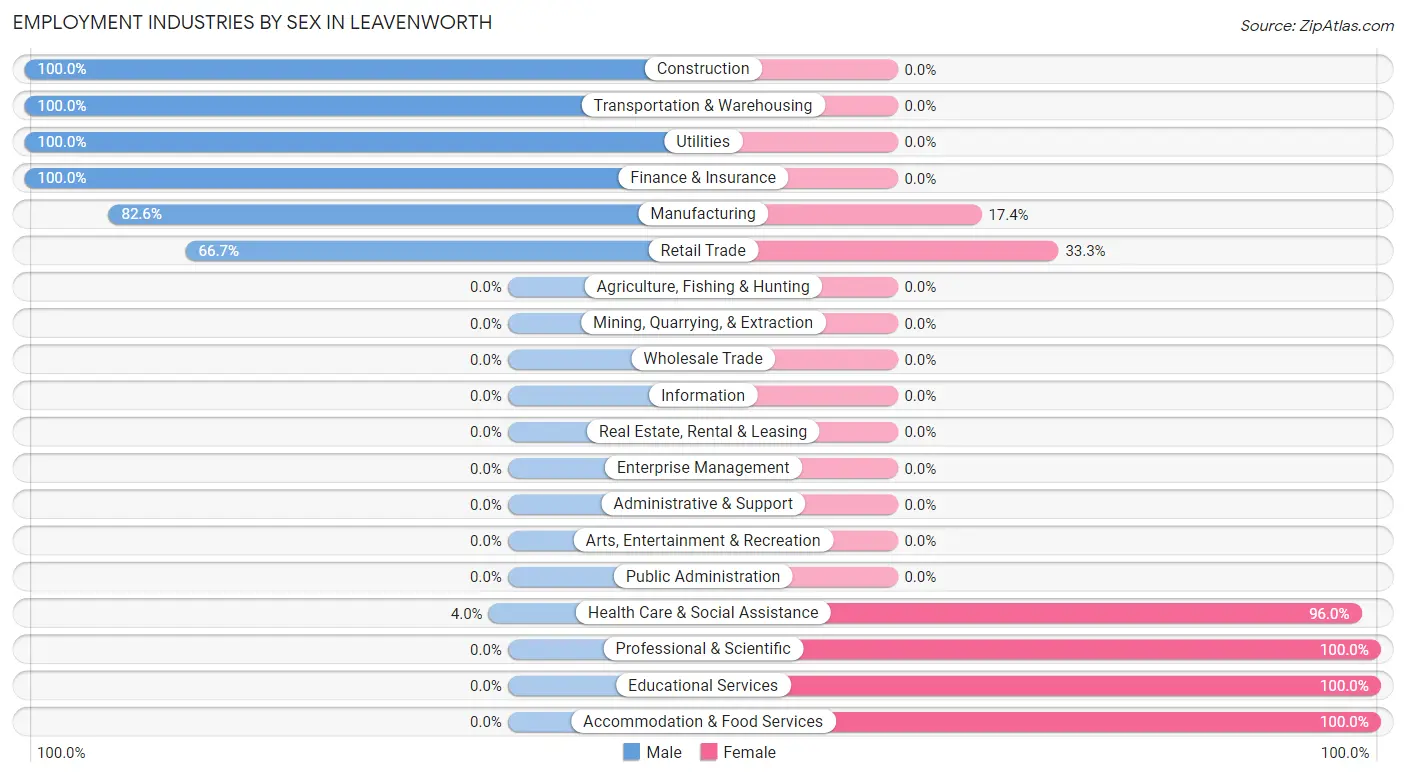
Employment Industries by Sex in Leavenworth
The Leavenworth industries that see more men than women are Construction (100.0%), Transportation & Warehousing (100.0%), and Utilities (100.0%), whereas the industries that tend to have a higher number of women are Professional & Scientific (100.0%), Educational Services (100.0%), and Accommodation & Food Services (100.0%).
| Industry | Male | Female |
| Agriculture, Fishing & Hunting | 0 (0.0%) | 0 (0.0%) |
| Mining, Quarrying, & Extraction | 0 (0.0%) | 0 (0.0%) |
| Construction | 2 (100.0%) | 0 (0.0%) |
| Manufacturing | 19 (82.6%) | 4 (17.4%) |
| Wholesale Trade | 0 (0.0%) | 0 (0.0%) |
| Retail Trade | 4 (66.7%) | 2 (33.3%) |
| Transportation & Warehousing | 1 (100.0%) | 0 (0.0%) |
| Utilities | 2 (100.0%) | 0 (0.0%) |
| Information | 0 (0.0%) | 0 (0.0%) |
| Finance & Insurance | 1 (100.0%) | 0 (0.0%) |
| Real Estate, Rental & Leasing | 0 (0.0%) | 0 (0.0%) |
| Professional & Scientific | 0 (0.0%) | 3 (100.0%) |
| Enterprise Management | 0 (0.0%) | 0 (0.0%) |
| Administrative & Support | 0 (0.0%) | 0 (0.0%) |
| Educational Services | 0 (0.0%) | 5 (100.0%) |
| Health Care & Social Assistance | 2 (4.0%) | 48 (96.0%) |
| Arts, Entertainment & Recreation | 0 (0.0%) | 0 (0.0%) |
| Accommodation & Food Services | 0 (0.0%) | 2 (100.0%) |
| Public Administration | 0 (0.0%) | 0 (0.0%) |
| Total | 31 (32.6%) | 64 (67.4%) |
Education in Leavenworth
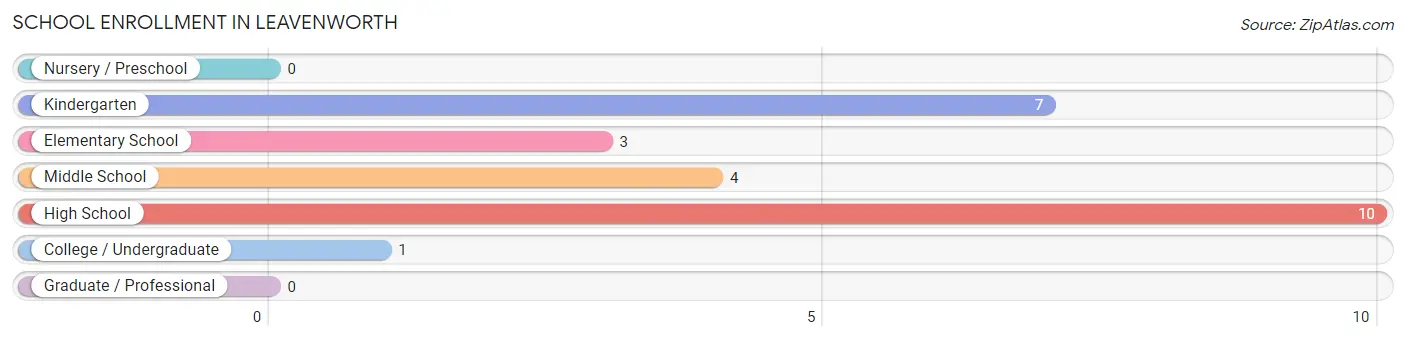
School Enrollment in Leavenworth
The most common levels of schooling among the 25 students in Leavenworth are high school (10 | 40.0%), kindergarten (7 | 28.0%), and middle school (4 | 16.0%).
| School Level | # Students | % Students |
| Nursery / Preschool | 0 | 0.0% |
| Kindergarten | 7 | 28.0% |
| Elementary School | 3 | 12.0% |
| Middle School | 4 | 16.0% |
| High School | 10 | 40.0% |
| College / Undergraduate | 1 | 4.0% |
| Graduate / Professional | 0 | 0.0% |
| Total | 25 | 100.0% |
School Enrollment by Age by Funding Source in Leavenworth
Out of a total of 25 students who are enrolled in schools in Leavenworth, 6 (24.0%) attend a private institution, while the remaining 19 (76.0%) are enrolled in public schools. The age group of 20 to 24 year olds has the highest likelihood of being enrolled in private schools, with 3 (100.0% in the age bracket) enrolled. Conversely, the age group of 10 to 14 year olds has the lowest likelihood of being enrolled in a private school, with 9 (100.0% in the age bracket) attending a public institution.
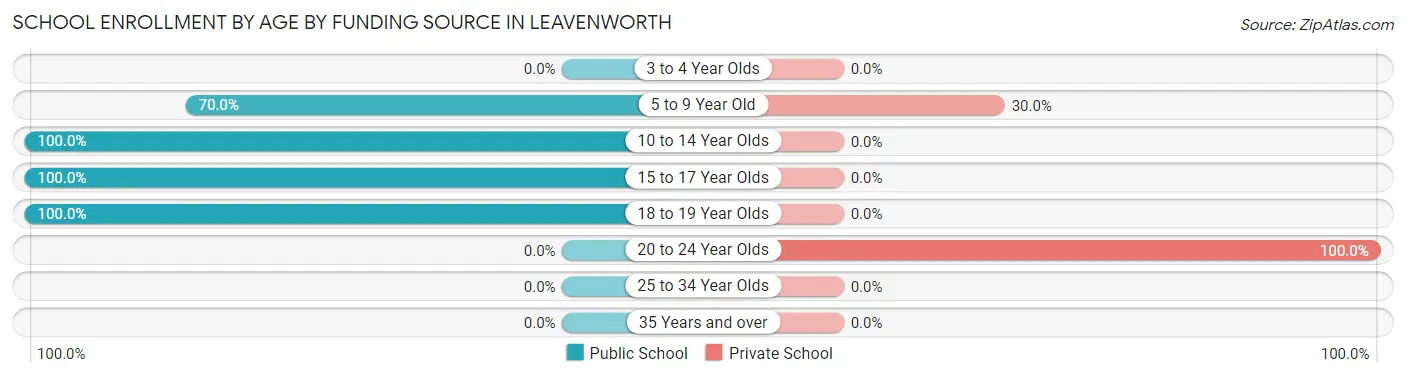
| Age Bracket | Public School | Private School |
| 3 to 4 Year Olds | 0 (0.0%) | 0 (0.0%) |
| 5 to 9 Year Old | 7 (70.0%) | 3 (30.0%) |
| 10 to 14 Year Olds | 9 (100.0%) | 0 (0.0%) |
| 15 to 17 Year Olds | 2 (100.0%) | 0 (0.0%) |
| 18 to 19 Year Olds | 1 (100.0%) | 0 (0.0%) |
| 20 to 24 Year Olds | 0 (0.0%) | 3 (100.0%) |
| 25 to 34 Year Olds | 0 (0.0%) | 0 (0.0%) |
| 35 Years and over | 0 (0.0%) | 0 (0.0%) |
| Total | 19 (76.0%) | 6 (24.0%) |
Educational Attainment by Field of Study in Leavenworth
Education (12 | 41.4%), physical & health sciences (5 | 17.2%), bio, nature & agricultural (4 | 13.8%), arts & humanities (3 | 10.3%), and science & technology (2 | 6.9%) are the most common fields of study among 29 individuals in Leavenworth who have obtained a bachelor's degree or higher.
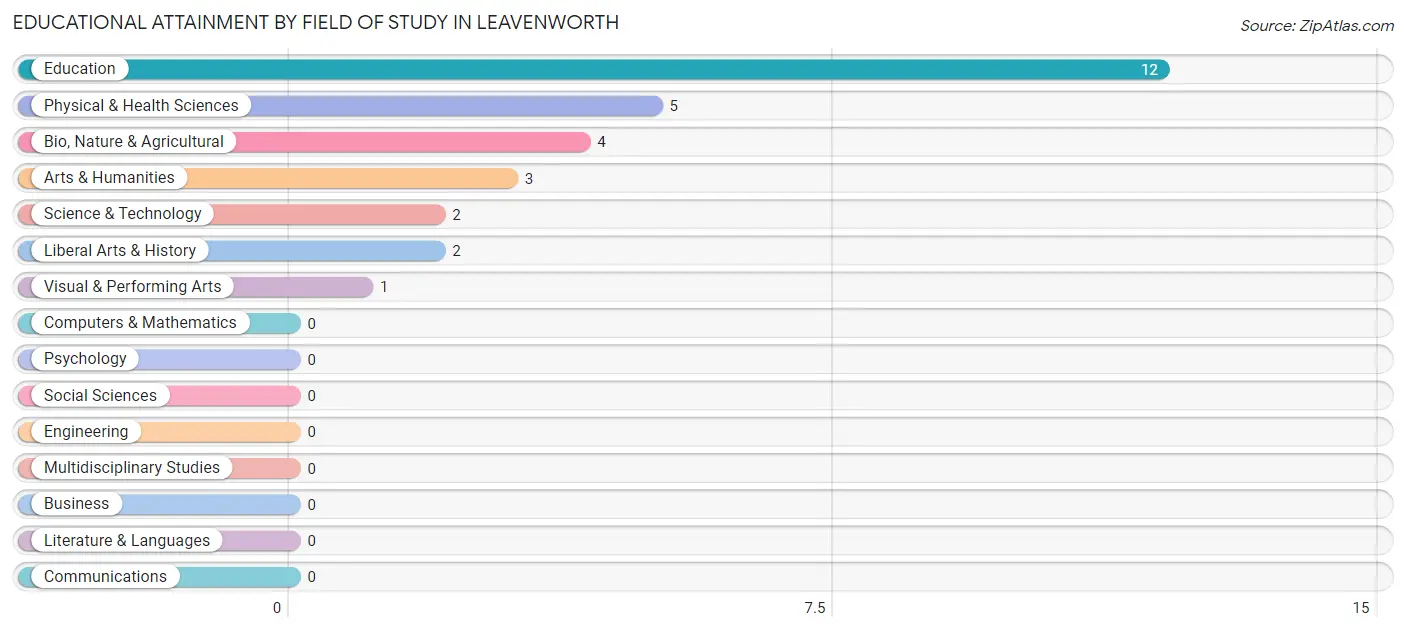
| Field of Study | # Graduates | % Graduates |
| Computers & Mathematics | 0 | 0.0% |
| Bio, Nature & Agricultural | 4 | 13.8% |
| Physical & Health Sciences | 5 | 17.2% |
| Psychology | 0 | 0.0% |
| Social Sciences | 0 | 0.0% |
| Engineering | 0 | 0.0% |
| Multidisciplinary Studies | 0 | 0.0% |
| Science & Technology | 2 | 6.9% |
| Business | 0 | 0.0% |
| Education | 12 | 41.4% |
| Literature & Languages | 0 | 0.0% |
| Liberal Arts & History | 2 | 6.9% |
| Visual & Performing Arts | 1 | 3.5% |
| Communications | 0 | 0.0% |
| Arts & Humanities | 3 | 10.3% |
| Total | 29 | 100.0% |
Transportation & Commute in Leavenworth
Vehicle Availability by Sex in Leavenworth
The most prevalent vehicle ownership categories in Leavenworth are males with 1 vehicle (11, accounting for 35.5%) and females with 1 vehicle (15, making up 17.7%).
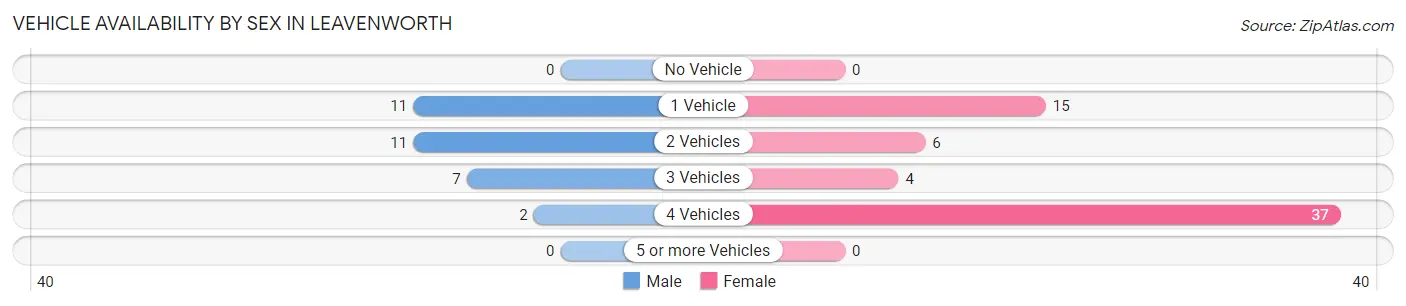
| Vehicles Available | Male | Female |
| No Vehicle | 0 (0.0%) | 0 (0.0%) |
| 1 Vehicle | 11 (35.5%) | 15 (24.2%) |
| 2 Vehicles | 11 (35.5%) | 6 (9.7%) |
| 3 Vehicles | 7 (22.6%) | 4 (6.5%) |
| 4 Vehicles | 2 (6.5%) | 37 (59.7%) |
| 5 or more Vehicles | 0 (0.0%) | 0 (0.0%) |
| Total | 31 (100.0%) | 62 (100.0%) |
Commute Time in Leavenworth
The most frequently occuring commute durations in Leavenworth are 30 to 34 minutes (50 commuters, 56.8%), 45 to 59 minutes (18 commuters, 20.4%), and 60 to 89 minutes (6 commuters, 6.8%).
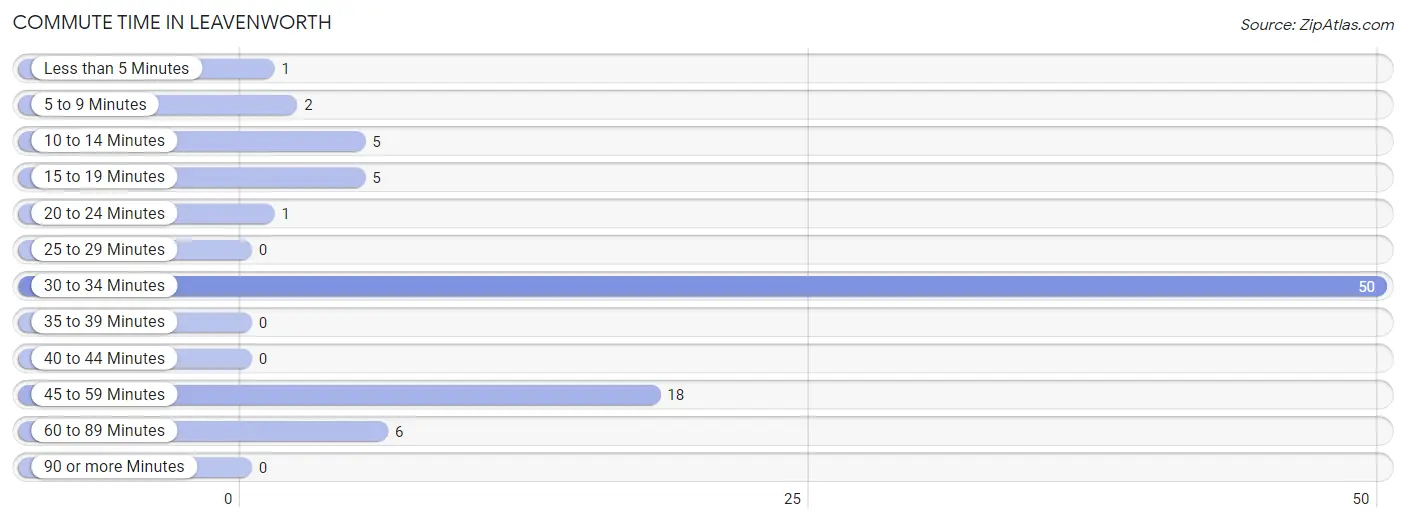
| Commute Time | # Commuters | % Commuters |
| Less than 5 Minutes | 1 | 1.1% |
| 5 to 9 Minutes | 2 | 2.3% |
| 10 to 14 Minutes | 5 | 5.7% |
| 15 to 19 Minutes | 5 | 5.7% |
| 20 to 24 Minutes | 1 | 1.1% |
| 25 to 29 Minutes | 0 | 0.0% |
| 30 to 34 Minutes | 50 | 56.8% |
| 35 to 39 Minutes | 0 | 0.0% |
| 40 to 44 Minutes | 0 | 0.0% |
| 45 to 59 Minutes | 18 | 20.4% |
| 60 to 89 Minutes | 6 | 6.8% |
| 90 or more Minutes | 0 | 0.0% |
Commute Time by Sex in Leavenworth
The most common commute times in Leavenworth are 45 to 59 minutes (18 commuters, 62.1%) for males and 30 to 34 minutes (50 commuters, 84.8%) for females.
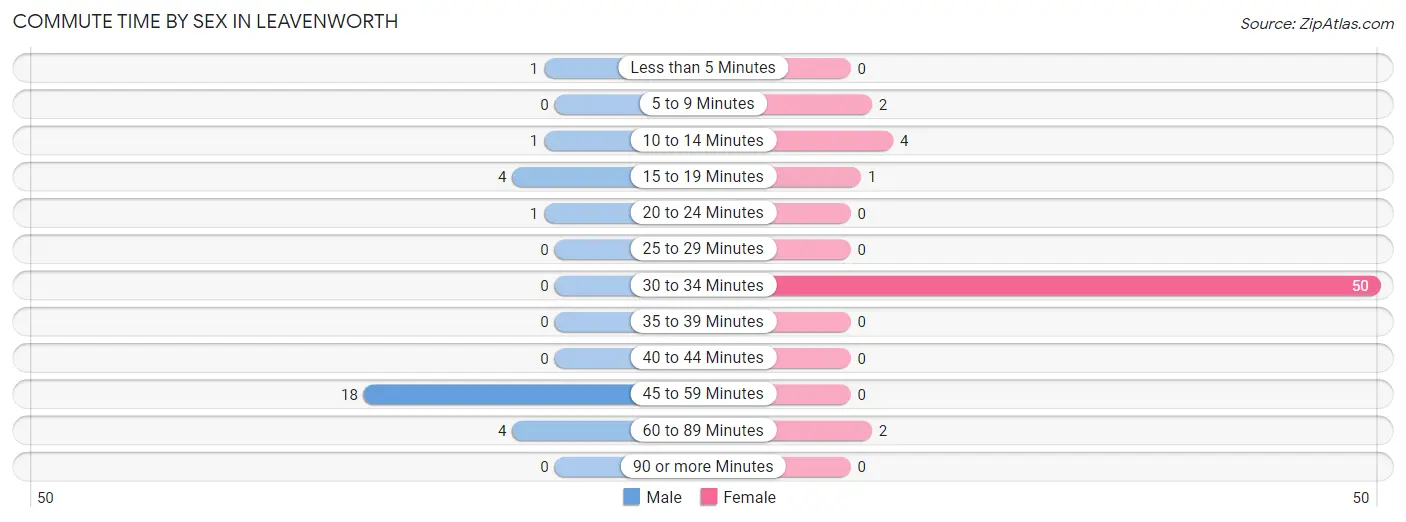
| Commute Time | Male | Female |
| Less than 5 Minutes | 1 (3.5%) | 0 (0.0%) |
| 5 to 9 Minutes | 0 (0.0%) | 2 (3.4%) |
| 10 to 14 Minutes | 1 (3.5%) | 4 (6.8%) |
| 15 to 19 Minutes | 4 (13.8%) | 1 (1.7%) |
| 20 to 24 Minutes | 1 (3.5%) | 0 (0.0%) |
| 25 to 29 Minutes | 0 (0.0%) | 0 (0.0%) |
| 30 to 34 Minutes | 0 (0.0%) | 50 (84.8%) |
| 35 to 39 Minutes | 0 (0.0%) | 0 (0.0%) |
| 40 to 44 Minutes | 0 (0.0%) | 0 (0.0%) |
| 45 to 59 Minutes | 18 (62.1%) | 0 (0.0%) |
| 60 to 89 Minutes | 4 (13.8%) | 2 (3.4%) |
| 90 or more Minutes | 0 (0.0%) | 0 (0.0%) |
Time of Departure to Work by Sex in Leavenworth
The most frequent times of departure to work in Leavenworth are 6:00 AM to 6:29 AM (12, 41.4%) for males and 12:00 AM to 4:59 AM (34, 57.6%) for females.
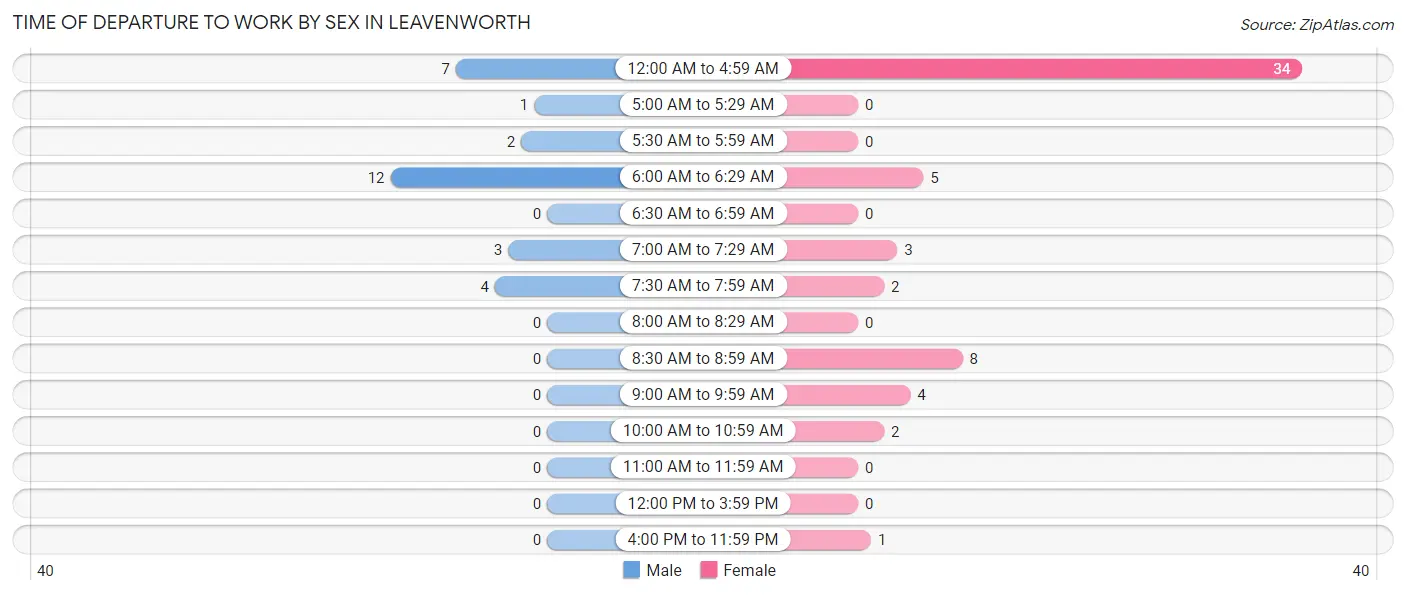
| Time of Departure | Male | Female |
| 12:00 AM to 4:59 AM | 7 (24.1%) | 34 (57.6%) |
| 5:00 AM to 5:29 AM | 1 (3.5%) | 0 (0.0%) |
| 5:30 AM to 5:59 AM | 2 (6.9%) | 0 (0.0%) |
| 6:00 AM to 6:29 AM | 12 (41.4%) | 5 (8.5%) |
| 6:30 AM to 6:59 AM | 0 (0.0%) | 0 (0.0%) |
| 7:00 AM to 7:29 AM | 3 (10.3%) | 3 (5.1%) |
| 7:30 AM to 7:59 AM | 4 (13.8%) | 2 (3.4%) |
| 8:00 AM to 8:29 AM | 0 (0.0%) | 0 (0.0%) |
| 8:30 AM to 8:59 AM | 0 (0.0%) | 8 (13.6%) |
| 9:00 AM to 9:59 AM | 0 (0.0%) | 4 (6.8%) |
| 10:00 AM to 10:59 AM | 0 (0.0%) | 2 (3.4%) |
| 11:00 AM to 11:59 AM | 0 (0.0%) | 0 (0.0%) |
| 12:00 PM to 3:59 PM | 0 (0.0%) | 0 (0.0%) |
| 4:00 PM to 11:59 PM | 0 (0.0%) | 1 (1.7%) |
| Total | 29 (100.0%) | 59 (100.0%) |
Housing Occupancy in Leavenworth
Occupancy by Ownership in Leavenworth
Of the total 137 dwellings in Leavenworth, owner-occupied units account for 91 (66.4%), while renter-occupied units make up 46 (33.6%).
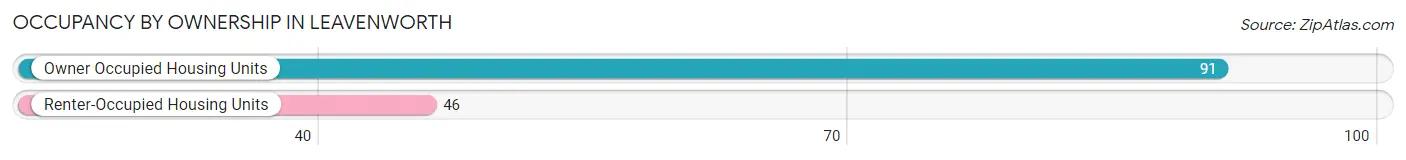
| Occupancy | # Housing Units | % Housing Units |
| Owner Occupied Housing Units | 91 | 66.4% |
| Renter-Occupied Housing Units | 46 | 33.6% |
| Total Occupied Housing Units | 137 | 100.0% |
Occupancy by Household Size in Leavenworth
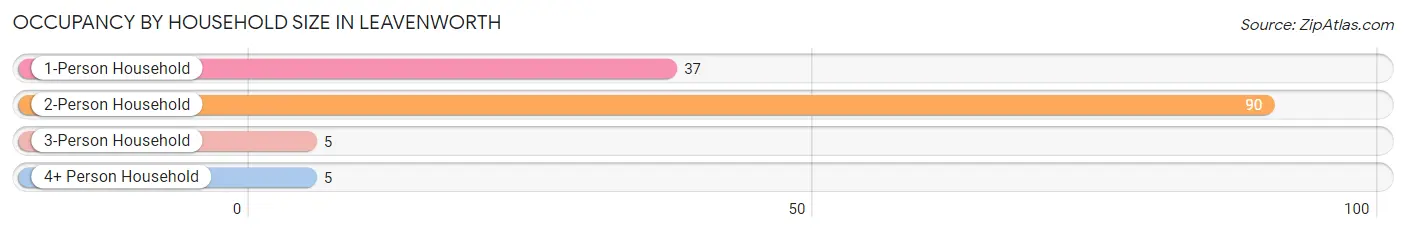
| Household Size | # Housing Units | % Housing Units |
| 1-Person Household | 37 | 27.0% |
| 2-Person Household | 90 | 65.7% |
| 3-Person Household | 5 | 3.6% |
| 4+ Person Household | 5 | 3.6% |
| Total Housing Units | 137 | 100.0% |
Occupancy by Ownership by Household Size in Leavenworth
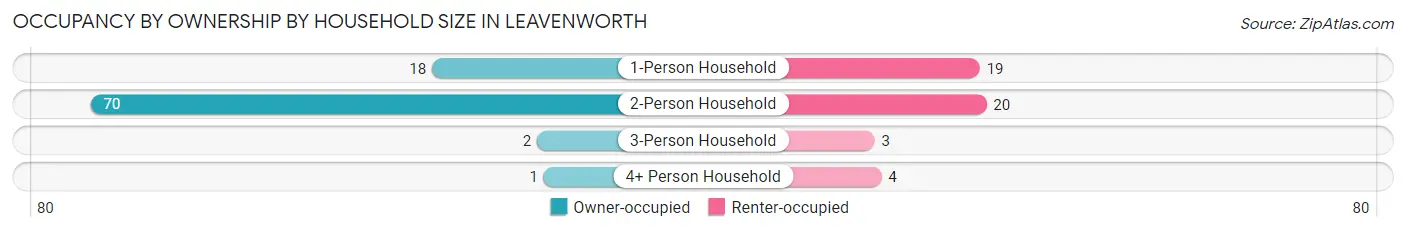
| Household Size | Owner-occupied | Renter-occupied |
| 1-Person Household | 18 (48.6%) | 19 (51.3%) |
| 2-Person Household | 70 (77.8%) | 20 (22.2%) |
| 3-Person Household | 2 (40.0%) | 3 (60.0%) |
| 4+ Person Household | 1 (20.0%) | 4 (80.0%) |
| Total Housing Units | 91 (66.4%) | 46 (33.6%) |
Occupancy by Educational Attainment in Leavenworth
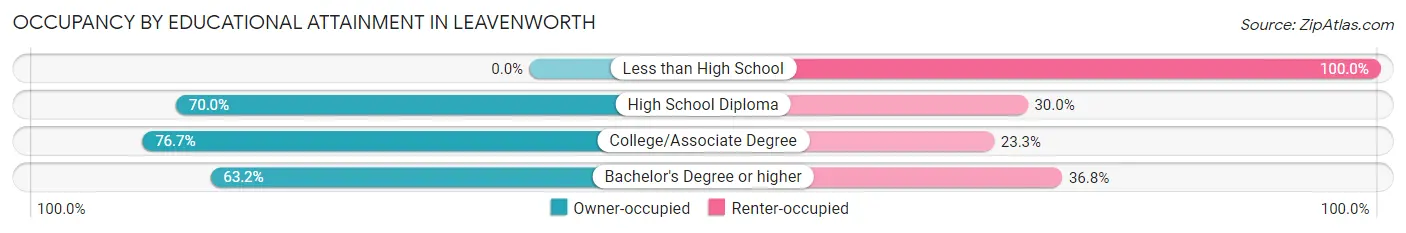
| Household Size | Owner-occupied | Renter-occupied |
| Less than High School | 0 (0.0%) | 8 (100.0%) |
| High School Diploma | 56 (70.0%) | 24 (30.0%) |
| College/Associate Degree | 23 (76.7%) | 7 (23.3%) |
| Bachelor's Degree or higher | 12 (63.2%) | 7 (36.8%) |
Occupancy by Age of Householder in Leavenworth
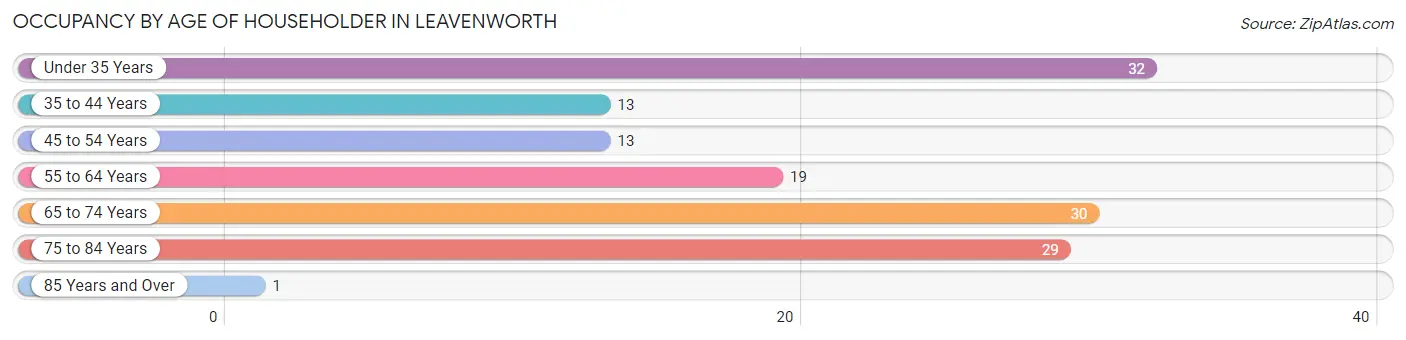
| Age Bracket | # Households | % Households |
| Under 35 Years | 32 | 23.4% |
| 35 to 44 Years | 13 | 9.5% |
| 45 to 54 Years | 13 | 9.5% |
| 55 to 64 Years | 19 | 13.9% |
| 65 to 74 Years | 30 | 21.9% |
| 75 to 84 Years | 29 | 21.2% |
| 85 Years and Over | 1 | 0.7% |
| Total | 137 | 100.0% |
Housing Finances in Leavenworth
Median Income by Occupancy in Leavenworth
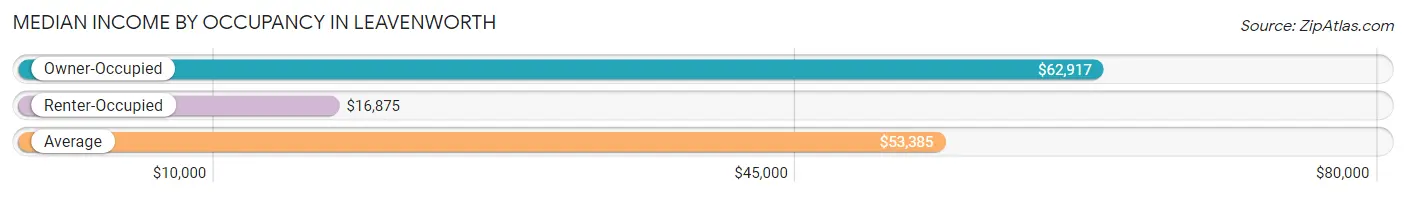
| Occupancy Type | # Households | Median Income |
| Owner-Occupied | 91 (66.4%) | $62,917 |
| Renter-Occupied | 46 (33.6%) | $16,875 |
| Average | 137 (100.0%) | $53,385 |
Occupancy by Householder Income Bracket in Leavenworth
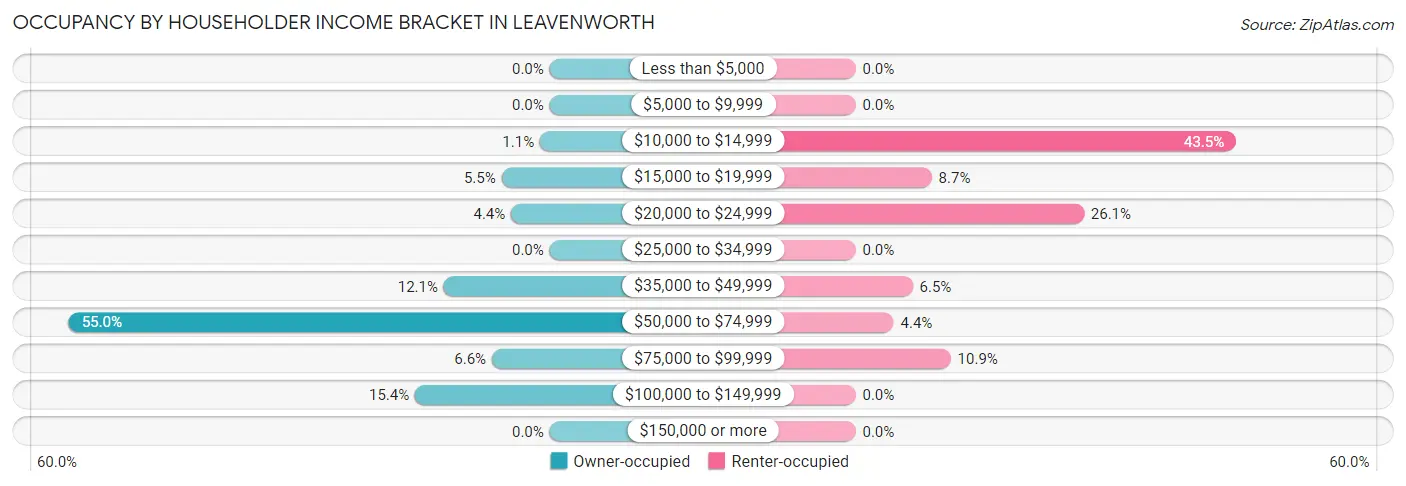
| Income Bracket | Owner-occupied | Renter-occupied |
| Less than $5,000 | 0 (0.0%) | 0 (0.0%) |
| $5,000 to $9,999 | 0 (0.0%) | 0 (0.0%) |
| $10,000 to $14,999 | 1 (1.1%) | 20 (43.5%) |
| $15,000 to $19,999 | 5 (5.5%) | 4 (8.7%) |
| $20,000 to $24,999 | 4 (4.4%) | 12 (26.1%) |
| $25,000 to $34,999 | 0 (0.0%) | 0 (0.0%) |
| $35,000 to $49,999 | 11 (12.1%) | 3 (6.5%) |
| $50,000 to $74,999 | 50 (54.9%) | 2 (4.3%) |
| $75,000 to $99,999 | 6 (6.6%) | 5 (10.9%) |
| $100,000 to $149,999 | 14 (15.4%) | 0 (0.0%) |
| $150,000 or more | 0 (0.0%) | 0 (0.0%) |
| Total | 91 (100.0%) | 46 (100.0%) |
Monthly Housing Cost Tiers in Leavenworth
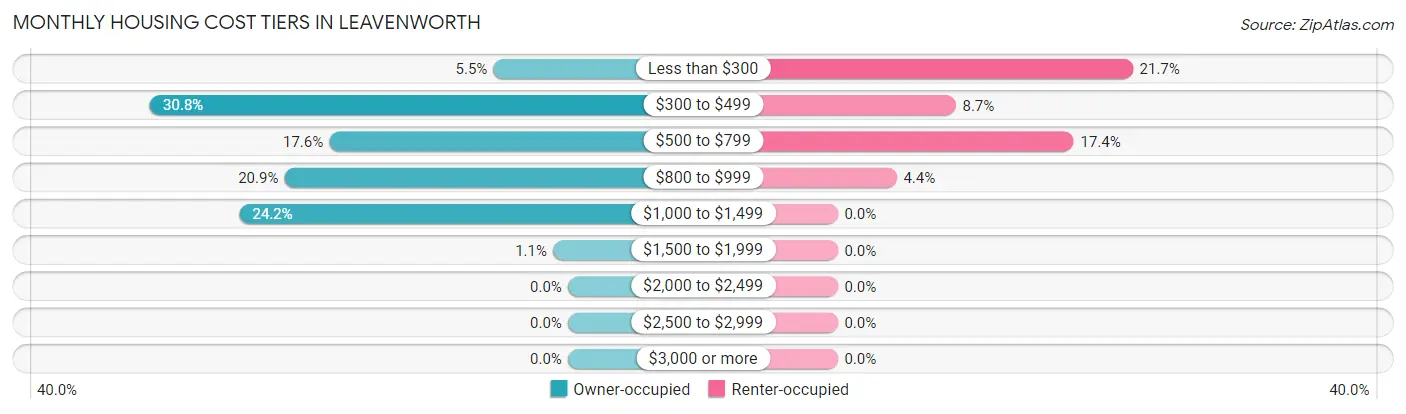
| Monthly Cost | Owner-occupied | Renter-occupied |
| Less than $300 | 5 (5.5%) | 10 (21.7%) |
| $300 to $499 | 28 (30.8%) | 4 (8.7%) |
| $500 to $799 | 16 (17.6%) | 8 (17.4%) |
| $800 to $999 | 19 (20.9%) | 2 (4.3%) |
| $1,000 to $1,499 | 22 (24.2%) | 0 (0.0%) |
| $1,500 to $1,999 | 1 (1.1%) | 0 (0.0%) |
| $2,000 to $2,499 | 0 (0.0%) | 0 (0.0%) |
| $2,500 to $2,999 | 0 (0.0%) | 0 (0.0%) |
| $3,000 or more | 0 (0.0%) | 0 (0.0%) |
| Total | 91 (100.0%) | 46 (100.0%) |
Physical Housing Characteristics in Leavenworth
Housing Structures in Leavenworth
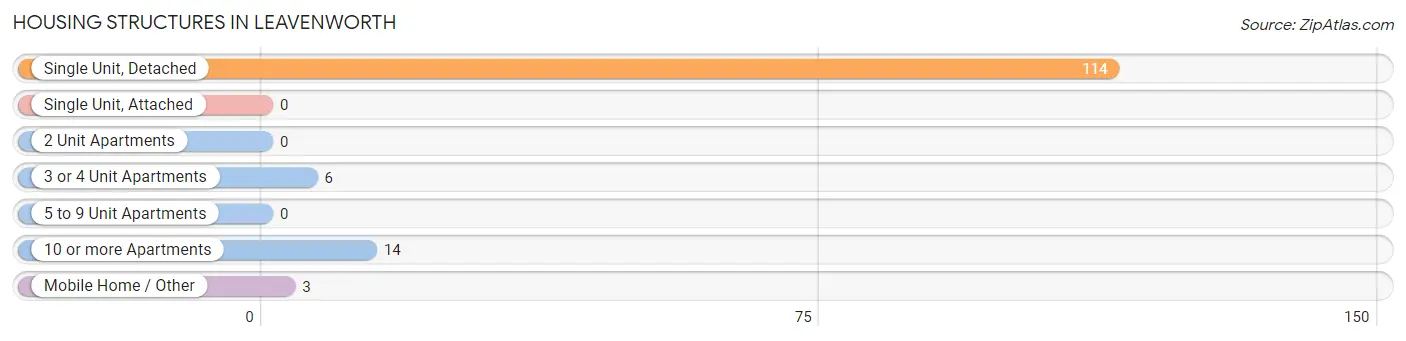
| Structure Type | # Housing Units | % Housing Units |
| Single Unit, Detached | 114 | 83.2% |
| Single Unit, Attached | 0 | 0.0% |
| 2 Unit Apartments | 0 | 0.0% |
| 3 or 4 Unit Apartments | 6 | 4.4% |
| 5 to 9 Unit Apartments | 0 | 0.0% |
| 10 or more Apartments | 14 | 10.2% |
| Mobile Home / Other | 3 | 2.2% |
| Total | 137 | 100.0% |
Housing Structures by Occupancy in Leavenworth
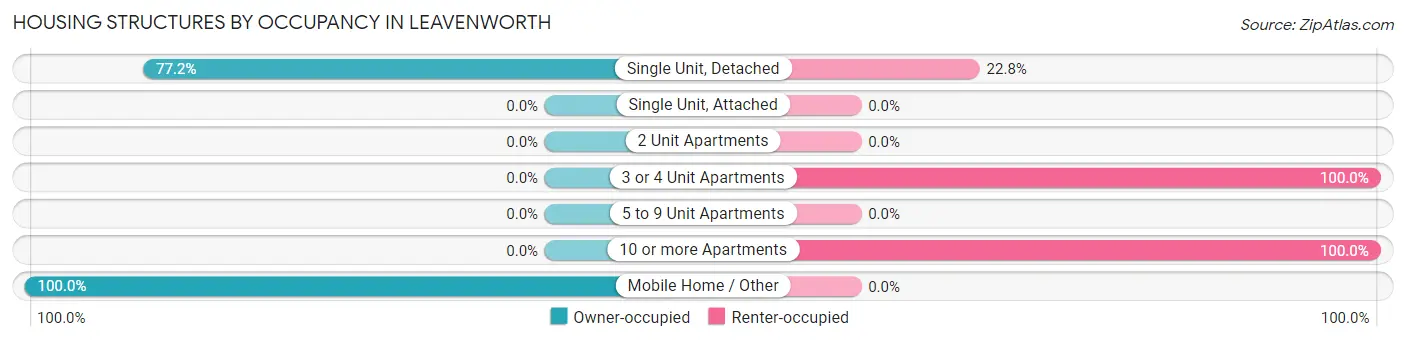
| Structure Type | Owner-occupied | Renter-occupied |
| Single Unit, Detached | 88 (77.2%) | 26 (22.8%) |
| Single Unit, Attached | 0 (0.0%) | 0 (0.0%) |
| 2 Unit Apartments | 0 (0.0%) | 0 (0.0%) |
| 3 or 4 Unit Apartments | 0 (0.0%) | 6 (100.0%) |
| 5 to 9 Unit Apartments | 0 (0.0%) | 0 (0.0%) |
| 10 or more Apartments | 0 (0.0%) | 14 (100.0%) |
| Mobile Home / Other | 3 (100.0%) | 0 (0.0%) |
| Total | 91 (66.4%) | 46 (33.6%) |
Housing Structures by Number of Rooms in Leavenworth
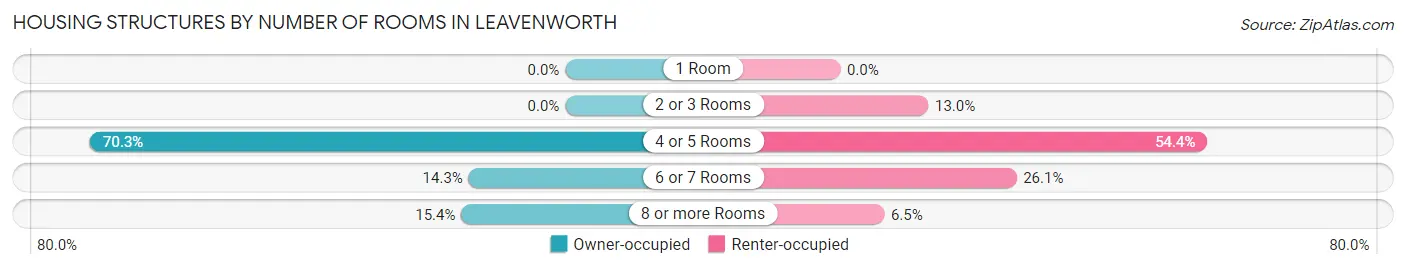
| Number of Rooms | Owner-occupied | Renter-occupied |
| 1 Room | 0 (0.0%) | 0 (0.0%) |
| 2 or 3 Rooms | 0 (0.0%) | 6 (13.0%) |
| 4 or 5 Rooms | 64 (70.3%) | 25 (54.3%) |
| 6 or 7 Rooms | 13 (14.3%) | 12 (26.1%) |
| 8 or more Rooms | 14 (15.4%) | 3 (6.5%) |
| Total | 91 (100.0%) | 46 (100.0%) |
Housing Structure by Heating Type in Leavenworth
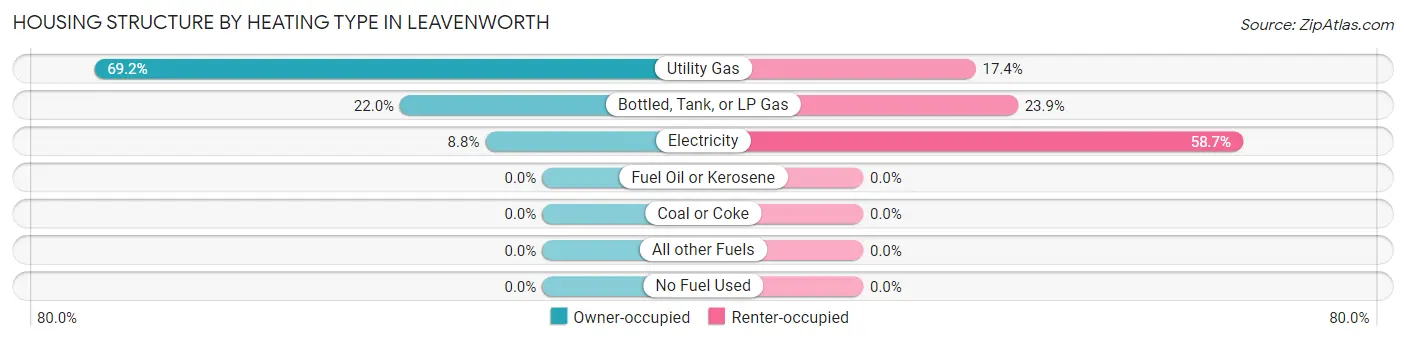
| Heating Type | Owner-occupied | Renter-occupied |
| Utility Gas | 63 (69.2%) | 8 (17.4%) |
| Bottled, Tank, or LP Gas | 20 (22.0%) | 11 (23.9%) |
| Electricity | 8 (8.8%) | 27 (58.7%) |
| Fuel Oil or Kerosene | 0 (0.0%) | 0 (0.0%) |
| Coal or Coke | 0 (0.0%) | 0 (0.0%) |
| All other Fuels | 0 (0.0%) | 0 (0.0%) |
| No Fuel Used | 0 (0.0%) | 0 (0.0%) |
| Total | 91 (100.0%) | 46 (100.0%) |
Household Vehicle Usage in Leavenworth
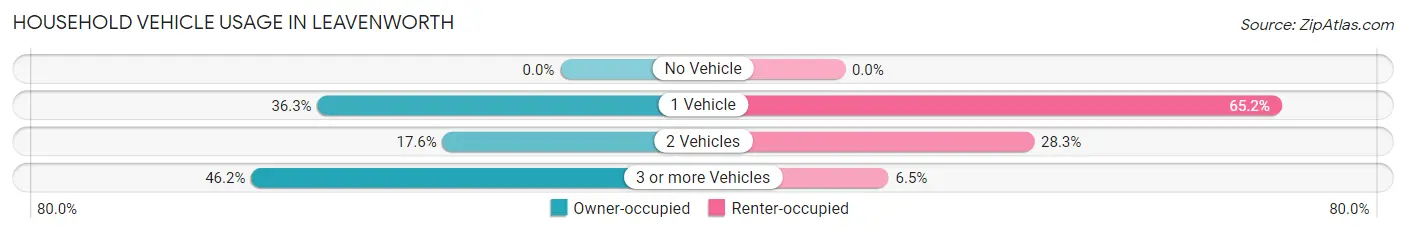
| Vehicles per Household | Owner-occupied | Renter-occupied |
| No Vehicle | 0 (0.0%) | 0 (0.0%) |
| 1 Vehicle | 33 (36.3%) | 30 (65.2%) |
| 2 Vehicles | 16 (17.6%) | 13 (28.3%) |
| 3 or more Vehicles | 42 (46.2%) | 3 (6.5%) |
| Total | 91 (100.0%) | 46 (100.0%) |
Real Estate & Mortgages in Leavenworth
Real Estate and Mortgage Overview in Leavenworth
| Characteristic | Without Mortgage | With Mortgage |
| Housing Units | 38 | 53 |
| Median Property Value | $77,300 | $115,100 |
| Median Household Income | $53,864 | $0 |
| Monthly Housing Costs | $446 | $0 |
| Real Estate Taxes | - | - |
Property Value by Mortgage Status in Leavenworth
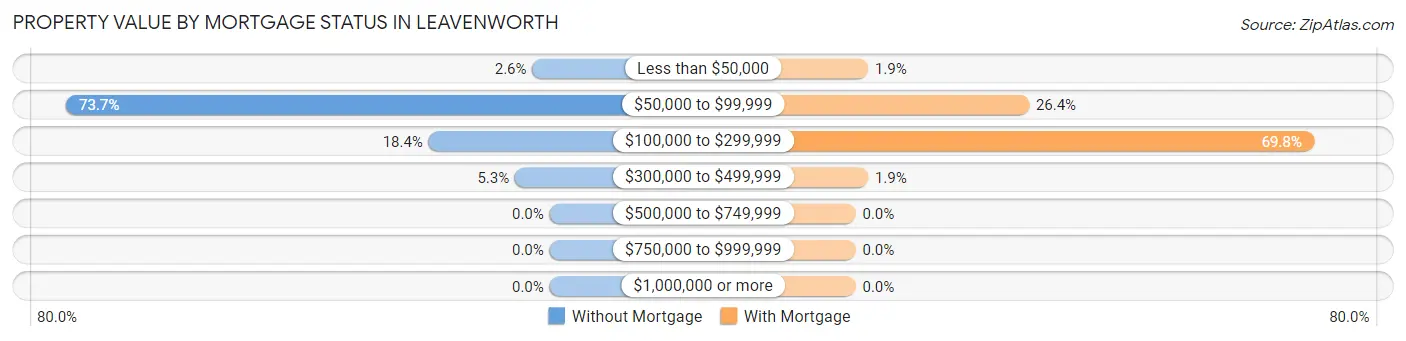
| Property Value | Without Mortgage | With Mortgage |
| Less than $50,000 | 1 (2.6%) | 1 (1.9%) |
| $50,000 to $99,999 | 28 (73.7%) | 14 (26.4%) |
| $100,000 to $299,999 | 7 (18.4%) | 37 (69.8%) |
| $300,000 to $499,999 | 2 (5.3%) | 1 (1.9%) |
| $500,000 to $749,999 | 0 (0.0%) | 0 (0.0%) |
| $750,000 to $999,999 | 0 (0.0%) | 0 (0.0%) |
| $1,000,000 or more | 0 (0.0%) | 0 (0.0%) |
| Total | 38 (100.0%) | 53 (100.0%) |
Household Income by Mortgage Status in Leavenworth
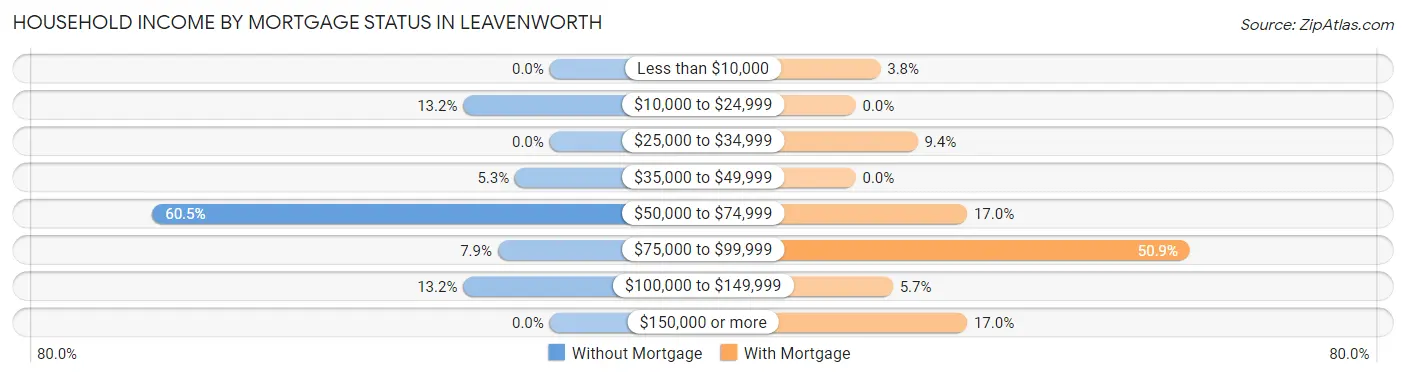
| Household Income | Without Mortgage | With Mortgage |
| Less than $10,000 | 0 (0.0%) | 2 (3.8%) |
| $10,000 to $24,999 | 5 (13.2%) | 0 (0.0%) |
| $25,000 to $34,999 | 0 (0.0%) | 5 (9.4%) |
| $35,000 to $49,999 | 2 (5.3%) | 0 (0.0%) |
| $50,000 to $74,999 | 23 (60.5%) | 9 (17.0%) |
| $75,000 to $99,999 | 3 (7.9%) | 27 (50.9%) |
| $100,000 to $149,999 | 5 (13.2%) | 3 (5.7%) |
| $150,000 or more | 0 (0.0%) | 9 (17.0%) |
| Total | 38 (100.0%) | 53 (100.0%) |
Property Value to Household Income Ratio in Leavenworth
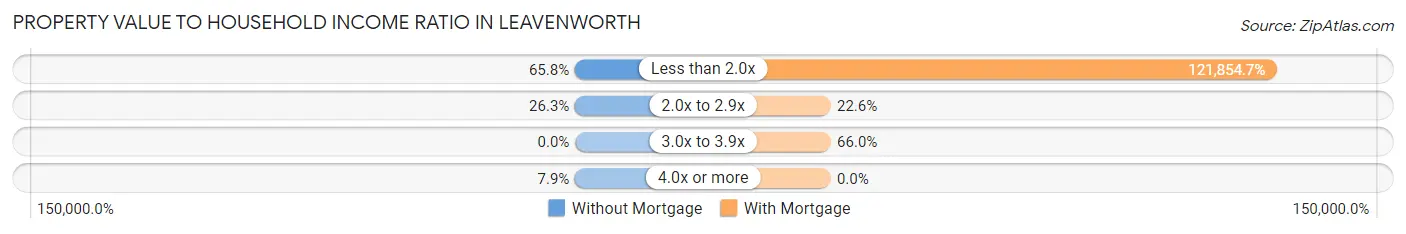
| Value-to-Income Ratio | Without Mortgage | With Mortgage |
| Less than 2.0x | 25 (65.8%) | 64,583 (121,854.7%) |
| 2.0x to 2.9x | 10 (26.3%) | 12 (22.6%) |
| 3.0x to 3.9x | 0 (0.0%) | 35 (66.0%) |
| 4.0x or more | 3 (7.9%) | 0 (0.0%) |
| Total | 38 (100.0%) | 53 (100.0%) |
Real Estate Taxes by Mortgage Status in Leavenworth
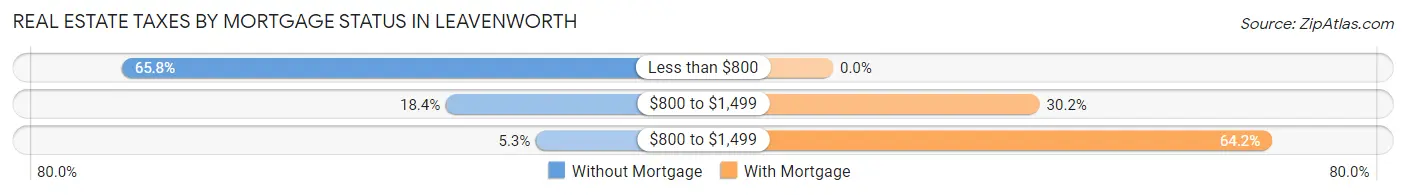
| Property Taxes | Without Mortgage | With Mortgage |
| Less than $800 | 25 (65.8%) | 0 (0.0%) |
| $800 to $1,499 | 7 (18.4%) | 16 (30.2%) |
| $800 to $1,499 | 2 (5.3%) | 34 (64.1%) |
| Total | 38 (100.0%) | 53 (100.0%) |
Health & Disability in Leavenworth
Health Insurance Coverage by Age in Leavenworth
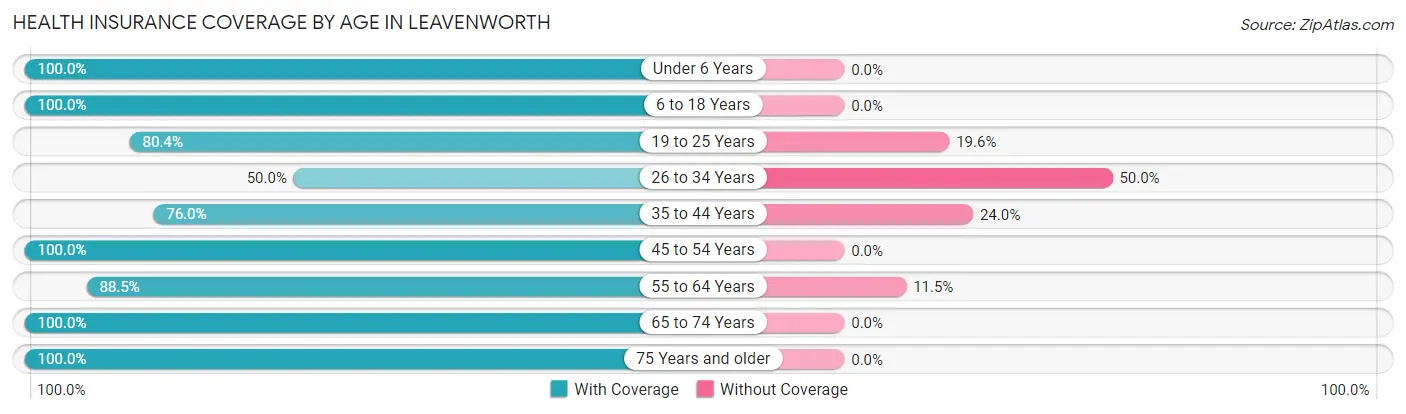
| Age Bracket | With Coverage | Without Coverage |
| Under 6 Years | 12 (100.0%) | 0 (0.0%) |
| 6 to 18 Years | 22 (100.0%) | 0 (0.0%) |
| 19 to 25 Years | 37 (80.4%) | 9 (19.6%) |
| 26 to 34 Years | 3 (50.0%) | 3 (50.0%) |
| 35 to 44 Years | 19 (76.0%) | 6 (24.0%) |
| 45 to 54 Years | 20 (100.0%) | 0 (0.0%) |
| 55 to 64 Years | 23 (88.5%) | 3 (11.5%) |
| 65 to 74 Years | 72 (100.0%) | 0 (0.0%) |
| 75 Years and older | 32 (100.0%) | 0 (0.0%) |
| Total | 240 (91.9%) | 21 (8.1%) |
Health Insurance Coverage by Citizenship Status in Leavenworth
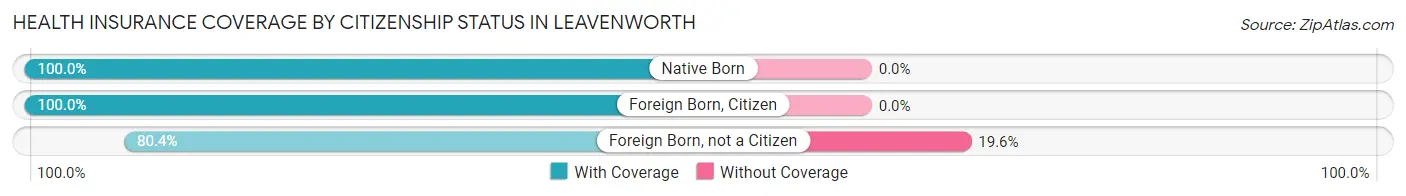
| Citizenship Status | With Coverage | Without Coverage |
| Native Born | 12 (100.0%) | 0 (0.0%) |
| Foreign Born, Citizen | 22 (100.0%) | 0 (0.0%) |
| Foreign Born, not a Citizen | 37 (80.4%) | 9 (19.6%) |
Health Insurance Coverage by Household Income in Leavenworth
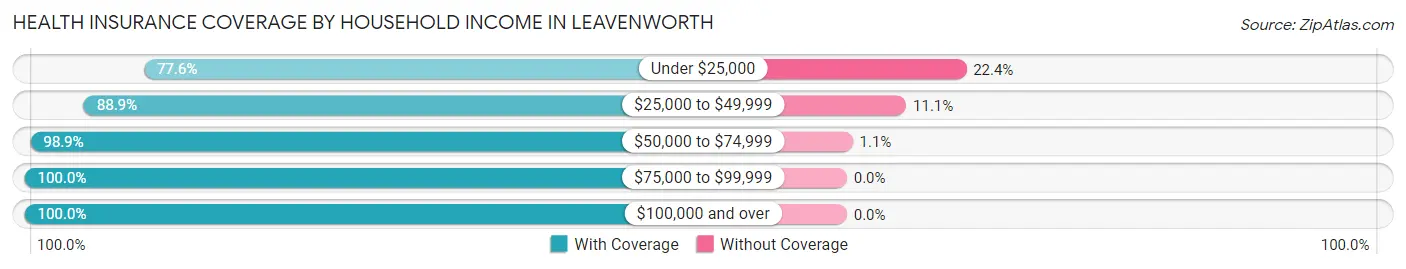
| Household Income | With Coverage | Without Coverage |
| Under $25,000 | 59 (77.6%) | 17 (22.4%) |
| $25,000 to $49,999 | 24 (88.9%) | 3 (11.1%) |
| $50,000 to $74,999 | 91 (98.9%) | 1 (1.1%) |
| $75,000 to $99,999 | 39 (100.0%) | 0 (0.0%) |
| $100,000 and over | 27 (100.0%) | 0 (0.0%) |
Public vs Private Health Insurance Coverage by Age in Leavenworth
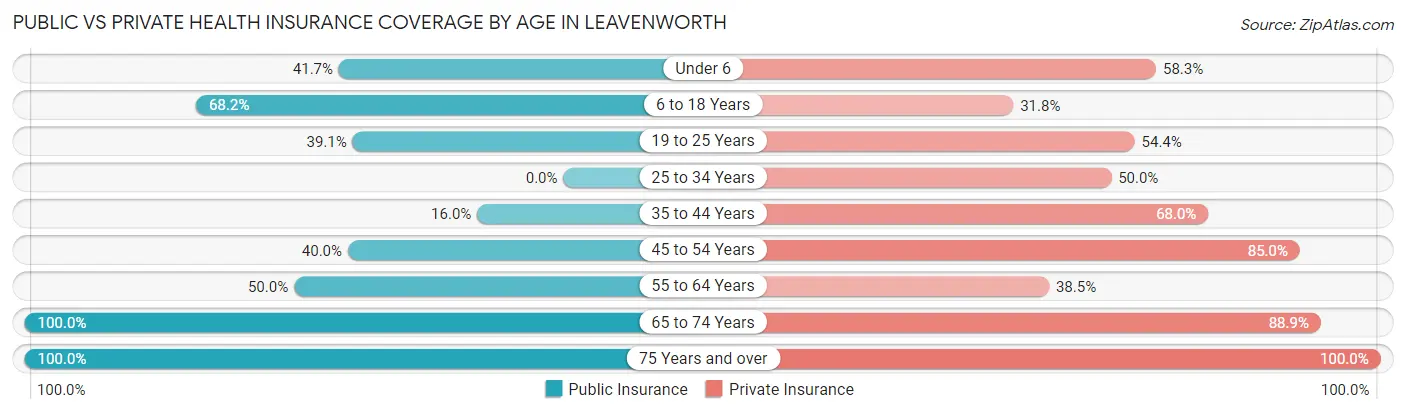
| Age Bracket | Public Insurance | Private Insurance |
| Under 6 | 5 (41.7%) | 7 (58.3%) |
| 6 to 18 Years | 15 (68.2%) | 7 (31.8%) |
| 19 to 25 Years | 18 (39.1%) | 25 (54.3%) |
| 25 to 34 Years | 0 (0.0%) | 3 (50.0%) |
| 35 to 44 Years | 4 (16.0%) | 17 (68.0%) |
| 45 to 54 Years | 8 (40.0%) | 17 (85.0%) |
| 55 to 64 Years | 13 (50.0%) | 10 (38.5%) |
| 65 to 74 Years | 72 (100.0%) | 64 (88.9%) |
| 75 Years and over | 32 (100.0%) | 32 (100.0%) |
| Total | 167 (64.0%) | 182 (69.7%) |
Disability Status by Sex by Age in Leavenworth
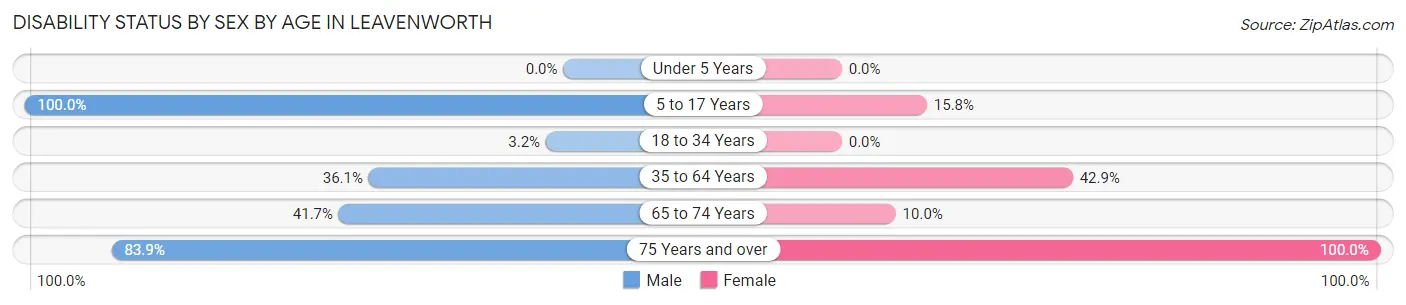
| Age Bracket | Male | Female |
| Under 5 Years | 0 (0.0%) | 0 (0.0%) |
| 5 to 17 Years | 2 (100.0%) | 3 (15.8%) |
| 18 to 34 Years | 1 (3.2%) | 0 (0.0%) |
| 35 to 64 Years | 13 (36.1%) | 15 (42.9%) |
| 65 to 74 Years | 5 (41.7%) | 6 (10.0%) |
| 75 Years and over | 26 (83.9%) | 1 (100.0%) |
Disability Class by Sex by Age in Leavenworth
Disability Class: Hearing Difficulty
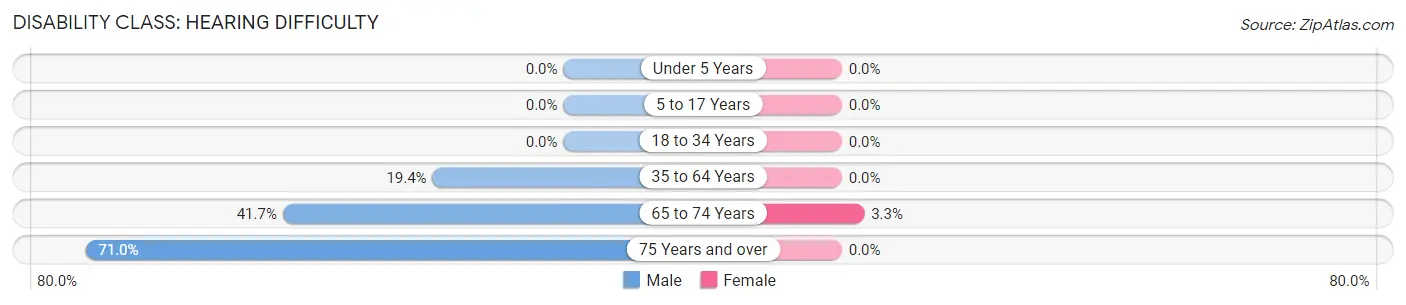
| Age Bracket | Male | Female |
| Under 5 Years | 0 (0.0%) | 0 (0.0%) |
| 5 to 17 Years | 0 (0.0%) | 0 (0.0%) |
| 18 to 34 Years | 0 (0.0%) | 0 (0.0%) |
| 35 to 64 Years | 7 (19.4%) | 0 (0.0%) |
| 65 to 74 Years | 5 (41.7%) | 2 (3.3%) |
| 75 Years and over | 22 (71.0%) | 0 (0.0%) |
Disability Class: Vision Difficulty
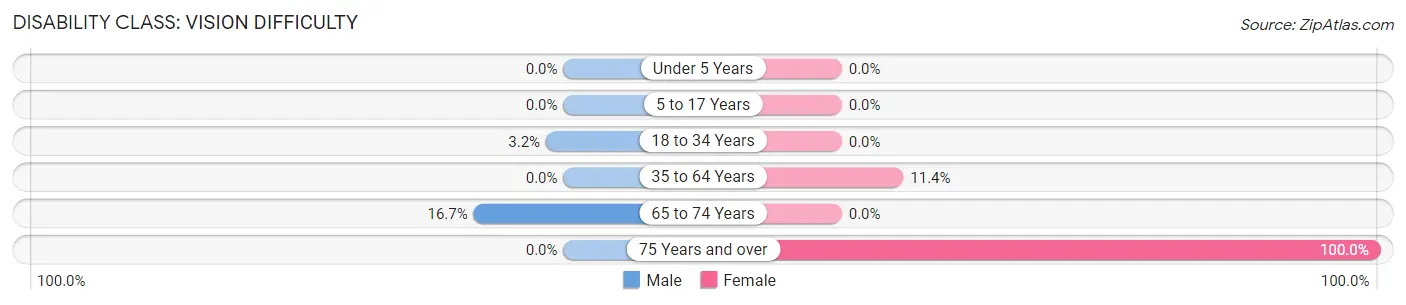
| Age Bracket | Male | Female |
| Under 5 Years | 0 (0.0%) | 0 (0.0%) |
| 5 to 17 Years | 0 (0.0%) | 0 (0.0%) |
| 18 to 34 Years | 1 (3.2%) | 0 (0.0%) |
| 35 to 64 Years | 0 (0.0%) | 4 (11.4%) |
| 65 to 74 Years | 2 (16.7%) | 0 (0.0%) |
| 75 Years and over | 0 (0.0%) | 1 (100.0%) |
Disability Class: Cognitive Difficulty
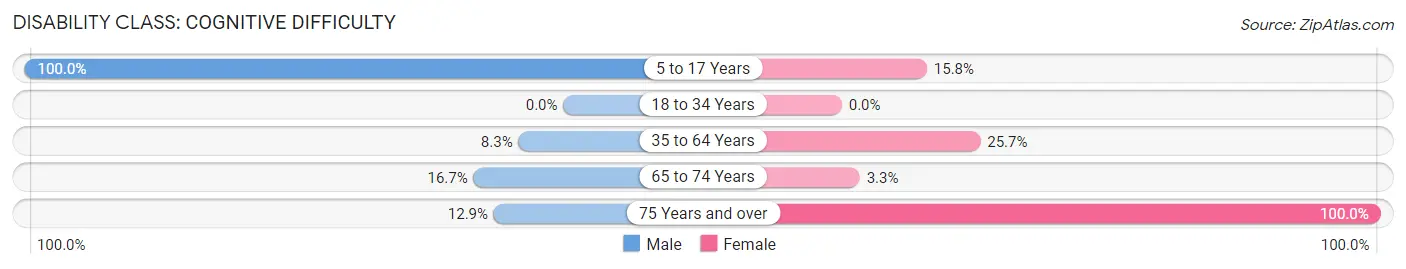
| Age Bracket | Male | Female |
| 5 to 17 Years | 2 (100.0%) | 3 (15.8%) |
| 18 to 34 Years | 0 (0.0%) | 0 (0.0%) |
| 35 to 64 Years | 3 (8.3%) | 9 (25.7%) |
| 65 to 74 Years | 2 (16.7%) | 2 (3.3%) |
| 75 Years and over | 4 (12.9%) | 1 (100.0%) |
Disability Class: Ambulatory Difficulty
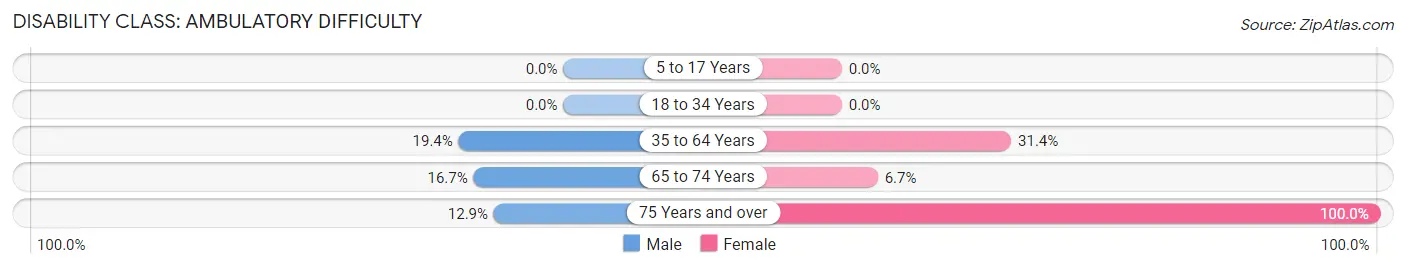
| Age Bracket | Male | Female |
| 5 to 17 Years | 0 (0.0%) | 0 (0.0%) |
| 18 to 34 Years | 0 (0.0%) | 0 (0.0%) |
| 35 to 64 Years | 7 (19.4%) | 11 (31.4%) |
| 65 to 74 Years | 2 (16.7%) | 4 (6.7%) |
| 75 Years and over | 4 (12.9%) | 1 (100.0%) |
Disability Class: Self-Care Difficulty
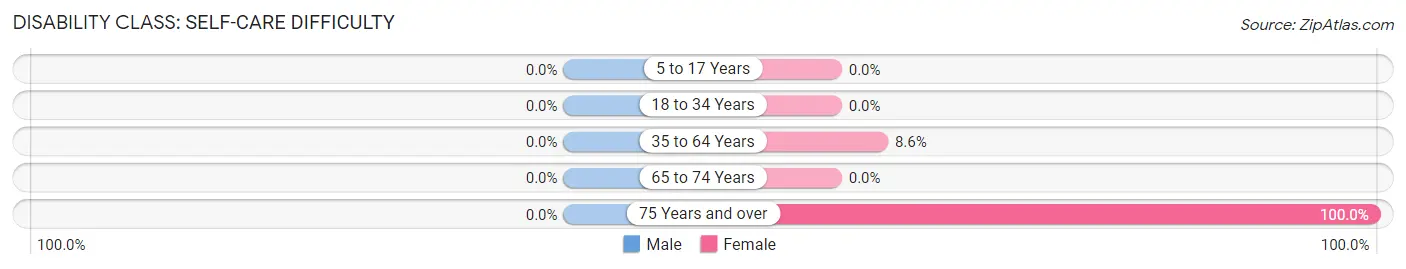
| Age Bracket | Male | Female |
| 5 to 17 Years | 0 (0.0%) | 0 (0.0%) |
| 18 to 34 Years | 0 (0.0%) | 0 (0.0%) |
| 35 to 64 Years | 0 (0.0%) | 3 (8.6%) |
| 65 to 74 Years | 0 (0.0%) | 0 (0.0%) |
| 75 Years and over | 0 (0.0%) | 1 (100.0%) |
Technology Access in Leavenworth
Computing Device Access in Leavenworth
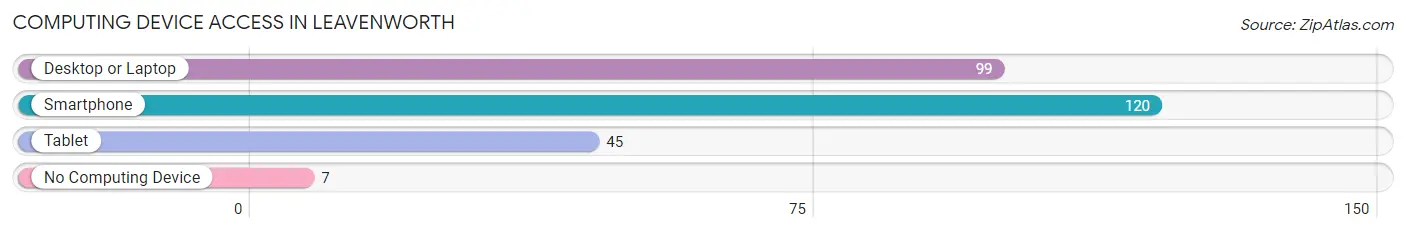
| Device Type | # Households | % Households |
| Desktop or Laptop | 99 | 72.3% |
| Smartphone | 120 | 87.6% |
| Tablet | 45 | 32.9% |
| No Computing Device | 7 | 5.1% |
| Total | 137 | 100.0% |
Internet Access in Leavenworth
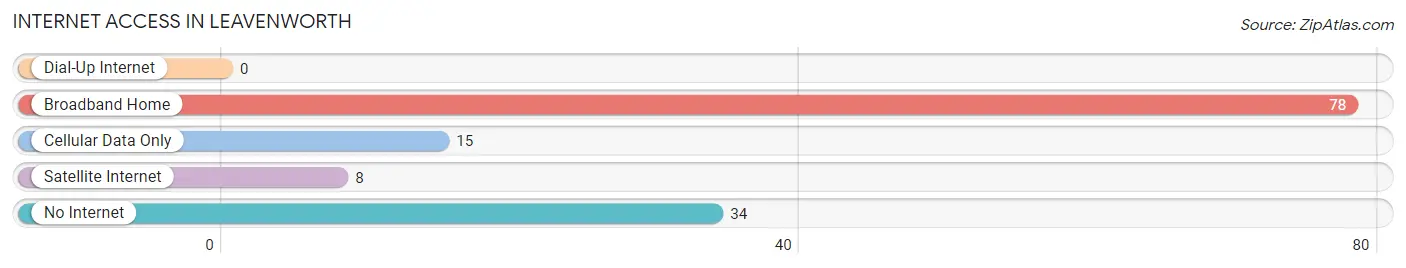
| Internet Type | # Households | % Households |
| Dial-Up Internet | 0 | 0.0% |
| Broadband Home | 78 | 56.9% |
| Cellular Data Only | 15 | 11.0% |
| Satellite Internet | 8 | 5.8% |
| No Internet | 34 | 24.8% |
| Total | 137 | 100.0% |
Leavenworth Summary
Leavenworth, Indiana is a small town located in the southwestern corner of the state, in Spencer County. It is situated on the banks of the Ohio River, and is part of the Louisville metropolitan area. The town has a population of just over 1,000 people, and is known for its historic buildings and quaint atmosphere.
History
Leavenworth was founded in 1818 by a group of settlers from Kentucky. The town was named after General Henry Leavenworth, who had served in the War of 1812. The town was originally a trading post, and the settlers built a fort to protect themselves from Native American attacks. The fort was later abandoned, and the town grew slowly over the years.
In the late 19th century, Leavenworth became a popular tourist destination. The town was known for its scenic beauty, and many visitors came to enjoy the river and the surrounding countryside. The town also became a popular stop for steamboats, which brought goods and passengers to the area.
In the early 20th century, Leavenworth began to decline. The steamboat industry had declined, and the town was no longer a popular tourist destination. The population began to decline, and the town was in danger of becoming a ghost town.
In the late 20th century, Leavenworth began to experience a revival. The town was designated as a National Historic District in 1976, and many of the historic buildings were restored. The town also began to attract new businesses, and the population began to grow again.
Geography
Leavenworth is located in the southwestern corner of Indiana, in Spencer County. The town is situated on the banks of the Ohio River, and is part of the Louisville metropolitan area. The town is surrounded by rolling hills and farmland, and is known for its scenic beauty.
The climate in Leavenworth is humid continental, with hot summers and cold winters. The average annual temperature is around 50 degrees Fahrenheit, and the average annual precipitation is around 40 inches.
Economy
The economy of Leavenworth is largely based on tourism and agriculture. The town is known for its historic buildings and scenic beauty, and many visitors come to enjoy the river and the surrounding countryside. The town also has several small businesses, including restaurants, shops, and a winery.
Agriculture is also an important part of the local economy. The town is surrounded by farmland, and many of the local farmers grow corn, soybeans, and wheat. The town also has several small manufacturing businesses, which produce a variety of products.
Demographics
As of the 2010 census, the population of Leavenworth was 1,072. The racial makeup of the town was 97.3% White, 0.7% African American, 0.2% Native American, 0.2% Asian, 0.1% Pacific Islander, and 1.5% from other races. The median household income was $37,500, and the median family income was $45,000.
Leavenworth is a small town with a rich history and a unique atmosphere. The town is known for its scenic beauty and historic buildings, and is a popular tourist destination. The town also has a strong agricultural base, and is home to several small businesses. The population of the town is growing, and the town is becoming an increasingly popular place to live.
Common Questions
What is the Total Population of Leavenworth?
Total Population of Leavenworth is 328.
What is the Total Male Population of Leavenworth?
Total Male Population of Leavenworth is 152.
What is the Total Female Population of Leavenworth?
Total Female Population of Leavenworth is 176.
What is the Ratio of Males per 100 Females in Leavenworth?
There are 86.36 Males per 100 Females in Leavenworth.
What is the Ratio of Females per 100 Males in Leavenworth?
There are 115.79 Females per 100 Males in Leavenworth.
What is the Median Population Age in Leavenworth?
Median Population Age in Leavenworth is 64.3 Years.
What is the Average Family Size in Leavenworth
Average Family Size in Leavenworth is 2.2 People.
What is the Average Household Size in Leavenworth
Average Household Size in Leavenworth is 1.9 People.
What is Per Capita Income in Leavenworth?
Per Capita income in Leavenworth is $20,925.
What is the Median Family Income in Leavenworth?
Median Family Income in Leavenworth is $54,943.
What is the Median Household income in Leavenworth?
Median Household Income in Leavenworth is $53,385.
What is Income or Wage Gap in Leavenworth?
Income or Wage Gap in Leavenworth is 5.5%.
Women in Leavenworth earn 94.5 cents for every dollar earned by a man.
What is Family Income Deficit in Leavenworth?
Family Income Deficit in Leavenworth is $10,390.
Families that are below poverty line in Leavenworth earn $10,390 less on average than the poverty threshold level.
What is Inequality or Gini Index in Leavenworth?
Inequality or Gini Index in Leavenworth is 0.35.
How Large is the Labor Force in Leavenworth?
There are 127 People in the Labor Forcein in Leavenworth.
What is the Percentage of People in the Labor Force in Leavenworth?
42.8% of People are in the Labor Force in Leavenworth.
What is the Unemployment Rate in Leavenworth?
Unemployment Rate in Leavenworth is 25.2%.