Wanatah, IN
Wanatah Map
Wanatah Overview
1,136
TOTAL POPULATION
548
MALE POPULATION
588
FEMALE POPULATION
93.20
MALES / 100 FEMALES
107.30
FEMALES / 100 MALES
41.0
MEDIAN AGE
3.1
AVG FAMILY SIZE
2.3
AVG HOUSEHOLD SIZE
$36,311
PER CAPITA INCOME
$99,688
AVG FAMILY INCOME
$67,917
AVG HOUSEHOLD INCOME
34.0%
WAGE / INCOME GAP [ % ]
66.0¢/ $1
WAGE / INCOME GAP [ $ ]
0.38
INEQUALITY / GINI INDEX
687
LABOR FORCE [ PEOPLE ]
74.2%
PERCENT IN LABOR FORCE
6.3%
UNEMPLOYMENT RATE
Wanatah Zip Codes
Wanatah Area Codes
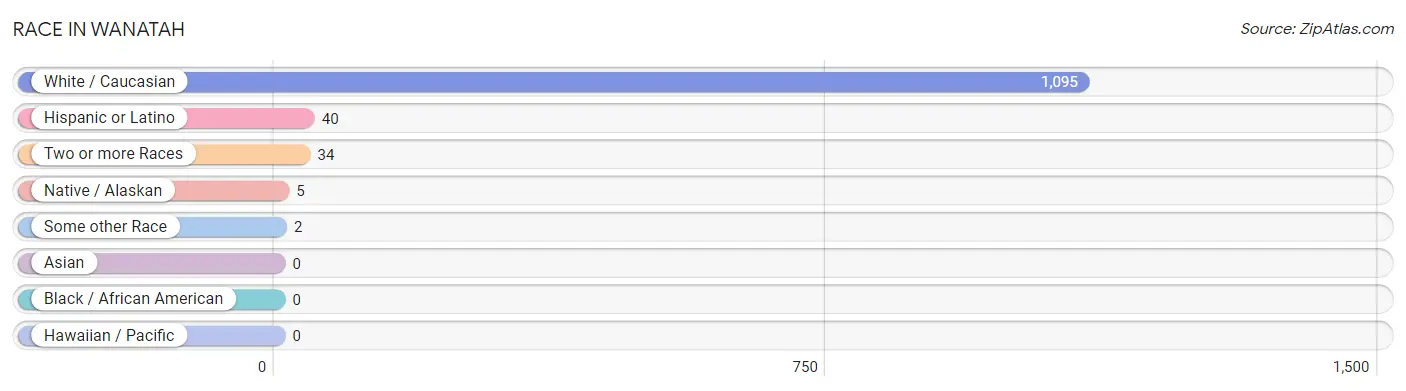
Race in Wanatah
The most populous races in Wanatah are White / Caucasian (1,095 | 96.4%), Hispanic or Latino (40 | 3.5%), and Two or more Races (34 | 3.0%).
| Race | # Population | % Population |
| Asian | 0 | 0.0% |
| Black / African American | 0 | 0.0% |
| Hawaiian / Pacific | 0 | 0.0% |
| Hispanic or Latino | 40 | 3.5% |
| Native / Alaskan | 5 | 0.4% |
| White / Caucasian | 1,095 | 96.4% |
| Two or more Races | 34 | 3.0% |
| Some other Race | 2 | 0.2% |
| Total | 1,136 | 100.0% |
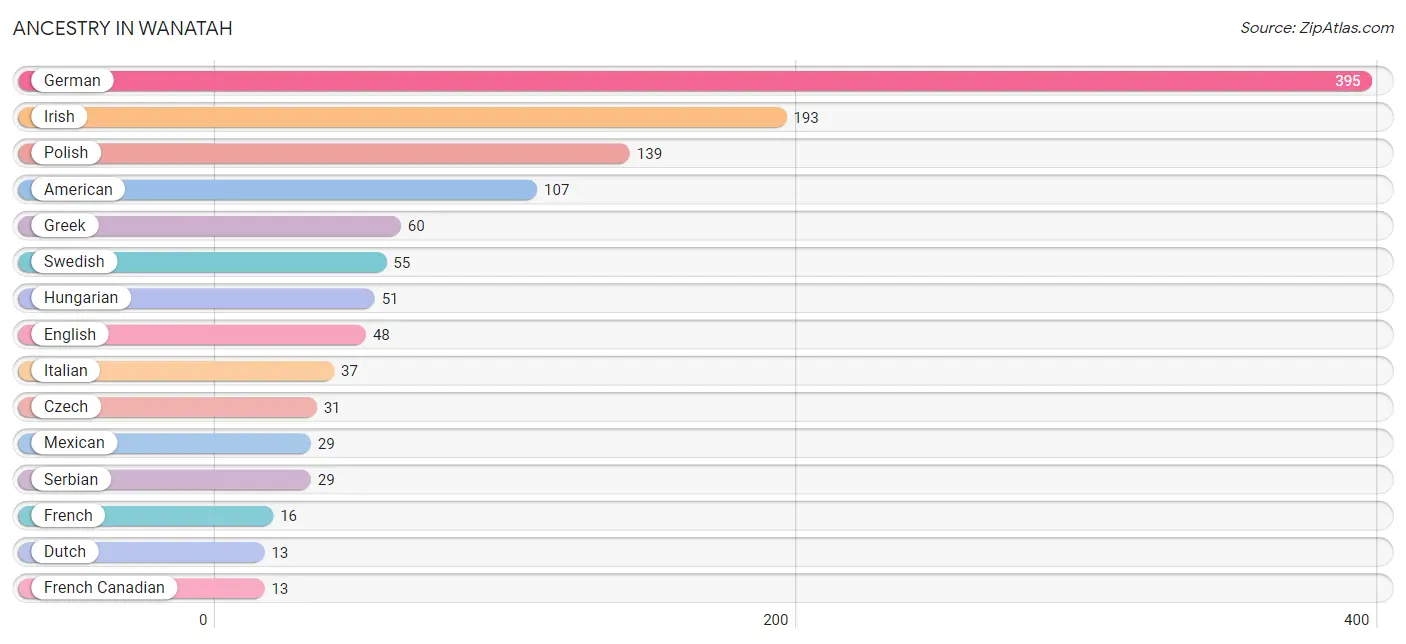
Ancestry in Wanatah
The most populous ancestries reported in Wanatah are German (395 | 34.8%), Irish (193 | 17.0%), Polish (139 | 12.2%), American (107 | 9.4%), and Greek (60 | 5.3%), together accounting for 78.7% of all Wanatah residents.
| Ancestry | # Population | % Population |
| American | 107 | 9.4% |
| Apache | 1 | 0.1% |
| Canadian | 4 | 0.4% |
| Cherokee | 4 | 0.4% |
| Czech | 31 | 2.7% |
| Czechoslovakian | 10 | 0.9% |
| Dominican | 9 | 0.8% |
| Dutch | 13 | 1.1% |
| English | 48 | 4.2% |
| European | 11 | 1.0% |
| French | 16 | 1.4% |
| French American Indian | 4 | 0.4% |
| French Canadian | 13 | 1.1% |
| German | 395 | 34.8% |
| Greek | 60 | 5.3% |
| Hungarian | 51 | 4.5% |
| Irish | 193 | 17.0% |
| Italian | 37 | 3.3% |
| Mexican | 29 | 2.5% |
| Navajo | 2 | 0.2% |
| Norwegian | 8 | 0.7% |
| Polish | 139 | 12.2% |
| Portuguese | 10 | 0.9% |
| Puerto Rican | 2 | 0.2% |
| Russian | 4 | 0.4% |
| Scandinavian | 3 | 0.3% |
| Scottish | 8 | 0.7% |
| Serbian | 29 | 2.5% |
| Sioux | 4 | 0.4% |
| Slovak | 4 | 0.4% |
| Swedish | 55 | 4.8% |
| Ukrainian | 12 | 1.1% | View All 32 Rows |
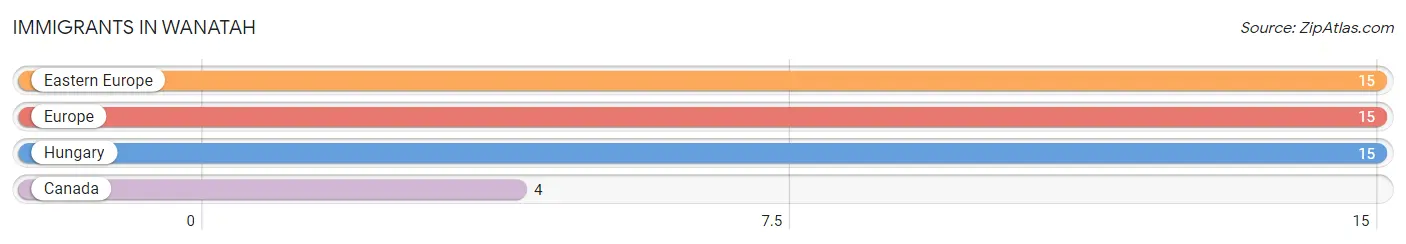
Immigrants in Wanatah
The most numerous immigrant groups reported in Wanatah came from Eastern Europe (15 | 1.3%), Europe (15 | 1.3%), Hungary (15 | 1.3%), and Canada (4 | 0.4%), together accounting for 4.3% of all Wanatah residents.
| Immigration Origin | # Population | % Population |
| Canada | 4 | 0.4% |
| Eastern Europe | 15 | 1.3% |
| Europe | 15 | 1.3% |
| Hungary | 15 | 1.3% | View All 4 Rows |
Sex and Age in Wanatah
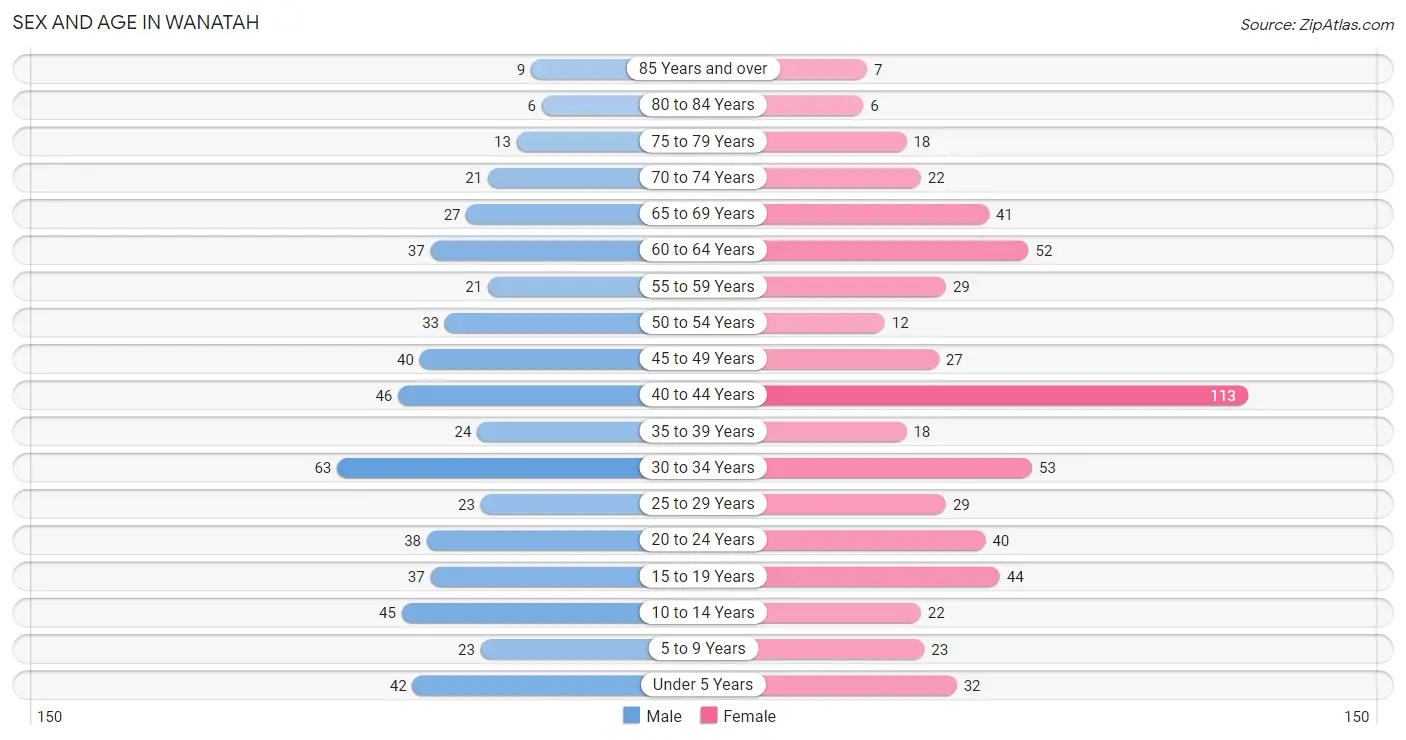
Sex and Age in Wanatah
The most populous age groups in Wanatah are 30 to 34 Years (63 | 11.5%) for men and 40 to 44 Years (113 | 19.2%) for women.
| Age Bracket | Male | Female |
| Under 5 Years | 42 (7.7%) | 32 (5.4%) |
| 5 to 9 Years | 23 (4.2%) | 23 (3.9%) |
| 10 to 14 Years | 45 (8.2%) | 22 (3.7%) |
| 15 to 19 Years | 37 (6.8%) | 44 (7.5%) |
| 20 to 24 Years | 38 (6.9%) | 40 (6.8%) |
| 25 to 29 Years | 23 (4.2%) | 29 (4.9%) |
| 30 to 34 Years | 63 (11.5%) | 53 (9.0%) |
| 35 to 39 Years | 24 (4.4%) | 18 (3.1%) |
| 40 to 44 Years | 46 (8.4%) | 113 (19.2%) |
| 45 to 49 Years | 40 (7.3%) | 27 (4.6%) |
| 50 to 54 Years | 33 (6.0%) | 12 (2.0%) |
| 55 to 59 Years | 21 (3.8%) | 29 (4.9%) |
| 60 to 64 Years | 37 (6.8%) | 52 (8.8%) |
| 65 to 69 Years | 27 (4.9%) | 41 (7.0%) |
| 70 to 74 Years | 21 (3.8%) | 22 (3.7%) |
| 75 to 79 Years | 13 (2.4%) | 18 (3.1%) |
| 80 to 84 Years | 6 (1.1%) | 6 (1.0%) |
| 85 Years and over | 9 (1.6%) | 7 (1.2%) |
| Total | 548 (100.0%) | 588 (100.0%) |
Families and Households in Wanatah
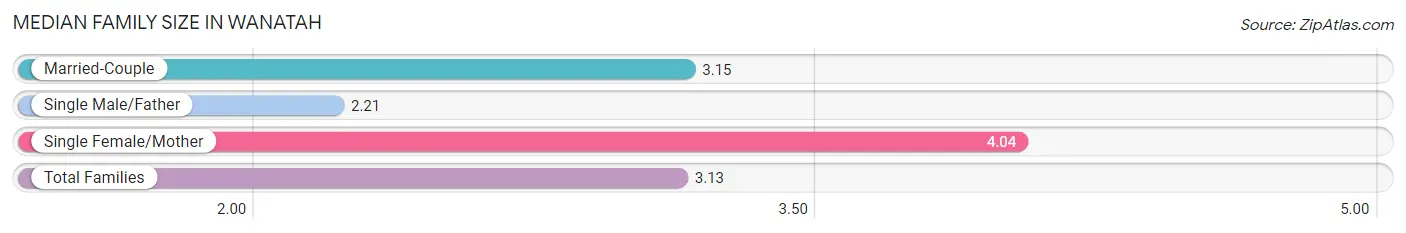
Median Family Size in Wanatah
The median family size in Wanatah is 3.13 persons per family, with single female/mother families (28 | 10.3%) accounting for the largest median family size of 4.04 persons per family. On the other hand, single male/father families (34 | 12.5%) represent the smallest median family size with 2.21 persons per family.
| Family Type | # Families | Family Size |
| Married-Couple | 210 (77.2%) | 3.15 |
| Single Male/Father | 34 (12.5%) | 2.21 |
| Single Female/Mother | 28 (10.3%) | 4.04 |
| Total Families | 272 (100.0%) | 3.13 |
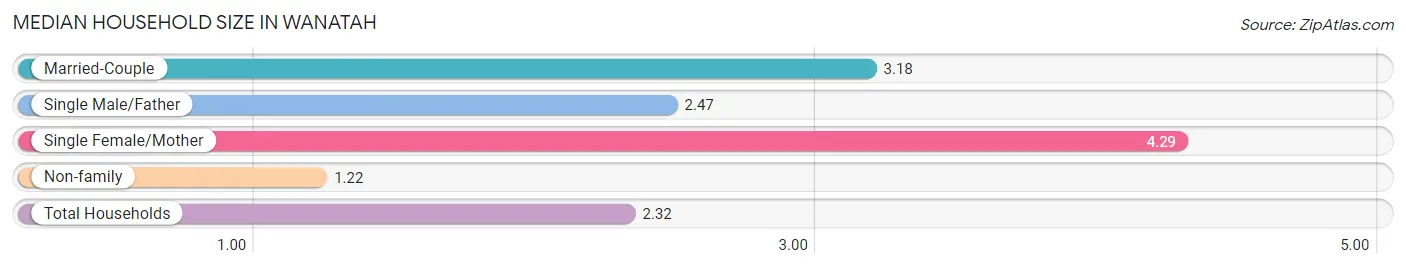
Median Household Size in Wanatah
The median household size in Wanatah is 2.32 persons per household, with single female/mother households (28 | 5.7%) accounting for the largest median household size of 4.29 persons per household. non-family households (217 | 44.4%) represent the smallest median household size with 1.22 persons per household.
| Household Type | # Households | Household Size |
| Married-Couple | 210 (42.9%) | 3.18 |
| Single Male/Father | 34 (7.0%) | 2.47 |
| Single Female/Mother | 28 (5.7%) | 4.29 |
| Non-family | 217 (44.4%) | 1.22 |
| Total Households | 489 (100.0%) | 2.32 |
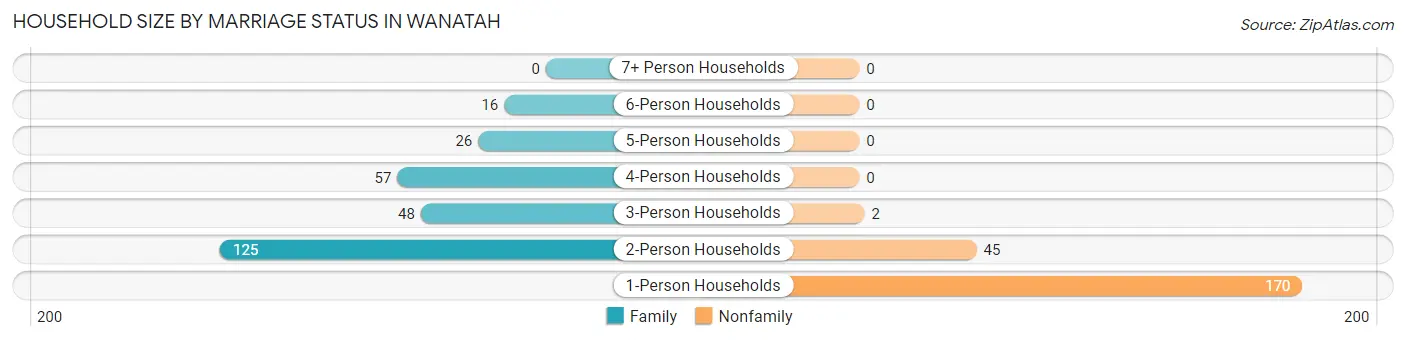
Household Size by Marriage Status in Wanatah
Out of a total of 489 households in Wanatah, 272 (55.6%) are family households, while 217 (44.4%) are nonfamily households. The most numerous type of family households are 2-person households, comprising 125, and the most common type of nonfamily households are 1-person households, comprising 170.
| Household Size | Family Households | Nonfamily Households |
| 1-Person Households | - | 170 (34.8%) |
| 2-Person Households | 125 (25.6%) | 45 (9.2%) |
| 3-Person Households | 48 (9.8%) | 2 (0.4%) |
| 4-Person Households | 57 (11.7%) | 0 (0.0%) |
| 5-Person Households | 26 (5.3%) | 0 (0.0%) |
| 6-Person Households | 16 (3.3%) | 0 (0.0%) |
| 7+ Person Households | 0 (0.0%) | 0 (0.0%) |
| Total | 272 (55.6%) | 217 (44.4%) |
Female Fertility in Wanatah
Fertility by Age in Wanatah
Average fertility rate in Wanatah is 34.0 births per 1,000 women. Women in the age bracket of 20 to 34 years have the highest fertility rate with 90.0 births per 1,000 women. Women in the age bracket of 20 to 34 years acount for 100.0% of all women with births.
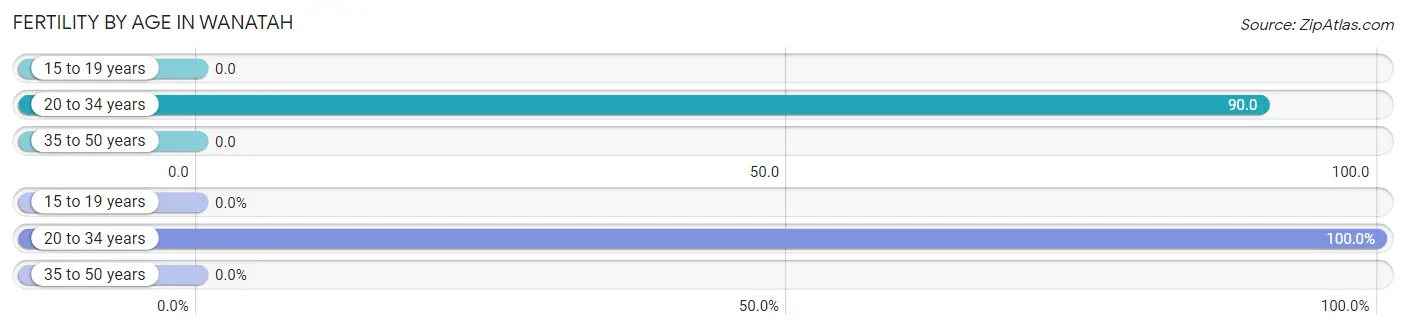
| Age Bracket | Women with Births | Births / 1,000 Women |
| 15 to 19 years | 0 (0.0%) | 0.0 |
| 20 to 34 years | 11 (100.0%) | 90.0 |
| 35 to 50 years | 0 (0.0%) | 0.0 |
| Total | 11 (100.0%) | 34.0 |
Fertility by Age by Marriage Status in Wanatah
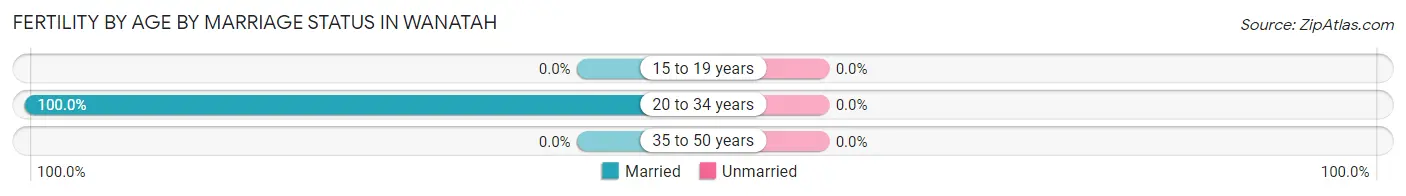
| Age Bracket | Married | Unmarried |
| 15 to 19 years | 0 (0.0%) | 0 (0.0%) |
| 20 to 34 years | 11 (100.0%) | 0 (0.0%) |
| 35 to 50 years | 0 (0.0%) | 0 (0.0%) |
| Total | 11 (100.0%) | 0 (0.0%) |
Fertility by Education in Wanatah
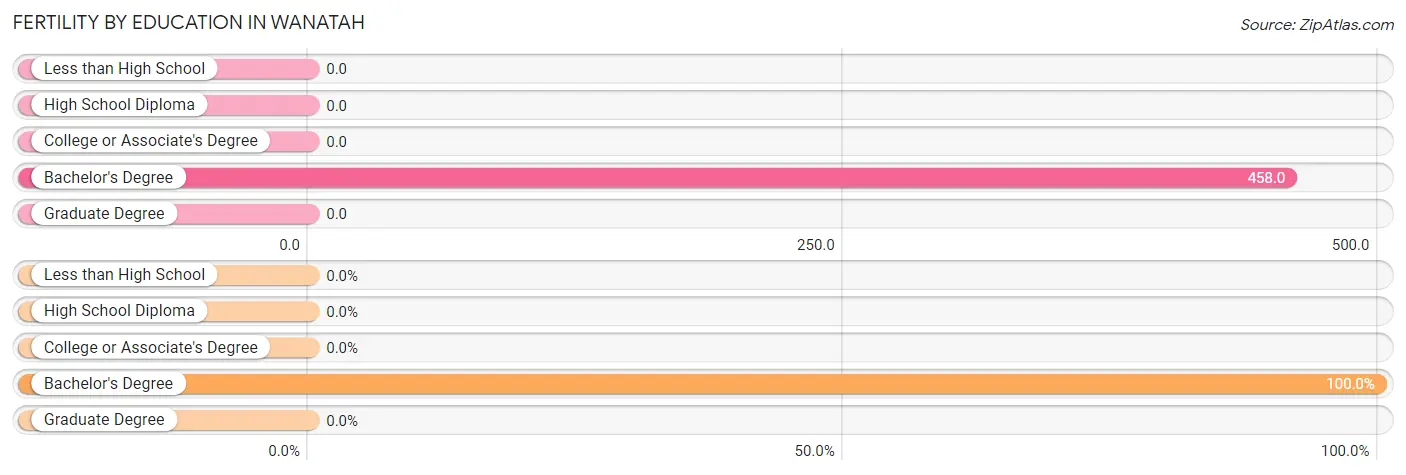
| Educational Attainment | Women with Births | Births / 1,000 Women |
| Less than High School | 0 (0.0%) | 0.0 |
| High School Diploma | 0 (0.0%) | 0.0 |
| College or Associate's Degree | 0 (0.0%) | 0.0 |
| Bachelor's Degree | 11 (100.0%) | 458.0 |
| Graduate Degree | 0 (0.0%) | 0.0 |
| Total | 11 (100.0%) | 34.0 |
Fertility by Education by Marriage Status in Wanatah
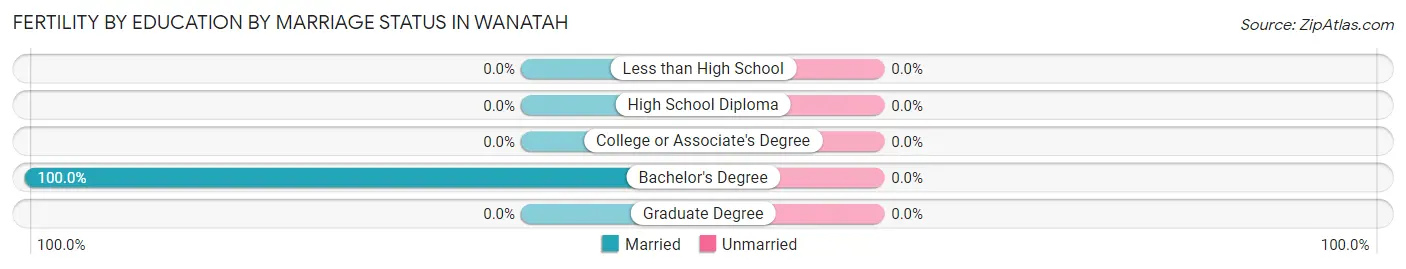
| Educational Attainment | Married | Unmarried |
| Less than High School | 0 (0.0%) | 0 (0.0%) |
| High School Diploma | 0 (0.0%) | 0 (0.0%) |
| College or Associate's Degree | 0 (0.0%) | 0 (0.0%) |
| Bachelor's Degree | 11 (100.0%) | 0 (0.0%) |
| Graduate Degree | 0 (0.0%) | 0 (0.0%) |
| Total | 11 (100.0%) | 0 (0.0%) |
Income in Wanatah
Income Overview in Wanatah
Per Capita Income in Wanatah is $36,311, while median incomes of families and households are $99,688 and $67,917 respectively.
| Characteristic | Number | Measure |
| Per Capita Income | 1,136 | $36,311 |
| Median Family Income | 272 | $99,688 |
| Mean Family Income | 272 | $100,015 |
| Median Household Income | 489 | $67,917 |
| Mean Household Income | 489 | $82,776 |
| Income Deficit | 272 | $0 |
| Wage / Income Gap (%) | 1,136 | 33.97% |
| Wage / Income Gap ($) | 1,136 | 66.03¢ per $1 |
| Gini / Inequality Index | 1,136 | 0.38 |
Earnings by Sex in Wanatah
Average Earnings in Wanatah are $40,149, $53,641 for men and $35,417 for women, a difference of 34.0%.
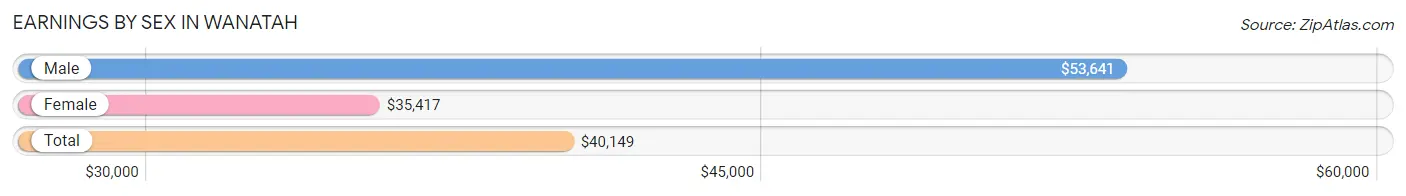
| Sex | Number | Average Earnings |
| Male | 349 (49.1%) | $53,641 |
| Female | 361 (50.8%) | $35,417 |
| Total | 710 (100.0%) | $40,149 |
Earnings by Sex by Income Bracket in Wanatah
The most common earnings brackets in Wanatah are $100,000+ for men (66 | 18.9%) and $40,000 to $44,999 for women (83 | 23.0%).
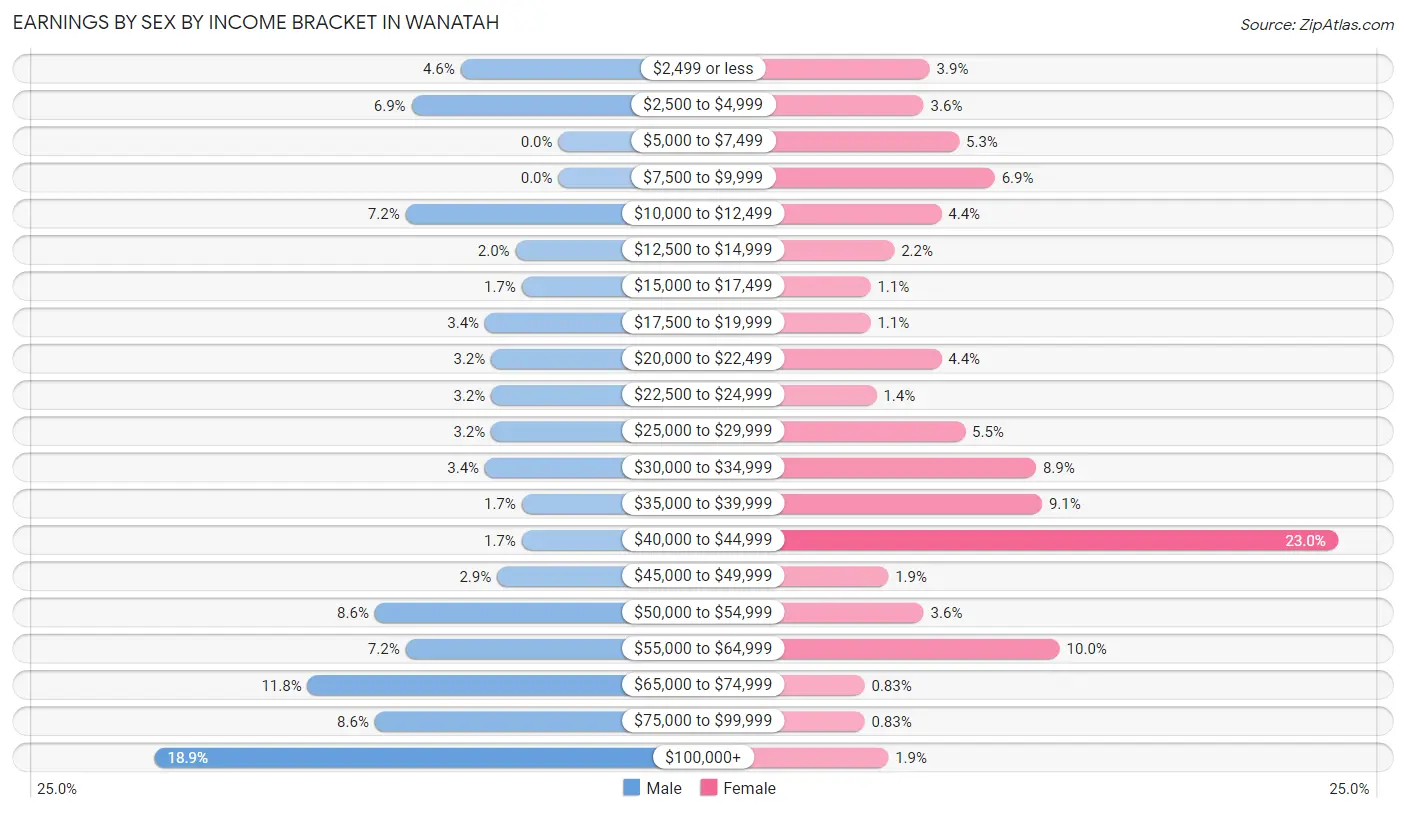
| Income | Male | Female |
| $2,499 or less | 16 (4.6%) | 14 (3.9%) |
| $2,500 to $4,999 | 24 (6.9%) | 13 (3.6%) |
| $5,000 to $7,499 | 0 (0.0%) | 19 (5.3%) |
| $7,500 to $9,999 | 0 (0.0%) | 25 (6.9%) |
| $10,000 to $12,499 | 25 (7.2%) | 16 (4.4%) |
| $12,500 to $14,999 | 7 (2.0%) | 8 (2.2%) |
| $15,000 to $17,499 | 6 (1.7%) | 4 (1.1%) |
| $17,500 to $19,999 | 12 (3.4%) | 4 (1.1%) |
| $20,000 to $22,499 | 11 (3.2%) | 16 (4.4%) |
| $22,500 to $24,999 | 11 (3.2%) | 5 (1.4%) |
| $25,000 to $29,999 | 11 (3.2%) | 20 (5.5%) |
| $30,000 to $34,999 | 12 (3.4%) | 32 (8.9%) |
| $35,000 to $39,999 | 6 (1.7%) | 33 (9.1%) |
| $40,000 to $44,999 | 6 (1.7%) | 83 (23.0%) |
| $45,000 to $49,999 | 10 (2.9%) | 7 (1.9%) |
| $50,000 to $54,999 | 30 (8.6%) | 13 (3.6%) |
| $55,000 to $64,999 | 25 (7.2%) | 36 (10.0%) |
| $65,000 to $74,999 | 41 (11.7%) | 3 (0.8%) |
| $75,000 to $99,999 | 30 (8.6%) | 3 (0.8%) |
| $100,000+ | 66 (18.9%) | 7 (1.9%) |
| Total | 349 (100.0%) | 361 (100.0%) |
Earnings by Sex by Educational Attainment in Wanatah
Average earnings in Wanatah are $57,273 for men and $40,064 for women, a difference of 30.0%. Men with an educational attainment of college or associate's degree enjoy the highest average annual earnings of $70,417, while those with less than high school education earn the least with $23,750. Women with an educational attainment of bachelor's degree earn the most with the average annual earnings of $58,125, while those with high school diploma education have the smallest earnings of $36,667.
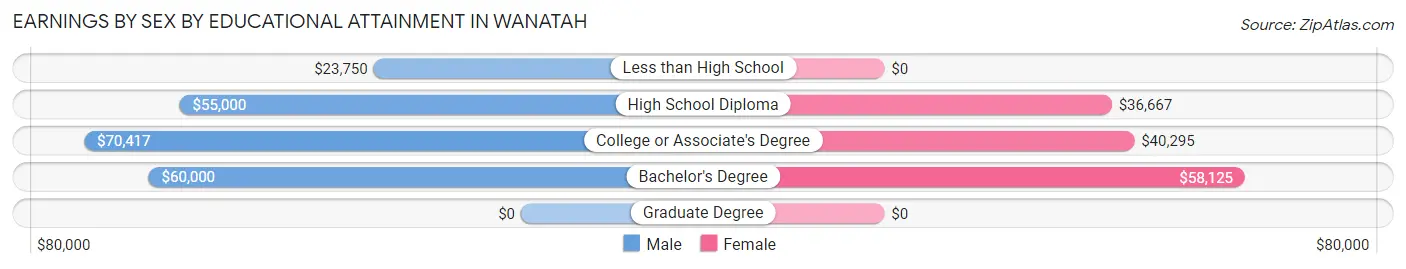
| Educational Attainment | Male Income | Female Income |
| Less than High School | $23,750 | $0 |
| High School Diploma | $55,000 | $36,667 |
| College or Associate's Degree | $70,417 | $40,295 |
| Bachelor's Degree | $60,000 | $58,125 |
| Graduate Degree | - | - |
| Total | $57,273 | $40,064 |
Family Income in Wanatah
Family Income Brackets in Wanatah
According to the Wanatah family income data, there are 115 families falling into the $100,000 to $149,999 income range, which is the most common income bracket and makes up 42.3% of all families.
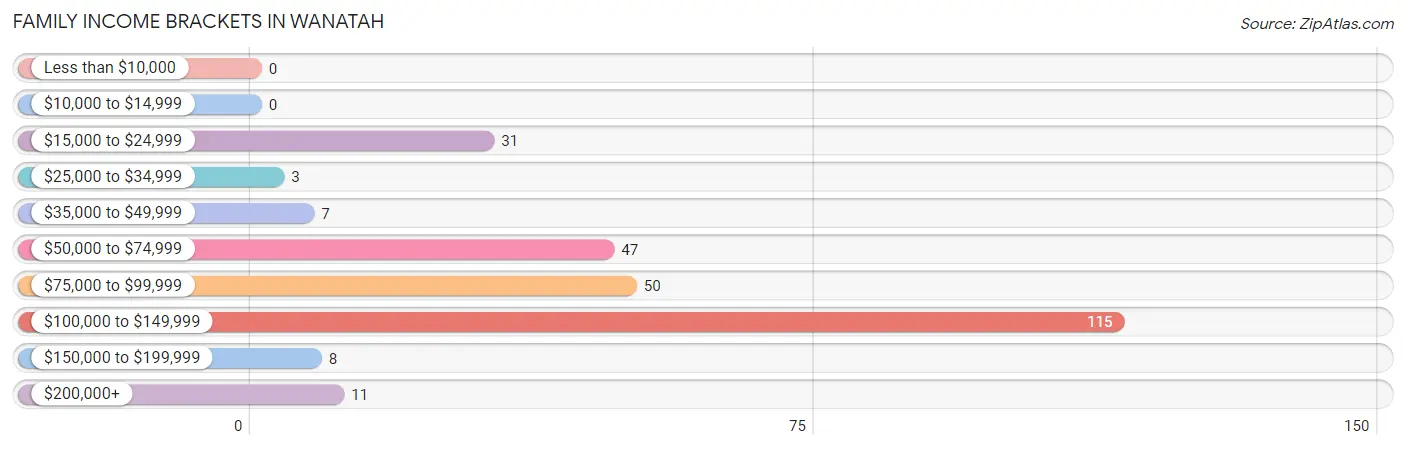
| Income Bracket | # Families | % Families |
| Less than $10,000 | 0 | 0.0% |
| $10,000 to $14,999 | 0 | 0.0% |
| $15,000 to $24,999 | 31 | 11.4% |
| $25,000 to $34,999 | 3 | 1.1% |
| $35,000 to $49,999 | 7 | 2.6% |
| $50,000 to $74,999 | 47 | 17.3% |
| $75,000 to $99,999 | 50 | 18.4% |
| $100,000 to $149,999 | 115 | 42.3% |
| $150,000 to $199,999 | 8 | 2.9% |
| $200,000+ | 11 | 4.0% |
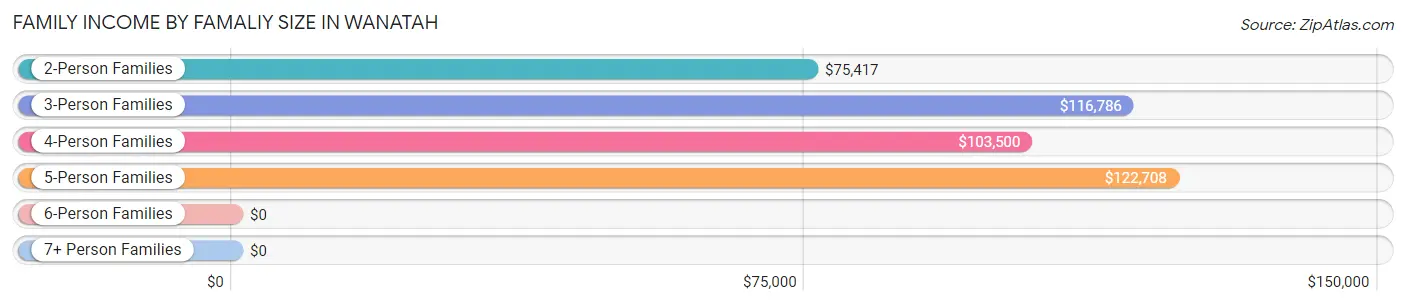
Family Income by Famaliy Size in Wanatah
5-person families (25 | 9.2%) account for the highest median family income in Wanatah with $122,708 per family, while 3-person families (54 | 19.9%) have the highest median income of $38,929 per family member.
| Income Bracket | # Families | Median Income |
| 2-Person Families | 129 (47.4%) | $75,417 |
| 3-Person Families | 54 (19.9%) | $116,786 |
| 4-Person Families | 48 (17.6%) | $103,500 |
| 5-Person Families | 25 (9.2%) | $122,708 |
| 6-Person Families | 16 (5.9%) | $0 |
| 7+ Person Families | 0 (0.0%) | $0 |
| Total | 272 (100.0%) | $99,688 |
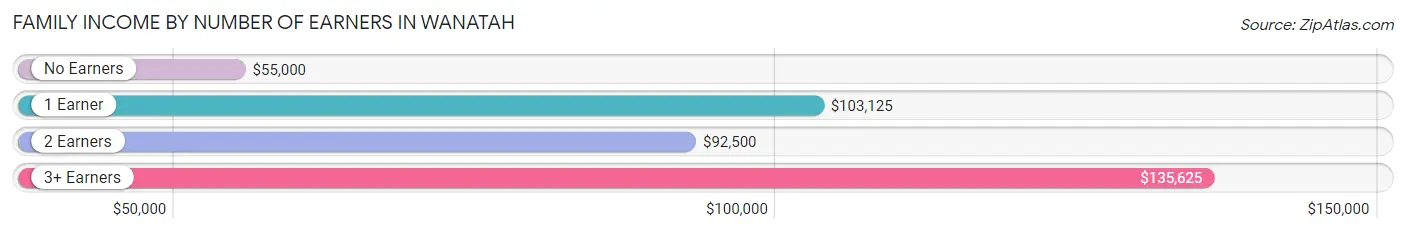
Family Income by Number of Earners in Wanatah
The median family income in Wanatah is $99,688, with families comprising 3+ earners (59) having the highest median family income of $135,625, while families with no earners (40) have the lowest median family income of $55,000, accounting for 21.7% and 14.7% of families, respectively.
| Number of Earners | # Families | Median Income |
| No Earners | 40 (14.7%) | $55,000 |
| 1 Earner | 73 (26.8%) | $103,125 |
| 2 Earners | 100 (36.8%) | $92,500 |
| 3+ Earners | 59 (21.7%) | $135,625 |
| Total | 272 (100.0%) | $99,688 |
Household Income in Wanatah
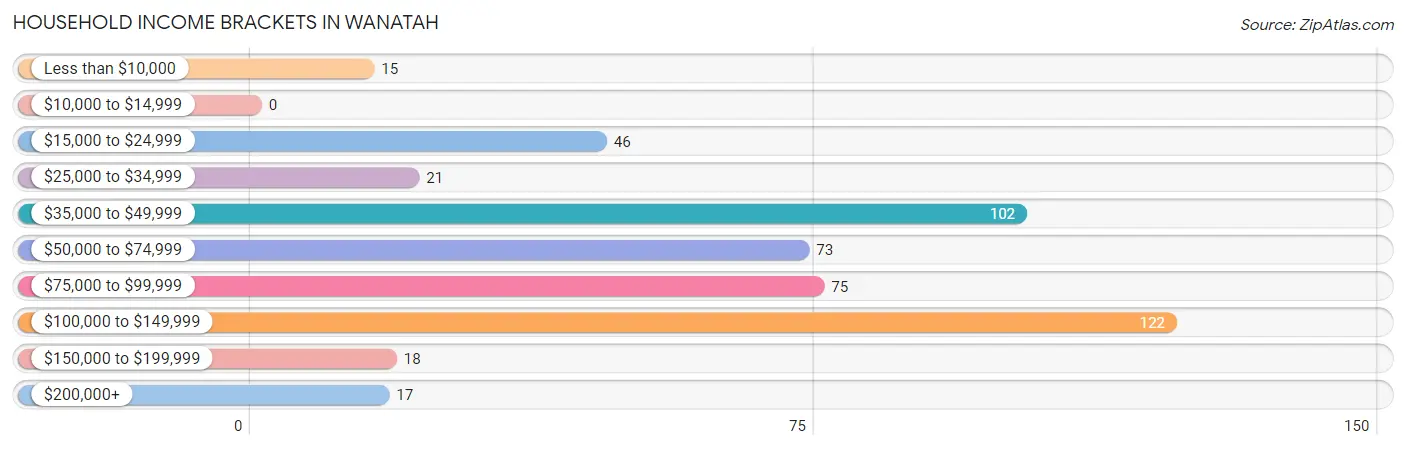
Household Income Brackets in Wanatah
With 122 households falling in the category, the $100,000 to $149,999 income range is the most frequent in Wanatah, accounting for 24.9% of all households.
| Income Bracket | # Households | % Households |
| Less than $10,000 | 15 | 3.1% |
| $10,000 to $14,999 | 0 | 0.0% |
| $15,000 to $24,999 | 46 | 9.4% |
| $25,000 to $34,999 | 21 | 4.3% |
| $35,000 to $49,999 | 102 | 20.9% |
| $50,000 to $74,999 | 73 | 14.9% |
| $75,000 to $99,999 | 75 | 15.3% |
| $100,000 to $149,999 | 122 | 24.9% |
| $150,000 to $199,999 | 18 | 3.7% |
| $200,000+ | 17 | 3.5% |
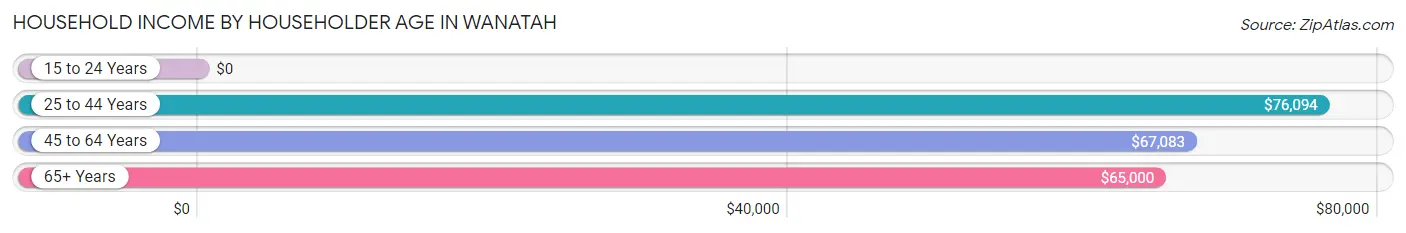
Household Income by Householder Age in Wanatah
The median household income in Wanatah is $67,917, with the highest median household income of $76,094 found in the 25 to 44 years age bracket for the primary householder. A total of 197 households (40.3%) fall into this category. Meanwhile, the 15 to 24 years age bracket for the primary householder has the lowest median household income of $0, with 17 households (3.5%) in this group.
| Income Bracket | # Households | Median Income |
| 15 to 24 Years | 17 (3.5%) | $0 |
| 25 to 44 Years | 197 (40.3%) | $76,094 |
| 45 to 64 Years | 163 (33.3%) | $67,083 |
| 65+ Years | 112 (22.9%) | $65,000 |
| Total | 489 (100.0%) | $67,917 |
Poverty in Wanatah
Income Below Poverty by Sex and Age in Wanatah
With 13.5% poverty level for males and 15.7% for females among the residents of Wanatah, 12 to 14 year old males and 15 year old females are the most vulnerable to poverty, with 14 males (51.8%) and 12 females (100.0%) in their respective age groups living below the poverty level.
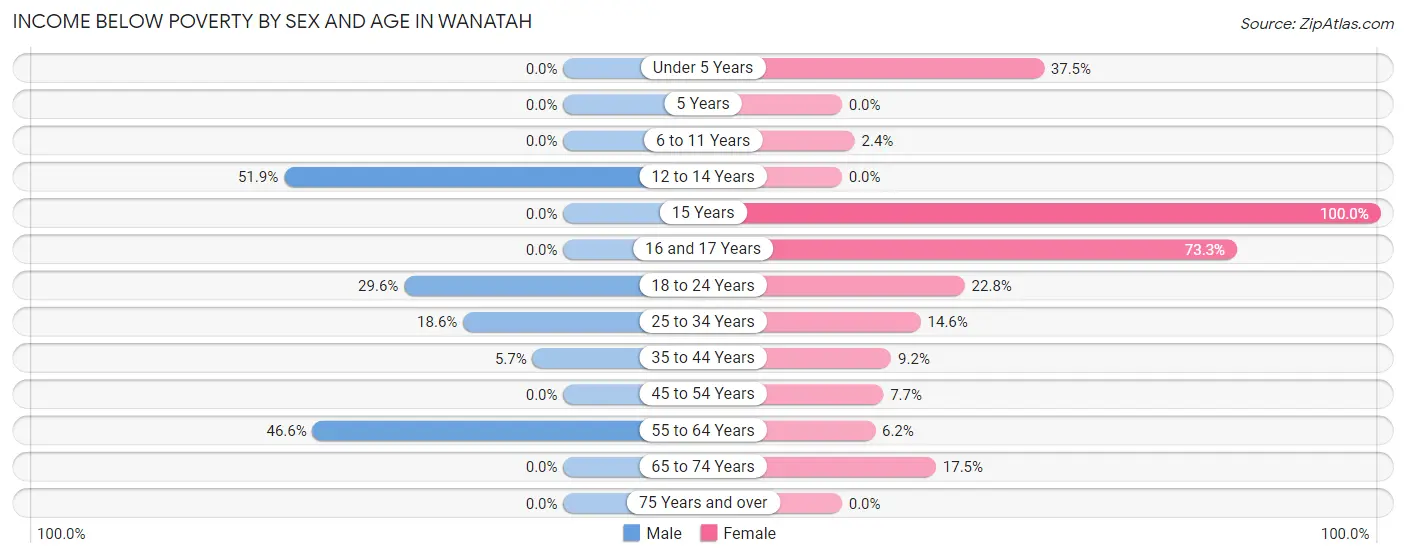
| Age Bracket | Male | Female |
| Under 5 Years | 0 (0.0%) | 12 (37.5%) |
| 5 Years | 0 (0.0%) | 0 (0.0%) |
| 6 to 11 Years | 0 (0.0%) | 1 (2.4%) |
| 12 to 14 Years | 14 (51.8%) | 0 (0.0%) |
| 15 Years | 0 (0.0%) | 12 (100.0%) |
| 16 and 17 Years | 0 (0.0%) | 11 (73.3%) |
| 18 to 24 Years | 13 (29.5%) | 13 (22.8%) |
| 25 to 34 Years | 16 (18.6%) | 12 (14.6%) |
| 35 to 44 Years | 4 (5.7%) | 12 (9.2%) |
| 45 to 54 Years | 0 (0.0%) | 3 (7.7%) |
| 55 to 64 Years | 27 (46.6%) | 5 (6.2%) |
| 65 to 74 Years | 0 (0.0%) | 11 (17.5%) |
| 75 Years and over | 0 (0.0%) | 0 (0.0%) |
| Total | 74 (13.5%) | 92 (15.7%) |
Income Above Poverty by Sex and Age in Wanatah
According to the poverty statistics in Wanatah, males aged under 5 years and females aged 5 years are the age groups that are most secure financially, with 100.0% of males and 100.0% of females in these age groups living above the poverty line.
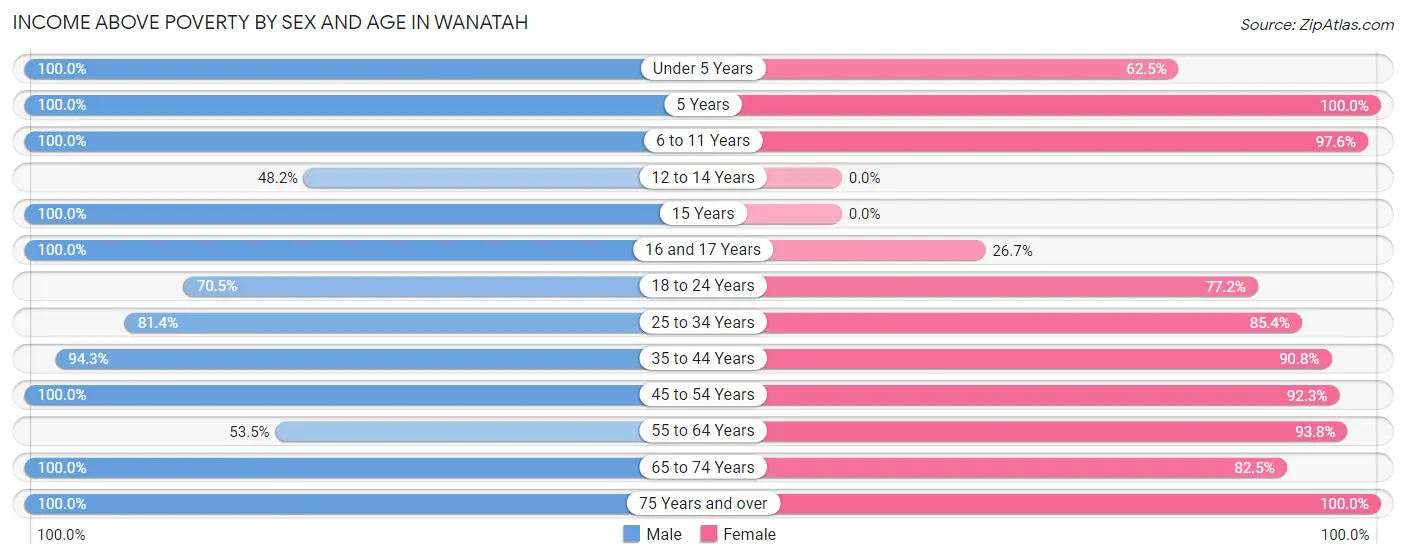
| Age Bracket | Male | Female |
| Under 5 Years | 42 (100.0%) | 20 (62.5%) |
| 5 Years | 4 (100.0%) | 3 (100.0%) |
| 6 to 11 Years | 37 (100.0%) | 41 (97.6%) |
| 12 to 14 Years | 13 (48.1%) | 0 (0.0%) |
| 15 Years | 11 (100.0%) | 0 (0.0%) |
| 16 and 17 Years | 20 (100.0%) | 4 (26.7%) |
| 18 to 24 Years | 31 (70.5%) | 44 (77.2%) |
| 25 to 34 Years | 70 (81.4%) | 70 (85.4%) |
| 35 to 44 Years | 66 (94.3%) | 119 (90.8%) |
| 45 to 54 Years | 73 (100.0%) | 36 (92.3%) |
| 55 to 64 Years | 31 (53.4%) | 76 (93.8%) |
| 65 to 74 Years | 48 (100.0%) | 52 (82.5%) |
| 75 Years and over | 28 (100.0%) | 31 (100.0%) |
| Total | 474 (86.5%) | 496 (84.4%) |
Income Below Poverty Among Married-Couple Families in Wanatah
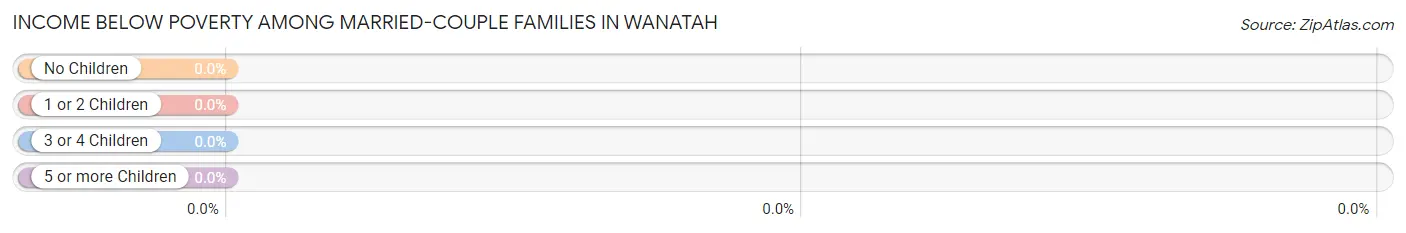
| Children | Above Poverty | Below Poverty |
| No Children | 123 (100.0%) | 0 (0.0%) |
| 1 or 2 Children | 81 (100.0%) | 0 (0.0%) |
| 3 or 4 Children | 6 (100.0%) | 0 (0.0%) |
| 5 or more Children | 0 (0.0%) | 0 (0.0%) |
| Total | 210 (100.0%) | 0 (0.0%) |
Income Below Poverty Among Single-Parent Households in Wanatah
According to the poverty data in Wanatah, 44.1% or 15 single-father households and 57.1% or 16 single-mother households are living below the poverty line. Among single-father households, those with no children have the highest poverty rate, with 15 households (78.9%) experiencing poverty. Likewise, among single-mother households, those with 3 or 4 children have the highest poverty rate, with 11 households (100.0%) falling below the poverty line.
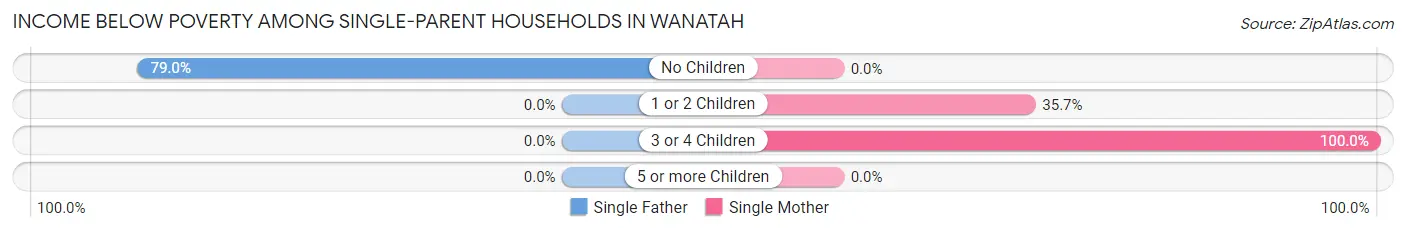
| Children | Single Father | Single Mother |
| No Children | 15 (78.9%) | 0 (0.0%) |
| 1 or 2 Children | 0 (0.0%) | 5 (35.7%) |
| 3 or 4 Children | 0 (0.0%) | 11 (100.0%) |
| 5 or more Children | 0 (0.0%) | 0 (0.0%) |
| Total | 15 (44.1%) | 16 (57.1%) |
Income Below Poverty Among Married-Couple vs Single-Parent Households in Wanatah
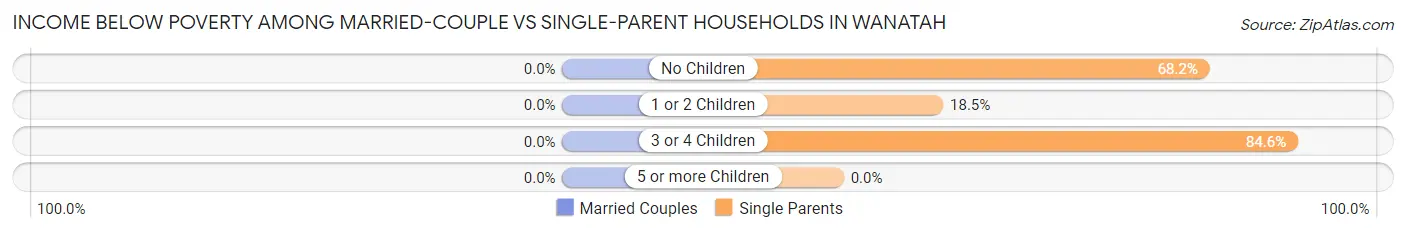
| Children | Married-Couple Families | Single-Parent Households |
| No Children | 0 (0.0%) | 15 (68.2%) |
| 1 or 2 Children | 0 (0.0%) | 5 (18.5%) |
| 3 or 4 Children | 0 (0.0%) | 11 (84.6%) |
| 5 or more Children | 0 (0.0%) | 0 (0.0%) |
| Total | 0 (0.0%) | 31 (50.0%) |
Employment Characteristics in Wanatah
Employment by Class of Employer in Wanatah
Among the 637 employed individuals in Wanatah, private company employees (474 | 74.4%), not-for-profit organizations (68 | 10.7%), and local government employees (35 | 5.5%) make up the most common classes of employment.
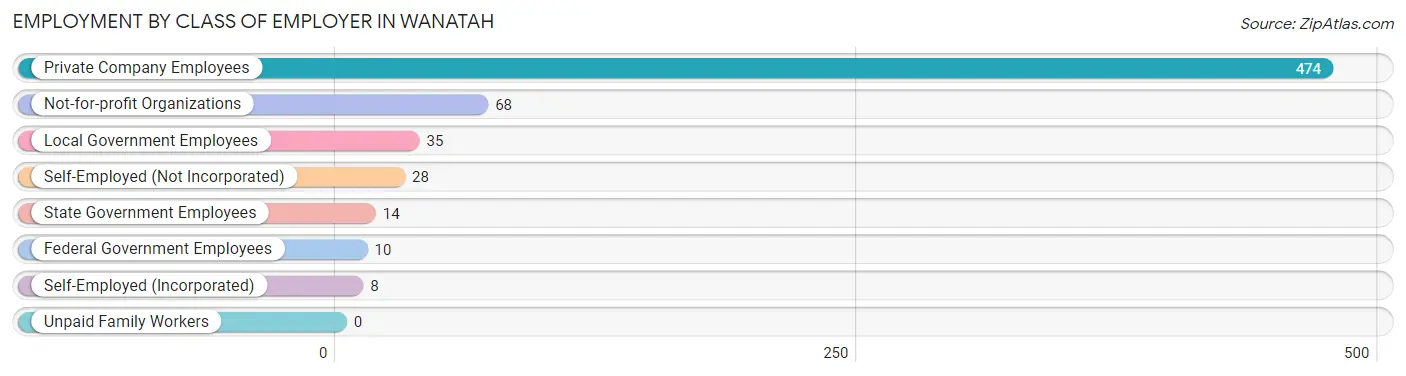
| Employer Class | # Employees | % Employees |
| Private Company Employees | 474 | 74.4% |
| Self-Employed (Incorporated) | 8 | 1.3% |
| Self-Employed (Not Incorporated) | 28 | 4.4% |
| Not-for-profit Organizations | 68 | 10.7% |
| Local Government Employees | 35 | 5.5% |
| State Government Employees | 14 | 2.2% |
| Federal Government Employees | 10 | 1.6% |
| Unpaid Family Workers | 0 | 0.0% |
| Total | 637 | 100.0% |
Employment Status by Age in Wanatah
According to the labor force statistics for Wanatah, out of the total population over 16 years of age (926), 74.2% or 687 individuals are in the labor force, with 6.3% or 43 of them unemployed. The age group with the highest labor force participation rate is 20 to 24 years, with 100.0% or 78 individuals in the labor force. Within the labor force, the 55 to 59 years age range has the highest percentage of unemployed individuals, with 27.3% or 12 of them being unemployed.
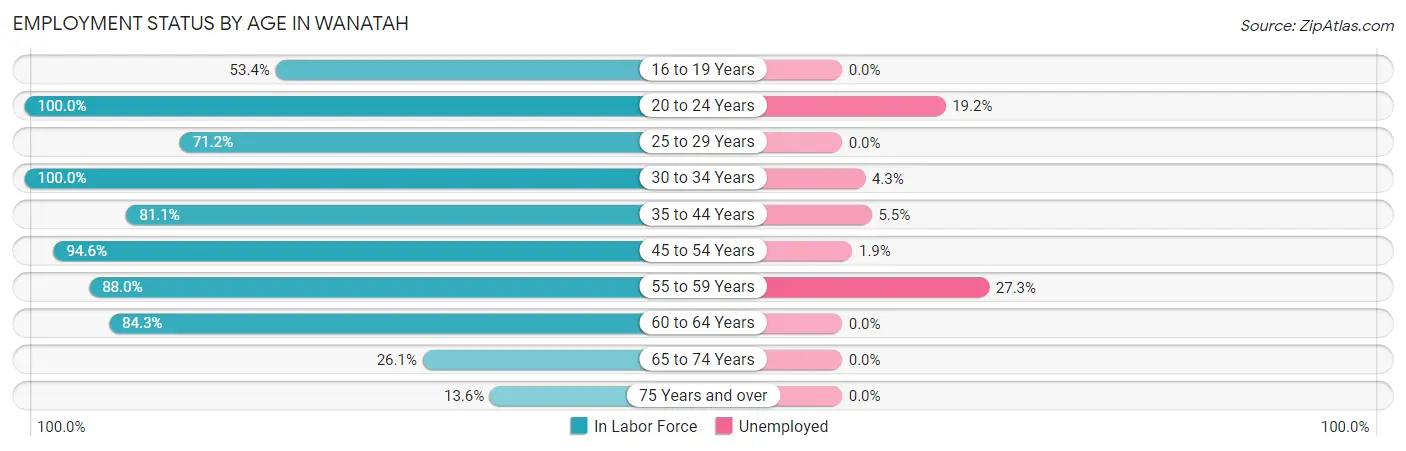
| Age Bracket | In Labor Force | Unemployed |
| 16 to 19 Years | 31 (53.4%) | 0 (0.0%) |
| 20 to 24 Years | 78 (100.0%) | 15 (19.2%) |
| 25 to 29 Years | 37 (71.2%) | 0 (0.0%) |
| 30 to 34 Years | 116 (100.0%) | 5 (4.3%) |
| 35 to 44 Years | 163 (81.1%) | 9 (5.5%) |
| 45 to 54 Years | 106 (94.6%) | 2 (1.9%) |
| 55 to 59 Years | 44 (88.0%) | 12 (27.3%) |
| 60 to 64 Years | 75 (84.3%) | 0 (0.0%) |
| 65 to 74 Years | 29 (26.1%) | 0 (0.0%) |
| 75 Years and over | 8 (13.6%) | 0 (0.0%) |
| Total | 687 (74.2%) | 43 (6.3%) |
Employment Status by Educational Attainment in Wanatah
According to labor force statistics for Wanatah, 87.3% of individuals (541) out of the total population between 25 and 64 years of age (620) are in the labor force, with 5.2% or 28 of them being unemployed. The group with the highest labor force participation rate are those with the educational attainment of high school diploma, with 93.9% or 260 individuals in the labor force. Within the labor force, individuals with high school diploma education have the highest percentage of unemployment, with 6.9% or 18 of them being unemployed.
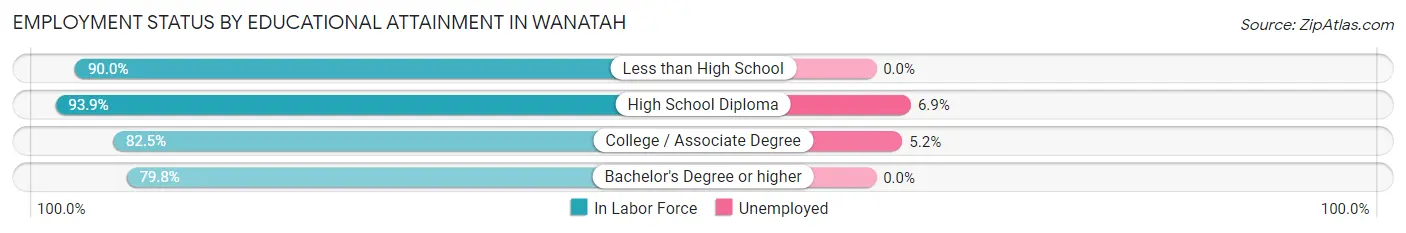
| Educational Attainment | In Labor Force | Unemployed |
| Less than High School | 9 (90.0%) | 0 (0.0%) |
| High School Diploma | 260 (93.9%) | 19 (6.9%) |
| College / Associate Degree | 193 (82.5%) | 12 (5.2%) |
| Bachelor's Degree or higher | 79 (79.8%) | 0 (0.0%) |
| Total | 541 (87.3%) | 32 (5.2%) |
Employment Occupations by Sex in Wanatah
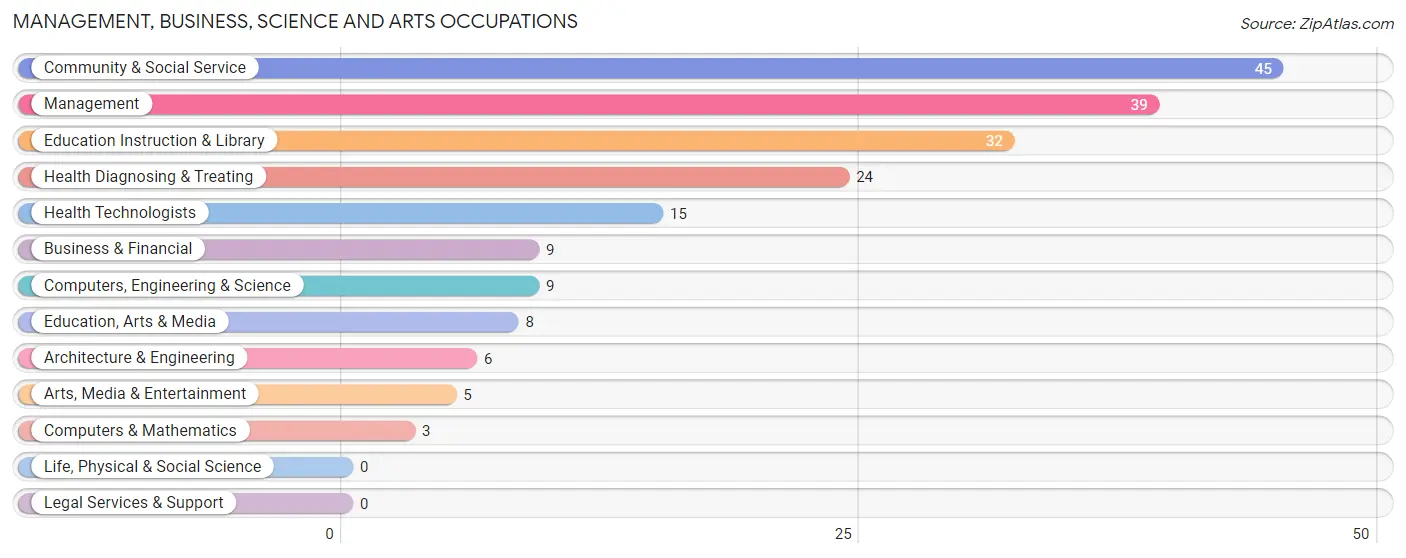
Management, Business, Science and Arts Occupations
The most common Management, Business, Science and Arts occupations in Wanatah are Community & Social Service (45 | 7.0%), Management (39 | 6.1%), Education Instruction & Library (32 | 5.0%), Health Diagnosing & Treating (24 | 3.7%), and Health Technologists (15 | 2.3%).
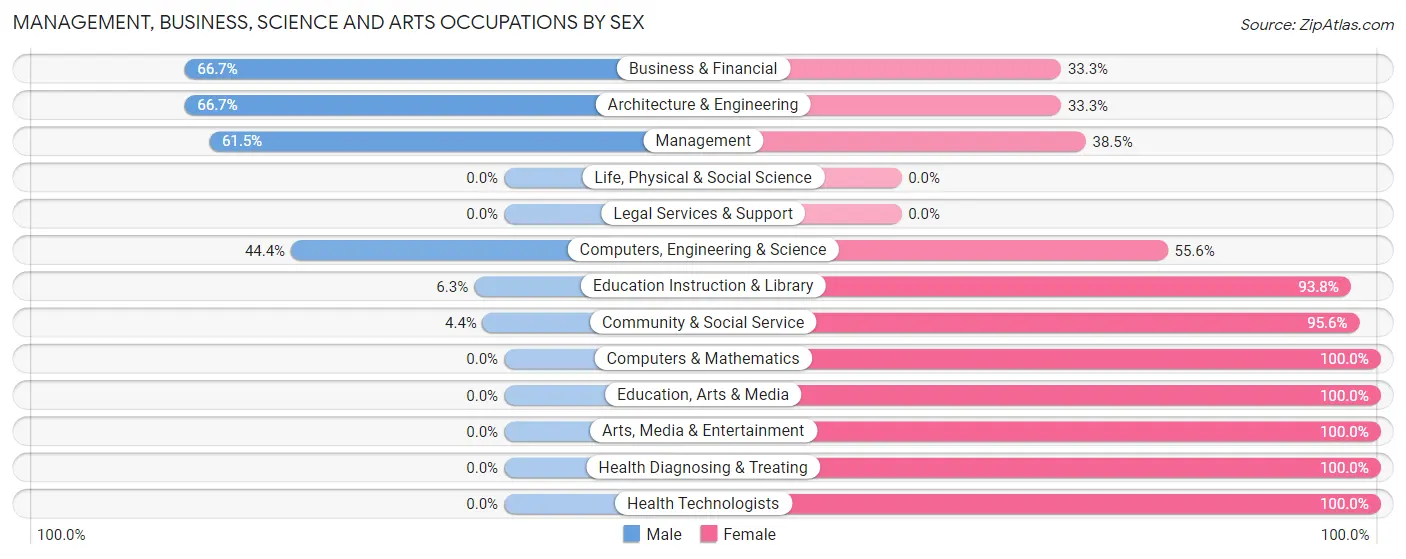
Management, Business, Science and Arts Occupations by Sex
Within the Management, Business, Science and Arts occupations in Wanatah, the most male-oriented occupations are Business & Financial (66.7%), Architecture & Engineering (66.7%), and Management (61.5%), while the most female-oriented occupations are Computers & Mathematics (100.0%), Education, Arts & Media (100.0%), and Arts, Media & Entertainment (100.0%).
| Occupation | Male | Female |
| Management | 24 (61.5%) | 15 (38.5%) |
| Business & Financial | 6 (66.7%) | 3 (33.3%) |
| Computers, Engineering & Science | 4 (44.4%) | 5 (55.6%) |
| Computers & Mathematics | 0 (0.0%) | 3 (100.0%) |
| Architecture & Engineering | 4 (66.7%) | 2 (33.3%) |
| Life, Physical & Social Science | 0 (0.0%) | 0 (0.0%) |
| Community & Social Service | 2 (4.4%) | 43 (95.6%) |
| Education, Arts & Media | 0 (0.0%) | 8 (100.0%) |
| Legal Services & Support | 0 (0.0%) | 0 (0.0%) |
| Education Instruction & Library | 2 (6.2%) | 30 (93.8%) |
| Arts, Media & Entertainment | 0 (0.0%) | 5 (100.0%) |
| Health Diagnosing & Treating | 0 (0.0%) | 24 (100.0%) |
| Health Technologists | 0 (0.0%) | 15 (100.0%) |
| Total (Category) | 36 (28.6%) | 90 (71.4%) |
| Total (Overall) | 313 (48.6%) | 331 (51.4%) |
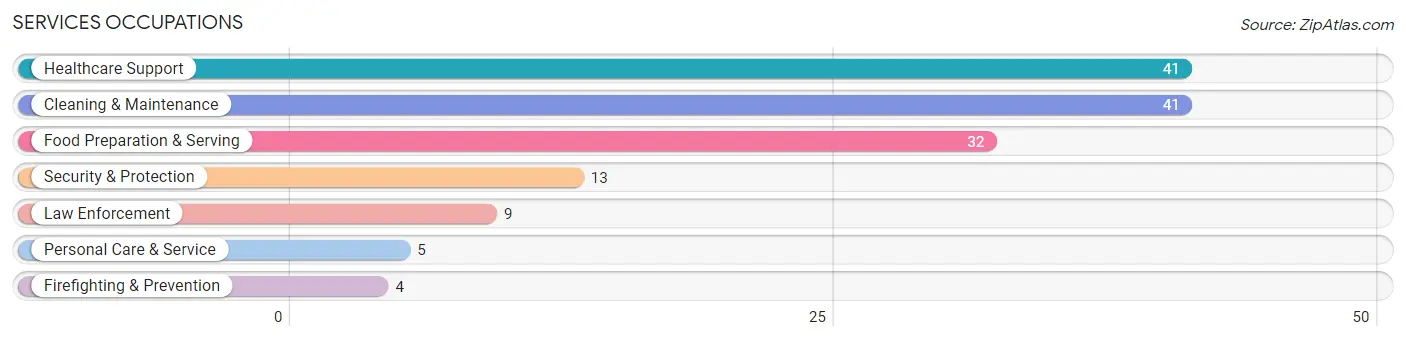
Services Occupations
The most common Services occupations in Wanatah are Healthcare Support (41 | 6.4%), Cleaning & Maintenance (41 | 6.4%), Food Preparation & Serving (32 | 5.0%), Security & Protection (13 | 2.0%), and Law Enforcement (9 | 1.4%).
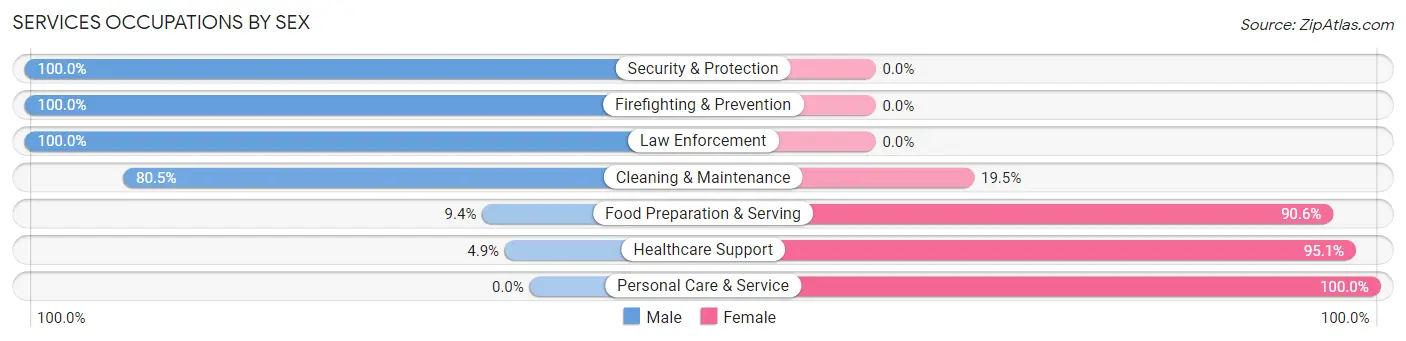
Services Occupations by Sex
Within the Services occupations in Wanatah, the most male-oriented occupations are Security & Protection (100.0%), Firefighting & Prevention (100.0%), and Law Enforcement (100.0%), while the most female-oriented occupations are Personal Care & Service (100.0%), Healthcare Support (95.1%), and Food Preparation & Serving (90.6%).
| Occupation | Male | Female |
| Healthcare Support | 2 (4.9%) | 39 (95.1%) |
| Security & Protection | 13 (100.0%) | 0 (0.0%) |
| Firefighting & Prevention | 4 (100.0%) | 0 (0.0%) |
| Law Enforcement | 9 (100.0%) | 0 (0.0%) |
| Food Preparation & Serving | 3 (9.4%) | 29 (90.6%) |
| Cleaning & Maintenance | 33 (80.5%) | 8 (19.5%) |
| Personal Care & Service | 0 (0.0%) | 5 (100.0%) |
| Total (Category) | 51 (38.6%) | 81 (61.4%) |
| Total (Overall) | 313 (48.6%) | 331 (51.4%) |
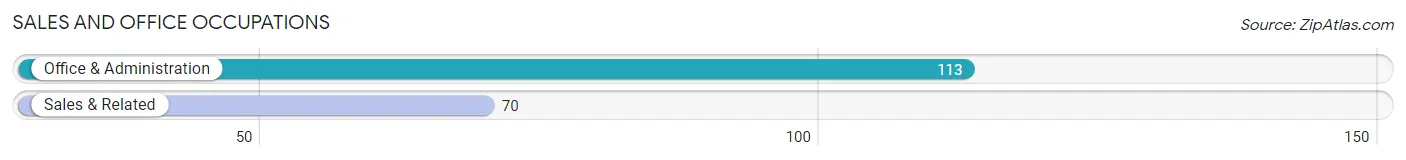
Sales and Office Occupations
The most common Sales and Office occupations in Wanatah are Office & Administration (113 | 17.5%), and Sales & Related (70 | 10.9%).
Sales and Office Occupations by Sex
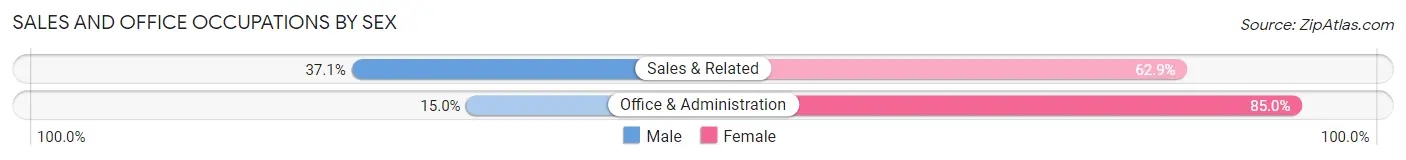
| Occupation | Male | Female |
| Sales & Related | 26 (37.1%) | 44 (62.9%) |
| Office & Administration | 17 (15.0%) | 96 (85.0%) |
| Total (Category) | 43 (23.5%) | 140 (76.5%) |
| Total (Overall) | 313 (48.6%) | 331 (51.4%) |
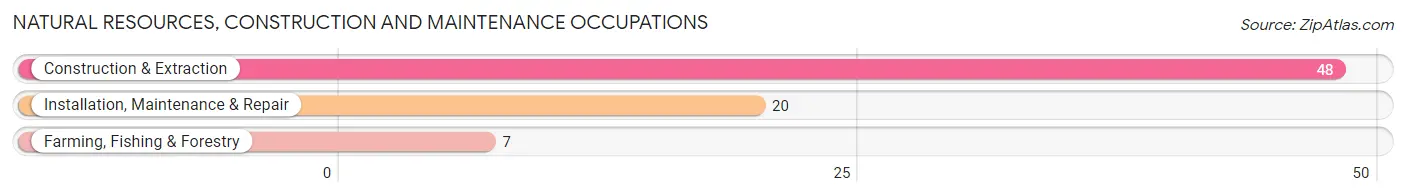
Natural Resources, Construction and Maintenance Occupations
The most common Natural Resources, Construction and Maintenance occupations in Wanatah are Construction & Extraction (48 | 7.4%), Installation, Maintenance & Repair (20 | 3.1%), and Farming, Fishing & Forestry (7 | 1.1%).
Natural Resources, Construction and Maintenance Occupations by Sex
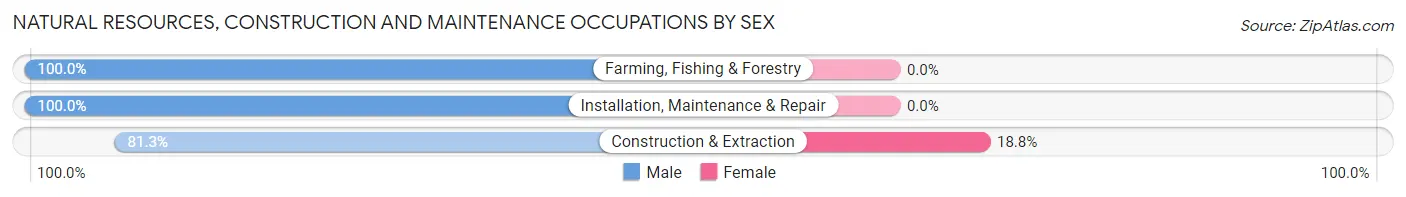
| Occupation | Male | Female |
| Farming, Fishing & Forestry | 7 (100.0%) | 0 (0.0%) |
| Construction & Extraction | 39 (81.2%) | 9 (18.8%) |
| Installation, Maintenance & Repair | 20 (100.0%) | 0 (0.0%) |
| Total (Category) | 66 (88.0%) | 9 (12.0%) |
| Total (Overall) | 313 (48.6%) | 331 (51.4%) |
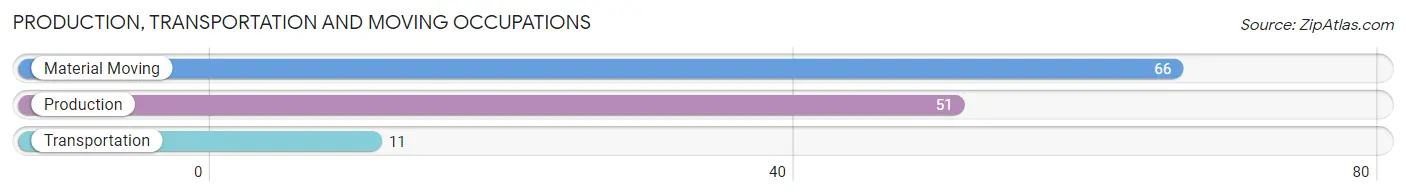
Production, Transportation and Moving Occupations
The most common Production, Transportation and Moving occupations in Wanatah are Material Moving (66 | 10.2%), Production (51 | 7.9%), and Transportation (11 | 1.7%).
Production, Transportation and Moving Occupations by Sex
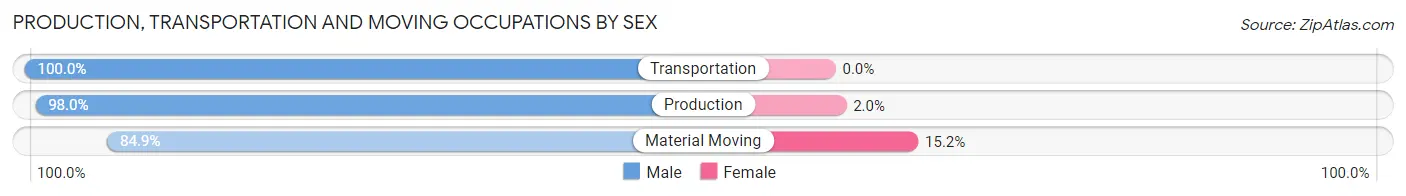
| Occupation | Male | Female |
| Production | 50 (98.0%) | 1 (2.0%) |
| Transportation | 11 (100.0%) | 0 (0.0%) |
| Material Moving | 56 (84.9%) | 10 (15.1%) |
| Total (Category) | 117 (91.4%) | 11 (8.6%) |
| Total (Overall) | 313 (48.6%) | 331 (51.4%) |
Employment Industries by Sex in Wanatah
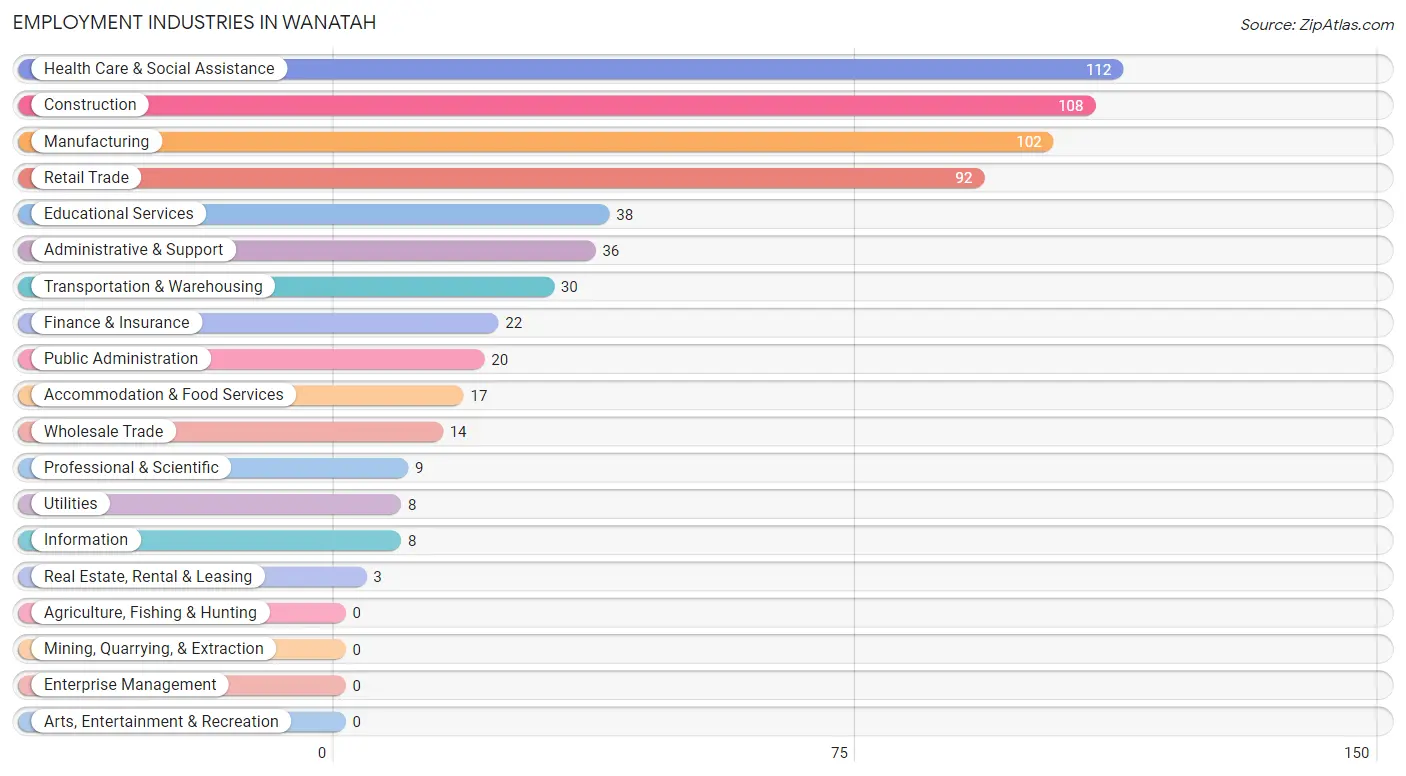
Employment Industries in Wanatah
The major employment industries in Wanatah include Health Care & Social Assistance (112 | 17.4%), Construction (108 | 16.8%), Manufacturing (102 | 15.8%), Retail Trade (92 | 14.3%), and Educational Services (38 | 5.9%).
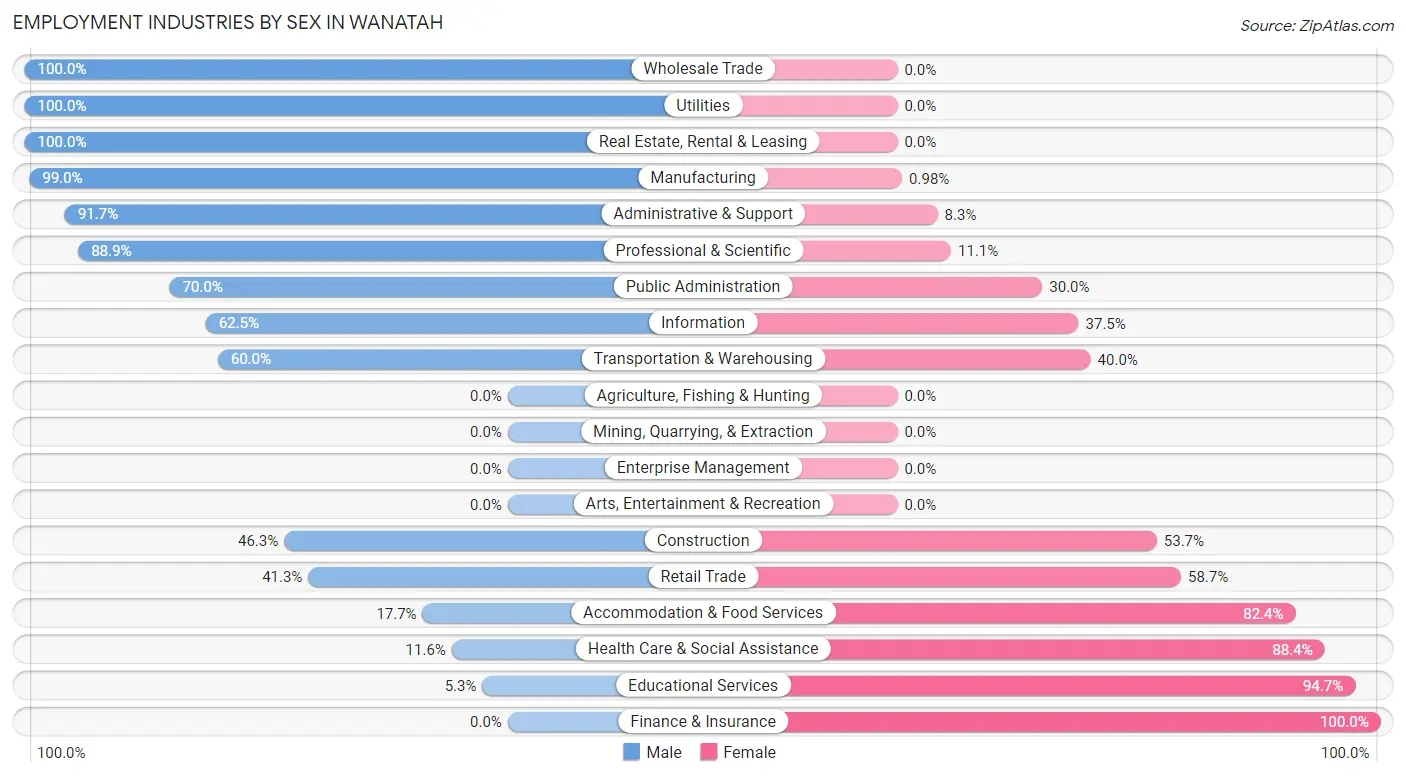
Employment Industries by Sex in Wanatah
The Wanatah industries that see more men than women are Wholesale Trade (100.0%), Utilities (100.0%), and Real Estate, Rental & Leasing (100.0%), whereas the industries that tend to have a higher number of women are Finance & Insurance (100.0%), Educational Services (94.7%), and Health Care & Social Assistance (88.4%).
| Industry | Male | Female |
| Agriculture, Fishing & Hunting | 0 (0.0%) | 0 (0.0%) |
| Mining, Quarrying, & Extraction | 0 (0.0%) | 0 (0.0%) |
| Construction | 50 (46.3%) | 58 (53.7%) |
| Manufacturing | 101 (99.0%) | 1 (1.0%) |
| Wholesale Trade | 14 (100.0%) | 0 (0.0%) |
| Retail Trade | 38 (41.3%) | 54 (58.7%) |
| Transportation & Warehousing | 18 (60.0%) | 12 (40.0%) |
| Utilities | 8 (100.0%) | 0 (0.0%) |
| Information | 5 (62.5%) | 3 (37.5%) |
| Finance & Insurance | 0 (0.0%) | 22 (100.0%) |
| Real Estate, Rental & Leasing | 3 (100.0%) | 0 (0.0%) |
| Professional & Scientific | 8 (88.9%) | 1 (11.1%) |
| Enterprise Management | 0 (0.0%) | 0 (0.0%) |
| Administrative & Support | 33 (91.7%) | 3 (8.3%) |
| Educational Services | 2 (5.3%) | 36 (94.7%) |
| Health Care & Social Assistance | 13 (11.6%) | 99 (88.4%) |
| Arts, Entertainment & Recreation | 0 (0.0%) | 0 (0.0%) |
| Accommodation & Food Services | 3 (17.6%) | 14 (82.4%) |
| Public Administration | 14 (70.0%) | 6 (30.0%) |
| Total | 313 (48.6%) | 331 (51.4%) |
Education in Wanatah
School Enrollment in Wanatah
The most common levels of schooling among the 260 students in Wanatah are college / undergraduate (72 | 27.7%), middle school (66 | 25.4%), and high school (55 | 21.1%).
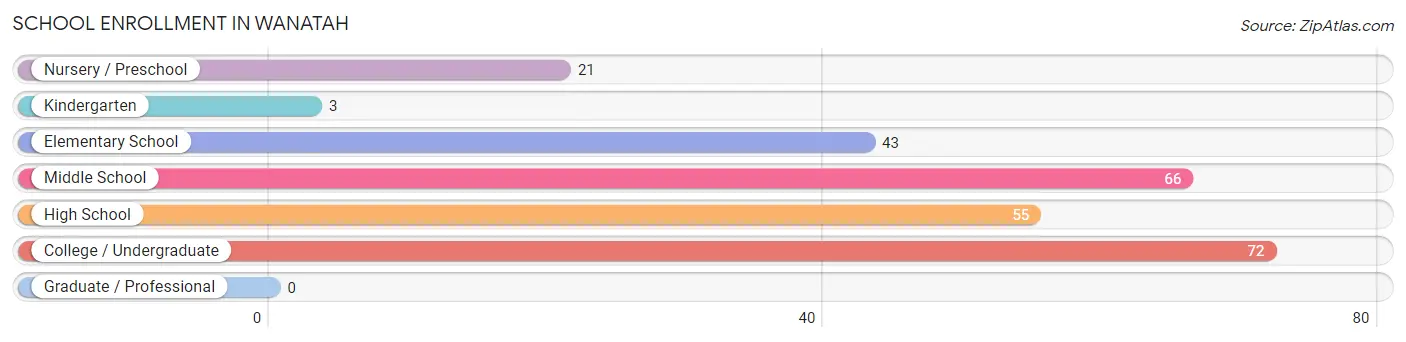
| School Level | # Students | % Students |
| Nursery / Preschool | 21 | 8.1% |
| Kindergarten | 3 | 1.1% |
| Elementary School | 43 | 16.5% |
| Middle School | 66 | 25.4% |
| High School | 55 | 21.1% |
| College / Undergraduate | 72 | 27.7% |
| Graduate / Professional | 0 | 0.0% |
| Total | 260 | 100.0% |
School Enrollment by Age by Funding Source in Wanatah
Out of a total of 260 students who are enrolled in schools in Wanatah, 15 (5.8%) attend a private institution, while the remaining 245 (94.2%) are enrolled in public schools. The age group of 18 to 19 year olds has the highest likelihood of being enrolled in private schools, with 5 (22.7% in the age bracket) enrolled. Conversely, the age group of 3 to 4 year olds has the lowest likelihood of being enrolled in a private school, with 17 (100.0% in the age bracket) attending a public institution.
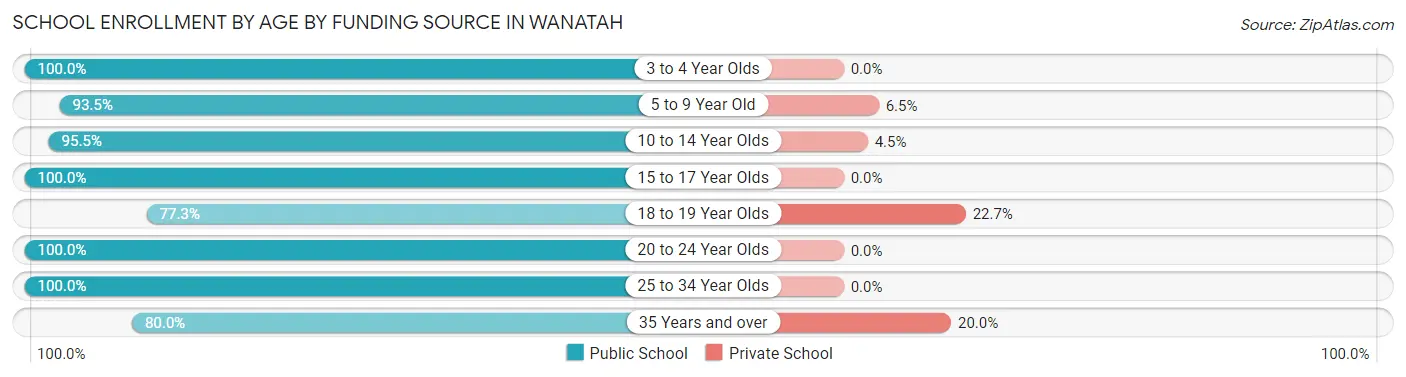
| Age Bracket | Public School | Private School |
| 3 to 4 Year Olds | 17 (100.0%) | 0 (0.0%) |
| 5 to 9 Year Old | 43 (93.5%) | 3 (6.5%) |
| 10 to 14 Year Olds | 64 (95.5%) | 3 (4.5%) |
| 15 to 17 Year Olds | 58 (100.0%) | 0 (0.0%) |
| 18 to 19 Year Olds | 17 (77.3%) | 5 (22.7%) |
| 20 to 24 Year Olds | 21 (100.0%) | 0 (0.0%) |
| 25 to 34 Year Olds | 9 (100.0%) | 0 (0.0%) |
| 35 Years and over | 16 (80.0%) | 4 (20.0%) |
| Total | 245 (94.2%) | 15 (5.8%) |
Educational Attainment by Field of Study in Wanatah
Science & technology (33 | 25.2%), education (21 | 16.0%), business (15 | 11.5%), arts & humanities (11 | 8.4%), and bio, nature & agricultural (10 | 7.6%) are the most common fields of study among 131 individuals in Wanatah who have obtained a bachelor's degree or higher.
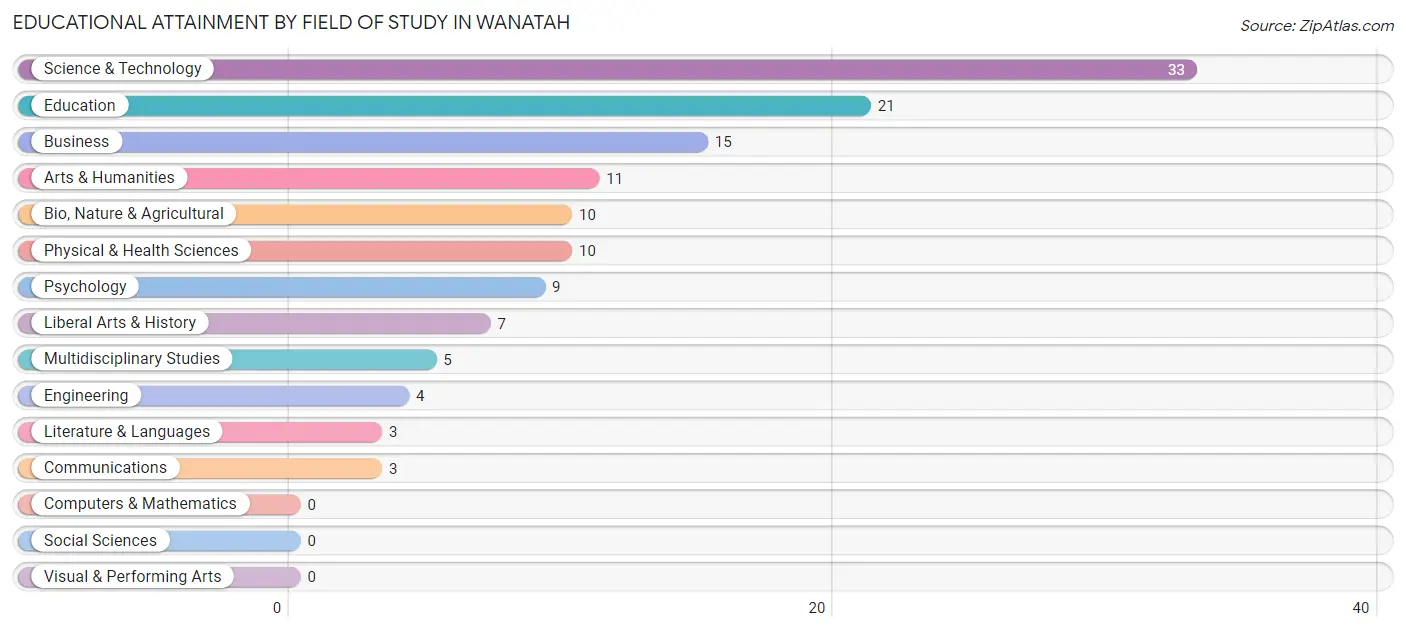
| Field of Study | # Graduates | % Graduates |
| Computers & Mathematics | 0 | 0.0% |
| Bio, Nature & Agricultural | 10 | 7.6% |
| Physical & Health Sciences | 10 | 7.6% |
| Psychology | 9 | 6.9% |
| Social Sciences | 0 | 0.0% |
| Engineering | 4 | 3.0% |
| Multidisciplinary Studies | 5 | 3.8% |
| Science & Technology | 33 | 25.2% |
| Business | 15 | 11.5% |
| Education | 21 | 16.0% |
| Literature & Languages | 3 | 2.3% |
| Liberal Arts & History | 7 | 5.3% |
| Visual & Performing Arts | 0 | 0.0% |
| Communications | 3 | 2.3% |
| Arts & Humanities | 11 | 8.4% |
| Total | 131 | 100.0% |
Transportation & Commute in Wanatah
Vehicle Availability by Sex in Wanatah
The most prevalent vehicle ownership categories in Wanatah are males with 2 vehicles (116, accounting for 37.9%) and females with 2 vehicles (100, making up 35.0%).
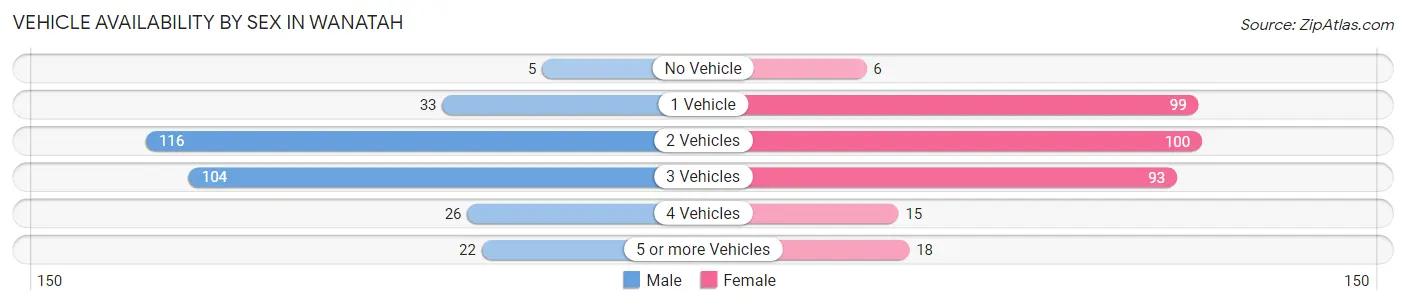
| Vehicles Available | Male | Female |
| No Vehicle | 5 (1.6%) | 6 (1.8%) |
| 1 Vehicle | 33 (10.8%) | 99 (29.9%) |
| 2 Vehicles | 116 (37.9%) | 100 (30.2%) |
| 3 Vehicles | 104 (34.0%) | 93 (28.1%) |
| 4 Vehicles | 26 (8.5%) | 15 (4.5%) |
| 5 or more Vehicles | 22 (7.2%) | 18 (5.4%) |
| Total | 306 (100.0%) | 331 (100.0%) |
Commute Time in Wanatah
The most frequently occuring commute durations in Wanatah are 10 to 14 minutes (106 commuters, 17.2%), 15 to 19 minutes (105 commuters, 17.0%), and 30 to 34 minutes (96 commuters, 15.6%).
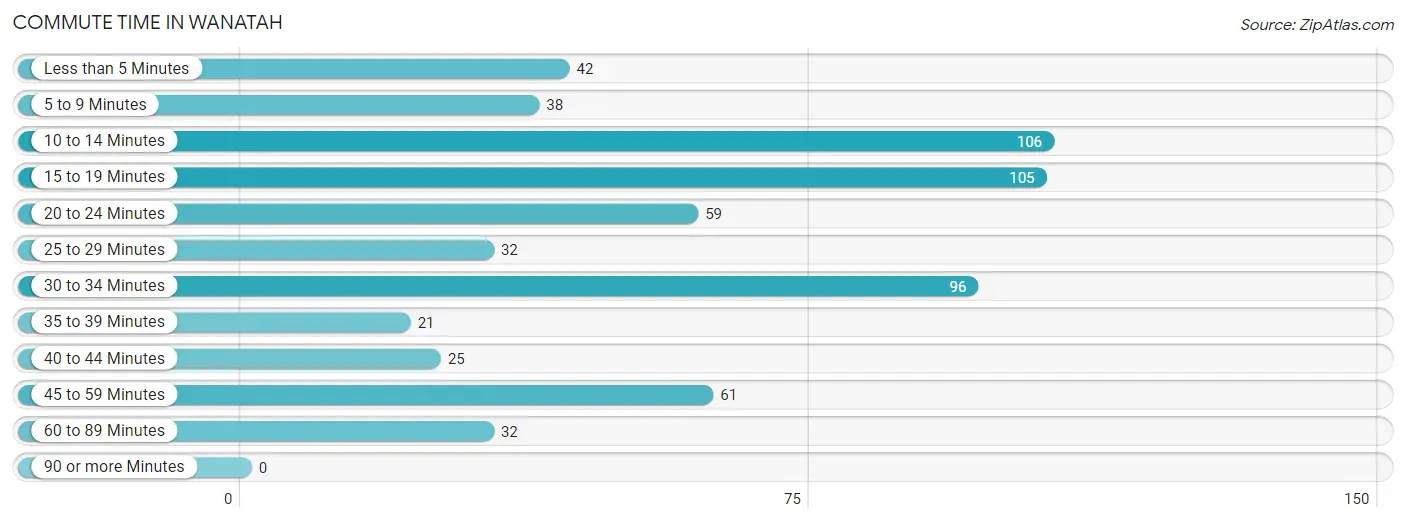
| Commute Time | # Commuters | % Commuters |
| Less than 5 Minutes | 42 | 6.8% |
| 5 to 9 Minutes | 38 | 6.2% |
| 10 to 14 Minutes | 106 | 17.2% |
| 15 to 19 Minutes | 105 | 17.0% |
| 20 to 24 Minutes | 59 | 9.6% |
| 25 to 29 Minutes | 32 | 5.2% |
| 30 to 34 Minutes | 96 | 15.6% |
| 35 to 39 Minutes | 21 | 3.4% |
| 40 to 44 Minutes | 25 | 4.1% |
| 45 to 59 Minutes | 61 | 9.9% |
| 60 to 89 Minutes | 32 | 5.2% |
| 90 or more Minutes | 0 | 0.0% |
Commute Time by Sex in Wanatah
The most common commute times in Wanatah are 45 to 59 minutes (58 commuters, 19.7%) for males and 15 to 19 minutes (89 commuters, 27.6%) for females.
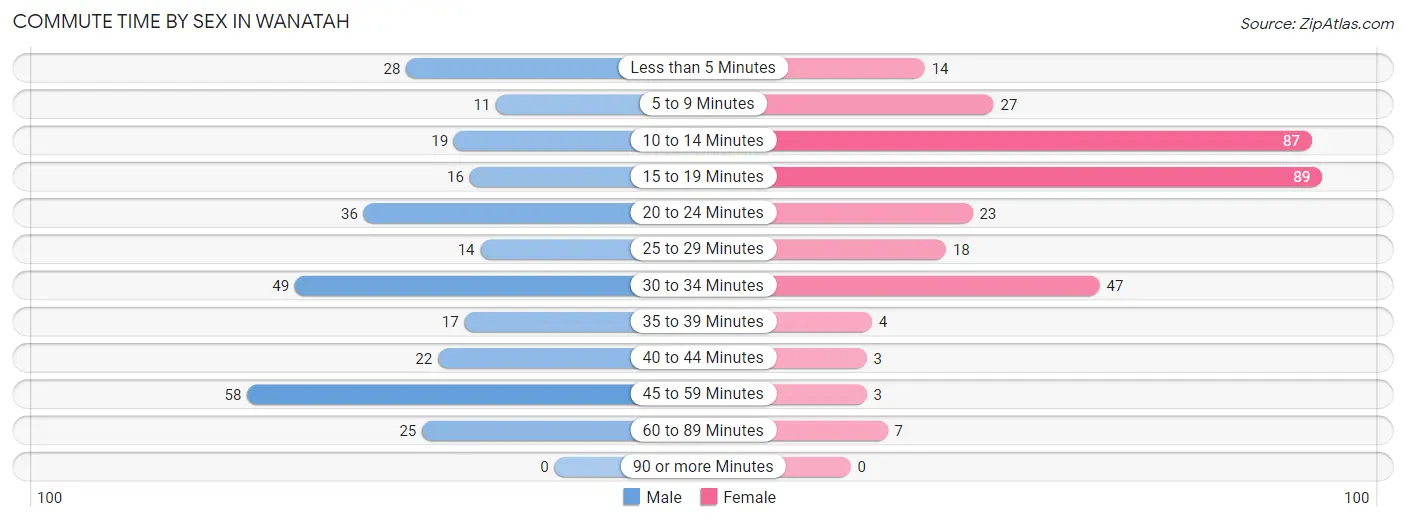
| Commute Time | Male | Female |
| Less than 5 Minutes | 28 (9.5%) | 14 (4.3%) |
| 5 to 9 Minutes | 11 (3.7%) | 27 (8.4%) |
| 10 to 14 Minutes | 19 (6.4%) | 87 (27.0%) |
| 15 to 19 Minutes | 16 (5.4%) | 89 (27.6%) |
| 20 to 24 Minutes | 36 (12.2%) | 23 (7.1%) |
| 25 to 29 Minutes | 14 (4.8%) | 18 (5.6%) |
| 30 to 34 Minutes | 49 (16.6%) | 47 (14.6%) |
| 35 to 39 Minutes | 17 (5.8%) | 4 (1.2%) |
| 40 to 44 Minutes | 22 (7.5%) | 3 (0.9%) |
| 45 to 59 Minutes | 58 (19.7%) | 3 (0.9%) |
| 60 to 89 Minutes | 25 (8.5%) | 7 (2.2%) |
| 90 or more Minutes | 0 (0.0%) | 0 (0.0%) |
Time of Departure to Work by Sex in Wanatah
The most frequent times of departure to work in Wanatah are 7:00 AM to 7:29 AM (94, 31.9%) for males and 6:00 AM to 6:29 AM (60, 18.6%) for females.
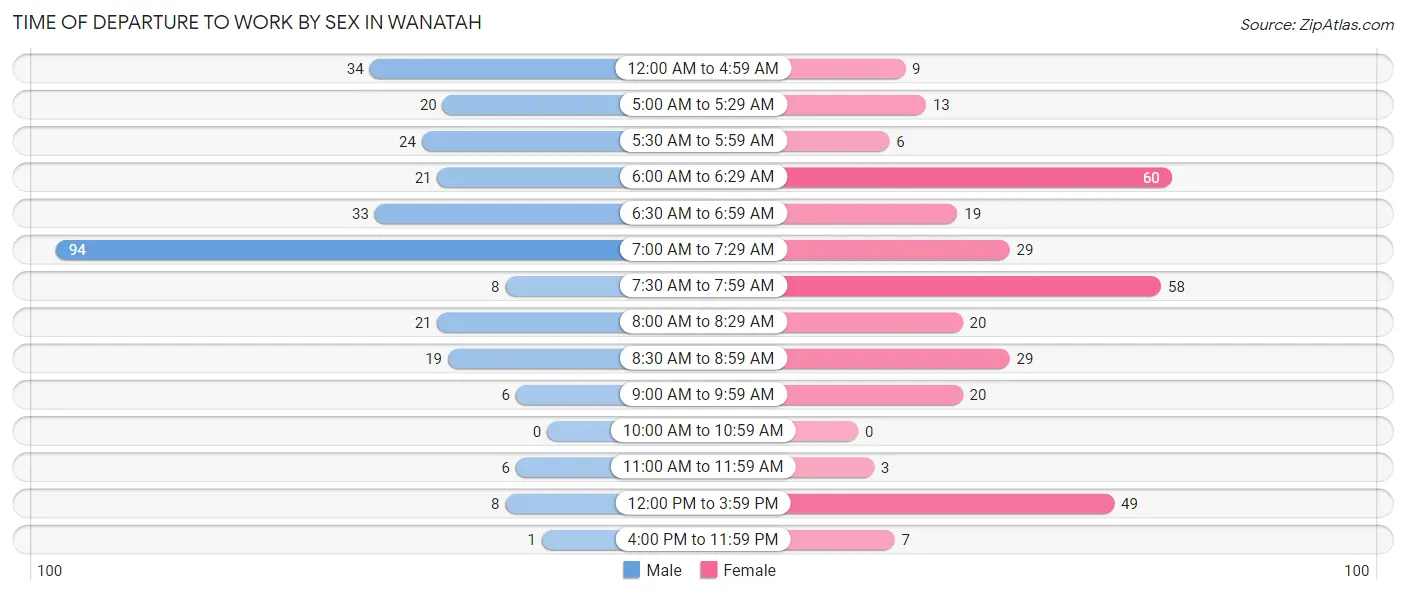
| Time of Departure | Male | Female |
| 12:00 AM to 4:59 AM | 34 (11.5%) | 9 (2.8%) |
| 5:00 AM to 5:29 AM | 20 (6.8%) | 13 (4.0%) |
| 5:30 AM to 5:59 AM | 24 (8.1%) | 6 (1.9%) |
| 6:00 AM to 6:29 AM | 21 (7.1%) | 60 (18.6%) |
| 6:30 AM to 6:59 AM | 33 (11.2%) | 19 (5.9%) |
| 7:00 AM to 7:29 AM | 94 (31.9%) | 29 (9.0%) |
| 7:30 AM to 7:59 AM | 8 (2.7%) | 58 (18.0%) |
| 8:00 AM to 8:29 AM | 21 (7.1%) | 20 (6.2%) |
| 8:30 AM to 8:59 AM | 19 (6.4%) | 29 (9.0%) |
| 9:00 AM to 9:59 AM | 6 (2.0%) | 20 (6.2%) |
| 10:00 AM to 10:59 AM | 0 (0.0%) | 0 (0.0%) |
| 11:00 AM to 11:59 AM | 6 (2.0%) | 3 (0.9%) |
| 12:00 PM to 3:59 PM | 8 (2.7%) | 49 (15.2%) |
| 4:00 PM to 11:59 PM | 1 (0.3%) | 7 (2.2%) |
| Total | 295 (100.0%) | 322 (100.0%) |
Housing Occupancy in Wanatah
Occupancy by Ownership in Wanatah
Of the total 489 dwellings in Wanatah, owner-occupied units account for 405 (82.8%), while renter-occupied units make up 84 (17.2%).
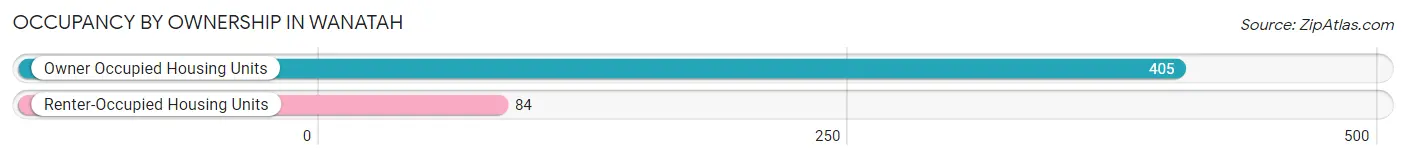
| Occupancy | # Housing Units | % Housing Units |
| Owner Occupied Housing Units | 405 | 82.8% |
| Renter-Occupied Housing Units | 84 | 17.2% |
| Total Occupied Housing Units | 489 | 100.0% |
Occupancy by Household Size in Wanatah
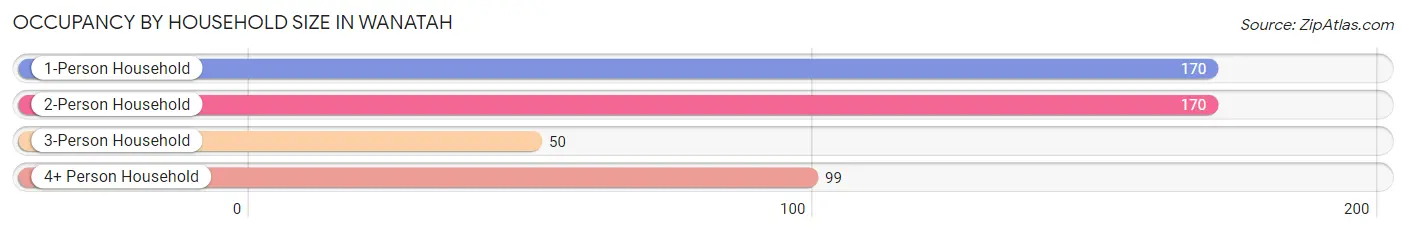
| Household Size | # Housing Units | % Housing Units |
| 1-Person Household | 170 | 34.8% |
| 2-Person Household | 170 | 34.8% |
| 3-Person Household | 50 | 10.2% |
| 4+ Person Household | 99 | 20.3% |
| Total Housing Units | 489 | 100.0% |
Occupancy by Ownership by Household Size in Wanatah
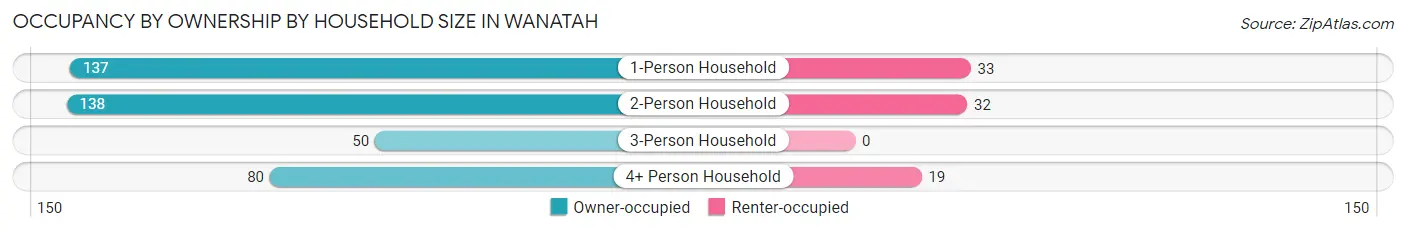
| Household Size | Owner-occupied | Renter-occupied |
| 1-Person Household | 137 (80.6%) | 33 (19.4%) |
| 2-Person Household | 138 (81.2%) | 32 (18.8%) |
| 3-Person Household | 50 (100.0%) | 0 (0.0%) |
| 4+ Person Household | 80 (80.8%) | 19 (19.2%) |
| Total Housing Units | 405 (82.8%) | 84 (17.2%) |
Occupancy by Educational Attainment in Wanatah
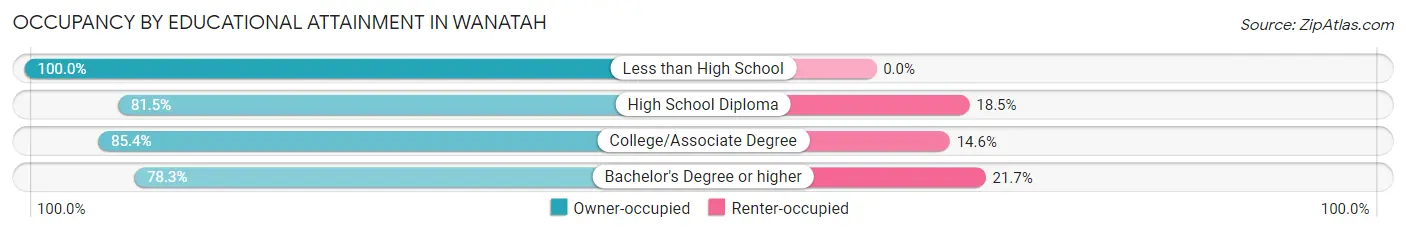
| Household Size | Owner-occupied | Renter-occupied |
| Less than High School | 10 (100.0%) | 0 (0.0%) |
| High School Diploma | 172 (81.5%) | 39 (18.5%) |
| College/Associate Degree | 158 (85.4%) | 27 (14.6%) |
| Bachelor's Degree or higher | 65 (78.3%) | 18 (21.7%) |
Occupancy by Age of Householder in Wanatah
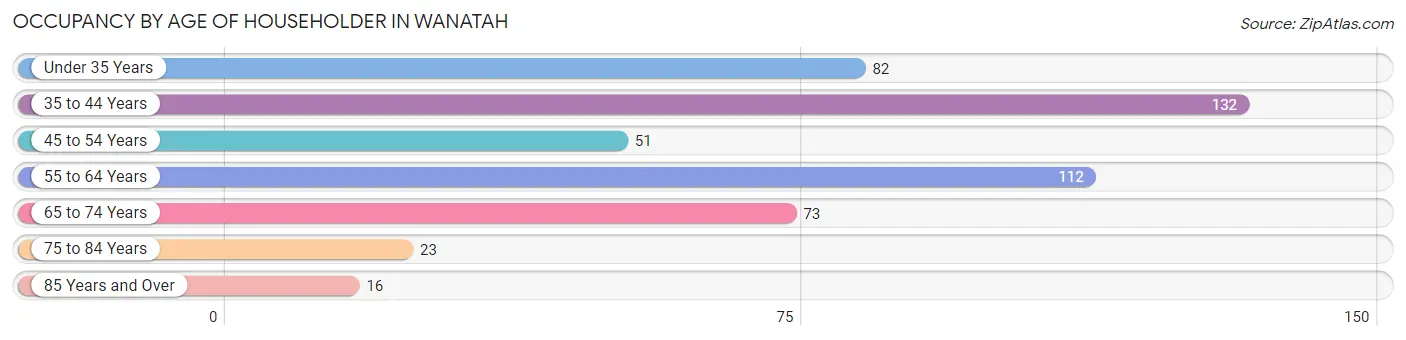
| Age Bracket | # Households | % Households |
| Under 35 Years | 82 | 16.8% |
| 35 to 44 Years | 132 | 27.0% |
| 45 to 54 Years | 51 | 10.4% |
| 55 to 64 Years | 112 | 22.9% |
| 65 to 74 Years | 73 | 14.9% |
| 75 to 84 Years | 23 | 4.7% |
| 85 Years and Over | 16 | 3.3% |
| Total | 489 | 100.0% |
Housing Finances in Wanatah
Median Income by Occupancy in Wanatah
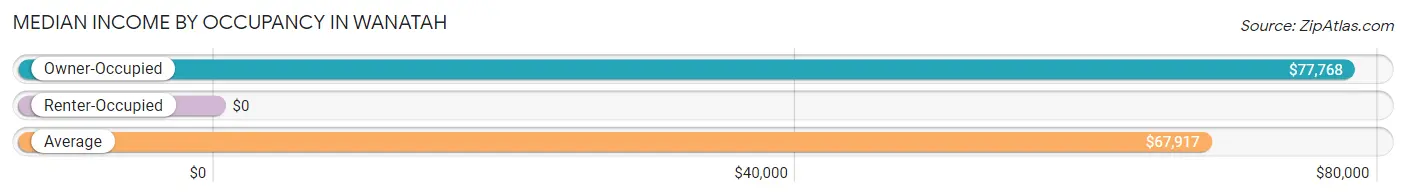
| Occupancy Type | # Households | Median Income |
| Owner-Occupied | 405 (82.8%) | $77,768 |
| Renter-Occupied | 84 (17.2%) | $0 |
| Average | 489 (100.0%) | $67,917 |
Occupancy by Householder Income Bracket in Wanatah
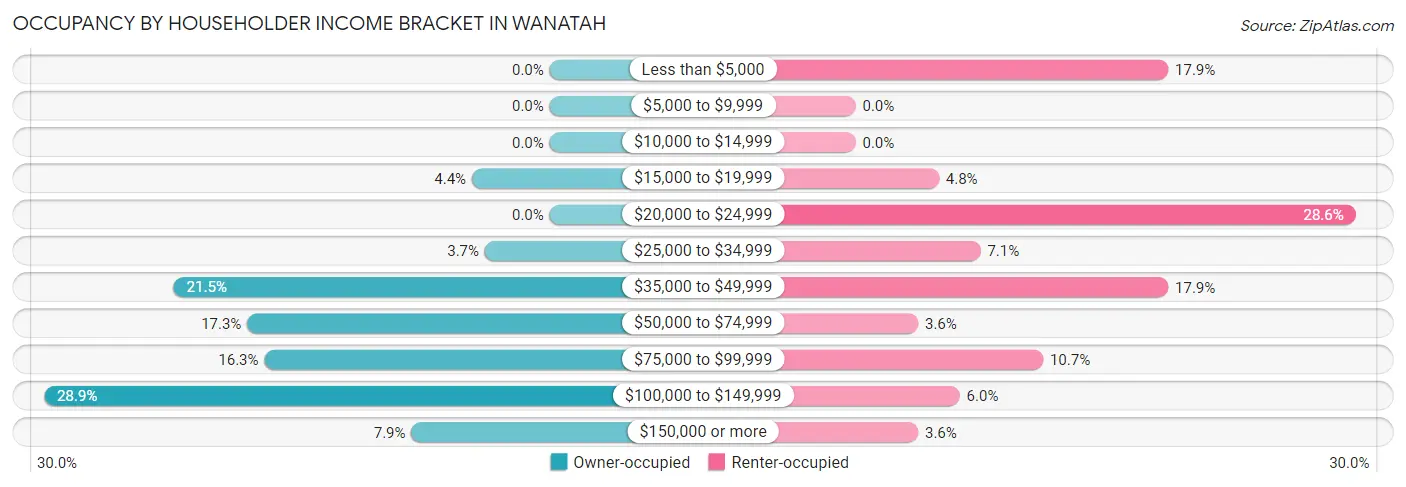
| Income Bracket | Owner-occupied | Renter-occupied |
| Less than $5,000 | 0 (0.0%) | 15 (17.9%) |
| $5,000 to $9,999 | 0 (0.0%) | 0 (0.0%) |
| $10,000 to $14,999 | 0 (0.0%) | 0 (0.0%) |
| $15,000 to $19,999 | 18 (4.4%) | 4 (4.8%) |
| $20,000 to $24,999 | 0 (0.0%) | 24 (28.6%) |
| $25,000 to $34,999 | 15 (3.7%) | 6 (7.1%) |
| $35,000 to $49,999 | 87 (21.5%) | 15 (17.9%) |
| $50,000 to $74,999 | 70 (17.3%) | 3 (3.6%) |
| $75,000 to $99,999 | 66 (16.3%) | 9 (10.7%) |
| $100,000 to $149,999 | 117 (28.9%) | 5 (5.9%) |
| $150,000 or more | 32 (7.9%) | 3 (3.6%) |
| Total | 405 (100.0%) | 84 (100.0%) |
Monthly Housing Cost Tiers in Wanatah
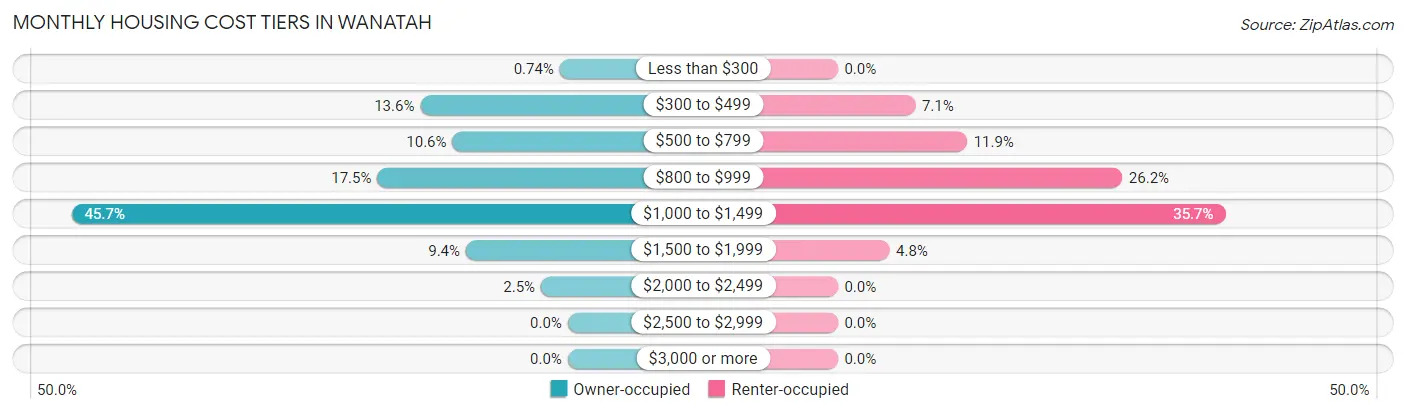
| Monthly Cost | Owner-occupied | Renter-occupied |
| Less than $300 | 3 (0.7%) | 0 (0.0%) |
| $300 to $499 | 55 (13.6%) | 6 (7.1%) |
| $500 to $799 | 43 (10.6%) | 10 (11.9%) |
| $800 to $999 | 71 (17.5%) | 22 (26.2%) |
| $1,000 to $1,499 | 185 (45.7%) | 30 (35.7%) |
| $1,500 to $1,999 | 38 (9.4%) | 4 (4.8%) |
| $2,000 to $2,499 | 10 (2.5%) | 0 (0.0%) |
| $2,500 to $2,999 | 0 (0.0%) | 0 (0.0%) |
| $3,000 or more | 0 (0.0%) | 0 (0.0%) |
| Total | 405 (100.0%) | 84 (100.0%) |
Physical Housing Characteristics in Wanatah
Housing Structures in Wanatah
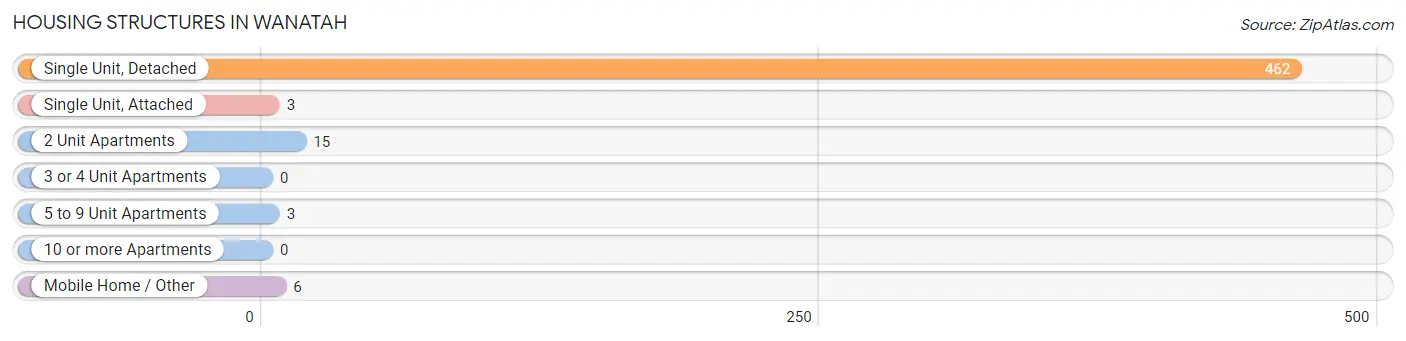
| Structure Type | # Housing Units | % Housing Units |
| Single Unit, Detached | 462 | 94.5% |
| Single Unit, Attached | 3 | 0.6% |
| 2 Unit Apartments | 15 | 3.1% |
| 3 or 4 Unit Apartments | 0 | 0.0% |
| 5 to 9 Unit Apartments | 3 | 0.6% |
| 10 or more Apartments | 0 | 0.0% |
| Mobile Home / Other | 6 | 1.2% |
| Total | 489 | 100.0% |
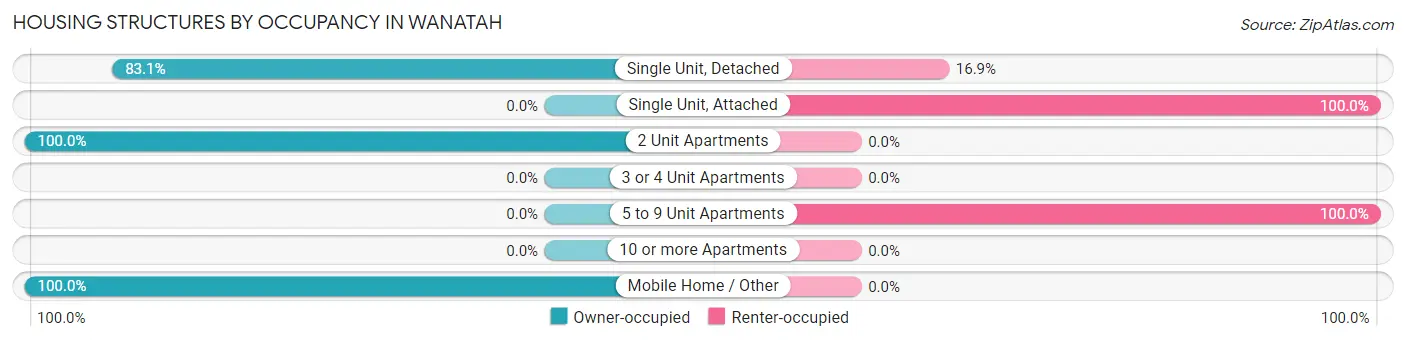
Housing Structures by Occupancy in Wanatah
| Structure Type | Owner-occupied | Renter-occupied |
| Single Unit, Detached | 384 (83.1%) | 78 (16.9%) |
| Single Unit, Attached | 0 (0.0%) | 3 (100.0%) |
| 2 Unit Apartments | 15 (100.0%) | 0 (0.0%) |
| 3 or 4 Unit Apartments | 0 (0.0%) | 0 (0.0%) |
| 5 to 9 Unit Apartments | 0 (0.0%) | 3 (100.0%) |
| 10 or more Apartments | 0 (0.0%) | 0 (0.0%) |
| Mobile Home / Other | 6 (100.0%) | 0 (0.0%) |
| Total | 405 (82.8%) | 84 (17.2%) |
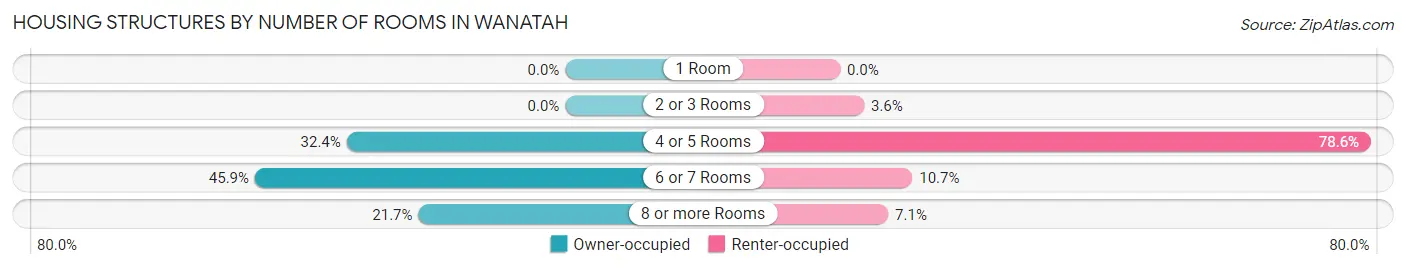
Housing Structures by Number of Rooms in Wanatah
| Number of Rooms | Owner-occupied | Renter-occupied |
| 1 Room | 0 (0.0%) | 0 (0.0%) |
| 2 or 3 Rooms | 0 (0.0%) | 3 (3.6%) |
| 4 or 5 Rooms | 131 (32.4%) | 66 (78.6%) |
| 6 or 7 Rooms | 186 (45.9%) | 9 (10.7%) |
| 8 or more Rooms | 88 (21.7%) | 6 (7.1%) |
| Total | 405 (100.0%) | 84 (100.0%) |
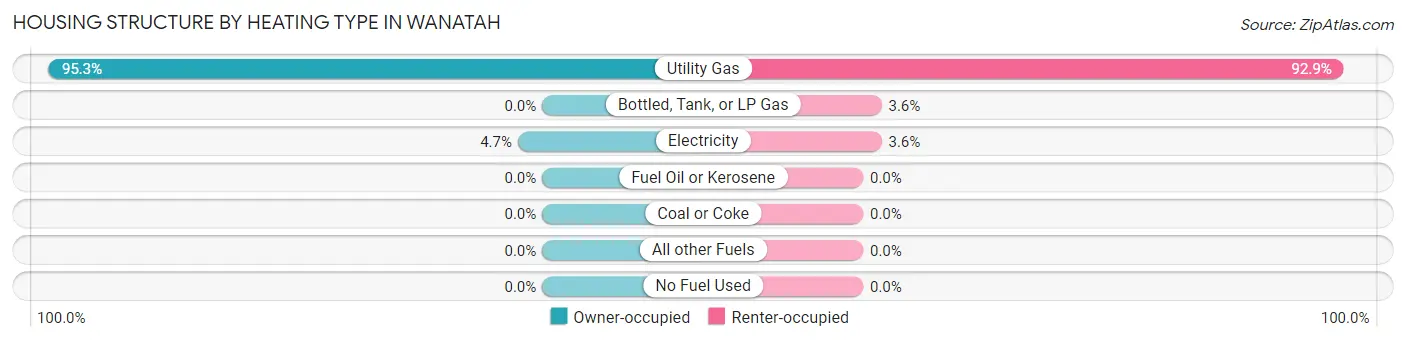
Housing Structure by Heating Type in Wanatah
| Heating Type | Owner-occupied | Renter-occupied |
| Utility Gas | 386 (95.3%) | 78 (92.9%) |
| Bottled, Tank, or LP Gas | 0 (0.0%) | 3 (3.6%) |
| Electricity | 19 (4.7%) | 3 (3.6%) |
| Fuel Oil or Kerosene | 0 (0.0%) | 0 (0.0%) |
| Coal or Coke | 0 (0.0%) | 0 (0.0%) |
| All other Fuels | 0 (0.0%) | 0 (0.0%) |
| No Fuel Used | 0 (0.0%) | 0 (0.0%) |
| Total | 405 (100.0%) | 84 (100.0%) |
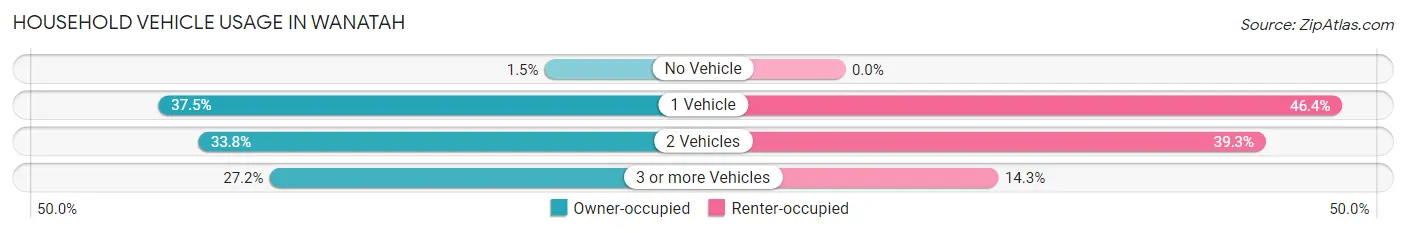
Household Vehicle Usage in Wanatah
| Vehicles per Household | Owner-occupied | Renter-occupied |
| No Vehicle | 6 (1.5%) | 0 (0.0%) |
| 1 Vehicle | 152 (37.5%) | 39 (46.4%) |
| 2 Vehicles | 137 (33.8%) | 33 (39.3%) |
| 3 or more Vehicles | 110 (27.2%) | 12 (14.3%) |
| Total | 405 (100.0%) | 84 (100.0%) |
Real Estate & Mortgages in Wanatah
Real Estate and Mortgage Overview in Wanatah
| Characteristic | Without Mortgage | With Mortgage |
| Housing Units | 110 | 295 |
| Median Property Value | $165,500 | $166,200 |
| Median Household Income | $61,458 | $20 |
| Monthly Housing Costs | $489 | $0 |
| Real Estate Taxes | $1,264 | $0 |
Property Value by Mortgage Status in Wanatah
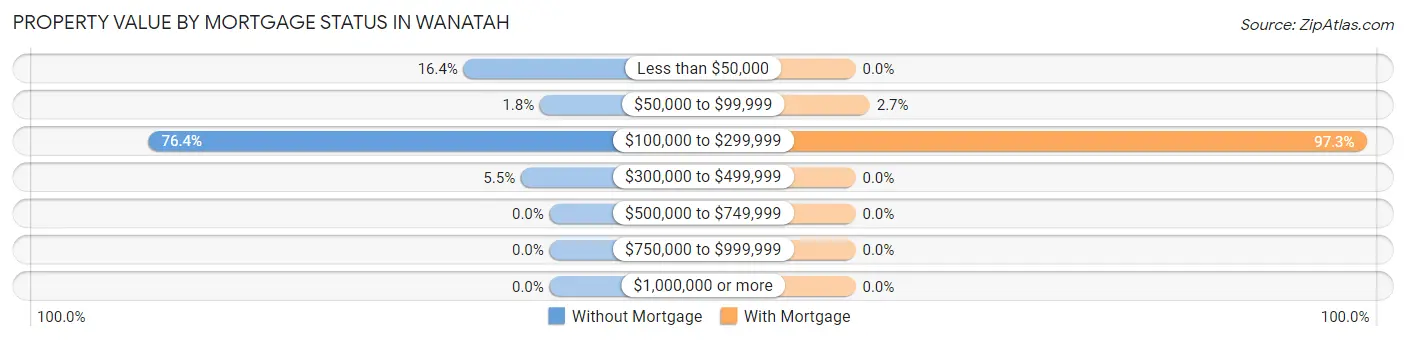
| Property Value | Without Mortgage | With Mortgage |
| Less than $50,000 | 18 (16.4%) | 0 (0.0%) |
| $50,000 to $99,999 | 2 (1.8%) | 8 (2.7%) |
| $100,000 to $299,999 | 84 (76.4%) | 287 (97.3%) |
| $300,000 to $499,999 | 6 (5.4%) | 0 (0.0%) |
| $500,000 to $749,999 | 0 (0.0%) | 0 (0.0%) |
| $750,000 to $999,999 | 0 (0.0%) | 0 (0.0%) |
| $1,000,000 or more | 0 (0.0%) | 0 (0.0%) |
| Total | 110 (100.0%) | 295 (100.0%) |
Household Income by Mortgage Status in Wanatah
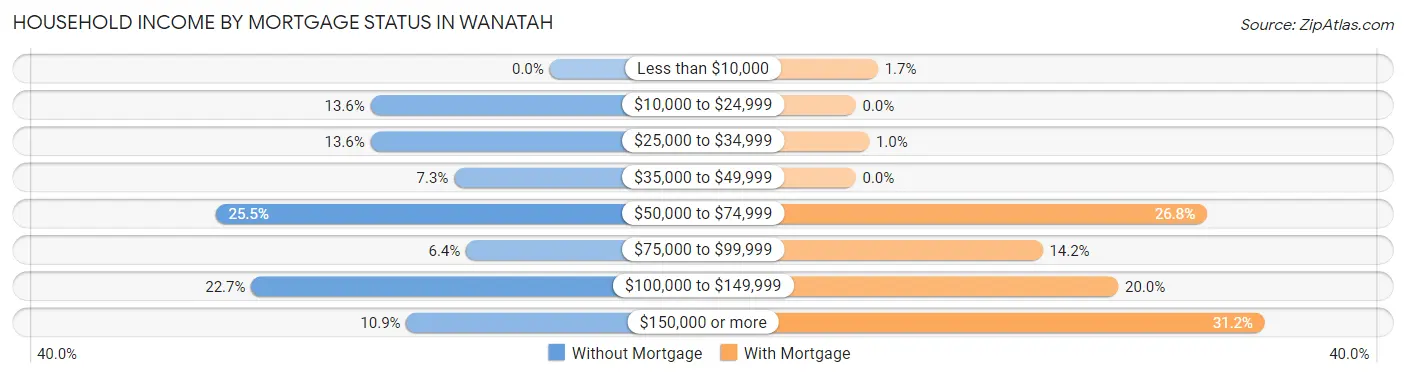
| Household Income | Without Mortgage | With Mortgage |
| Less than $10,000 | 0 (0.0%) | 5 (1.7%) |
| $10,000 to $24,999 | 15 (13.6%) | 0 (0.0%) |
| $25,000 to $34,999 | 15 (13.6%) | 3 (1.0%) |
| $35,000 to $49,999 | 8 (7.3%) | 0 (0.0%) |
| $50,000 to $74,999 | 28 (25.5%) | 79 (26.8%) |
| $75,000 to $99,999 | 7 (6.4%) | 42 (14.2%) |
| $100,000 to $149,999 | 25 (22.7%) | 59 (20.0%) |
| $150,000 or more | 12 (10.9%) | 92 (31.2%) |
| Total | 110 (100.0%) | 295 (100.0%) |
Property Value to Household Income Ratio in Wanatah
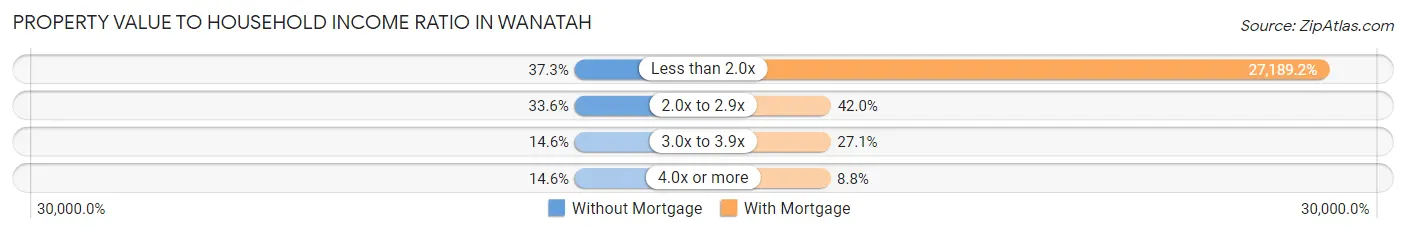
| Value-to-Income Ratio | Without Mortgage | With Mortgage |
| Less than 2.0x | 41 (37.3%) | 80,208 (27,189.2%) |
| 2.0x to 2.9x | 37 (33.6%) | 124 (42.0%) |
| 3.0x to 3.9x | 16 (14.5%) | 80 (27.1%) |
| 4.0x or more | 16 (14.5%) | 26 (8.8%) |
| Total | 110 (100.0%) | 295 (100.0%) |
Real Estate Taxes by Mortgage Status in Wanatah
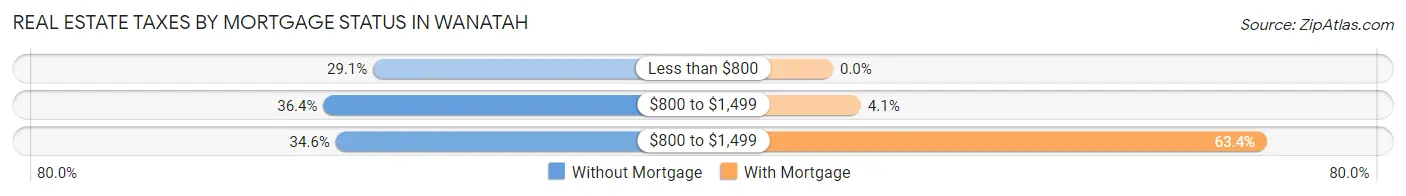
| Property Taxes | Without Mortgage | With Mortgage |
| Less than $800 | 32 (29.1%) | 0 (0.0%) |
| $800 to $1,499 | 40 (36.4%) | 12 (4.1%) |
| $800 to $1,499 | 38 (34.5%) | 187 (63.4%) |
| Total | 110 (100.0%) | 295 (100.0%) |
Health & Disability in Wanatah
Health Insurance Coverage by Age in Wanatah
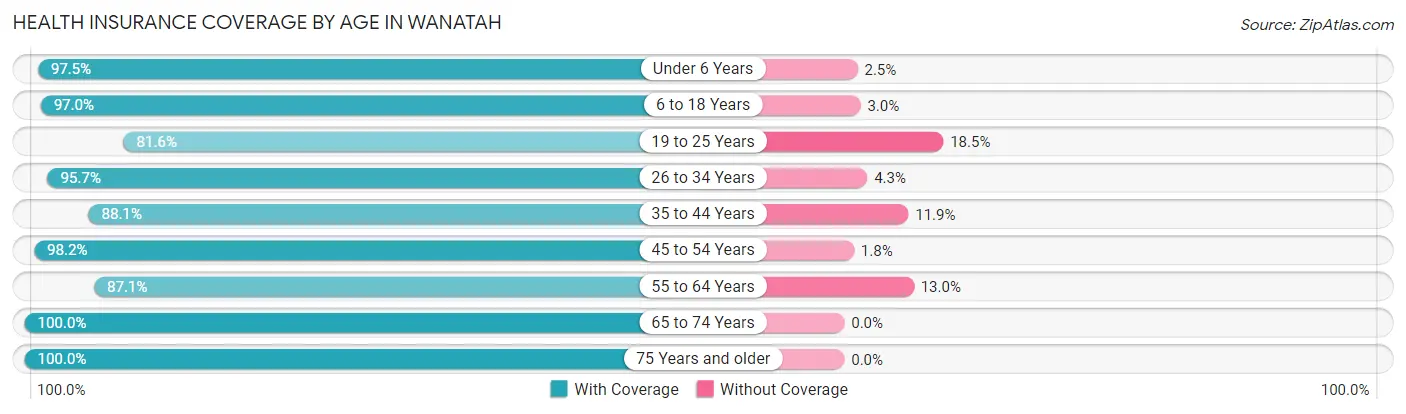
| Age Bracket | With Coverage | Without Coverage |
| Under 6 Years | 79 (97.5%) | 2 (2.5%) |
| 6 to 18 Years | 161 (97.0%) | 5 (3.0%) |
| 19 to 25 Years | 84 (81.6%) | 19 (18.4%) |
| 26 to 34 Years | 157 (95.7%) | 7 (4.3%) |
| 35 to 44 Years | 177 (88.1%) | 24 (11.9%) |
| 45 to 54 Years | 110 (98.2%) | 2 (1.8%) |
| 55 to 64 Years | 121 (87.1%) | 18 (13.0%) |
| 65 to 74 Years | 111 (100.0%) | 0 (0.0%) |
| 75 Years and older | 59 (100.0%) | 0 (0.0%) |
| Total | 1,059 (93.2%) | 77 (6.8%) |
Health Insurance Coverage by Citizenship Status in Wanatah
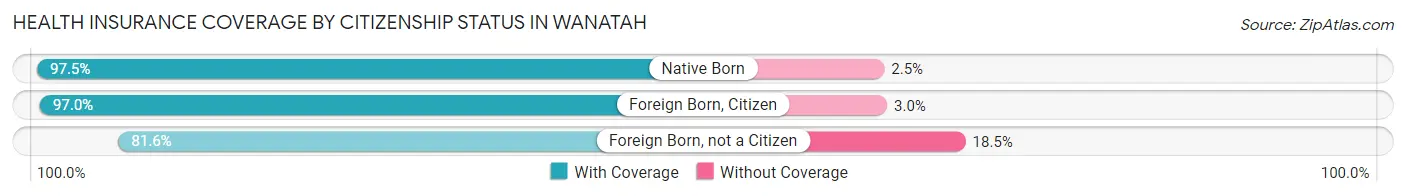
| Citizenship Status | With Coverage | Without Coverage |
| Native Born | 79 (97.5%) | 2 (2.5%) |
| Foreign Born, Citizen | 161 (97.0%) | 5 (3.0%) |
| Foreign Born, not a Citizen | 84 (81.6%) | 19 (18.4%) |
Health Insurance Coverage by Household Income in Wanatah
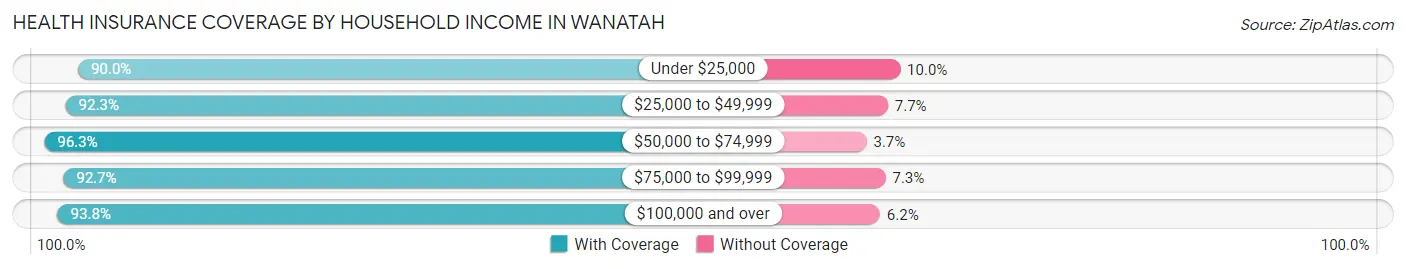
| Household Income | With Coverage | Without Coverage |
| Under $25,000 | 135 (90.0%) | 15 (10.0%) |
| $25,000 to $49,999 | 144 (92.3%) | 12 (7.7%) |
| $50,000 to $74,999 | 130 (96.3%) | 5 (3.7%) |
| $75,000 to $99,999 | 166 (92.7%) | 13 (7.3%) |
| $100,000 and over | 484 (93.8%) | 32 (6.2%) |
Public vs Private Health Insurance Coverage by Age in Wanatah
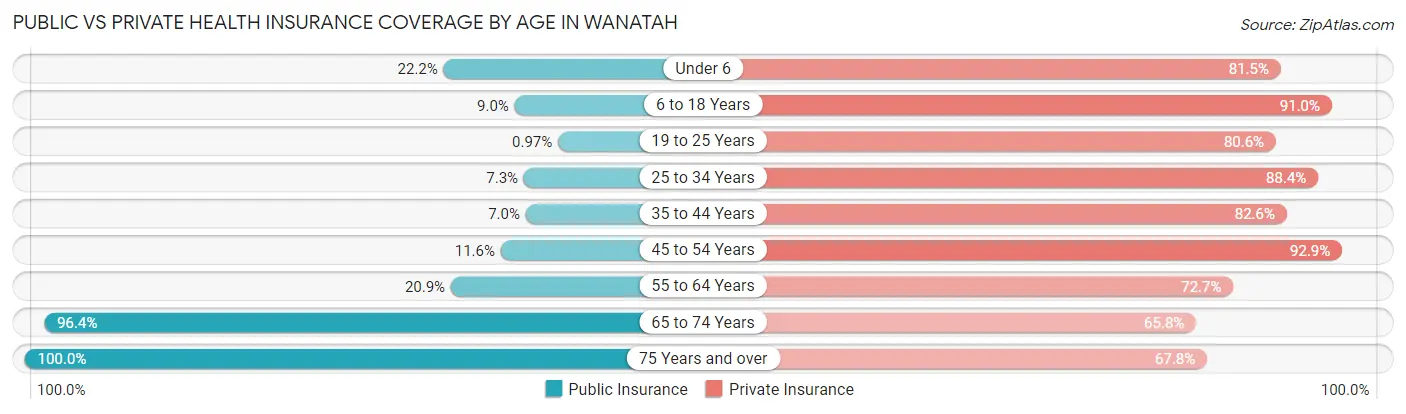
| Age Bracket | Public Insurance | Private Insurance |
| Under 6 | 18 (22.2%) | 66 (81.5%) |
| 6 to 18 Years | 15 (9.0%) | 151 (91.0%) |
| 19 to 25 Years | 1 (1.0%) | 83 (80.6%) |
| 25 to 34 Years | 12 (7.3%) | 145 (88.4%) |
| 35 to 44 Years | 14 (7.0%) | 166 (82.6%) |
| 45 to 54 Years | 13 (11.6%) | 104 (92.9%) |
| 55 to 64 Years | 29 (20.9%) | 101 (72.7%) |
| 65 to 74 Years | 107 (96.4%) | 73 (65.8%) |
| 75 Years and over | 59 (100.0%) | 40 (67.8%) |
| Total | 268 (23.6%) | 929 (81.8%) |
Disability Status by Sex by Age in Wanatah
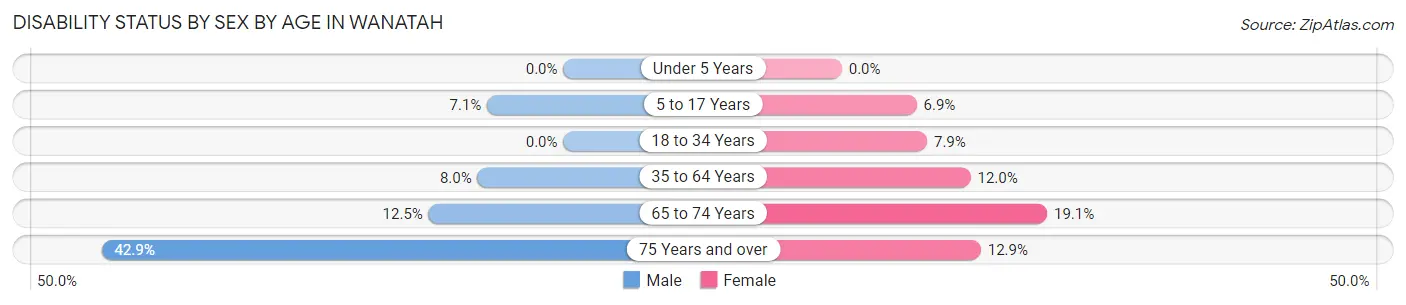
| Age Bracket | Male | Female |
| Under 5 Years | 0 (0.0%) | 0 (0.0%) |
| 5 to 17 Years | 7 (7.1%) | 5 (6.9%) |
| 18 to 34 Years | 0 (0.0%) | 11 (7.9%) |
| 35 to 64 Years | 16 (8.0%) | 30 (11.9%) |
| 65 to 74 Years | 6 (12.5%) | 12 (19.1%) |
| 75 Years and over | 12 (42.9%) | 4 (12.9%) |
Disability Class by Sex by Age in Wanatah
Disability Class: Hearing Difficulty
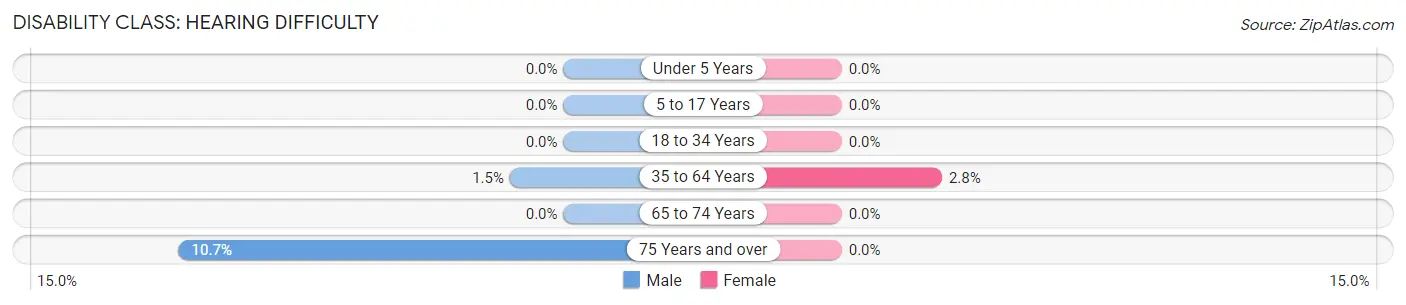
| Age Bracket | Male | Female |
| Under 5 Years | 0 (0.0%) | 0 (0.0%) |
| 5 to 17 Years | 0 (0.0%) | 0 (0.0%) |
| 18 to 34 Years | 0 (0.0%) | 0 (0.0%) |
| 35 to 64 Years | 3 (1.5%) | 7 (2.8%) |
| 65 to 74 Years | 0 (0.0%) | 0 (0.0%) |
| 75 Years and over | 3 (10.7%) | 0 (0.0%) |
Disability Class: Vision Difficulty
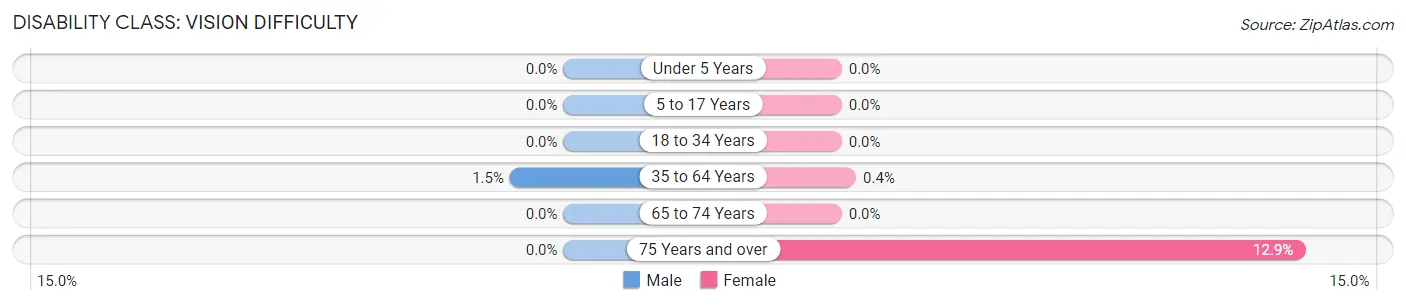
| Age Bracket | Male | Female |
| Under 5 Years | 0 (0.0%) | 0 (0.0%) |
| 5 to 17 Years | 0 (0.0%) | 0 (0.0%) |
| 18 to 34 Years | 0 (0.0%) | 0 (0.0%) |
| 35 to 64 Years | 3 (1.5%) | 1 (0.4%) |
| 65 to 74 Years | 0 (0.0%) | 0 (0.0%) |
| 75 Years and over | 0 (0.0%) | 4 (12.9%) |
Disability Class: Cognitive Difficulty
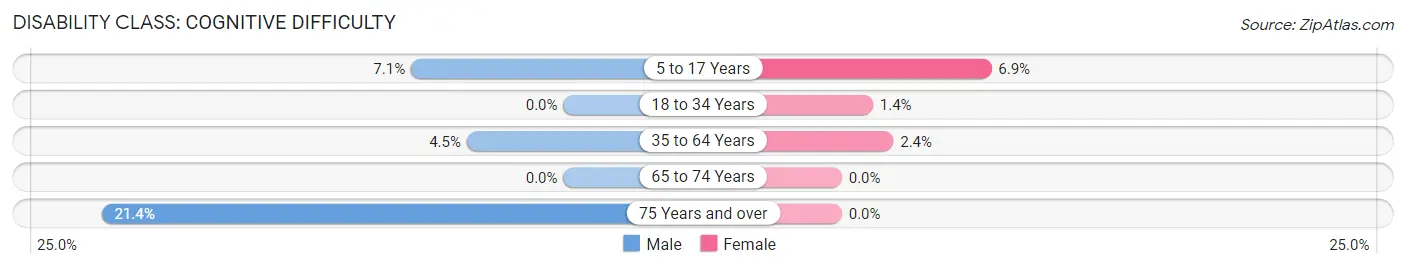
| Age Bracket | Male | Female |
| 5 to 17 Years | 7 (7.1%) | 5 (6.9%) |
| 18 to 34 Years | 0 (0.0%) | 2 (1.4%) |
| 35 to 64 Years | 9 (4.5%) | 6 (2.4%) |
| 65 to 74 Years | 0 (0.0%) | 0 (0.0%) |
| 75 Years and over | 6 (21.4%) | 0 (0.0%) |
Disability Class: Ambulatory Difficulty
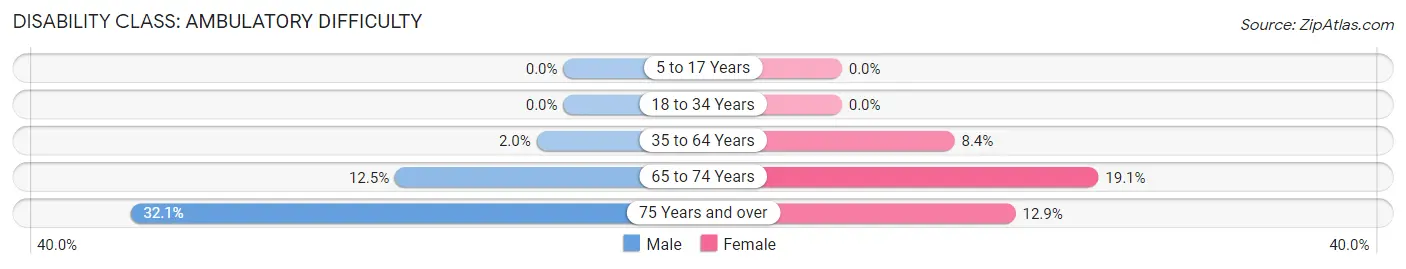
| Age Bracket | Male | Female |
| 5 to 17 Years | 0 (0.0%) | 0 (0.0%) |
| 18 to 34 Years | 0 (0.0%) | 0 (0.0%) |
| 35 to 64 Years | 4 (2.0%) | 21 (8.4%) |
| 65 to 74 Years | 6 (12.5%) | 12 (19.1%) |
| 75 Years and over | 9 (32.1%) | 4 (12.9%) |
Disability Class: Self-Care Difficulty
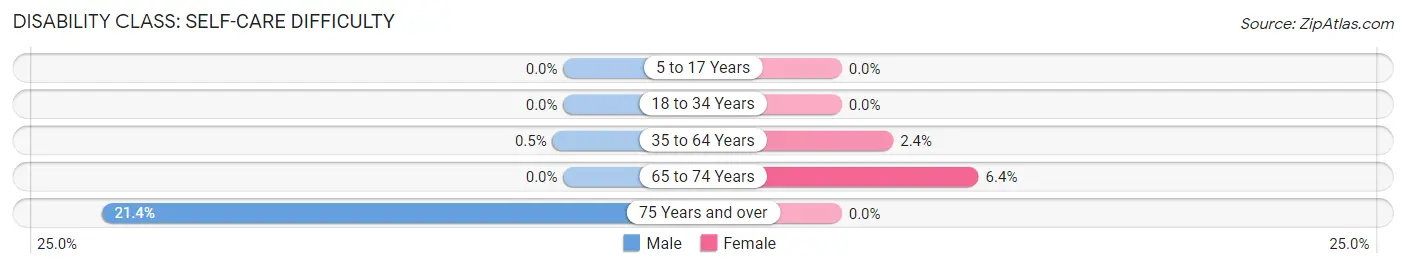
| Age Bracket | Male | Female |
| 5 to 17 Years | 0 (0.0%) | 0 (0.0%) |
| 18 to 34 Years | 0 (0.0%) | 0 (0.0%) |
| 35 to 64 Years | 1 (0.5%) | 6 (2.4%) |
| 65 to 74 Years | 0 (0.0%) | 4 (6.4%) |
| 75 Years and over | 6 (21.4%) | 0 (0.0%) |
Technology Access in Wanatah
Computing Device Access in Wanatah
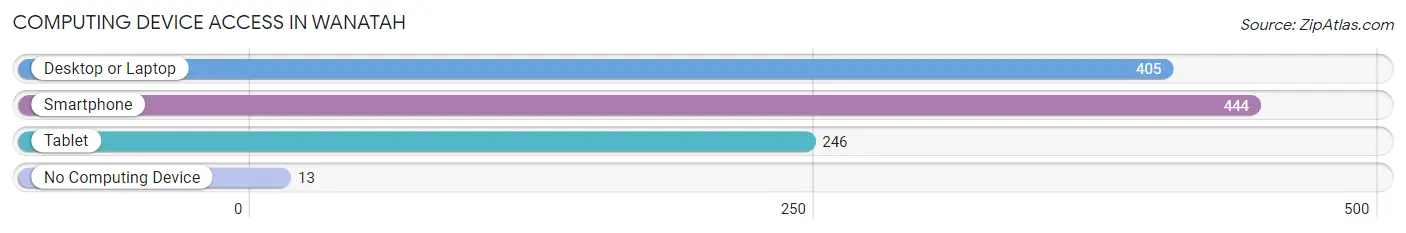
| Device Type | # Households | % Households |
| Desktop or Laptop | 405 | 82.8% |
| Smartphone | 444 | 90.8% |
| Tablet | 246 | 50.3% |
| No Computing Device | 13 | 2.7% |
| Total | 489 | 100.0% |
Internet Access in Wanatah
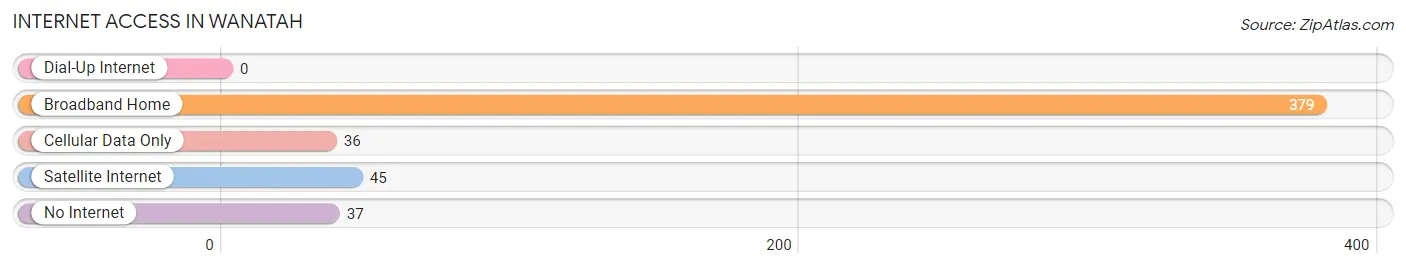
| Internet Type | # Households | % Households |
| Dial-Up Internet | 0 | 0.0% |
| Broadband Home | 379 | 77.5% |
| Cellular Data Only | 36 | 7.4% |
| Satellite Internet | 45 | 9.2% |
| No Internet | 37 | 7.6% |
| Total | 489 | 100.0% |
Wanatah Summary
History
The town of Wanatah, Indiana is located in LaPorte County, in the northwest corner of the state. It is situated on the banks of the Little Calumet River, and is part of the South Bend-Mishawaka metropolitan area. The town was first settled in 1834 by a group of settlers from New York, led by William and Mary Wanatah. The town was named after the Wanatah family, and was incorporated in 1867.
The town of Wanatah has a rich history, and has been home to many notable people. The most famous of these is the late Senator Birch Bayh, who was born in Wanatah in 1934. Bayh served in the United States Senate from 1963 to 1981, and was a major figure in the passage of the 26th Amendment, which lowered the voting age to 18.
Geography
Wanatah is located in the northwest corner of Indiana, in LaPorte County. It is situated on the banks of the Little Calumet River, and is part of the South Bend-Mishawaka metropolitan area. The town is located approximately 25 miles east of Lake Michigan, and is bordered by the towns of LaPorte, Michigan City, and Valparaiso.
The town of Wanatah has a total area of 1.3 square miles, all of which is land. The town is located in a flat, low-lying area, and is surrounded by farmland and woodlands. The town is located in the Central Lowland region of the United States, and is part of the Great Lakes region.
Economy
The economy of Wanatah is largely based on agriculture and manufacturing. The town is home to several large agricultural operations, including the Wanatah Grain Elevator, which is one of the largest grain elevators in the state. The town is also home to several manufacturing companies, including the Wanatah Steel Company, which produces steel products for the automotive and construction industries.
The town is also home to several small businesses, including restaurants, retail stores, and service providers. The town is also home to several small-scale farms, which produce a variety of fruits and vegetables for local consumption.
Demographics
As of the 2010 census, the town of Wanatah had a population of 1,845. The population is largely white (94.3%), with small percentages of African American (2.2%), Hispanic (1.7%), and Asian (1.2%) residents. The median household income in the town is $45,000, and the median age is 40.
The town of Wanatah is served by the Wanatah Public School System, which consists of one elementary school, one middle school, and one high school. The town is also home to several churches, including the First United Methodist Church, the First Presbyterian Church, and the St. John's Lutheran Church.
Conclusion
The town of Wanatah, Indiana is a small, rural community located in the northwest corner of the state. The town has a rich history, and is home to many notable people, including the late Senator Birch Bayh. The town has a largely agricultural and manufacturing-based economy, and is home to several small businesses. The town has a population of 1,845, and is served by the Wanatah Public School System.
Common Questions
What is the Total Population of Wanatah?
Total Population of Wanatah is 1,136.
What is the Total Male Population of Wanatah?
Total Male Population of Wanatah is 548.
What is the Total Female Population of Wanatah?
Total Female Population of Wanatah is 588.
What is the Ratio of Males per 100 Females in Wanatah?
There are 93.20 Males per 100 Females in Wanatah.
What is the Ratio of Females per 100 Males in Wanatah?
There are 107.30 Females per 100 Males in Wanatah.
What is the Median Population Age in Wanatah?
Median Population Age in Wanatah is 41.0 Years.
What is the Average Family Size in Wanatah
Average Family Size in Wanatah is 3.1 People.
What is the Average Household Size in Wanatah
Average Household Size in Wanatah is 2.3 People.
What is Per Capita Income in Wanatah?
Per Capita income in Wanatah is $36,311.
What is the Median Family Income in Wanatah?
Median Family Income in Wanatah is $99,688.
What is the Median Household income in Wanatah?
Median Household Income in Wanatah is $67,917.
What is Income or Wage Gap in Wanatah?
Income or Wage Gap in Wanatah is 34.0%.
Women in Wanatah earn 66.0 cents for every dollar earned by a man.
What is Inequality or Gini Index in Wanatah?
Inequality or Gini Index in Wanatah is 0.38.
How Large is the Labor Force in Wanatah?
There are 687 People in the Labor Forcein in Wanatah.
What is the Percentage of People in the Labor Force in Wanatah?
74.2% of People are in the Labor Force in Wanatah.
What is the Unemployment Rate in Wanatah?
Unemployment Rate in Wanatah is 6.3%.