Parkers Settlement, IN
Parkers Settlement Map
Parkers Settlement Overview
547
TOTAL POPULATION
279
MALE POPULATION
268
FEMALE POPULATION
104.10
MALES / 100 FEMALES
96.06
FEMALES / 100 MALES
52.5
MEDIAN AGE
2.4
AVG FAMILY SIZE
2.0
AVG HOUSEHOLD SIZE
$44,126
PER CAPITA INCOME
$108,824
AVG FAMILY INCOME
$69,850
AVG HOUSEHOLD INCOME
0.35
INEQUALITY / GINI INDEX
319
LABOR FORCE [ PEOPLE ]
62.9%
PERCENT IN LABOR FORCE
7.2%
UNEMPLOYMENT RATE
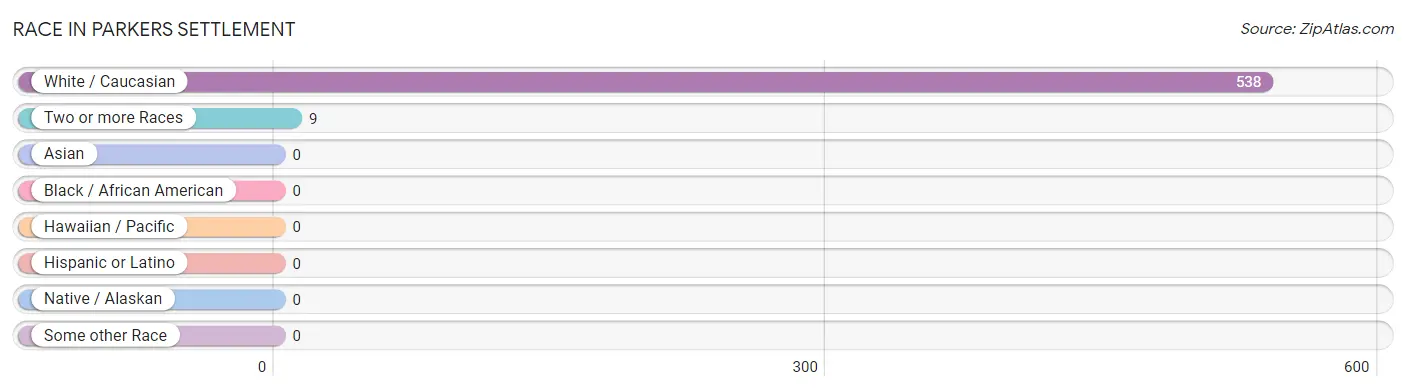
Race in Parkers Settlement
The most populous races in Parkers Settlement are White / Caucasian (538 | 98.4%), and Two or more Races (9 | 1.7%).
| Race | # Population | % Population |
| Asian | 0 | 0.0% |
| Black / African American | 0 | 0.0% |
| Hawaiian / Pacific | 0 | 0.0% |
| Hispanic or Latino | 0 | 0.0% |
| Native / Alaskan | 0 | 0.0% |
| White / Caucasian | 538 | 98.4% |
| Two or more Races | 9 | 1.7% |
| Some other Race | 0 | 0.0% |
| Total | 547 | 100.0% |
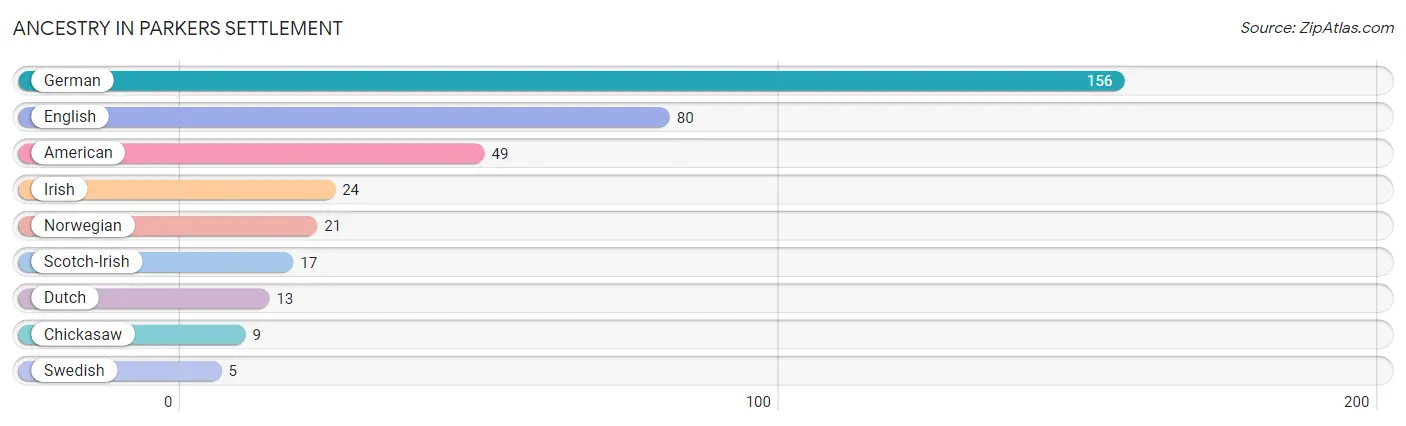
Ancestry in Parkers Settlement
The most populous ancestries reported in Parkers Settlement are German (156 | 28.5%), English (80 | 14.6%), American (49 | 9.0%), Irish (24 | 4.4%), and Norwegian (21 | 3.8%), together accounting for 60.3% of all Parkers Settlement residents.
| Ancestry | # Population | % Population |
| American | 49 | 9.0% |
| Chickasaw | 9 | 1.7% |
| Dutch | 13 | 2.4% |
| English | 80 | 14.6% |
| German | 156 | 28.5% |
| Irish | 24 | 4.4% |
| Norwegian | 21 | 3.8% |
| Scotch-Irish | 17 | 3.1% |
| Swedish | 5 | 0.9% | View All 9 Rows |
Immigrants in Parkers Settlement

| Immigration Origin | # Population | % Population | View All 0 Rows |
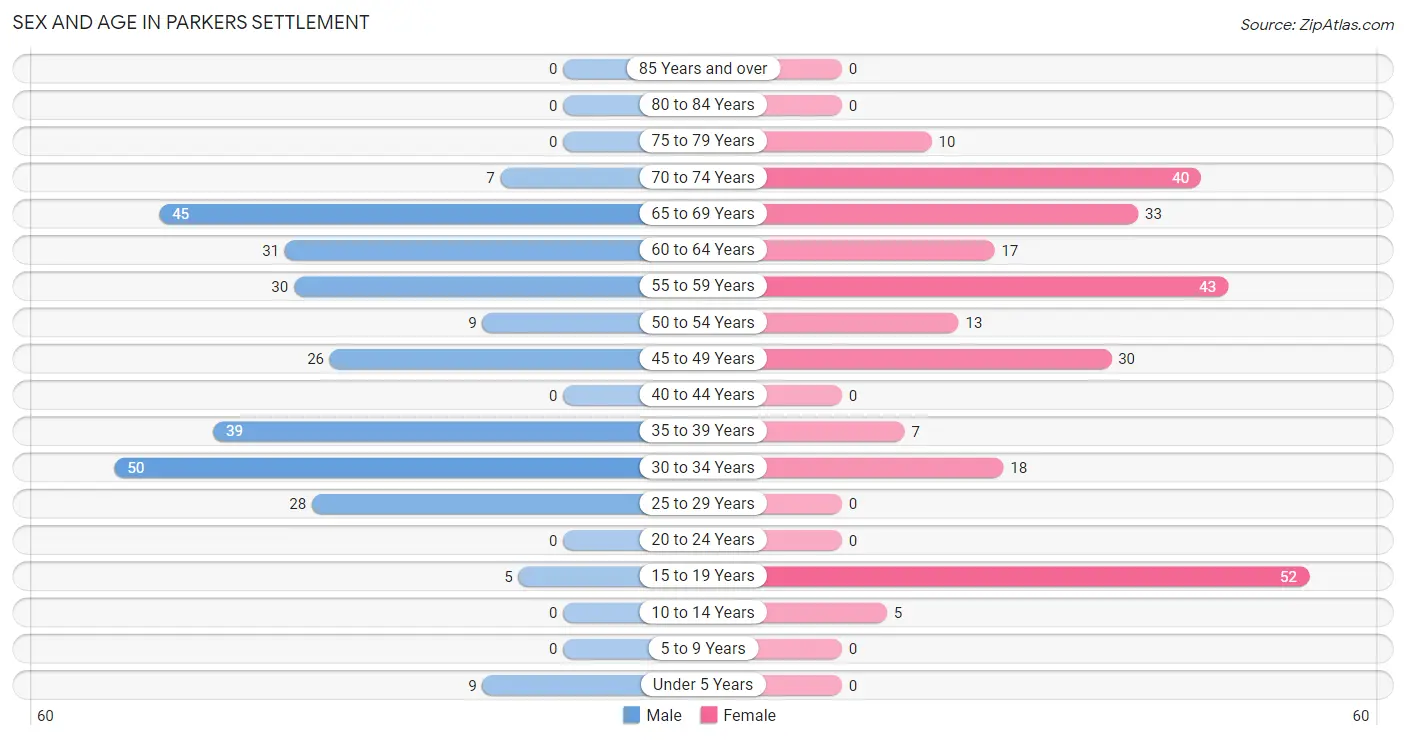
Sex and Age in Parkers Settlement
Sex and Age in Parkers Settlement
The most populous age groups in Parkers Settlement are 30 to 34 Years (50 | 17.9%) for men and 15 to 19 Years (52 | 19.4%) for women.
| Age Bracket | Male | Female |
| Under 5 Years | 9 (3.2%) | 0 (0.0%) |
| 5 to 9 Years | 0 (0.0%) | 0 (0.0%) |
| 10 to 14 Years | 0 (0.0%) | 5 (1.9%) |
| 15 to 19 Years | 5 (1.8%) | 52 (19.4%) |
| 20 to 24 Years | 0 (0.0%) | 0 (0.0%) |
| 25 to 29 Years | 28 (10.0%) | 0 (0.0%) |
| 30 to 34 Years | 50 (17.9%) | 18 (6.7%) |
| 35 to 39 Years | 39 (14.0%) | 7 (2.6%) |
| 40 to 44 Years | 0 (0.0%) | 0 (0.0%) |
| 45 to 49 Years | 26 (9.3%) | 30 (11.2%) |
| 50 to 54 Years | 9 (3.2%) | 13 (4.9%) |
| 55 to 59 Years | 30 (10.7%) | 43 (16.0%) |
| 60 to 64 Years | 31 (11.1%) | 17 (6.3%) |
| 65 to 69 Years | 45 (16.1%) | 33 (12.3%) |
| 70 to 74 Years | 7 (2.5%) | 40 (14.9%) |
| 75 to 79 Years | 0 (0.0%) | 10 (3.7%) |
| 80 to 84 Years | 0 (0.0%) | 0 (0.0%) |
| 85 Years and over | 0 (0.0%) | 0 (0.0%) |
| Total | 279 (100.0%) | 268 (100.0%) |
Families and Households in Parkers Settlement
Median Family Size in Parkers Settlement
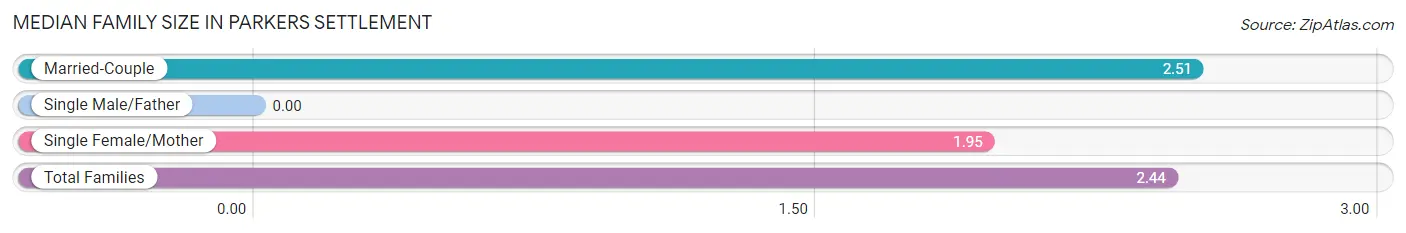
| Family Type | # Families | Family Size |
| Married-Couple | 170 (88.5%) | 2.51 |
| Single Male/Father | 0 (0.0%) | - |
| Single Female/Mother | 22 (11.5%) | 1.95 |
| Total Families | 192 (100.0%) | 2.44 |
Median Household Size in Parkers Settlement
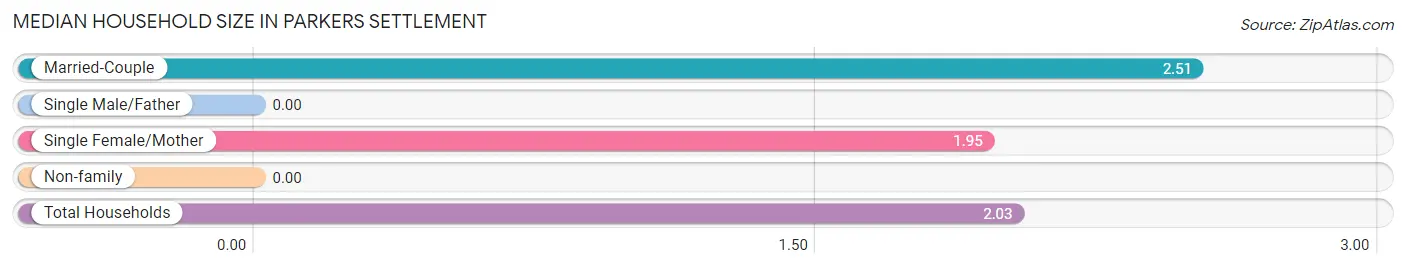
| Household Type | # Households | Household Size |
| Married-Couple | 170 (63.0%) | 2.51 |
| Single Male/Father | 0 (0.0%) | - |
| Single Female/Mother | 22 (8.2%) | 1.95 |
| Non-family | 78 (28.9%) | - |
| Total Households | 270 (100.0%) | 2.03 |
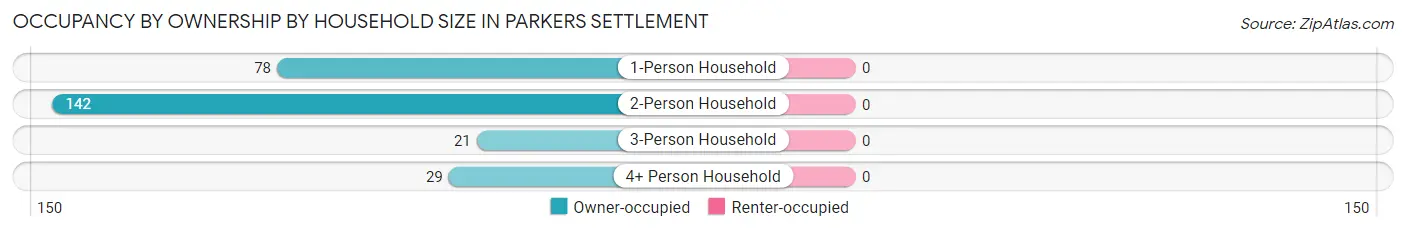
Household Size by Marriage Status in Parkers Settlement
Out of a total of 270 households in Parkers Settlement, 192 (71.1%) are family households, while 78 (28.9%) are nonfamily households. The most numerous type of family households are 2-person households, comprising 142, and the most common type of nonfamily households are 1-person households, comprising 78.
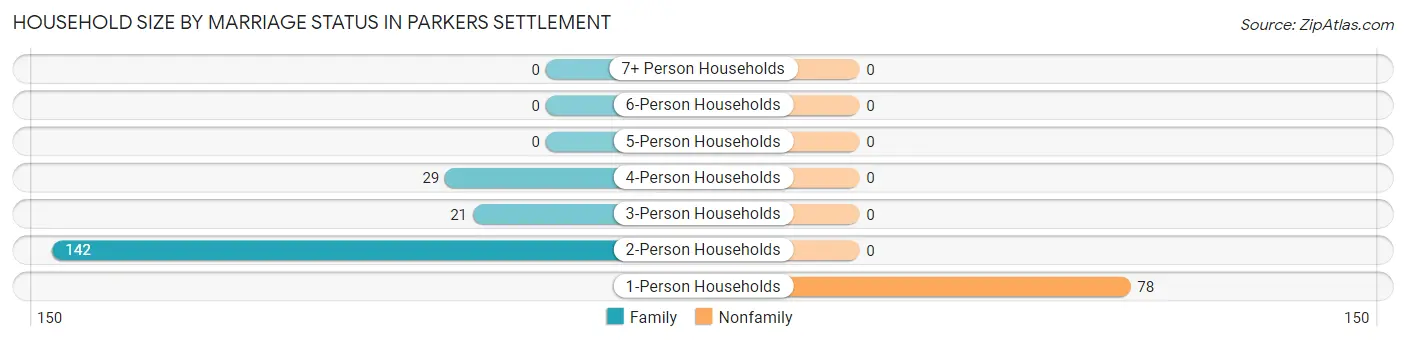
| Household Size | Family Households | Nonfamily Households |
| 1-Person Households | - | 78 (28.9%) |
| 2-Person Households | 142 (52.6%) | 0 (0.0%) |
| 3-Person Households | 21 (7.8%) | 0 (0.0%) |
| 4-Person Households | 29 (10.7%) | 0 (0.0%) |
| 5-Person Households | 0 (0.0%) | 0 (0.0%) |
| 6-Person Households | 0 (0.0%) | 0 (0.0%) |
| 7+ Person Households | 0 (0.0%) | 0 (0.0%) |
| Total | 192 (71.1%) | 78 (28.9%) |
Female Fertility in Parkers Settlement
Fertility by Age in Parkers Settlement
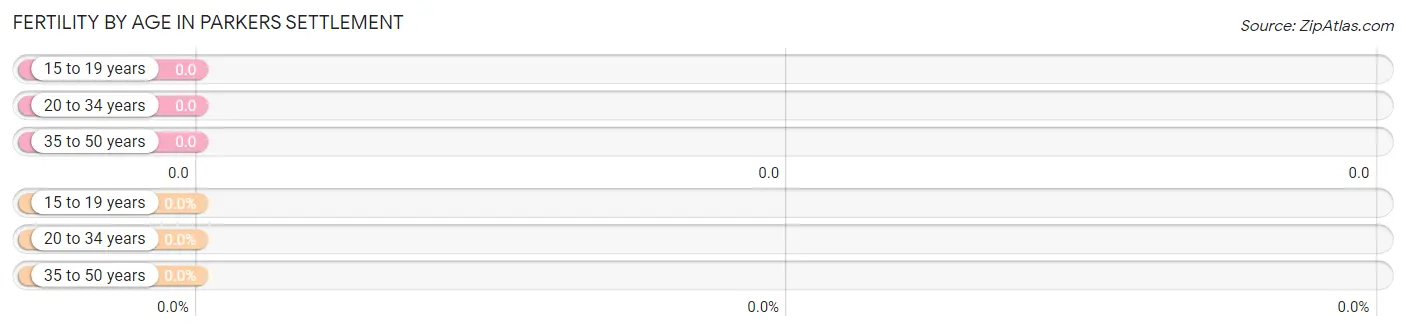
| Age Bracket | Women with Births | Births / 1,000 Women |
| 15 to 19 years | 0 (0.0%) | 0.0 |
| 20 to 34 years | 0 (0.0%) | 0.0 |
| 35 to 50 years | 0 (0.0%) | 0.0 |
| Total | 0 (0.0%) | 0.0 |
Fertility by Age by Marriage Status in Parkers Settlement
| Age Bracket | Married | Unmarried |
| 15 to 19 years | 0 (0.0%) | 0 (0.0%) |
| 20 to 34 years | 0 (0.0%) | 0 (0.0%) |
| 35 to 50 years | 0 (0.0%) | 0 (0.0%) |
| Total | 0 (0.0%) | 0 (0.0%) |
Fertility by Education in Parkers Settlement
| Educational Attainment | Women with Births | Births / 1,000 Women |
| Less than High School | 0 (0.0%) | 0.0 |
| High School Diploma | 0 (0.0%) | 0.0 |
| College or Associate's Degree | 0 (0.0%) | 0.0 |
| Bachelor's Degree | 0 (0.0%) | 0.0 |
| Graduate Degree | 0 (0.0%) | 0.0 |
| Total | 0 (0.0%) | 0.0 |
Fertility by Education by Marriage Status in Parkers Settlement
| Educational Attainment | Married | Unmarried |
| Less than High School | 0 (0.0%) | 0 (0.0%) |
| High School Diploma | 0 (0.0%) | 0 (0.0%) |
| College or Associate's Degree | 0 (0.0%) | 0 (0.0%) |
| Bachelor's Degree | 0 (0.0%) | 0 (0.0%) |
| Graduate Degree | 0 (0.0%) | 0 (0.0%) |
| Total | 0 (0.0%) | 0 (0.0%) |
Income in Parkers Settlement
Income Overview in Parkers Settlement
Per Capita Income in Parkers Settlement is $44,126, while median incomes of families and households are $108,824 and $69,850 respectively.
| Characteristic | Number | Measure |
| Per Capita Income | 547 | $44,126 |
| Median Family Income | 192 | $108,824 |
| Mean Family Income | 192 | $113,624 |
| Median Household Income | 270 | $69,850 |
| Mean Household Income | 270 | $95,061 |
| Income Deficit | 192 | $0 |
| Wage / Income Gap (%) | 547 | 0.00% |
| Wage / Income Gap ($) | 547 | 100.00¢ per $1 |
| Gini / Inequality Index | 547 | 0.35 |
Earnings by Sex in Parkers Settlement
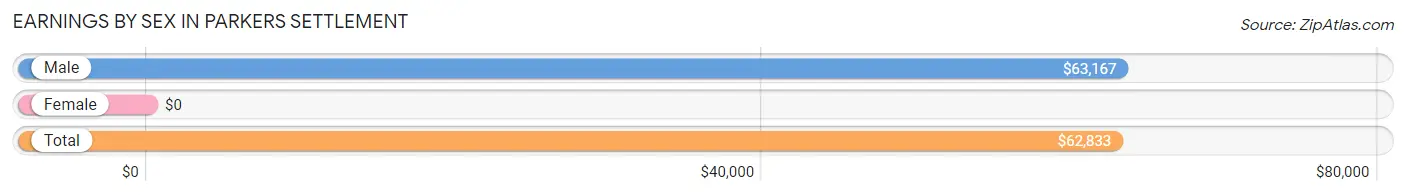
| Sex | Number | Average Earnings |
| Male | 204 (59.7%) | $63,167 |
| Female | 138 (40.4%) | $0 |
| Total | 342 (100.0%) | $62,833 |
Earnings by Sex by Income Bracket in Parkers Settlement
The most common earnings brackets in Parkers Settlement are $65,000 to $74,999 for men (64 | 31.4%) and $75,000 to $99,999 for women (53 | 38.4%).
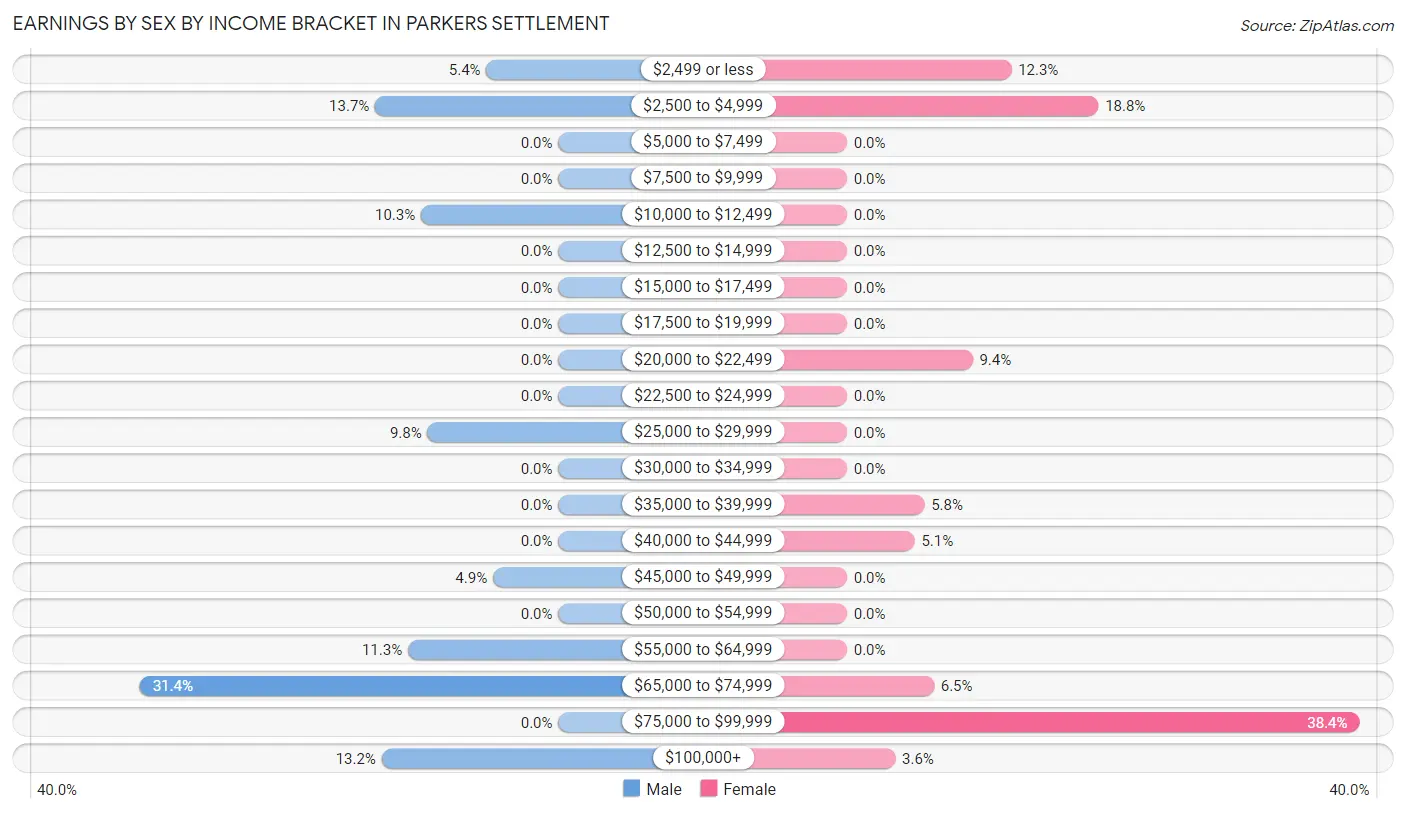
| Income | Male | Female |
| $2,499 or less | 11 (5.4%) | 17 (12.3%) |
| $2,500 to $4,999 | 28 (13.7%) | 26 (18.8%) |
| $5,000 to $7,499 | 0 (0.0%) | 0 (0.0%) |
| $7,500 to $9,999 | 0 (0.0%) | 0 (0.0%) |
| $10,000 to $12,499 | 21 (10.3%) | 0 (0.0%) |
| $12,500 to $14,999 | 0 (0.0%) | 0 (0.0%) |
| $15,000 to $17,499 | 0 (0.0%) | 0 (0.0%) |
| $17,500 to $19,999 | 0 (0.0%) | 0 (0.0%) |
| $20,000 to $22,499 | 0 (0.0%) | 13 (9.4%) |
| $22,500 to $24,999 | 0 (0.0%) | 0 (0.0%) |
| $25,000 to $29,999 | 20 (9.8%) | 0 (0.0%) |
| $30,000 to $34,999 | 0 (0.0%) | 0 (0.0%) |
| $35,000 to $39,999 | 0 (0.0%) | 8 (5.8%) |
| $40,000 to $44,999 | 0 (0.0%) | 7 (5.1%) |
| $45,000 to $49,999 | 10 (4.9%) | 0 (0.0%) |
| $50,000 to $54,999 | 0 (0.0%) | 0 (0.0%) |
| $55,000 to $64,999 | 23 (11.3%) | 0 (0.0%) |
| $65,000 to $74,999 | 64 (31.4%) | 9 (6.5%) |
| $75,000 to $99,999 | 0 (0.0%) | 53 (38.4%) |
| $100,000+ | 27 (13.2%) | 5 (3.6%) |
| Total | 204 (100.0%) | 138 (100.0%) |
Earnings by Sex by Educational Attainment in Parkers Settlement
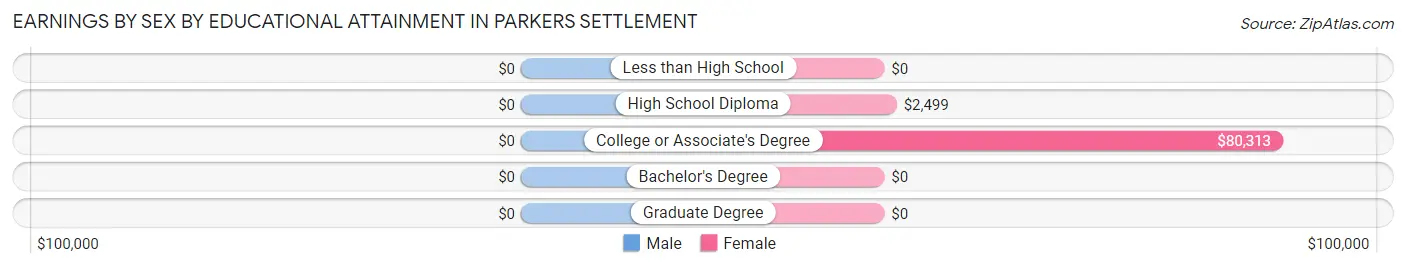
| Educational Attainment | Male Income | Female Income |
| Less than High School | - | - |
| High School Diploma | - | - |
| College or Associate's Degree | - | - |
| Bachelor's Degree | - | - |
| Graduate Degree | - | - |
| Total | $63,583 | $77,794 |
Family Income in Parkers Settlement
Family Income Brackets in Parkers Settlement
According to the Parkers Settlement family income data, there are 53 families falling into the $35,000 to $49,999 income range, which is the most common income bracket and makes up 27.6% of all families.
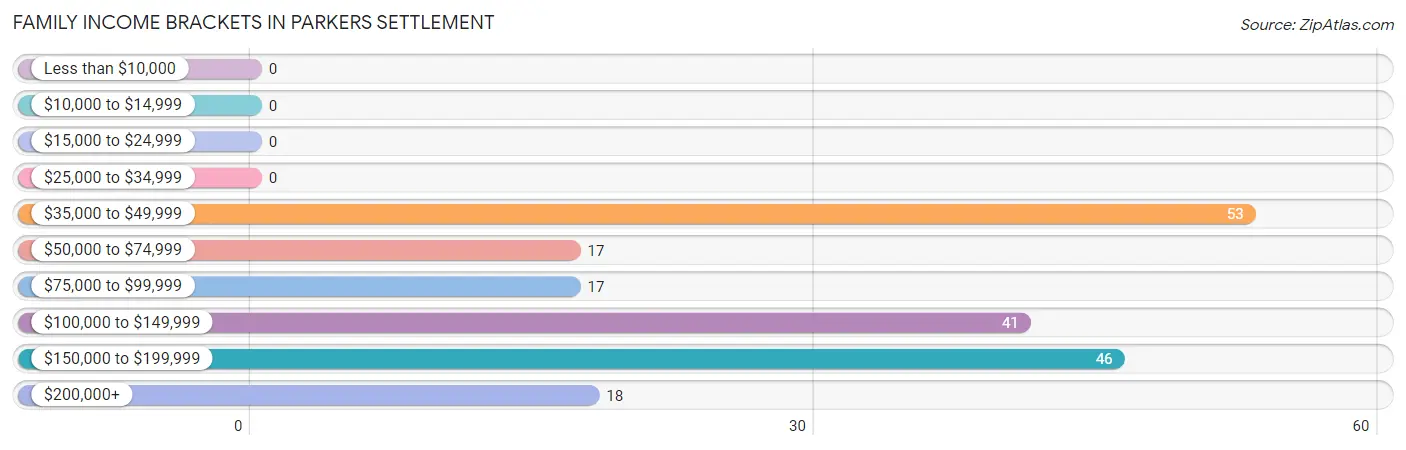
| Income Bracket | # Families | % Families |
| Less than $10,000 | 0 | 0.0% |
| $10,000 to $14,999 | 0 | 0.0% |
| $15,000 to $24,999 | 0 | 0.0% |
| $25,000 to $34,999 | 0 | 0.0% |
| $35,000 to $49,999 | 53 | 27.6% |
| $50,000 to $74,999 | 17 | 8.9% |
| $75,000 to $99,999 | 17 | 8.9% |
| $100,000 to $149,999 | 41 | 21.4% |
| $150,000 to $199,999 | 46 | 24.0% |
| $200,000+ | 18 | 9.4% |
Family Income by Famaliy Size in Parkers Settlement
4-person families (29 | 15.1%) account for the highest median family income in Parkers Settlement with $166,103 per family, while 4-person families (29 | 15.1%) have the highest median income of $41,526 per family member.
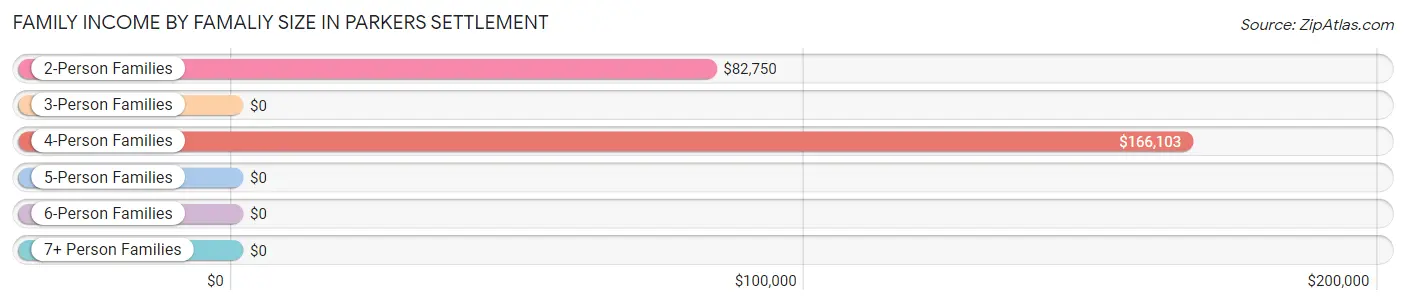
| Income Bracket | # Families | Median Income |
| 2-Person Families | 142 (74.0%) | $82,750 |
| 3-Person Families | 21 (10.9%) | $0 |
| 4-Person Families | 29 (15.1%) | $166,103 |
| 5-Person Families | 0 (0.0%) | $0 |
| 6-Person Families | 0 (0.0%) | $0 |
| 7+ Person Families | 0 (0.0%) | $0 |
| Total | 192 (100.0%) | $108,824 |
Family Income by Number of Earners in Parkers Settlement
The median family income in Parkers Settlement is $108,824, with families comprising 3+ earners (35) having the highest median family income of $230,250, while families with no earners (33) have the lowest median family income of $49,464, accounting for 18.2% and 17.2% of families, respectively.
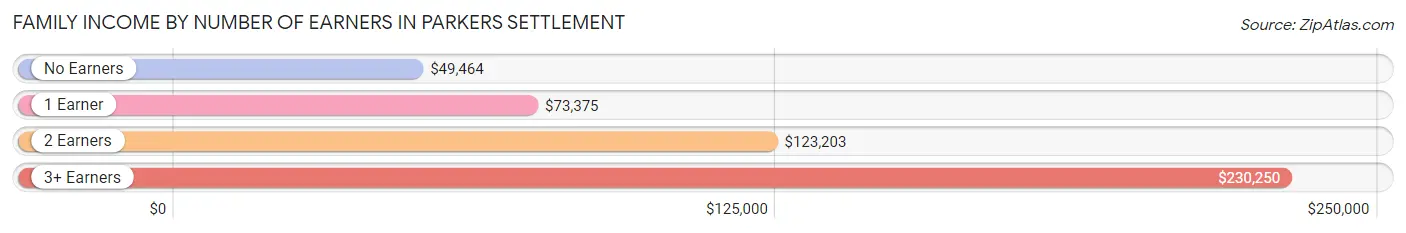
| Number of Earners | # Families | Median Income |
| No Earners | 33 (17.2%) | $49,464 |
| 1 Earner | 71 (37.0%) | $73,375 |
| 2 Earners | 53 (27.6%) | $123,203 |
| 3+ Earners | 35 (18.2%) | $230,250 |
| Total | 192 (100.0%) | $108,824 |
Household Income in Parkers Settlement
Household Income Brackets in Parkers Settlement
With 67 households falling in the category, the $50,000 to $74,999 income range is the most frequent in Parkers Settlement, accounting for 24.8% of all households.
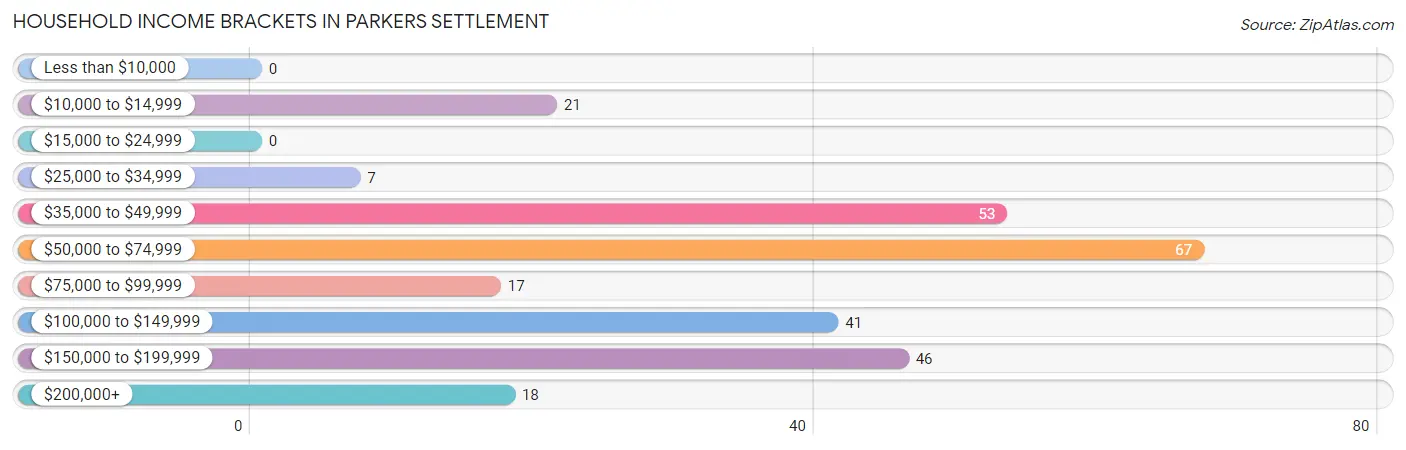
| Income Bracket | # Households | % Households |
| Less than $10,000 | 0 | 0.0% |
| $10,000 to $14,999 | 21 | 7.8% |
| $15,000 to $24,999 | 0 | 0.0% |
| $25,000 to $34,999 | 7 | 2.6% |
| $35,000 to $49,999 | 53 | 19.6% |
| $50,000 to $74,999 | 67 | 24.8% |
| $75,000 to $99,999 | 17 | 6.3% |
| $100,000 to $149,999 | 41 | 15.2% |
| $150,000 to $199,999 | 46 | 17.0% |
| $200,000+ | 18 | 6.7% |
Household Income by Householder Age in Parkers Settlement
The median household income in Parkers Settlement is $69,850, with the highest median household income of $123,203 found in the 45 to 64 years age bracket for the primary householder. A total of 93 households (34.4%) fall into this category.
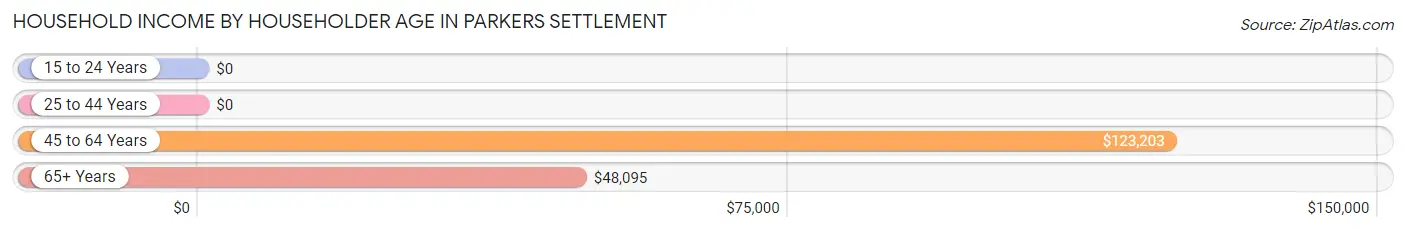
| Income Bracket | # Households | Median Income |
| 15 to 24 Years | 0 (0.0%) | $0 |
| 25 to 44 Years | 87 (32.2%) | $0 |
| 45 to 64 Years | 93 (34.4%) | $123,203 |
| 65+ Years | 90 (33.3%) | $48,095 |
| Total | 270 (100.0%) | $69,850 |
Poverty in Parkers Settlement
Income Below Poverty by Sex and Age in Parkers Settlement
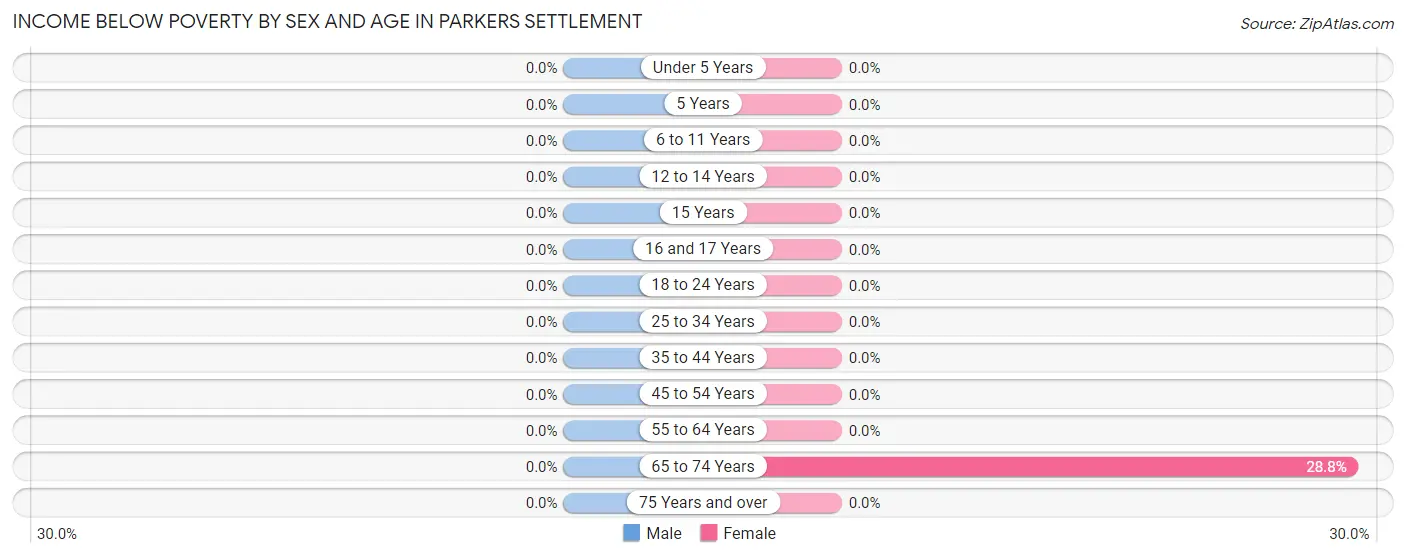
| Age Bracket | Male | Female |
| Under 5 Years | 0 (0.0%) | 0 (0.0%) |
| 5 Years | 0 (0.0%) | 0 (0.0%) |
| 6 to 11 Years | 0 (0.0%) | 0 (0.0%) |
| 12 to 14 Years | 0 (0.0%) | 0 (0.0%) |
| 15 Years | 0 (0.0%) | 0 (0.0%) |
| 16 and 17 Years | 0 (0.0%) | 0 (0.0%) |
| 18 to 24 Years | 0 (0.0%) | 0 (0.0%) |
| 25 to 34 Years | 0 (0.0%) | 0 (0.0%) |
| 35 to 44 Years | 0 (0.0%) | 0 (0.0%) |
| 45 to 54 Years | 0 (0.0%) | 0 (0.0%) |
| 55 to 64 Years | 0 (0.0%) | 0 (0.0%) |
| 65 to 74 Years | 0 (0.0%) | 21 (28.8%) |
| 75 Years and over | 0 (0.0%) | 0 (0.0%) |
| Total | 0 (0.0%) | 21 (7.8%) |
Income Above Poverty by Sex and Age in Parkers Settlement
According to the poverty statistics in Parkers Settlement, males aged under 5 years and females aged 12 to 14 years are the age groups that are most secure financially, with 100.0% of males and 100.0% of females in these age groups living above the poverty line.
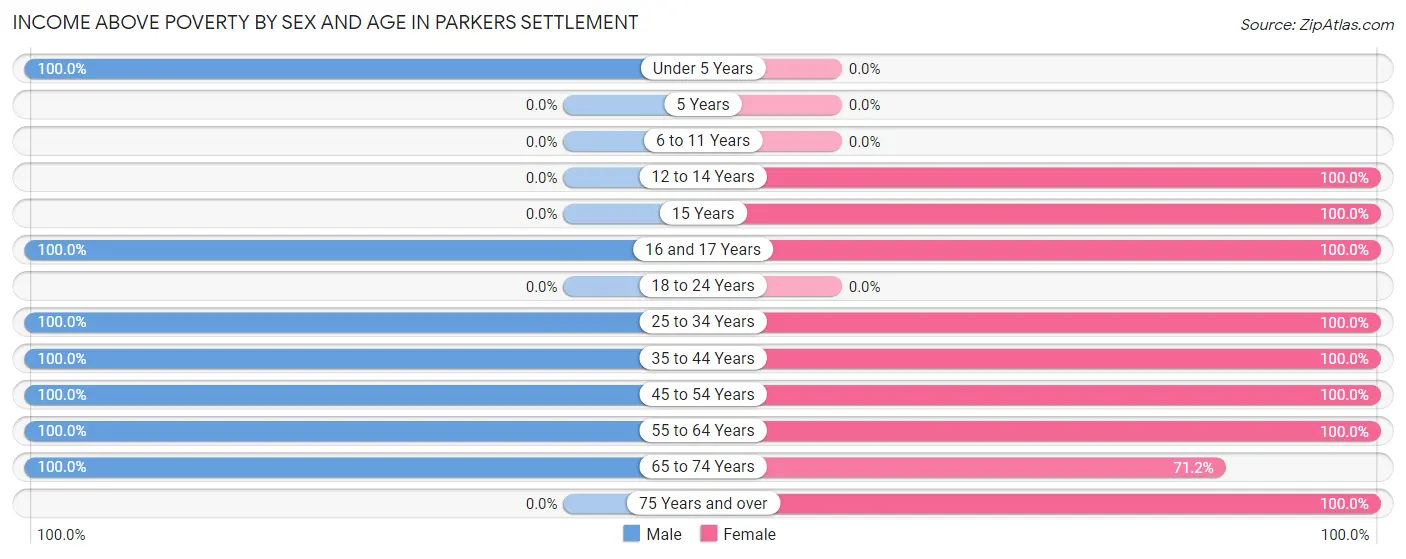
| Age Bracket | Male | Female |
| Under 5 Years | 9 (100.0%) | 0 (0.0%) |
| 5 Years | 0 (0.0%) | 0 (0.0%) |
| 6 to 11 Years | 0 (0.0%) | 0 (0.0%) |
| 12 to 14 Years | 0 (0.0%) | 5 (100.0%) |
| 15 Years | 0 (0.0%) | 26 (100.0%) |
| 16 and 17 Years | 5 (100.0%) | 26 (100.0%) |
| 18 to 24 Years | 0 (0.0%) | 0 (0.0%) |
| 25 to 34 Years | 78 (100.0%) | 18 (100.0%) |
| 35 to 44 Years | 39 (100.0%) | 7 (100.0%) |
| 45 to 54 Years | 35 (100.0%) | 43 (100.0%) |
| 55 to 64 Years | 61 (100.0%) | 60 (100.0%) |
| 65 to 74 Years | 52 (100.0%) | 52 (71.2%) |
| 75 Years and over | 0 (0.0%) | 10 (100.0%) |
| Total | 279 (100.0%) | 247 (92.2%) |
Income Below Poverty Among Married-Couple Families in Parkers Settlement
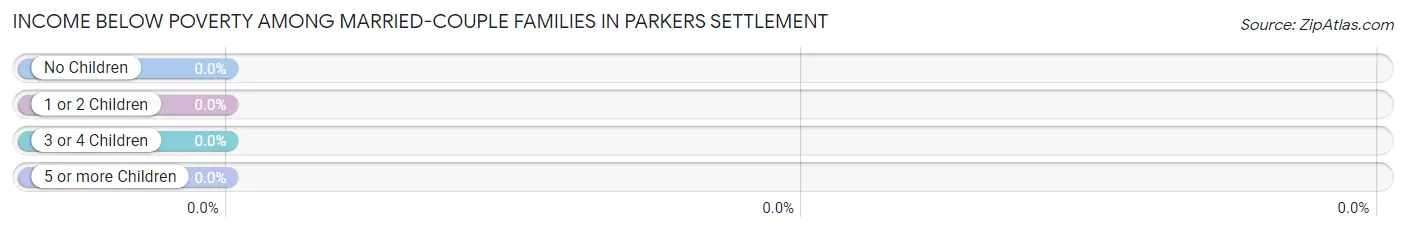
| Children | Above Poverty | Below Poverty |
| No Children | 140 (100.0%) | 0 (0.0%) |
| 1 or 2 Children | 30 (100.0%) | 0 (0.0%) |
| 3 or 4 Children | 0 (0.0%) | 0 (0.0%) |
| 5 or more Children | 0 (0.0%) | 0 (0.0%) |
| Total | 170 (100.0%) | 0 (0.0%) |
Income Below Poverty Among Single-Parent Households in Parkers Settlement
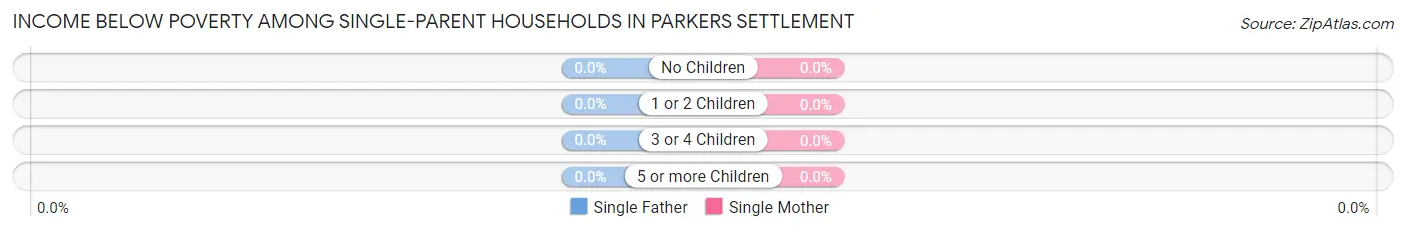
| Children | Single Father | Single Mother |
| No Children | 0 (0.0%) | 0 (0.0%) |
| 1 or 2 Children | 0 (0.0%) | 0 (0.0%) |
| 3 or 4 Children | 0 (0.0%) | 0 (0.0%) |
| 5 or more Children | 0 (0.0%) | 0 (0.0%) |
| Total | 0 (0.0%) | 0 (0.0%) |
Income Below Poverty Among Married-Couple vs Single-Parent Households in Parkers Settlement
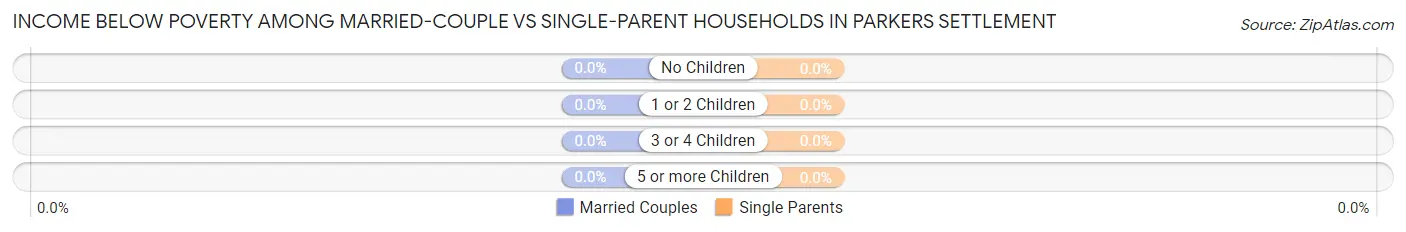
| Children | Married-Couple Families | Single-Parent Households |
| No Children | 0 (0.0%) | 0 (0.0%) |
| 1 or 2 Children | 0 (0.0%) | 0 (0.0%) |
| 3 or 4 Children | 0 (0.0%) | 0 (0.0%) |
| 5 or more Children | 0 (0.0%) | 0 (0.0%) |
| Total | 0 (0.0%) | 0 (0.0%) |
Employment Characteristics in Parkers Settlement
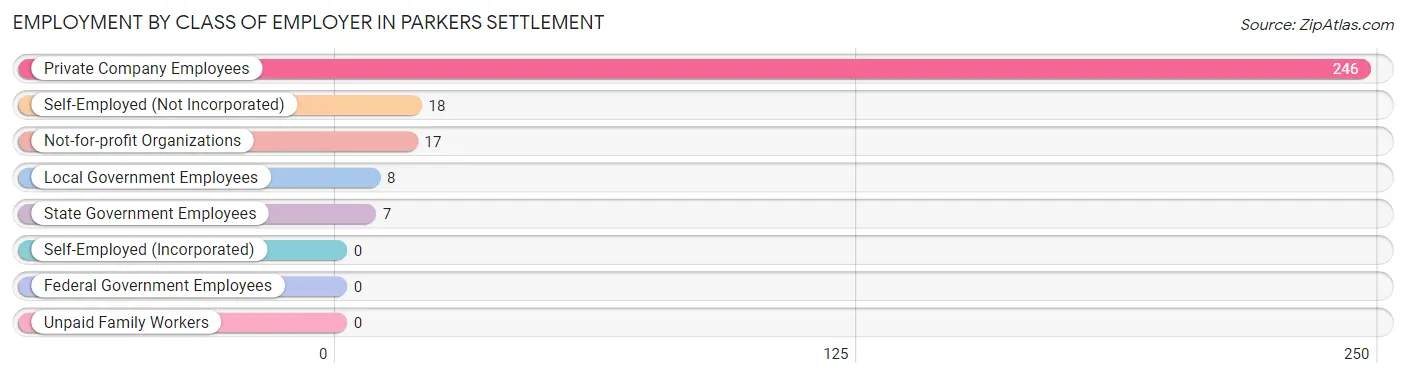
Employment by Class of Employer in Parkers Settlement
Among the 296 employed individuals in Parkers Settlement, private company employees (246 | 83.1%), self-employed (not incorporated) (18 | 6.1%), and not-for-profit organizations (17 | 5.7%) make up the most common classes of employment.
| Employer Class | # Employees | % Employees |
| Private Company Employees | 246 | 83.1% |
| Self-Employed (Incorporated) | 0 | 0.0% |
| Self-Employed (Not Incorporated) | 18 | 6.1% |
| Not-for-profit Organizations | 17 | 5.7% |
| Local Government Employees | 8 | 2.7% |
| State Government Employees | 7 | 2.4% |
| Federal Government Employees | 0 | 0.0% |
| Unpaid Family Workers | 0 | 0.0% |
| Total | 296 | 100.0% |
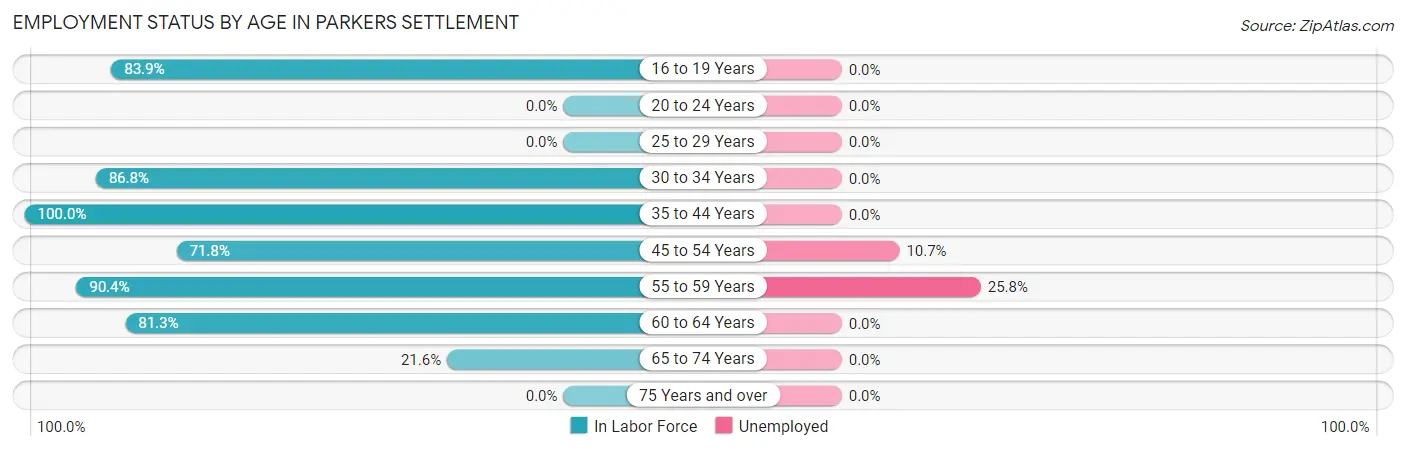
Employment Status by Age in Parkers Settlement
According to the labor force statistics for Parkers Settlement, out of the total population over 16 years of age (507), 62.9% or 319 individuals are in the labor force, with 7.2% or 23 of them unemployed. The age group with the highest labor force participation rate is 35 to 44 years, with 100.0% or 46 individuals in the labor force. Within the labor force, the 55 to 59 years age range has the highest percentage of unemployed individuals, with 25.8% or 17 of them being unemployed.
| Age Bracket | In Labor Force | Unemployed |
| 16 to 19 Years | 26 (83.9%) | 0 (0.0%) |
| 20 to 24 Years | 0 (0.0%) | 0 (0.0%) |
| 25 to 29 Years | 0 (0.0%) | 0 (0.0%) |
| 30 to 34 Years | 59 (86.8%) | 0 (0.0%) |
| 35 to 44 Years | 46 (100.0%) | 0 (0.0%) |
| 45 to 54 Years | 56 (71.8%) | 6 (10.7%) |
| 55 to 59 Years | 66 (90.4%) | 17 (25.8%) |
| 60 to 64 Years | 39 (81.3%) | 0 (0.0%) |
| 65 to 74 Years | 27 (21.6%) | 0 (0.0%) |
| 75 Years and over | 0 (0.0%) | 0 (0.0%) |
| Total | 319 (62.9%) | 23 (7.2%) |
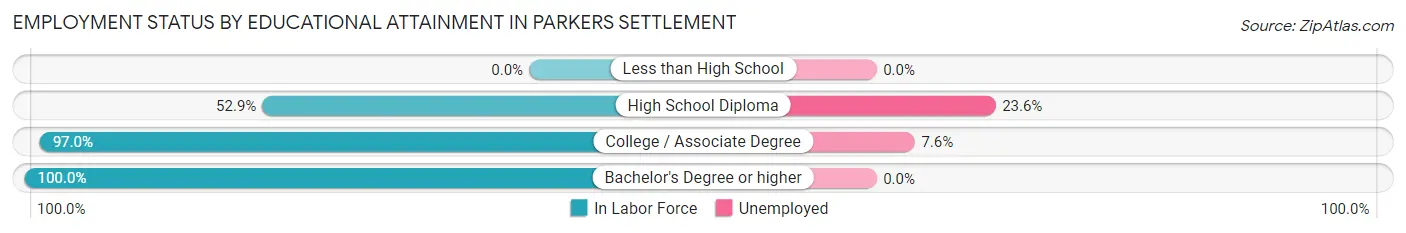
Employment Status by Educational Attainment in Parkers Settlement
According to labor force statistics for Parkers Settlement, 78.0% of individuals (266) out of the total population between 25 and 64 years of age (341) are in the labor force, with 8.6% or 23 of them being unemployed. The group with the highest labor force participation rate are those with the educational attainment of bachelor's degree or higher, with 100.0% or 80 individuals in the labor force. Within the labor force, individuals with high school diploma education have the highest percentage of unemployment, with 23.6% or 13 of them being unemployed.
| Educational Attainment | In Labor Force | Unemployed |
| Less than High School | 0 (0.0%) | 0 (0.0%) |
| High School Diploma | 55 (52.9%) | 25 (23.6%) |
| College / Associate Degree | 131 (97.0%) | 10 (7.6%) |
| Bachelor's Degree or higher | 80 (100.0%) | 0 (0.0%) |
| Total | 266 (78.0%) | 29 (8.6%) |
Employment Occupations by Sex in Parkers Settlement
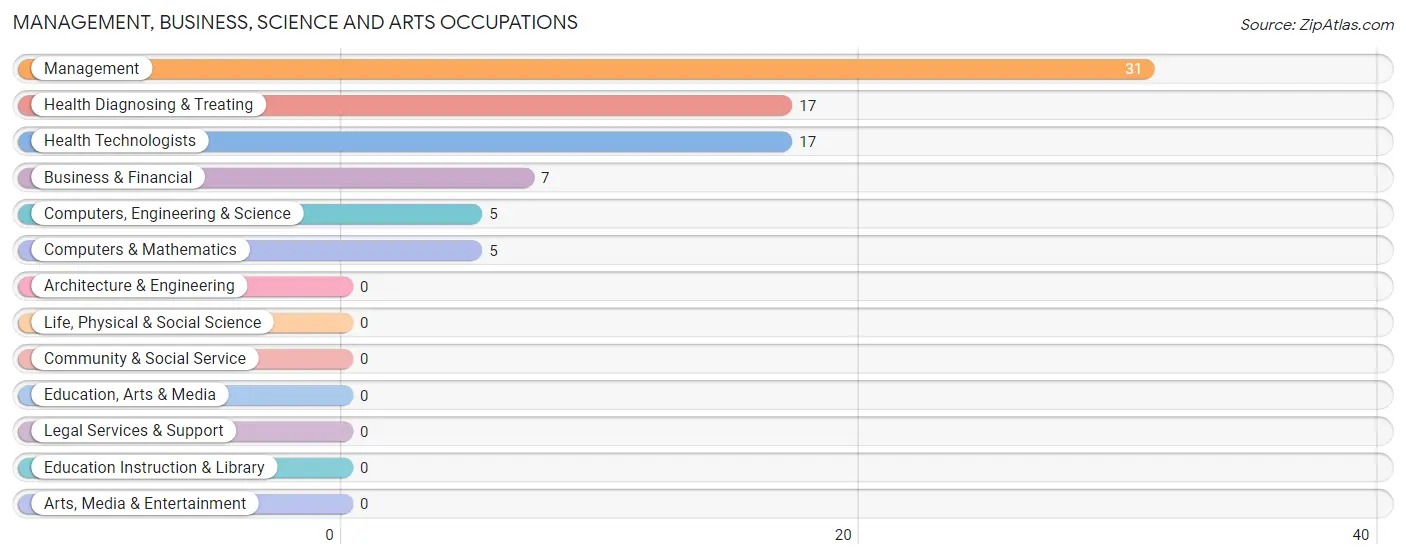
Management, Business, Science and Arts Occupations
The most common Management, Business, Science and Arts occupations in Parkers Settlement are Management (31 | 10.5%), Health Diagnosing & Treating (17 | 5.7%), Health Technologists (17 | 5.7%), Business & Financial (7 | 2.4%), and Computers, Engineering & Science (5 | 1.7%).
Management, Business, Science and Arts Occupations by Sex
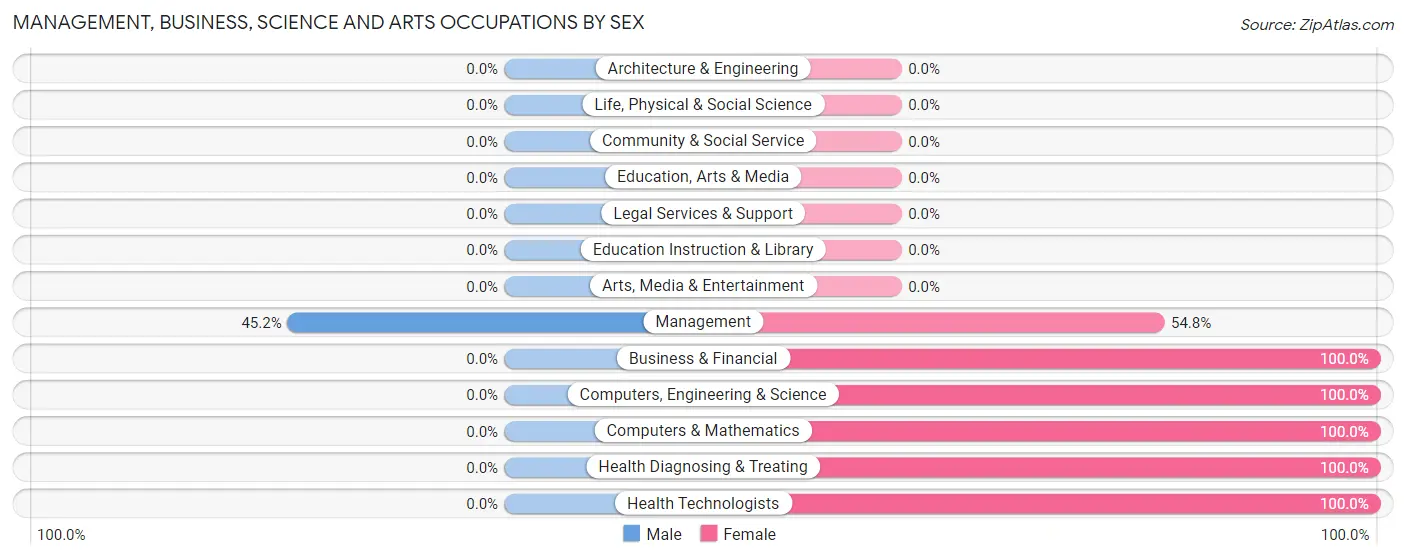
| Occupation | Male | Female |
| Management | 14 (45.2%) | 17 (54.8%) |
| Business & Financial | 0 (0.0%) | 7 (100.0%) |
| Computers, Engineering & Science | 0 (0.0%) | 5 (100.0%) |
| Computers & Mathematics | 0 (0.0%) | 5 (100.0%) |
| Architecture & Engineering | 0 (0.0%) | 0 (0.0%) |
| Life, Physical & Social Science | 0 (0.0%) | 0 (0.0%) |
| Community & Social Service | 0 (0.0%) | 0 (0.0%) |
| Education, Arts & Media | 0 (0.0%) | 0 (0.0%) |
| Legal Services & Support | 0 (0.0%) | 0 (0.0%) |
| Education Instruction & Library | 0 (0.0%) | 0 (0.0%) |
| Arts, Media & Entertainment | 0 (0.0%) | 0 (0.0%) |
| Health Diagnosing & Treating | 0 (0.0%) | 17 (100.0%) |
| Health Technologists | 0 (0.0%) | 17 (100.0%) |
| Total (Category) | 14 (23.3%) | 46 (76.7%) |
| Total (Overall) | 165 (55.7%) | 131 (44.3%) |
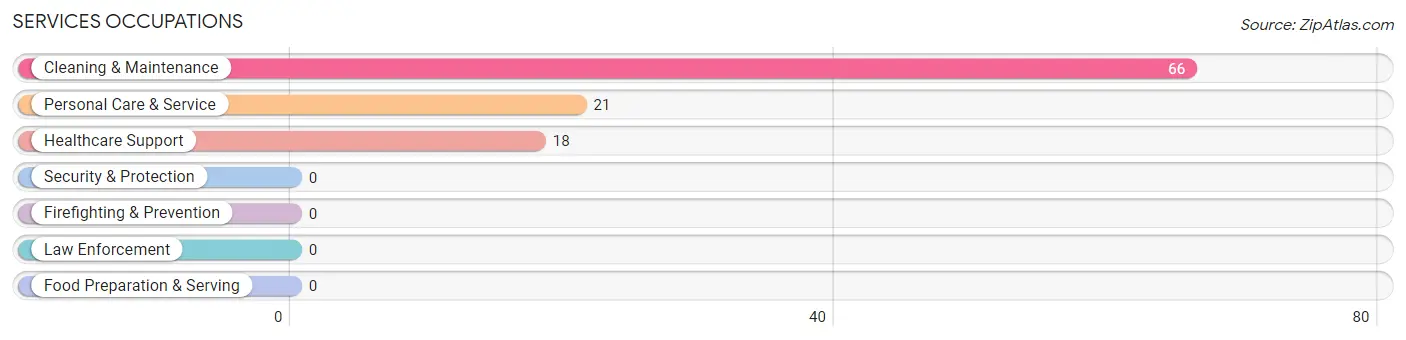
Services Occupations
The most common Services occupations in Parkers Settlement are Cleaning & Maintenance (66 | 22.3%), Personal Care & Service (21 | 7.1%), and Healthcare Support (18 | 6.1%).
Services Occupations by Sex
Within the Services occupations in Parkers Settlement, the most male-oriented occupations are Cleaning & Maintenance (100.0%), and Healthcare Support (27.8%), while the most female-oriented occupations are Personal Care & Service (100.0%), and Healthcare Support (72.2%).
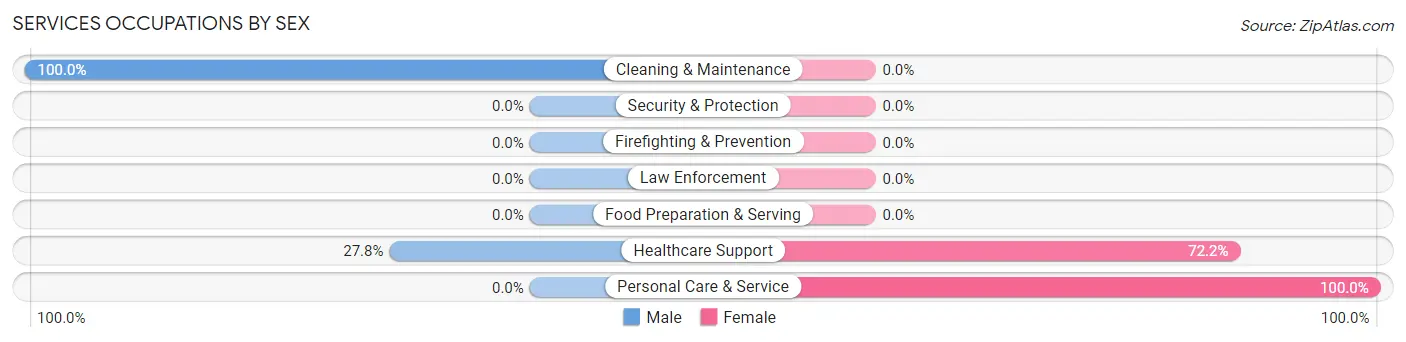
| Occupation | Male | Female |
| Healthcare Support | 5 (27.8%) | 13 (72.2%) |
| Security & Protection | 0 (0.0%) | 0 (0.0%) |
| Firefighting & Prevention | 0 (0.0%) | 0 (0.0%) |
| Law Enforcement | 0 (0.0%) | 0 (0.0%) |
| Food Preparation & Serving | 0 (0.0%) | 0 (0.0%) |
| Cleaning & Maintenance | 66 (100.0%) | 0 (0.0%) |
| Personal Care & Service | 0 (0.0%) | 21 (100.0%) |
| Total (Category) | 71 (67.6%) | 34 (32.4%) |
| Total (Overall) | 165 (55.7%) | 131 (44.3%) |
Sales and Office Occupations
The most common Sales and Office occupations in Parkers Settlement are Sales & Related (48 | 16.2%), and Office & Administration (48 | 16.2%).
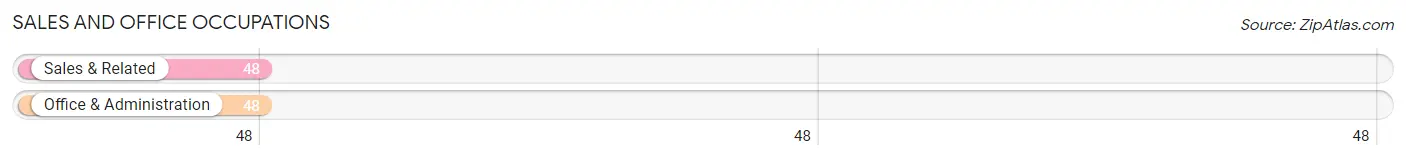
Sales and Office Occupations by Sex
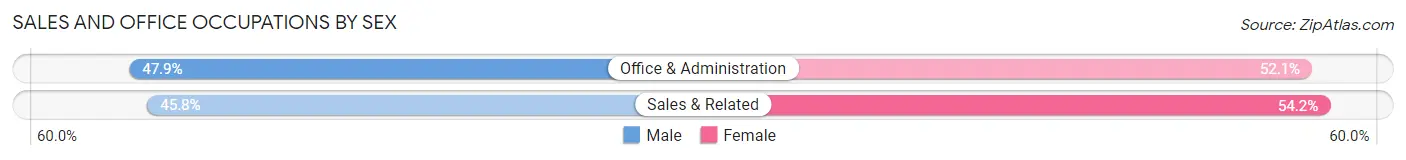
| Occupation | Male | Female |
| Sales & Related | 22 (45.8%) | 26 (54.2%) |
| Office & Administration | 23 (47.9%) | 25 (52.1%) |
| Total (Category) | 45 (46.9%) | 51 (53.1%) |
| Total (Overall) | 165 (55.7%) | 131 (44.3%) |
Natural Resources, Construction and Maintenance Occupations
Natural Resources, Construction and Maintenance Occupations by Sex
| Occupation | Male | Female |
| Farming, Fishing & Forestry | 0 (0.0%) | 0 (0.0%) |
| Construction & Extraction | 0 (0.0%) | 0 (0.0%) |
| Installation, Maintenance & Repair | 0 (0.0%) | 0 (0.0%) |
| Total (Category) | 0 (0.0%) | 0 (0.0%) |
| Total (Overall) | 165 (55.7%) | 131 (44.3%) |
Production, Transportation and Moving Occupations
The most common Production, Transportation and Moving occupations in Parkers Settlement are Material Moving (20 | 6.8%), and Production (15 | 5.1%).
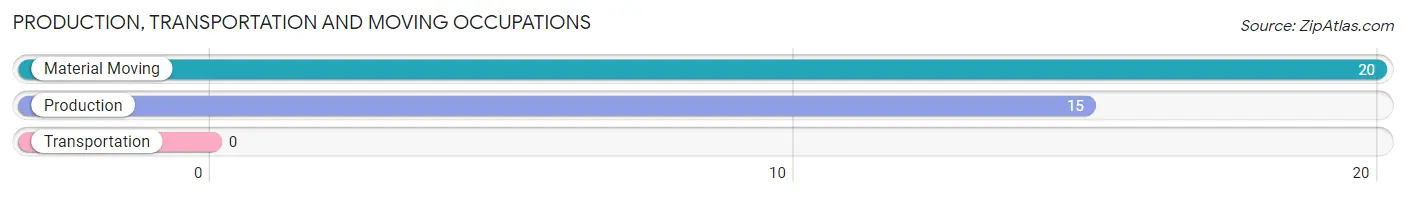
Production, Transportation and Moving Occupations by Sex
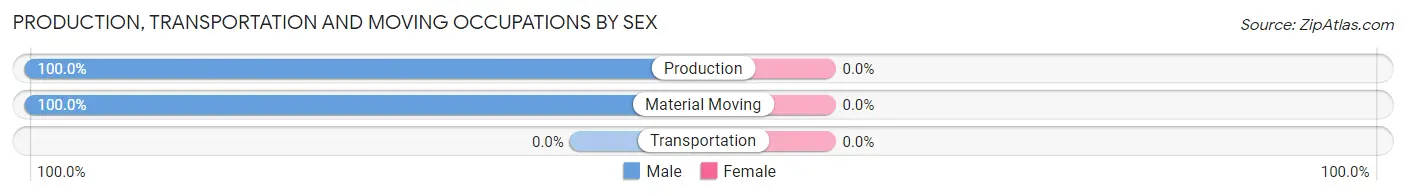
| Occupation | Male | Female |
| Production | 15 (100.0%) | 0 (0.0%) |
| Transportation | 0 (0.0%) | 0 (0.0%) |
| Material Moving | 20 (100.0%) | 0 (0.0%) |
| Total (Category) | 35 (100.0%) | 0 (0.0%) |
| Total (Overall) | 165 (55.7%) | 131 (44.3%) |
Employment Industries by Sex in Parkers Settlement
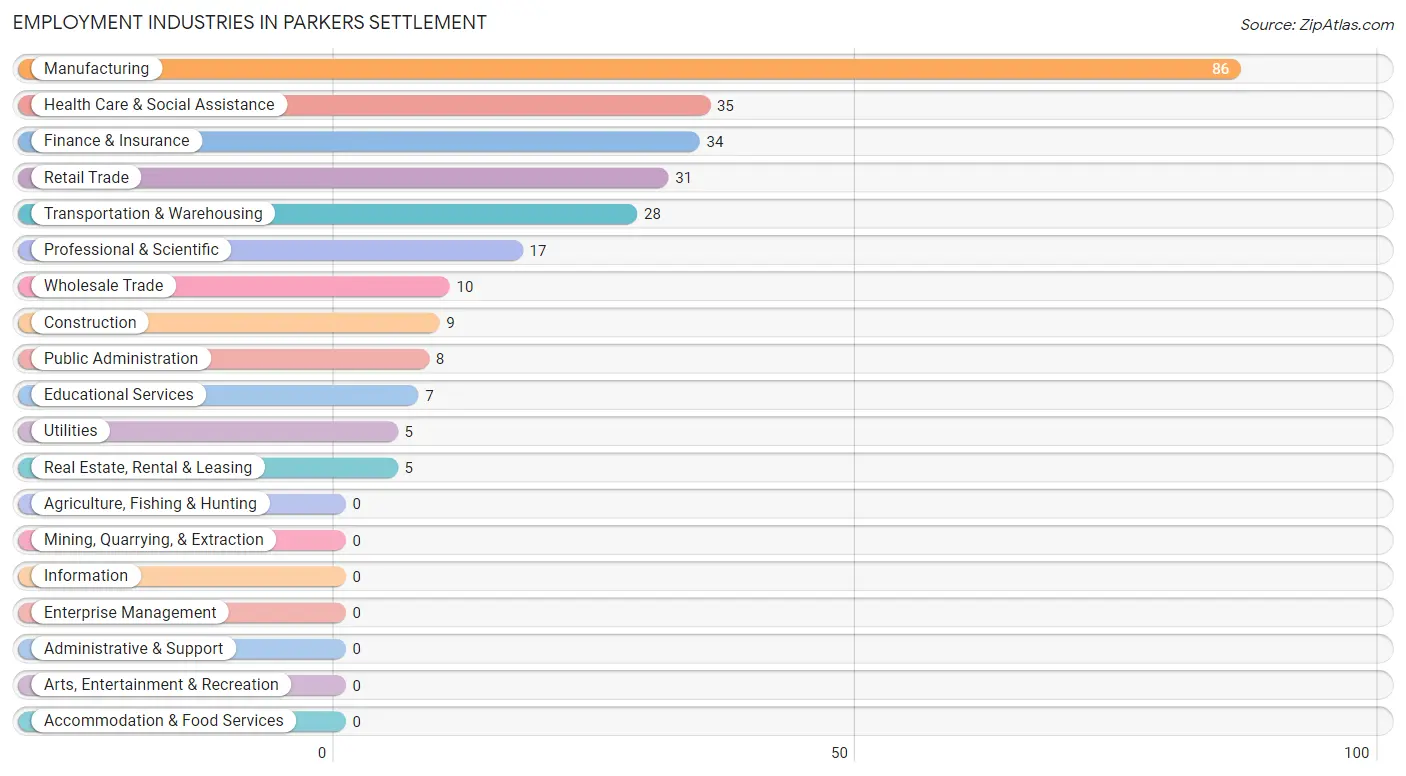
Employment Industries in Parkers Settlement
The major employment industries in Parkers Settlement include Manufacturing (86 | 29.0%), Health Care & Social Assistance (35 | 11.8%), Finance & Insurance (34 | 11.5%), Retail Trade (31 | 10.5%), and Transportation & Warehousing (28 | 9.5%).
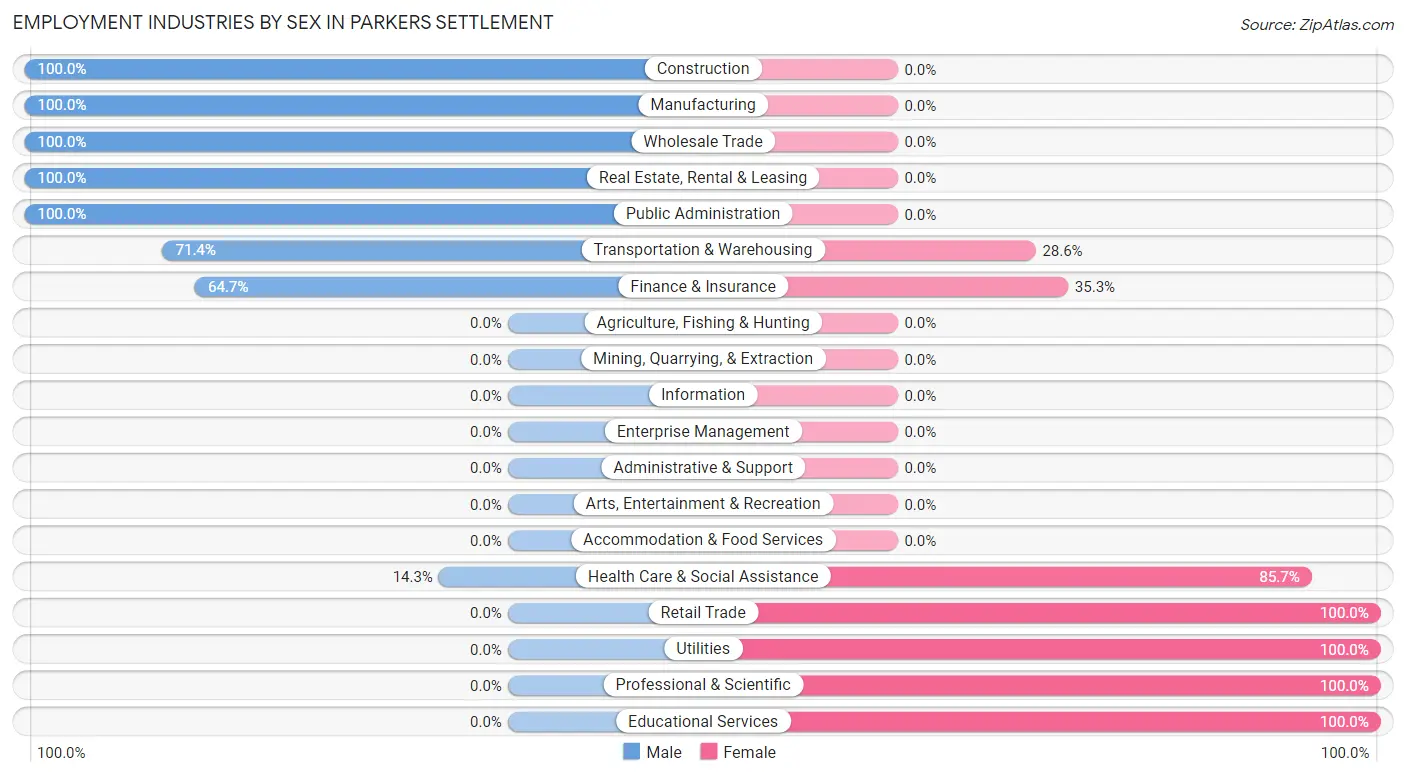
Employment Industries by Sex in Parkers Settlement
The Parkers Settlement industries that see more men than women are Construction (100.0%), Manufacturing (100.0%), and Wholesale Trade (100.0%), whereas the industries that tend to have a higher number of women are Retail Trade (100.0%), Utilities (100.0%), and Professional & Scientific (100.0%).
| Industry | Male | Female |
| Agriculture, Fishing & Hunting | 0 (0.0%) | 0 (0.0%) |
| Mining, Quarrying, & Extraction | 0 (0.0%) | 0 (0.0%) |
| Construction | 9 (100.0%) | 0 (0.0%) |
| Manufacturing | 86 (100.0%) | 0 (0.0%) |
| Wholesale Trade | 10 (100.0%) | 0 (0.0%) |
| Retail Trade | 0 (0.0%) | 31 (100.0%) |
| Transportation & Warehousing | 20 (71.4%) | 8 (28.6%) |
| Utilities | 0 (0.0%) | 5 (100.0%) |
| Information | 0 (0.0%) | 0 (0.0%) |
| Finance & Insurance | 22 (64.7%) | 12 (35.3%) |
| Real Estate, Rental & Leasing | 5 (100.0%) | 0 (0.0%) |
| Professional & Scientific | 0 (0.0%) | 17 (100.0%) |
| Enterprise Management | 0 (0.0%) | 0 (0.0%) |
| Administrative & Support | 0 (0.0%) | 0 (0.0%) |
| Educational Services | 0 (0.0%) | 7 (100.0%) |
| Health Care & Social Assistance | 5 (14.3%) | 30 (85.7%) |
| Arts, Entertainment & Recreation | 0 (0.0%) | 0 (0.0%) |
| Accommodation & Food Services | 0 (0.0%) | 0 (0.0%) |
| Public Administration | 8 (100.0%) | 0 (0.0%) |
| Total | 165 (55.7%) | 131 (44.3%) |
Education in Parkers Settlement
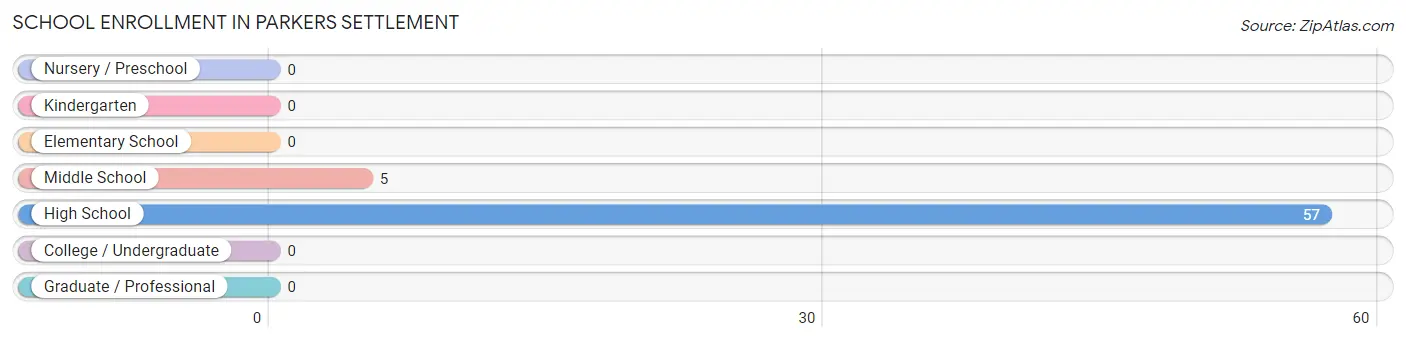
School Enrollment in Parkers Settlement
The most common levels of schooling among the 62 students in Parkers Settlement are high school (57 | 91.9%), and middle school (5 | 8.1%).
| School Level | # Students | % Students |
| Nursery / Preschool | 0 | 0.0% |
| Kindergarten | 0 | 0.0% |
| Elementary School | 0 | 0.0% |
| Middle School | 5 | 8.1% |
| High School | 57 | 91.9% |
| College / Undergraduate | 0 | 0.0% |
| Graduate / Professional | 0 | 0.0% |
| Total | 62 | 100.0% |
School Enrollment by Age by Funding Source in Parkers Settlement
Out of a total of 62 students who are enrolled in schools in Parkers Settlement, 10 (16.1%) attend a private institution, while the remaining 52 (83.9%) are enrolled in public schools. The age group of 10 to 14 year olds has the highest likelihood of being enrolled in private schools, with 5 (100.0% in the age bracket) enrolled. Conversely, the age group of 15 to 17 year olds has the lowest likelihood of being enrolled in a private school, with 52 (91.2% in the age bracket) attending a public institution.
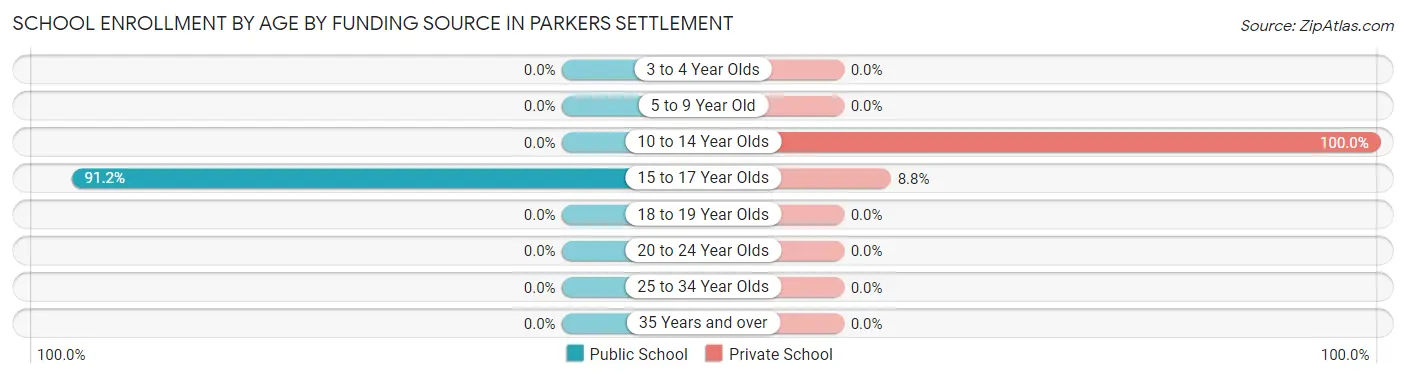
| Age Bracket | Public School | Private School |
| 3 to 4 Year Olds | 0 (0.0%) | 0 (0.0%) |
| 5 to 9 Year Old | 0 (0.0%) | 0 (0.0%) |
| 10 to 14 Year Olds | 0 (0.0%) | 5 (100.0%) |
| 15 to 17 Year Olds | 52 (91.2%) | 5 (8.8%) |
| 18 to 19 Year Olds | 0 (0.0%) | 0 (0.0%) |
| 20 to 24 Year Olds | 0 (0.0%) | 0 (0.0%) |
| 25 to 34 Year Olds | 0 (0.0%) | 0 (0.0%) |
| 35 Years and over | 0 (0.0%) | 0 (0.0%) |
| Total | 52 (83.9%) | 10 (16.1%) |
Educational Attainment by Field of Study in Parkers Settlement
Arts & humanities (43 | 38.1%), communications (27 | 23.9%), physical & health sciences (25 | 22.1%), engineering (10 | 8.8%), and business (8 | 7.1%) are the most common fields of study among 113 individuals in Parkers Settlement who have obtained a bachelor's degree or higher.
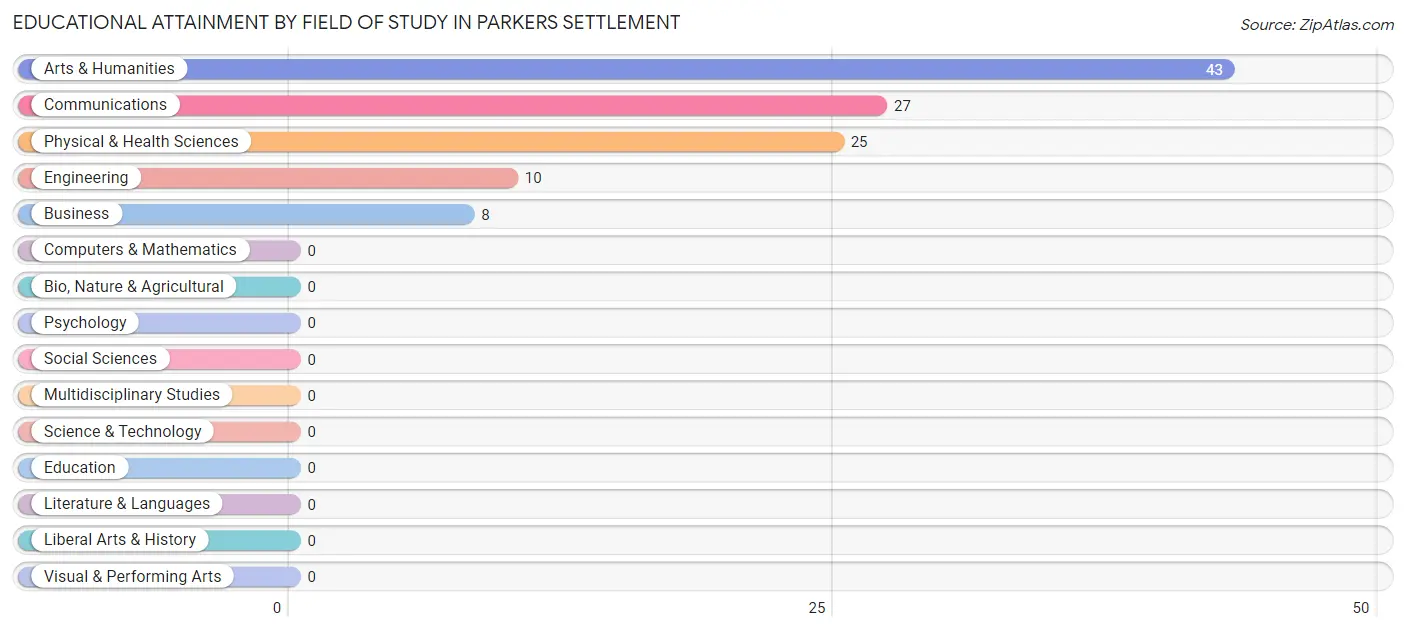
| Field of Study | # Graduates | % Graduates |
| Computers & Mathematics | 0 | 0.0% |
| Bio, Nature & Agricultural | 0 | 0.0% |
| Physical & Health Sciences | 25 | 22.1% |
| Psychology | 0 | 0.0% |
| Social Sciences | 0 | 0.0% |
| Engineering | 10 | 8.8% |
| Multidisciplinary Studies | 0 | 0.0% |
| Science & Technology | 0 | 0.0% |
| Business | 8 | 7.1% |
| Education | 0 | 0.0% |
| Literature & Languages | 0 | 0.0% |
| Liberal Arts & History | 0 | 0.0% |
| Visual & Performing Arts | 0 | 0.0% |
| Communications | 27 | 23.9% |
| Arts & Humanities | 43 | 38.1% |
| Total | 113 | 100.0% |
Transportation & Commute in Parkers Settlement
Vehicle Availability by Sex in Parkers Settlement
The most prevalent vehicle ownership categories in Parkers Settlement are males with 3 vehicles (118, accounting for 71.5%) and females with 3 vehicles (47, making up 90.1%).
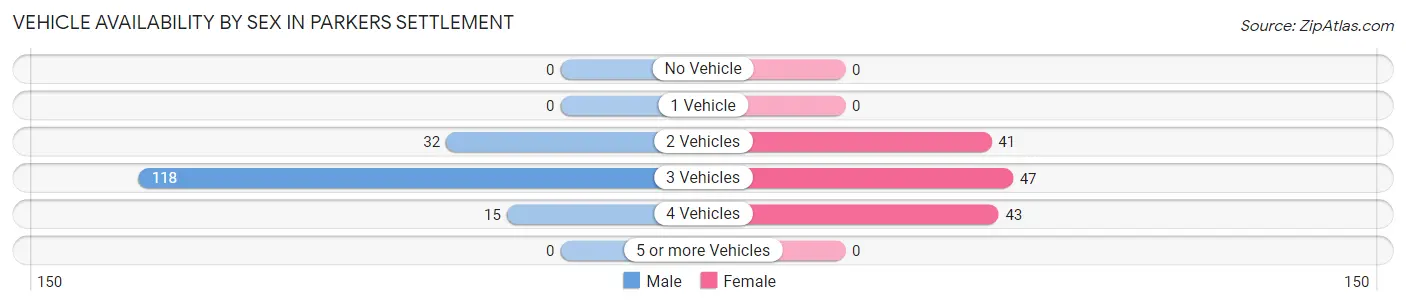
| Vehicles Available | Male | Female |
| No Vehicle | 0 (0.0%) | 0 (0.0%) |
| 1 Vehicle | 0 (0.0%) | 0 (0.0%) |
| 2 Vehicles | 32 (19.4%) | 41 (31.3%) |
| 3 Vehicles | 118 (71.5%) | 47 (35.9%) |
| 4 Vehicles | 15 (9.1%) | 43 (32.8%) |
| 5 or more Vehicles | 0 (0.0%) | 0 (0.0%) |
| Total | 165 (100.0%) | 131 (100.0%) |
Commute Time in Parkers Settlement
The most frequently occuring commute durations in Parkers Settlement are 20 to 24 minutes (128 commuters, 52.2%), 10 to 14 minutes (41 commuters, 16.7%), and 25 to 29 minutes (41 commuters, 16.7%).
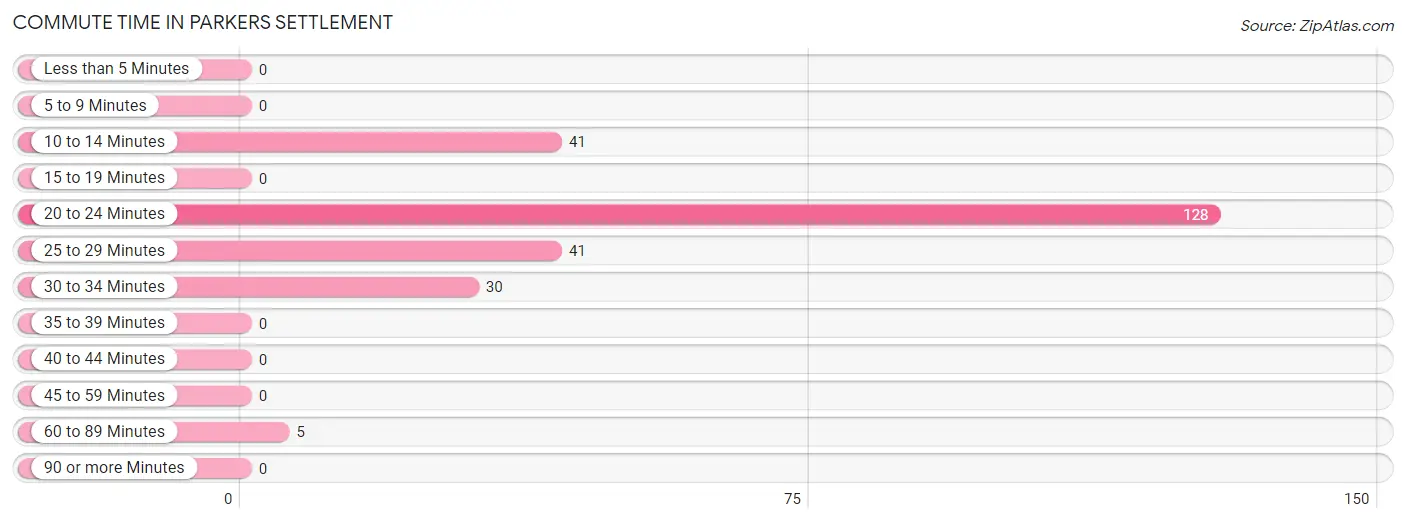
| Commute Time | # Commuters | % Commuters |
| Less than 5 Minutes | 0 | 0.0% |
| 5 to 9 Minutes | 0 | 0.0% |
| 10 to 14 Minutes | 41 | 16.7% |
| 15 to 19 Minutes | 0 | 0.0% |
| 20 to 24 Minutes | 128 | 52.2% |
| 25 to 29 Minutes | 41 | 16.7% |
| 30 to 34 Minutes | 30 | 12.2% |
| 35 to 39 Minutes | 0 | 0.0% |
| 40 to 44 Minutes | 0 | 0.0% |
| 45 to 59 Minutes | 0 | 0.0% |
| 60 to 89 Minutes | 5 | 2.0% |
| 90 or more Minutes | 0 | 0.0% |
Commute Time by Sex in Parkers Settlement
The most common commute times in Parkers Settlement are 20 to 24 minutes (98 commuters, 64.9%) for males and 10 to 14 minutes (33 commuters, 35.1%) for females.
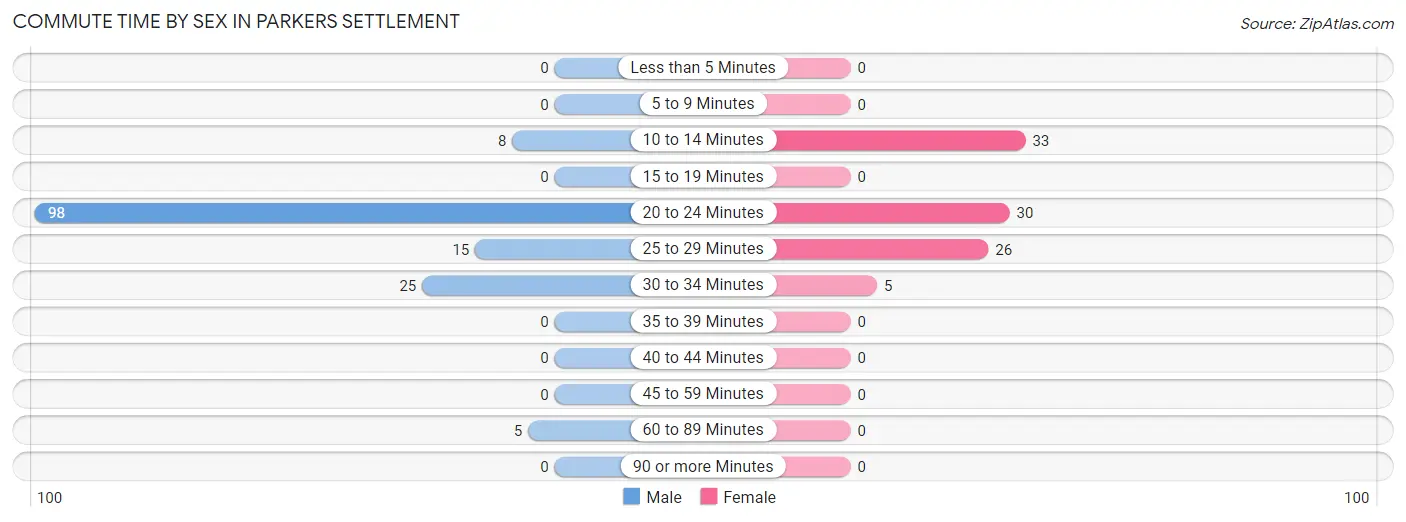
| Commute Time | Male | Female |
| Less than 5 Minutes | 0 (0.0%) | 0 (0.0%) |
| 5 to 9 Minutes | 0 (0.0%) | 0 (0.0%) |
| 10 to 14 Minutes | 8 (5.3%) | 33 (35.1%) |
| 15 to 19 Minutes | 0 (0.0%) | 0 (0.0%) |
| 20 to 24 Minutes | 98 (64.9%) | 30 (31.9%) |
| 25 to 29 Minutes | 15 (9.9%) | 26 (27.7%) |
| 30 to 34 Minutes | 25 (16.6%) | 5 (5.3%) |
| 35 to 39 Minutes | 0 (0.0%) | 0 (0.0%) |
| 40 to 44 Minutes | 0 (0.0%) | 0 (0.0%) |
| 45 to 59 Minutes | 0 (0.0%) | 0 (0.0%) |
| 60 to 89 Minutes | 5 (3.3%) | 0 (0.0%) |
| 90 or more Minutes | 0 (0.0%) | 0 (0.0%) |
Time of Departure to Work by Sex in Parkers Settlement
The most frequent times of departure to work in Parkers Settlement are 6:00 AM to 6:29 AM (82, 54.3%) for males and 12:00 PM to 3:59 PM (43, 45.7%) for females.
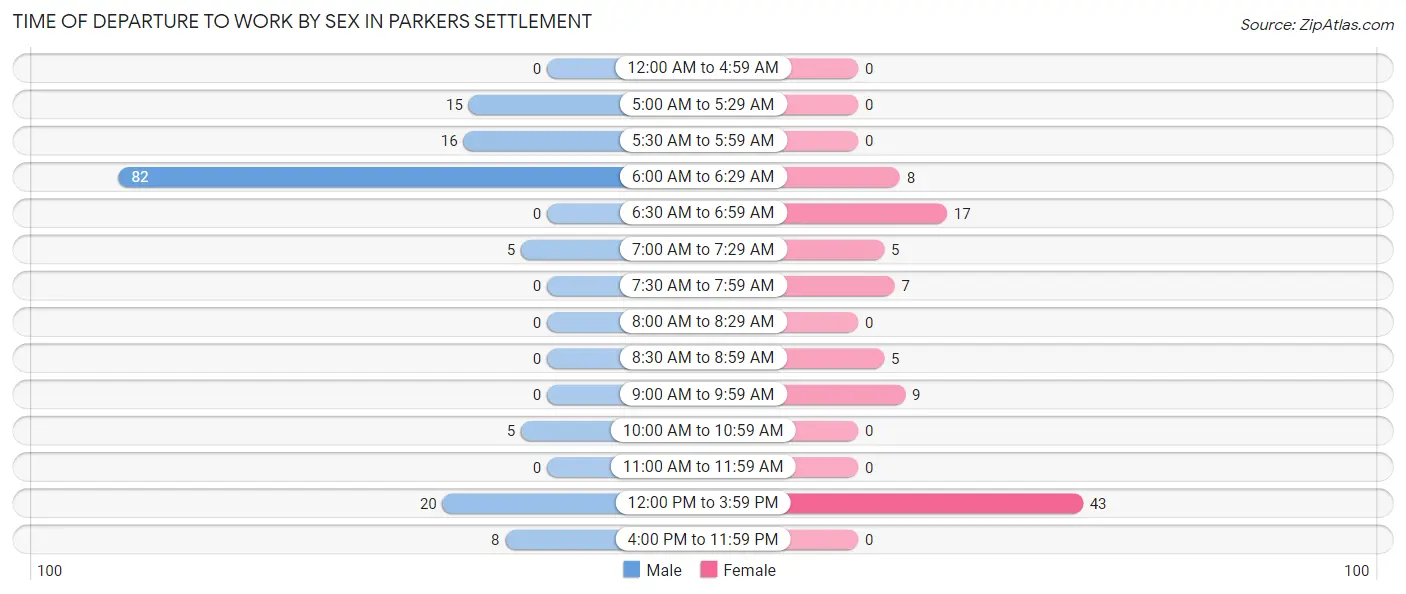
| Time of Departure | Male | Female |
| 12:00 AM to 4:59 AM | 0 (0.0%) | 0 (0.0%) |
| 5:00 AM to 5:29 AM | 15 (9.9%) | 0 (0.0%) |
| 5:30 AM to 5:59 AM | 16 (10.6%) | 0 (0.0%) |
| 6:00 AM to 6:29 AM | 82 (54.3%) | 8 (8.5%) |
| 6:30 AM to 6:59 AM | 0 (0.0%) | 17 (18.1%) |
| 7:00 AM to 7:29 AM | 5 (3.3%) | 5 (5.3%) |
| 7:30 AM to 7:59 AM | 0 (0.0%) | 7 (7.4%) |
| 8:00 AM to 8:29 AM | 0 (0.0%) | 0 (0.0%) |
| 8:30 AM to 8:59 AM | 0 (0.0%) | 5 (5.3%) |
| 9:00 AM to 9:59 AM | 0 (0.0%) | 9 (9.6%) |
| 10:00 AM to 10:59 AM | 5 (3.3%) | 0 (0.0%) |
| 11:00 AM to 11:59 AM | 0 (0.0%) | 0 (0.0%) |
| 12:00 PM to 3:59 PM | 20 (13.3%) | 43 (45.7%) |
| 4:00 PM to 11:59 PM | 8 (5.3%) | 0 (0.0%) |
| Total | 151 (100.0%) | 94 (100.0%) |
Housing Occupancy in Parkers Settlement
Occupancy by Ownership in Parkers Settlement
Of the total 270 dwellings in Parkers Settlement, owner-occupied units account for 270 (100.0%), while renter-occupied units make up 0 (0.0%).
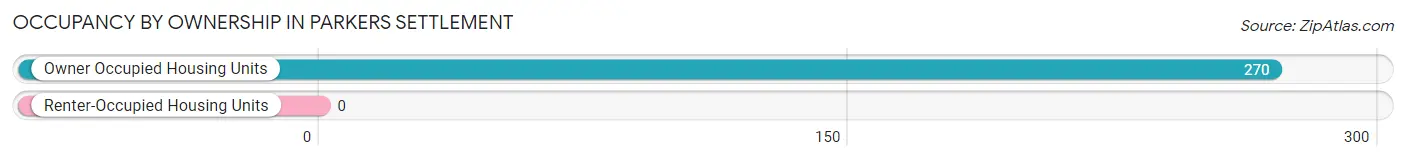
| Occupancy | # Housing Units | % Housing Units |
| Owner Occupied Housing Units | 270 | 100.0% |
| Renter-Occupied Housing Units | 0 | 0.0% |
| Total Occupied Housing Units | 270 | 100.0% |
Occupancy by Household Size in Parkers Settlement
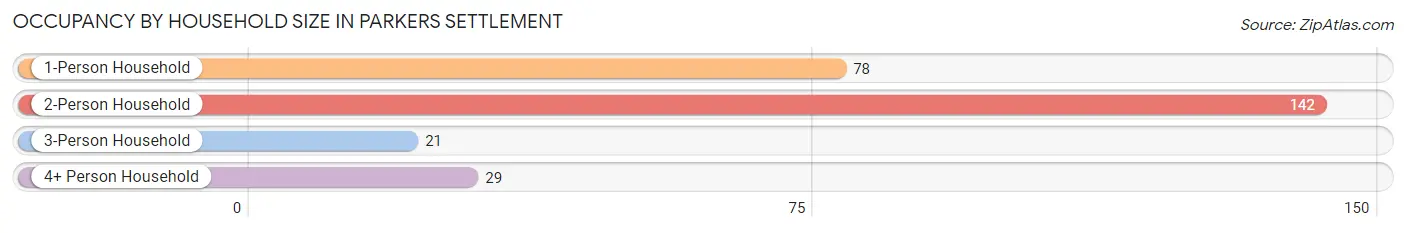
| Household Size | # Housing Units | % Housing Units |
| 1-Person Household | 78 | 28.9% |
| 2-Person Household | 142 | 52.6% |
| 3-Person Household | 21 | 7.8% |
| 4+ Person Household | 29 | 10.7% |
| Total Housing Units | 270 | 100.0% |
Occupancy by Ownership by Household Size in Parkers Settlement
| Household Size | Owner-occupied | Renter-occupied |
| 1-Person Household | 78 (100.0%) | 0 (0.0%) |
| 2-Person Household | 142 (100.0%) | 0 (0.0%) |
| 3-Person Household | 21 (100.0%) | 0 (0.0%) |
| 4+ Person Household | 29 (100.0%) | 0 (0.0%) |
| Total Housing Units | 270 (100.0%) | 0 (0.0%) |
Occupancy by Educational Attainment in Parkers Settlement
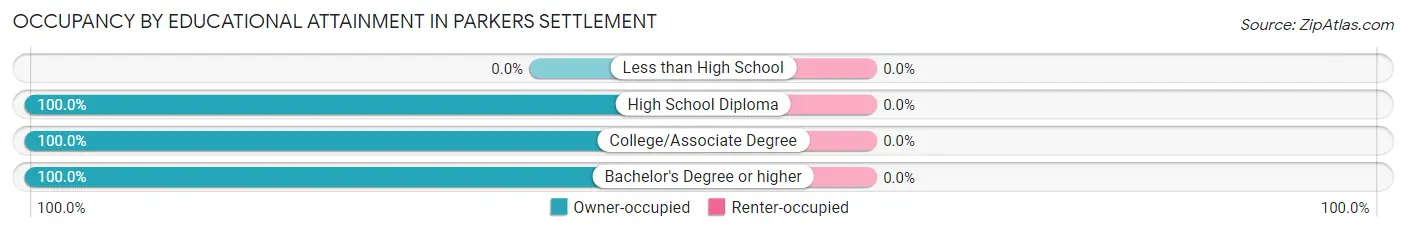
| Household Size | Owner-occupied | Renter-occupied |
| Less than High School | 0 (0.0%) | 0 (0.0%) |
| High School Diploma | 70 (100.0%) | 0 (0.0%) |
| College/Associate Degree | 117 (100.0%) | 0 (0.0%) |
| Bachelor's Degree or higher | 83 (100.0%) | 0 (0.0%) |
Occupancy by Age of Householder in Parkers Settlement
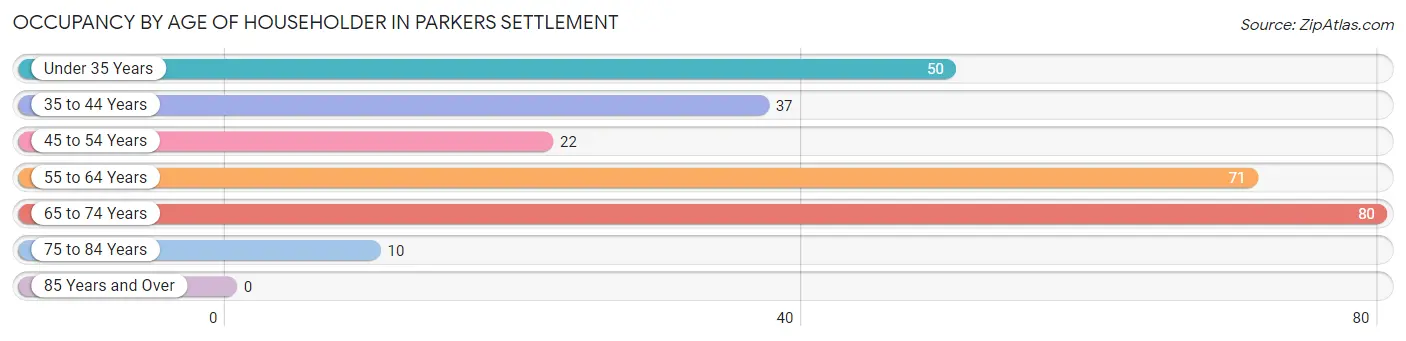
| Age Bracket | # Households | % Households |
| Under 35 Years | 50 | 18.5% |
| 35 to 44 Years | 37 | 13.7% |
| 45 to 54 Years | 22 | 8.2% |
| 55 to 64 Years | 71 | 26.3% |
| 65 to 74 Years | 80 | 29.6% |
| 75 to 84 Years | 10 | 3.7% |
| 85 Years and Over | 0 | 0.0% |
| Total | 270 | 100.0% |
Housing Finances in Parkers Settlement
Median Income by Occupancy in Parkers Settlement
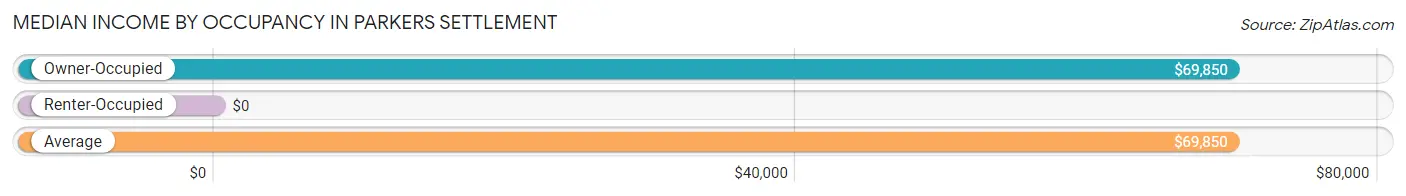
| Occupancy Type | # Households | Median Income |
| Owner-Occupied | 270 (100.0%) | $69,850 |
| Renter-Occupied | 0 (0.0%) | $0 |
| Average | 270 (100.0%) | $69,850 |
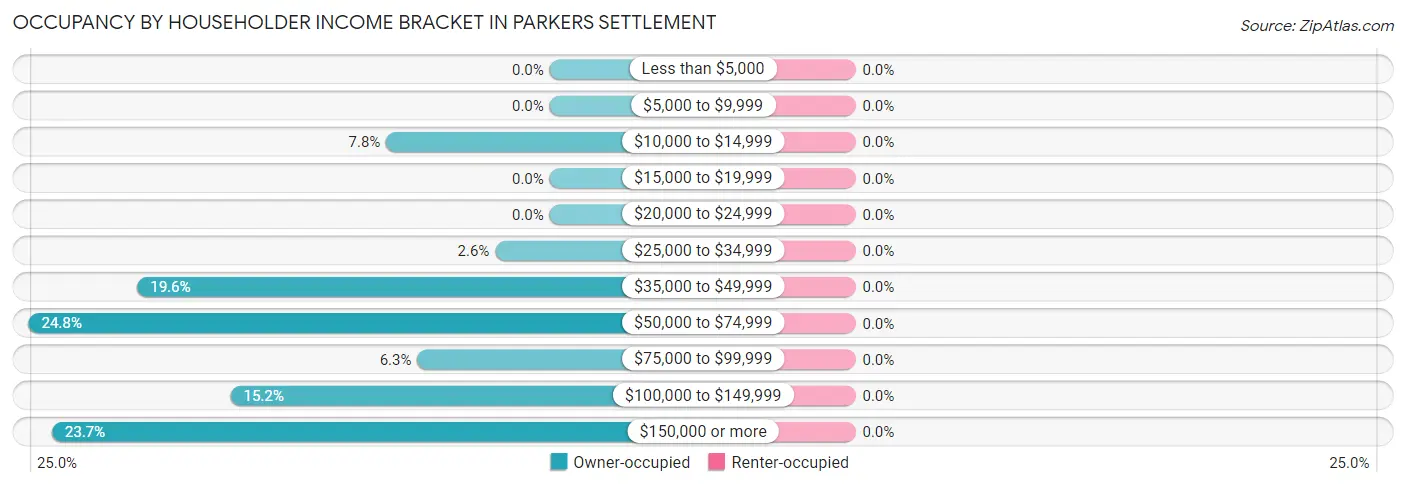
Occupancy by Householder Income Bracket in Parkers Settlement
| Income Bracket | Owner-occupied | Renter-occupied |
| Less than $5,000 | 0 (0.0%) | 0 (0.0%) |
| $5,000 to $9,999 | 0 (0.0%) | 0 (0.0%) |
| $10,000 to $14,999 | 21 (7.8%) | 0 (0.0%) |
| $15,000 to $19,999 | 0 (0.0%) | 0 (0.0%) |
| $20,000 to $24,999 | 0 (0.0%) | 0 (0.0%) |
| $25,000 to $34,999 | 7 (2.6%) | 0 (0.0%) |
| $35,000 to $49,999 | 53 (19.6%) | 0 (0.0%) |
| $50,000 to $74,999 | 67 (24.8%) | 0 (0.0%) |
| $75,000 to $99,999 | 17 (6.3%) | 0 (0.0%) |
| $100,000 to $149,999 | 41 (15.2%) | 0 (0.0%) |
| $150,000 or more | 64 (23.7%) | 0 (0.0%) |
| Total | 270 (100.0%) | 0 (0.0%) |
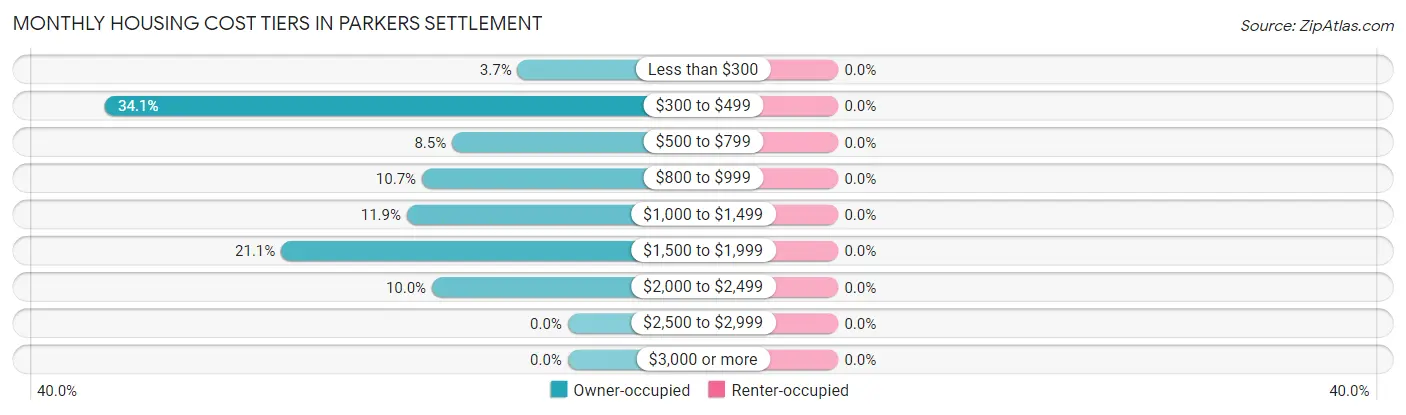
Monthly Housing Cost Tiers in Parkers Settlement
| Monthly Cost | Owner-occupied | Renter-occupied |
| Less than $300 | 10 (3.7%) | 0 (0.0%) |
| $300 to $499 | 92 (34.1%) | 0 (0.0%) |
| $500 to $799 | 23 (8.5%) | 0 (0.0%) |
| $800 to $999 | 29 (10.7%) | 0 (0.0%) |
| $1,000 to $1,499 | 32 (11.8%) | 0 (0.0%) |
| $1,500 to $1,999 | 57 (21.1%) | 0 (0.0%) |
| $2,000 to $2,499 | 27 (10.0%) | 0 (0.0%) |
| $2,500 to $2,999 | 0 (0.0%) | 0 (0.0%) |
| $3,000 or more | 0 (0.0%) | 0 (0.0%) |
| Total | 270 (100.0%) | 0 (0.0%) |
Physical Housing Characteristics in Parkers Settlement
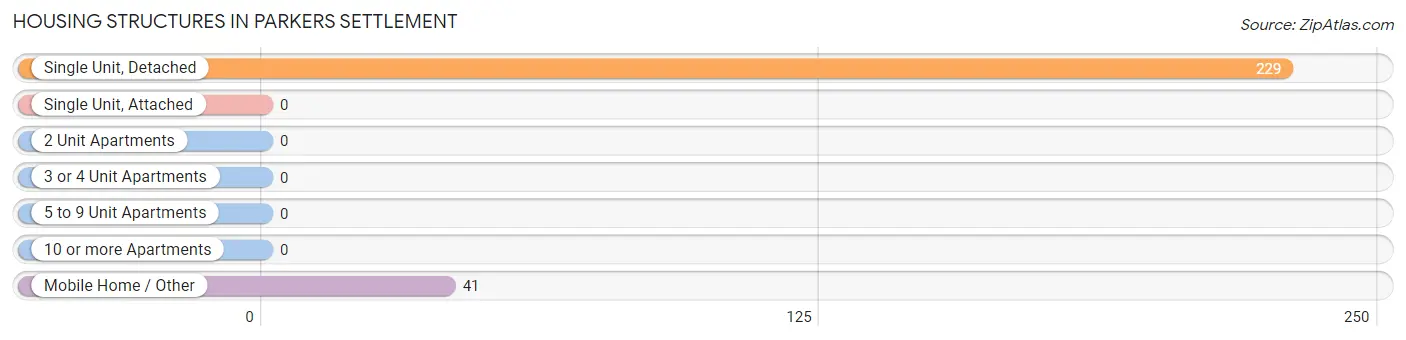
Housing Structures in Parkers Settlement
| Structure Type | # Housing Units | % Housing Units |
| Single Unit, Detached | 229 | 84.8% |
| Single Unit, Attached | 0 | 0.0% |
| 2 Unit Apartments | 0 | 0.0% |
| 3 or 4 Unit Apartments | 0 | 0.0% |
| 5 to 9 Unit Apartments | 0 | 0.0% |
| 10 or more Apartments | 0 | 0.0% |
| Mobile Home / Other | 41 | 15.2% |
| Total | 270 | 100.0% |
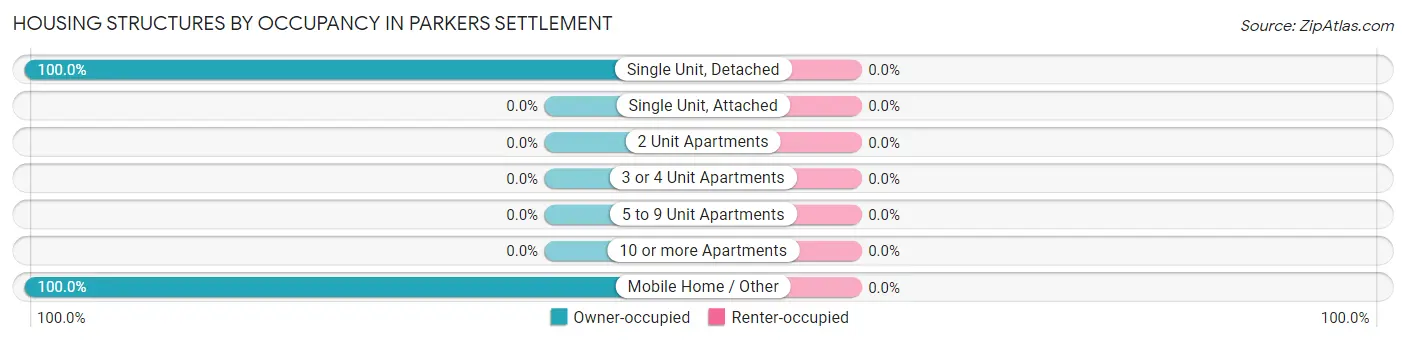
Housing Structures by Occupancy in Parkers Settlement
| Structure Type | Owner-occupied | Renter-occupied |
| Single Unit, Detached | 229 (100.0%) | 0 (0.0%) |
| Single Unit, Attached | 0 (0.0%) | 0 (0.0%) |
| 2 Unit Apartments | 0 (0.0%) | 0 (0.0%) |
| 3 or 4 Unit Apartments | 0 (0.0%) | 0 (0.0%) |
| 5 to 9 Unit Apartments | 0 (0.0%) | 0 (0.0%) |
| 10 or more Apartments | 0 (0.0%) | 0 (0.0%) |
| Mobile Home / Other | 41 (100.0%) | 0 (0.0%) |
| Total | 270 (100.0%) | 0 (0.0%) |
Housing Structures by Number of Rooms in Parkers Settlement
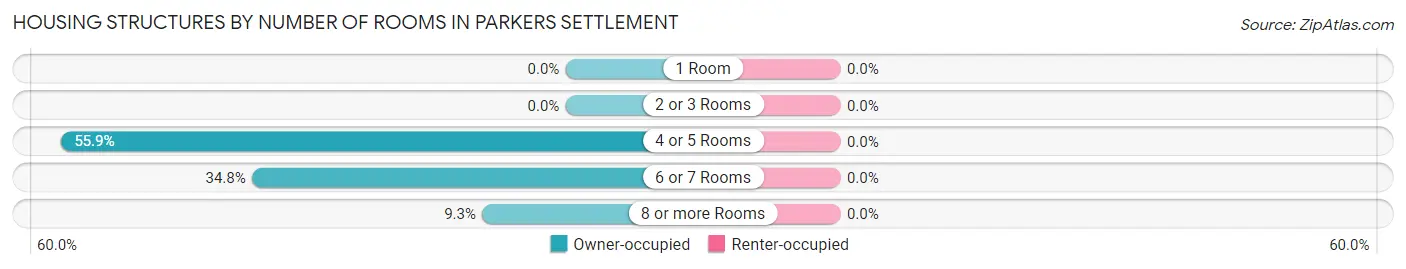
| Number of Rooms | Owner-occupied | Renter-occupied |
| 1 Room | 0 (0.0%) | 0 (0.0%) |
| 2 or 3 Rooms | 0 (0.0%) | 0 (0.0%) |
| 4 or 5 Rooms | 151 (55.9%) | 0 (0.0%) |
| 6 or 7 Rooms | 94 (34.8%) | 0 (0.0%) |
| 8 or more Rooms | 25 (9.3%) | 0 (0.0%) |
| Total | 270 (100.0%) | 0 (0.0%) |
Housing Structure by Heating Type in Parkers Settlement
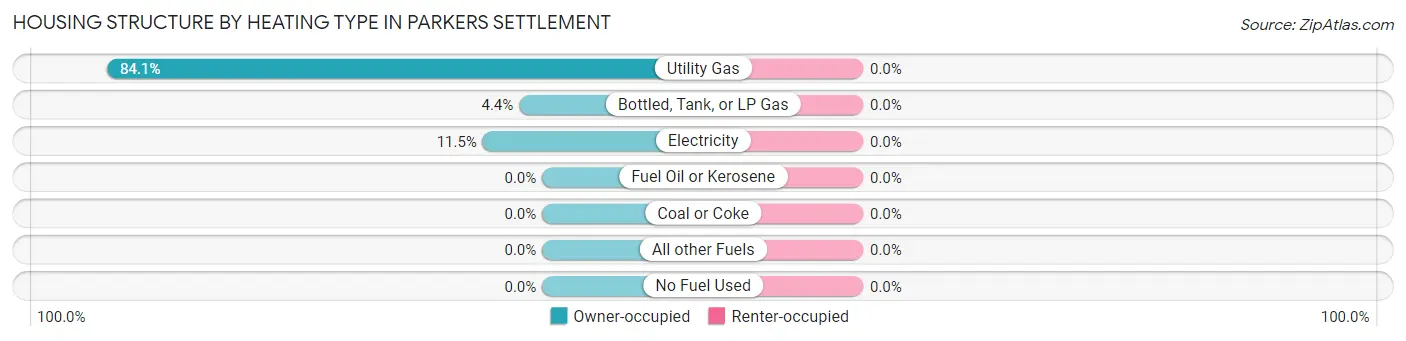
| Heating Type | Owner-occupied | Renter-occupied |
| Utility Gas | 227 (84.1%) | 0 (0.0%) |
| Bottled, Tank, or LP Gas | 12 (4.4%) | 0 (0.0%) |
| Electricity | 31 (11.5%) | 0 (0.0%) |
| Fuel Oil or Kerosene | 0 (0.0%) | 0 (0.0%) |
| Coal or Coke | 0 (0.0%) | 0 (0.0%) |
| All other Fuels | 0 (0.0%) | 0 (0.0%) |
| No Fuel Used | 0 (0.0%) | 0 (0.0%) |
| Total | 270 (100.0%) | 0 (0.0%) |
Household Vehicle Usage in Parkers Settlement
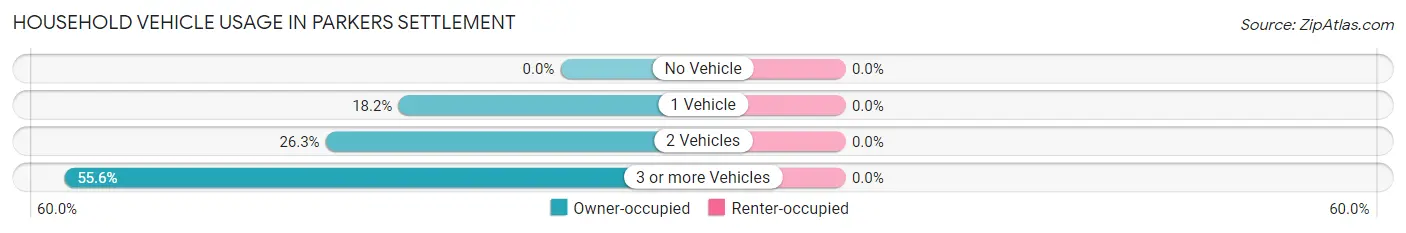
| Vehicles per Household | Owner-occupied | Renter-occupied |
| No Vehicle | 0 (0.0%) | 0 (0.0%) |
| 1 Vehicle | 49 (18.1%) | 0 (0.0%) |
| 2 Vehicles | 71 (26.3%) | 0 (0.0%) |
| 3 or more Vehicles | 150 (55.6%) | 0 (0.0%) |
| Total | 270 (100.0%) | 0 (0.0%) |
Real Estate & Mortgages in Parkers Settlement
Real Estate and Mortgage Overview in Parkers Settlement
| Characteristic | Without Mortgage | With Mortgage |
| Housing Units | 137 | 133 |
| Median Property Value | $115,300 | $215,500 |
| Median Household Income | - | - |
| Monthly Housing Costs | $393 | $0 |
| Real Estate Taxes | $559 | $0 |
Property Value by Mortgage Status in Parkers Settlement
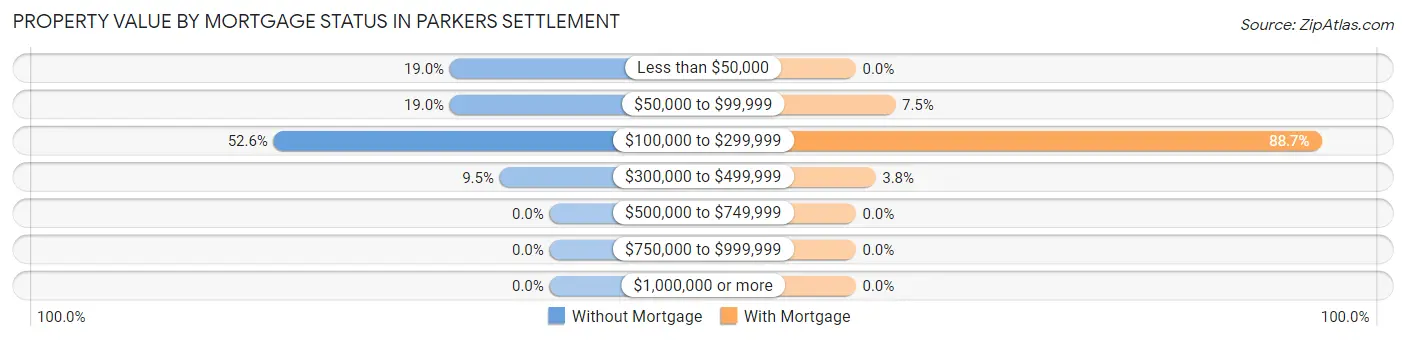
| Property Value | Without Mortgage | With Mortgage |
| Less than $50,000 | 26 (19.0%) | 0 (0.0%) |
| $50,000 to $99,999 | 26 (19.0%) | 10 (7.5%) |
| $100,000 to $299,999 | 72 (52.5%) | 118 (88.7%) |
| $300,000 to $499,999 | 13 (9.5%) | 5 (3.8%) |
| $500,000 to $749,999 | 0 (0.0%) | 0 (0.0%) |
| $750,000 to $999,999 | 0 (0.0%) | 0 (0.0%) |
| $1,000,000 or more | 0 (0.0%) | 0 (0.0%) |
| Total | 137 (100.0%) | 133 (100.0%) |
Household Income by Mortgage Status in Parkers Settlement

| Household Income | Without Mortgage | With Mortgage |
| Less than $10,000 | 0 (0.0%) | 0 (0.0%) |
| $10,000 to $24,999 | 21 (15.3%) | 0 (0.0%) |
| $25,000 to $34,999 | 7 (5.1%) | 0 (0.0%) |
| $35,000 to $49,999 | 43 (31.4%) | 0 (0.0%) |
| $50,000 to $74,999 | 10 (7.3%) | 10 (7.5%) |
| $75,000 to $99,999 | 10 (7.3%) | 57 (42.9%) |
| $100,000 to $149,999 | 33 (24.1%) | 7 (5.3%) |
| $150,000 or more | 13 (9.5%) | 8 (6.0%) |
| Total | 137 (100.0%) | 133 (100.0%) |
Property Value to Household Income Ratio in Parkers Settlement
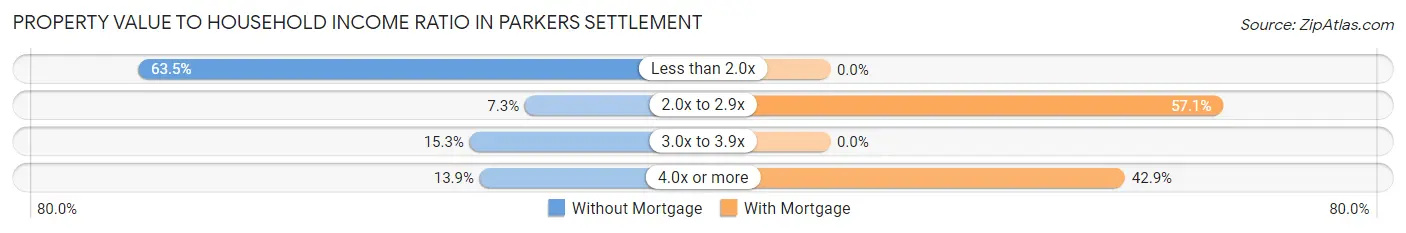
| Value-to-Income Ratio | Without Mortgage | With Mortgage |
| Less than 2.0x | 87 (63.5%) | 0 (0.0%) |
| 2.0x to 2.9x | 10 (7.3%) | 76 (57.1%) |
| 3.0x to 3.9x | 21 (15.3%) | 0 (0.0%) |
| 4.0x or more | 19 (13.9%) | 57 (42.9%) |
| Total | 137 (100.0%) | 133 (100.0%) |
Real Estate Taxes by Mortgage Status in Parkers Settlement
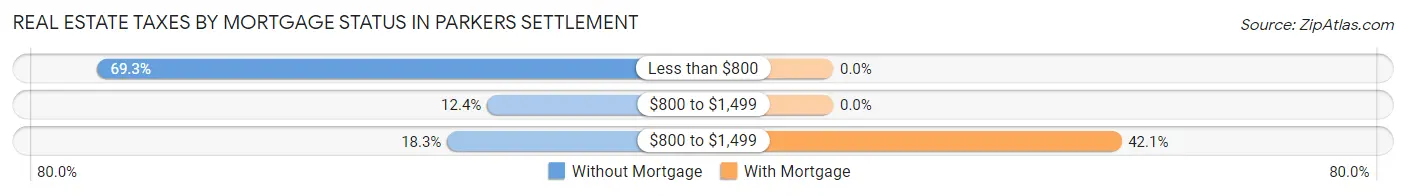
| Property Taxes | Without Mortgage | With Mortgage |
| Less than $800 | 95 (69.3%) | 0 (0.0%) |
| $800 to $1,499 | 17 (12.4%) | 0 (0.0%) |
| $800 to $1,499 | 25 (18.2%) | 56 (42.1%) |
| Total | 137 (100.0%) | 133 (100.0%) |
Health & Disability in Parkers Settlement
Health Insurance Coverage by Age in Parkers Settlement
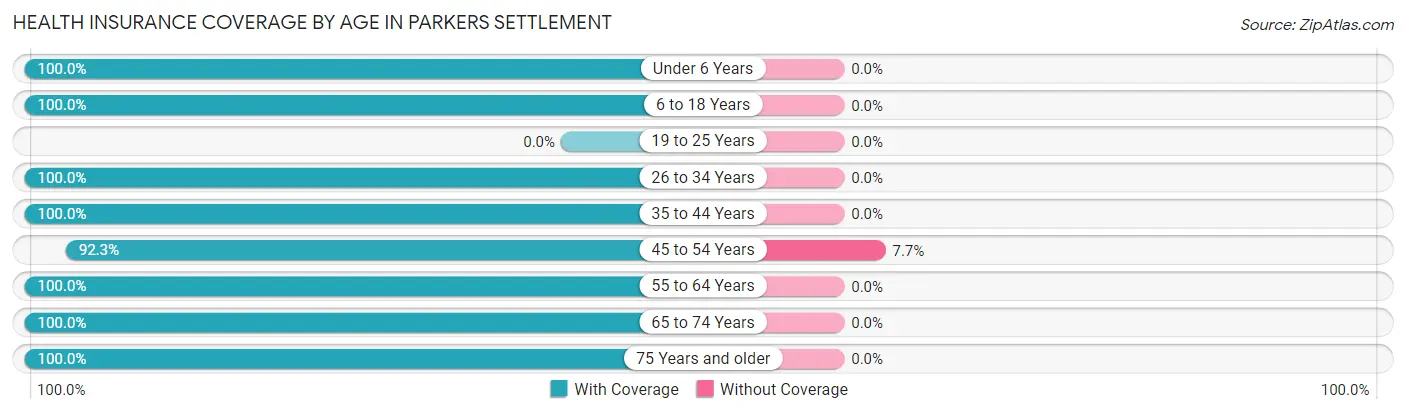
| Age Bracket | With Coverage | Without Coverage |
| Under 6 Years | 9 (100.0%) | 0 (0.0%) |
| 6 to 18 Years | 62 (100.0%) | 0 (0.0%) |
| 19 to 25 Years | 0 (0.0%) | 0 (0.0%) |
| 26 to 34 Years | 96 (100.0%) | 0 (0.0%) |
| 35 to 44 Years | 46 (100.0%) | 0 (0.0%) |
| 45 to 54 Years | 72 (92.3%) | 6 (7.7%) |
| 55 to 64 Years | 121 (100.0%) | 0 (0.0%) |
| 65 to 74 Years | 125 (100.0%) | 0 (0.0%) |
| 75 Years and older | 10 (100.0%) | 0 (0.0%) |
| Total | 541 (98.9%) | 6 (1.1%) |
Health Insurance Coverage by Citizenship Status in Parkers Settlement
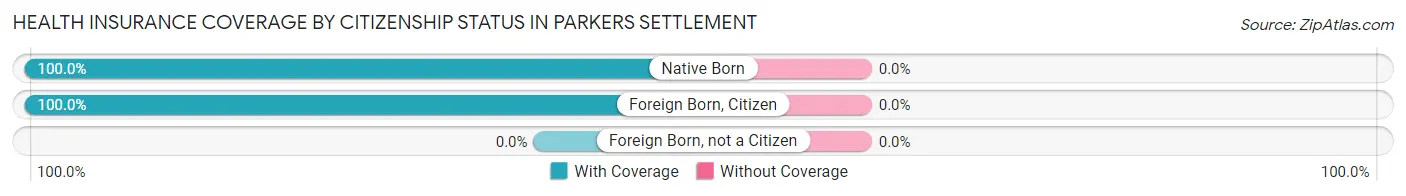
| Citizenship Status | With Coverage | Without Coverage |
| Native Born | 9 (100.0%) | 0 (0.0%) |
| Foreign Born, Citizen | 62 (100.0%) | 0 (0.0%) |
| Foreign Born, not a Citizen | 0 (0.0%) | 0 (0.0%) |
Health Insurance Coverage by Household Income in Parkers Settlement
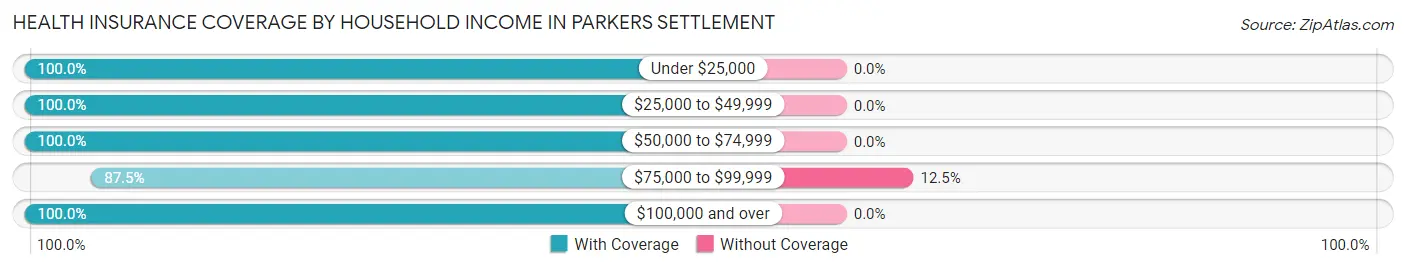
| Household Income | With Coverage | Without Coverage |
| Under $25,000 | 21 (100.0%) | 0 (0.0%) |
| $25,000 to $49,999 | 108 (100.0%) | 0 (0.0%) |
| $50,000 to $74,999 | 82 (100.0%) | 0 (0.0%) |
| $75,000 to $99,999 | 42 (87.5%) | 6 (12.5%) |
| $100,000 and over | 288 (100.0%) | 0 (0.0%) |
Public vs Private Health Insurance Coverage by Age in Parkers Settlement
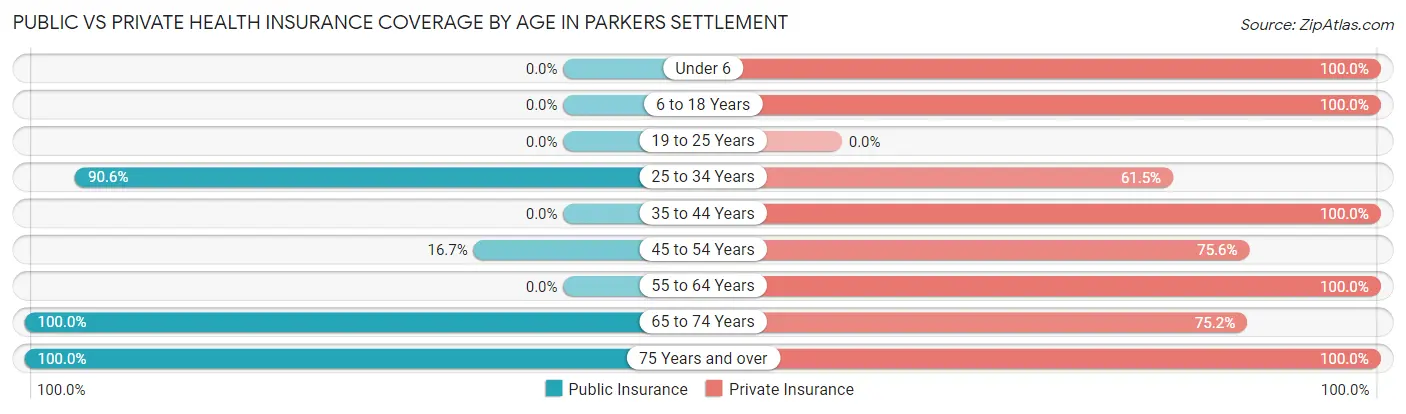
| Age Bracket | Public Insurance | Private Insurance |
| Under 6 | 0 (0.0%) | 9 (100.0%) |
| 6 to 18 Years | 0 (0.0%) | 62 (100.0%) |
| 19 to 25 Years | 0 (0.0%) | 0 (0.0%) |
| 25 to 34 Years | 87 (90.6%) | 59 (61.5%) |
| 35 to 44 Years | 0 (0.0%) | 46 (100.0%) |
| 45 to 54 Years | 13 (16.7%) | 59 (75.6%) |
| 55 to 64 Years | 0 (0.0%) | 121 (100.0%) |
| 65 to 74 Years | 125 (100.0%) | 94 (75.2%) |
| 75 Years and over | 10 (100.0%) | 10 (100.0%) |
| Total | 235 (43.0%) | 460 (84.1%) |
Disability Status by Sex by Age in Parkers Settlement
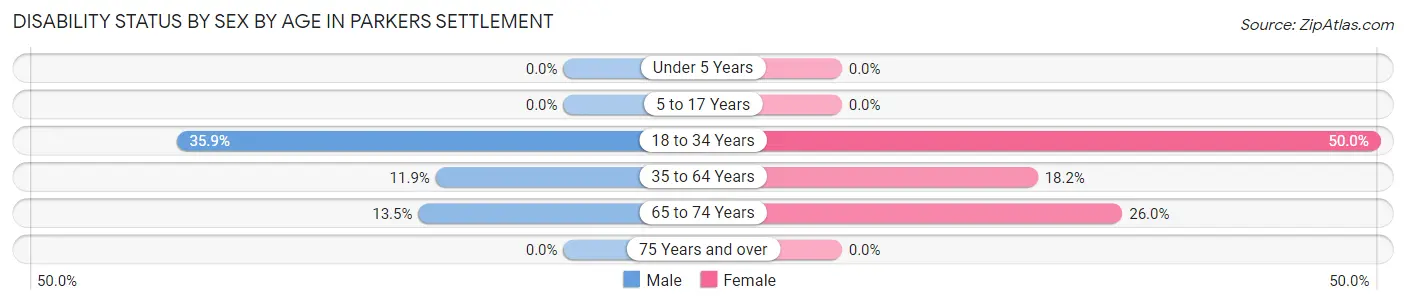
| Age Bracket | Male | Female |
| Under 5 Years | 0 (0.0%) | 0 (0.0%) |
| 5 to 17 Years | 0 (0.0%) | 0 (0.0%) |
| 18 to 34 Years | 28 (35.9%) | 9 (50.0%) |
| 35 to 64 Years | 16 (11.8%) | 20 (18.2%) |
| 65 to 74 Years | 7 (13.5%) | 19 (26.0%) |
| 75 Years and over | 0 (0.0%) | 0 (0.0%) |
Disability Class by Sex by Age in Parkers Settlement
Disability Class: Hearing Difficulty
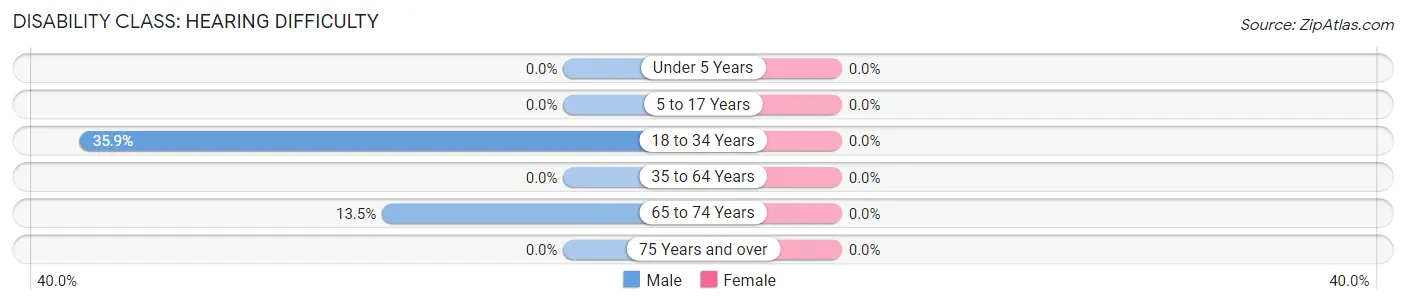
| Age Bracket | Male | Female |
| Under 5 Years | 0 (0.0%) | 0 (0.0%) |
| 5 to 17 Years | 0 (0.0%) | 0 (0.0%) |
| 18 to 34 Years | 28 (35.9%) | 0 (0.0%) |
| 35 to 64 Years | 0 (0.0%) | 0 (0.0%) |
| 65 to 74 Years | 7 (13.5%) | 0 (0.0%) |
| 75 Years and over | 0 (0.0%) | 0 (0.0%) |
Disability Class: Vision Difficulty
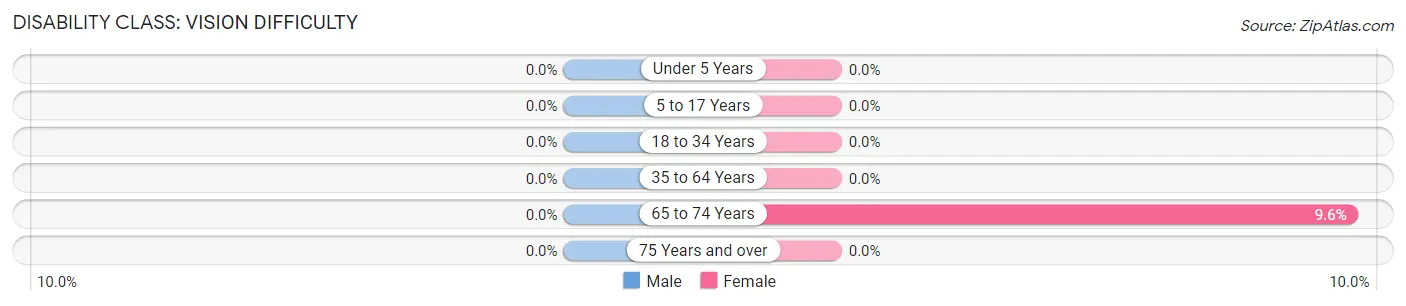
| Age Bracket | Male | Female |
| Under 5 Years | 0 (0.0%) | 0 (0.0%) |
| 5 to 17 Years | 0 (0.0%) | 0 (0.0%) |
| 18 to 34 Years | 0 (0.0%) | 0 (0.0%) |
| 35 to 64 Years | 0 (0.0%) | 0 (0.0%) |
| 65 to 74 Years | 0 (0.0%) | 7 (9.6%) |
| 75 Years and over | 0 (0.0%) | 0 (0.0%) |
Disability Class: Cognitive Difficulty
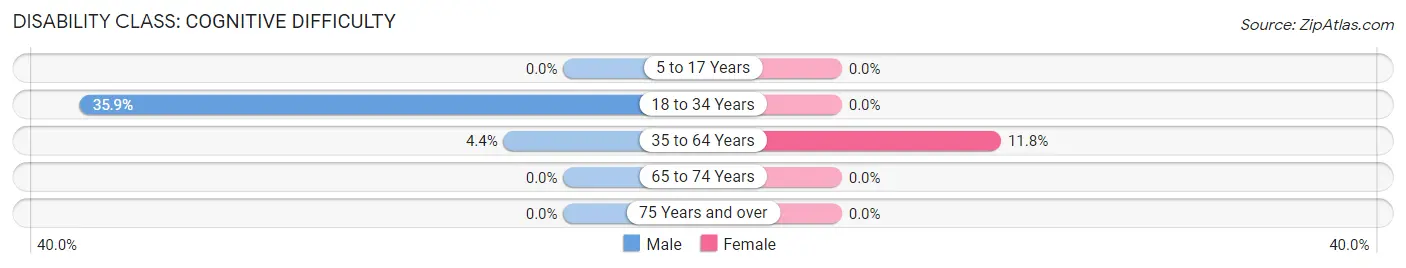
| Age Bracket | Male | Female |
| 5 to 17 Years | 0 (0.0%) | 0 (0.0%) |
| 18 to 34 Years | 28 (35.9%) | 0 (0.0%) |
| 35 to 64 Years | 6 (4.4%) | 13 (11.8%) |
| 65 to 74 Years | 0 (0.0%) | 0 (0.0%) |
| 75 Years and over | 0 (0.0%) | 0 (0.0%) |
Disability Class: Ambulatory Difficulty
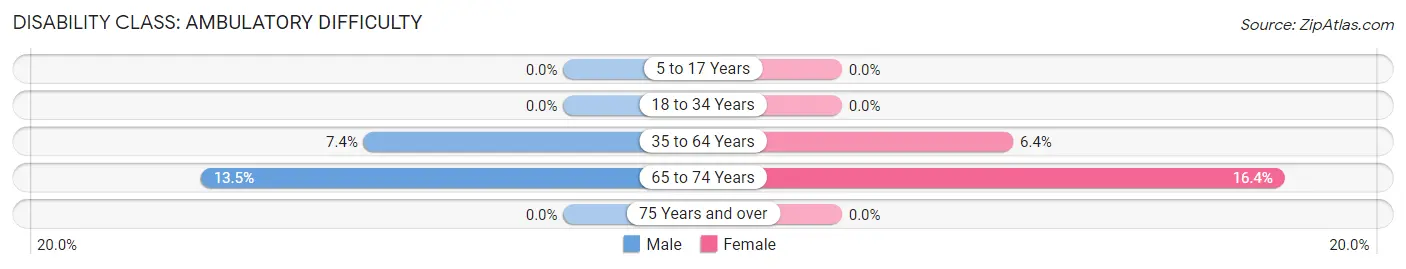
| Age Bracket | Male | Female |
| 5 to 17 Years | 0 (0.0%) | 0 (0.0%) |
| 18 to 34 Years | 0 (0.0%) | 0 (0.0%) |
| 35 to 64 Years | 10 (7.4%) | 7 (6.4%) |
| 65 to 74 Years | 7 (13.5%) | 12 (16.4%) |
| 75 Years and over | 0 (0.0%) | 0 (0.0%) |
Disability Class: Self-Care Difficulty
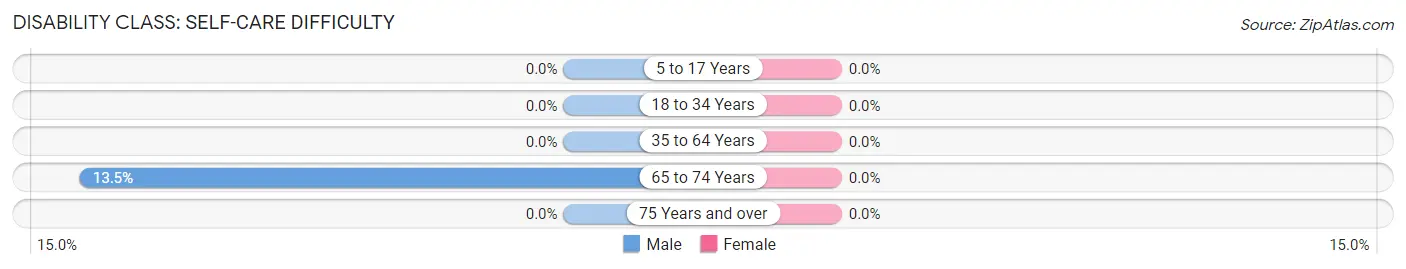
| Age Bracket | Male | Female |
| 5 to 17 Years | 0 (0.0%) | 0 (0.0%) |
| 18 to 34 Years | 0 (0.0%) | 0 (0.0%) |
| 35 to 64 Years | 0 (0.0%) | 0 (0.0%) |
| 65 to 74 Years | 7 (13.5%) | 0 (0.0%) |
| 75 Years and over | 0 (0.0%) | 0 (0.0%) |
Technology Access in Parkers Settlement
Computing Device Access in Parkers Settlement
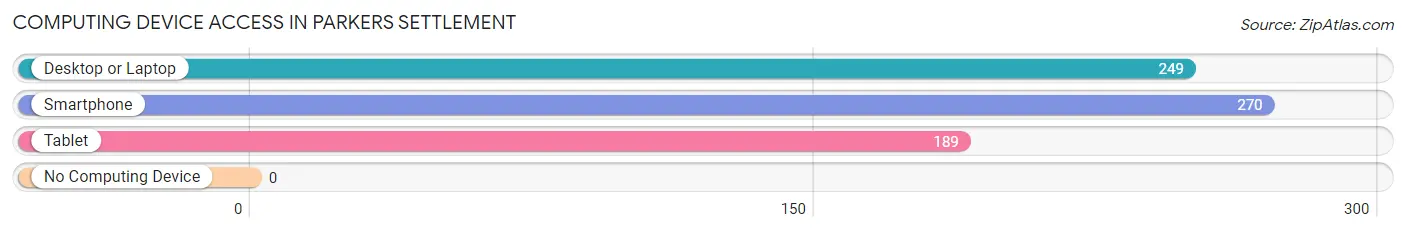
| Device Type | # Households | % Households |
| Desktop or Laptop | 249 | 92.2% |
| Smartphone | 270 | 100.0% |
| Tablet | 189 | 70.0% |
| No Computing Device | 0 | 0.0% |
| Total | 270 | 100.0% |
Internet Access in Parkers Settlement
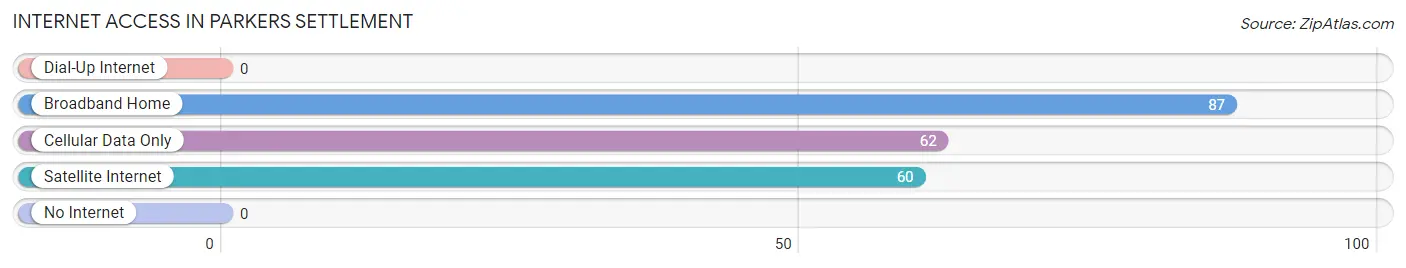
| Internet Type | # Households | % Households |
| Dial-Up Internet | 0 | 0.0% |
| Broadband Home | 87 | 32.2% |
| Cellular Data Only | 62 | 23.0% |
| Satellite Internet | 60 | 22.2% |
| No Internet | 0 | 0.0% |
| Total | 270 | 100.0% |
Parkers Settlement Summary
Parkers Settlement is a small unincorporated community located in the state of Indiana, in the United States. It is situated in the southwestern part of the state, in the county of Posey. The community is located on the banks of the Wabash River, and is surrounded by the towns of New Harmony, Mount Vernon, and Poseyville.
History
Parkers Settlement was founded in 1817 by a group of settlers led by William Parker. The settlers were originally from North Carolina, and had been searching for a new home in the Midwest. After traveling through Kentucky and Illinois, they eventually settled in the area that is now Parkers Settlement. The settlers named the community after William Parker, and it quickly grew into a thriving community.
The settlers built a church, a school, and a general store, and the community soon became a popular destination for travelers. In 1820, the first post office was established in Parkers Settlement, and the community continued to grow. By the mid-1800s, the population had grown to over 500 people.
Geography
Parkers Settlement is located in the southwestern part of Indiana, in the county of Posey. It is situated on the banks of the Wabash River, and is surrounded by the towns of New Harmony, Mount Vernon, and Poseyville. The community is located at an elevation of 590 feet above sea level.
The climate in Parkers Settlement is humid continental, with hot summers and cold winters. The average annual temperature is around 50 degrees Fahrenheit, and the average annual precipitation is around 40 inches.
Economy
The economy of Parkers Settlement is largely based on agriculture. The community is home to several farms, which produce a variety of crops, including corn, soybeans, wheat, and hay. The community also has several small businesses, including a general store, a gas station, and a restaurant.
Demographics
As of the 2010 census, the population of Parkers Settlement was 545 people. The racial makeup of the community was 97.3% White, 0.7% African American, 0.2% Native American, 0.2% Asian, and 1.6% from other races. The median household income was $37,500, and the median family income was $45,000.
Conclusion
Parkers Settlement is a small unincorporated community located in the southwestern part of Indiana. It was founded in 1817 by a group of settlers led by William Parker, and has since grown into a thriving community. The economy of Parkers Settlement is largely based on agriculture, and the population is predominantly White. The community is a popular destination for travelers, and is home to several small businesses.
Common Questions
What is the Total Population of Parkers Settlement?
Total Population of Parkers Settlement is 547.
What is the Total Male Population of Parkers Settlement?
Total Male Population of Parkers Settlement is 279.
What is the Total Female Population of Parkers Settlement?
Total Female Population of Parkers Settlement is 268.
What is the Ratio of Males per 100 Females in Parkers Settlement?
There are 104.10 Males per 100 Females in Parkers Settlement.
What is the Ratio of Females per 100 Males in Parkers Settlement?
There are 96.06 Females per 100 Males in Parkers Settlement.
What is the Median Population Age in Parkers Settlement?
Median Population Age in Parkers Settlement is 52.5 Years.
What is the Average Family Size in Parkers Settlement
Average Family Size in Parkers Settlement is 2.4 People.
What is the Average Household Size in Parkers Settlement
Average Household Size in Parkers Settlement is 2.0 People.
What is Per Capita Income in Parkers Settlement?
Per Capita income in Parkers Settlement is $44,126.
What is the Median Family Income in Parkers Settlement?
Median Family Income in Parkers Settlement is $108,824.
What is the Median Household income in Parkers Settlement?
Median Household Income in Parkers Settlement is $69,850.
What is Inequality or Gini Index in Parkers Settlement?
Inequality or Gini Index in Parkers Settlement is 0.35.
How Large is the Labor Force in Parkers Settlement?
There are 319 People in the Labor Forcein in Parkers Settlement.
What is the Percentage of People in the Labor Force in Parkers Settlement?
62.9% of People are in the Labor Force in Parkers Settlement.
What is the Unemployment Rate in Parkers Settlement?
Unemployment Rate in Parkers Settlement is 7.2%.