Zanesville, IN
Zanesville Map
Zanesville Overview
530
TOTAL POPULATION
236
MALE POPULATION
294
FEMALE POPULATION
80.27
MALES / 100 FEMALES
124.58
FEMALES / 100 MALES
41.5
MEDIAN AGE
2.8
AVG FAMILY SIZE
2.3
AVG HOUSEHOLD SIZE
$25,904
PER CAPITA INCOME
$57,500
AVG FAMILY INCOME
$55,625
AVG HOUSEHOLD INCOME
33.0%
WAGE / INCOME GAP [ % ]
67.0¢/ $1
WAGE / INCOME GAP [ $ ]
0.35
INEQUALITY / GINI INDEX
235
LABOR FORCE [ PEOPLE ]
52.8%
PERCENT IN LABOR FORCE
0.9%
UNEMPLOYMENT RATE
Zanesville Zip Codes
Zanesville Area Codes
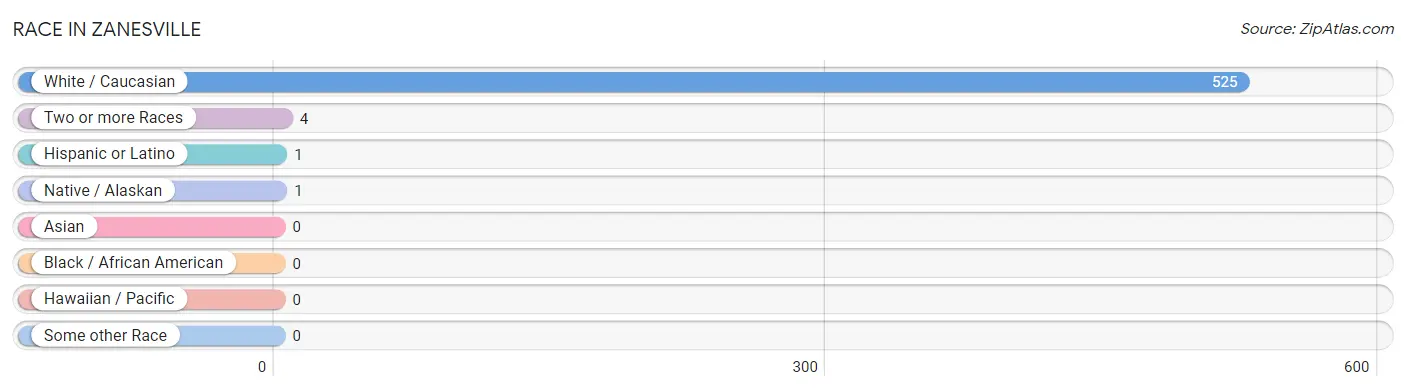
Race in Zanesville
The most populous races in Zanesville are White / Caucasian (525 | 99.1%), Two or more Races (4 | 0.7%), and Hispanic or Latino (1 | 0.2%).
| Race | # Population | % Population |
| Asian | 0 | 0.0% |
| Black / African American | 0 | 0.0% |
| Hawaiian / Pacific | 0 | 0.0% |
| Hispanic or Latino | 1 | 0.2% |
| Native / Alaskan | 1 | 0.2% |
| White / Caucasian | 525 | 99.1% |
| Two or more Races | 4 | 0.7% |
| Some other Race | 0 | 0.0% |
| Total | 530 | 100.0% |
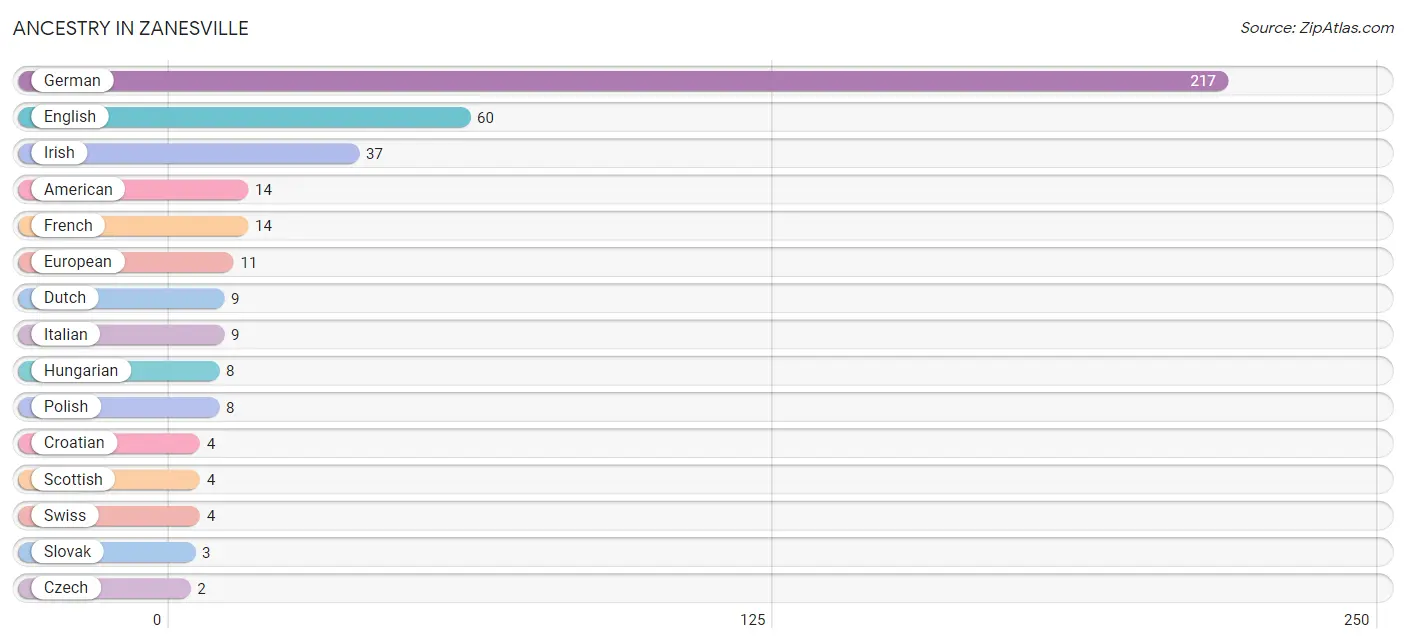
Ancestry in Zanesville
The most populous ancestries reported in Zanesville are German (217 | 40.9%), English (60 | 11.3%), Irish (37 | 7.0%), American (14 | 2.6%), and French (14 | 2.6%), together accounting for 64.5% of all Zanesville residents.
| Ancestry | # Population | % Population |
| American | 14 | 2.6% |
| Colombian | 1 | 0.2% |
| Croatian | 4 | 0.7% |
| Czech | 2 | 0.4% |
| Dutch | 9 | 1.7% |
| Eastern European | 2 | 0.4% |
| English | 60 | 11.3% |
| European | 11 | 2.1% |
| French | 14 | 2.6% |
| German | 217 | 40.9% |
| Hungarian | 8 | 1.5% |
| Irish | 37 | 7.0% |
| Italian | 9 | 1.7% |
| Polish | 8 | 1.5% |
| Scottish | 4 | 0.7% |
| Slovak | 3 | 0.6% |
| South American | 1 | 0.2% |
| South American Indian | 1 | 0.2% |
| Swiss | 4 | 0.7% | View All 19 Rows |
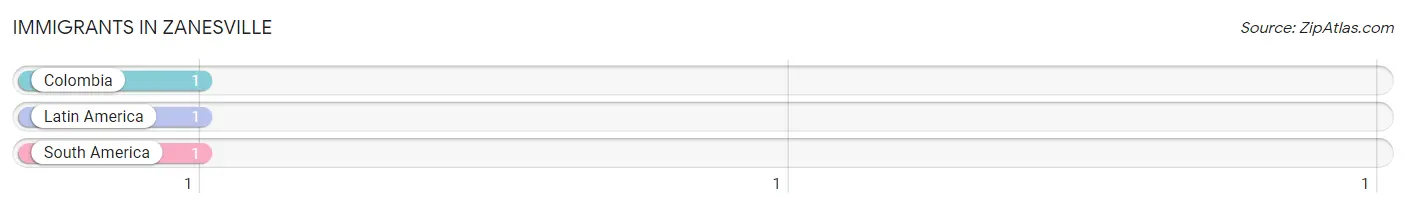
Immigrants in Zanesville
The most numerous immigrant groups reported in Zanesville came from Colombia (1 | 0.2%), Latin America (1 | 0.2%), and South America (1 | 0.2%), together accounting for 0.6% of all Zanesville residents.
| Immigration Origin | # Population | % Population |
| Colombia | 1 | 0.2% |
| Latin America | 1 | 0.2% |
| South America | 1 | 0.2% | View All 3 Rows |
Sex and Age in Zanesville
Sex and Age in Zanesville
The most populous age groups in Zanesville are 15 to 19 Years (55 | 23.3%) for men and 10 to 14 Years (32 | 10.9%) for women.
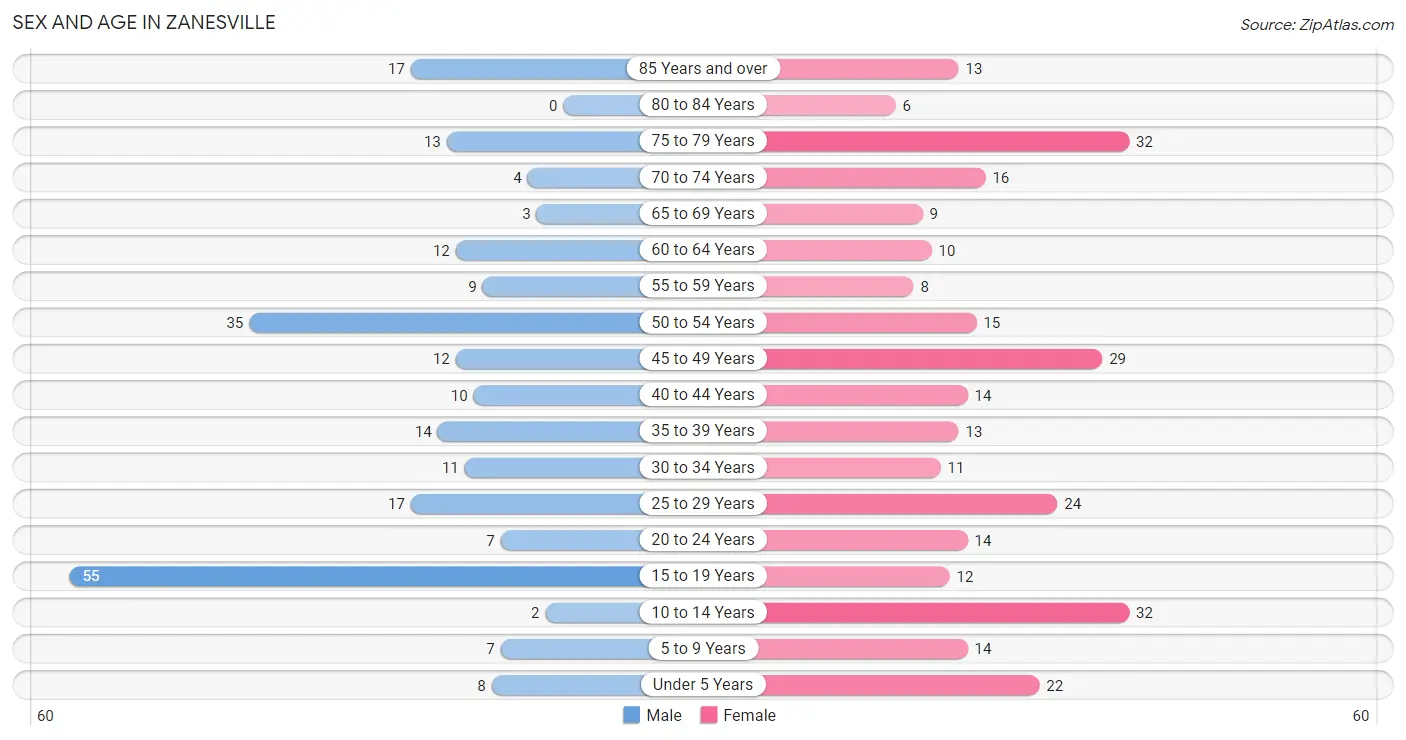
| Age Bracket | Male | Female |
| Under 5 Years | 8 (3.4%) | 22 (7.5%) |
| 5 to 9 Years | 7 (3.0%) | 14 (4.8%) |
| 10 to 14 Years | 2 (0.9%) | 32 (10.9%) |
| 15 to 19 Years | 55 (23.3%) | 12 (4.1%) |
| 20 to 24 Years | 7 (3.0%) | 14 (4.8%) |
| 25 to 29 Years | 17 (7.2%) | 24 (8.2%) |
| 30 to 34 Years | 11 (4.7%) | 11 (3.7%) |
| 35 to 39 Years | 14 (5.9%) | 13 (4.4%) |
| 40 to 44 Years | 10 (4.2%) | 14 (4.8%) |
| 45 to 49 Years | 12 (5.1%) | 29 (9.9%) |
| 50 to 54 Years | 35 (14.8%) | 15 (5.1%) |
| 55 to 59 Years | 9 (3.8%) | 8 (2.7%) |
| 60 to 64 Years | 12 (5.1%) | 10 (3.4%) |
| 65 to 69 Years | 3 (1.3%) | 9 (3.1%) |
| 70 to 74 Years | 4 (1.7%) | 16 (5.4%) |
| 75 to 79 Years | 13 (5.5%) | 32 (10.9%) |
| 80 to 84 Years | 0 (0.0%) | 6 (2.0%) |
| 85 Years and over | 17 (7.2%) | 13 (4.4%) |
| Total | 236 (100.0%) | 294 (100.0%) |
Families and Households in Zanesville
Median Family Size in Zanesville
The median family size in Zanesville is 2.78 persons per family, with single female/mother families (30 | 19.5%) accounting for the largest median family size of 3.03 persons per family. On the other hand, single male/father families (31 | 20.1%) represent the smallest median family size with 2.19 persons per family.
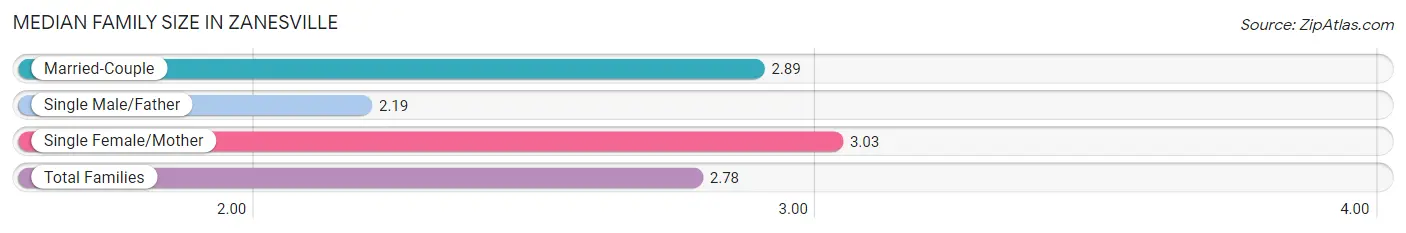
| Family Type | # Families | Family Size |
| Married-Couple | 93 (60.4%) | 2.89 |
| Single Male/Father | 31 (20.1%) | 2.19 |
| Single Female/Mother | 30 (19.5%) | 3.03 |
| Total Families | 154 (100.0%) | 2.78 |
Median Household Size in Zanesville
The median household size in Zanesville is 2.28 persons per household, with single female/mother households (30 | 12.9%) accounting for the largest median household size of 3.03 persons per household. non-family households (78 | 33.6%) represent the smallest median household size with 1.13 persons per household.
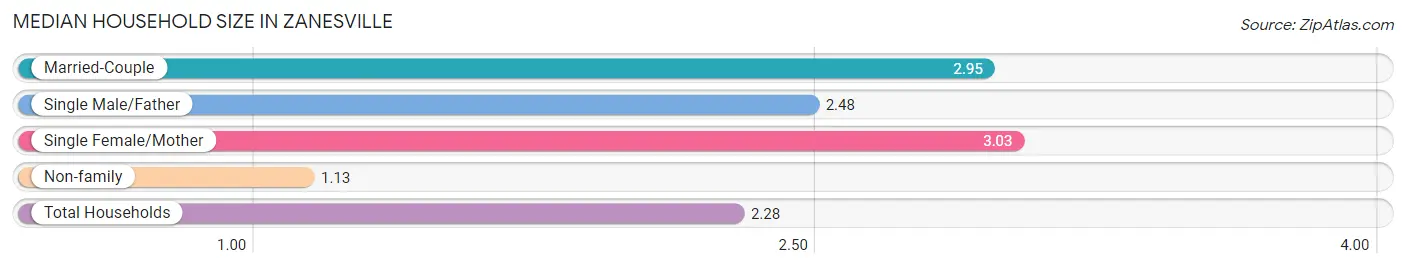
| Household Type | # Households | Household Size |
| Married-Couple | 93 (40.1%) | 2.95 |
| Single Male/Father | 31 (13.4%) | 2.48 |
| Single Female/Mother | 30 (12.9%) | 3.03 |
| Non-family | 78 (33.6%) | 1.13 |
| Total Households | 232 (100.0%) | 2.28 |
Household Size by Marriage Status in Zanesville
Out of a total of 232 households in Zanesville, 154 (66.4%) are family households, while 78 (33.6%) are nonfamily households. The most numerous type of family households are 2-person households, comprising 83, and the most common type of nonfamily households are 1-person households, comprising 70.
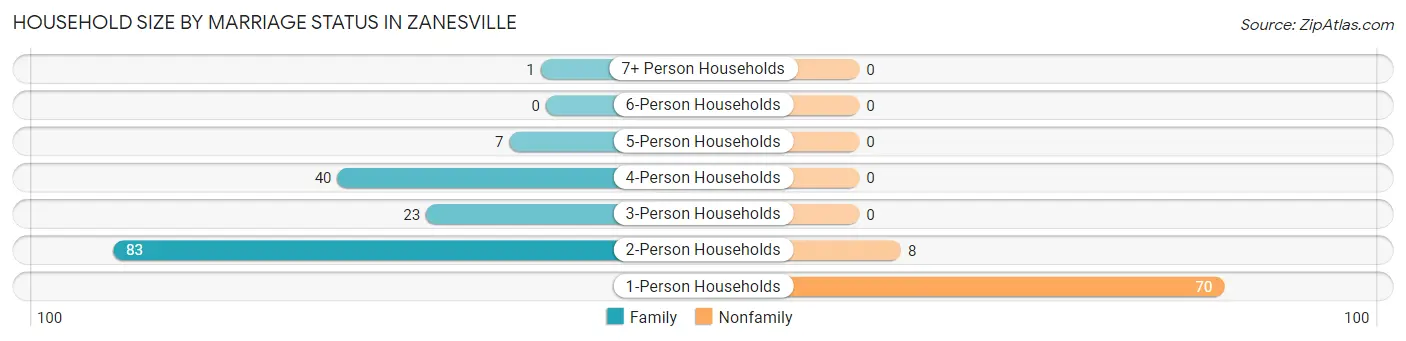
| Household Size | Family Households | Nonfamily Households |
| 1-Person Households | - | 70 (30.2%) |
| 2-Person Households | 83 (35.8%) | 8 (3.5%) |
| 3-Person Households | 23 (9.9%) | 0 (0.0%) |
| 4-Person Households | 40 (17.2%) | 0 (0.0%) |
| 5-Person Households | 7 (3.0%) | 0 (0.0%) |
| 6-Person Households | 0 (0.0%) | 0 (0.0%) |
| 7+ Person Households | 1 (0.4%) | 0 (0.0%) |
| Total | 154 (66.4%) | 78 (33.6%) |
Female Fertility in Zanesville
Fertility by Age in Zanesville
Average fertility rate in Zanesville is 83.0 births per 1,000 women. Women in the age bracket of 35 to 50 years have the highest fertility rate with 100.0 births per 1,000 women. Women in the age bracket of 35 to 50 years acount for 60.0% of all women with births.
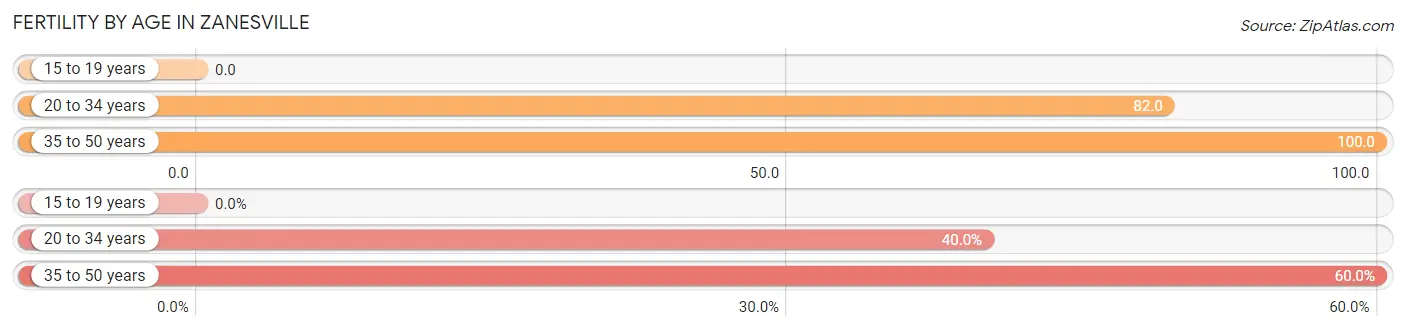
| Age Bracket | Women with Births | Births / 1,000 Women |
| 15 to 19 years | 0 (0.0%) | 0.0 |
| 20 to 34 years | 4 (40.0%) | 82.0 |
| 35 to 50 years | 6 (60.0%) | 100.0 |
| Total | 10 (100.0%) | 83.0 |
Fertility by Age by Marriage Status in Zanesville
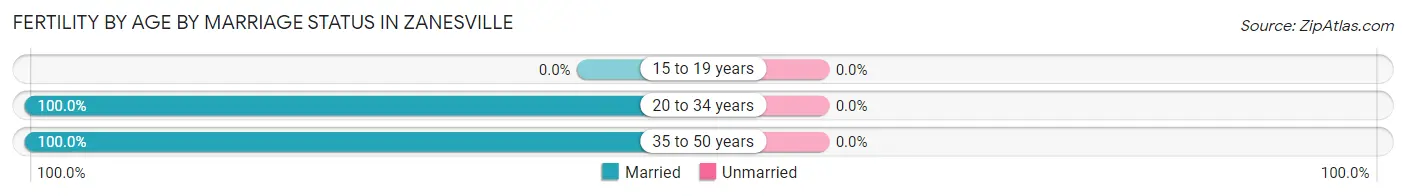
| Age Bracket | Married | Unmarried |
| 15 to 19 years | 0 (0.0%) | 0 (0.0%) |
| 20 to 34 years | 4 (100.0%) | 0 (0.0%) |
| 35 to 50 years | 6 (100.0%) | 0 (0.0%) |
| Total | 10 (100.0%) | 0 (0.0%) |
Fertility by Education in Zanesville
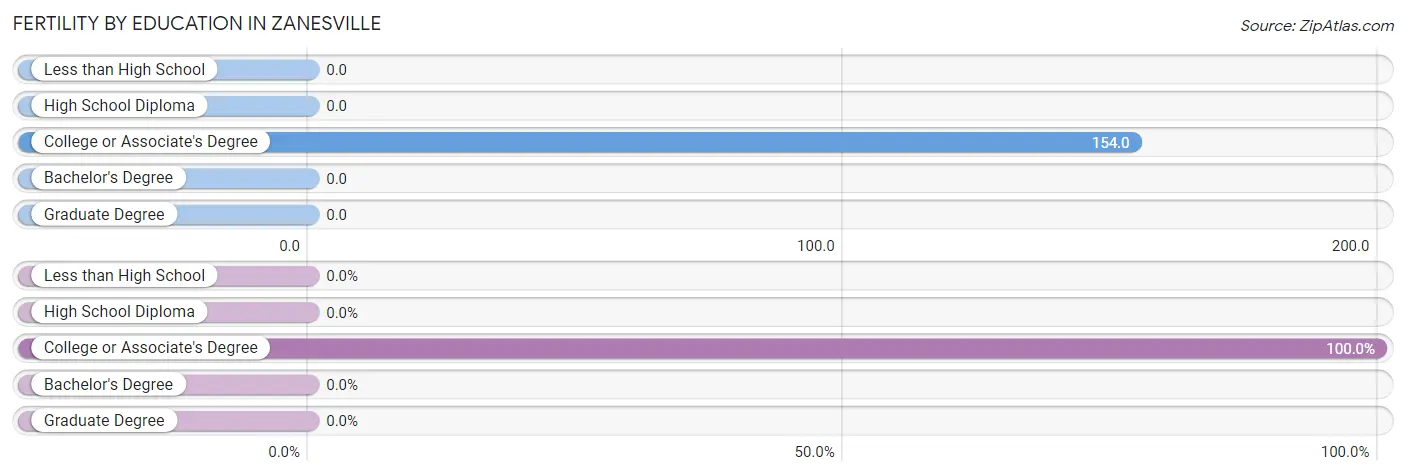
| Educational Attainment | Women with Births | Births / 1,000 Women |
| Less than High School | 0 (0.0%) | 0.0 |
| High School Diploma | 0 (0.0%) | 0.0 |
| College or Associate's Degree | 10 (100.0%) | 154.0 |
| Bachelor's Degree | 0 (0.0%) | 0.0 |
| Graduate Degree | 0 (0.0%) | 0.0 |
| Total | 10 (100.0%) | 83.0 |
Fertility by Education by Marriage Status in Zanesville
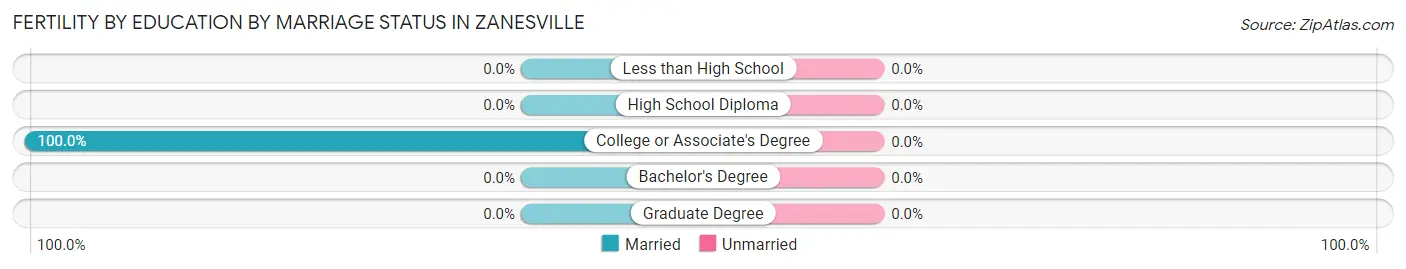
| Educational Attainment | Married | Unmarried |
| Less than High School | 0 (0.0%) | 0 (0.0%) |
| High School Diploma | 0 (0.0%) | 0 (0.0%) |
| College or Associate's Degree | 10 (100.0%) | 0 (0.0%) |
| Bachelor's Degree | 0 (0.0%) | 0 (0.0%) |
| Graduate Degree | 0 (0.0%) | 0 (0.0%) |
| Total | 10 (100.0%) | 0 (0.0%) |
Income in Zanesville
Income Overview in Zanesville
Per Capita Income in Zanesville is $25,904, while median incomes of families and households are $57,500 and $55,625 respectively.
| Characteristic | Number | Measure |
| Per Capita Income | 530 | $25,904 |
| Median Family Income | 154 | $57,500 |
| Mean Family Income | 154 | $61,656 |
| Median Household Income | 232 | $55,625 |
| Mean Household Income | 232 | $59,705 |
| Income Deficit | 154 | $0 |
| Wage / Income Gap (%) | 530 | 32.96% |
| Wage / Income Gap ($) | 530 | 67.04¢ per $1 |
| Gini / Inequality Index | 530 | 0.35 |
Earnings by Sex in Zanesville
Average Earnings in Zanesville are $31,053, $40,417 for men and $27,097 for women, a difference of 33.0%.
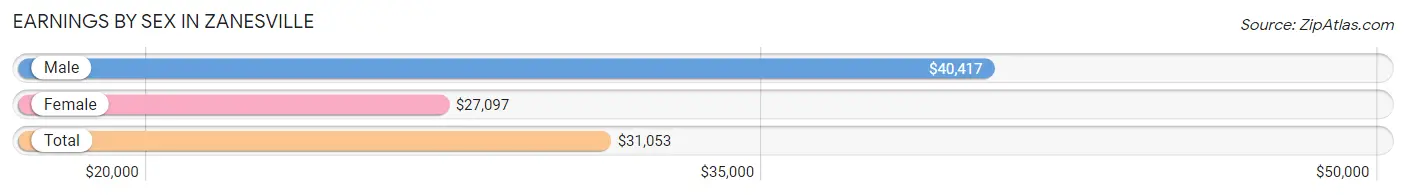
| Sex | Number | Average Earnings |
| Male | 150 (54.0%) | $40,417 |
| Female | 128 (46.0%) | $27,097 |
| Total | 278 (100.0%) | $31,053 |
Earnings by Sex by Income Bracket in Zanesville
The most common earnings brackets in Zanesville are $2,499 or less for men (31 | 20.7%) and $25,000 to $29,999 for women (31 | 24.2%).
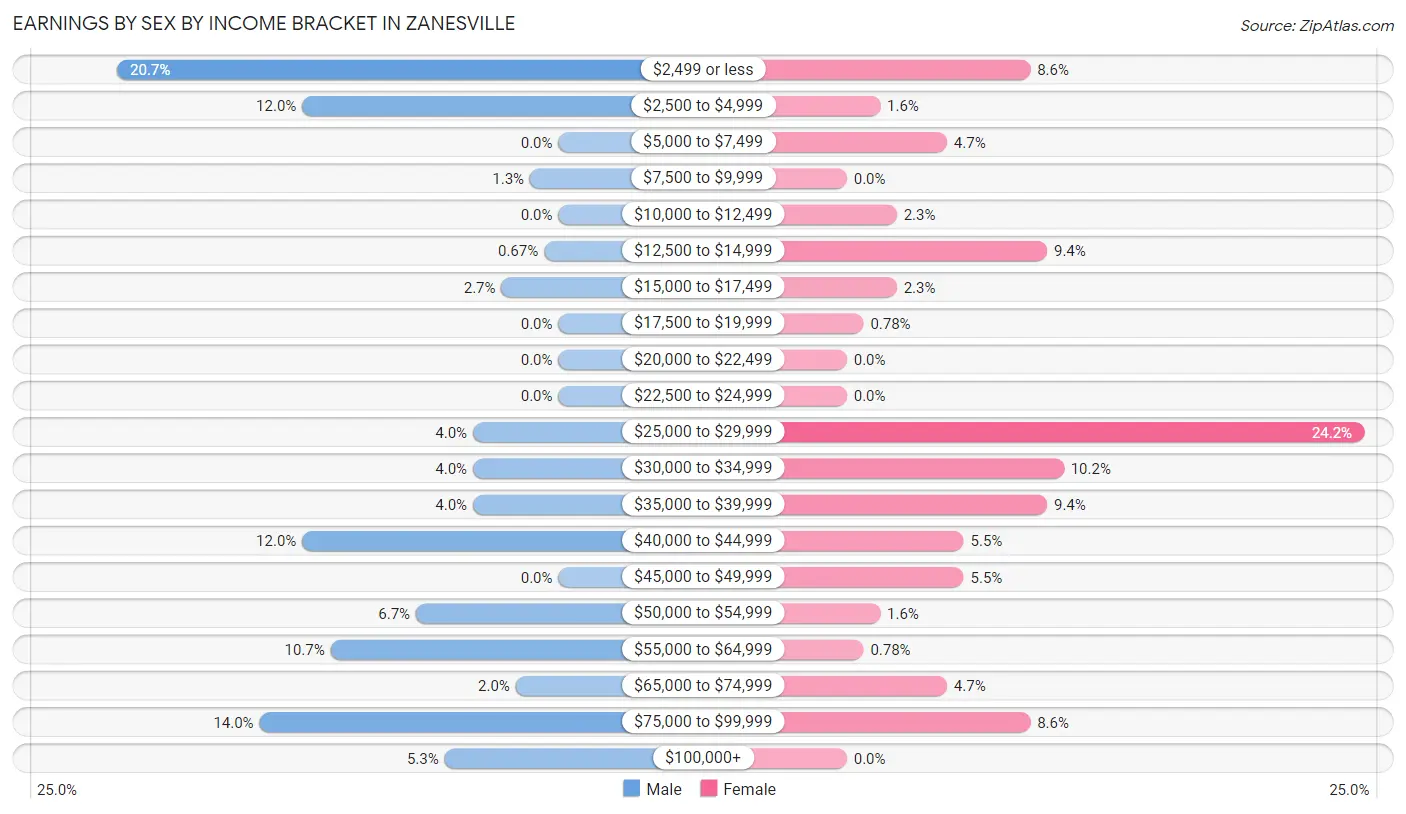
| Income | Male | Female |
| $2,499 or less | 31 (20.7%) | 11 (8.6%) |
| $2,500 to $4,999 | 18 (12.0%) | 2 (1.6%) |
| $5,000 to $7,499 | 0 (0.0%) | 6 (4.7%) |
| $7,500 to $9,999 | 2 (1.3%) | 0 (0.0%) |
| $10,000 to $12,499 | 0 (0.0%) | 3 (2.3%) |
| $12,500 to $14,999 | 1 (0.7%) | 12 (9.4%) |
| $15,000 to $17,499 | 4 (2.7%) | 3 (2.3%) |
| $17,500 to $19,999 | 0 (0.0%) | 1 (0.8%) |
| $20,000 to $22,499 | 0 (0.0%) | 0 (0.0%) |
| $22,500 to $24,999 | 0 (0.0%) | 0 (0.0%) |
| $25,000 to $29,999 | 6 (4.0%) | 31 (24.2%) |
| $30,000 to $34,999 | 6 (4.0%) | 13 (10.2%) |
| $35,000 to $39,999 | 6 (4.0%) | 12 (9.4%) |
| $40,000 to $44,999 | 18 (12.0%) | 7 (5.5%) |
| $45,000 to $49,999 | 0 (0.0%) | 7 (5.5%) |
| $50,000 to $54,999 | 10 (6.7%) | 2 (1.6%) |
| $55,000 to $64,999 | 16 (10.7%) | 1 (0.8%) |
| $65,000 to $74,999 | 3 (2.0%) | 6 (4.7%) |
| $75,000 to $99,999 | 21 (14.0%) | 11 (8.6%) |
| $100,000+ | 8 (5.3%) | 0 (0.0%) |
| Total | 150 (100.0%) | 128 (100.0%) |
Earnings by Sex by Educational Attainment in Zanesville
Average earnings in Zanesville are $52,857 for men and $30,769 for women, a difference of 41.8%. Men with an educational attainment of college or associate's degree enjoy the highest average annual earnings of $64,583, while those with college or associate's degree education earn the least with $64,583. Women with an educational attainment of bachelor's degree earn the most with the average annual earnings of $38,750, while those with college or associate's degree education have the smallest earnings of $26,734.
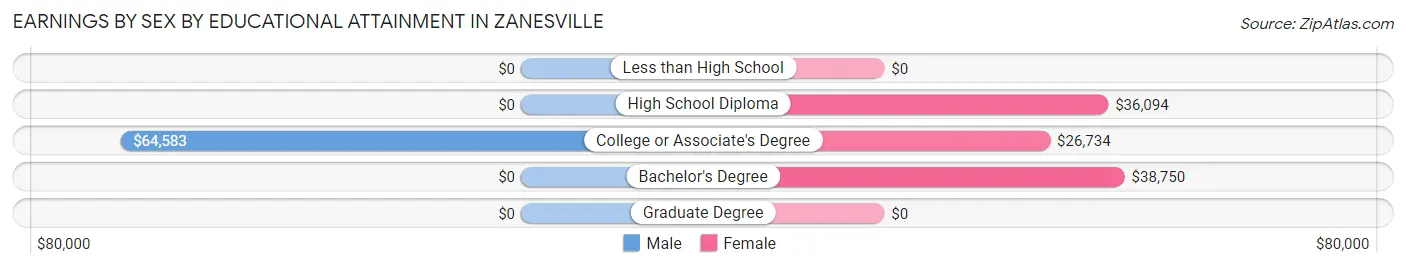
| Educational Attainment | Male Income | Female Income |
| Less than High School | - | - |
| High School Diploma | - | - |
| College or Associate's Degree | $64,583 | $26,734 |
| Bachelor's Degree | - | - |
| Graduate Degree | - | - |
| Total | $52,857 | $30,769 |
Family Income in Zanesville
Family Income Brackets in Zanesville
According to the Zanesville family income data, there are 34 families falling into the $75,000 to $99,999 income range, which is the most common income bracket and makes up 22.1% of all families.
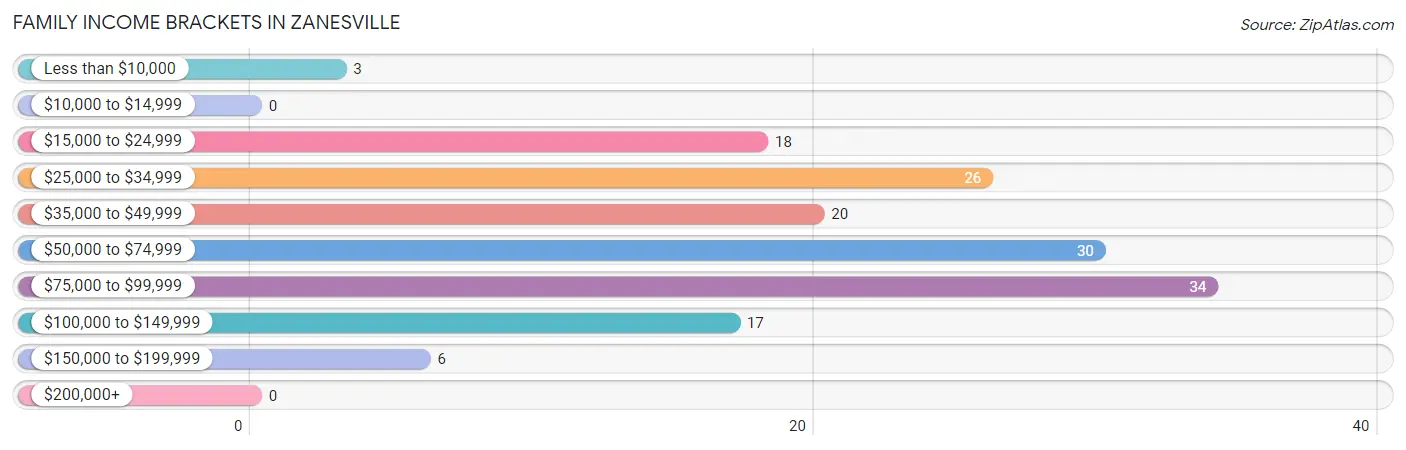
| Income Bracket | # Families | % Families |
| Less than $10,000 | 3 | 1.9% |
| $10,000 to $14,999 | 0 | 0.0% |
| $15,000 to $24,999 | 18 | 11.7% |
| $25,000 to $34,999 | 26 | 16.9% |
| $35,000 to $49,999 | 20 | 13.0% |
| $50,000 to $74,999 | 30 | 19.5% |
| $75,000 to $99,999 | 34 | 22.1% |
| $100,000 to $149,999 | 17 | 11.0% |
| $150,000 to $199,999 | 6 | 3.9% |
| $200,000+ | 0 | 0.0% |
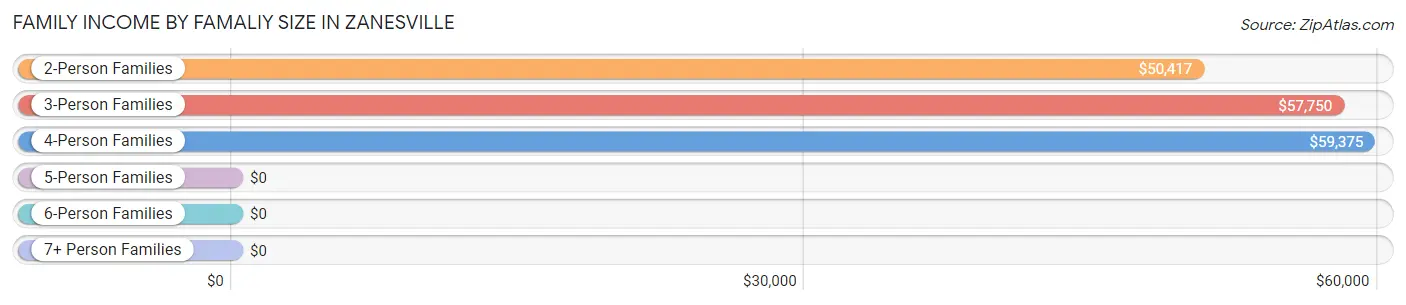
Family Income by Famaliy Size in Zanesville
4-person families (40 | 26.0%) account for the highest median family income in Zanesville with $59,375 per family, while 2-person families (92 | 59.7%) have the highest median income of $25,208 per family member.
| Income Bracket | # Families | Median Income |
| 2-Person Families | 92 (59.7%) | $50,417 |
| 3-Person Families | 17 (11.0%) | $57,750 |
| 4-Person Families | 40 (26.0%) | $59,375 |
| 5-Person Families | 4 (2.6%) | $0 |
| 6-Person Families | 1 (0.6%) | $0 |
| 7+ Person Families | 0 (0.0%) | $0 |
| Total | 154 (100.0%) | $57,500 |
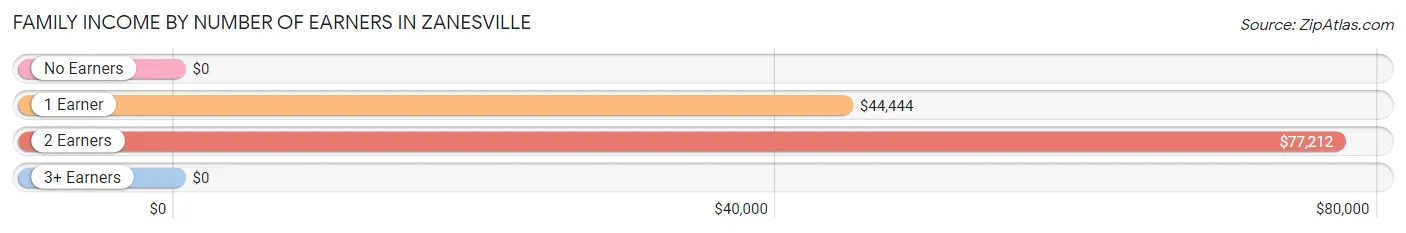
Family Income by Number of Earners in Zanesville
| Number of Earners | # Families | Median Income |
| No Earners | 45 (29.2%) | $0 |
| 1 Earner | 38 (24.7%) | $44,444 |
| 2 Earners | 51 (33.1%) | $77,212 |
| 3+ Earners | 20 (13.0%) | $0 |
| Total | 154 (100.0%) | $57,500 |
Household Income in Zanesville
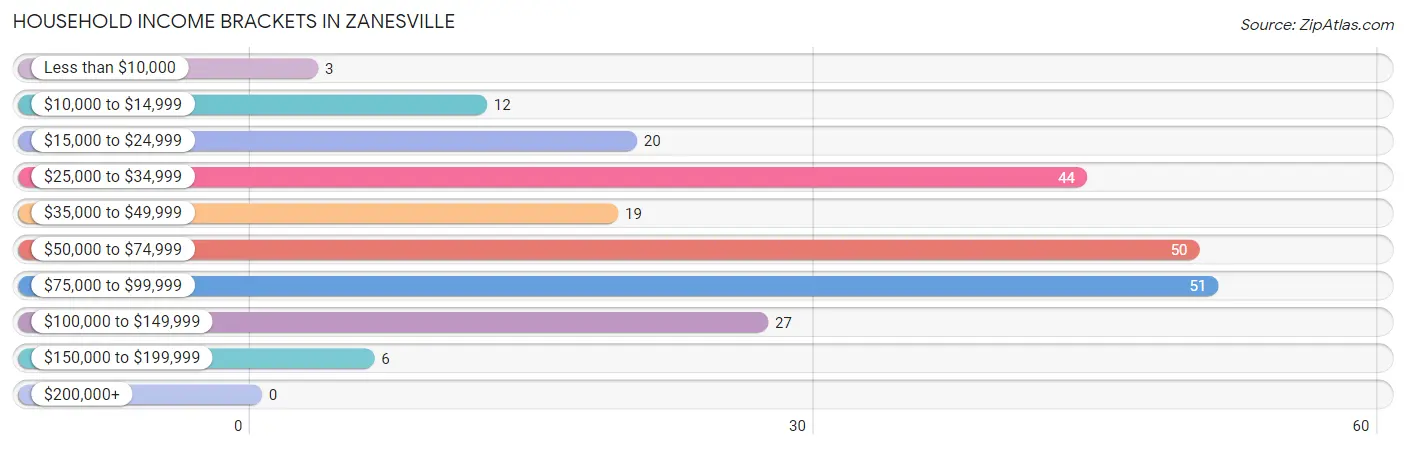
Household Income Brackets in Zanesville
With 51 households falling in the category, the $75,000 to $99,999 income range is the most frequent in Zanesville, accounting for 22.0% of all households.
| Income Bracket | # Households | % Households |
| Less than $10,000 | 3 | 1.3% |
| $10,000 to $14,999 | 12 | 5.2% |
| $15,000 to $24,999 | 20 | 8.6% |
| $25,000 to $34,999 | 44 | 19.0% |
| $35,000 to $49,999 | 19 | 8.2% |
| $50,000 to $74,999 | 50 | 21.6% |
| $75,000 to $99,999 | 51 | 22.0% |
| $100,000 to $149,999 | 27 | 11.6% |
| $150,000 to $199,999 | 6 | 2.6% |
| $200,000+ | 0 | 0.0% |
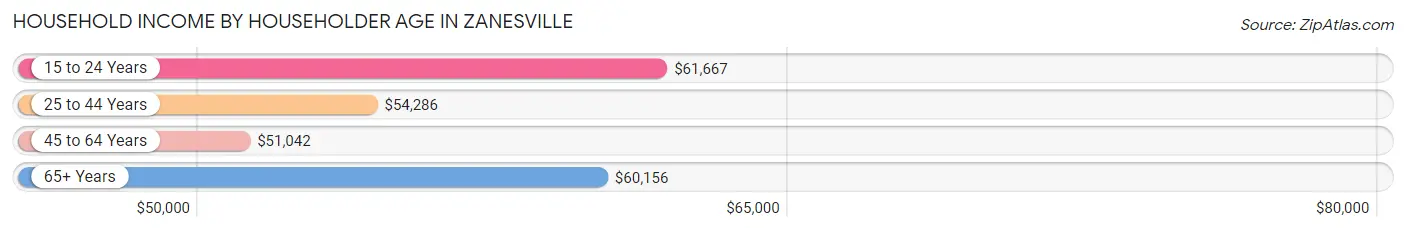
Household Income by Householder Age in Zanesville
The median household income in Zanesville is $55,625, with the highest median household income of $61,667 found in the 15 to 24 years age bracket for the primary householder. A total of 10 households (4.3%) fall into this category. Meanwhile, the 45 to 64 years age bracket for the primary householder has the lowest median household income of $51,042, with 101 households (43.5%) in this group.
| Income Bracket | # Households | Median Income |
| 15 to 24 Years | 10 (4.3%) | $61,667 |
| 25 to 44 Years | 68 (29.3%) | $54,286 |
| 45 to 64 Years | 101 (43.5%) | $51,042 |
| 65+ Years | 53 (22.8%) | $60,156 |
| Total | 232 (100.0%) | $55,625 |
Poverty in Zanesville
Income Below Poverty by Sex and Age in Zanesville
With 11.2% poverty level for males and 11.3% for females among the residents of Zanesville, 45 to 54 year old males and 75 year old and over females are the most vulnerable to poverty, with 18 males (38.3%) and 18 females (35.3%) in their respective age groups living below the poverty level.
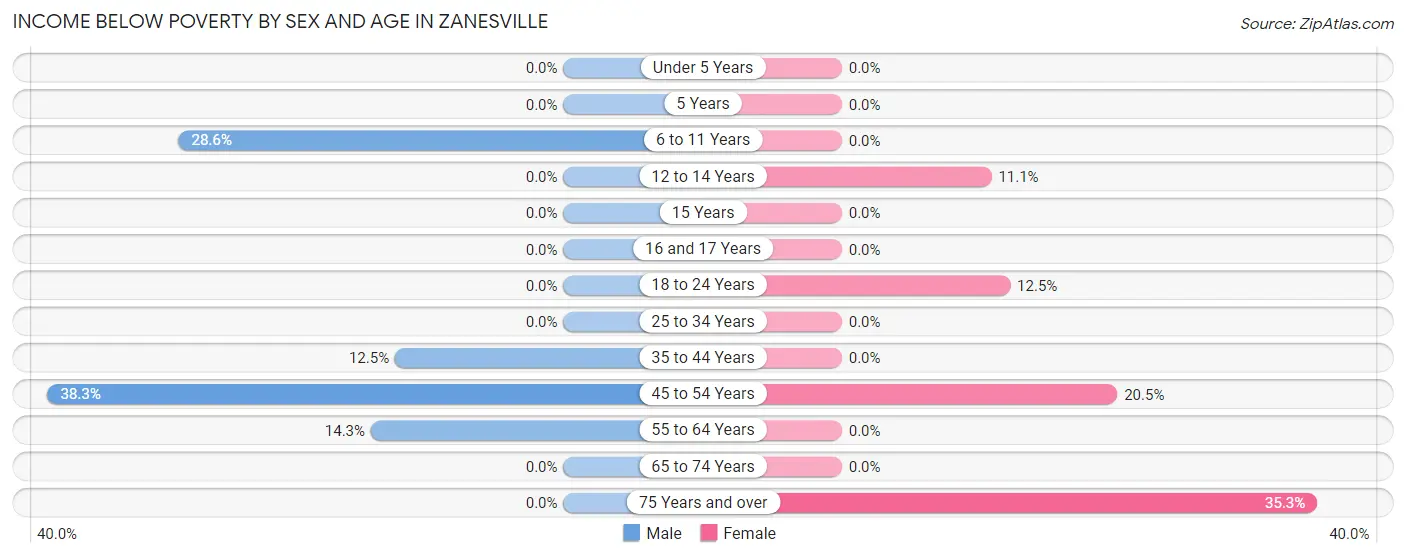
| Age Bracket | Male | Female |
| Under 5 Years | 0 (0.0%) | 0 (0.0%) |
| 5 Years | 0 (0.0%) | 0 (0.0%) |
| 6 to 11 Years | 2 (28.6%) | 0 (0.0%) |
| 12 to 14 Years | 0 (0.0%) | 3 (11.1%) |
| 15 Years | 0 (0.0%) | 0 (0.0%) |
| 16 and 17 Years | 0 (0.0%) | 0 (0.0%) |
| 18 to 24 Years | 0 (0.0%) | 3 (12.5%) |
| 25 to 34 Years | 0 (0.0%) | 0 (0.0%) |
| 35 to 44 Years | 3 (12.5%) | 0 (0.0%) |
| 45 to 54 Years | 18 (38.3%) | 9 (20.4%) |
| 55 to 64 Years | 3 (14.3%) | 0 (0.0%) |
| 65 to 74 Years | 0 (0.0%) | 0 (0.0%) |
| 75 Years and over | 0 (0.0%) | 18 (35.3%) |
| Total | 26 (11.2%) | 33 (11.3%) |
Income Above Poverty by Sex and Age in Zanesville
According to the poverty statistics in Zanesville, males aged under 5 years and females aged under 5 years are the age groups that are most secure financially, with 100.0% of males and 100.0% of females in these age groups living above the poverty line.
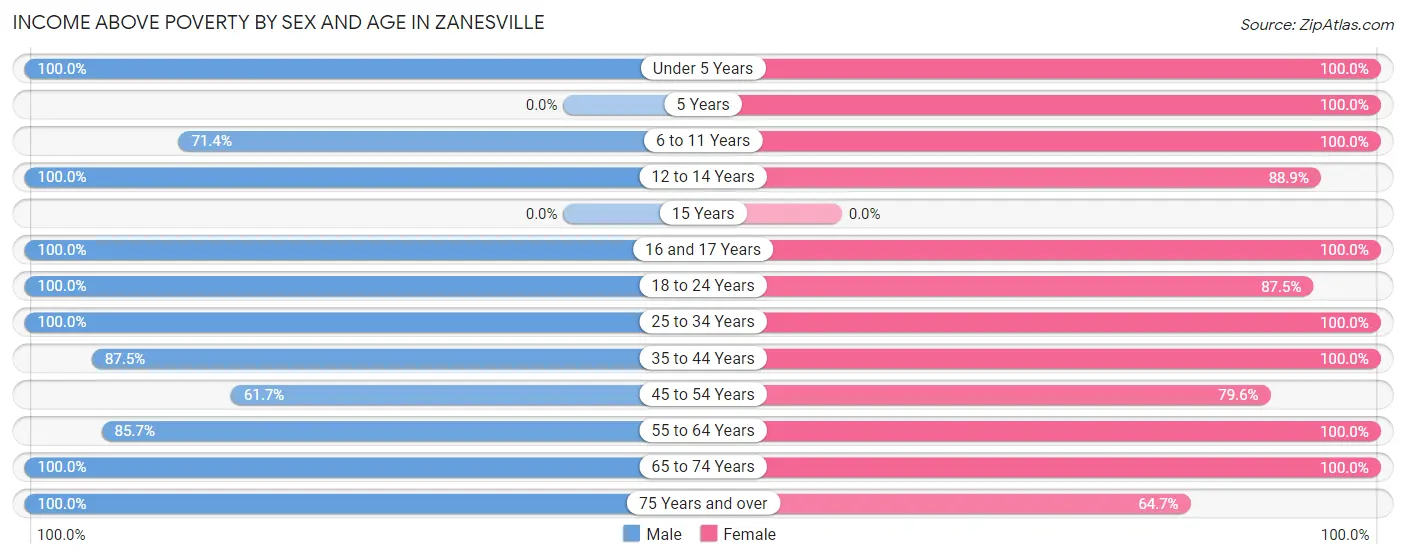
| Age Bracket | Male | Female |
| Under 5 Years | 5 (100.0%) | 20 (100.0%) |
| 5 Years | 0 (0.0%) | 8 (100.0%) |
| 6 to 11 Years | 5 (71.4%) | 11 (100.0%) |
| 12 to 14 Years | 2 (100.0%) | 24 (88.9%) |
| 15 Years | 0 (0.0%) | 0 (0.0%) |
| 16 and 17 Years | 36 (100.0%) | 2 (100.0%) |
| 18 to 24 Years | 26 (100.0%) | 21 (87.5%) |
| 25 to 34 Years | 28 (100.0%) | 35 (100.0%) |
| 35 to 44 Years | 21 (87.5%) | 27 (100.0%) |
| 45 to 54 Years | 29 (61.7%) | 35 (79.5%) |
| 55 to 64 Years | 18 (85.7%) | 18 (100.0%) |
| 65 to 74 Years | 7 (100.0%) | 25 (100.0%) |
| 75 Years and over | 30 (100.0%) | 33 (64.7%) |
| Total | 207 (88.8%) | 259 (88.7%) |
Income Below Poverty Among Married-Couple Families in Zanesville
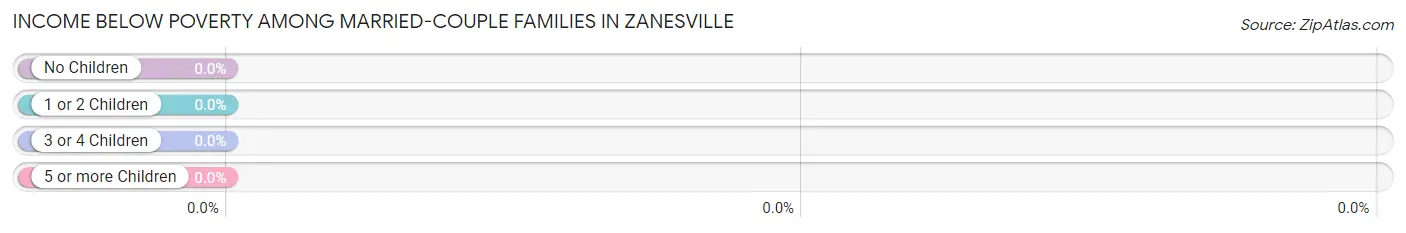
| Children | Above Poverty | Below Poverty |
| No Children | 56 (100.0%) | 0 (0.0%) |
| 1 or 2 Children | 33 (100.0%) | 0 (0.0%) |
| 3 or 4 Children | 4 (100.0%) | 0 (0.0%) |
| 5 or more Children | 0 (0.0%) | 0 (0.0%) |
| Total | 93 (100.0%) | 0 (0.0%) |
Income Below Poverty Among Single-Parent Households in Zanesville
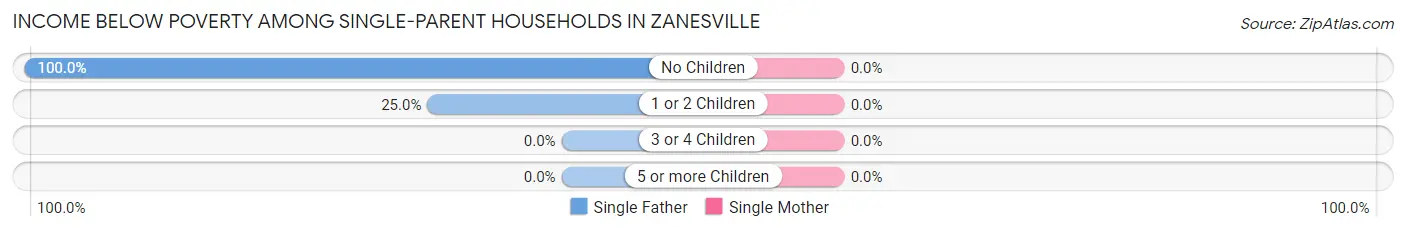
| Children | Single Father | Single Mother |
| No Children | 18 (100.0%) | 0 (0.0%) |
| 1 or 2 Children | 3 (25.0%) | 0 (0.0%) |
| 3 or 4 Children | 0 (0.0%) | 0 (0.0%) |
| 5 or more Children | 0 (0.0%) | 0 (0.0%) |
| Total | 21 (67.7%) | 0 (0.0%) |
Income Below Poverty Among Married-Couple vs Single-Parent Households in Zanesville
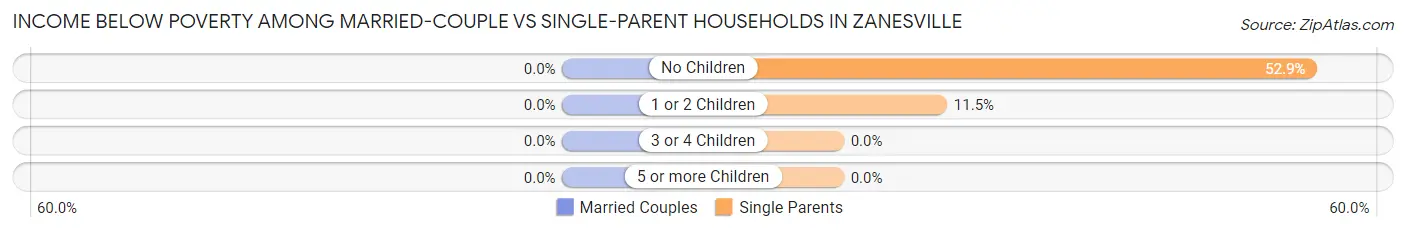
| Children | Married-Couple Families | Single-Parent Households |
| No Children | 0 (0.0%) | 18 (52.9%) |
| 1 or 2 Children | 0 (0.0%) | 3 (11.5%) |
| 3 or 4 Children | 0 (0.0%) | 0 (0.0%) |
| 5 or more Children | 0 (0.0%) | 0 (0.0%) |
| Total | 0 (0.0%) | 21 (34.4%) |
Employment Characteristics in Zanesville
Employment by Class of Employer in Zanesville
Among the 232 employed individuals in Zanesville, private company employees (137 | 59.1%), not-for-profit organizations (38 | 16.4%), and self-employed (not incorporated) (20 | 8.6%) make up the most common classes of employment.
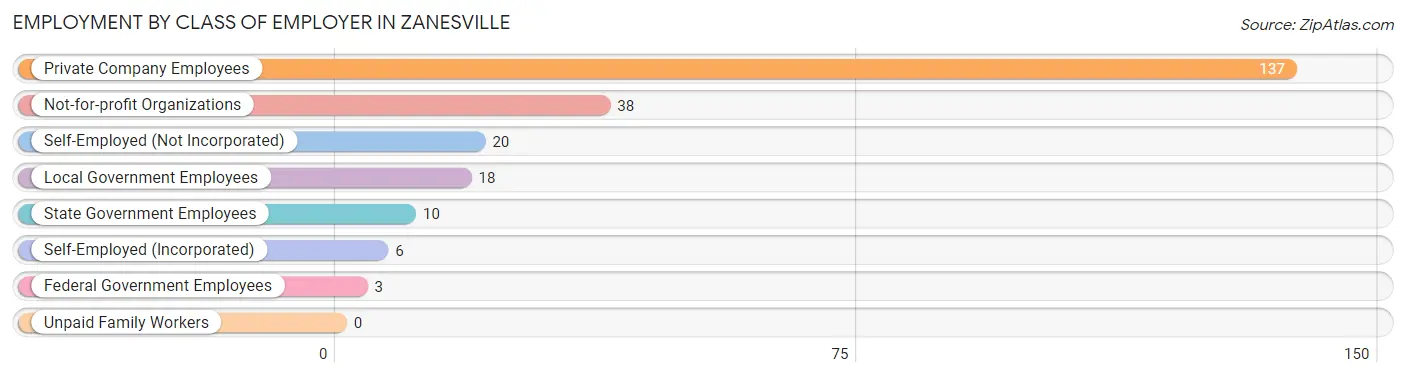
| Employer Class | # Employees | % Employees |
| Private Company Employees | 137 | 59.1% |
| Self-Employed (Incorporated) | 6 | 2.6% |
| Self-Employed (Not Incorporated) | 20 | 8.6% |
| Not-for-profit Organizations | 38 | 16.4% |
| Local Government Employees | 18 | 7.8% |
| State Government Employees | 10 | 4.3% |
| Federal Government Employees | 3 | 1.3% |
| Unpaid Family Workers | 0 | 0.0% |
| Total | 232 | 100.0% |
Employment Status by Age in Zanesville
According to the labor force statistics for Zanesville, out of the total population over 16 years of age (445), 52.8% or 235 individuals are in the labor force, with 0.9% or 2 of them unemployed. The age group with the highest labor force participation rate is 30 to 34 years, with 100.0% or 22 individuals in the labor force. Within the labor force, the 20 to 24 years age range has the highest percentage of unemployed individuals, with 5.6% or 1 of them being unemployed.
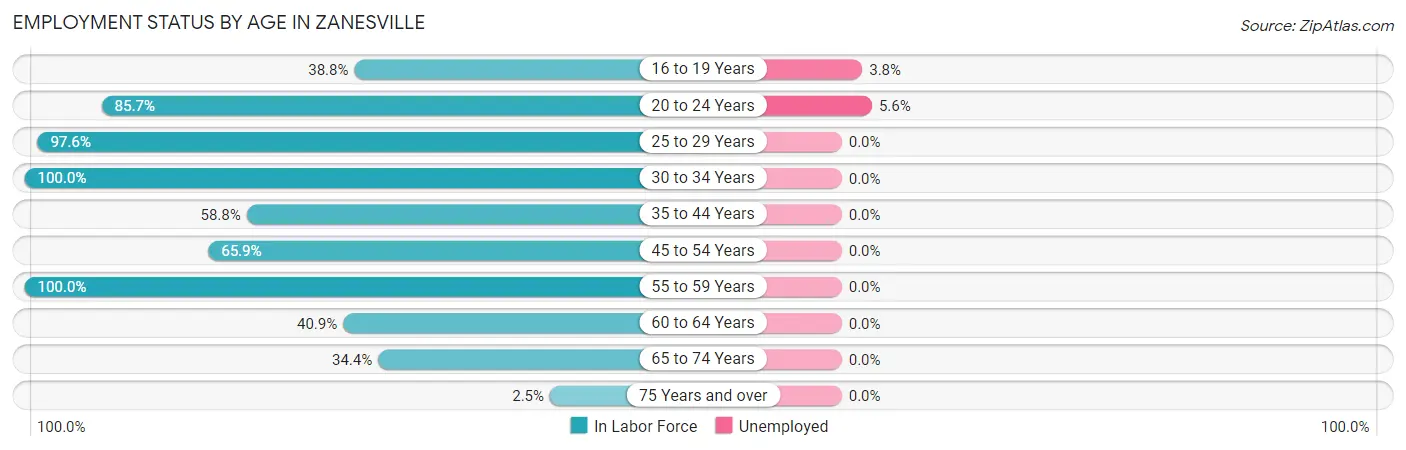
| Age Bracket | In Labor Force | Unemployed |
| 16 to 19 Years | 26 (38.8%) | 1 (3.8%) |
| 20 to 24 Years | 18 (85.7%) | 1 (5.6%) |
| 25 to 29 Years | 40 (97.6%) | 0 (0.0%) |
| 30 to 34 Years | 22 (100.0%) | 0 (0.0%) |
| 35 to 44 Years | 30 (58.8%) | 0 (0.0%) |
| 45 to 54 Years | 60 (65.9%) | 0 (0.0%) |
| 55 to 59 Years | 17 (100.0%) | 0 (0.0%) |
| 60 to 64 Years | 9 (40.9%) | 0 (0.0%) |
| 65 to 74 Years | 11 (34.4%) | 0 (0.0%) |
| 75 Years and over | 2 (2.5%) | 0 (0.0%) |
| Total | 235 (52.8%) | 2 (0.9%) |
Employment Status by Educational Attainment in Zanesville
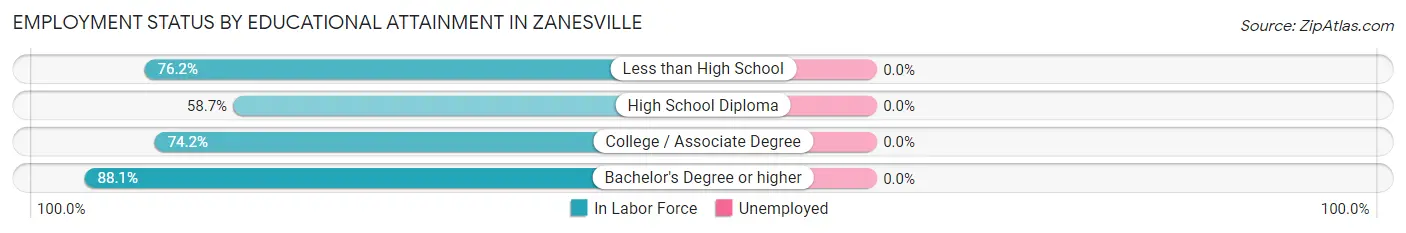
| Educational Attainment | In Labor Force | Unemployed |
| Less than High School | 16 (76.2%) | 0 (0.0%) |
| High School Diploma | 44 (58.7%) | 0 (0.0%) |
| College / Associate Degree | 66 (74.2%) | 0 (0.0%) |
| Bachelor's Degree or higher | 52 (88.1%) | 0 (0.0%) |
| Total | 178 (73.0%) | 0 (0.0%) |
Employment Occupations by Sex in Zanesville
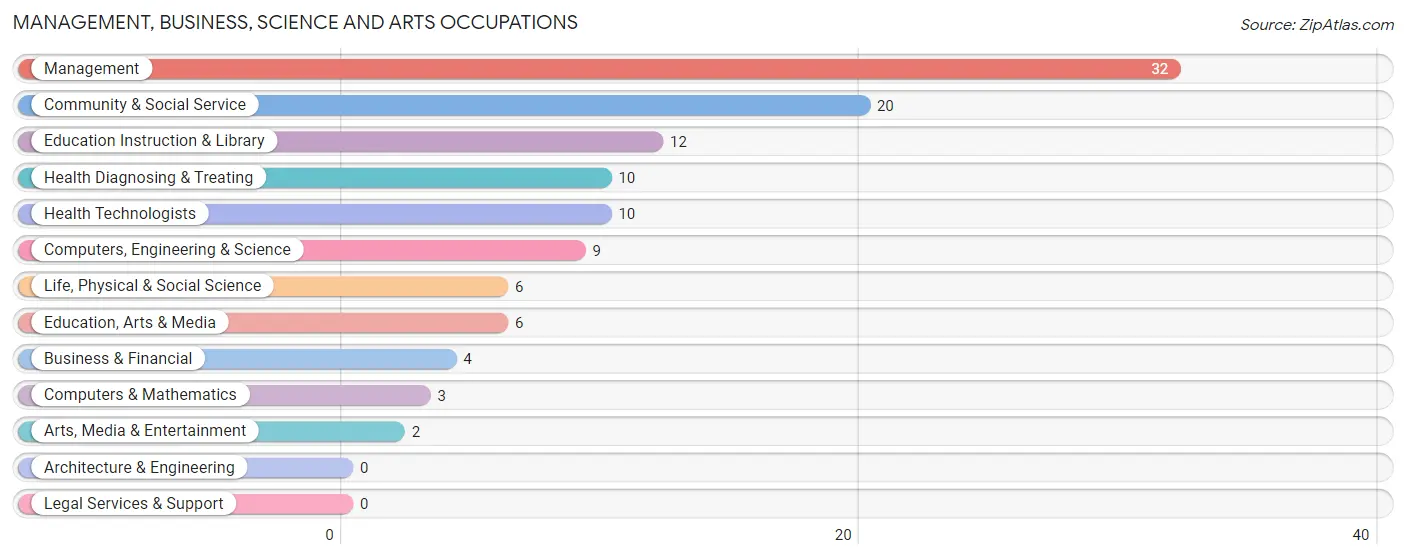
Management, Business, Science and Arts Occupations
The most common Management, Business, Science and Arts occupations in Zanesville are Management (32 | 13.7%), Community & Social Service (20 | 8.6%), Education Instruction & Library (12 | 5.1%), Health Diagnosing & Treating (10 | 4.3%), and Health Technologists (10 | 4.3%).
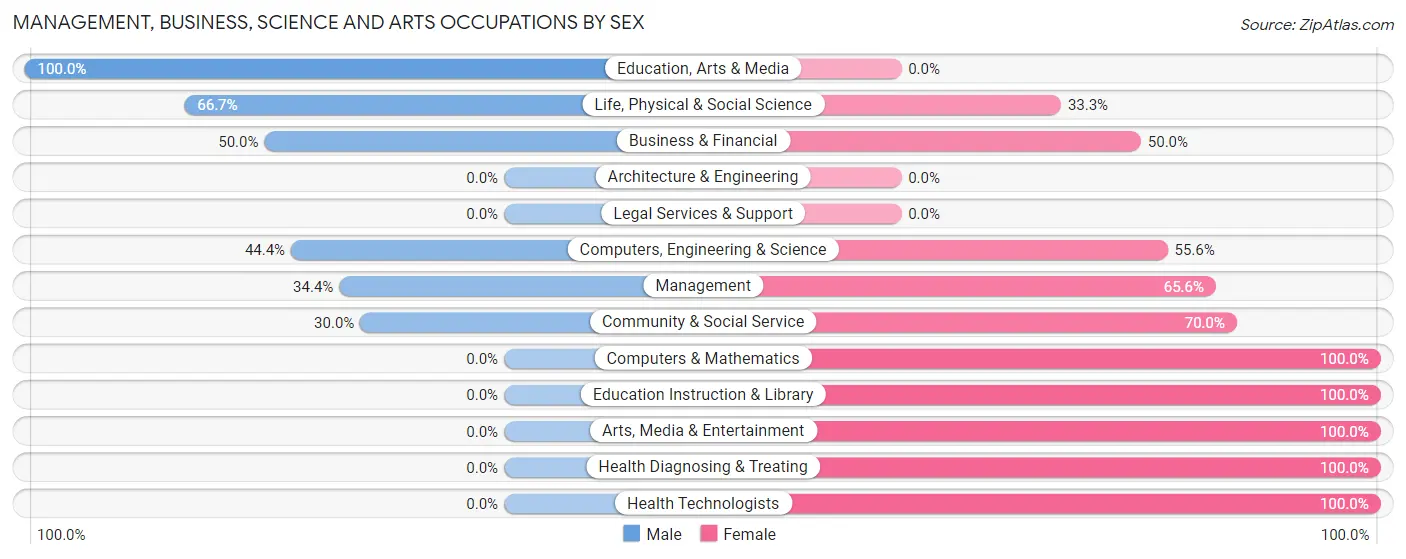
Management, Business, Science and Arts Occupations by Sex
Within the Management, Business, Science and Arts occupations in Zanesville, the most male-oriented occupations are Education, Arts & Media (100.0%), Life, Physical & Social Science (66.7%), and Business & Financial (50.0%), while the most female-oriented occupations are Computers & Mathematics (100.0%), Education Instruction & Library (100.0%), and Arts, Media & Entertainment (100.0%).
| Occupation | Male | Female |
| Management | 11 (34.4%) | 21 (65.6%) |
| Business & Financial | 2 (50.0%) | 2 (50.0%) |
| Computers, Engineering & Science | 4 (44.4%) | 5 (55.6%) |
| Computers & Mathematics | 0 (0.0%) | 3 (100.0%) |
| Architecture & Engineering | 0 (0.0%) | 0 (0.0%) |
| Life, Physical & Social Science | 4 (66.7%) | 2 (33.3%) |
| Community & Social Service | 6 (30.0%) | 14 (70.0%) |
| Education, Arts & Media | 6 (100.0%) | 0 (0.0%) |
| Legal Services & Support | 0 (0.0%) | 0 (0.0%) |
| Education Instruction & Library | 0 (0.0%) | 12 (100.0%) |
| Arts, Media & Entertainment | 0 (0.0%) | 2 (100.0%) |
| Health Diagnosing & Treating | 0 (0.0%) | 10 (100.0%) |
| Health Technologists | 0 (0.0%) | 10 (100.0%) |
| Total (Category) | 23 (30.7%) | 52 (69.3%) |
| Total (Overall) | 113 (48.5%) | 120 (51.5%) |
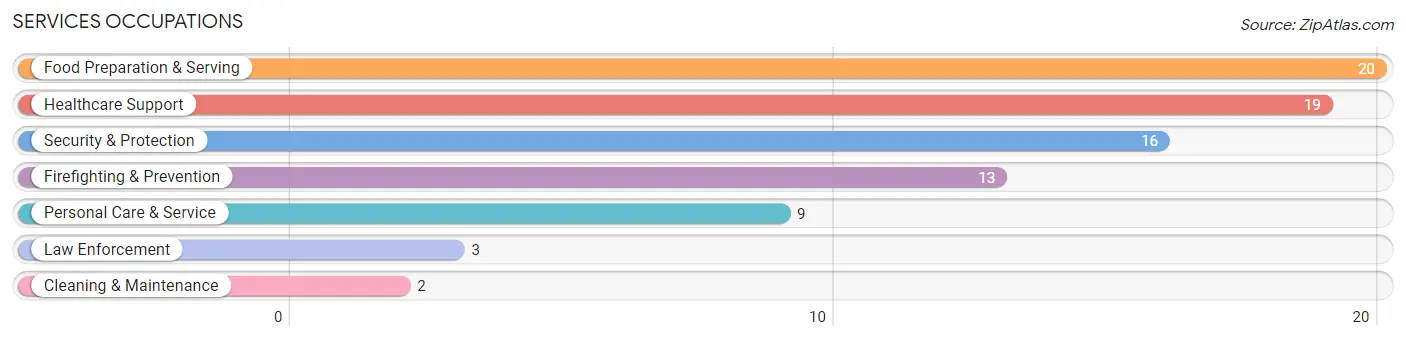
Services Occupations
The most common Services occupations in Zanesville are Food Preparation & Serving (20 | 8.6%), Healthcare Support (19 | 8.2%), Security & Protection (16 | 6.9%), Firefighting & Prevention (13 | 5.6%), and Personal Care & Service (9 | 3.9%).
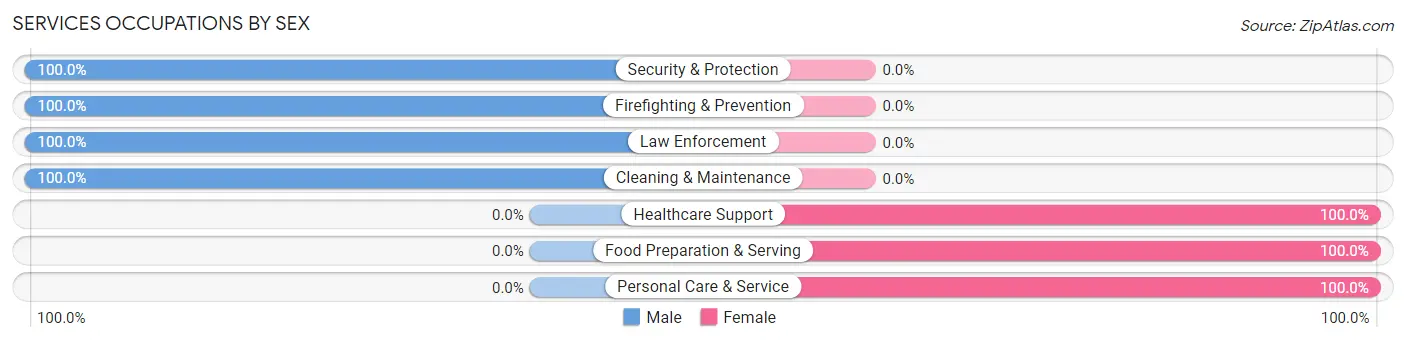
Services Occupations by Sex
Within the Services occupations in Zanesville, the most male-oriented occupations are Security & Protection (100.0%), Firefighting & Prevention (100.0%), and Law Enforcement (100.0%), while the most female-oriented occupations are Healthcare Support (100.0%), Food Preparation & Serving (100.0%), and Personal Care & Service (100.0%).
| Occupation | Male | Female |
| Healthcare Support | 0 (0.0%) | 19 (100.0%) |
| Security & Protection | 16 (100.0%) | 0 (0.0%) |
| Firefighting & Prevention | 13 (100.0%) | 0 (0.0%) |
| Law Enforcement | 3 (100.0%) | 0 (0.0%) |
| Food Preparation & Serving | 0 (0.0%) | 20 (100.0%) |
| Cleaning & Maintenance | 2 (100.0%) | 0 (0.0%) |
| Personal Care & Service | 0 (0.0%) | 9 (100.0%) |
| Total (Category) | 18 (27.3%) | 48 (72.7%) |
| Total (Overall) | 113 (48.5%) | 120 (51.5%) |
Sales and Office Occupations
The most common Sales and Office occupations in Zanesville are Sales & Related (12 | 5.1%), and Office & Administration (10 | 4.3%).
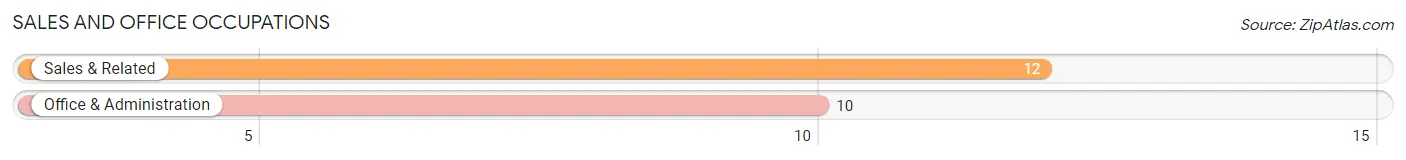
Sales and Office Occupations by Sex
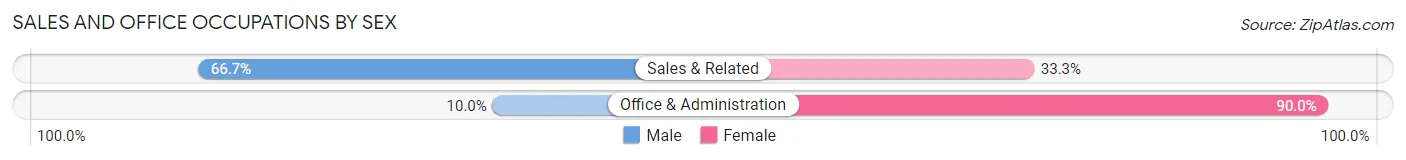
| Occupation | Male | Female |
| Sales & Related | 8 (66.7%) | 4 (33.3%) |
| Office & Administration | 1 (10.0%) | 9 (90.0%) |
| Total (Category) | 9 (40.9%) | 13 (59.1%) |
| Total (Overall) | 113 (48.5%) | 120 (51.5%) |
Natural Resources, Construction and Maintenance Occupations
The most common Natural Resources, Construction and Maintenance occupations in Zanesville are Installation, Maintenance & Repair (16 | 6.9%), and Construction & Extraction (12 | 5.1%).

Natural Resources, Construction and Maintenance Occupations by Sex

| Occupation | Male | Female |
| Farming, Fishing & Forestry | 0 (0.0%) | 0 (0.0%) |
| Construction & Extraction | 12 (100.0%) | 0 (0.0%) |
| Installation, Maintenance & Repair | 9 (56.2%) | 7 (43.8%) |
| Total (Category) | 21 (75.0%) | 7 (25.0%) |
| Total (Overall) | 113 (48.5%) | 120 (51.5%) |
Production, Transportation and Moving Occupations
The most common Production, Transportation and Moving occupations in Zanesville are Production (19 | 8.2%), Transportation (15 | 6.4%), and Material Moving (8 | 3.4%).
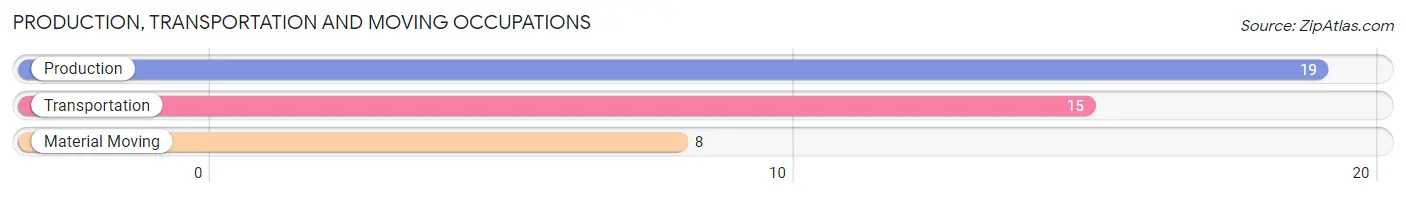
Production, Transportation and Moving Occupations by Sex
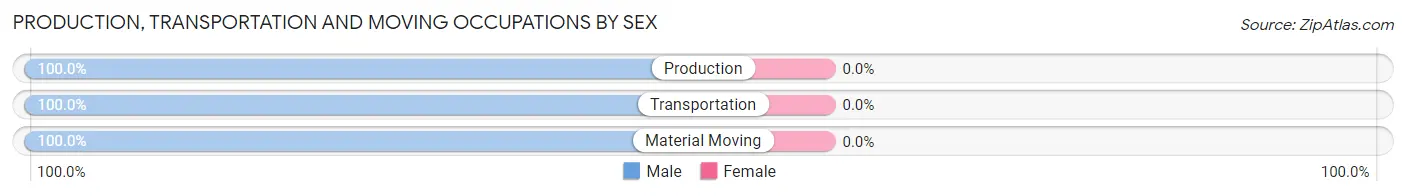
| Occupation | Male | Female |
| Production | 19 (100.0%) | 0 (0.0%) |
| Transportation | 15 (100.0%) | 0 (0.0%) |
| Material Moving | 8 (100.0%) | 0 (0.0%) |
| Total (Category) | 42 (100.0%) | 0 (0.0%) |
| Total (Overall) | 113 (48.5%) | 120 (51.5%) |
Employment Industries by Sex in Zanesville
Employment Industries in Zanesville
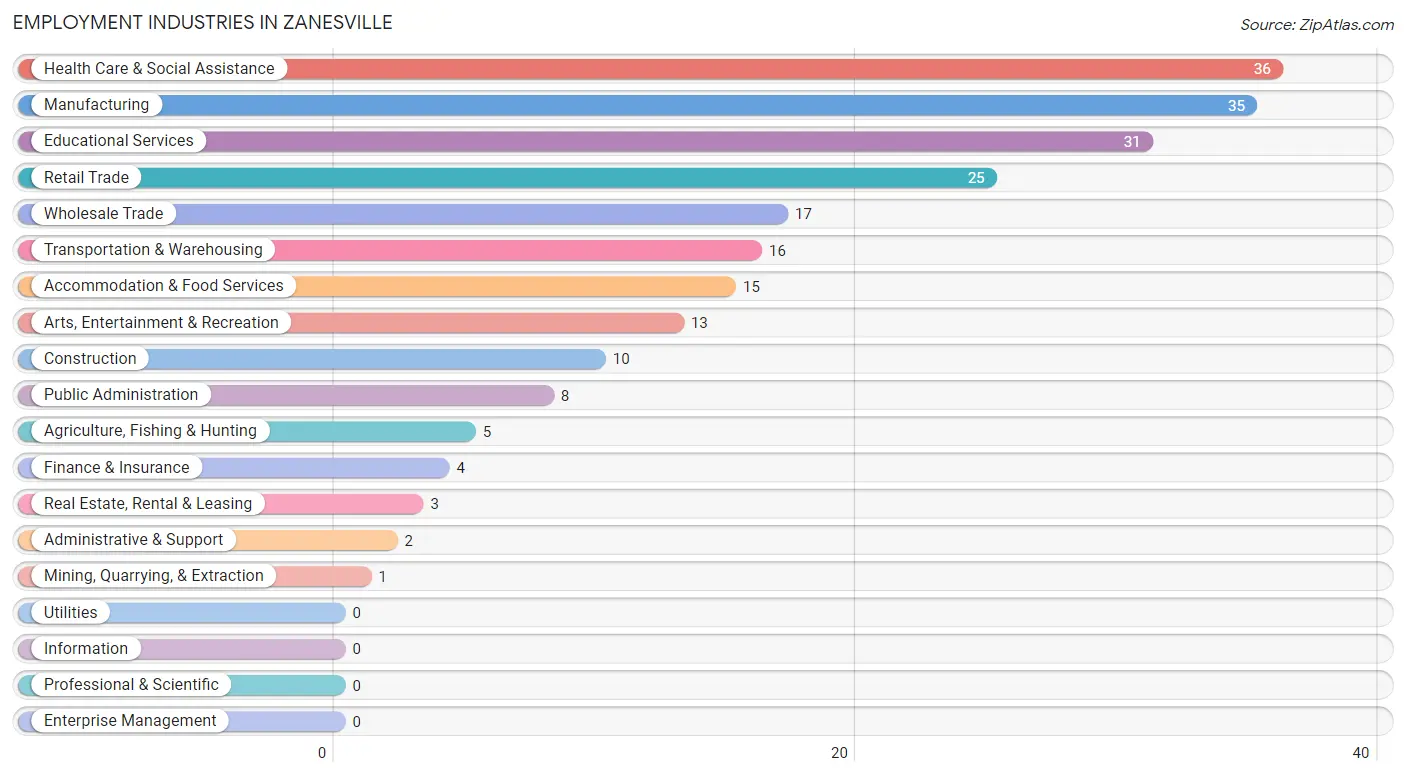
The major employment industries in Zanesville include Health Care & Social Assistance (36 | 15.4%), Manufacturing (35 | 15.0%), Educational Services (31 | 13.3%), Retail Trade (25 | 10.7%), and Wholesale Trade (17 | 7.3%).
Employment Industries by Sex in Zanesville
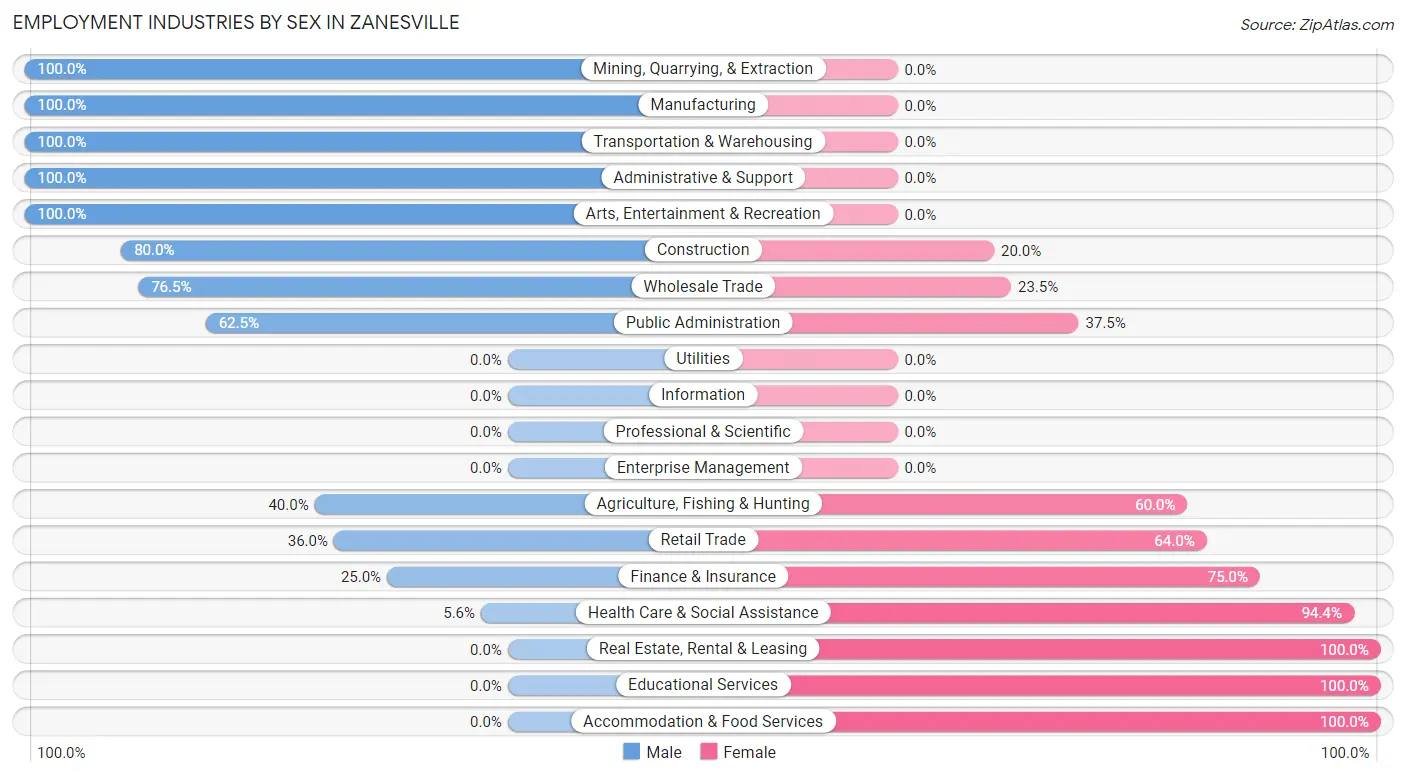
The Zanesville industries that see more men than women are Mining, Quarrying, & Extraction (100.0%), Manufacturing (100.0%), and Transportation & Warehousing (100.0%), whereas the industries that tend to have a higher number of women are Real Estate, Rental & Leasing (100.0%), Educational Services (100.0%), and Accommodation & Food Services (100.0%).
| Industry | Male | Female |
| Agriculture, Fishing & Hunting | 2 (40.0%) | 3 (60.0%) |
| Mining, Quarrying, & Extraction | 1 (100.0%) | 0 (0.0%) |
| Construction | 8 (80.0%) | 2 (20.0%) |
| Manufacturing | 35 (100.0%) | 0 (0.0%) |
| Wholesale Trade | 13 (76.5%) | 4 (23.5%) |
| Retail Trade | 9 (36.0%) | 16 (64.0%) |
| Transportation & Warehousing | 16 (100.0%) | 0 (0.0%) |
| Utilities | 0 (0.0%) | 0 (0.0%) |
| Information | 0 (0.0%) | 0 (0.0%) |
| Finance & Insurance | 1 (25.0%) | 3 (75.0%) |
| Real Estate, Rental & Leasing | 0 (0.0%) | 3 (100.0%) |
| Professional & Scientific | 0 (0.0%) | 0 (0.0%) |
| Enterprise Management | 0 (0.0%) | 0 (0.0%) |
| Administrative & Support | 2 (100.0%) | 0 (0.0%) |
| Educational Services | 0 (0.0%) | 31 (100.0%) |
| Health Care & Social Assistance | 2 (5.6%) | 34 (94.4%) |
| Arts, Entertainment & Recreation | 13 (100.0%) | 0 (0.0%) |
| Accommodation & Food Services | 0 (0.0%) | 15 (100.0%) |
| Public Administration | 5 (62.5%) | 3 (37.5%) |
| Total | 113 (48.5%) | 120 (51.5%) |
Education in Zanesville
School Enrollment in Zanesville
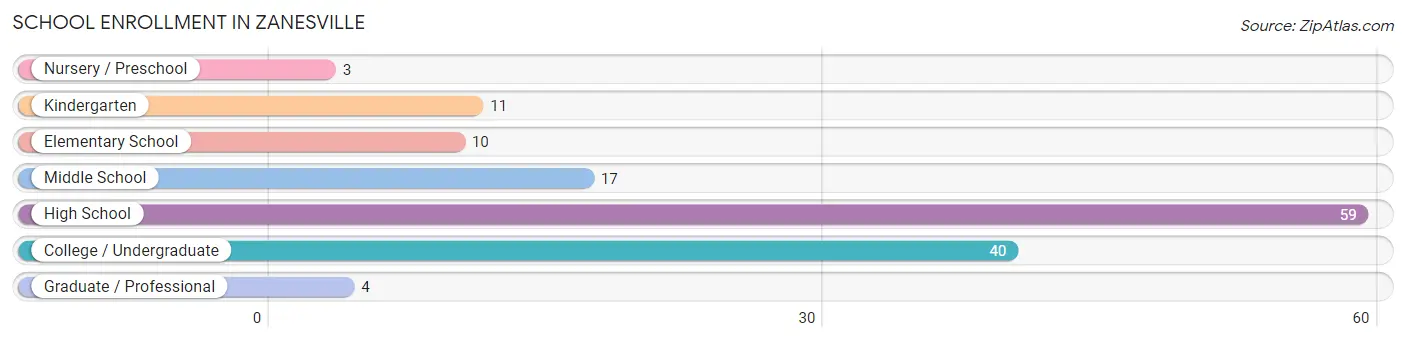
The most common levels of schooling among the 144 students in Zanesville are high school (59 | 41.0%), college / undergraduate (40 | 27.8%), and middle school (17 | 11.8%).
| School Level | # Students | % Students |
| Nursery / Preschool | 3 | 2.1% |
| Kindergarten | 11 | 7.6% |
| Elementary School | 10 | 6.9% |
| Middle School | 17 | 11.8% |
| High School | 59 | 41.0% |
| College / Undergraduate | 40 | 27.8% |
| Graduate / Professional | 4 | 2.8% |
| Total | 144 | 100.0% |
School Enrollment by Age by Funding Source in Zanesville
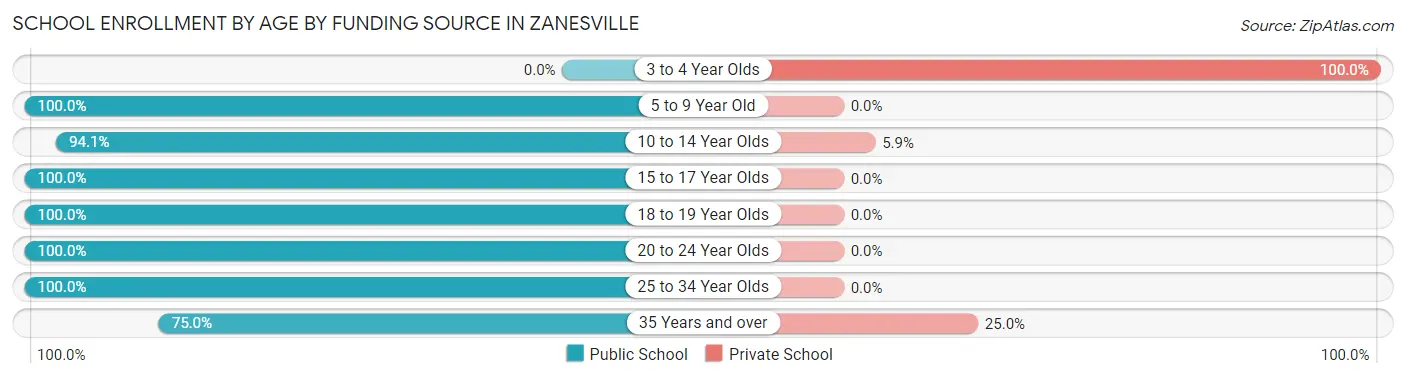
Out of a total of 144 students who are enrolled in schools in Zanesville, 6 (4.2%) attend a private institution, while the remaining 138 (95.8%) are enrolled in public schools. The age group of 3 to 4 year olds has the highest likelihood of being enrolled in private schools, with 3 (100.0% in the age bracket) enrolled. Conversely, the age group of 5 to 9 year old has the lowest likelihood of being enrolled in a private school, with 18 (100.0% in the age bracket) attending a public institution.
| Age Bracket | Public School | Private School |
| 3 to 4 Year Olds | 0 (0.0%) | 3 (100.0%) |
| 5 to 9 Year Old | 18 (100.0%) | 0 (0.0%) |
| 10 to 14 Year Olds | 32 (94.1%) | 2 (5.9%) |
| 15 to 17 Year Olds | 38 (100.0%) | 0 (0.0%) |
| 18 to 19 Year Olds | 25 (100.0%) | 0 (0.0%) |
| 20 to 24 Year Olds | 3 (100.0%) | 0 (0.0%) |
| 25 to 34 Year Olds | 19 (100.0%) | 0 (0.0%) |
| 35 Years and over | 3 (75.0%) | 1 (25.0%) |
| Total | 138 (95.8%) | 6 (4.2%) |
Educational Attainment by Field of Study in Zanesville
Education (28 | 34.6%), computers & mathematics (7 | 8.6%), arts & humanities (7 | 8.6%), psychology (6 | 7.4%), and science & technology (6 | 7.4%) are the most common fields of study among 81 individuals in Zanesville who have obtained a bachelor's degree or higher.
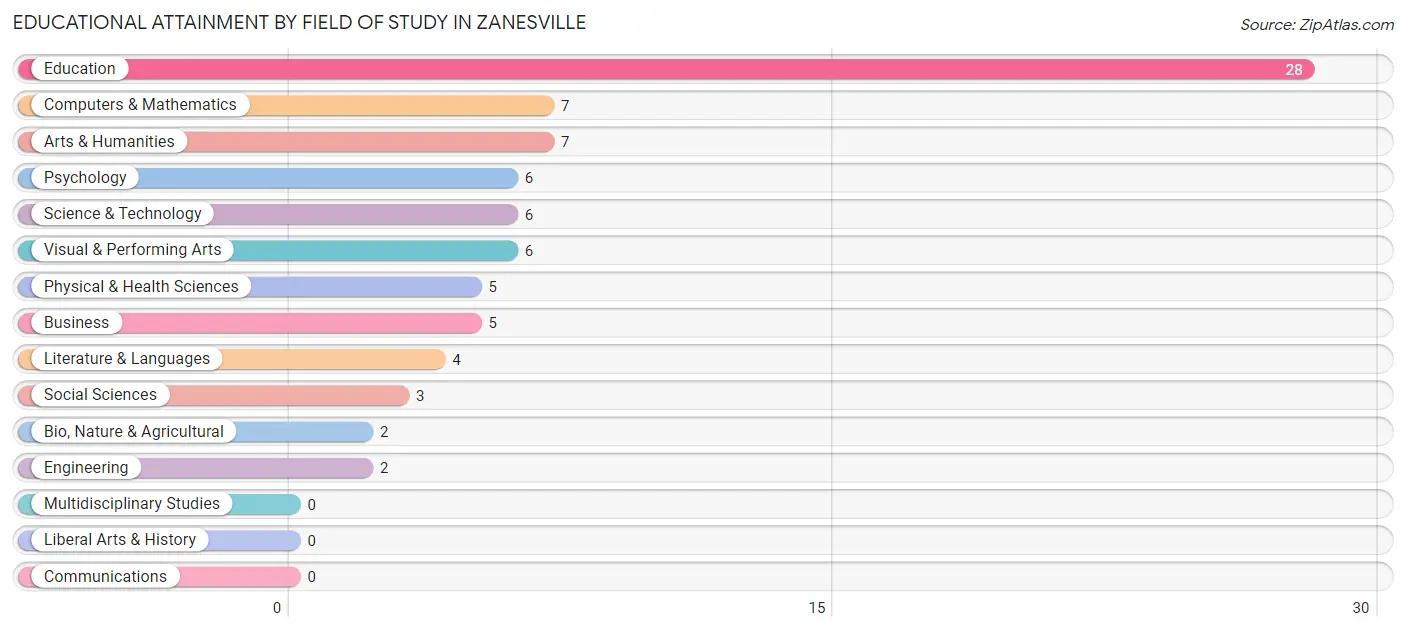
| Field of Study | # Graduates | % Graduates |
| Computers & Mathematics | 7 | 8.6% |
| Bio, Nature & Agricultural | 2 | 2.5% |
| Physical & Health Sciences | 5 | 6.2% |
| Psychology | 6 | 7.4% |
| Social Sciences | 3 | 3.7% |
| Engineering | 2 | 2.5% |
| Multidisciplinary Studies | 0 | 0.0% |
| Science & Technology | 6 | 7.4% |
| Business | 5 | 6.2% |
| Education | 28 | 34.6% |
| Literature & Languages | 4 | 4.9% |
| Liberal Arts & History | 0 | 0.0% |
| Visual & Performing Arts | 6 | 7.4% |
| Communications | 0 | 0.0% |
| Arts & Humanities | 7 | 8.6% |
| Total | 81 | 100.0% |
Transportation & Commute in Zanesville
Vehicle Availability by Sex in Zanesville
The most prevalent vehicle ownership categories in Zanesville are males with 2 vehicles (48, accounting for 42.9%) and females with 2 vehicles (53, making up 40.0%).
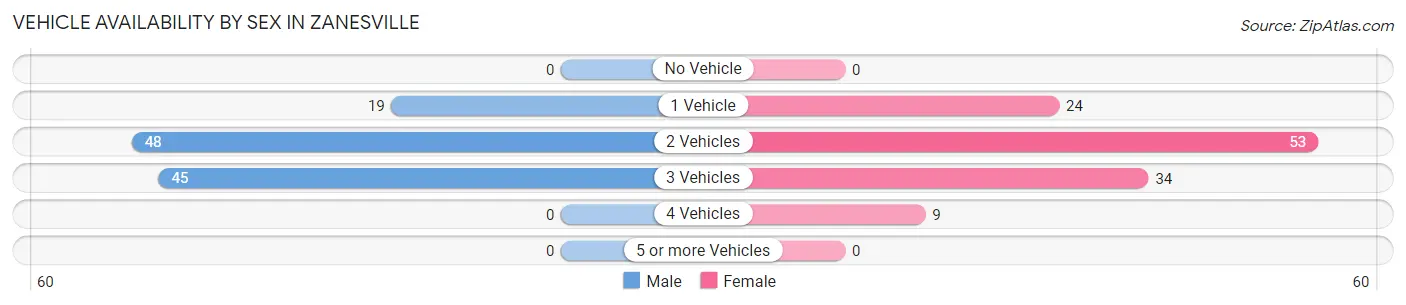
| Vehicles Available | Male | Female |
| No Vehicle | 0 (0.0%) | 0 (0.0%) |
| 1 Vehicle | 19 (17.0%) | 24 (20.0%) |
| 2 Vehicles | 48 (42.9%) | 53 (44.2%) |
| 3 Vehicles | 45 (40.2%) | 34 (28.3%) |
| 4 Vehicles | 0 (0.0%) | 9 (7.5%) |
| 5 or more Vehicles | 0 (0.0%) | 0 (0.0%) |
| Total | 112 (100.0%) | 120 (100.0%) |
Commute Time in Zanesville
The most frequently occuring commute durations in Zanesville are 15 to 19 minutes (64 commuters, 28.1%), 30 to 34 minutes (50 commuters, 21.9%), and 25 to 29 minutes (49 commuters, 21.5%).
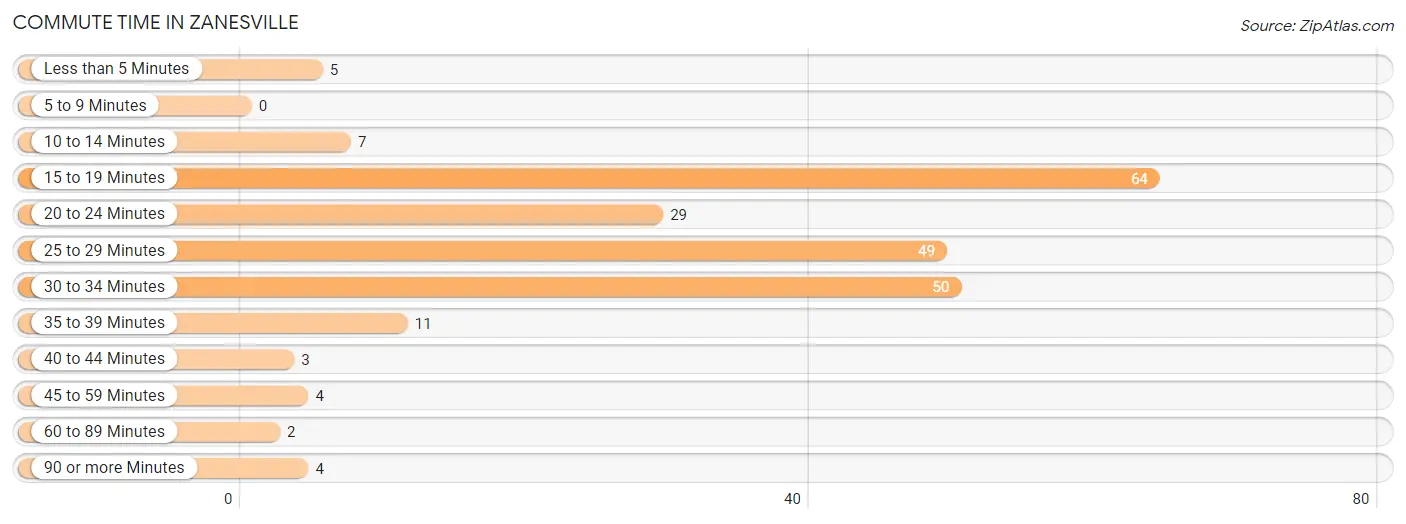
| Commute Time | # Commuters | % Commuters |
| Less than 5 Minutes | 5 | 2.2% |
| 5 to 9 Minutes | 0 | 0.0% |
| 10 to 14 Minutes | 7 | 3.1% |
| 15 to 19 Minutes | 64 | 28.1% |
| 20 to 24 Minutes | 29 | 12.7% |
| 25 to 29 Minutes | 49 | 21.5% |
| 30 to 34 Minutes | 50 | 21.9% |
| 35 to 39 Minutes | 11 | 4.8% |
| 40 to 44 Minutes | 3 | 1.3% |
| 45 to 59 Minutes | 4 | 1.8% |
| 60 to 89 Minutes | 2 | 0.9% |
| 90 or more Minutes | 4 | 1.8% |
Commute Time by Sex in Zanesville
The most common commute times in Zanesville are 30 to 34 minutes (42 commuters, 37.8%) for males and 25 to 29 minutes (40 commuters, 34.2%) for females.
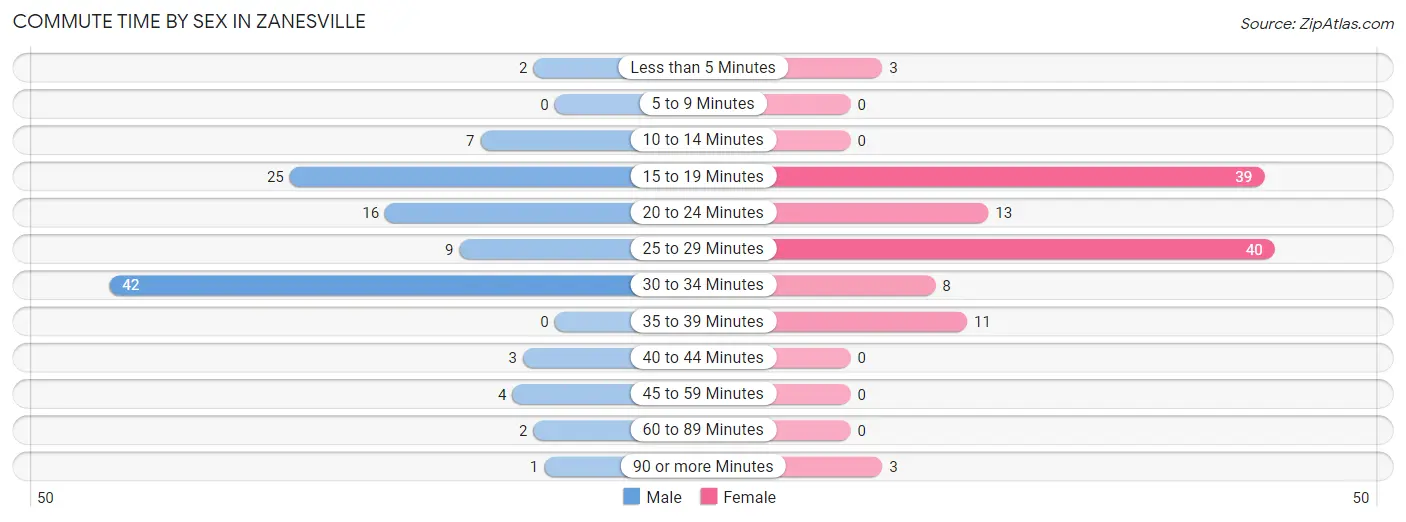
| Commute Time | Male | Female |
| Less than 5 Minutes | 2 (1.8%) | 3 (2.6%) |
| 5 to 9 Minutes | 0 (0.0%) | 0 (0.0%) |
| 10 to 14 Minutes | 7 (6.3%) | 0 (0.0%) |
| 15 to 19 Minutes | 25 (22.5%) | 39 (33.3%) |
| 20 to 24 Minutes | 16 (14.4%) | 13 (11.1%) |
| 25 to 29 Minutes | 9 (8.1%) | 40 (34.2%) |
| 30 to 34 Minutes | 42 (37.8%) | 8 (6.8%) |
| 35 to 39 Minutes | 0 (0.0%) | 11 (9.4%) |
| 40 to 44 Minutes | 3 (2.7%) | 0 (0.0%) |
| 45 to 59 Minutes | 4 (3.6%) | 0 (0.0%) |
| 60 to 89 Minutes | 2 (1.8%) | 0 (0.0%) |
| 90 or more Minutes | 1 (0.9%) | 3 (2.6%) |
Time of Departure to Work by Sex in Zanesville
The most frequent times of departure to work in Zanesville are 7:00 AM to 7:29 AM (22, 19.8%) for males and 8:00 AM to 8:29 AM (21, 17.9%) for females.
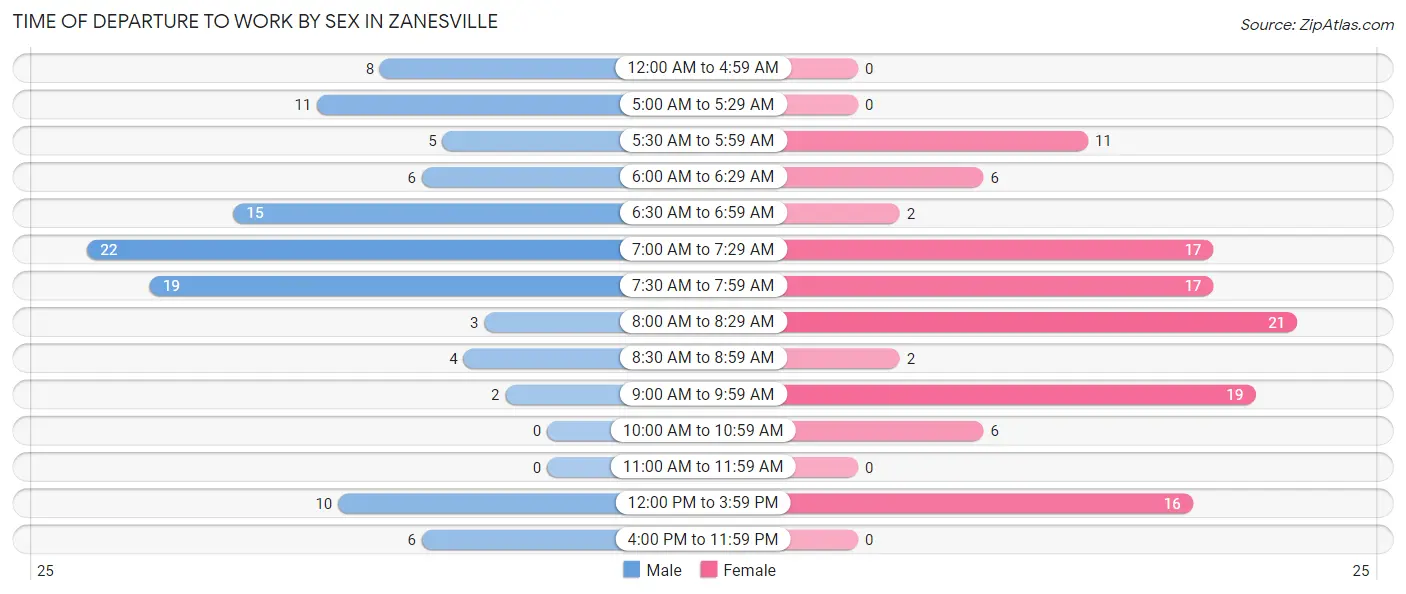
| Time of Departure | Male | Female |
| 12:00 AM to 4:59 AM | 8 (7.2%) | 0 (0.0%) |
| 5:00 AM to 5:29 AM | 11 (9.9%) | 0 (0.0%) |
| 5:30 AM to 5:59 AM | 5 (4.5%) | 11 (9.4%) |
| 6:00 AM to 6:29 AM | 6 (5.4%) | 6 (5.1%) |
| 6:30 AM to 6:59 AM | 15 (13.5%) | 2 (1.7%) |
| 7:00 AM to 7:29 AM | 22 (19.8%) | 17 (14.5%) |
| 7:30 AM to 7:59 AM | 19 (17.1%) | 17 (14.5%) |
| 8:00 AM to 8:29 AM | 3 (2.7%) | 21 (17.9%) |
| 8:30 AM to 8:59 AM | 4 (3.6%) | 2 (1.7%) |
| 9:00 AM to 9:59 AM | 2 (1.8%) | 19 (16.2%) |
| 10:00 AM to 10:59 AM | 0 (0.0%) | 6 (5.1%) |
| 11:00 AM to 11:59 AM | 0 (0.0%) | 0 (0.0%) |
| 12:00 PM to 3:59 PM | 10 (9.0%) | 16 (13.7%) |
| 4:00 PM to 11:59 PM | 6 (5.4%) | 0 (0.0%) |
| Total | 111 (100.0%) | 117 (100.0%) |
Housing Occupancy in Zanesville
Occupancy by Ownership in Zanesville
Of the total 232 dwellings in Zanesville, owner-occupied units account for 183 (78.9%), while renter-occupied units make up 49 (21.1%).
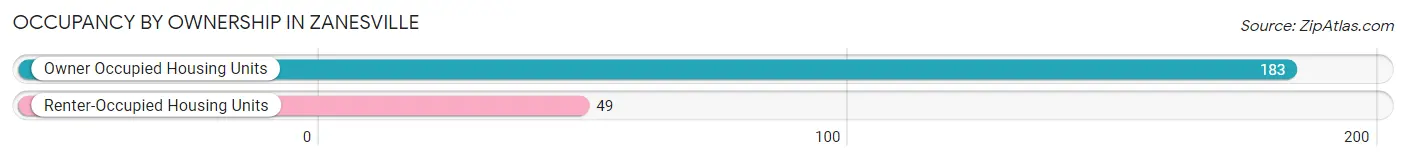
| Occupancy | # Housing Units | % Housing Units |
| Owner Occupied Housing Units | 183 | 78.9% |
| Renter-Occupied Housing Units | 49 | 21.1% |
| Total Occupied Housing Units | 232 | 100.0% |
Occupancy by Household Size in Zanesville
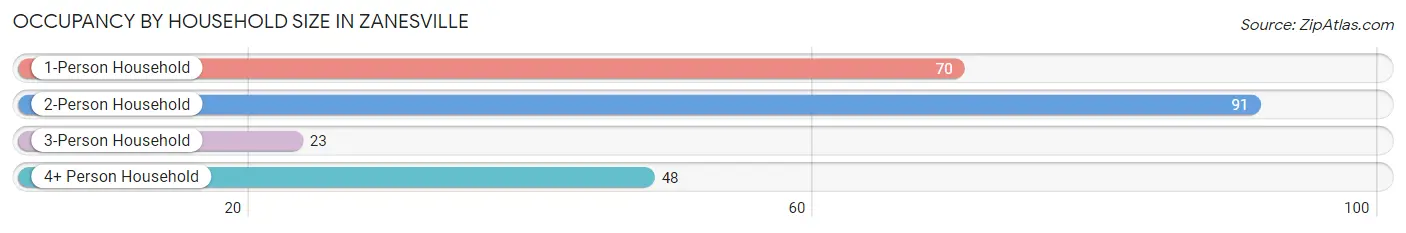
| Household Size | # Housing Units | % Housing Units |
| 1-Person Household | 70 | 30.2% |
| 2-Person Household | 91 | 39.2% |
| 3-Person Household | 23 | 9.9% |
| 4+ Person Household | 48 | 20.7% |
| Total Housing Units | 232 | 100.0% |
Occupancy by Ownership by Household Size in Zanesville
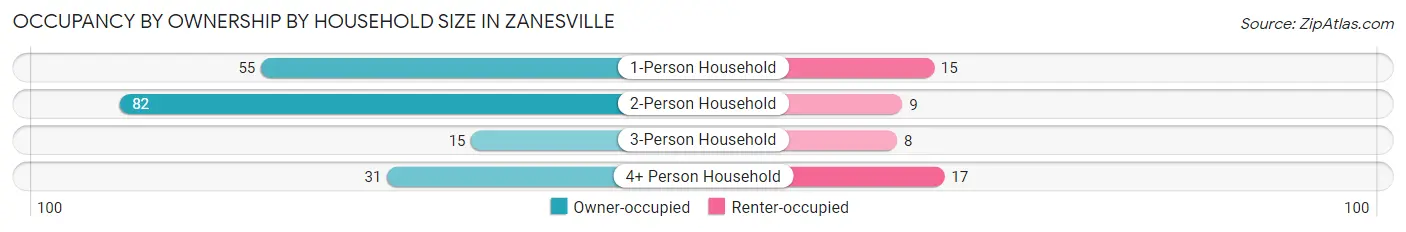
| Household Size | Owner-occupied | Renter-occupied |
| 1-Person Household | 55 (78.6%) | 15 (21.4%) |
| 2-Person Household | 82 (90.1%) | 9 (9.9%) |
| 3-Person Household | 15 (65.2%) | 8 (34.8%) |
| 4+ Person Household | 31 (64.6%) | 17 (35.4%) |
| Total Housing Units | 183 (78.9%) | 49 (21.1%) |
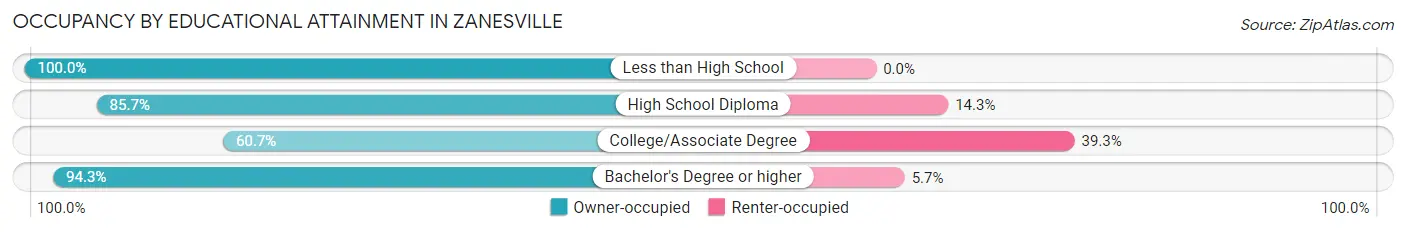
Occupancy by Educational Attainment in Zanesville
| Household Size | Owner-occupied | Renter-occupied |
| Less than High School | 13 (100.0%) | 0 (0.0%) |
| High School Diploma | 66 (85.7%) | 11 (14.3%) |
| College/Associate Degree | 54 (60.7%) | 35 (39.3%) |
| Bachelor's Degree or higher | 50 (94.3%) | 3 (5.7%) |
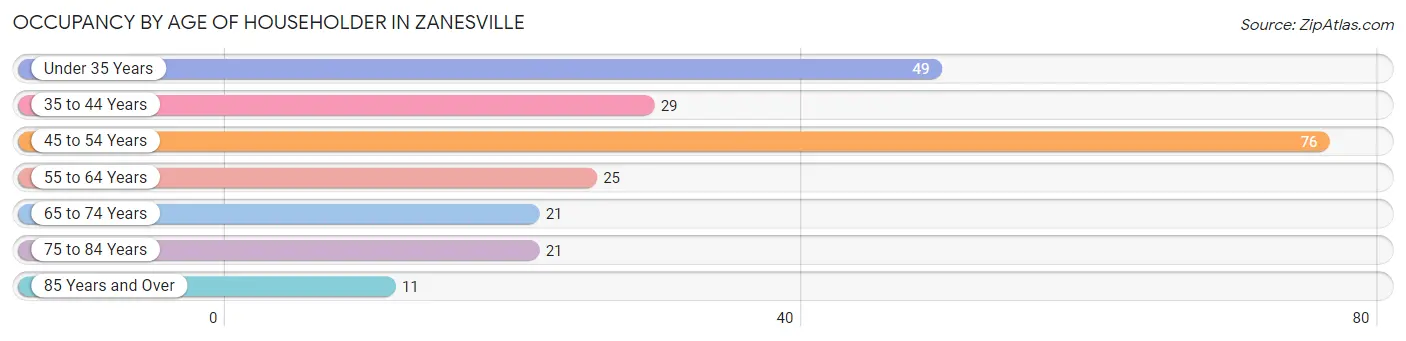
Occupancy by Age of Householder in Zanesville
| Age Bracket | # Households | % Households |
| Under 35 Years | 49 | 21.1% |
| 35 to 44 Years | 29 | 12.5% |
| 45 to 54 Years | 76 | 32.8% |
| 55 to 64 Years | 25 | 10.8% |
| 65 to 74 Years | 21 | 9.0% |
| 75 to 84 Years | 21 | 9.0% |
| 85 Years and Over | 11 | 4.7% |
| Total | 232 | 100.0% |
Housing Finances in Zanesville
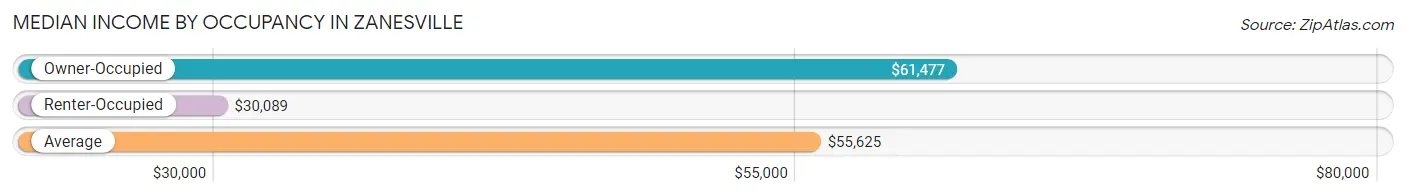
Median Income by Occupancy in Zanesville
| Occupancy Type | # Households | Median Income |
| Owner-Occupied | 183 (78.9%) | $61,477 |
| Renter-Occupied | 49 (21.1%) | $30,089 |
| Average | 232 (100.0%) | $55,625 |
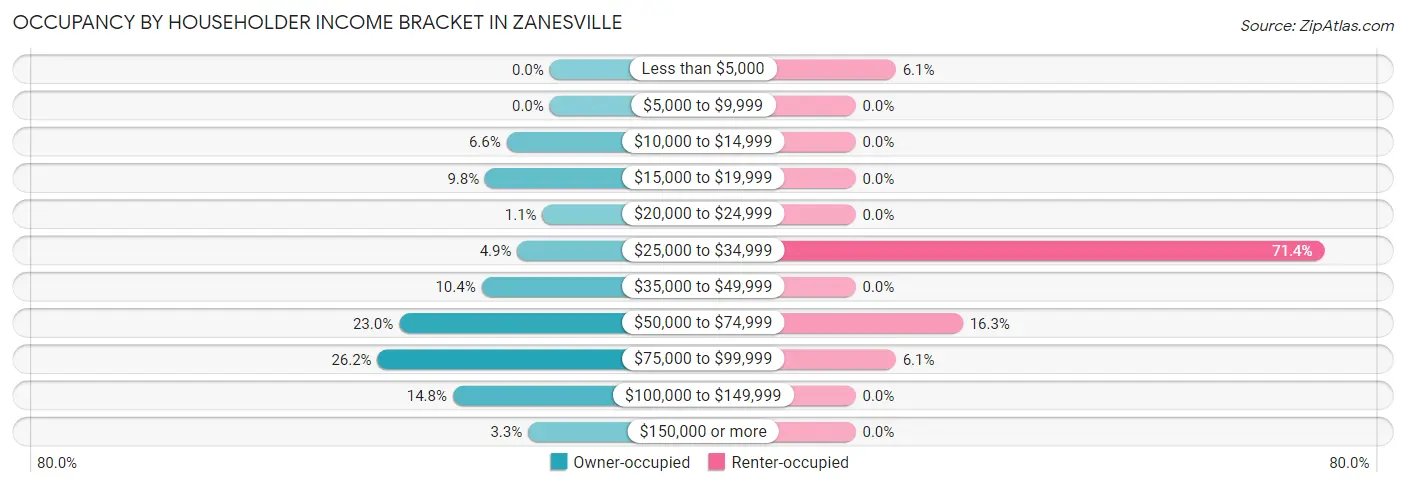
Occupancy by Householder Income Bracket in Zanesville
| Income Bracket | Owner-occupied | Renter-occupied |
| Less than $5,000 | 0 (0.0%) | 3 (6.1%) |
| $5,000 to $9,999 | 0 (0.0%) | 0 (0.0%) |
| $10,000 to $14,999 | 12 (6.6%) | 0 (0.0%) |
| $15,000 to $19,999 | 18 (9.8%) | 0 (0.0%) |
| $20,000 to $24,999 | 2 (1.1%) | 0 (0.0%) |
| $25,000 to $34,999 | 9 (4.9%) | 35 (71.4%) |
| $35,000 to $49,999 | 19 (10.4%) | 0 (0.0%) |
| $50,000 to $74,999 | 42 (23.0%) | 8 (16.3%) |
| $75,000 to $99,999 | 48 (26.2%) | 3 (6.1%) |
| $100,000 to $149,999 | 27 (14.7%) | 0 (0.0%) |
| $150,000 or more | 6 (3.3%) | 0 (0.0%) |
| Total | 183 (100.0%) | 49 (100.0%) |
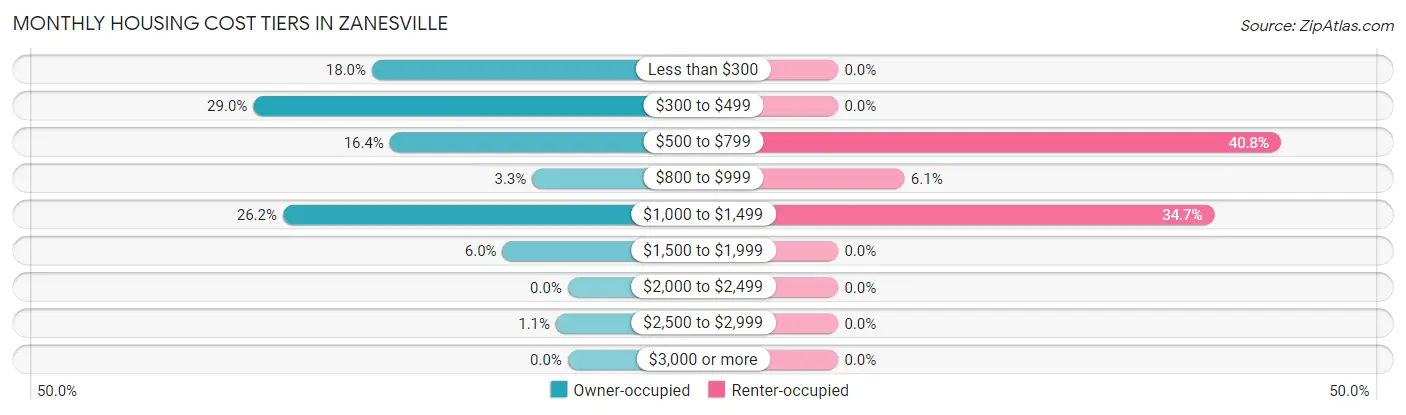
Monthly Housing Cost Tiers in Zanesville
| Monthly Cost | Owner-occupied | Renter-occupied |
| Less than $300 | 33 (18.0%) | 0 (0.0%) |
| $300 to $499 | 53 (29.0%) | 0 (0.0%) |
| $500 to $799 | 30 (16.4%) | 20 (40.8%) |
| $800 to $999 | 6 (3.3%) | 3 (6.1%) |
| $1,000 to $1,499 | 48 (26.2%) | 17 (34.7%) |
| $1,500 to $1,999 | 11 (6.0%) | 0 (0.0%) |
| $2,000 to $2,499 | 0 (0.0%) | 0 (0.0%) |
| $2,500 to $2,999 | 2 (1.1%) | 0 (0.0%) |
| $3,000 or more | 0 (0.0%) | 0 (0.0%) |
| Total | 183 (100.0%) | 49 (100.0%) |
Physical Housing Characteristics in Zanesville
Housing Structures in Zanesville
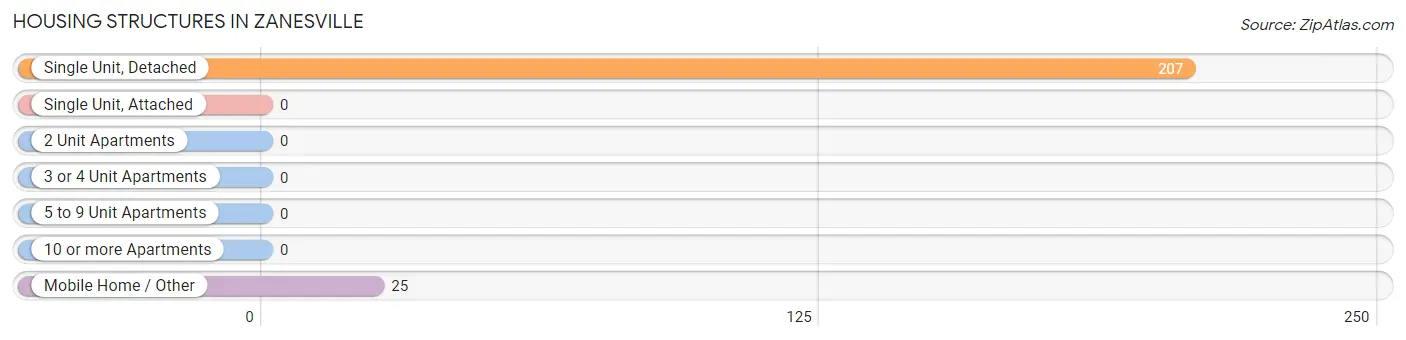
| Structure Type | # Housing Units | % Housing Units |
| Single Unit, Detached | 207 | 89.2% |
| Single Unit, Attached | 0 | 0.0% |
| 2 Unit Apartments | 0 | 0.0% |
| 3 or 4 Unit Apartments | 0 | 0.0% |
| 5 to 9 Unit Apartments | 0 | 0.0% |
| 10 or more Apartments | 0 | 0.0% |
| Mobile Home / Other | 25 | 10.8% |
| Total | 232 | 100.0% |
Housing Structures by Occupancy in Zanesville
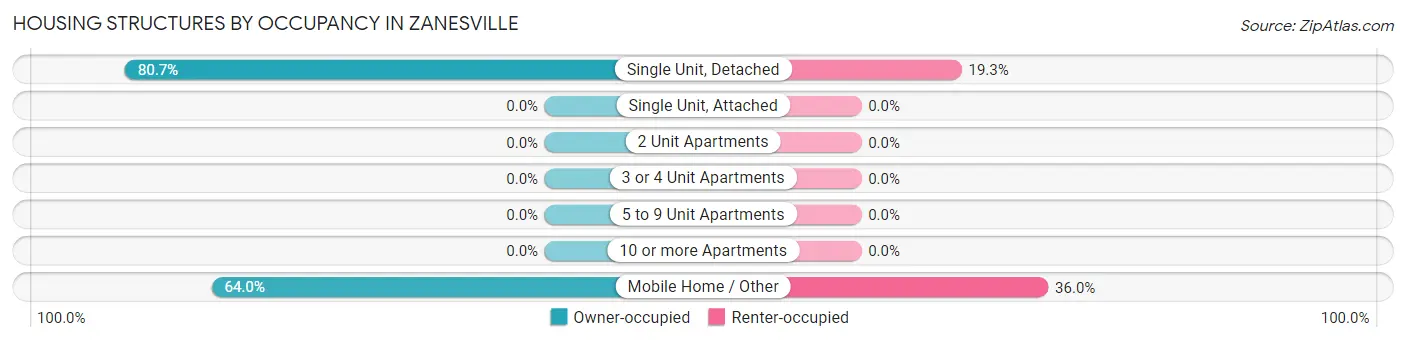
| Structure Type | Owner-occupied | Renter-occupied |
| Single Unit, Detached | 167 (80.7%) | 40 (19.3%) |
| Single Unit, Attached | 0 (0.0%) | 0 (0.0%) |
| 2 Unit Apartments | 0 (0.0%) | 0 (0.0%) |
| 3 or 4 Unit Apartments | 0 (0.0%) | 0 (0.0%) |
| 5 to 9 Unit Apartments | 0 (0.0%) | 0 (0.0%) |
| 10 or more Apartments | 0 (0.0%) | 0 (0.0%) |
| Mobile Home / Other | 16 (64.0%) | 9 (36.0%) |
| Total | 183 (78.9%) | 49 (21.1%) |
Housing Structures by Number of Rooms in Zanesville
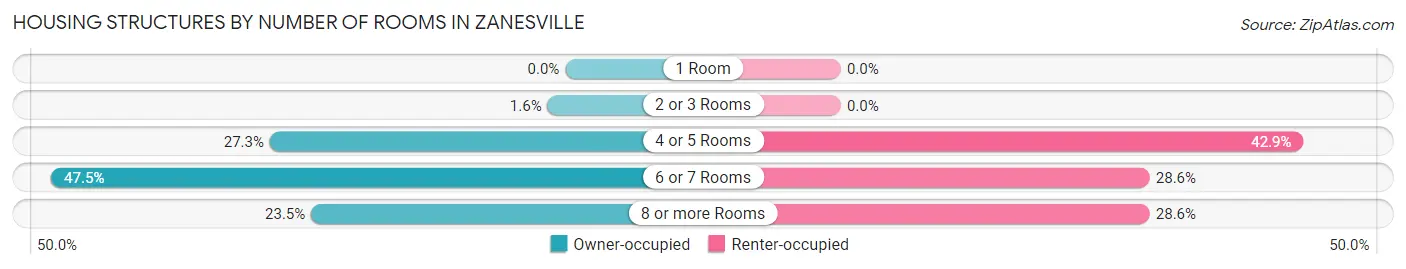
| Number of Rooms | Owner-occupied | Renter-occupied |
| 1 Room | 0 (0.0%) | 0 (0.0%) |
| 2 or 3 Rooms | 3 (1.6%) | 0 (0.0%) |
| 4 or 5 Rooms | 50 (27.3%) | 21 (42.9%) |
| 6 or 7 Rooms | 87 (47.5%) | 14 (28.6%) |
| 8 or more Rooms | 43 (23.5%) | 14 (28.6%) |
| Total | 183 (100.0%) | 49 (100.0%) |
Housing Structure by Heating Type in Zanesville
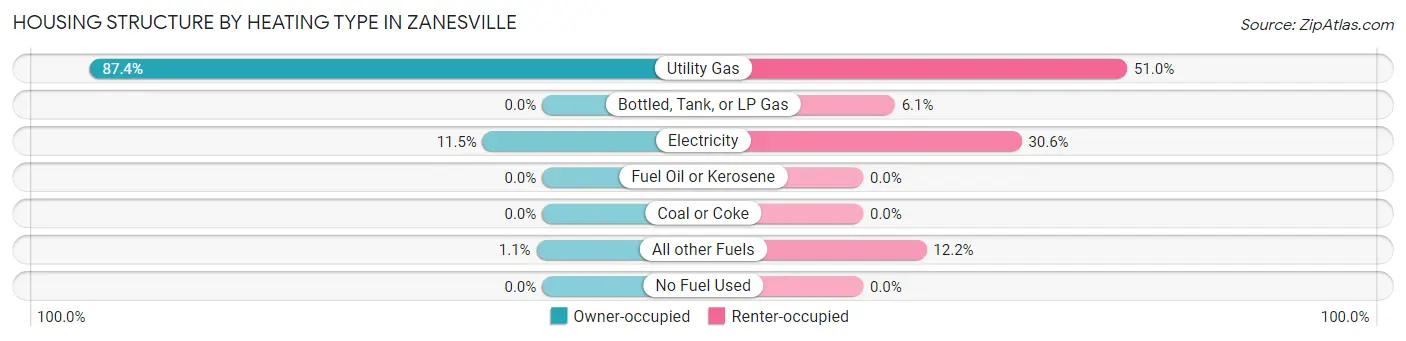
| Heating Type | Owner-occupied | Renter-occupied |
| Utility Gas | 160 (87.4%) | 25 (51.0%) |
| Bottled, Tank, or LP Gas | 0 (0.0%) | 3 (6.1%) |
| Electricity | 21 (11.5%) | 15 (30.6%) |
| Fuel Oil or Kerosene | 0 (0.0%) | 0 (0.0%) |
| Coal or Coke | 0 (0.0%) | 0 (0.0%) |
| All other Fuels | 2 (1.1%) | 6 (12.2%) |
| No Fuel Used | 0 (0.0%) | 0 (0.0%) |
| Total | 183 (100.0%) | 49 (100.0%) |
Household Vehicle Usage in Zanesville
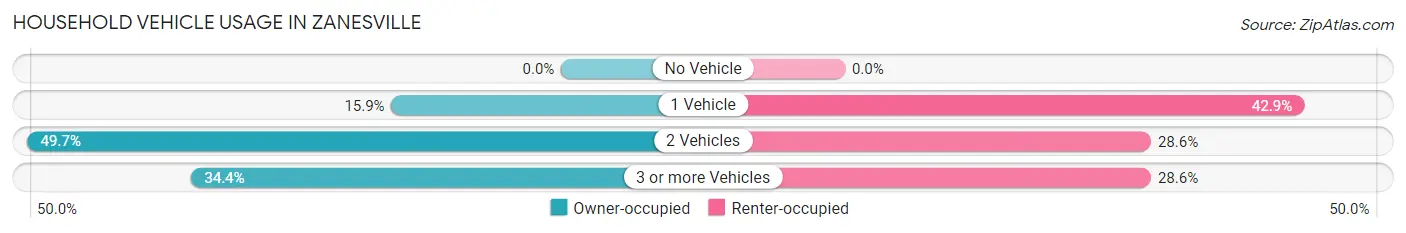
| Vehicles per Household | Owner-occupied | Renter-occupied |
| No Vehicle | 0 (0.0%) | 0 (0.0%) |
| 1 Vehicle | 29 (15.9%) | 21 (42.9%) |
| 2 Vehicles | 91 (49.7%) | 14 (28.6%) |
| 3 or more Vehicles | 63 (34.4%) | 14 (28.6%) |
| Total | 183 (100.0%) | 49 (100.0%) |
Real Estate & Mortgages in Zanesville
Real Estate and Mortgage Overview in Zanesville
| Characteristic | Without Mortgage | With Mortgage |
| Housing Units | 94 | 89 |
| Median Property Value | $104,500 | $148,000 |
| Median Household Income | $37,500 | $4 |
| Monthly Housing Costs | $358 | $0 |
| Real Estate Taxes | $268 | $0 |
Property Value by Mortgage Status in Zanesville
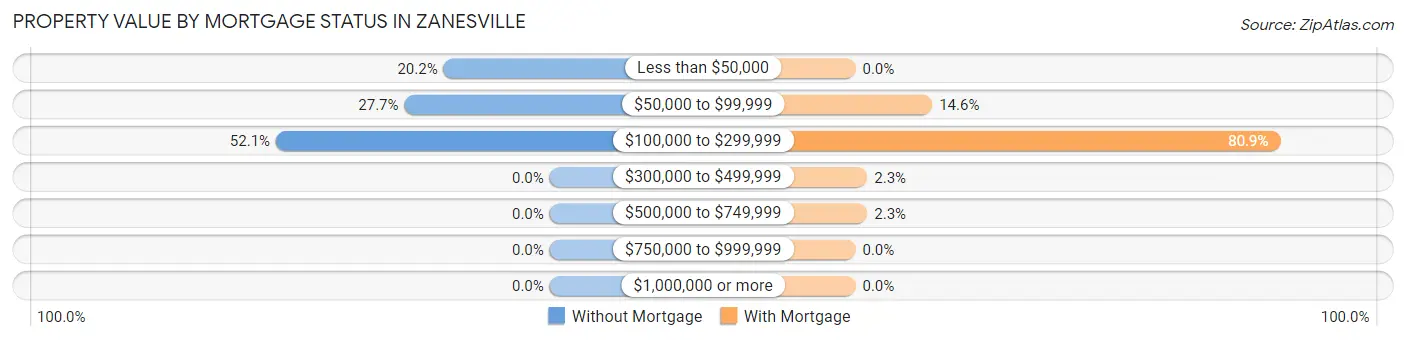
| Property Value | Without Mortgage | With Mortgage |
| Less than $50,000 | 19 (20.2%) | 0 (0.0%) |
| $50,000 to $99,999 | 26 (27.7%) | 13 (14.6%) |
| $100,000 to $299,999 | 49 (52.1%) | 72 (80.9%) |
| $300,000 to $499,999 | 0 (0.0%) | 2 (2.2%) |
| $500,000 to $749,999 | 0 (0.0%) | 2 (2.2%) |
| $750,000 to $999,999 | 0 (0.0%) | 0 (0.0%) |
| $1,000,000 or more | 0 (0.0%) | 0 (0.0%) |
| Total | 94 (100.0%) | 89 (100.0%) |
Household Income by Mortgage Status in Zanesville
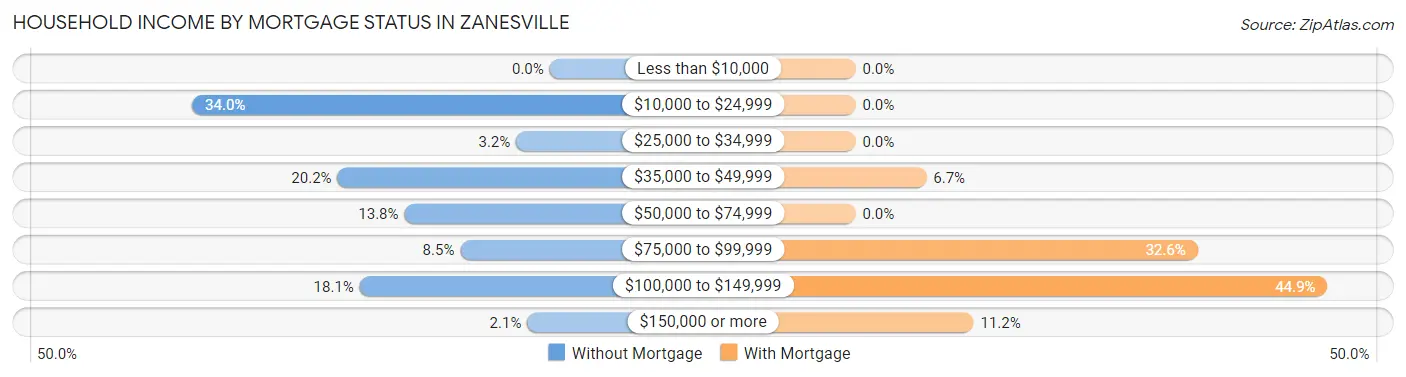
| Household Income | Without Mortgage | With Mortgage |
| Less than $10,000 | 0 (0.0%) | 0 (0.0%) |
| $10,000 to $24,999 | 32 (34.0%) | 0 (0.0%) |
| $25,000 to $34,999 | 3 (3.2%) | 0 (0.0%) |
| $35,000 to $49,999 | 19 (20.2%) | 6 (6.7%) |
| $50,000 to $74,999 | 13 (13.8%) | 0 (0.0%) |
| $75,000 to $99,999 | 8 (8.5%) | 29 (32.6%) |
| $100,000 to $149,999 | 17 (18.1%) | 40 (44.9%) |
| $150,000 or more | 2 (2.1%) | 10 (11.2%) |
| Total | 94 (100.0%) | 89 (100.0%) |
Property Value to Household Income Ratio in Zanesville
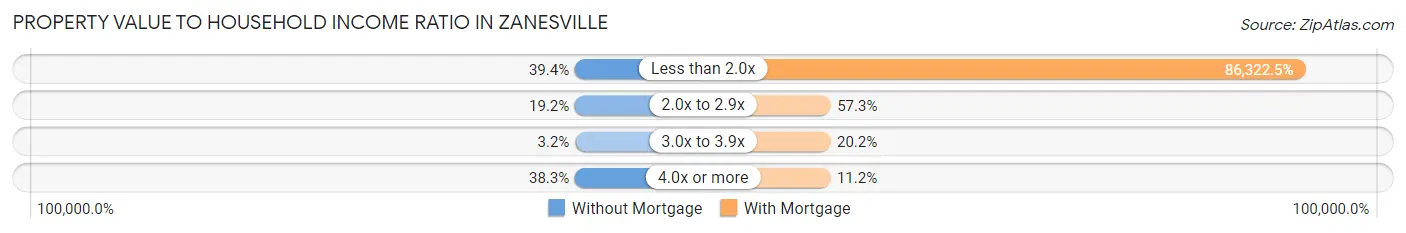
| Value-to-Income Ratio | Without Mortgage | With Mortgage |
| Less than 2.0x | 37 (39.4%) | 76,827 (86,322.5%) |
| 2.0x to 2.9x | 18 (19.2%) | 51 (57.3%) |
| 3.0x to 3.9x | 3 (3.2%) | 18 (20.2%) |
| 4.0x or more | 36 (38.3%) | 10 (11.2%) |
| Total | 94 (100.0%) | 89 (100.0%) |
Real Estate Taxes by Mortgage Status in Zanesville
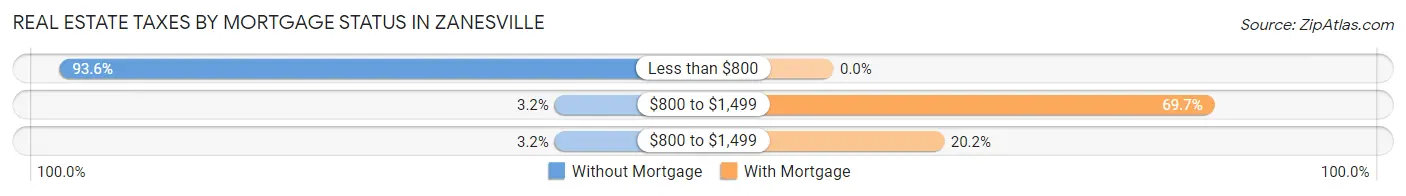
| Property Taxes | Without Mortgage | With Mortgage |
| Less than $800 | 88 (93.6%) | 0 (0.0%) |
| $800 to $1,499 | 3 (3.2%) | 62 (69.7%) |
| $800 to $1,499 | 3 (3.2%) | 18 (20.2%) |
| Total | 94 (100.0%) | 89 (100.0%) |
Health & Disability in Zanesville
Health Insurance Coverage by Age in Zanesville
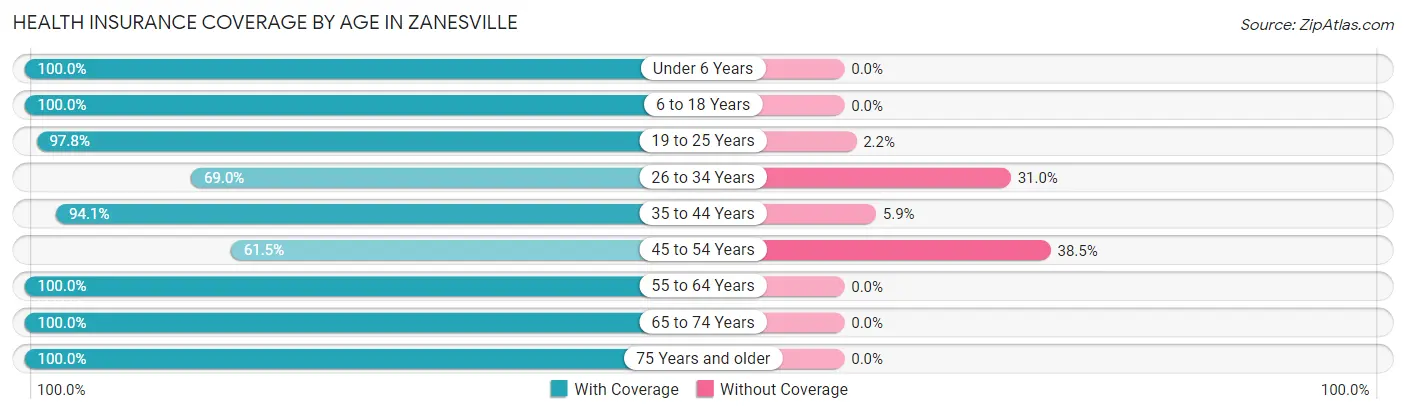
| Age Bracket | With Coverage | Without Coverage |
| Under 6 Years | 38 (100.0%) | 0 (0.0%) |
| 6 to 18 Years | 95 (100.0%) | 0 (0.0%) |
| 19 to 25 Years | 44 (97.8%) | 1 (2.2%) |
| 26 to 34 Years | 40 (69.0%) | 18 (31.0%) |
| 35 to 44 Years | 48 (94.1%) | 3 (5.9%) |
| 45 to 54 Years | 56 (61.5%) | 35 (38.5%) |
| 55 to 64 Years | 39 (100.0%) | 0 (0.0%) |
| 65 to 74 Years | 32 (100.0%) | 0 (0.0%) |
| 75 Years and older | 81 (100.0%) | 0 (0.0%) |
| Total | 473 (89.2%) | 57 (10.7%) |
Health Insurance Coverage by Citizenship Status in Zanesville

| Citizenship Status | With Coverage | Without Coverage |
| Native Born | 38 (100.0%) | 0 (0.0%) |
| Foreign Born, Citizen | 95 (100.0%) | 0 (0.0%) |
| Foreign Born, not a Citizen | 44 (97.8%) | 1 (2.2%) |
Health Insurance Coverage by Household Income in Zanesville
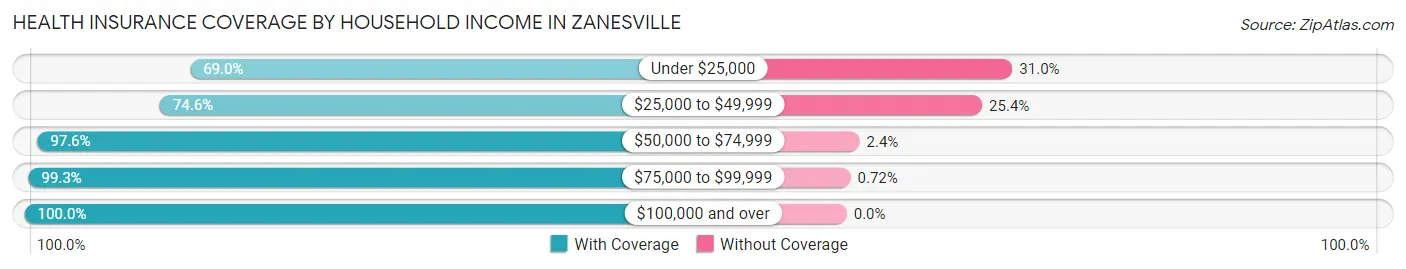
| Household Income | With Coverage | Without Coverage |
| Under $25,000 | 40 (69.0%) | 18 (31.0%) |
| $25,000 to $49,999 | 103 (74.6%) | 35 (25.4%) |
| $50,000 to $74,999 | 122 (97.6%) | 3 (2.4%) |
| $75,000 to $99,999 | 138 (99.3%) | 1 (0.7%) |
| $100,000 and over | 70 (100.0%) | 0 (0.0%) |
Public vs Private Health Insurance Coverage by Age in Zanesville
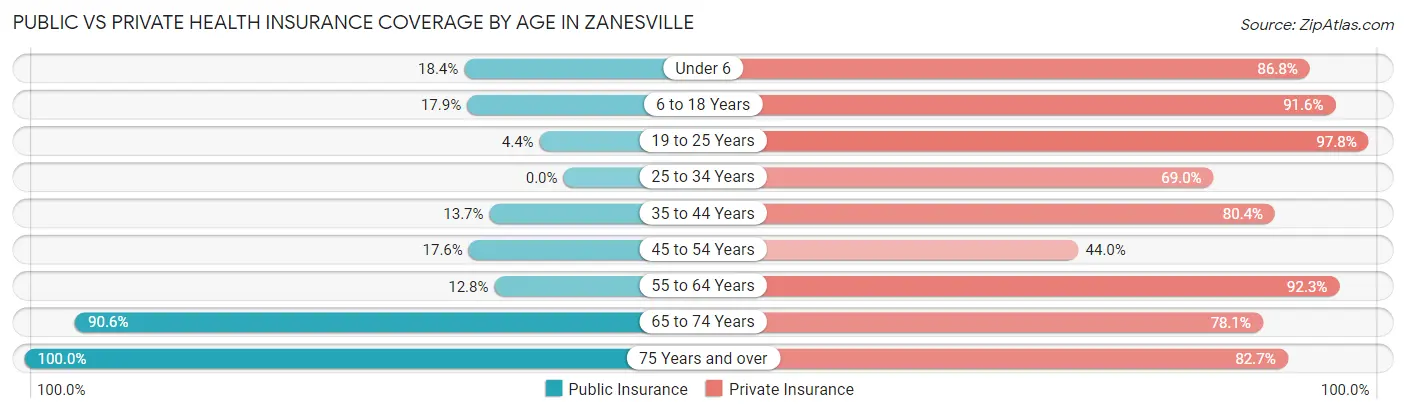
| Age Bracket | Public Insurance | Private Insurance |
| Under 6 | 7 (18.4%) | 33 (86.8%) |
| 6 to 18 Years | 17 (17.9%) | 87 (91.6%) |
| 19 to 25 Years | 2 (4.4%) | 44 (97.8%) |
| 25 to 34 Years | 0 (0.0%) | 40 (69.0%) |
| 35 to 44 Years | 7 (13.7%) | 41 (80.4%) |
| 45 to 54 Years | 16 (17.6%) | 40 (44.0%) |
| 55 to 64 Years | 5 (12.8%) | 36 (92.3%) |
| 65 to 74 Years | 29 (90.6%) | 25 (78.1%) |
| 75 Years and over | 81 (100.0%) | 67 (82.7%) |
| Total | 164 (30.9%) | 413 (77.9%) |
Disability Status by Sex by Age in Zanesville
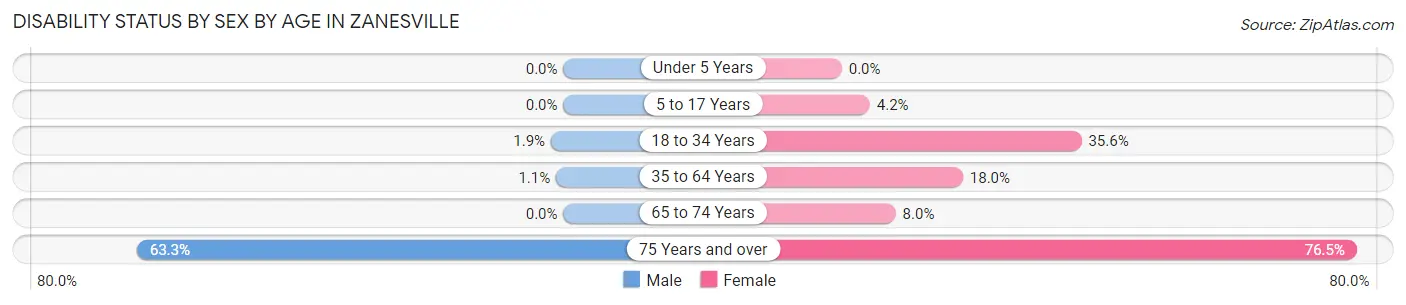
| Age Bracket | Male | Female |
| Under 5 Years | 0 (0.0%) | 0 (0.0%) |
| 5 to 17 Years | 0 (0.0%) | 2 (4.2%) |
| 18 to 34 Years | 1 (1.8%) | 21 (35.6%) |
| 35 to 64 Years | 1 (1.1%) | 16 (18.0%) |
| 65 to 74 Years | 0 (0.0%) | 2 (8.0%) |
| 75 Years and over | 19 (63.3%) | 39 (76.5%) |
Disability Class by Sex by Age in Zanesville
Disability Class: Hearing Difficulty
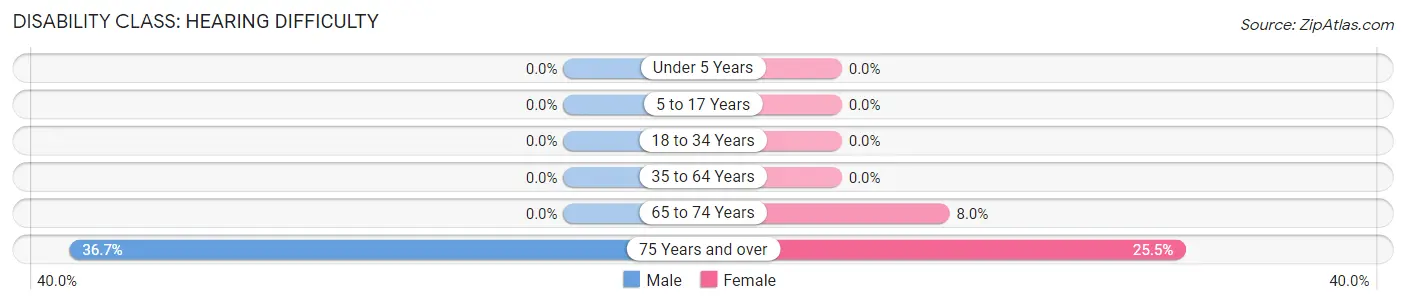
| Age Bracket | Male | Female |
| Under 5 Years | 0 (0.0%) | 0 (0.0%) |
| 5 to 17 Years | 0 (0.0%) | 0 (0.0%) |
| 18 to 34 Years | 0 (0.0%) | 0 (0.0%) |
| 35 to 64 Years | 0 (0.0%) | 0 (0.0%) |
| 65 to 74 Years | 0 (0.0%) | 2 (8.0%) |
| 75 Years and over | 11 (36.7%) | 13 (25.5%) |
Disability Class: Vision Difficulty
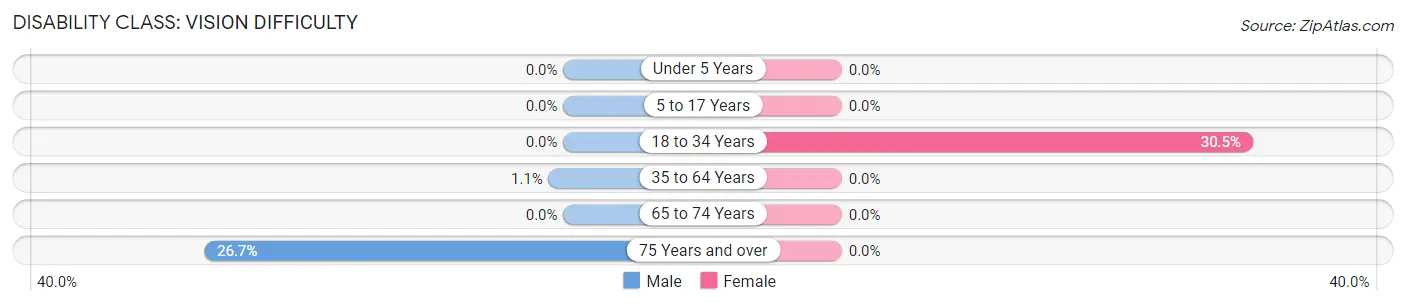
| Age Bracket | Male | Female |
| Under 5 Years | 0 (0.0%) | 0 (0.0%) |
| 5 to 17 Years | 0 (0.0%) | 0 (0.0%) |
| 18 to 34 Years | 0 (0.0%) | 18 (30.5%) |
| 35 to 64 Years | 1 (1.1%) | 0 (0.0%) |
| 65 to 74 Years | 0 (0.0%) | 0 (0.0%) |
| 75 Years and over | 8 (26.7%) | 0 (0.0%) |
Disability Class: Cognitive Difficulty
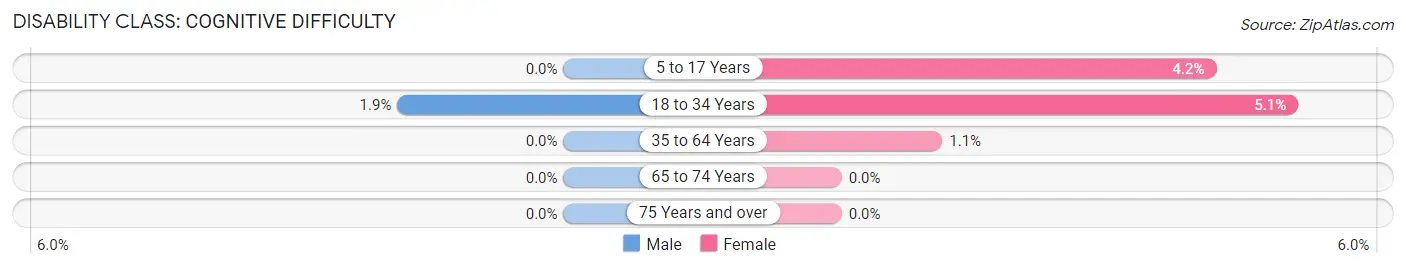
| Age Bracket | Male | Female |
| 5 to 17 Years | 0 (0.0%) | 2 (4.2%) |
| 18 to 34 Years | 1 (1.8%) | 3 (5.1%) |
| 35 to 64 Years | 0 (0.0%) | 1 (1.1%) |
| 65 to 74 Years | 0 (0.0%) | 0 (0.0%) |
| 75 Years and over | 0 (0.0%) | 0 (0.0%) |
Disability Class: Ambulatory Difficulty
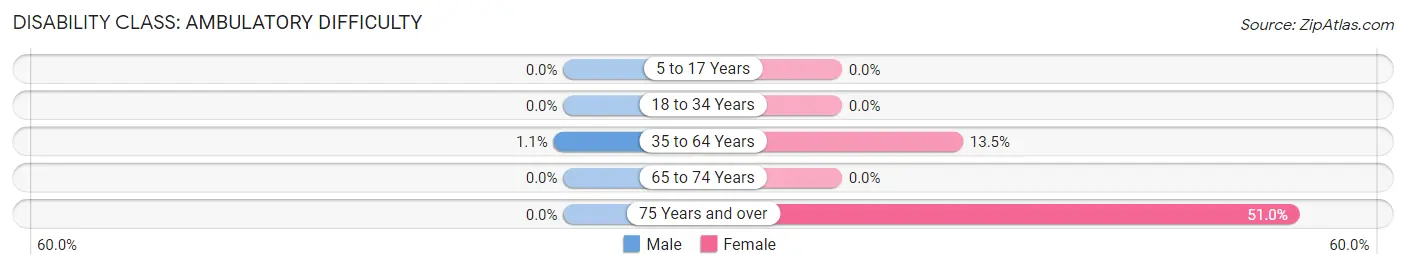
| Age Bracket | Male | Female |
| 5 to 17 Years | 0 (0.0%) | 0 (0.0%) |
| 18 to 34 Years | 0 (0.0%) | 0 (0.0%) |
| 35 to 64 Years | 1 (1.1%) | 12 (13.5%) |
| 65 to 74 Years | 0 (0.0%) | 0 (0.0%) |
| 75 Years and over | 0 (0.0%) | 26 (51.0%) |
Disability Class: Self-Care Difficulty
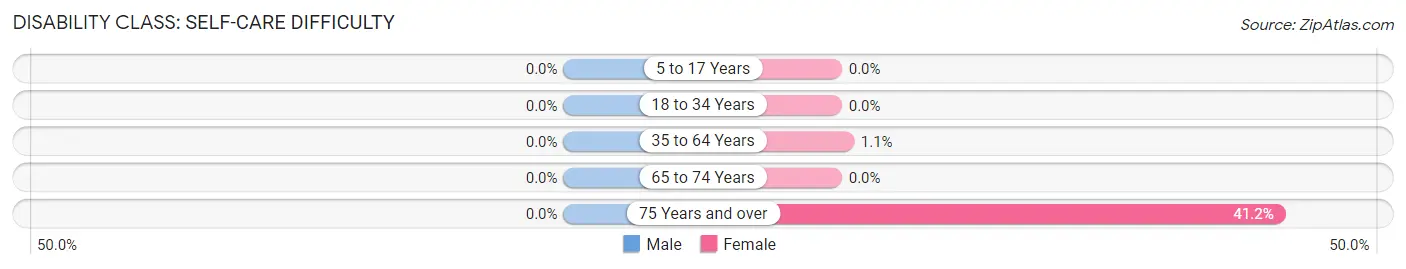
| Age Bracket | Male | Female |
| 5 to 17 Years | 0 (0.0%) | 0 (0.0%) |
| 18 to 34 Years | 0 (0.0%) | 0 (0.0%) |
| 35 to 64 Years | 0 (0.0%) | 1 (1.1%) |
| 65 to 74 Years | 0 (0.0%) | 0 (0.0%) |
| 75 Years and over | 0 (0.0%) | 21 (41.2%) |
Technology Access in Zanesville
Computing Device Access in Zanesville
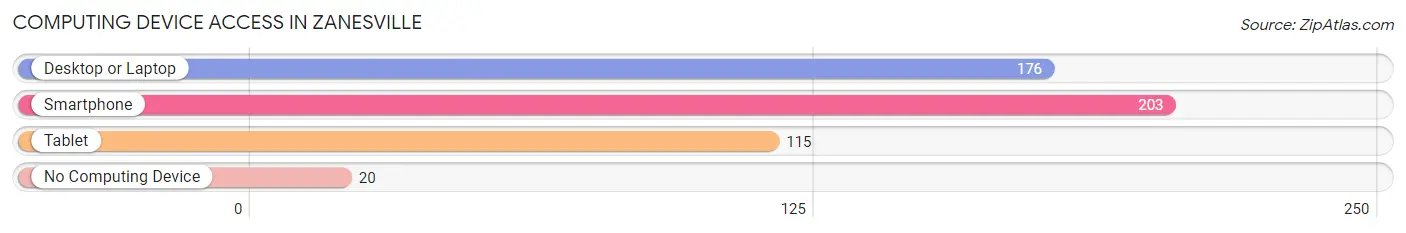
| Device Type | # Households | % Households |
| Desktop or Laptop | 176 | 75.9% |
| Smartphone | 203 | 87.5% |
| Tablet | 115 | 49.6% |
| No Computing Device | 20 | 8.6% |
| Total | 232 | 100.0% |
Internet Access in Zanesville
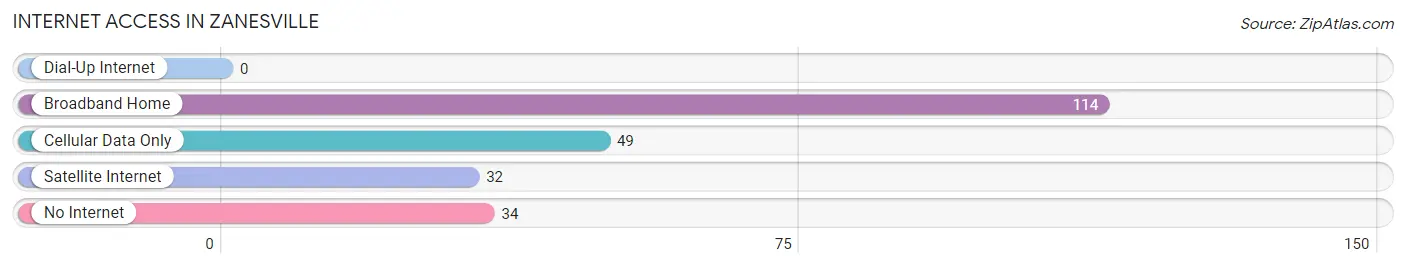
| Internet Type | # Households | % Households |
| Dial-Up Internet | 0 | 0.0% |
| Broadband Home | 114 | 49.1% |
| Cellular Data Only | 49 | 21.1% |
| Satellite Internet | 32 | 13.8% |
| No Internet | 34 | 14.7% |
| Total | 232 | 100.0% |
Zanesville Summary
Zanesville, Indiana is a small town located in the southwestern corner of the state, in the heart of the Wabash Valley. It is situated on the banks of the Wabash River, and is surrounded by rolling hills and farmland. The town has a population of just over 1,000 people, and is the county seat of Vigo County.
History
The area that is now Zanesville was first settled in 1817 by a group of settlers from North Carolina. The town was named after Ebenezer Zane, a Revolutionary War veteran who had surveyed the area in 1796. The town was officially incorporated in 1837, and the first post office was established in 1838.
In the late 19th century, Zanesville was a thriving agricultural center, with a variety of crops being grown in the area. The town was also home to several mills, including a flour mill, a sawmill, and a woolen mill.
In the early 20th century, the town began to decline as the agricultural industry shifted away from the area. The mills closed, and the population began to dwindle. However, in recent years, the town has seen a resurgence in population and economic activity.
Geography
Zanesville is located in the southwestern corner of Indiana, in the heart of the Wabash Valley. The town is situated on the banks of the Wabash River, and is surrounded by rolling hills and farmland. The town is located approximately 30 miles south of Terre Haute, and is about an hour and a half drive from Indianapolis.
The town has a total area of 0.8 square miles, all of which is land. The town is located at an elevation of 590 feet above sea level.
Economy
The economy of Zanesville is largely based on agriculture. The town is home to several farms, which produce a variety of crops, including corn, soybeans, wheat, and hay. The town is also home to several small businesses, including a grocery store, a hardware store, and a restaurant.
Demographics
As of the 2010 census, the population of Zanesville was 1,072. The town has a median household income of $37,500, and the median age is 41. The town is predominantly white, with 92.3% of the population identifying as such. The town also has a small Hispanic population, with 4.3% of the population identifying as Hispanic or Latino. The town has a low unemployment rate, with only 4.2% of the population being unemployed.
Common Questions
What is the Total Population of Zanesville?
Total Population of Zanesville is 530.
What is the Total Male Population of Zanesville?
Total Male Population of Zanesville is 236.
What is the Total Female Population of Zanesville?
Total Female Population of Zanesville is 294.
What is the Ratio of Males per 100 Females in Zanesville?
There are 80.27 Males per 100 Females in Zanesville.
What is the Ratio of Females per 100 Males in Zanesville?
There are 124.58 Females per 100 Males in Zanesville.
What is the Median Population Age in Zanesville?
Median Population Age in Zanesville is 41.5 Years.
What is the Average Family Size in Zanesville
Average Family Size in Zanesville is 2.8 People.
What is the Average Household Size in Zanesville
Average Household Size in Zanesville is 2.3 People.
What is Per Capita Income in Zanesville?
Per Capita income in Zanesville is $25,904.
What is the Median Family Income in Zanesville?
Median Family Income in Zanesville is $57,500.
What is the Median Household income in Zanesville?
Median Household Income in Zanesville is $55,625.
What is Income or Wage Gap in Zanesville?
Income or Wage Gap in Zanesville is 33.0%.
Women in Zanesville earn 67.0 cents for every dollar earned by a man.
What is Inequality or Gini Index in Zanesville?
Inequality or Gini Index in Zanesville is 0.35.
How Large is the Labor Force in Zanesville?
There are 235 People in the Labor Forcein in Zanesville.
What is the Percentage of People in the Labor Force in Zanesville?
52.8% of People are in the Labor Force in Zanesville.
What is the Unemployment Rate in Zanesville?
Unemployment Rate in Zanesville is 0.9%.