De Motte, IN
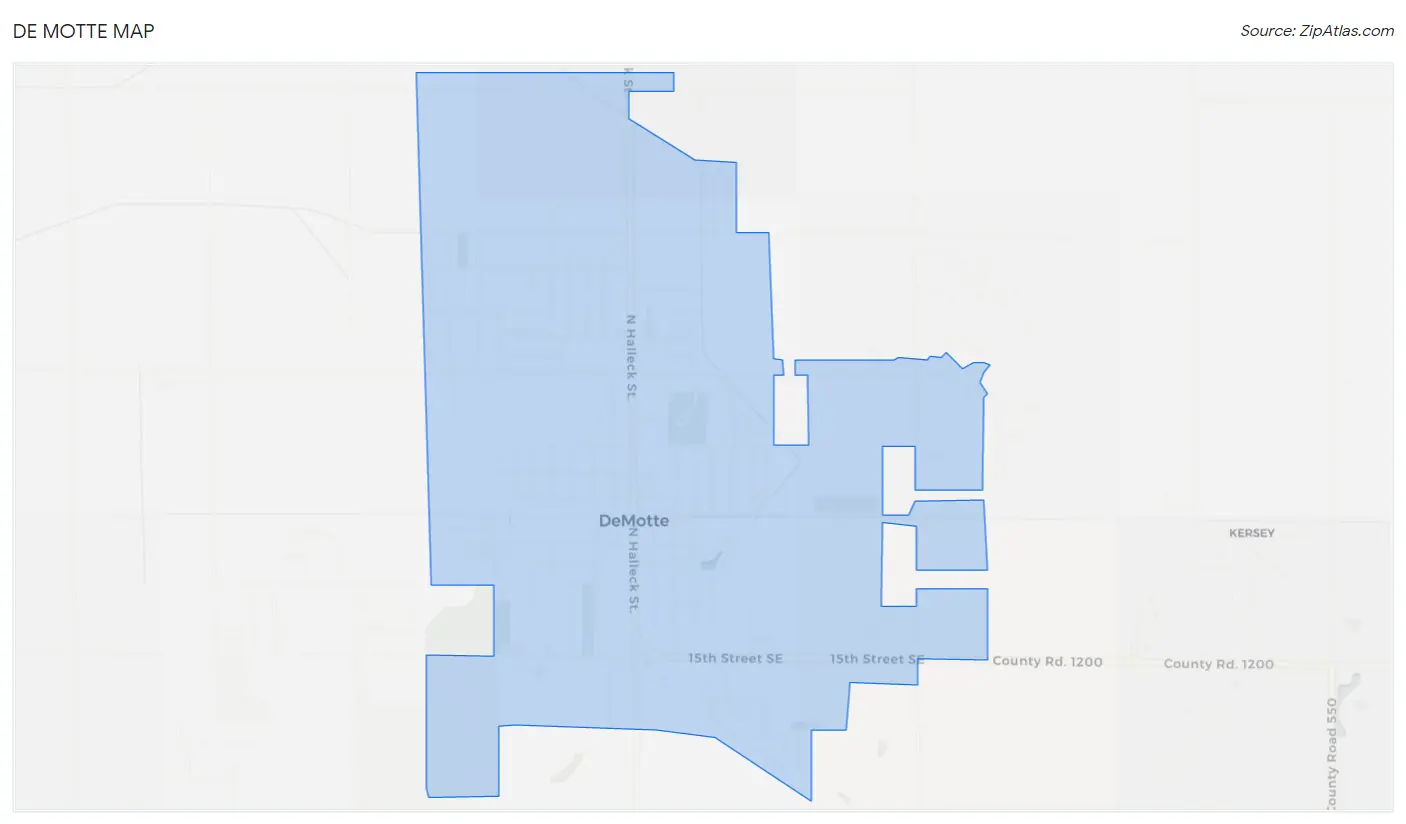
De Motte Map
De Motte Overview
4,182
TOTAL POPULATION
1,653
MALE POPULATION
2,529
FEMALE POPULATION
65.36
MALES / 100 FEMALES
152.99
FEMALES / 100 MALES
41.6
MEDIAN AGE
2.7
AVG FAMILY SIZE
2.1
AVG HOUSEHOLD SIZE
$31,036
PER CAPITA INCOME
$79,026
AVG FAMILY INCOME
$64,415
AVG HOUSEHOLD INCOME
49.4%
WAGE / INCOME GAP [ % ]
50.6¢/ $1
WAGE / INCOME GAP [ $ ]
0.34
INEQUALITY / GINI INDEX
1,650
LABOR FORCE [ PEOPLE ]
52.3%
PERCENT IN LABOR FORCE
1.1%
UNEMPLOYMENT RATE
Race in De Motte
The most populous races in De Motte are White / Caucasian (3,706 | 88.6%), Two or more Races (375 | 9.0%), and Hispanic or Latino (316 | 7.6%).
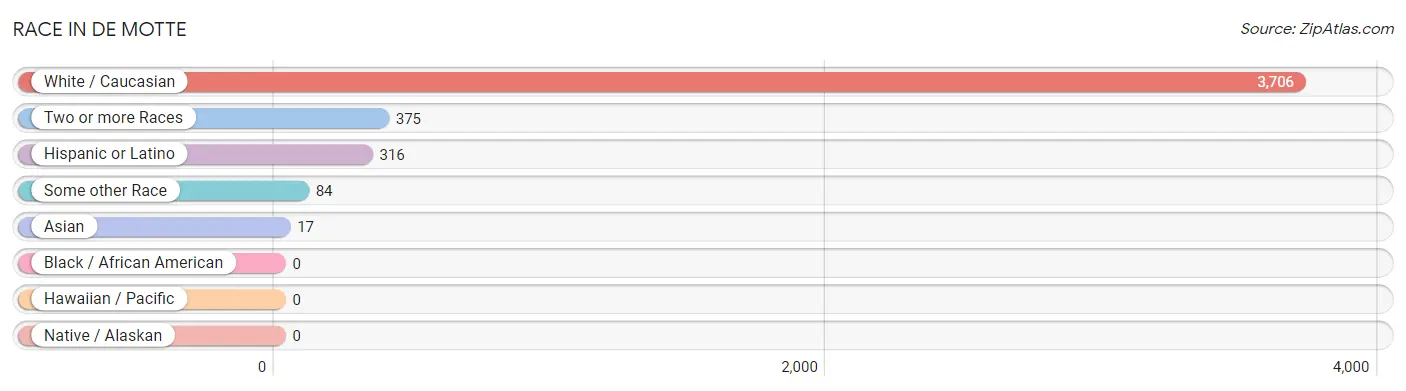
| Race | # Population | % Population |
| Asian | 17 | 0.4% |
| Black / African American | 0 | 0.0% |
| Hawaiian / Pacific | 0 | 0.0% |
| Hispanic or Latino | 316 | 7.6% |
| Native / Alaskan | 0 | 0.0% |
| White / Caucasian | 3,706 | 88.6% |
| Two or more Races | 375 | 9.0% |
| Some other Race | 84 | 2.0% |
| Total | 4,182 | 100.0% |
Ancestry in De Motte
The most populous ancestries reported in De Motte are Irish (639 | 15.3%), German (609 | 14.6%), English (562 | 13.4%), Dutch (253 | 6.0%), and Mexican (243 | 5.8%), together accounting for 55.1% of all De Motte residents.
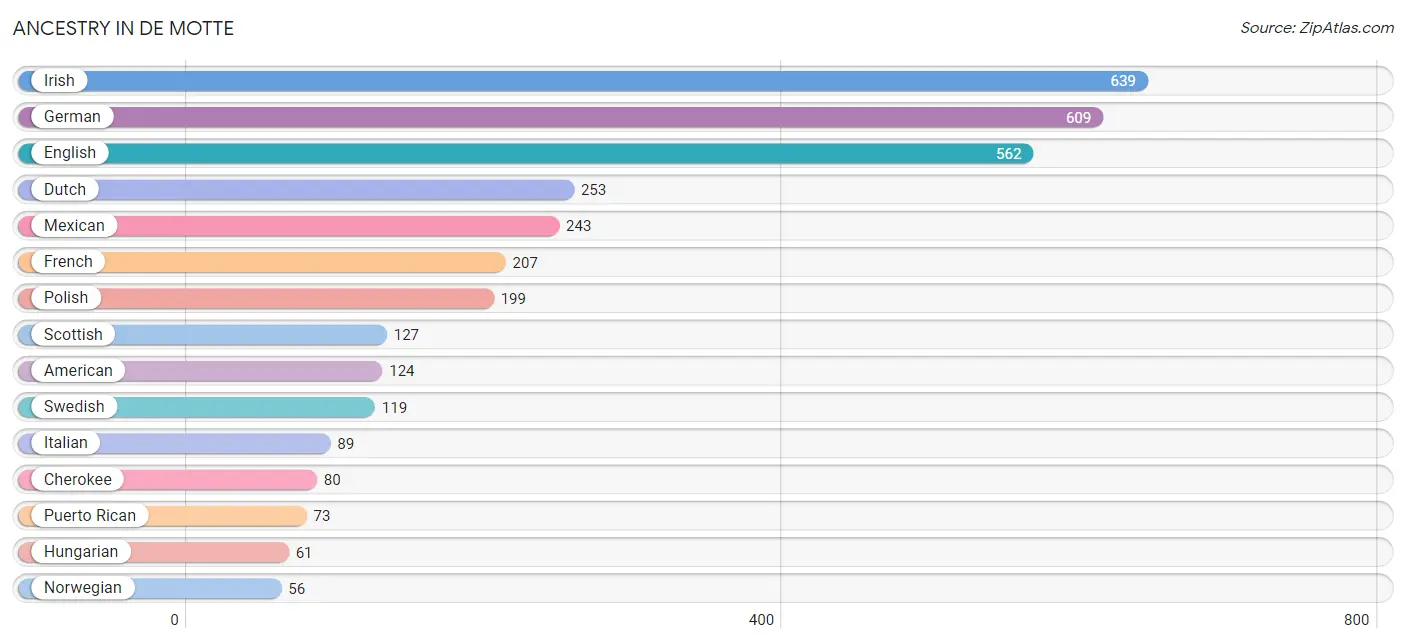
| Ancestry | # Population | % Population |
| American | 124 | 3.0% |
| Belgian | 48 | 1.1% |
| Burmese | 8 | 0.2% |
| Cherokee | 80 | 1.9% |
| Chippewa | 38 | 0.9% |
| Danish | 45 | 1.1% |
| Dutch | 253 | 6.0% |
| English | 562 | 13.4% |
| French | 207 | 5.0% |
| French Canadian | 3 | 0.1% |
| German | 609 | 14.6% |
| Hungarian | 61 | 1.5% |
| Indian (Asian) | 17 | 0.4% |
| Irish | 639 | 15.3% |
| Italian | 89 | 2.1% |
| Laotian | 17 | 0.4% |
| Mexican | 243 | 5.8% |
| Norwegian | 56 | 1.3% |
| Polish | 199 | 4.8% |
| Puerto Rican | 73 | 1.8% |
| Romanian | 19 | 0.4% |
| Scotch-Irish | 36 | 0.9% |
| Scottish | 127 | 3.0% |
| Slovak | 21 | 0.5% |
| Swedish | 119 | 2.9% |
| Swiss | 56 | 1.3% |
| Welsh | 33 | 0.8% | View All 27 Rows |
Immigrants in De Motte
The most numerous immigrant groups reported in De Motte came from Central America (78 | 1.9%), Latin America (78 | 1.9%), Mexico (78 | 1.9%), Asia (17 | 0.4%), and Indonesia (17 | 0.4%), together accounting for 6.4% of all De Motte residents.
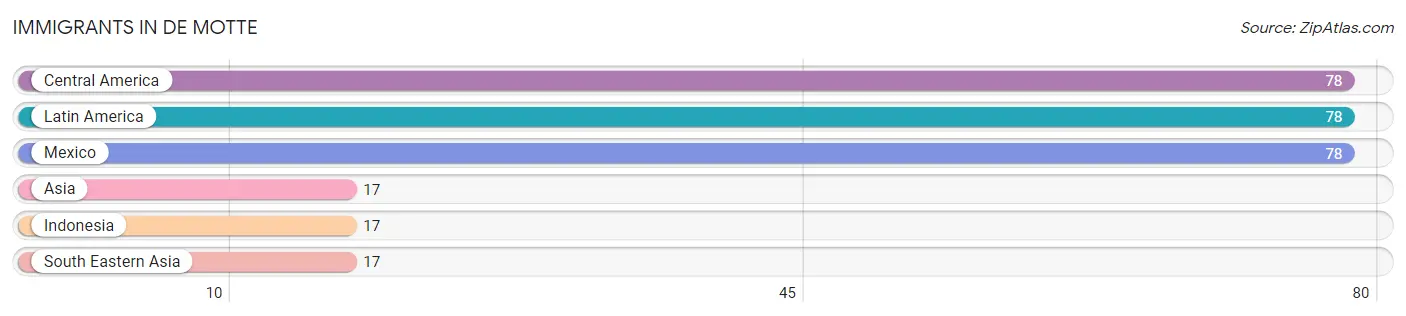
| Immigration Origin | # Population | % Population |
| Asia | 17 | 0.4% |
| Central America | 78 | 1.9% |
| Indonesia | 17 | 0.4% |
| Latin America | 78 | 1.9% |
| Mexico | 78 | 1.9% |
| South Eastern Asia | 17 | 0.4% | View All 6 Rows |
Sex and Age in De Motte
Sex and Age in De Motte
The most populous age groups in De Motte are 55 to 59 Years (211 | 12.8%) for men and 25 to 29 Years (270 | 10.7%) for women.
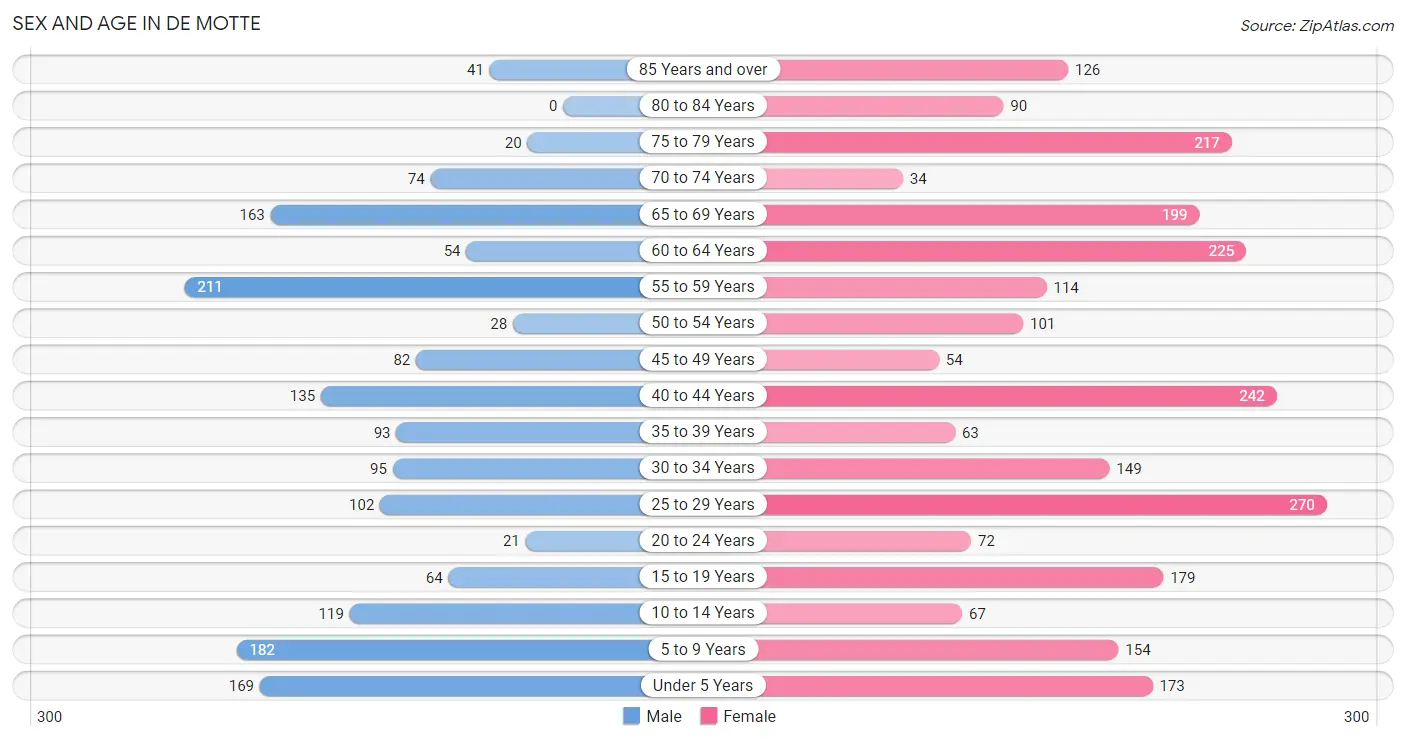
| Age Bracket | Male | Female |
| Under 5 Years | 169 (10.2%) | 173 (6.8%) |
| 5 to 9 Years | 182 (11.0%) | 154 (6.1%) |
| 10 to 14 Years | 119 (7.2%) | 67 (2.6%) |
| 15 to 19 Years | 64 (3.9%) | 179 (7.1%) |
| 20 to 24 Years | 21 (1.3%) | 72 (2.9%) |
| 25 to 29 Years | 102 (6.2%) | 270 (10.7%) |
| 30 to 34 Years | 95 (5.8%) | 149 (5.9%) |
| 35 to 39 Years | 93 (5.6%) | 63 (2.5%) |
| 40 to 44 Years | 135 (8.2%) | 242 (9.6%) |
| 45 to 49 Years | 82 (5.0%) | 54 (2.1%) |
| 50 to 54 Years | 28 (1.7%) | 101 (4.0%) |
| 55 to 59 Years | 211 (12.8%) | 114 (4.5%) |
| 60 to 64 Years | 54 (3.3%) | 225 (8.9%) |
| 65 to 69 Years | 163 (9.9%) | 199 (7.9%) |
| 70 to 74 Years | 74 (4.5%) | 34 (1.3%) |
| 75 to 79 Years | 20 (1.2%) | 217 (8.6%) |
| 80 to 84 Years | 0 (0.0%) | 90 (3.6%) |
| 85 Years and over | 41 (2.5%) | 126 (5.0%) |
| Total | 1,653 (100.0%) | 2,529 (100.0%) |
Families and Households in De Motte
Median Family Size in De Motte
The median family size in De Motte is 2.72 persons per family, with married-couple families (662 | 64.3%) accounting for the largest median family size of 2.84 persons per family. On the other hand, single female/mother families (192 | 18.7%) represent the smallest median family size with 2.28 persons per family.
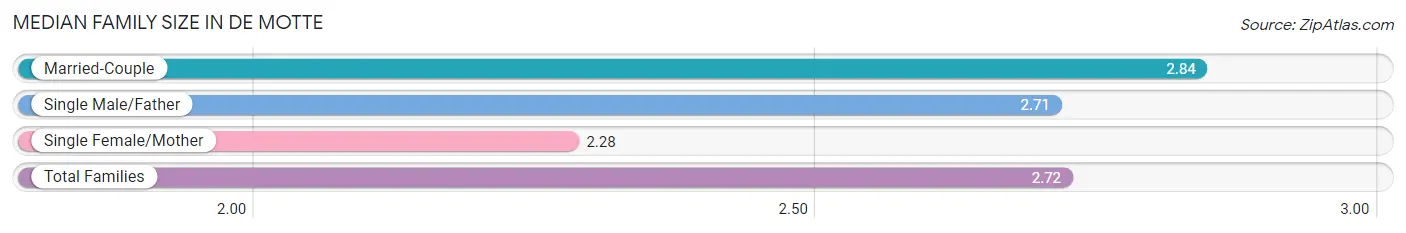
| Family Type | # Families | Family Size |
| Married-Couple | 662 (64.3%) | 2.84 |
| Single Male/Father | 175 (17.0%) | 2.71 |
| Single Female/Mother | 192 (18.7%) | 2.28 |
| Total Families | 1,029 (100.0%) | 2.72 |
Median Household Size in De Motte
The median household size in De Motte is 2.13 persons per household, with single male/father households (175 | 9.0%) accounting for the largest median household size of 4.05 persons per household. non-family households (909 | 46.9%) represent the smallest median household size with 1.13 persons per household.
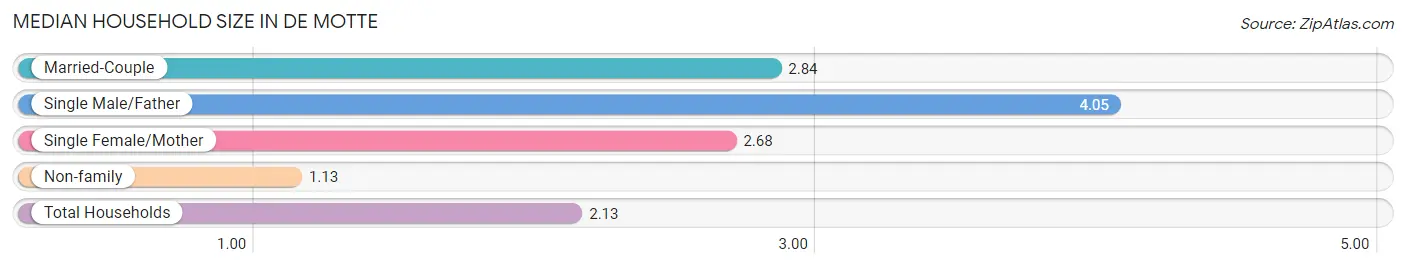
| Household Type | # Households | Household Size |
| Married-Couple | 662 (34.2%) | 2.84 |
| Single Male/Father | 175 (9.0%) | 4.05 |
| Single Female/Mother | 192 (9.9%) | 2.68 |
| Non-family | 909 (46.9%) | 1.13 |
| Total Households | 1,938 (100.0%) | 2.13 |
Household Size by Marriage Status in De Motte
Out of a total of 1,938 households in De Motte, 1,029 (53.1%) are family households, while 909 (46.9%) are nonfamily households. The most numerous type of family households are 2-person households, comprising 570, and the most common type of nonfamily households are 1-person households, comprising 796.
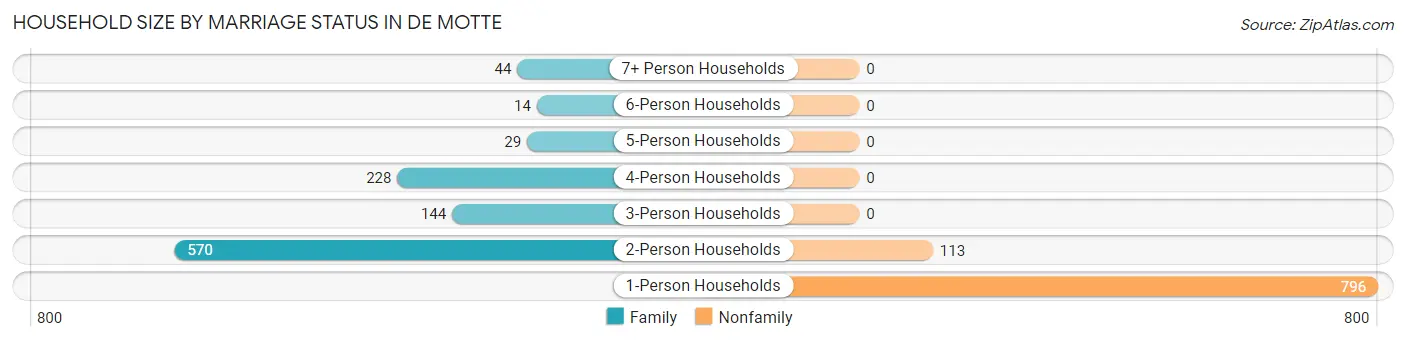
| Household Size | Family Households | Nonfamily Households |
| 1-Person Households | - | 796 (41.1%) |
| 2-Person Households | 570 (29.4%) | 113 (5.8%) |
| 3-Person Households | 144 (7.4%) | 0 (0.0%) |
| 4-Person Households | 228 (11.8%) | 0 (0.0%) |
| 5-Person Households | 29 (1.5%) | 0 (0.0%) |
| 6-Person Households | 14 (0.7%) | 0 (0.0%) |
| 7+ Person Households | 44 (2.3%) | 0 (0.0%) |
| Total | 1,029 (53.1%) | 909 (46.9%) |
Female Fertility in De Motte
Fertility by Age in De Motte
Average fertility rate in De Motte is 145.0 births per 1,000 women. Women in the age bracket of 20 to 34 years have the highest fertility rate with 281.0 births per 1,000 women. Women in the age bracket of 20 to 34 years acount for 86.3% of all women with births.
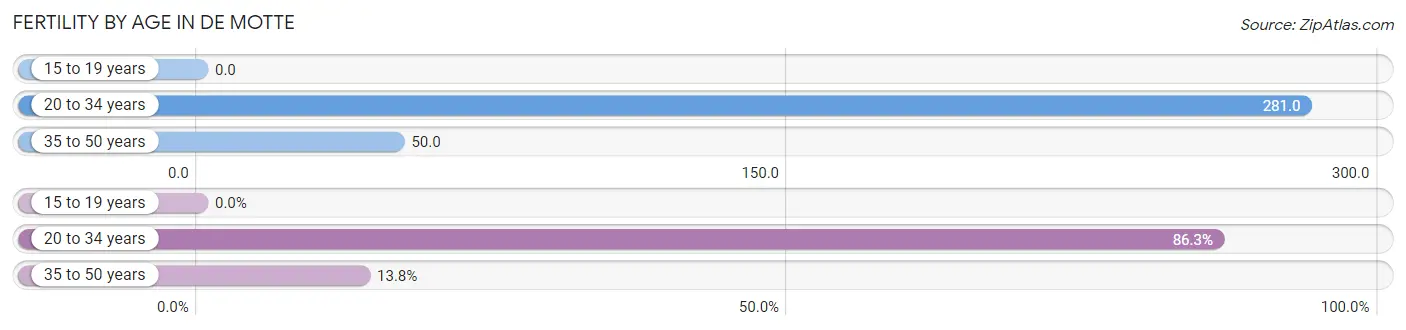
| Age Bracket | Women with Births | Births / 1,000 Women |
| 15 to 19 years | 0 (0.0%) | 0.0 |
| 20 to 34 years | 138 (86.3%) | 281.0 |
| 35 to 50 years | 22 (13.8%) | 50.0 |
| Total | 160 (100.0%) | 145.0 |
Fertility by Age by Marriage Status in De Motte
60.0% of women with births (160) in De Motte are married. The highest percentage of unmarried women with births falls into 20 to 34 years age bracket with 46.4% of them unmarried at the time of birth, while the lowest percentage of unmarried women with births belong to 35 to 50 years age bracket with 0.0% of them unmarried.
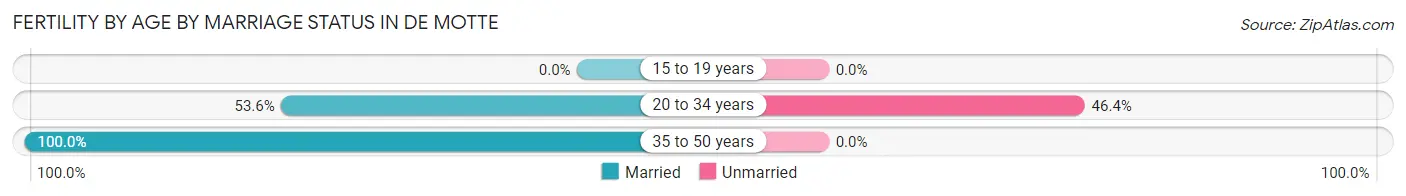
| Age Bracket | Married | Unmarried |
| 15 to 19 years | 0 (0.0%) | 0 (0.0%) |
| 20 to 34 years | 74 (53.6%) | 64 (46.4%) |
| 35 to 50 years | 22 (100.0%) | 0 (0.0%) |
| Total | 96 (60.0%) | 64 (40.0%) |
Fertility by Education in De Motte
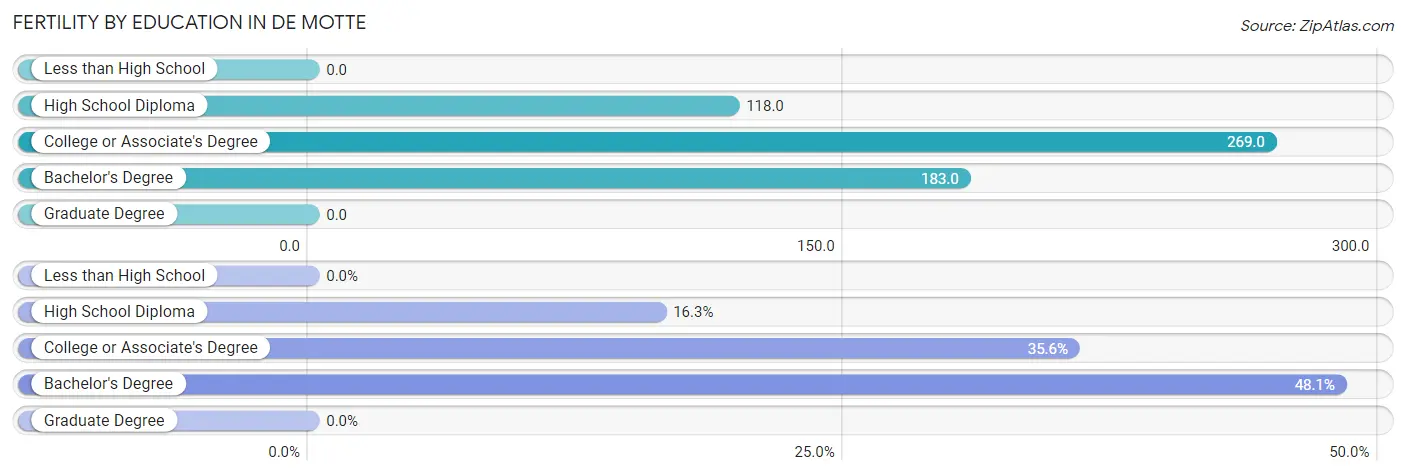
| Educational Attainment | Women with Births | Births / 1,000 Women |
| Less than High School | 0 (0.0%) | 0.0 |
| High School Diploma | 26 (16.3%) | 118.0 |
| College or Associate's Degree | 57 (35.6%) | 269.0 |
| Bachelor's Degree | 77 (48.1%) | 183.0 |
| Graduate Degree | 0 (0.0%) | 0.0 |
| Total | 160 (100.0%) | 145.0 |
Fertility by Education by Marriage Status in De Motte
40.0% of women with births in De Motte are unmarried. Women with the educational attainment of high school diploma are most likely to be married with 100.0% of them married at childbirth, while women with the educational attainment of bachelor's degree are least likely to be married with 51.9% of them unmarried at childbirth.
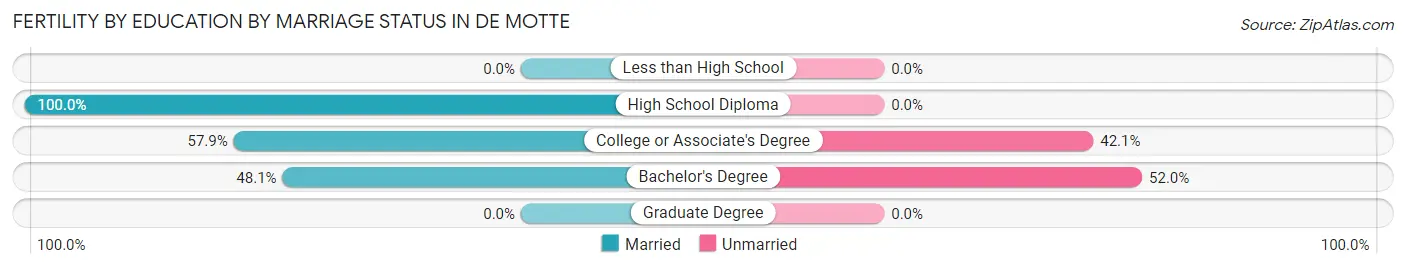
| Educational Attainment | Married | Unmarried |
| Less than High School | 0 (0.0%) | 0 (0.0%) |
| High School Diploma | 26 (100.0%) | 0 (0.0%) |
| College or Associate's Degree | 33 (57.9%) | 24 (42.1%) |
| Bachelor's Degree | 37 (48.0%) | 40 (51.9%) |
| Graduate Degree | 0 (0.0%) | 0 (0.0%) |
| Total | 96 (60.0%) | 64 (40.0%) |
Income in De Motte
Income Overview in De Motte
Per Capita Income in De Motte is $31,036, while median incomes of families and households are $79,026 and $64,415 respectively.
| Characteristic | Number | Measure |
| Per Capita Income | 4,182 | $31,036 |
| Median Family Income | 1,029 | $79,026 |
| Mean Family Income | 1,029 | $78,809 |
| Median Household Income | 1,938 | $64,415 |
| Mean Household Income | 1,938 | $67,305 |
| Income Deficit | 1,029 | $0 |
| Wage / Income Gap (%) | 4,182 | 49.45% |
| Wage / Income Gap ($) | 4,182 | 50.55¢ per $1 |
| Gini / Inequality Index | 4,182 | 0.34 |
Earnings by Sex in De Motte
Average Earnings in De Motte are $51,311, $68,966 for men and $34,865 for women, a difference of 49.4%.
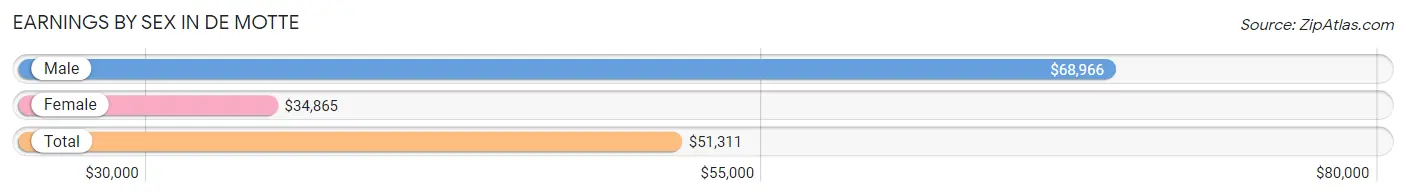
| Sex | Number | Average Earnings |
| Male | 773 (46.2%) | $68,966 |
| Female | 902 (53.8%) | $34,865 |
| Total | 1,675 (100.0%) | $51,311 |
Earnings by Sex by Income Bracket in De Motte
The most common earnings brackets in De Motte are $75,000 to $99,999 for men (216 | 27.9%) and $50,000 to $54,999 for women (122 | 13.5%).
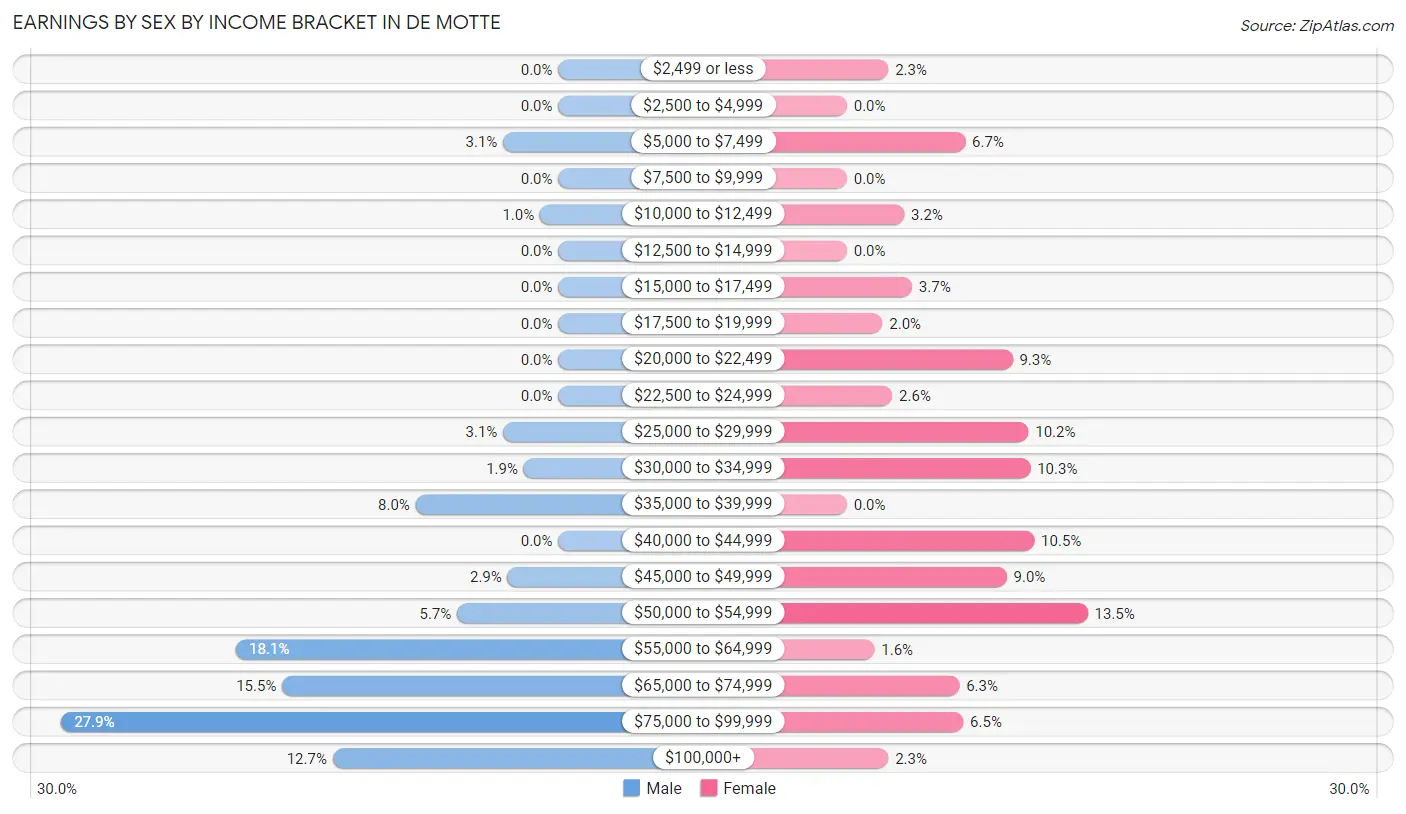
| Income | Male | Female |
| $2,499 or less | 0 (0.0%) | 21 (2.3%) |
| $2,500 to $4,999 | 0 (0.0%) | 0 (0.0%) |
| $5,000 to $7,499 | 24 (3.1%) | 60 (6.7%) |
| $7,500 to $9,999 | 0 (0.0%) | 0 (0.0%) |
| $10,000 to $12,499 | 8 (1.0%) | 29 (3.2%) |
| $12,500 to $14,999 | 0 (0.0%) | 0 (0.0%) |
| $15,000 to $17,499 | 0 (0.0%) | 33 (3.7%) |
| $17,500 to $19,999 | 0 (0.0%) | 18 (2.0%) |
| $20,000 to $22,499 | 0 (0.0%) | 84 (9.3%) |
| $22,500 to $24,999 | 0 (0.0%) | 23 (2.5%) |
| $25,000 to $29,999 | 24 (3.1%) | 92 (10.2%) |
| $30,000 to $34,999 | 15 (1.9%) | 93 (10.3%) |
| $35,000 to $39,999 | 62 (8.0%) | 0 (0.0%) |
| $40,000 to $44,999 | 0 (0.0%) | 95 (10.5%) |
| $45,000 to $49,999 | 22 (2.9%) | 81 (9.0%) |
| $50,000 to $54,999 | 44 (5.7%) | 122 (13.5%) |
| $55,000 to $64,999 | 140 (18.1%) | 14 (1.5%) |
| $65,000 to $74,999 | 120 (15.5%) | 57 (6.3%) |
| $75,000 to $99,999 | 216 (27.9%) | 59 (6.5%) |
| $100,000+ | 98 (12.7%) | 21 (2.3%) |
| Total | 773 (100.0%) | 902 (100.0%) |
Earnings by Sex by Educational Attainment in De Motte
Average earnings in De Motte are $68,642 for men and $40,553 for women, a difference of 40.9%. Men with an educational attainment of high school diploma enjoy the highest average annual earnings of $72,847, while those with bachelor's degree education earn the least with $55,857. Women with an educational attainment of bachelor's degree earn the most with the average annual earnings of $50,323, while those with high school diploma education have the smallest earnings of $26,612.
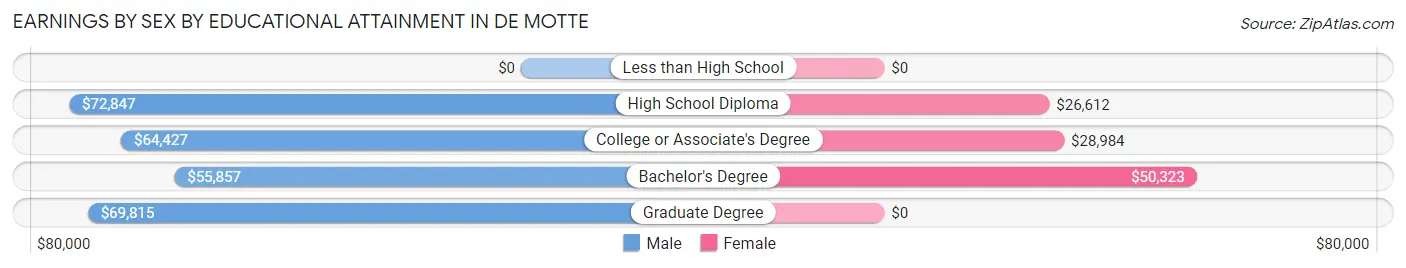
| Educational Attainment | Male Income | Female Income |
| Less than High School | - | - |
| High School Diploma | $72,847 | $26,612 |
| College or Associate's Degree | $64,427 | $28,984 |
| Bachelor's Degree | $55,857 | $50,323 |
| Graduate Degree | $69,815 | $0 |
| Total | $68,642 | $40,553 |
Family Income in De Motte
Family Income Brackets in De Motte
According to the De Motte family income data, there are 338 families falling into the $75,000 to $99,999 income range, which is the most common income bracket and makes up 32.9% of all families.
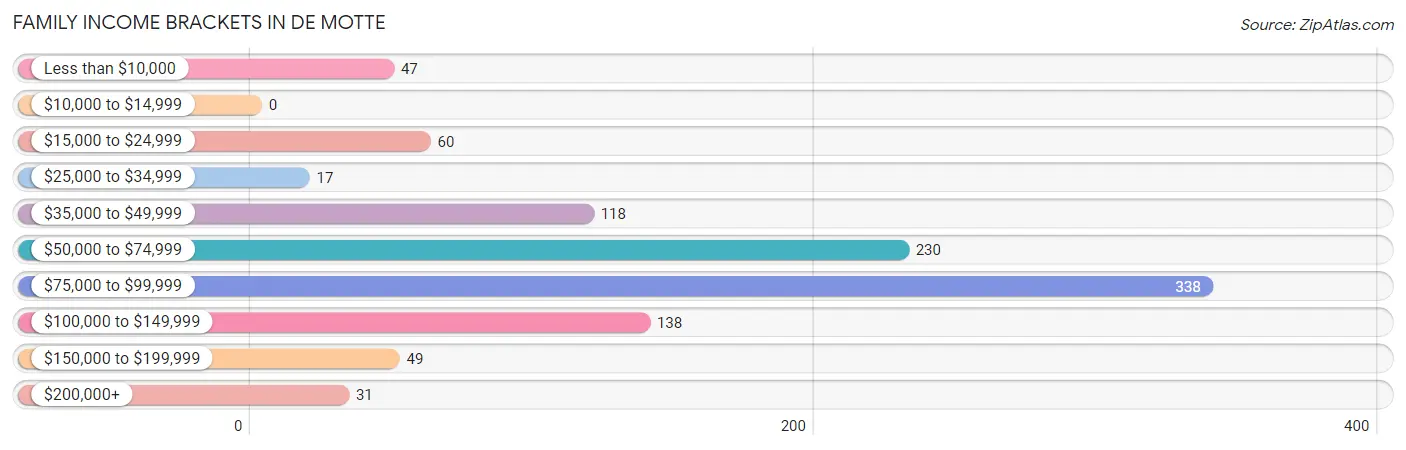
| Income Bracket | # Families | % Families |
| Less than $10,000 | 47 | 4.6% |
| $10,000 to $14,999 | 0 | 0.0% |
| $15,000 to $24,999 | 60 | 5.8% |
| $25,000 to $34,999 | 17 | 1.7% |
| $35,000 to $49,999 | 118 | 11.5% |
| $50,000 to $74,999 | 230 | 22.4% |
| $75,000 to $99,999 | 338 | 32.8% |
| $100,000 to $149,999 | 138 | 13.4% |
| $150,000 to $199,999 | 49 | 4.8% |
| $200,000+ | 31 | 3.0% |
Family Income by Famaliy Size in De Motte
4-person families (69 | 6.7%) account for the highest median family income in De Motte with $92,464 per family, while 2-person families (641 | 62.3%) have the highest median income of $41,101 per family member.
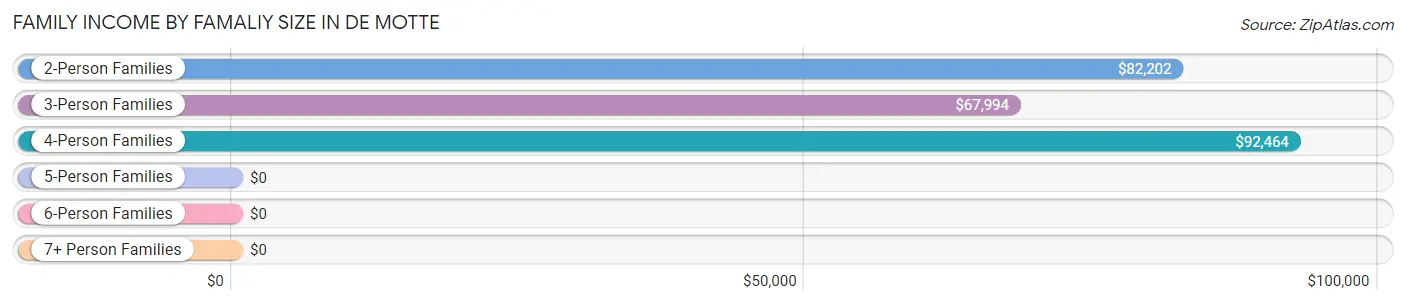
| Income Bracket | # Families | Median Income |
| 2-Person Families | 641 (62.3%) | $82,202 |
| 3-Person Families | 232 (22.6%) | $67,994 |
| 4-Person Families | 69 (6.7%) | $92,464 |
| 5-Person Families | 43 (4.2%) | $0 |
| 6-Person Families | 0 (0.0%) | $0 |
| 7+ Person Families | 44 (4.3%) | $0 |
| Total | 1,029 (100.0%) | $79,026 |
Family Income by Number of Earners in De Motte
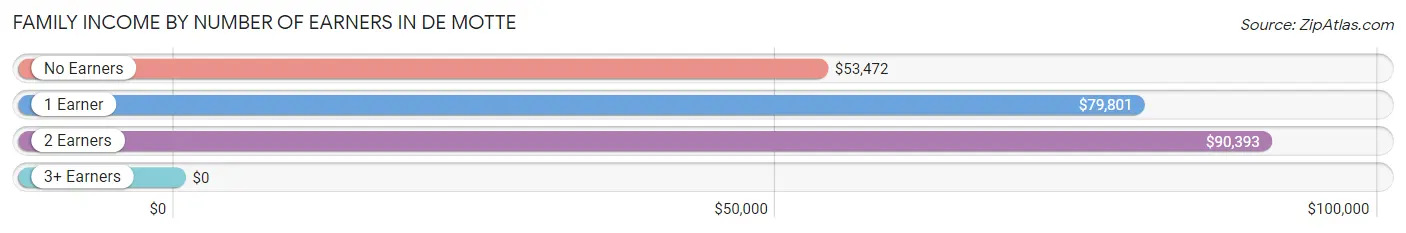
| Number of Earners | # Families | Median Income |
| No Earners | 269 (26.1%) | $53,472 |
| 1 Earner | 545 (53.0%) | $79,801 |
| 2 Earners | 183 (17.8%) | $90,393 |
| 3+ Earners | 32 (3.1%) | $0 |
| Total | 1,029 (100.0%) | $79,026 |
Household Income in De Motte
Household Income Brackets in De Motte
With 624 households falling in the category, the $75,000 to $99,999 income range is the most frequent in De Motte, accounting for 32.2% of all households. In contrast, only 17 households (0.9%) fall into the $150,000 to $199,999 income bracket, making it the least populous group.
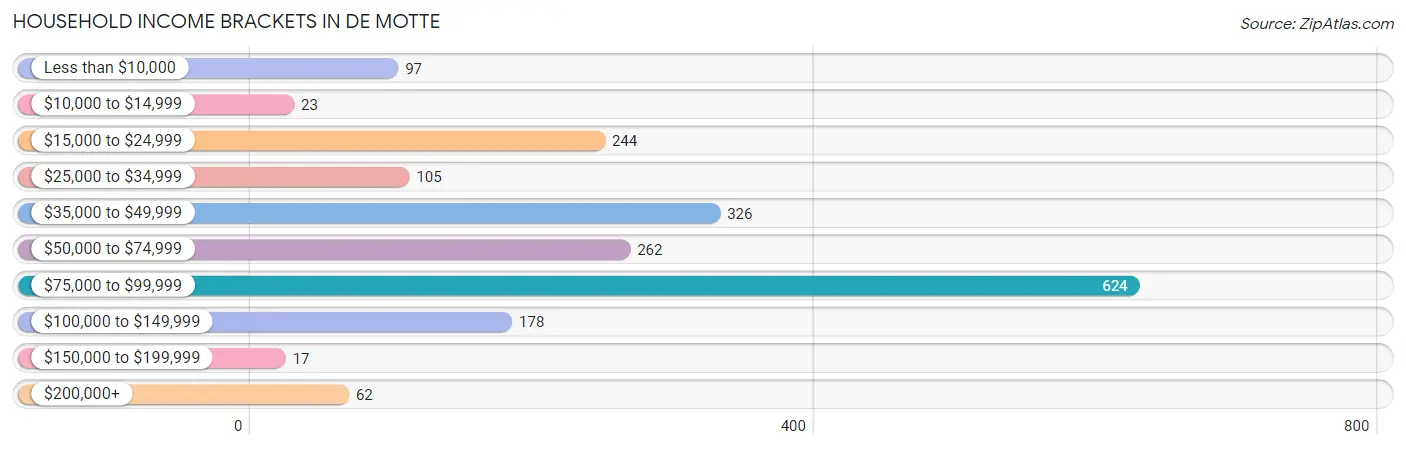
| Income Bracket | # Households | % Households |
| Less than $10,000 | 97 | 5.0% |
| $10,000 to $14,999 | 23 | 1.2% |
| $15,000 to $24,999 | 244 | 12.6% |
| $25,000 to $34,999 | 105 | 5.4% |
| $35,000 to $49,999 | 326 | 16.8% |
| $50,000 to $74,999 | 262 | 13.5% |
| $75,000 to $99,999 | 624 | 32.2% |
| $100,000 to $149,999 | 178 | 9.2% |
| $150,000 to $199,999 | 17 | 0.9% |
| $200,000+ | 62 | 3.2% |
Household Income by Householder Age in De Motte
The median household income in De Motte is $64,415, with the highest median household income of $92,250 found in the 45 to 64 years age bracket for the primary householder. A total of 561 households (28.9%) fall into this category. Meanwhile, the 15 to 24 years age bracket for the primary householder has the lowest median household income of $0, with 21 households (1.1%) in this group.
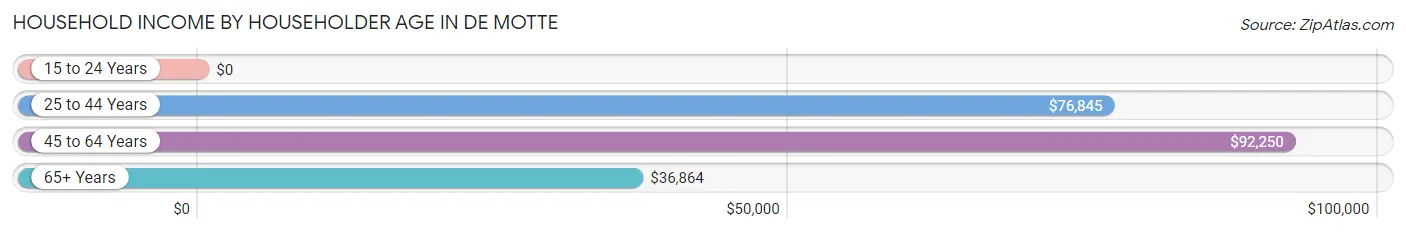
| Income Bracket | # Households | Median Income |
| 15 to 24 Years | 21 (1.1%) | $0 |
| 25 to 44 Years | 659 (34.0%) | $76,845 |
| 45 to 64 Years | 561 (28.9%) | $92,250 |
| 65+ Years | 697 (36.0%) | $36,864 |
| Total | 1,938 (100.0%) | $64,415 |
Poverty in De Motte
Income Below Poverty by Sex and Age in De Motte
With 0.9% poverty level for males and 13.9% for females among the residents of De Motte, 55 to 64 year old males and 15 year old females are the most vulnerable to poverty, with 15 males (5.7%) and 65 females (53.3%) in their respective age groups living below the poverty level.
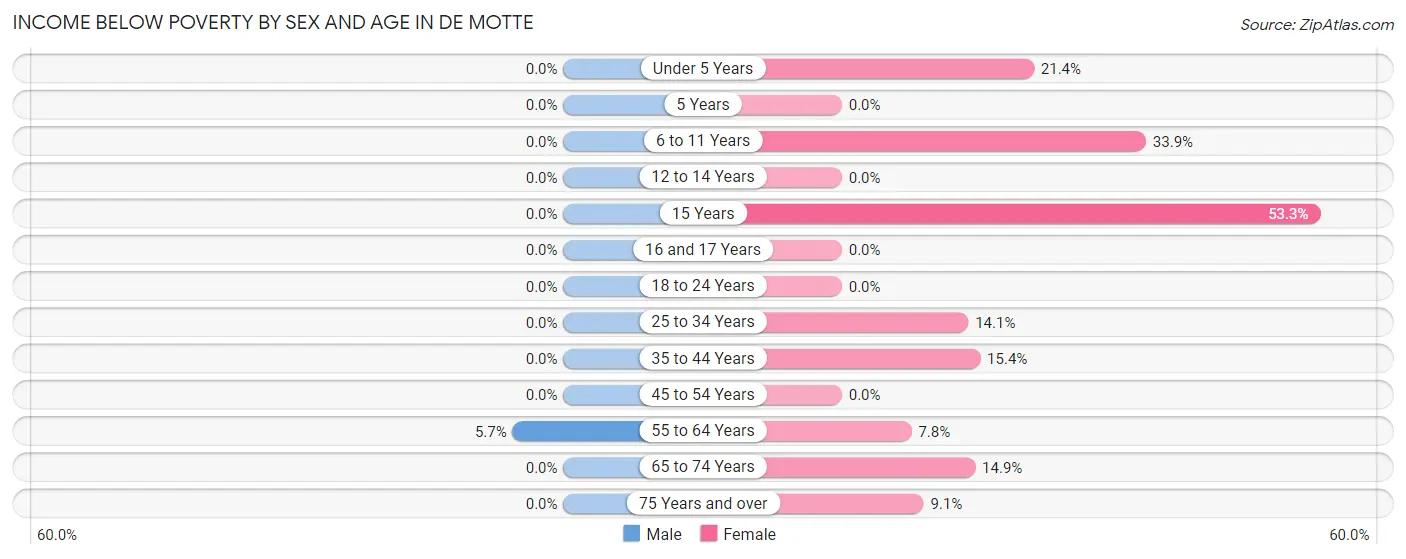
| Age Bracket | Male | Female |
| Under 5 Years | 0 (0.0%) | 37 (21.4%) |
| 5 Years | 0 (0.0%) | 0 (0.0%) |
| 6 to 11 Years | 0 (0.0%) | 42 (33.9%) |
| 12 to 14 Years | 0 (0.0%) | 0 (0.0%) |
| 15 Years | 0 (0.0%) | 65 (53.3%) |
| 16 and 17 Years | 0 (0.0%) | 0 (0.0%) |
| 18 to 24 Years | 0 (0.0%) | 0 (0.0%) |
| 25 to 34 Years | 0 (0.0%) | 59 (14.1%) |
| 35 to 44 Years | 0 (0.0%) | 47 (15.4%) |
| 45 to 54 Years | 0 (0.0%) | 0 (0.0%) |
| 55 to 64 Years | 15 (5.7%) | 26 (7.8%) |
| 65 to 74 Years | 0 (0.0%) | 34 (14.8%) |
| 75 Years and over | 0 (0.0%) | 37 (9.1%) |
| Total | 15 (0.9%) | 347 (13.9%) |
Income Above Poverty by Sex and Age in De Motte
According to the poverty statistics in De Motte, males aged under 5 years and females aged 5 years are the age groups that are most secure financially, with 100.0% of males and 100.0% of females in these age groups living above the poverty line.
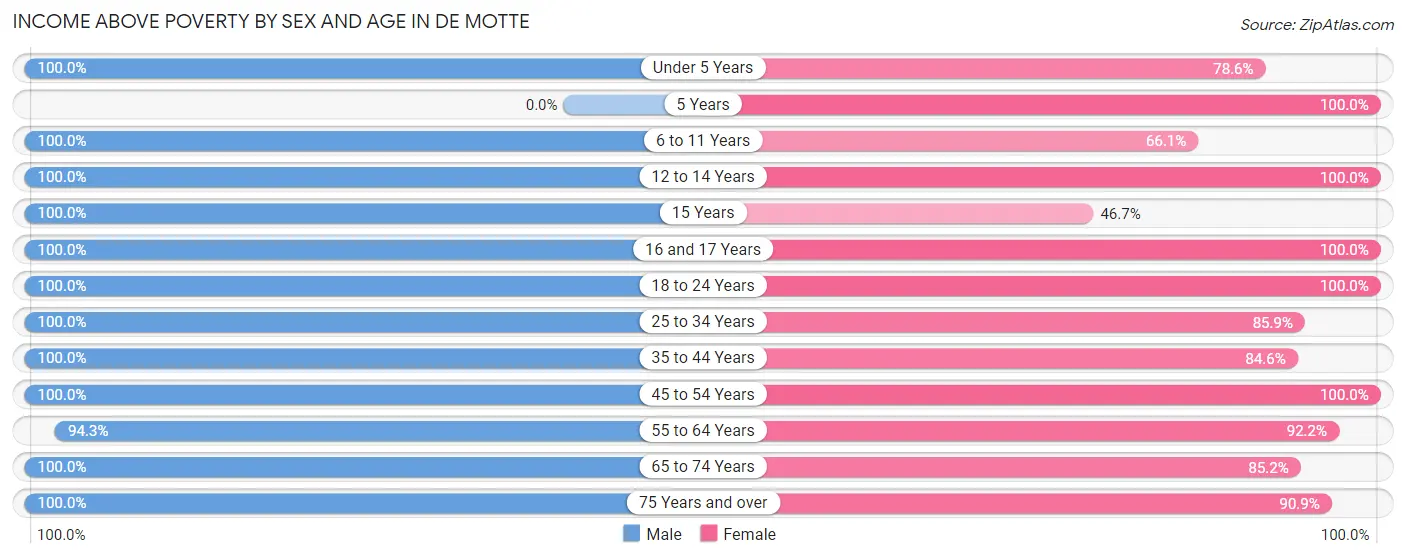
| Age Bracket | Male | Female |
| Under 5 Years | 169 (100.0%) | 136 (78.6%) |
| 5 Years | 0 (0.0%) | 52 (100.0%) |
| 6 to 11 Years | 200 (100.0%) | 82 (66.1%) |
| 12 to 14 Years | 101 (100.0%) | 45 (100.0%) |
| 15 Years | 42 (100.0%) | 57 (46.7%) |
| 16 and 17 Years | 4 (100.0%) | 57 (100.0%) |
| 18 to 24 Years | 39 (100.0%) | 72 (100.0%) |
| 25 to 34 Years | 197 (100.0%) | 360 (85.9%) |
| 35 to 44 Years | 228 (100.0%) | 258 (84.6%) |
| 45 to 54 Years | 110 (100.0%) | 155 (100.0%) |
| 55 to 64 Years | 250 (94.3%) | 309 (92.2%) |
| 65 to 74 Years | 237 (100.0%) | 195 (85.2%) |
| 75 Years and over | 50 (100.0%) | 369 (90.9%) |
| Total | 1,627 (99.1%) | 2,147 (86.1%) |
Income Below Poverty Among Married-Couple Families in De Motte
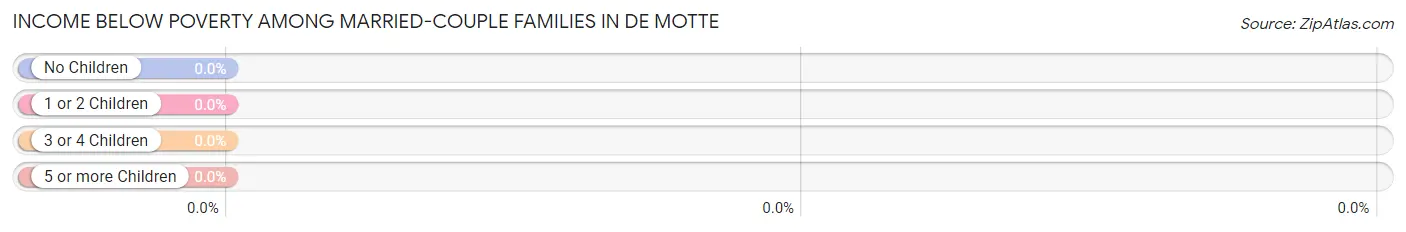
| Children | Above Poverty | Below Poverty |
| No Children | 484 (100.0%) | 0 (0.0%) |
| 1 or 2 Children | 105 (100.0%) | 0 (0.0%) |
| 3 or 4 Children | 29 (100.0%) | 0 (0.0%) |
| 5 or more Children | 44 (100.0%) | 0 (0.0%) |
| Total | 662 (100.0%) | 0 (0.0%) |
Income Below Poverty Among Single-Parent Households in De Motte
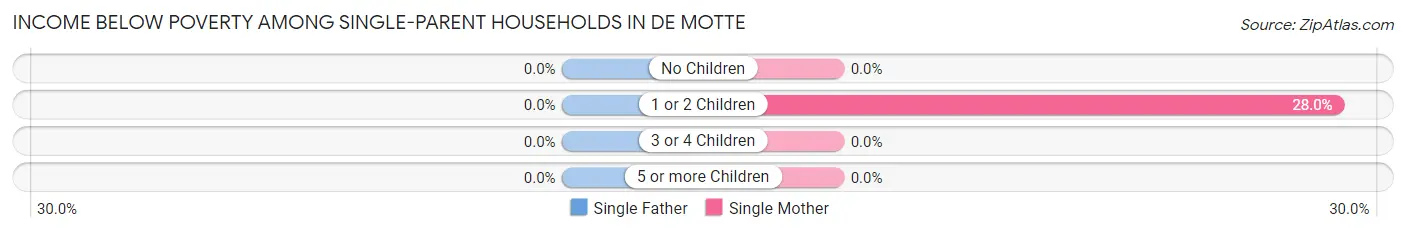
| Children | Single Father | Single Mother |
| No Children | 0 (0.0%) | 0 (0.0%) |
| 1 or 2 Children | 0 (0.0%) | 47 (28.0%) |
| 3 or 4 Children | 0 (0.0%) | 0 (0.0%) |
| 5 or more Children | 0 (0.0%) | 0 (0.0%) |
| Total | 0 (0.0%) | 47 (24.5%) |
Income Below Poverty Among Married-Couple vs Single-Parent Households in De Motte
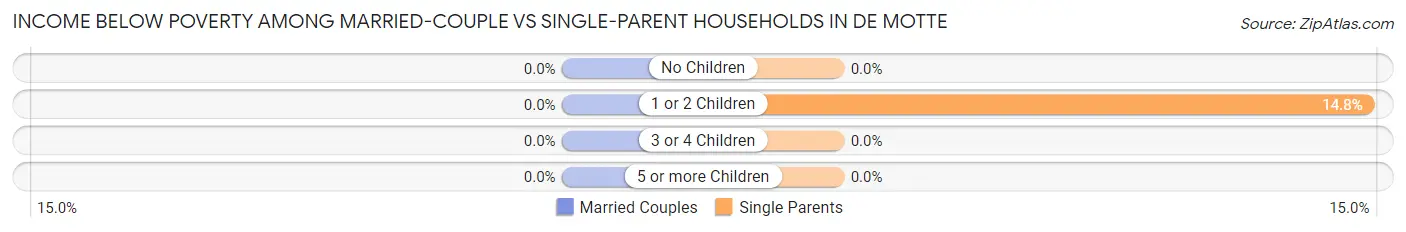
| Children | Married-Couple Families | Single-Parent Households |
| No Children | 0 (0.0%) | 0 (0.0%) |
| 1 or 2 Children | 0 (0.0%) | 47 (14.8%) |
| 3 or 4 Children | 0 (0.0%) | 0 (0.0%) |
| 5 or more Children | 0 (0.0%) | 0 (0.0%) |
| Total | 0 (0.0%) | 47 (12.8%) |
Employment Characteristics in De Motte
Employment by Class of Employer in De Motte
Among the 1,606 employed individuals in De Motte, private company employees (1,256 | 78.2%), not-for-profit organizations (115 | 7.2%), and state government employees (93 | 5.8%) make up the most common classes of employment.
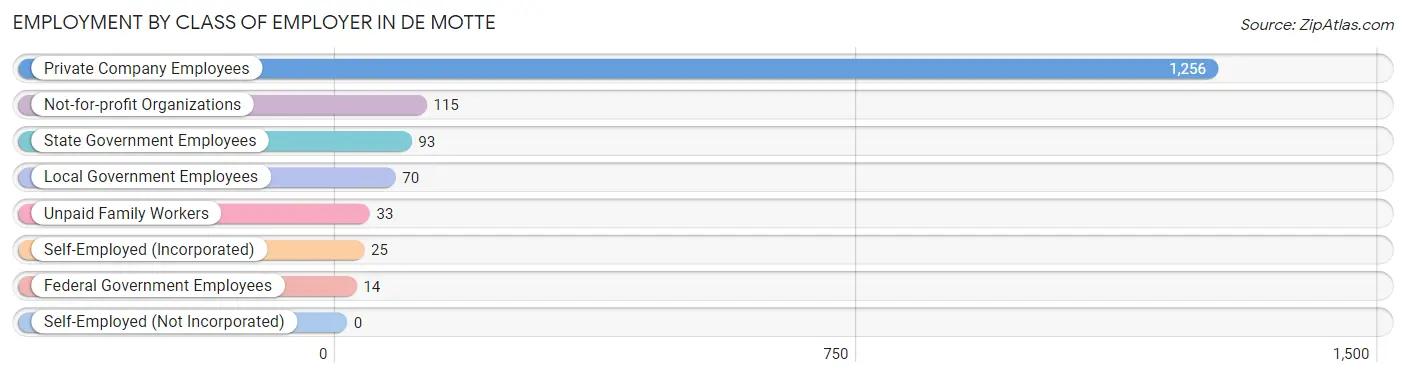
| Employer Class | # Employees | % Employees |
| Private Company Employees | 1,256 | 78.2% |
| Self-Employed (Incorporated) | 25 | 1.6% |
| Self-Employed (Not Incorporated) | 0 | 0.0% |
| Not-for-profit Organizations | 115 | 7.2% |
| Local Government Employees | 70 | 4.4% |
| State Government Employees | 93 | 5.8% |
| Federal Government Employees | 14 | 0.9% |
| Unpaid Family Workers | 33 | 2.1% |
| Total | 1,606 | 100.0% |
Employment Status by Age in De Motte
According to the labor force statistics for De Motte, out of the total population over 16 years of age (3,154), 52.3% or 1,650 individuals are in the labor force, with 1.1% or 18 of them unemployed. The age group with the highest labor force participation rate is 30 to 34 years, with 100.0% or 244 individuals in the labor force. Within the labor force, the 16 to 19 years age range has the highest percentage of unemployed individuals, with 100.0% or 18 of them being unemployed.
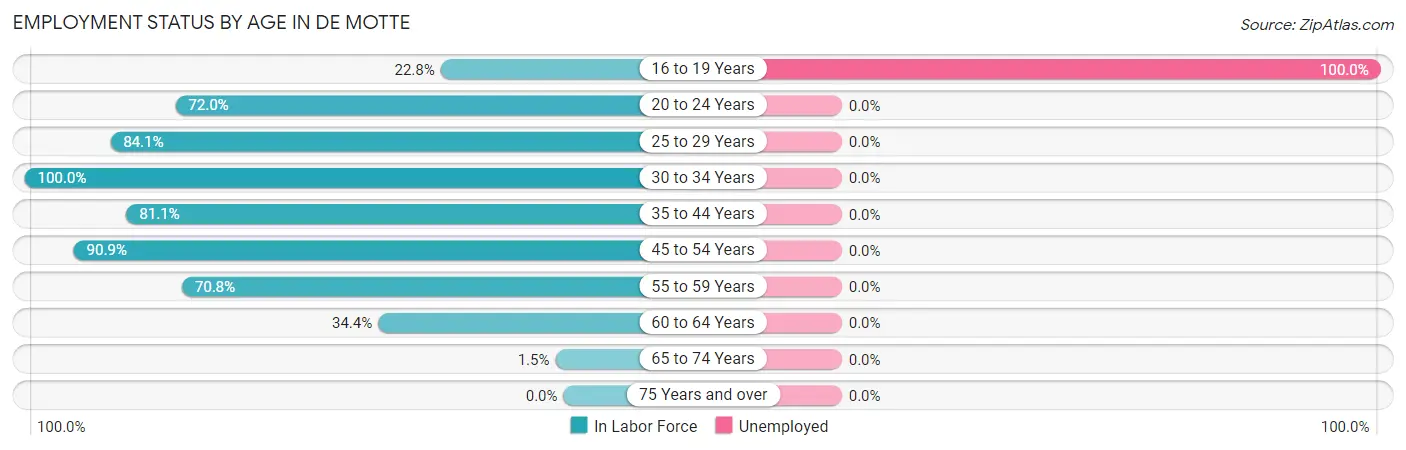
| Age Bracket | In Labor Force | Unemployed |
| 16 to 19 Years | 18 (22.8%) | 18 (100.0%) |
| 20 to 24 Years | 67 (72.0%) | 0 (0.0%) |
| 25 to 29 Years | 313 (84.1%) | 0 (0.0%) |
| 30 to 34 Years | 244 (100.0%) | 0 (0.0%) |
| 35 to 44 Years | 432 (81.1%) | 0 (0.0%) |
| 45 to 54 Years | 241 (90.9%) | 0 (0.0%) |
| 55 to 59 Years | 230 (70.8%) | 0 (0.0%) |
| 60 to 64 Years | 96 (34.4%) | 0 (0.0%) |
| 65 to 74 Years | 7 (1.5%) | 0 (0.0%) |
| 75 Years and over | 0 (0.0%) | 0 (0.0%) |
| Total | 1,650 (52.3%) | 18 (1.1%) |
Employment Status by Educational Attainment in De Motte
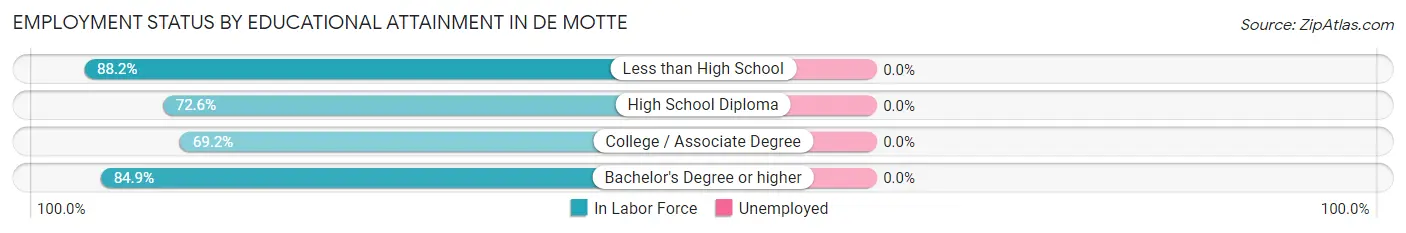
| Educational Attainment | In Labor Force | Unemployed |
| Less than High School | 112 (88.2%) | 0 (0.0%) |
| High School Diploma | 443 (72.6%) | 0 (0.0%) |
| College / Associate Degree | 379 (69.2%) | 0 (0.0%) |
| Bachelor's Degree or higher | 622 (84.9%) | 0 (0.0%) |
| Total | 1,556 (77.1%) | 0 (0.0%) |
Employment Occupations by Sex in De Motte
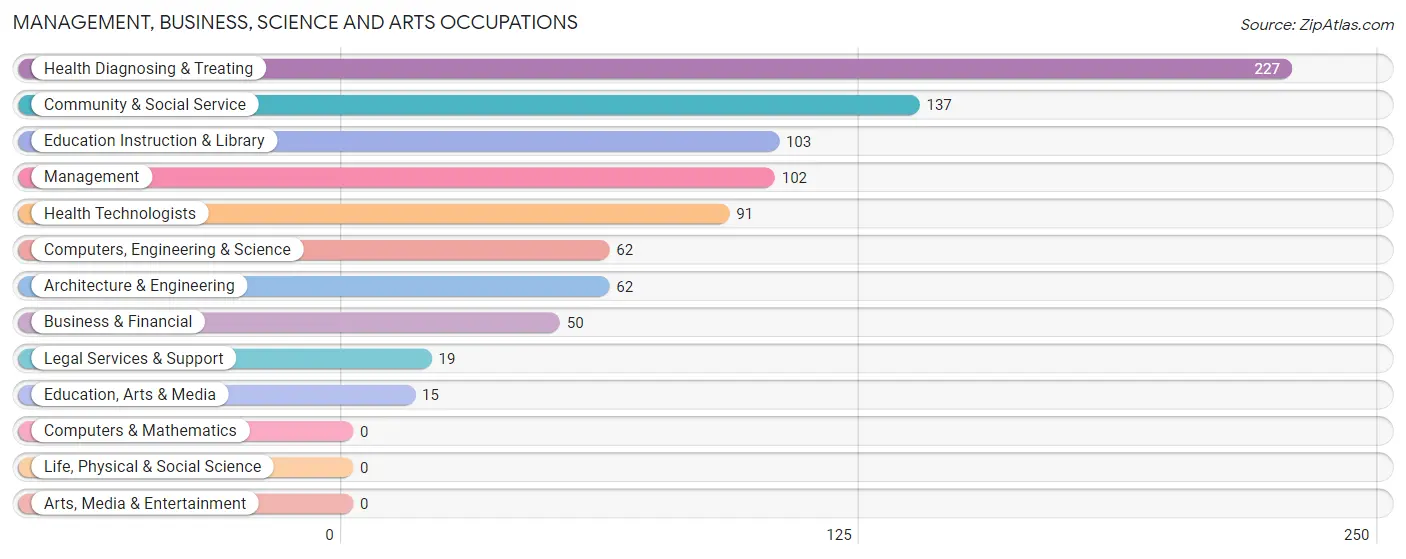
Management, Business, Science and Arts Occupations
The most common Management, Business, Science and Arts occupations in De Motte are Health Diagnosing & Treating (227 | 14.1%), Community & Social Service (137 | 8.5%), Education Instruction & Library (103 | 6.4%), Management (102 | 6.3%), and Health Technologists (91 | 5.6%).
Management, Business, Science and Arts Occupations by Sex
Within the Management, Business, Science and Arts occupations in De Motte, the most male-oriented occupations are Computers, Engineering & Science (100.0%), Architecture & Engineering (100.0%), and Education, Arts & Media (100.0%), while the most female-oriented occupations are Legal Services & Support (100.0%), Health Diagnosing & Treating (100.0%), and Health Technologists (100.0%).
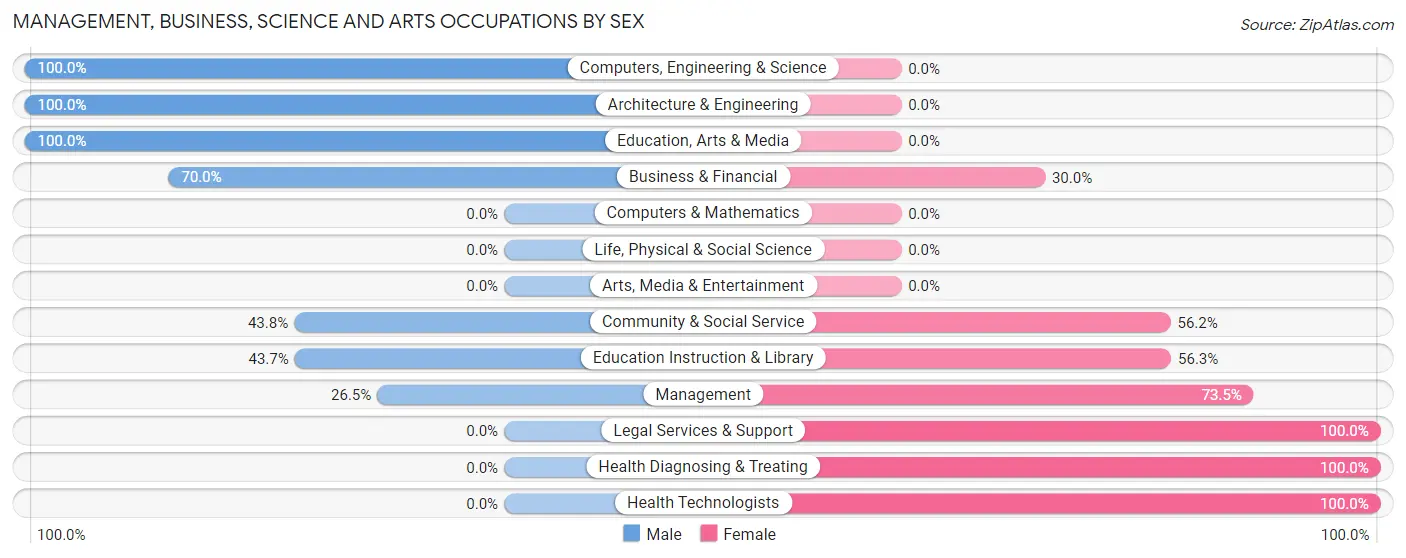
| Occupation | Male | Female |
| Management | 27 (26.5%) | 75 (73.5%) |
| Business & Financial | 35 (70.0%) | 15 (30.0%) |
| Computers, Engineering & Science | 62 (100.0%) | 0 (0.0%) |
| Computers & Mathematics | 0 (0.0%) | 0 (0.0%) |
| Architecture & Engineering | 62 (100.0%) | 0 (0.0%) |
| Life, Physical & Social Science | 0 (0.0%) | 0 (0.0%) |
| Community & Social Service | 60 (43.8%) | 77 (56.2%) |
| Education, Arts & Media | 15 (100.0%) | 0 (0.0%) |
| Legal Services & Support | 0 (0.0%) | 19 (100.0%) |
| Education Instruction & Library | 45 (43.7%) | 58 (56.3%) |
| Arts, Media & Entertainment | 0 (0.0%) | 0 (0.0%) |
| Health Diagnosing & Treating | 0 (0.0%) | 227 (100.0%) |
| Health Technologists | 0 (0.0%) | 91 (100.0%) |
| Total (Category) | 184 (31.8%) | 394 (68.2%) |
| Total (Overall) | 735 (45.5%) | 881 (54.5%) |
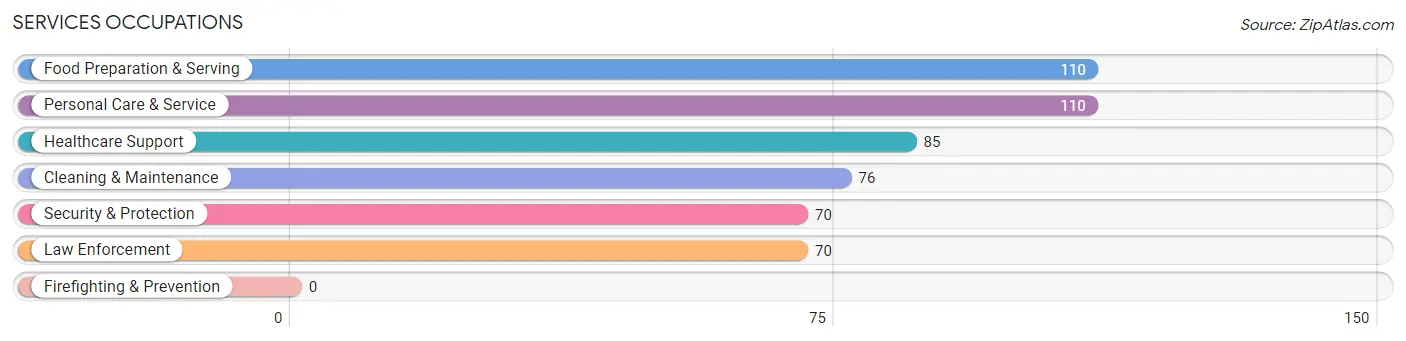
Services Occupations
The most common Services occupations in De Motte are Food Preparation & Serving (110 | 6.8%), Personal Care & Service (110 | 6.8%), Healthcare Support (85 | 5.3%), Cleaning & Maintenance (76 | 4.7%), and Security & Protection (70 | 4.3%).
Services Occupations by Sex
Within the Services occupations in De Motte, the most male-oriented occupations are Personal Care & Service (66.4%), Security & Protection (42.9%), and Law Enforcement (42.9%), while the most female-oriented occupations are Healthcare Support (100.0%), Food Preparation & Serving (100.0%), and Cleaning & Maintenance (100.0%).
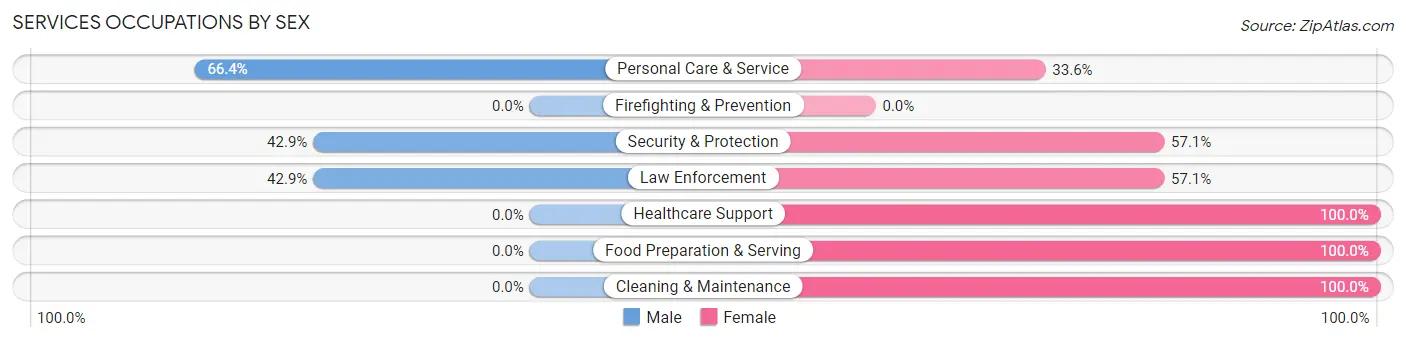
| Occupation | Male | Female |
| Healthcare Support | 0 (0.0%) | 85 (100.0%) |
| Security & Protection | 30 (42.9%) | 40 (57.1%) |
| Firefighting & Prevention | 0 (0.0%) | 0 (0.0%) |
| Law Enforcement | 30 (42.9%) | 40 (57.1%) |
| Food Preparation & Serving | 0 (0.0%) | 110 (100.0%) |
| Cleaning & Maintenance | 0 (0.0%) | 76 (100.0%) |
| Personal Care & Service | 73 (66.4%) | 37 (33.6%) |
| Total (Category) | 103 (22.8%) | 348 (77.2%) |
| Total (Overall) | 735 (45.5%) | 881 (54.5%) |
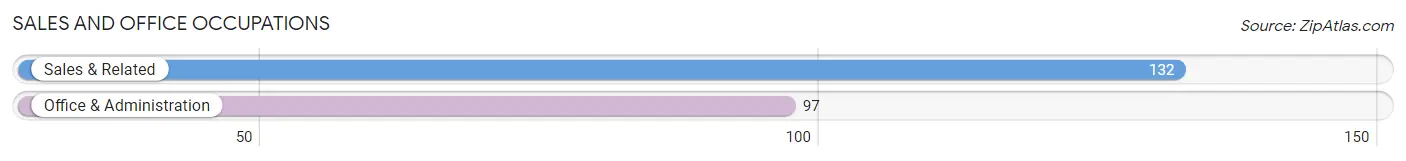
Sales and Office Occupations
The most common Sales and Office occupations in De Motte are Sales & Related (132 | 8.2%), and Office & Administration (97 | 6.0%).
Sales and Office Occupations by Sex
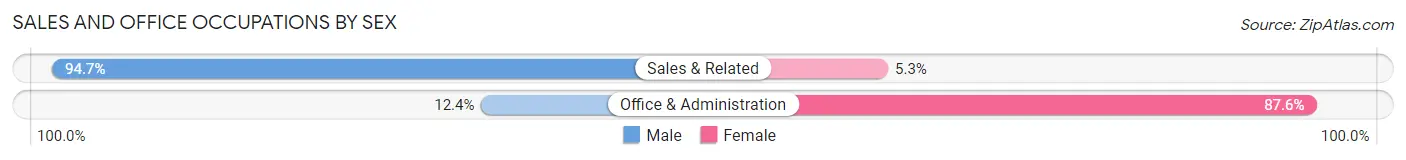
| Occupation | Male | Female |
| Sales & Related | 125 (94.7%) | 7 (5.3%) |
| Office & Administration | 12 (12.4%) | 85 (87.6%) |
| Total (Category) | 137 (59.8%) | 92 (40.2%) |
| Total (Overall) | 735 (45.5%) | 881 (54.5%) |
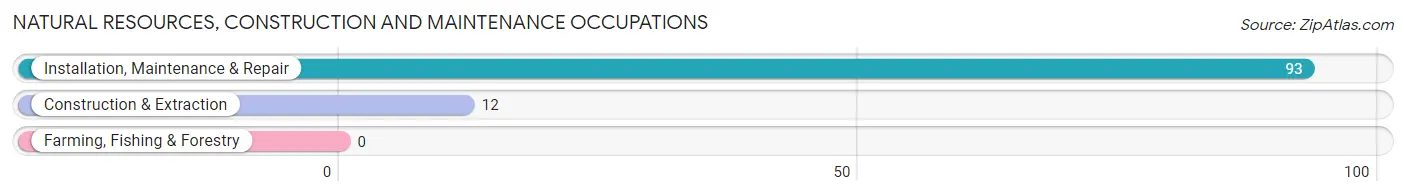
Natural Resources, Construction and Maintenance Occupations
The most common Natural Resources, Construction and Maintenance occupations in De Motte are Installation, Maintenance & Repair (93 | 5.8%), and Construction & Extraction (12 | 0.7%).
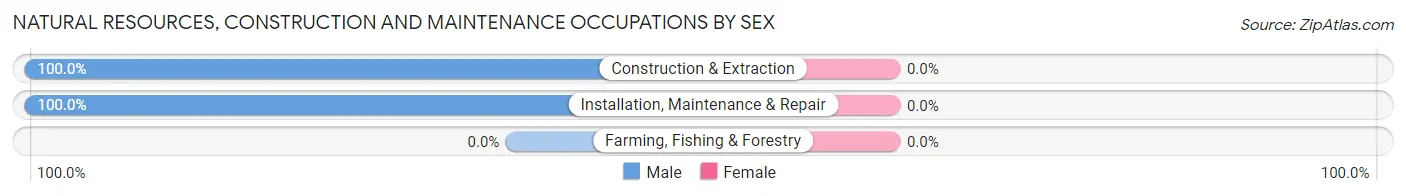
Natural Resources, Construction and Maintenance Occupations by Sex
| Occupation | Male | Female |
| Farming, Fishing & Forestry | 0 (0.0%) | 0 (0.0%) |
| Construction & Extraction | 12 (100.0%) | 0 (0.0%) |
| Installation, Maintenance & Repair | 93 (100.0%) | 0 (0.0%) |
| Total (Category) | 105 (100.0%) | 0 (0.0%) |
| Total (Overall) | 735 (45.5%) | 881 (54.5%) |
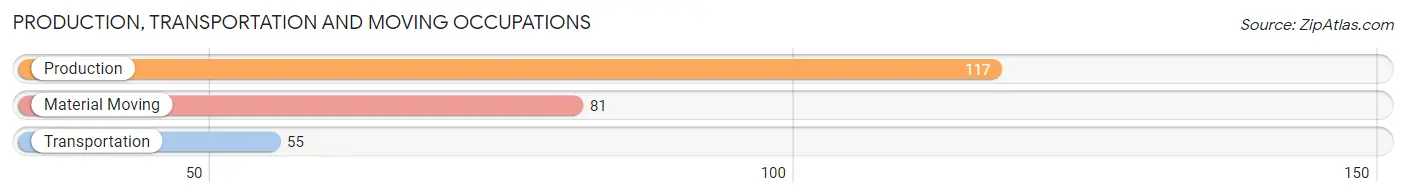
Production, Transportation and Moving Occupations
The most common Production, Transportation and Moving occupations in De Motte are Production (117 | 7.2%), Material Moving (81 | 5.0%), and Transportation (55 | 3.4%).
Production, Transportation and Moving Occupations by Sex
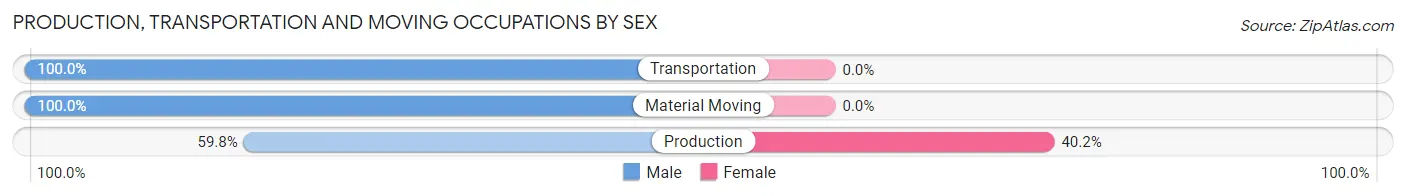
| Occupation | Male | Female |
| Production | 70 (59.8%) | 47 (40.2%) |
| Transportation | 55 (100.0%) | 0 (0.0%) |
| Material Moving | 81 (100.0%) | 0 (0.0%) |
| Total (Category) | 206 (81.4%) | 47 (18.6%) |
| Total (Overall) | 735 (45.5%) | 881 (54.5%) |
Employment Industries by Sex in De Motte
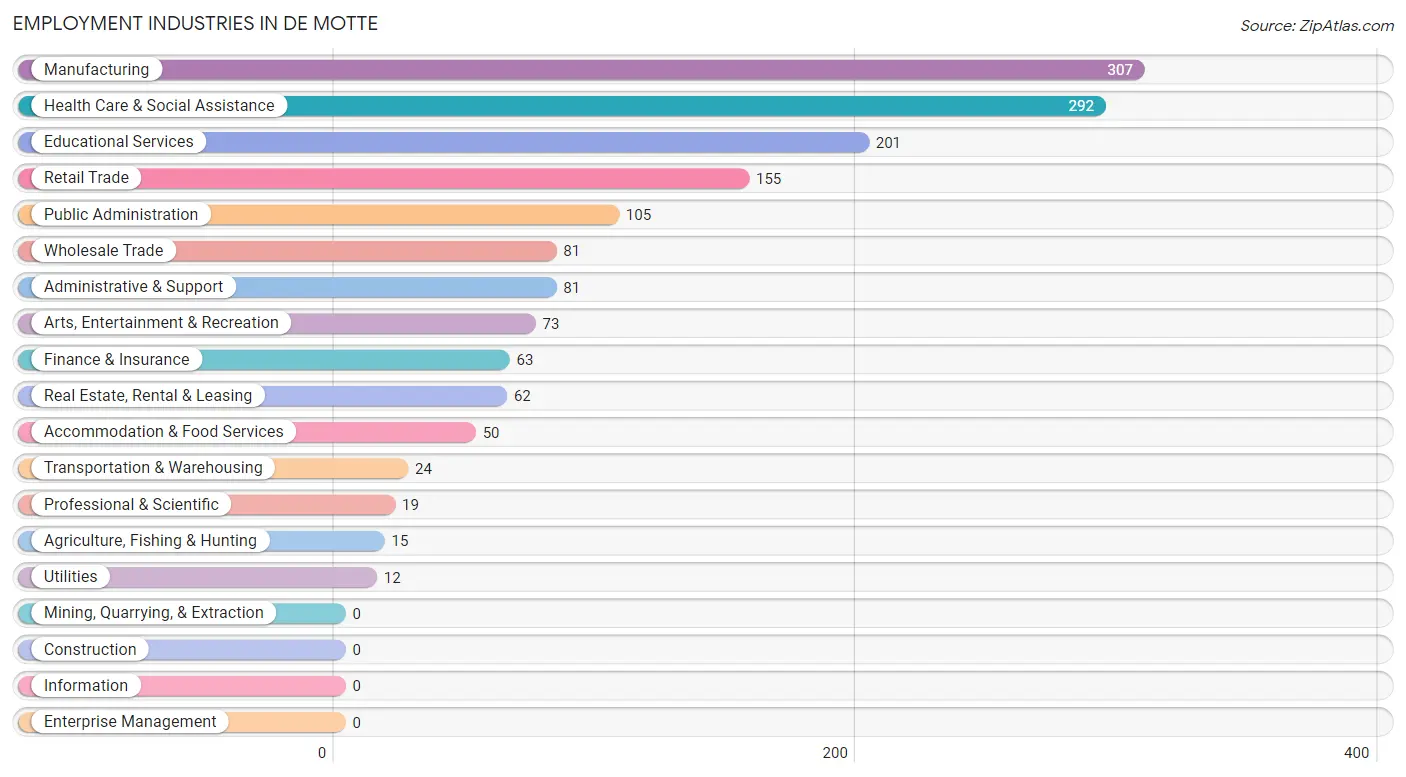
Employment Industries in De Motte
The major employment industries in De Motte include Manufacturing (307 | 19.0%), Health Care & Social Assistance (292 | 18.1%), Educational Services (201 | 12.4%), Retail Trade (155 | 9.6%), and Public Administration (105 | 6.5%).
Employment Industries by Sex in De Motte
The De Motte industries that see more men than women are Agriculture, Fishing & Hunting (100.0%), Wholesale Trade (100.0%), and Transportation & Warehousing (100.0%), whereas the industries that tend to have a higher number of women are Finance & Insurance (100.0%), Professional & Scientific (100.0%), and Administrative & Support (100.0%).
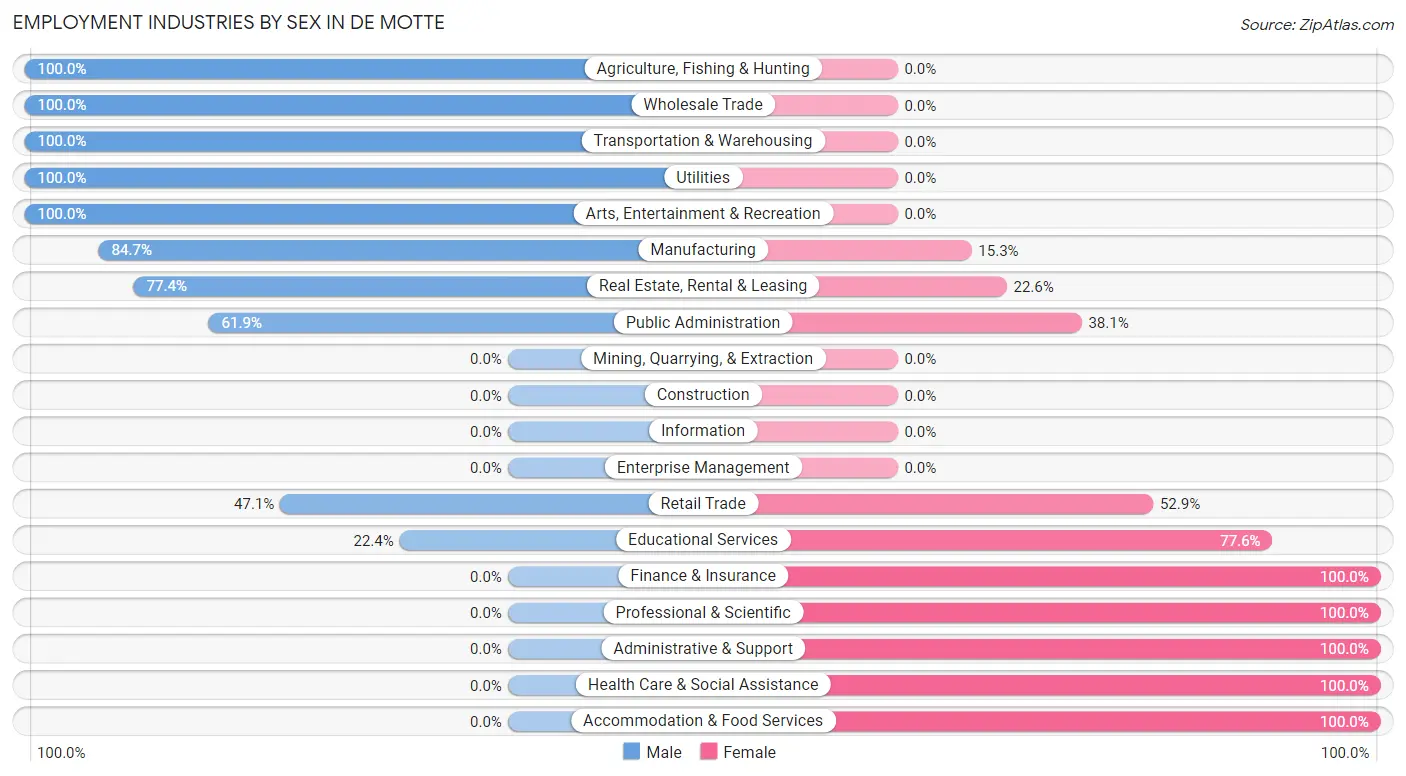
| Industry | Male | Female |
| Agriculture, Fishing & Hunting | 15 (100.0%) | 0 (0.0%) |
| Mining, Quarrying, & Extraction | 0 (0.0%) | 0 (0.0%) |
| Construction | 0 (0.0%) | 0 (0.0%) |
| Manufacturing | 260 (84.7%) | 47 (15.3%) |
| Wholesale Trade | 81 (100.0%) | 0 (0.0%) |
| Retail Trade | 73 (47.1%) | 82 (52.9%) |
| Transportation & Warehousing | 24 (100.0%) | 0 (0.0%) |
| Utilities | 12 (100.0%) | 0 (0.0%) |
| Information | 0 (0.0%) | 0 (0.0%) |
| Finance & Insurance | 0 (0.0%) | 63 (100.0%) |
| Real Estate, Rental & Leasing | 48 (77.4%) | 14 (22.6%) |
| Professional & Scientific | 0 (0.0%) | 19 (100.0%) |
| Enterprise Management | 0 (0.0%) | 0 (0.0%) |
| Administrative & Support | 0 (0.0%) | 81 (100.0%) |
| Educational Services | 45 (22.4%) | 156 (77.6%) |
| Health Care & Social Assistance | 0 (0.0%) | 292 (100.0%) |
| Arts, Entertainment & Recreation | 73 (100.0%) | 0 (0.0%) |
| Accommodation & Food Services | 0 (0.0%) | 50 (100.0%) |
| Public Administration | 65 (61.9%) | 40 (38.1%) |
| Total | 735 (45.5%) | 881 (54.5%) |
Education in De Motte
School Enrollment in De Motte
The most common levels of schooling among the 764 students in De Motte are elementary school (284 | 37.2%), middle school (245 | 32.1%), and high school (184 | 24.1%).
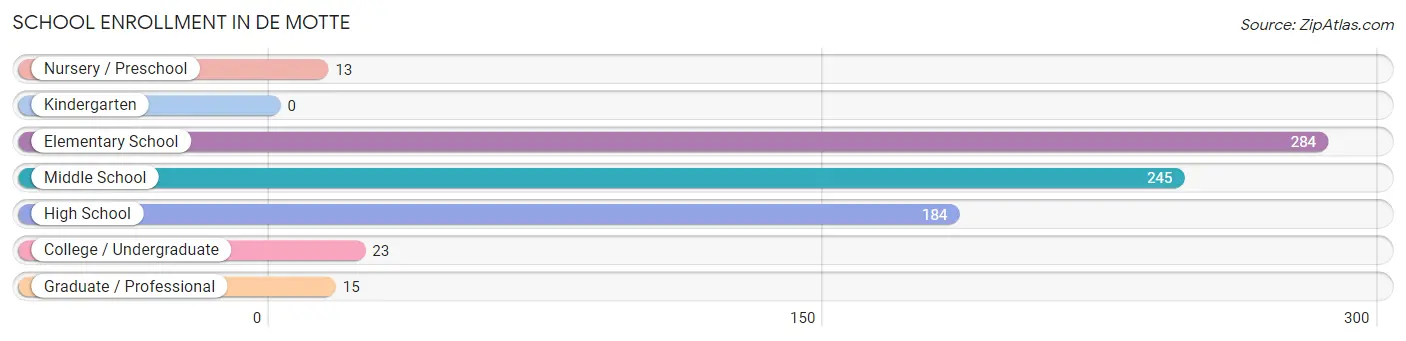
| School Level | # Students | % Students |
| Nursery / Preschool | 13 | 1.7% |
| Kindergarten | 0 | 0.0% |
| Elementary School | 284 | 37.2% |
| Middle School | 245 | 32.1% |
| High School | 184 | 24.1% |
| College / Undergraduate | 23 | 3.0% |
| Graduate / Professional | 15 | 2.0% |
| Total | 764 | 100.0% |
School Enrollment by Age by Funding Source in De Motte
Out of a total of 764 students who are enrolled in schools in De Motte, 155 (20.3%) attend a private institution, while the remaining 609 (79.7%) are enrolled in public schools. The age group of 10 to 14 year olds has the highest likelihood of being enrolled in private schools, with 77 (41.4% in the age bracket) enrolled. Conversely, the age group of 15 to 17 year olds has the lowest likelihood of being enrolled in a private school, with 225 (100.0% in the age bracket) attending a public institution.
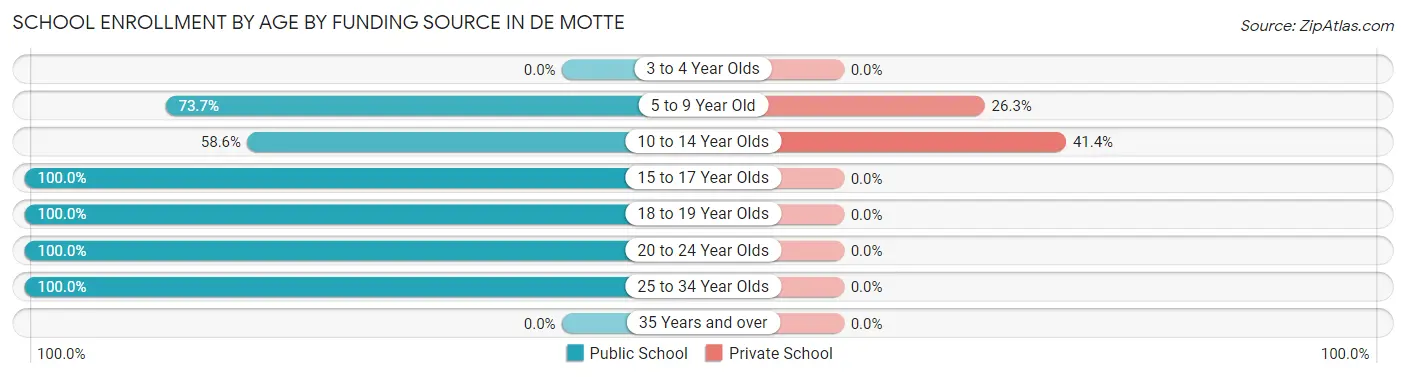
| Age Bracket | Public School | Private School |
| 3 to 4 Year Olds | 0 (0.0%) | 0 (0.0%) |
| 5 to 9 Year Old | 219 (73.7%) | 78 (26.3%) |
| 10 to 14 Year Olds | 109 (58.6%) | 77 (41.4%) |
| 15 to 17 Year Olds | 225 (100.0%) | 0 (0.0%) |
| 18 to 19 Year Olds | 18 (100.0%) | 0 (0.0%) |
| 20 to 24 Year Olds | 23 (100.0%) | 0 (0.0%) |
| 25 to 34 Year Olds | 15 (100.0%) | 0 (0.0%) |
| 35 Years and over | 0 (0.0%) | 0 (0.0%) |
| Total | 609 (79.7%) | 155 (20.3%) |
Educational Attainment by Field of Study in De Motte
Business (149 | 17.2%), education (137 | 15.9%), computers & mathematics (81 | 9.4%), physical & health sciences (81 | 9.4%), and arts & humanities (68 | 7.9%) are the most common fields of study among 864 individuals in De Motte who have obtained a bachelor's degree or higher.
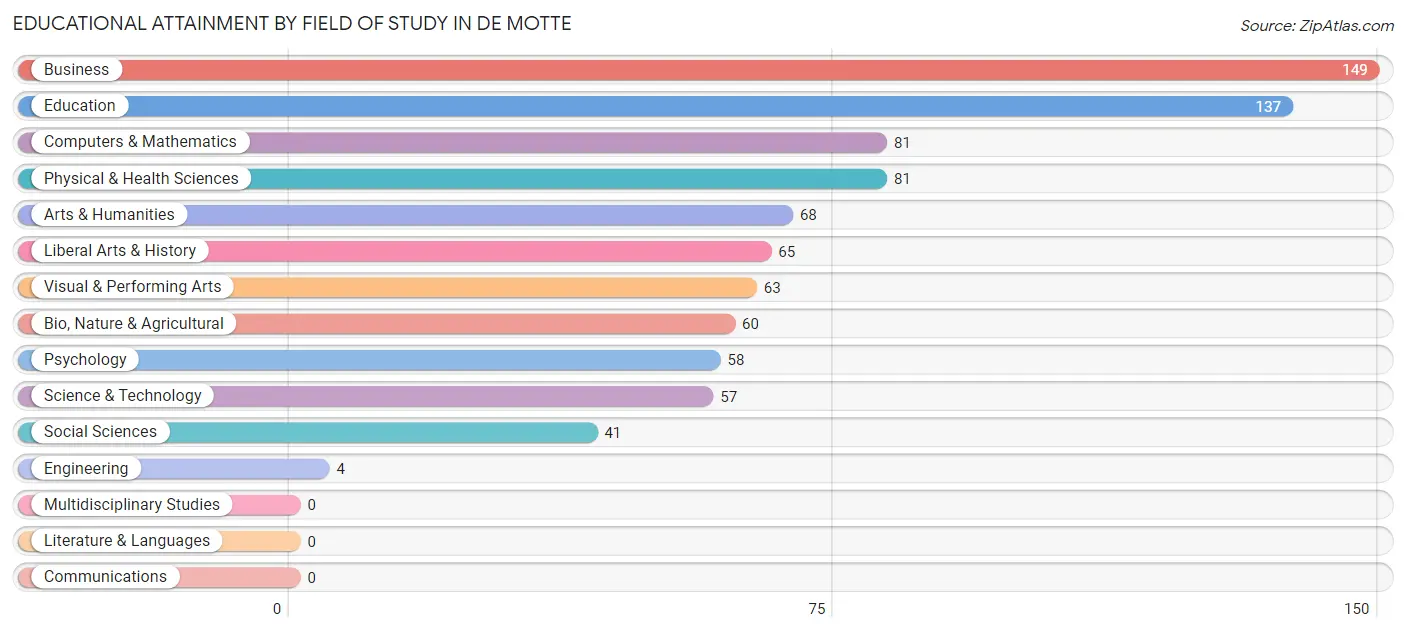
| Field of Study | # Graduates | % Graduates |
| Computers & Mathematics | 81 | 9.4% |
| Bio, Nature & Agricultural | 60 | 6.9% |
| Physical & Health Sciences | 81 | 9.4% |
| Psychology | 58 | 6.7% |
| Social Sciences | 41 | 4.8% |
| Engineering | 4 | 0.5% |
| Multidisciplinary Studies | 0 | 0.0% |
| Science & Technology | 57 | 6.6% |
| Business | 149 | 17.2% |
| Education | 137 | 15.9% |
| Literature & Languages | 0 | 0.0% |
| Liberal Arts & History | 65 | 7.5% |
| Visual & Performing Arts | 63 | 7.3% |
| Communications | 0 | 0.0% |
| Arts & Humanities | 68 | 7.9% |
| Total | 864 | 100.0% |
Transportation & Commute in De Motte
Vehicle Availability by Sex in De Motte
The most prevalent vehicle ownership categories in De Motte are males with 2 vehicles (430, accounting for 59.3%) and females with 2 vehicles (316, making up 48.8%).
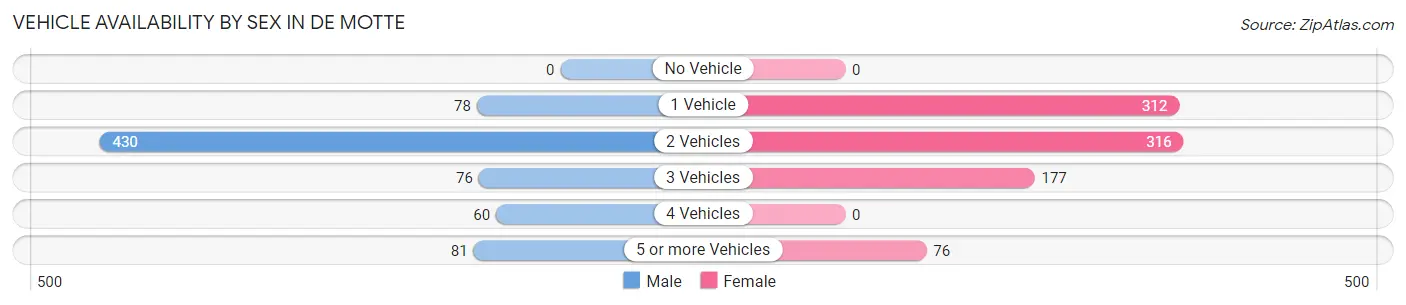
| Vehicles Available | Male | Female |
| No Vehicle | 0 (0.0%) | 0 (0.0%) |
| 1 Vehicle | 78 (10.8%) | 312 (35.4%) |
| 2 Vehicles | 430 (59.3%) | 316 (35.9%) |
| 3 Vehicles | 76 (10.5%) | 177 (20.1%) |
| 4 Vehicles | 60 (8.3%) | 0 (0.0%) |
| 5 or more Vehicles | 81 (11.2%) | 76 (8.6%) |
| Total | 725 (100.0%) | 881 (100.0%) |
Commute Time in De Motte
The most frequently occuring commute durations in De Motte are 30 to 34 minutes (327 commuters, 21.7%), 5 to 9 minutes (312 commuters, 20.7%), and 40 to 44 minutes (153 commuters, 10.2%).
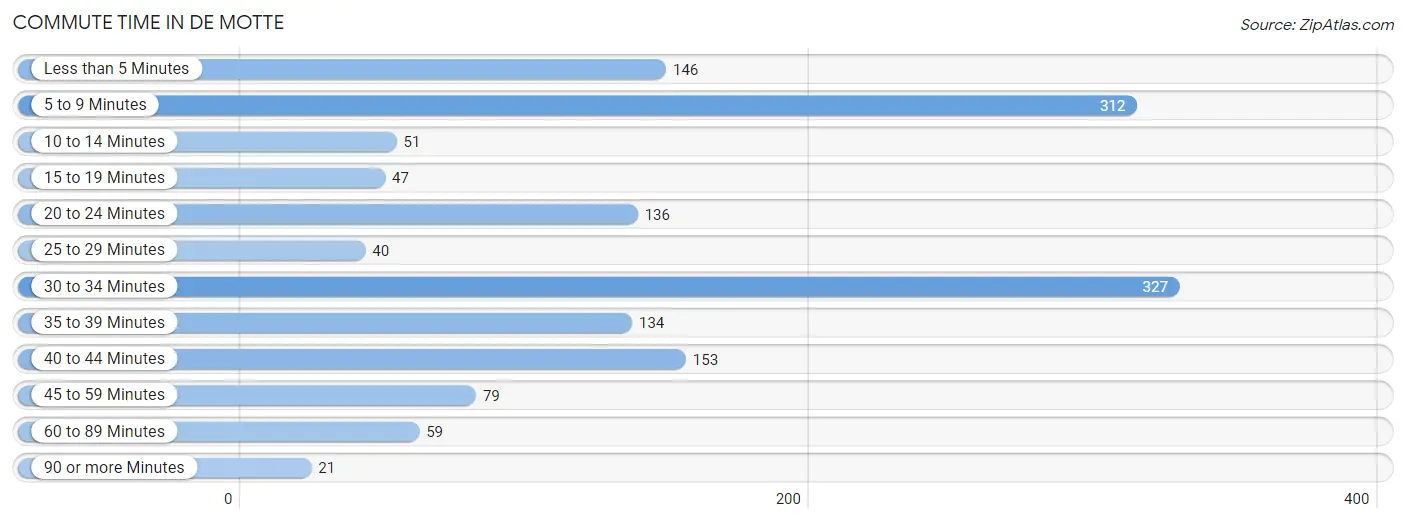
| Commute Time | # Commuters | % Commuters |
| Less than 5 Minutes | 146 | 9.7% |
| 5 to 9 Minutes | 312 | 20.7% |
| 10 to 14 Minutes | 51 | 3.4% |
| 15 to 19 Minutes | 47 | 3.1% |
| 20 to 24 Minutes | 136 | 9.0% |
| 25 to 29 Minutes | 40 | 2.7% |
| 30 to 34 Minutes | 327 | 21.7% |
| 35 to 39 Minutes | 134 | 8.9% |
| 40 to 44 Minutes | 153 | 10.2% |
| 45 to 59 Minutes | 79 | 5.2% |
| 60 to 89 Minutes | 59 | 3.9% |
| 90 or more Minutes | 21 | 1.4% |
Commute Time by Sex in De Motte
The most common commute times in De Motte are 40 to 44 minutes (153 commuters, 21.1%) for males and 5 to 9 minutes (227 commuters, 29.1%) for females.
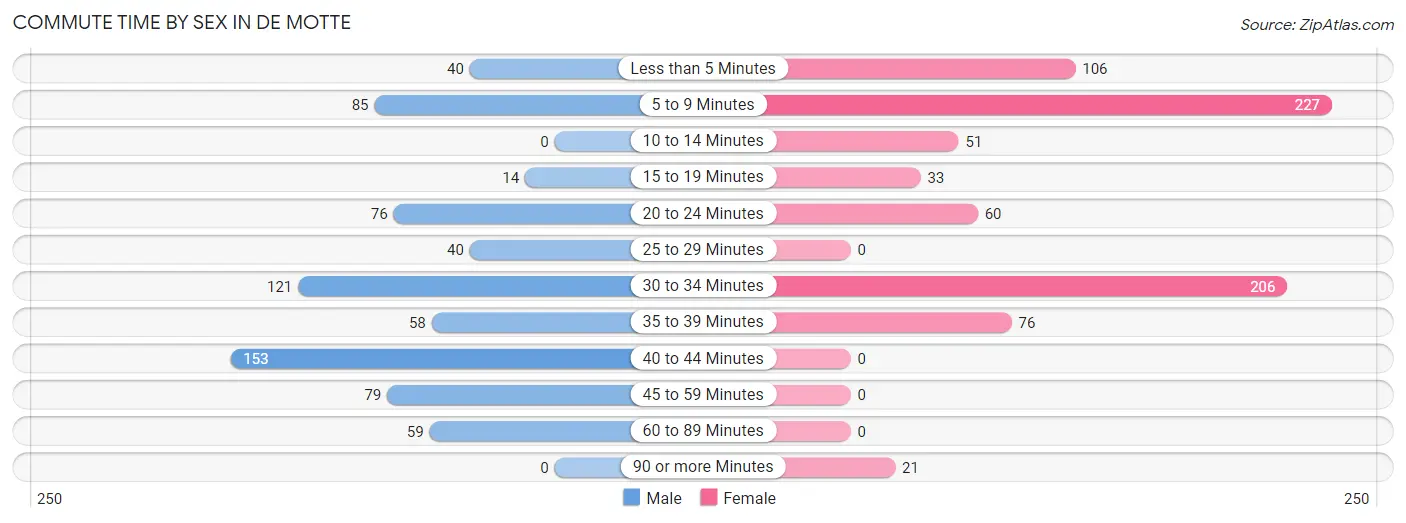
| Commute Time | Male | Female |
| Less than 5 Minutes | 40 (5.5%) | 106 (13.6%) |
| 5 to 9 Minutes | 85 (11.7%) | 227 (29.1%) |
| 10 to 14 Minutes | 0 (0.0%) | 51 (6.5%) |
| 15 to 19 Minutes | 14 (1.9%) | 33 (4.2%) |
| 20 to 24 Minutes | 76 (10.5%) | 60 (7.7%) |
| 25 to 29 Minutes | 40 (5.5%) | 0 (0.0%) |
| 30 to 34 Minutes | 121 (16.7%) | 206 (26.4%) |
| 35 to 39 Minutes | 58 (8.0%) | 76 (9.7%) |
| 40 to 44 Minutes | 153 (21.1%) | 0 (0.0%) |
| 45 to 59 Minutes | 79 (10.9%) | 0 (0.0%) |
| 60 to 89 Minutes | 59 (8.1%) | 0 (0.0%) |
| 90 or more Minutes | 0 (0.0%) | 21 (2.7%) |
Time of Departure to Work by Sex in De Motte
The most frequent times of departure to work in De Motte are 12:00 AM to 4:59 AM (165, 22.8%) for males and 8:00 AM to 8:29 AM (122, 15.6%) for females.
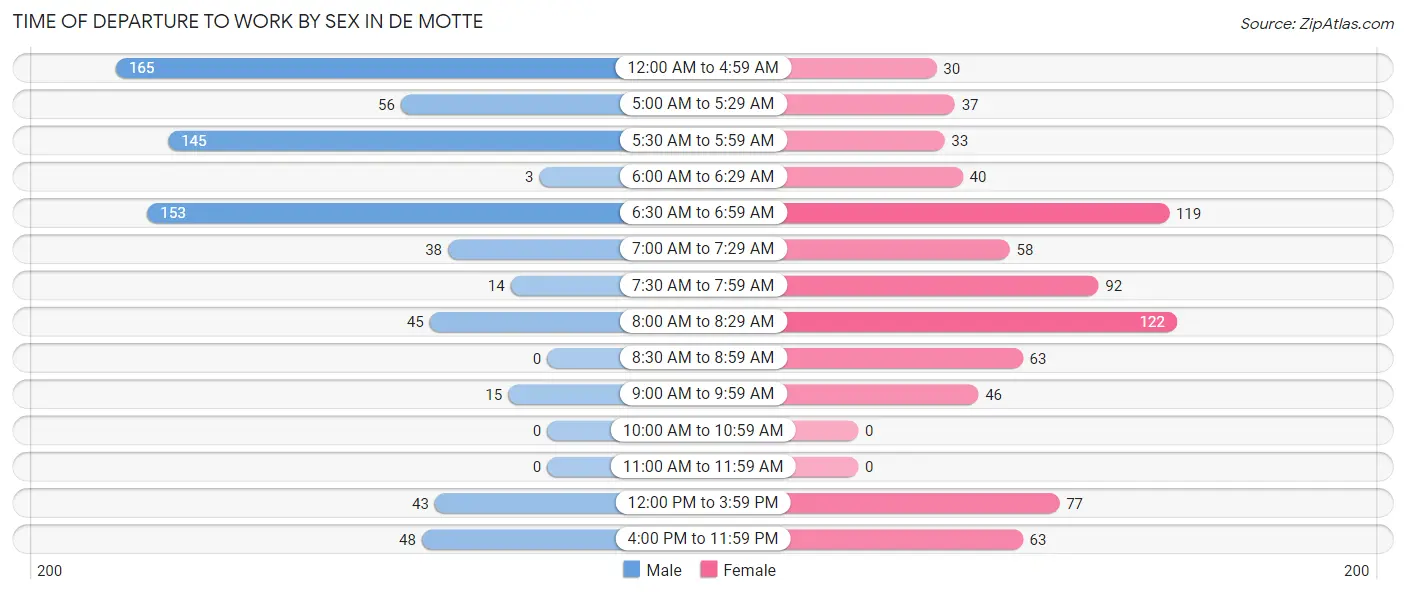
| Time of Departure | Male | Female |
| 12:00 AM to 4:59 AM | 165 (22.8%) | 30 (3.8%) |
| 5:00 AM to 5:29 AM | 56 (7.7%) | 37 (4.7%) |
| 5:30 AM to 5:59 AM | 145 (20.0%) | 33 (4.2%) |
| 6:00 AM to 6:29 AM | 3 (0.4%) | 40 (5.1%) |
| 6:30 AM to 6:59 AM | 153 (21.1%) | 119 (15.3%) |
| 7:00 AM to 7:29 AM | 38 (5.2%) | 58 (7.4%) |
| 7:30 AM to 7:59 AM | 14 (1.9%) | 92 (11.8%) |
| 8:00 AM to 8:29 AM | 45 (6.2%) | 122 (15.6%) |
| 8:30 AM to 8:59 AM | 0 (0.0%) | 63 (8.1%) |
| 9:00 AM to 9:59 AM | 15 (2.1%) | 46 (5.9%) |
| 10:00 AM to 10:59 AM | 0 (0.0%) | 0 (0.0%) |
| 11:00 AM to 11:59 AM | 0 (0.0%) | 0 (0.0%) |
| 12:00 PM to 3:59 PM | 43 (5.9%) | 77 (9.9%) |
| 4:00 PM to 11:59 PM | 48 (6.6%) | 63 (8.1%) |
| Total | 725 (100.0%) | 780 (100.0%) |
Housing Occupancy in De Motte
Occupancy by Ownership in De Motte
Of the total 1,938 dwellings in De Motte, owner-occupied units account for 1,407 (72.6%), while renter-occupied units make up 531 (27.4%).
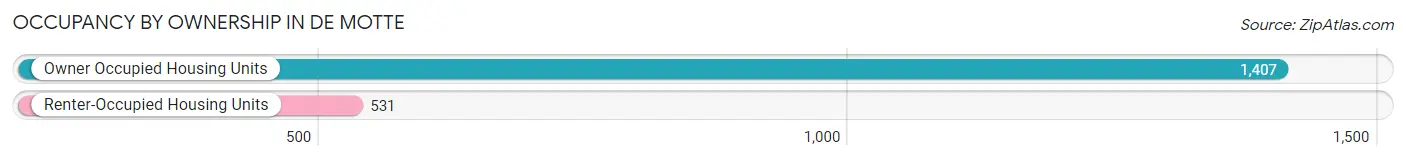
| Occupancy | # Housing Units | % Housing Units |
| Owner Occupied Housing Units | 1,407 | 72.6% |
| Renter-Occupied Housing Units | 531 | 27.4% |
| Total Occupied Housing Units | 1,938 | 100.0% |
Occupancy by Household Size in De Motte
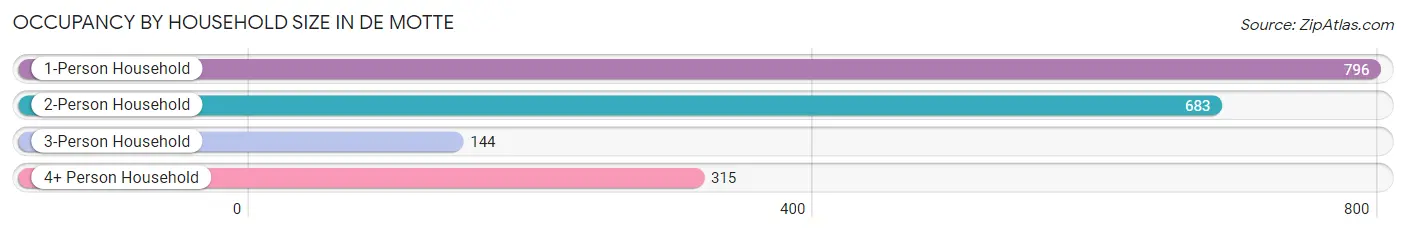
| Household Size | # Housing Units | % Housing Units |
| 1-Person Household | 796 | 41.1% |
| 2-Person Household | 683 | 35.2% |
| 3-Person Household | 144 | 7.4% |
| 4+ Person Household | 315 | 16.3% |
| Total Housing Units | 1,938 | 100.0% |
Occupancy by Ownership by Household Size in De Motte
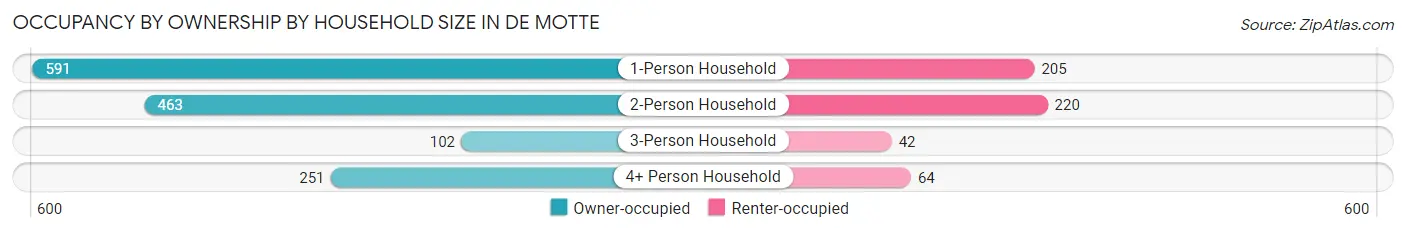
| Household Size | Owner-occupied | Renter-occupied |
| 1-Person Household | 591 (74.3%) | 205 (25.8%) |
| 2-Person Household | 463 (67.8%) | 220 (32.2%) |
| 3-Person Household | 102 (70.8%) | 42 (29.2%) |
| 4+ Person Household | 251 (79.7%) | 64 (20.3%) |
| Total Housing Units | 1,407 (72.6%) | 531 (27.4%) |
Occupancy by Educational Attainment in De Motte
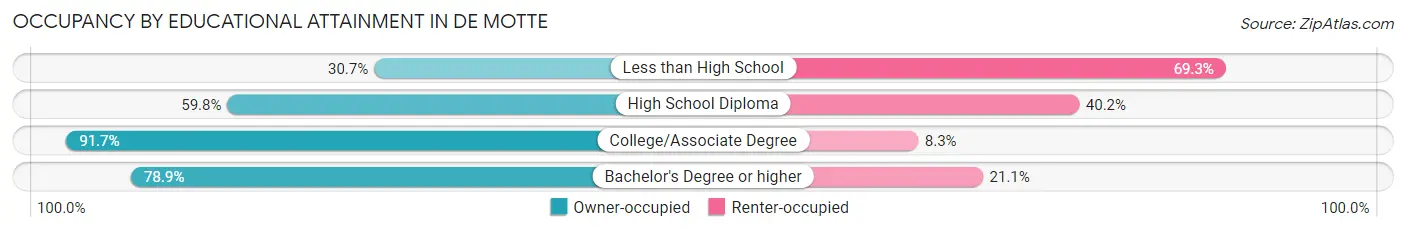
| Household Size | Owner-occupied | Renter-occupied |
| Less than High School | 39 (30.7%) | 88 (69.3%) |
| High School Diploma | 405 (59.8%) | 272 (40.2%) |
| College/Associate Degree | 488 (91.7%) | 44 (8.3%) |
| Bachelor's Degree or higher | 475 (78.9%) | 127 (21.1%) |
Occupancy by Age of Householder in De Motte
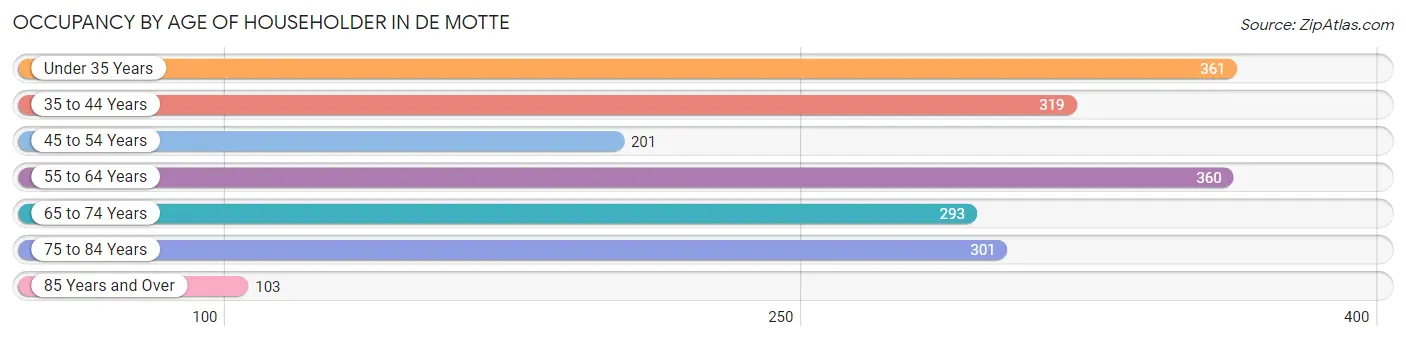
| Age Bracket | # Households | % Households |
| Under 35 Years | 361 | 18.6% |
| 35 to 44 Years | 319 | 16.5% |
| 45 to 54 Years | 201 | 10.4% |
| 55 to 64 Years | 360 | 18.6% |
| 65 to 74 Years | 293 | 15.1% |
| 75 to 84 Years | 301 | 15.5% |
| 85 Years and Over | 103 | 5.3% |
| Total | 1,938 | 100.0% |
Housing Finances in De Motte
Median Income by Occupancy in De Motte
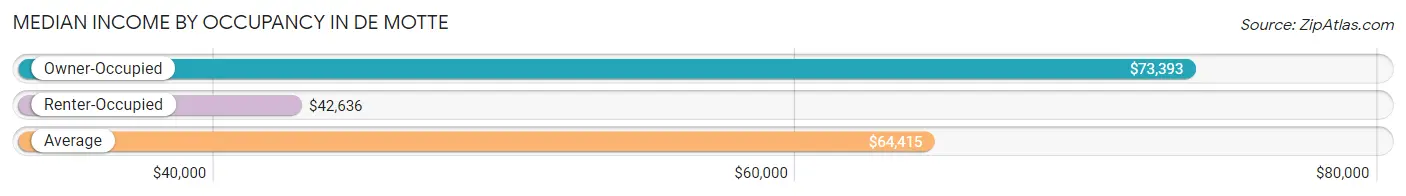
| Occupancy Type | # Households | Median Income |
| Owner-Occupied | 1,407 (72.6%) | $73,393 |
| Renter-Occupied | 531 (27.4%) | $42,636 |
| Average | 1,938 (100.0%) | $64,415 |
Occupancy by Householder Income Bracket in De Motte
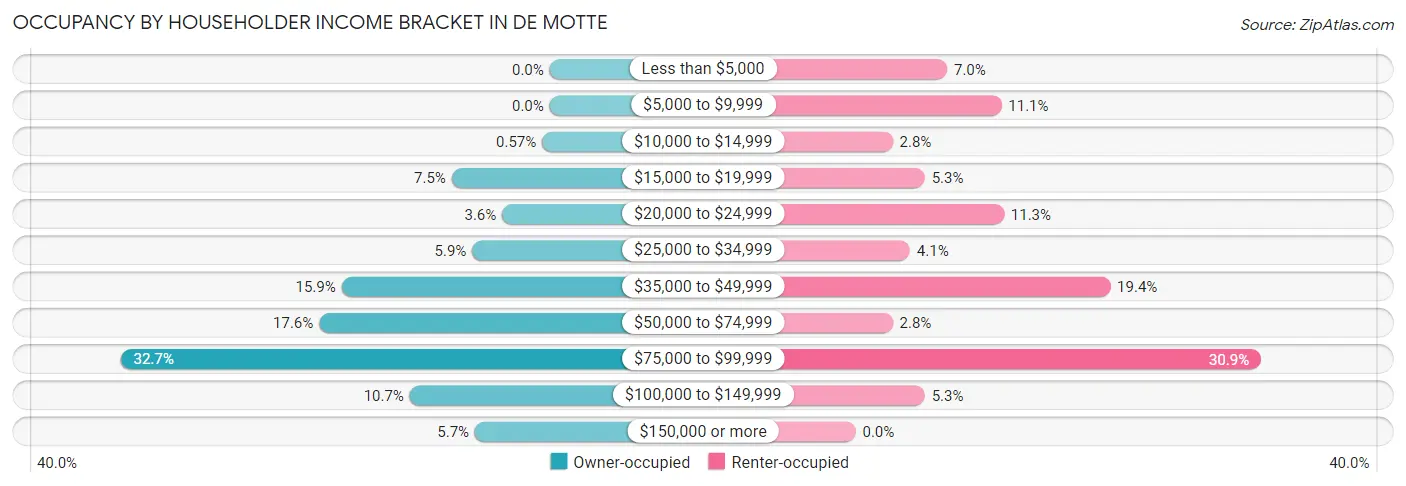
| Income Bracket | Owner-occupied | Renter-occupied |
| Less than $5,000 | 0 (0.0%) | 37 (7.0%) |
| $5,000 to $9,999 | 0 (0.0%) | 59 (11.1%) |
| $10,000 to $14,999 | 8 (0.6%) | 15 (2.8%) |
| $15,000 to $19,999 | 105 (7.5%) | 28 (5.3%) |
| $20,000 to $24,999 | 51 (3.6%) | 60 (11.3%) |
| $25,000 to $34,999 | 83 (5.9%) | 22 (4.1%) |
| $35,000 to $49,999 | 223 (15.9%) | 103 (19.4%) |
| $50,000 to $74,999 | 247 (17.6%) | 15 (2.8%) |
| $75,000 to $99,999 | 460 (32.7%) | 164 (30.9%) |
| $100,000 to $149,999 | 150 (10.7%) | 28 (5.3%) |
| $150,000 or more | 80 (5.7%) | 0 (0.0%) |
| Total | 1,407 (100.0%) | 531 (100.0%) |
Monthly Housing Cost Tiers in De Motte
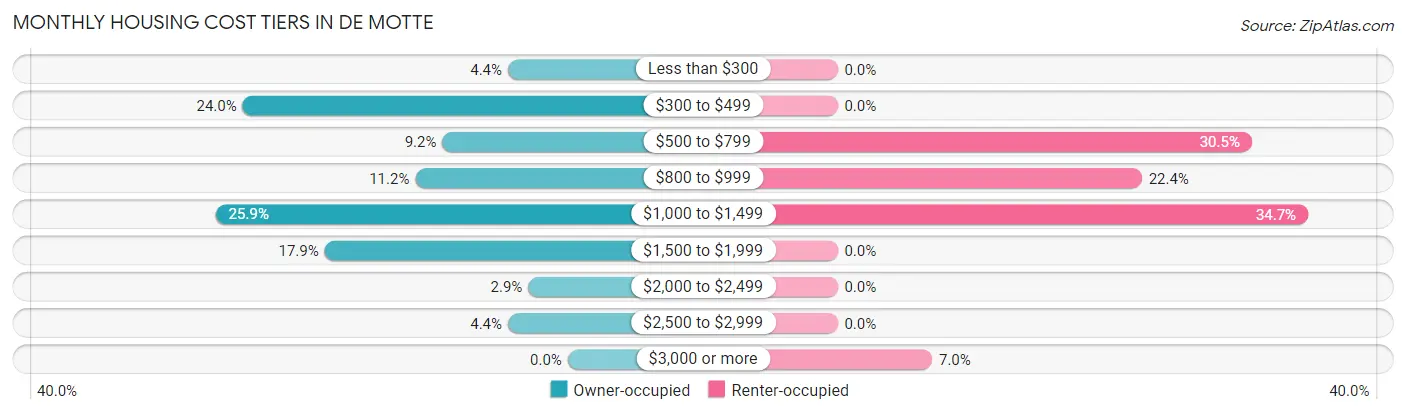
| Monthly Cost | Owner-occupied | Renter-occupied |
| Less than $300 | 62 (4.4%) | 0 (0.0%) |
| $300 to $499 | 337 (23.9%) | 0 (0.0%) |
| $500 to $799 | 130 (9.2%) | 162 (30.5%) |
| $800 to $999 | 158 (11.2%) | 119 (22.4%) |
| $1,000 to $1,499 | 365 (25.9%) | 184 (34.6%) |
| $1,500 to $1,999 | 252 (17.9%) | 0 (0.0%) |
| $2,000 to $2,499 | 41 (2.9%) | 0 (0.0%) |
| $2,500 to $2,999 | 62 (4.4%) | 0 (0.0%) |
| $3,000 or more | 0 (0.0%) | 37 (7.0%) |
| Total | 1,407 (100.0%) | 531 (100.0%) |
Physical Housing Characteristics in De Motte
Housing Structures in De Motte
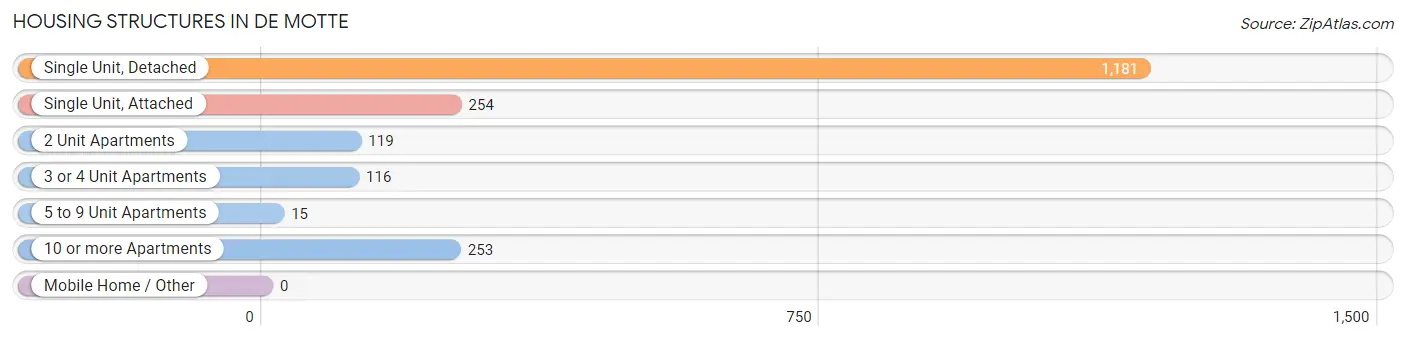
| Structure Type | # Housing Units | % Housing Units |
| Single Unit, Detached | 1,181 | 60.9% |
| Single Unit, Attached | 254 | 13.1% |
| 2 Unit Apartments | 119 | 6.1% |
| 3 or 4 Unit Apartments | 116 | 6.0% |
| 5 to 9 Unit Apartments | 15 | 0.8% |
| 10 or more Apartments | 253 | 13.1% |
| Mobile Home / Other | 0 | 0.0% |
| Total | 1,938 | 100.0% |
Housing Structures by Occupancy in De Motte
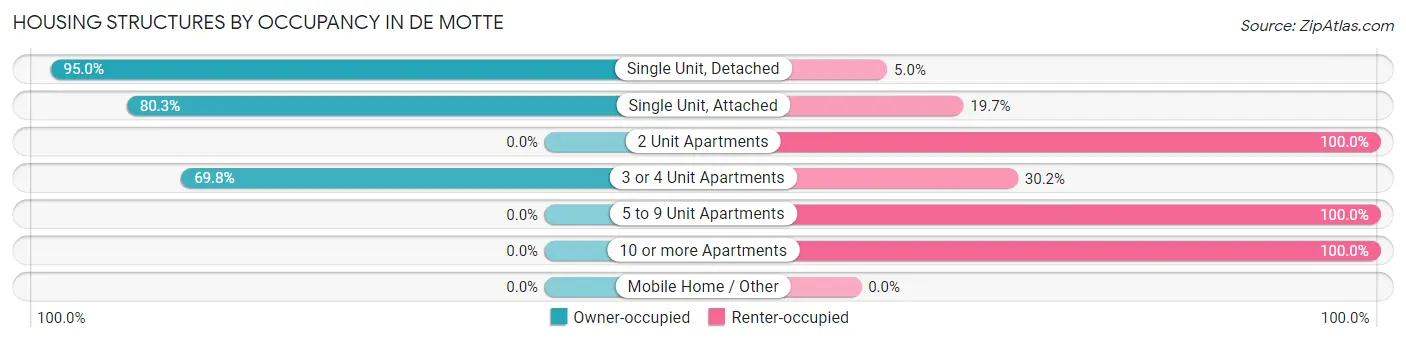
| Structure Type | Owner-occupied | Renter-occupied |
| Single Unit, Detached | 1,122 (95.0%) | 59 (5.0%) |
| Single Unit, Attached | 204 (80.3%) | 50 (19.7%) |
| 2 Unit Apartments | 0 (0.0%) | 119 (100.0%) |
| 3 or 4 Unit Apartments | 81 (69.8%) | 35 (30.2%) |
| 5 to 9 Unit Apartments | 0 (0.0%) | 15 (100.0%) |
| 10 or more Apartments | 0 (0.0%) | 253 (100.0%) |
| Mobile Home / Other | 0 (0.0%) | 0 (0.0%) |
| Total | 1,407 (72.6%) | 531 (27.4%) |
Housing Structures by Number of Rooms in De Motte
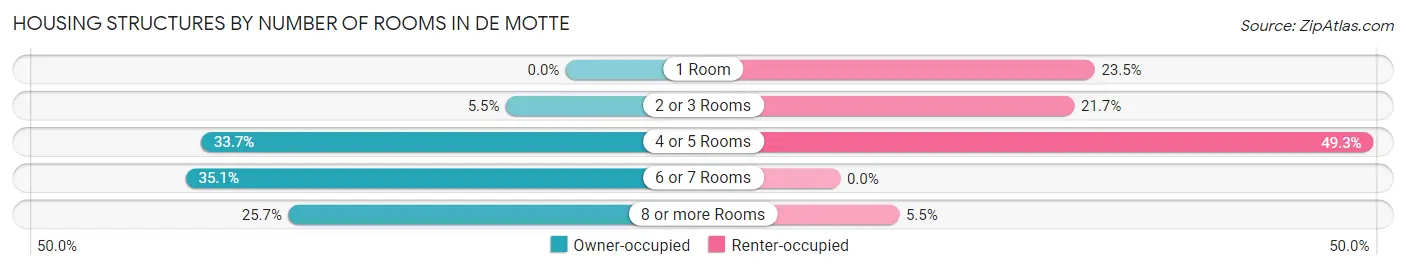
| Number of Rooms | Owner-occupied | Renter-occupied |
| 1 Room | 0 (0.0%) | 125 (23.5%) |
| 2 or 3 Rooms | 78 (5.5%) | 115 (21.7%) |
| 4 or 5 Rooms | 474 (33.7%) | 262 (49.3%) |
| 6 or 7 Rooms | 494 (35.1%) | 0 (0.0%) |
| 8 or more Rooms | 361 (25.7%) | 29 (5.5%) |
| Total | 1,407 (100.0%) | 531 (100.0%) |
Housing Structure by Heating Type in De Motte
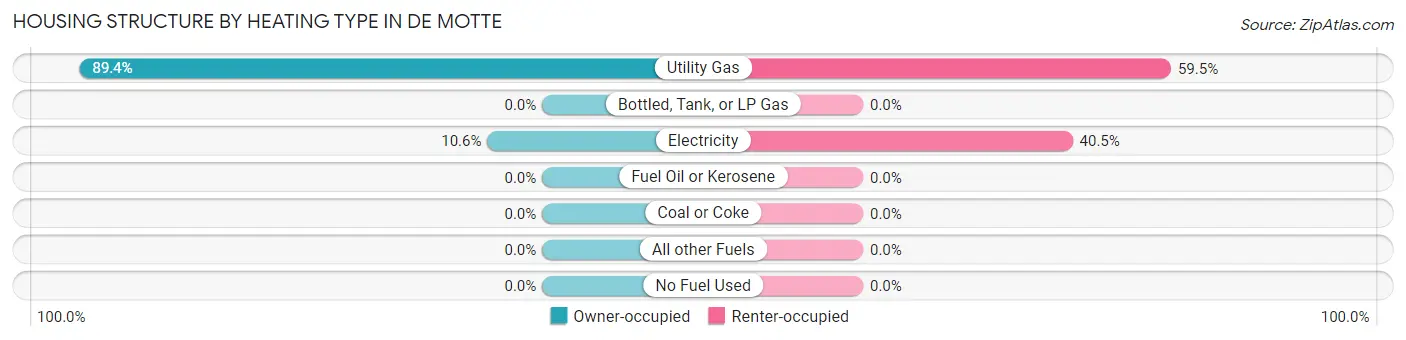
| Heating Type | Owner-occupied | Renter-occupied |
| Utility Gas | 1,258 (89.4%) | 316 (59.5%) |
| Bottled, Tank, or LP Gas | 0 (0.0%) | 0 (0.0%) |
| Electricity | 149 (10.6%) | 215 (40.5%) |
| Fuel Oil or Kerosene | 0 (0.0%) | 0 (0.0%) |
| Coal or Coke | 0 (0.0%) | 0 (0.0%) |
| All other Fuels | 0 (0.0%) | 0 (0.0%) |
| No Fuel Used | 0 (0.0%) | 0 (0.0%) |
| Total | 1,407 (100.0%) | 531 (100.0%) |
Household Vehicle Usage in De Motte
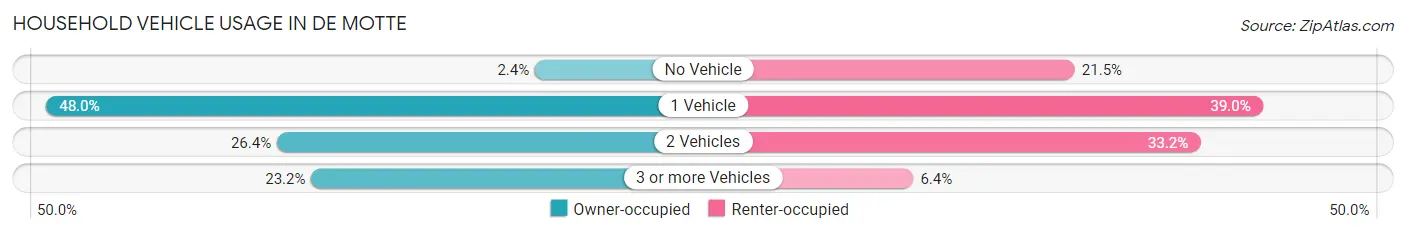
| Vehicles per Household | Owner-occupied | Renter-occupied |
| No Vehicle | 33 (2.4%) | 114 (21.5%) |
| 1 Vehicle | 675 (48.0%) | 207 (39.0%) |
| 2 Vehicles | 372 (26.4%) | 176 (33.2%) |
| 3 or more Vehicles | 327 (23.2%) | 34 (6.4%) |
| Total | 1,407 (100.0%) | 531 (100.0%) |
Real Estate & Mortgages in De Motte
Real Estate and Mortgage Overview in De Motte
| Characteristic | Without Mortgage | With Mortgage |
| Housing Units | 482 | 925 |
| Median Property Value | $173,200 | $207,400 |
| Median Household Income | $55,833 | $80 |
| Monthly Housing Costs | $382 | $0 |
| Real Estate Taxes | $1,082 | $24 |
Property Value by Mortgage Status in De Motte
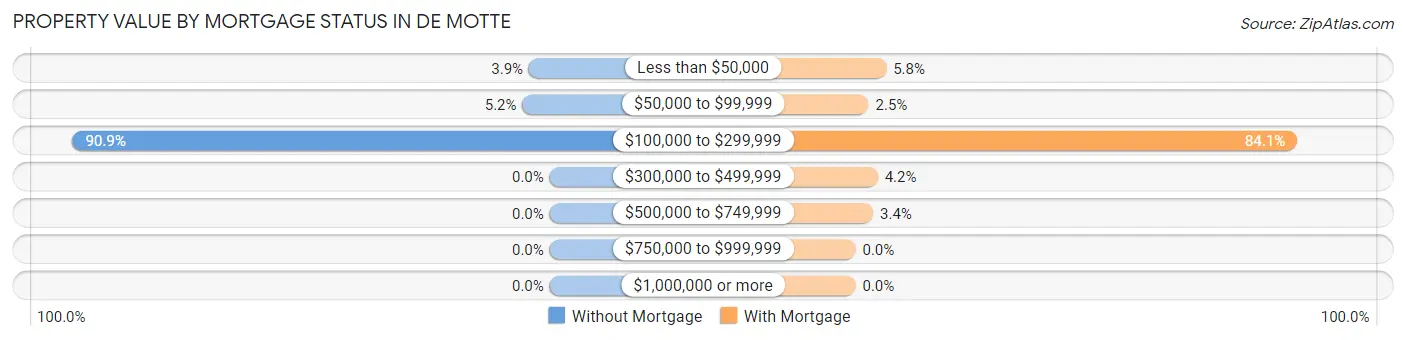
| Property Value | Without Mortgage | With Mortgage |
| Less than $50,000 | 19 (3.9%) | 54 (5.8%) |
| $50,000 to $99,999 | 25 (5.2%) | 23 (2.5%) |
| $100,000 to $299,999 | 438 (90.9%) | 778 (84.1%) |
| $300,000 to $499,999 | 0 (0.0%) | 39 (4.2%) |
| $500,000 to $749,999 | 0 (0.0%) | 31 (3.4%) |
| $750,000 to $999,999 | 0 (0.0%) | 0 (0.0%) |
| $1,000,000 or more | 0 (0.0%) | 0 (0.0%) |
| Total | 482 (100.0%) | 925 (100.0%) |
Household Income by Mortgage Status in De Motte
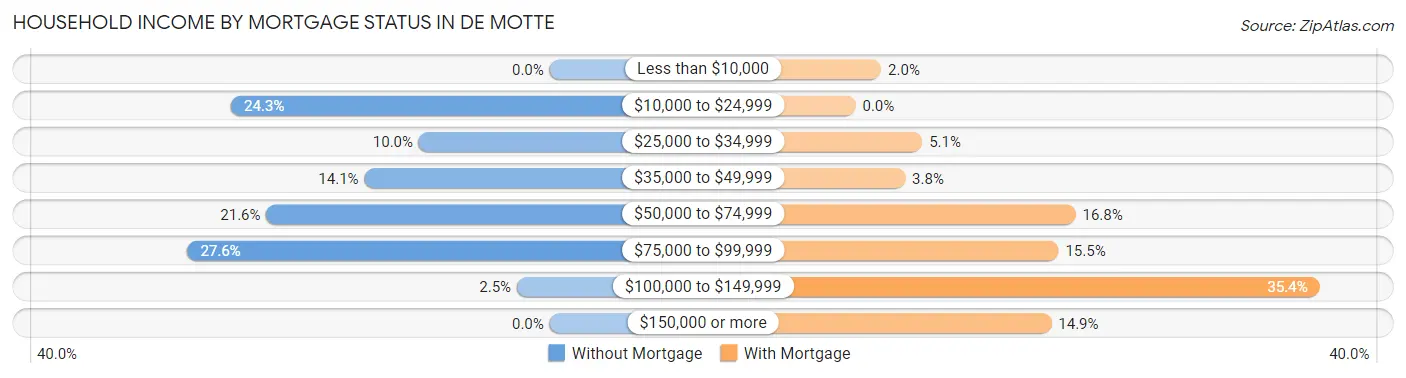
| Household Income | Without Mortgage | With Mortgage |
| Less than $10,000 | 0 (0.0%) | 18 (1.9%) |
| $10,000 to $24,999 | 117 (24.3%) | 0 (0.0%) |
| $25,000 to $34,999 | 48 (10.0%) | 47 (5.1%) |
| $35,000 to $49,999 | 68 (14.1%) | 35 (3.8%) |
| $50,000 to $74,999 | 104 (21.6%) | 155 (16.8%) |
| $75,000 to $99,999 | 133 (27.6%) | 143 (15.5%) |
| $100,000 to $149,999 | 12 (2.5%) | 327 (35.3%) |
| $150,000 or more | 0 (0.0%) | 138 (14.9%) |
| Total | 482 (100.0%) | 925 (100.0%) |
Property Value to Household Income Ratio in De Motte
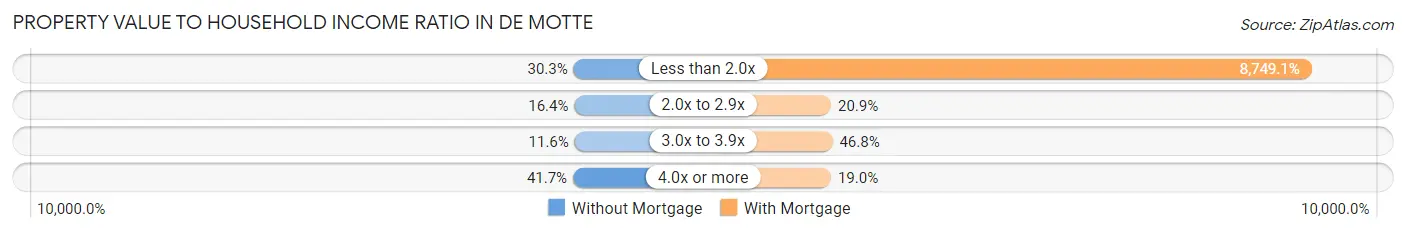
| Value-to-Income Ratio | Without Mortgage | With Mortgage |
| Less than 2.0x | 146 (30.3%) | 80,929 (8,749.1%) |
| 2.0x to 2.9x | 79 (16.4%) | 193 (20.9%) |
| 3.0x to 3.9x | 56 (11.6%) | 433 (46.8%) |
| 4.0x or more | 201 (41.7%) | 176 (19.0%) |
| Total | 482 (100.0%) | 925 (100.0%) |
Real Estate Taxes by Mortgage Status in De Motte
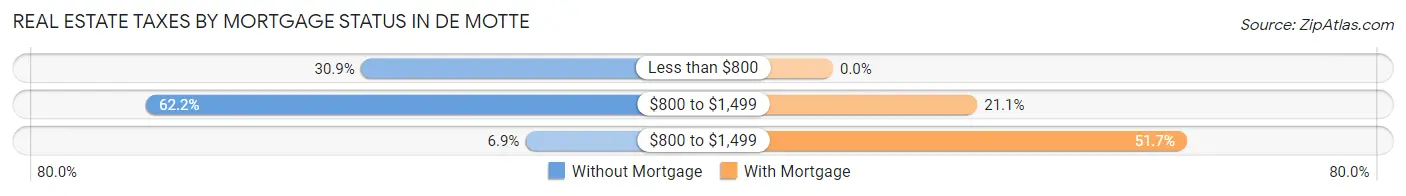
| Property Taxes | Without Mortgage | With Mortgage |
| Less than $800 | 149 (30.9%) | 0 (0.0%) |
| $800 to $1,499 | 300 (62.2%) | 195 (21.1%) |
| $800 to $1,499 | 33 (6.9%) | 478 (51.7%) |
| Total | 482 (100.0%) | 925 (100.0%) |
Health & Disability in De Motte
Health Insurance Coverage by Age in De Motte
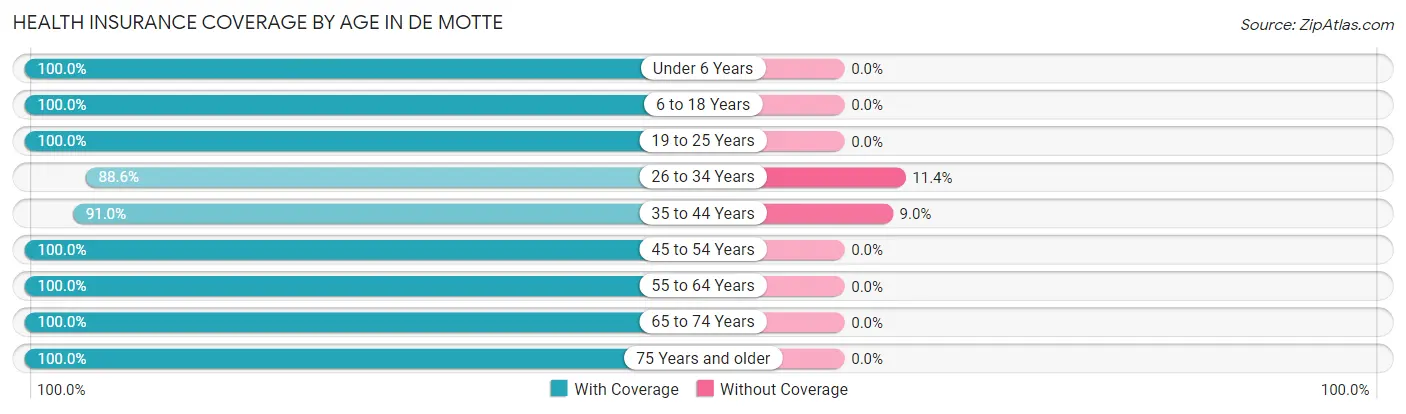
| Age Bracket | With Coverage | Without Coverage |
| Under 6 Years | 394 (100.0%) | 0 (0.0%) |
| 6 to 18 Years | 713 (100.0%) | 0 (0.0%) |
| 19 to 25 Years | 142 (100.0%) | 0 (0.0%) |
| 26 to 34 Years | 490 (88.6%) | 63 (11.4%) |
| 35 to 44 Years | 485 (91.0%) | 48 (9.0%) |
| 45 to 54 Years | 265 (100.0%) | 0 (0.0%) |
| 55 to 64 Years | 600 (100.0%) | 0 (0.0%) |
| 65 to 74 Years | 466 (100.0%) | 0 (0.0%) |
| 75 Years and older | 456 (100.0%) | 0 (0.0%) |
| Total | 4,011 (97.3%) | 111 (2.7%) |
Health Insurance Coverage by Citizenship Status in De Motte
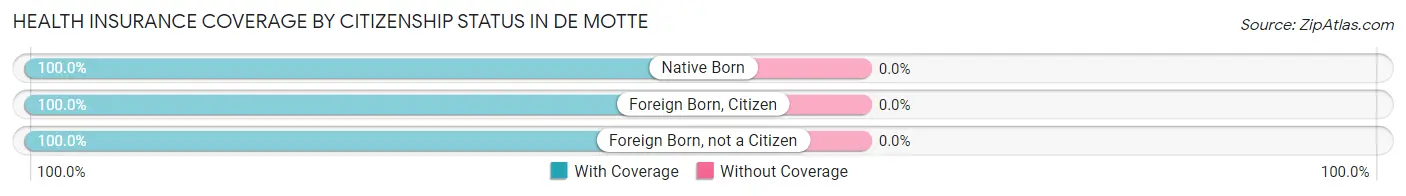
| Citizenship Status | With Coverage | Without Coverage |
| Native Born | 394 (100.0%) | 0 (0.0%) |
| Foreign Born, Citizen | 713 (100.0%) | 0 (0.0%) |
| Foreign Born, not a Citizen | 142 (100.0%) | 0 (0.0%) |
Health Insurance Coverage by Household Income in De Motte
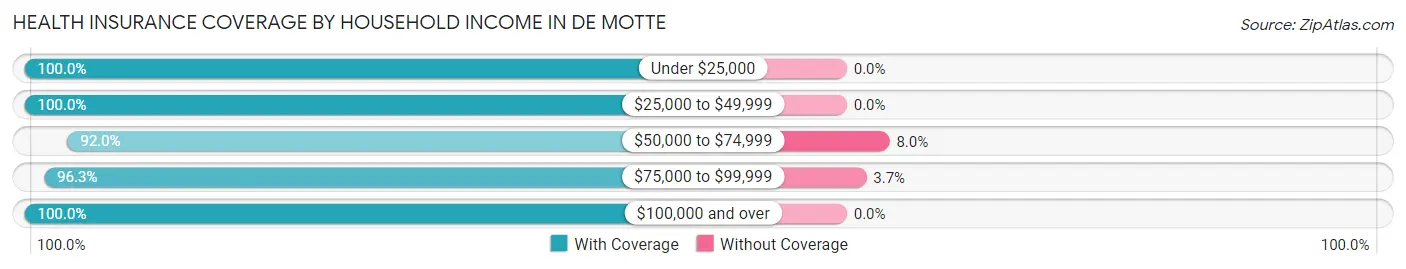
| Household Income | With Coverage | Without Coverage |
| Under $25,000 | 423 (100.0%) | 0 (0.0%) |
| $25,000 to $49,999 | 589 (100.0%) | 0 (0.0%) |
| $50,000 to $74,999 | 552 (92.0%) | 48 (8.0%) |
| $75,000 to $99,999 | 1,660 (96.3%) | 63 (3.7%) |
| $100,000 and over | 787 (100.0%) | 0 (0.0%) |
Public vs Private Health Insurance Coverage by Age in De Motte
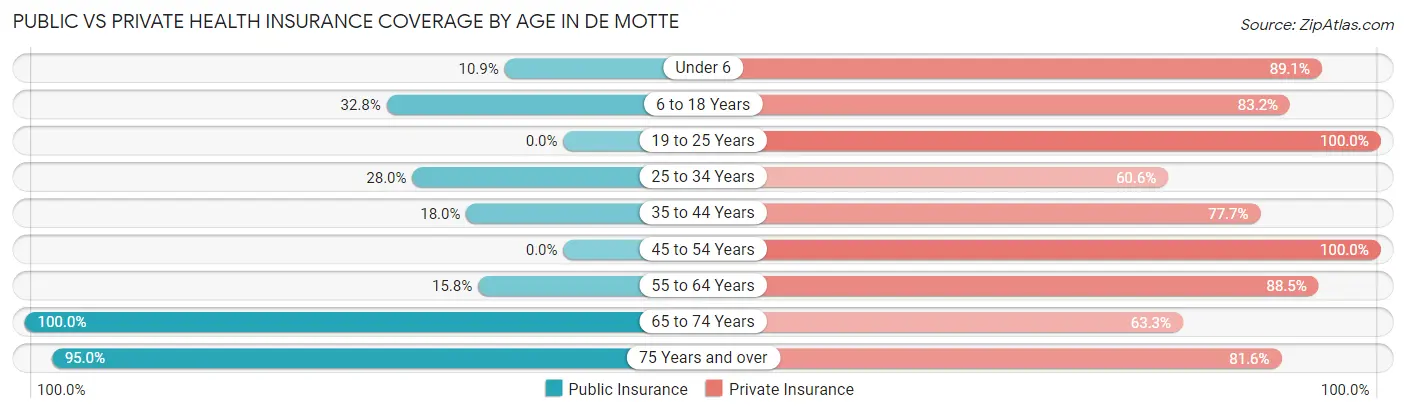
| Age Bracket | Public Insurance | Private Insurance |
| Under 6 | 43 (10.9%) | 351 (89.1%) |
| 6 to 18 Years | 234 (32.8%) | 593 (83.2%) |
| 19 to 25 Years | 0 (0.0%) | 142 (100.0%) |
| 25 to 34 Years | 155 (28.0%) | 335 (60.6%) |
| 35 to 44 Years | 96 (18.0%) | 414 (77.7%) |
| 45 to 54 Years | 0 (0.0%) | 265 (100.0%) |
| 55 to 64 Years | 95 (15.8%) | 531 (88.5%) |
| 65 to 74 Years | 466 (100.0%) | 295 (63.3%) |
| 75 Years and over | 433 (95.0%) | 372 (81.6%) |
| Total | 1,522 (36.9%) | 3,298 (80.0%) |
Disability Status by Sex by Age in De Motte
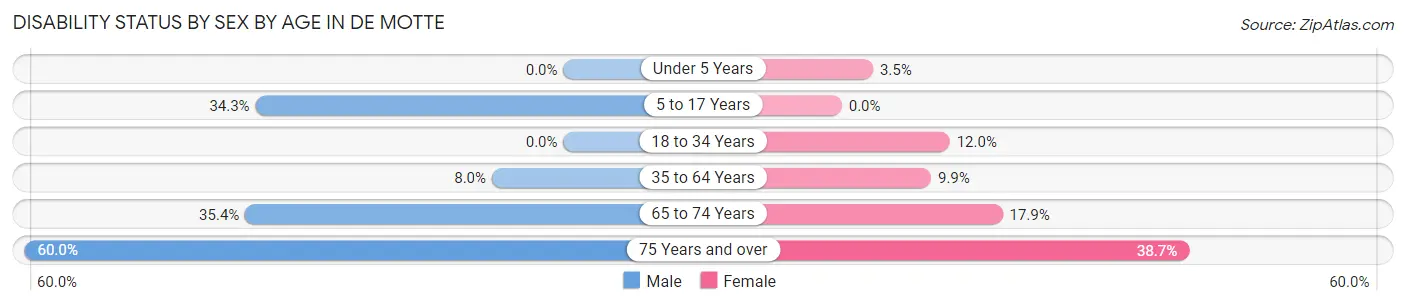
| Age Bracket | Male | Female |
| Under 5 Years | 0 (0.0%) | 6 (3.5%) |
| 5 to 17 Years | 119 (34.3%) | 0 (0.0%) |
| 18 to 34 Years | 0 (0.0%) | 59 (12.0%) |
| 35 to 64 Years | 48 (8.0%) | 79 (9.9%) |
| 65 to 74 Years | 84 (35.4%) | 41 (17.9%) |
| 75 Years and over | 30 (60.0%) | 157 (38.7%) |
Disability Class by Sex by Age in De Motte
Disability Class: Hearing Difficulty
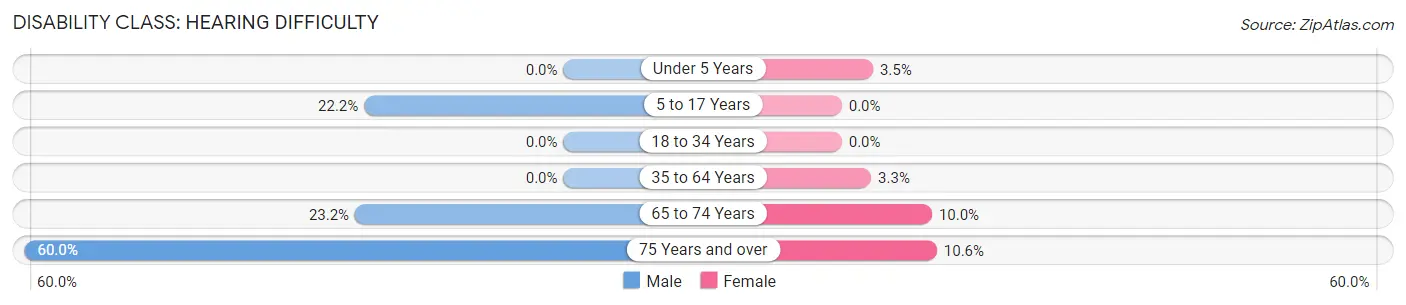
| Age Bracket | Male | Female |
| Under 5 Years | 0 (0.0%) | 6 (3.5%) |
| 5 to 17 Years | 77 (22.2%) | 0 (0.0%) |
| 18 to 34 Years | 0 (0.0%) | 0 (0.0%) |
| 35 to 64 Years | 0 (0.0%) | 26 (3.3%) |
| 65 to 74 Years | 55 (23.2%) | 23 (10.0%) |
| 75 Years and over | 30 (60.0%) | 43 (10.6%) |
Disability Class: Vision Difficulty
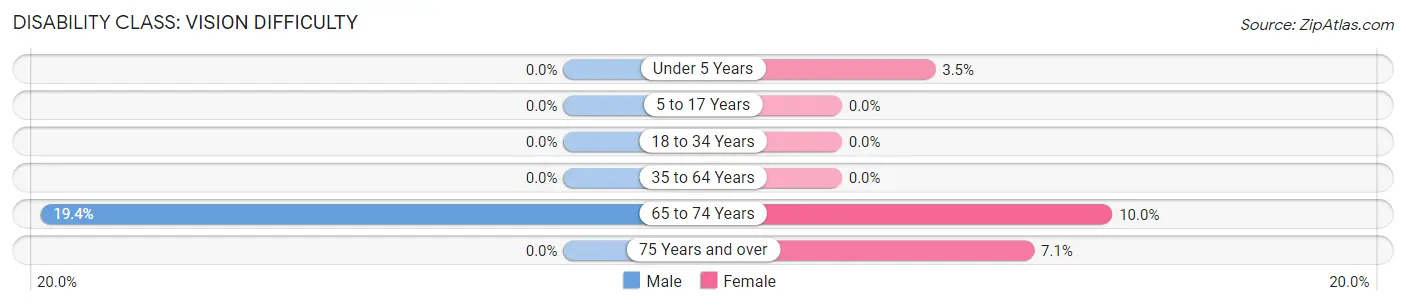
| Age Bracket | Male | Female |
| Under 5 Years | 0 (0.0%) | 6 (3.5%) |
| 5 to 17 Years | 0 (0.0%) | 0 (0.0%) |
| 18 to 34 Years | 0 (0.0%) | 0 (0.0%) |
| 35 to 64 Years | 0 (0.0%) | 0 (0.0%) |
| 65 to 74 Years | 46 (19.4%) | 23 (10.0%) |
| 75 Years and over | 0 (0.0%) | 29 (7.1%) |
Disability Class: Cognitive Difficulty
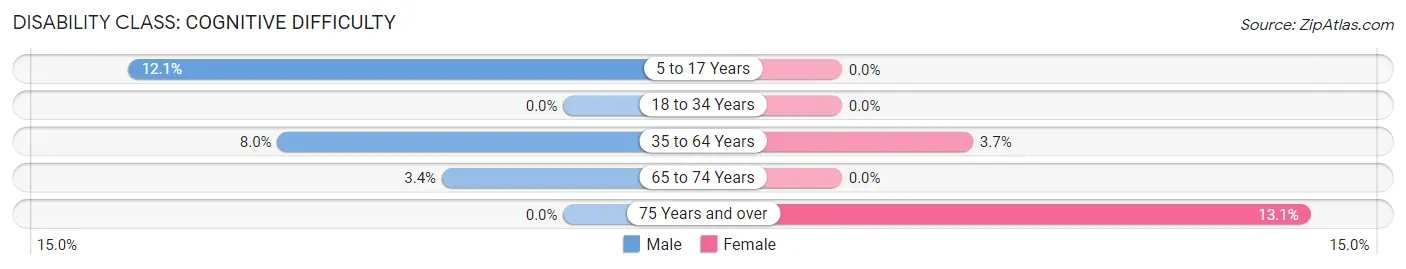
| Age Bracket | Male | Female |
| 5 to 17 Years | 42 (12.1%) | 0 (0.0%) |
| 18 to 34 Years | 0 (0.0%) | 0 (0.0%) |
| 35 to 64 Years | 48 (8.0%) | 29 (3.6%) |
| 65 to 74 Years | 8 (3.4%) | 0 (0.0%) |
| 75 Years and over | 0 (0.0%) | 53 (13.1%) |
Disability Class: Ambulatory Difficulty
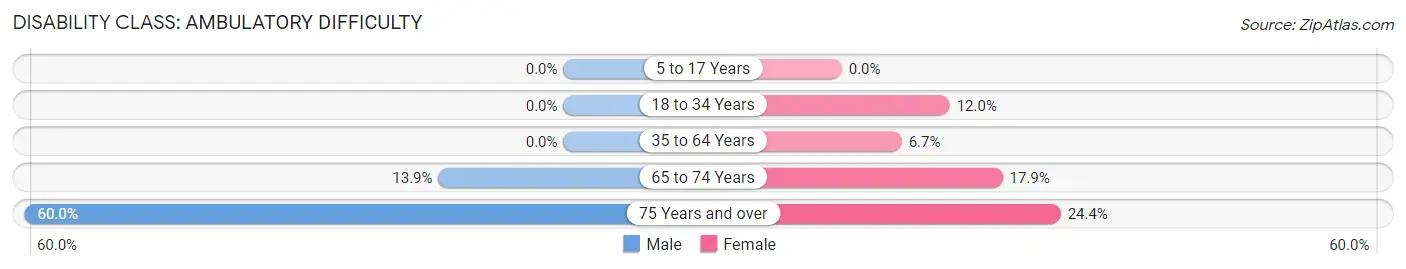
| Age Bracket | Male | Female |
| 5 to 17 Years | 0 (0.0%) | 0 (0.0%) |
| 18 to 34 Years | 0 (0.0%) | 59 (12.0%) |
| 35 to 64 Years | 0 (0.0%) | 53 (6.7%) |
| 65 to 74 Years | 33 (13.9%) | 41 (17.9%) |
| 75 Years and over | 30 (60.0%) | 99 (24.4%) |
Disability Class: Self-Care Difficulty
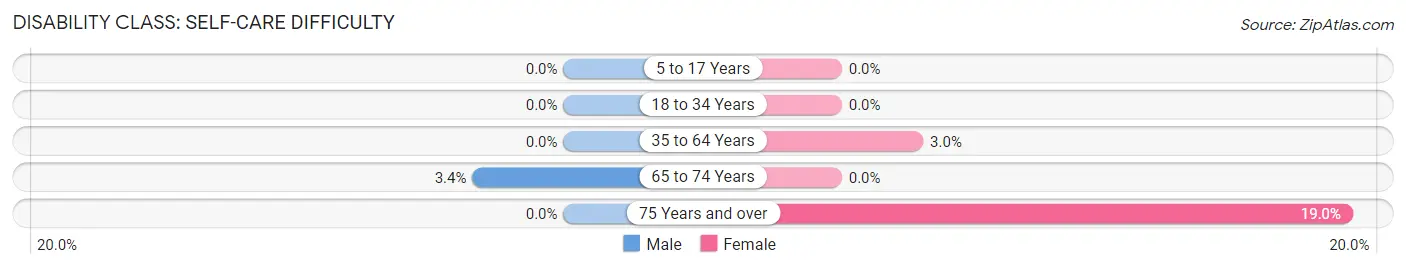
| Age Bracket | Male | Female |
| 5 to 17 Years | 0 (0.0%) | 0 (0.0%) |
| 18 to 34 Years | 0 (0.0%) | 0 (0.0%) |
| 35 to 64 Years | 0 (0.0%) | 24 (3.0%) |
| 65 to 74 Years | 8 (3.4%) | 0 (0.0%) |
| 75 Years and over | 0 (0.0%) | 77 (19.0%) |
Technology Access in De Motte
Computing Device Access in De Motte
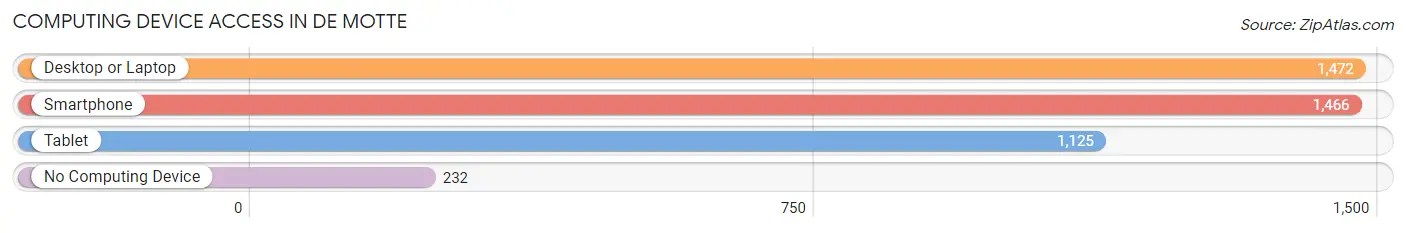
| Device Type | # Households | % Households |
| Desktop or Laptop | 1,472 | 75.9% |
| Smartphone | 1,466 | 75.6% |
| Tablet | 1,125 | 58.1% |
| No Computing Device | 232 | 12.0% |
| Total | 1,938 | 100.0% |
Internet Access in De Motte
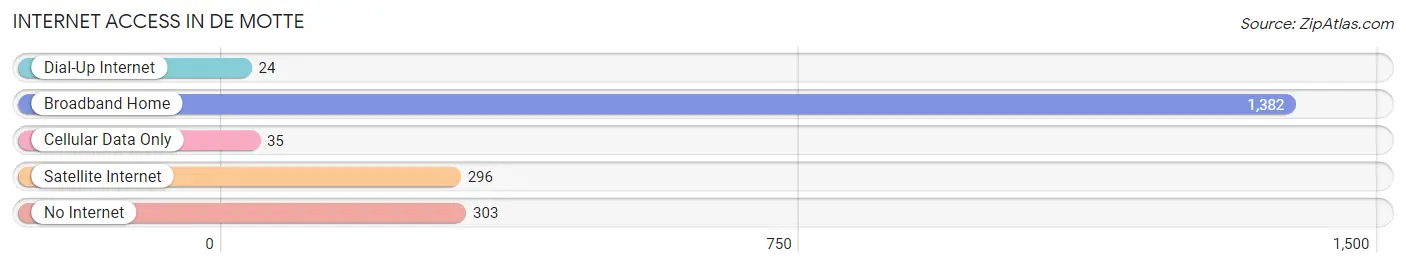
| Internet Type | # Households | % Households |
| Dial-Up Internet | 24 | 1.2% |
| Broadband Home | 1,382 | 71.3% |
| Cellular Data Only | 35 | 1.8% |
| Satellite Internet | 296 | 15.3% |
| No Internet | 303 | 15.6% |
| Total | 1,938 | 100.0% |
De Motte Summary
Motte, Indiana is a small town located in Jasper County, Indiana. It is situated on the banks of the Kankakee River, about 25 miles south of the city of Valparaiso. The town was founded in 1837 by John DeMotte, a Dutch immigrant who had come to the area in search of a better life. The town was named after him and has since grown to a population of around 1,000 people.
Geography
Motte is located in the northwest corner of Jasper County, Indiana. It is situated on the banks of the Kankakee River, about 25 miles south of the city of Valparaiso. The town is surrounded by rolling hills and farmland, with the Kankakee River providing a scenic backdrop. The town is located in the Central Till Plain region of Indiana, which is characterized by flat terrain and fertile soil.
Economy
Motte’s economy is largely based on agriculture. The town is home to several farms, which produce a variety of crops, including corn, soybeans, wheat, and hay. The town also has a few small businesses, including a grocery store, a hardware store, and a few restaurants.
Demographics
As of the 2010 census, the population of Motte was 1,000 people. The racial makeup of the town was 97.2% White, 0.7% African American, 0.3% Native American, 0.2% Asian, 0.1% Pacific Islander, and 1.5% from two or more races. The median household income was $41,250, and the median family income was $50,000.
History
Motte was founded in 1837 by John DeMotte, a Dutch immigrant who had come to the area in search of a better life. The town was named after him and has since grown to a population of around 1,000 people. The town was originally a farming community, but in the late 19th century, it began to develop into a small industrial center. The town was home to several factories, including a brickyard, a sawmill, and a flour mill.
In the early 20th century, the town began to decline as the factories closed and the population began to dwindle. However, in recent years, the town has seen a resurgence in population and economic activity. The town is now home to several small businesses, including a grocery store, a hardware store, and a few restaurants.
Conclusion
Motte, Indiana is a small town located in Jasper County, Indiana. It is situated on the banks of the Kankakee River, about 25 miles south of the city of Valparaiso. The town was founded in 1837 by John DeMotte, a Dutch immigrant who had come to the area in search of a better life. The town was originally a farming community, but in the late 19th century, it began to develop into a small industrial center. In recent years, the town has seen a resurgence in population and economic activity, and is now home to several small businesses. The population of Motte is 1,000 people, and the median household income is $41,250.
Common Questions
What is the Total Population of De Motte?
Total Population of De Motte is 4,182.
What is the Total Male Population of De Motte?
Total Male Population of De Motte is 1,653.
What is the Total Female Population of De Motte?
Total Female Population of De Motte is 2,529.
What is the Ratio of Males per 100 Females in De Motte?
There are 65.36 Males per 100 Females in De Motte.
What is the Ratio of Females per 100 Males in De Motte?
There are 152.99 Females per 100 Males in De Motte.
What is the Median Population Age in De Motte?
Median Population Age in De Motte is 41.6 Years.
What is the Average Family Size in De Motte
Average Family Size in De Motte is 2.7 People.
What is the Average Household Size in De Motte
Average Household Size in De Motte is 2.1 People.
What is Per Capita Income in De Motte?
Per Capita income in De Motte is $31,036.
What is the Median Family Income in De Motte?
Median Family Income in De Motte is $79,026.
What is the Median Household income in De Motte?
Median Household Income in De Motte is $64,415.
What is Income or Wage Gap in De Motte?
Income or Wage Gap in De Motte is 49.4%.
Women in De Motte earn 50.6 cents for every dollar earned by a man.
What is Inequality or Gini Index in De Motte?
Inequality or Gini Index in De Motte is 0.34.
How Large is the Labor Force in De Motte?
There are 1,650 People in the Labor Forcein in De Motte.
What is the Percentage of People in the Labor Force in De Motte?
52.3% of People are in the Labor Force in De Motte.
What is the Unemployment Rate in De Motte?
Unemployment Rate in De Motte is 1.1%.