Country Squire Lakes, IN
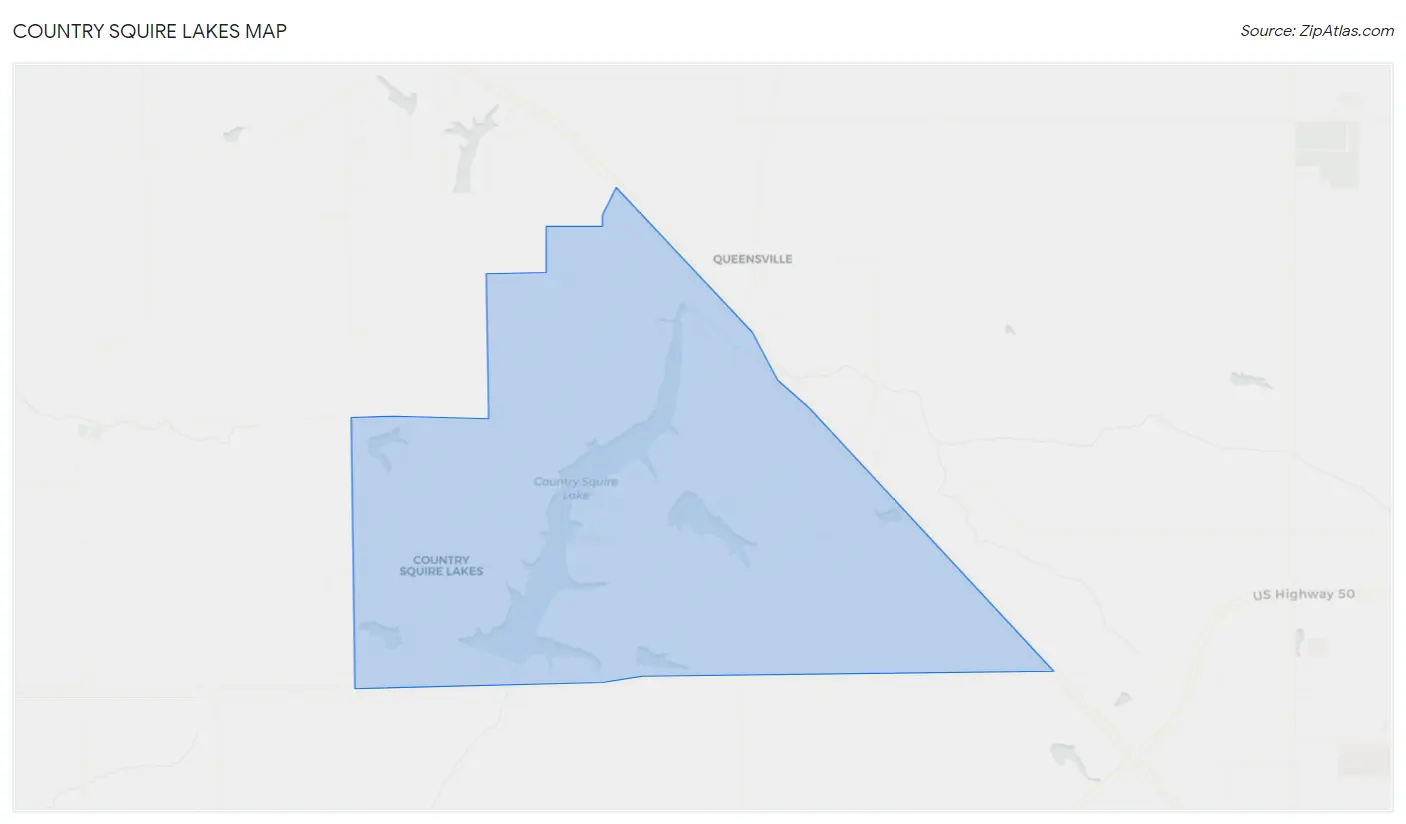
Country Squire Lakes Map
Country Squire Lakes Overview
3,021
TOTAL POPULATION
1,643
MALE POPULATION
1,378
FEMALE POPULATION
119.23
MALES / 100 FEMALES
83.87
FEMALES / 100 MALES
37.1
MEDIAN AGE
2.6
AVG FAMILY SIZE
2.5
AVG HOUSEHOLD SIZE
$22,727
PER CAPITA INCOME
$44,829
AVG FAMILY INCOME
$50,078
AVG HOUSEHOLD INCOME
57.5%
WAGE / INCOME GAP [ % ]
42.5¢/ $1
WAGE / INCOME GAP [ $ ]
0.43
INEQUALITY / GINI INDEX
1,712
LABOR FORCE [ PEOPLE ]
69.4%
PERCENT IN LABOR FORCE
14.6%
UNEMPLOYMENT RATE
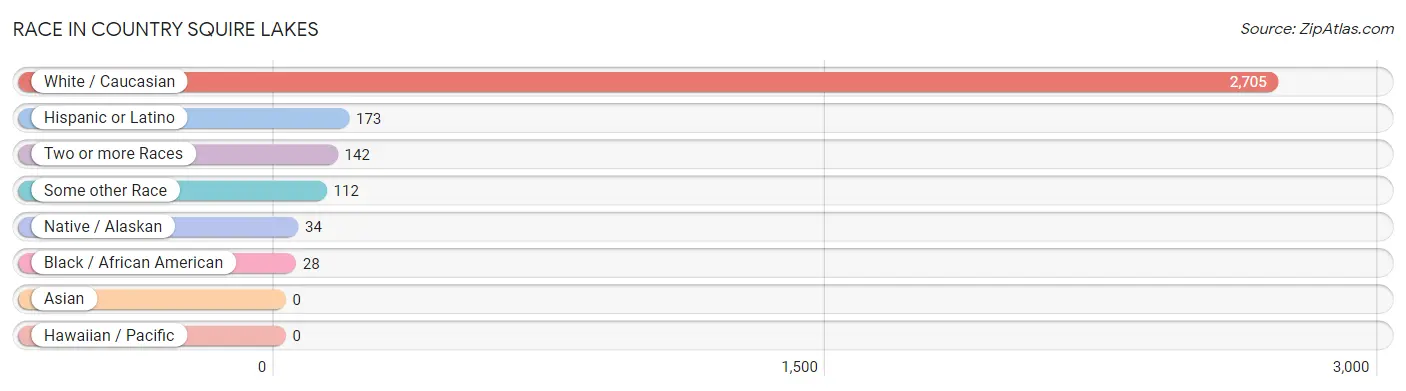
Race in Country Squire Lakes
The most populous races in Country Squire Lakes are White / Caucasian (2,705 | 89.5%), Hispanic or Latino (173 | 5.7%), and Two or more Races (142 | 4.7%).
| Race | # Population | % Population |
| Asian | 0 | 0.0% |
| Black / African American | 28 | 0.9% |
| Hawaiian / Pacific | 0 | 0.0% |
| Hispanic or Latino | 173 | 5.7% |
| Native / Alaskan | 34 | 1.1% |
| White / Caucasian | 2,705 | 89.5% |
| Two or more Races | 142 | 4.7% |
| Some other Race | 112 | 3.7% |
| Total | 3,021 | 100.0% |
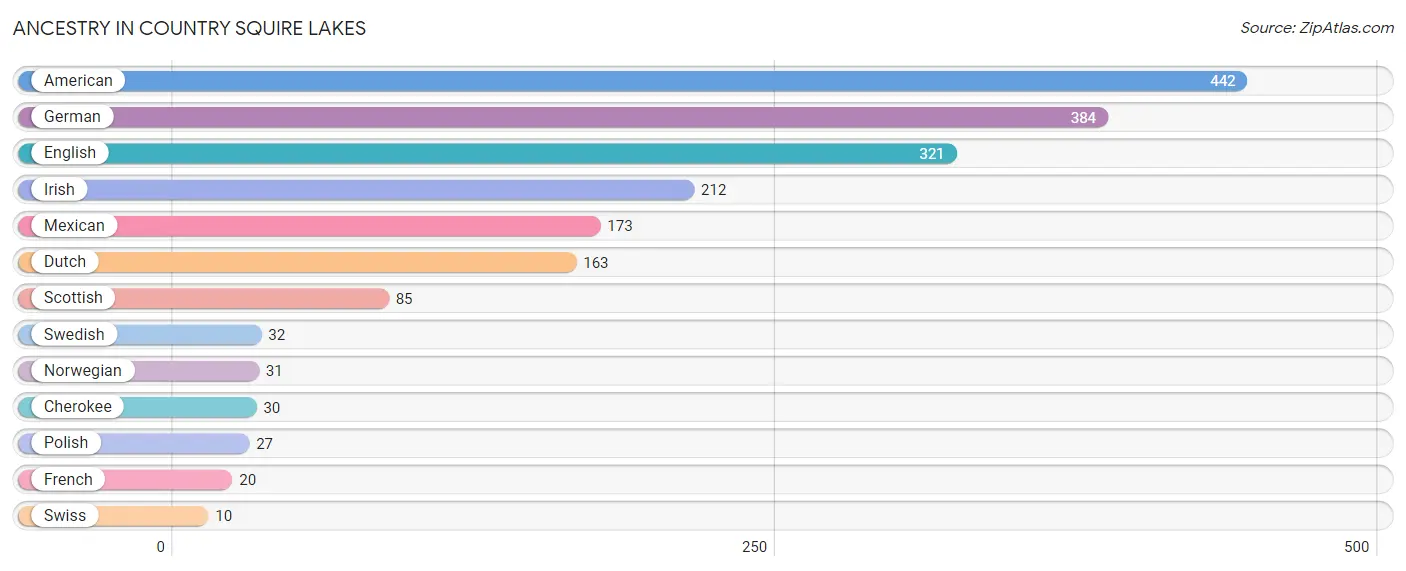
Ancestry in Country Squire Lakes
The most populous ancestries reported in Country Squire Lakes are American (442 | 14.6%), German (384 | 12.7%), English (321 | 10.6%), Irish (212 | 7.0%), and Mexican (173 | 5.7%), together accounting for 50.7% of all Country Squire Lakes residents.
| Ancestry | # Population | % Population |
| American | 442 | 14.6% |
| Cherokee | 30 | 1.0% |
| Dutch | 163 | 5.4% |
| English | 321 | 10.6% |
| French | 20 | 0.7% |
| German | 384 | 12.7% |
| Irish | 212 | 7.0% |
| Mexican | 173 | 5.7% |
| Norwegian | 31 | 1.0% |
| Polish | 27 | 0.9% |
| Scottish | 85 | 2.8% |
| Swedish | 32 | 1.1% |
| Swiss | 10 | 0.3% | View All 13 Rows |
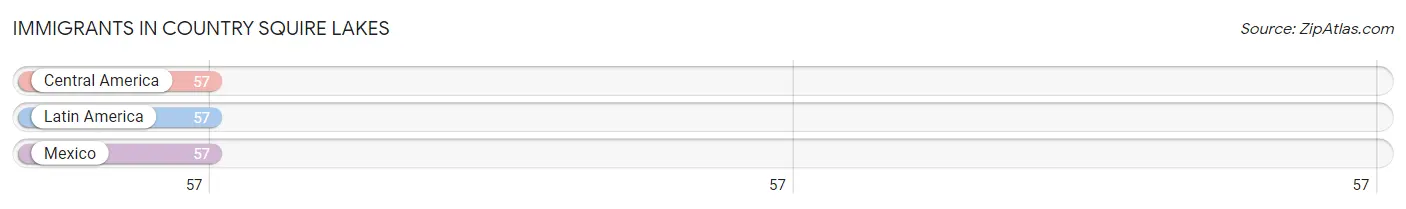
Immigrants in Country Squire Lakes
The most numerous immigrant groups reported in Country Squire Lakes came from Central America (57 | 1.9%), Latin America (57 | 1.9%), and Mexico (57 | 1.9%), together accounting for 5.7% of all Country Squire Lakes residents.
| Immigration Origin | # Population | % Population |
| Central America | 57 | 1.9% |
| Latin America | 57 | 1.9% |
| Mexico | 57 | 1.9% | View All 3 Rows |
Sex and Age in Country Squire Lakes
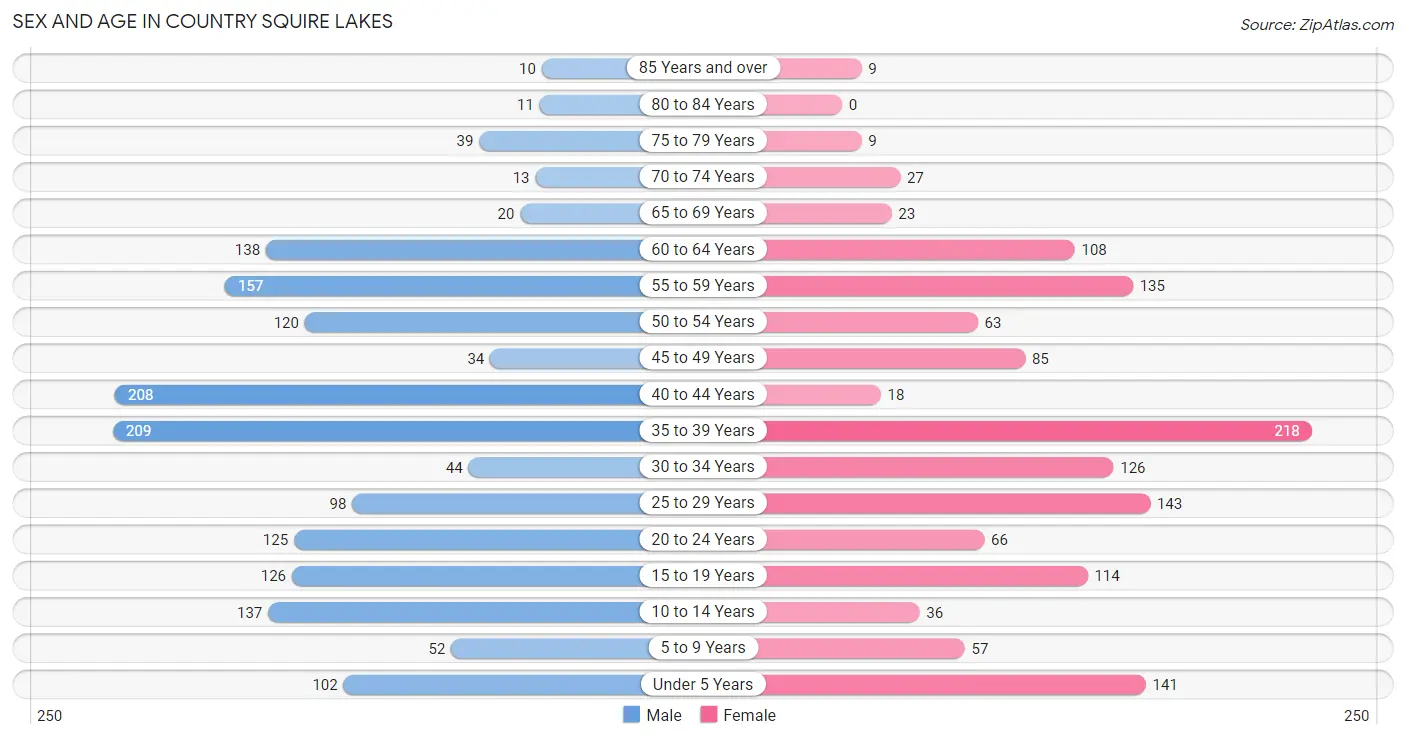
Sex and Age in Country Squire Lakes
The most populous age groups in Country Squire Lakes are 35 to 39 Years (209 | 12.7%) for men and 35 to 39 Years (218 | 15.8%) for women.
| Age Bracket | Male | Female |
| Under 5 Years | 102 (6.2%) | 141 (10.2%) |
| 5 to 9 Years | 52 (3.2%) | 57 (4.1%) |
| 10 to 14 Years | 137 (8.3%) | 36 (2.6%) |
| 15 to 19 Years | 126 (7.7%) | 114 (8.3%) |
| 20 to 24 Years | 125 (7.6%) | 66 (4.8%) |
| 25 to 29 Years | 98 (6.0%) | 143 (10.4%) |
| 30 to 34 Years | 44 (2.7%) | 126 (9.1%) |
| 35 to 39 Years | 209 (12.7%) | 218 (15.8%) |
| 40 to 44 Years | 208 (12.7%) | 18 (1.3%) |
| 45 to 49 Years | 34 (2.1%) | 85 (6.2%) |
| 50 to 54 Years | 120 (7.3%) | 63 (4.6%) |
| 55 to 59 Years | 157 (9.6%) | 135 (9.8%) |
| 60 to 64 Years | 138 (8.4%) | 108 (7.8%) |
| 65 to 69 Years | 20 (1.2%) | 23 (1.7%) |
| 70 to 74 Years | 13 (0.8%) | 27 (2.0%) |
| 75 to 79 Years | 39 (2.4%) | 9 (0.6%) |
| 80 to 84 Years | 11 (0.7%) | 0 (0.0%) |
| 85 Years and over | 10 (0.6%) | 9 (0.6%) |
| Total | 1,643 (100.0%) | 1,378 (100.0%) |
Families and Households in Country Squire Lakes
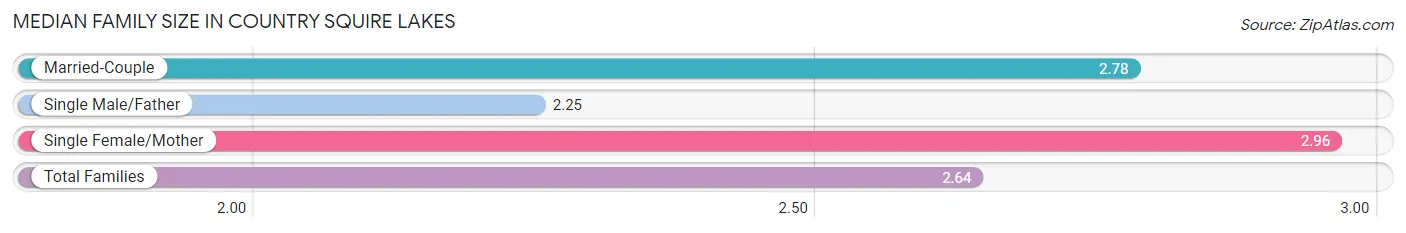
Median Family Size in Country Squire Lakes
The median family size in Country Squire Lakes is 2.64 persons per family, with single female/mother families (172 | 19.8%) accounting for the largest median family size of 2.96 persons per family. On the other hand, single male/father families (288 | 33.2%) represent the smallest median family size with 2.25 persons per family.
| Family Type | # Families | Family Size |
| Married-Couple | 408 (47.0%) | 2.78 |
| Single Male/Father | 288 (33.2%) | 2.25 |
| Single Female/Mother | 172 (19.8%) | 2.96 |
| Total Families | 868 (100.0%) | 2.64 |
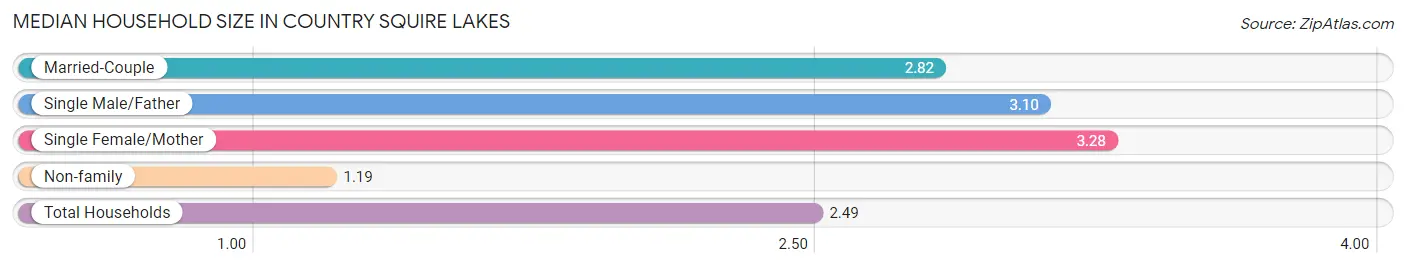
Median Household Size in Country Squire Lakes
The median household size in Country Squire Lakes is 2.49 persons per household, with single female/mother households (172 | 14.2%) accounting for the largest median household size of 3.28 persons per household. non-family households (339 | 28.1%) represent the smallest median household size with 1.19 persons per household.
| Household Type | # Households | Household Size |
| Married-Couple | 408 (33.8%) | 2.82 |
| Single Male/Father | 288 (23.9%) | 3.10 |
| Single Female/Mother | 172 (14.2%) | 3.28 |
| Non-family | 339 (28.1%) | 1.19 |
| Total Households | 1,207 (100.0%) | 2.49 |
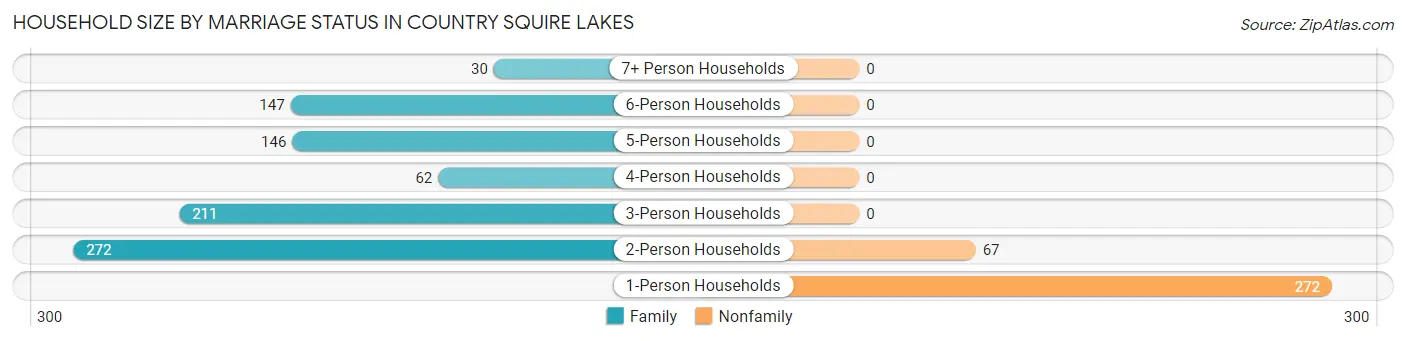
Household Size by Marriage Status in Country Squire Lakes
Out of a total of 1,207 households in Country Squire Lakes, 868 (71.9%) are family households, while 339 (28.1%) are nonfamily households. The most numerous type of family households are 2-person households, comprising 272, and the most common type of nonfamily households are 1-person households, comprising 272.
| Household Size | Family Households | Nonfamily Households |
| 1-Person Households | - | 272 (22.5%) |
| 2-Person Households | 272 (22.5%) | 67 (5.6%) |
| 3-Person Households | 211 (17.5%) | 0 (0.0%) |
| 4-Person Households | 62 (5.1%) | 0 (0.0%) |
| 5-Person Households | 146 (12.1%) | 0 (0.0%) |
| 6-Person Households | 147 (12.2%) | 0 (0.0%) |
| 7+ Person Households | 30 (2.5%) | 0 (0.0%) |
| Total | 868 (71.9%) | 339 (28.1%) |
Female Fertility in Country Squire Lakes
Fertility by Age in Country Squire Lakes
Average fertility rate in Country Squire Lakes is 17.0 births per 1,000 women. Women in the age bracket of 20 to 34 years have the highest fertility rate with 39.0 births per 1,000 women. Women in the age bracket of 20 to 34 years acount for 100.0% of all women with births.
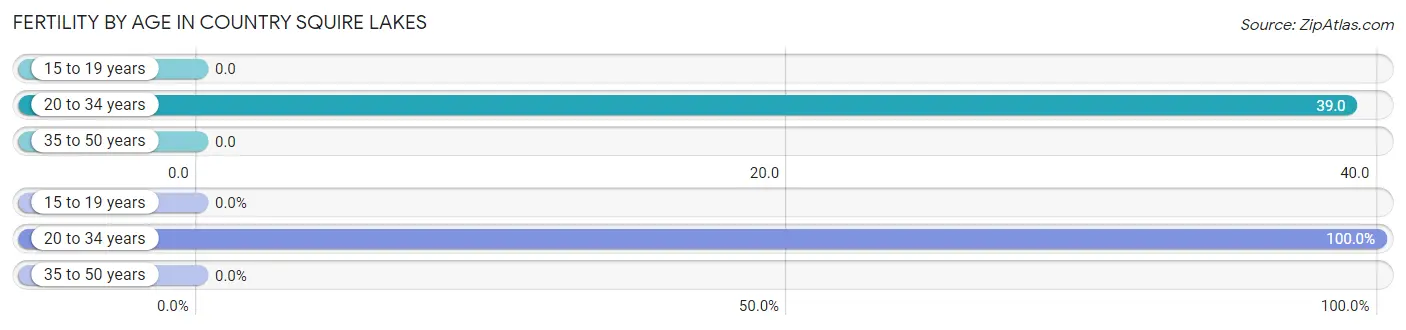
| Age Bracket | Women with Births | Births / 1,000 Women |
| 15 to 19 years | 0 (0.0%) | 0.0 |
| 20 to 34 years | 13 (100.0%) | 39.0 |
| 35 to 50 years | 0 (0.0%) | 0.0 |
| Total | 13 (100.0%) | 17.0 |
Fertility by Age by Marriage Status in Country Squire Lakes
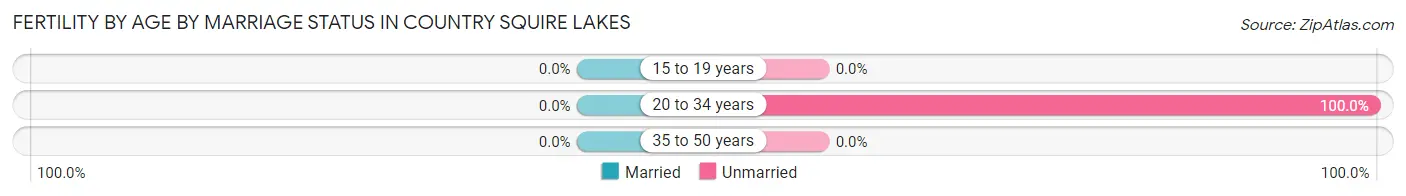
| Age Bracket | Married | Unmarried |
| 15 to 19 years | 0 (0.0%) | 0 (0.0%) |
| 20 to 34 years | 0 (0.0%) | 13 (100.0%) |
| 35 to 50 years | 0 (0.0%) | 0 (0.0%) |
| Total | 0 (0.0%) | 13 (100.0%) |
Fertility by Education in Country Squire Lakes
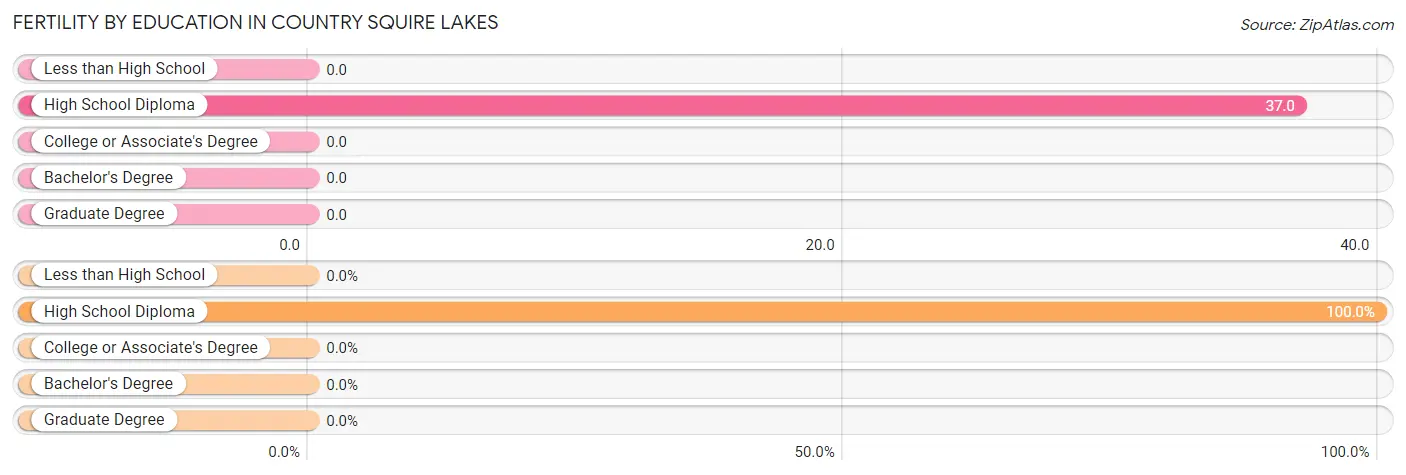
| Educational Attainment | Women with Births | Births / 1,000 Women |
| Less than High School | 0 (0.0%) | 0.0 |
| High School Diploma | 13 (100.0%) | 37.0 |
| College or Associate's Degree | 0 (0.0%) | 0.0 |
| Bachelor's Degree | 0 (0.0%) | 0.0 |
| Graduate Degree | 0 (0.0%) | 0.0 |
| Total | 13 (100.0%) | 17.0 |
Fertility by Education by Marriage Status in Country Squire Lakes
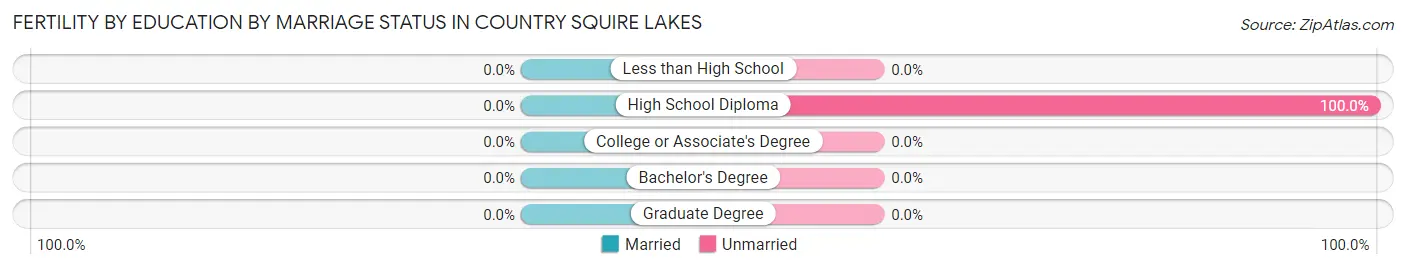
| Educational Attainment | Married | Unmarried |
| Less than High School | 0 (0.0%) | 0 (0.0%) |
| High School Diploma | 0 (0.0%) | 13 (100.0%) |
| College or Associate's Degree | 0 (0.0%) | 0 (0.0%) |
| Bachelor's Degree | 0 (0.0%) | 0 (0.0%) |
| Graduate Degree | 0 (0.0%) | 0 (0.0%) |
| Total | 0 (0.0%) | 13 (100.0%) |
Income in Country Squire Lakes
Income Overview in Country Squire Lakes
Per Capita Income in Country Squire Lakes is $22,727, while median incomes of families and households are $44,829 and $50,078 respectively.
| Characteristic | Number | Measure |
| Per Capita Income | 3,021 | $22,727 |
| Median Family Income | 868 | $44,829 |
| Mean Family Income | 868 | $67,357 |
| Median Household Income | 1,207 | $50,078 |
| Mean Household Income | 1,207 | $62,457 |
| Income Deficit | 868 | $0 |
| Wage / Income Gap (%) | 3,021 | 57.49% |
| Wage / Income Gap ($) | 3,021 | 42.51¢ per $1 |
| Gini / Inequality Index | 3,021 | 0.43 |
Earnings by Sex in Country Squire Lakes
Average Earnings in Country Squire Lakes are $32,967, $39,291 for men and $16,701 for women, a difference of 57.5%.
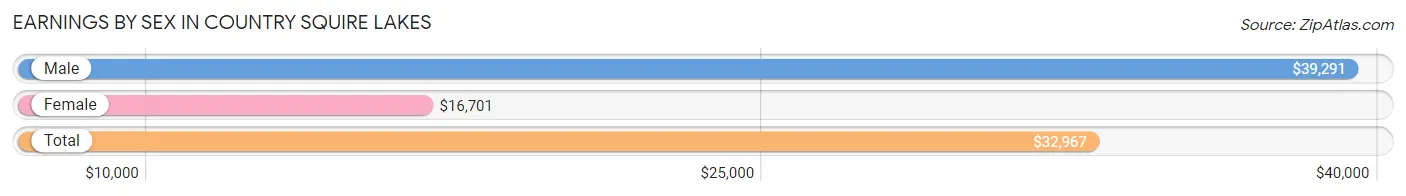
| Sex | Number | Average Earnings |
| Male | 947 (56.4%) | $39,291 |
| Female | 733 (43.6%) | $16,701 |
| Total | 1,680 (100.0%) | $32,967 |
Earnings by Sex by Income Bracket in Country Squire Lakes
The most common earnings brackets in Country Squire Lakes are $75,000 to $99,999 for men (179 | 18.9%) and $15,000 to $17,499 for women (183 | 25.0%).
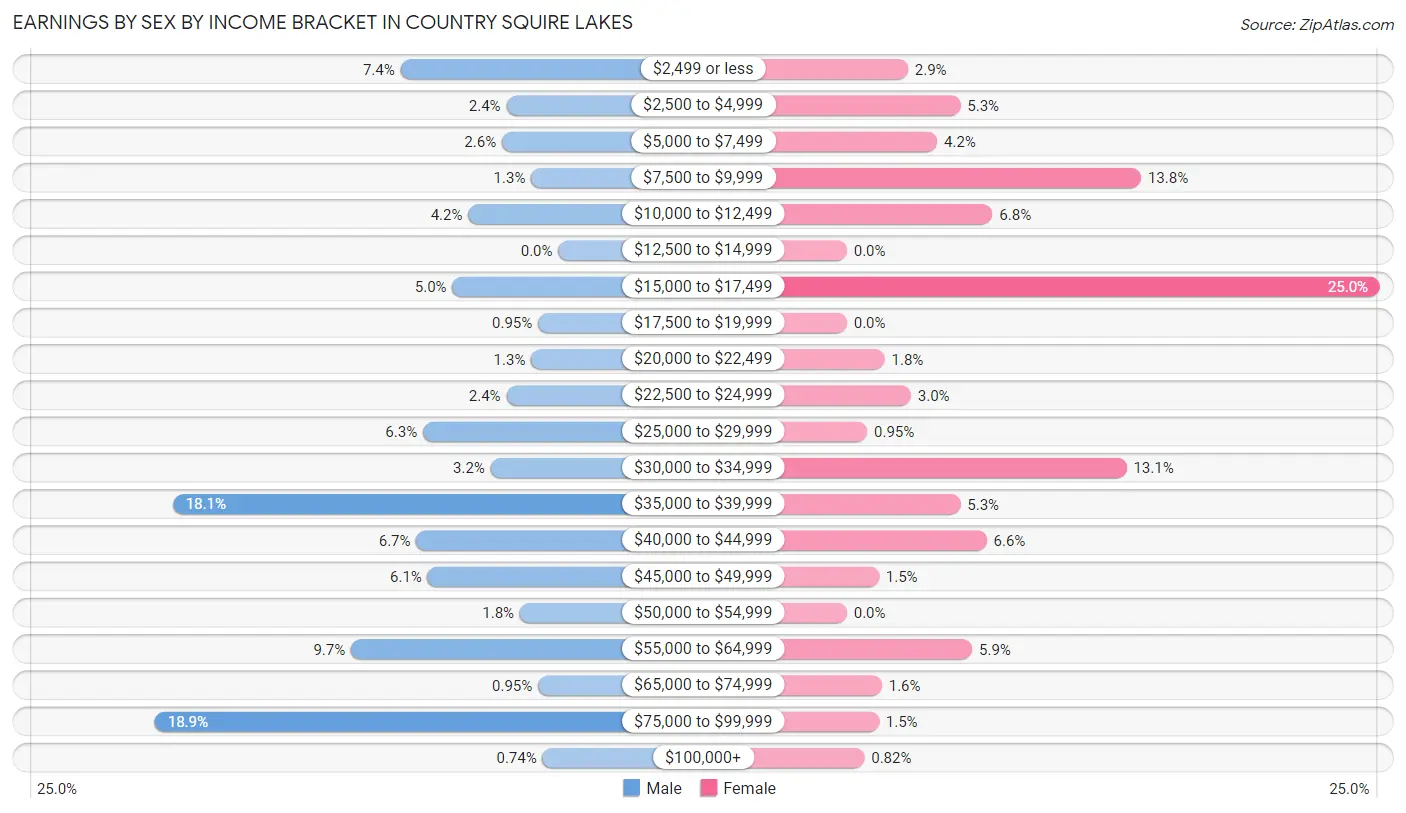
| Income | Male | Female |
| $2,499 or less | 70 (7.4%) | 21 (2.9%) |
| $2,500 to $4,999 | 23 (2.4%) | 39 (5.3%) |
| $5,000 to $7,499 | 25 (2.6%) | 31 (4.2%) |
| $7,500 to $9,999 | 12 (1.3%) | 101 (13.8%) |
| $10,000 to $12,499 | 40 (4.2%) | 50 (6.8%) |
| $12,500 to $14,999 | 0 (0.0%) | 0 (0.0%) |
| $15,000 to $17,499 | 47 (5.0%) | 183 (25.0%) |
| $17,500 to $19,999 | 9 (0.9%) | 0 (0.0%) |
| $20,000 to $22,499 | 12 (1.3%) | 13 (1.8%) |
| $22,500 to $24,999 | 23 (2.4%) | 22 (3.0%) |
| $25,000 to $29,999 | 60 (6.3%) | 7 (0.9%) |
| $30,000 to $34,999 | 30 (3.2%) | 96 (13.1%) |
| $35,000 to $39,999 | 171 (18.1%) | 39 (5.3%) |
| $40,000 to $44,999 | 63 (6.7%) | 48 (6.6%) |
| $45,000 to $49,999 | 58 (6.1%) | 11 (1.5%) |
| $50,000 to $54,999 | 17 (1.8%) | 0 (0.0%) |
| $55,000 to $64,999 | 92 (9.7%) | 43 (5.9%) |
| $65,000 to $74,999 | 9 (0.9%) | 12 (1.6%) |
| $75,000 to $99,999 | 179 (18.9%) | 11 (1.5%) |
| $100,000+ | 7 (0.7%) | 6 (0.8%) |
| Total | 947 (100.0%) | 733 (100.0%) |
Earnings by Sex by Educational Attainment in Country Squire Lakes
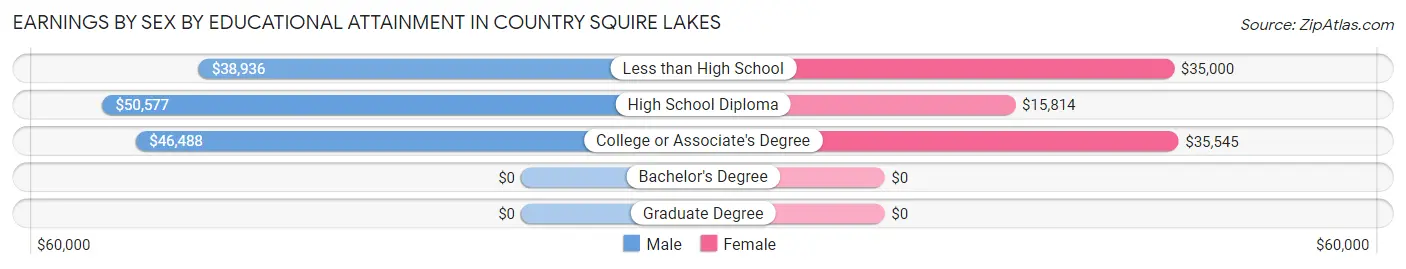
| Educational Attainment | Male Income | Female Income |
| Less than High School | $38,936 | $35,000 |
| High School Diploma | $50,577 | $15,814 |
| College or Associate's Degree | $46,488 | $35,545 |
| Bachelor's Degree | - | - |
| Graduate Degree | - | - |
| Total | $41,222 | $0 |
Family Income in Country Squire Lakes
Family Income Brackets in Country Squire Lakes
According to the Country Squire Lakes family income data, there are 267 families falling into the $35,000 to $49,999 income range, which is the most common income bracket and makes up 30.8% of all families.
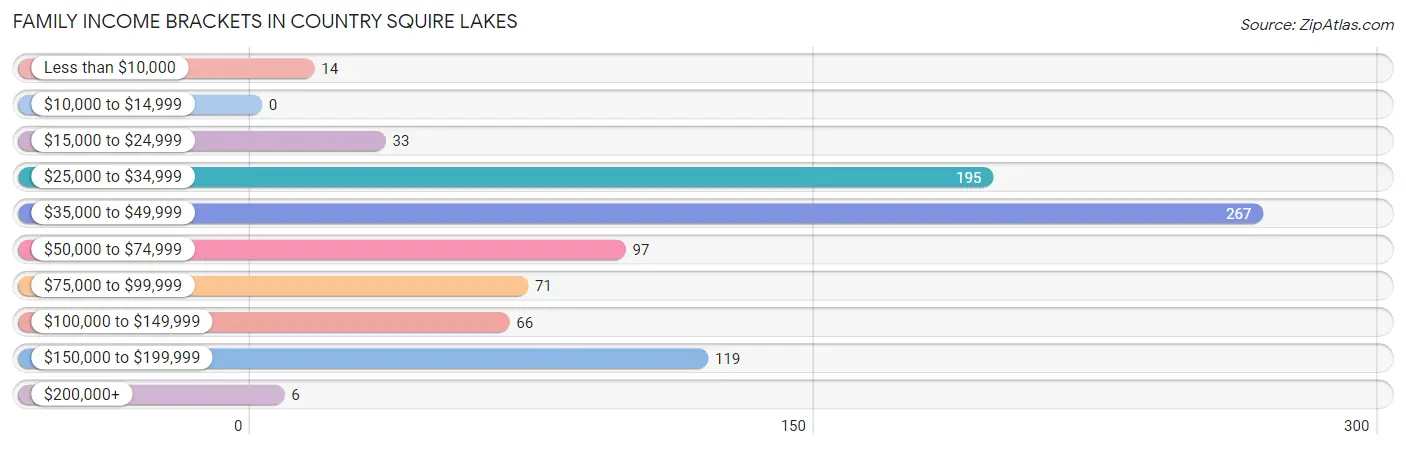
| Income Bracket | # Families | % Families |
| Less than $10,000 | 14 | 1.6% |
| $10,000 to $14,999 | 0 | 0.0% |
| $15,000 to $24,999 | 33 | 3.8% |
| $25,000 to $34,999 | 195 | 22.5% |
| $35,000 to $49,999 | 267 | 30.8% |
| $50,000 to $74,999 | 97 | 11.2% |
| $75,000 to $99,999 | 71 | 8.2% |
| $100,000 to $149,999 | 66 | 7.6% |
| $150,000 to $199,999 | 119 | 13.7% |
| $200,000+ | 6 | 0.7% |
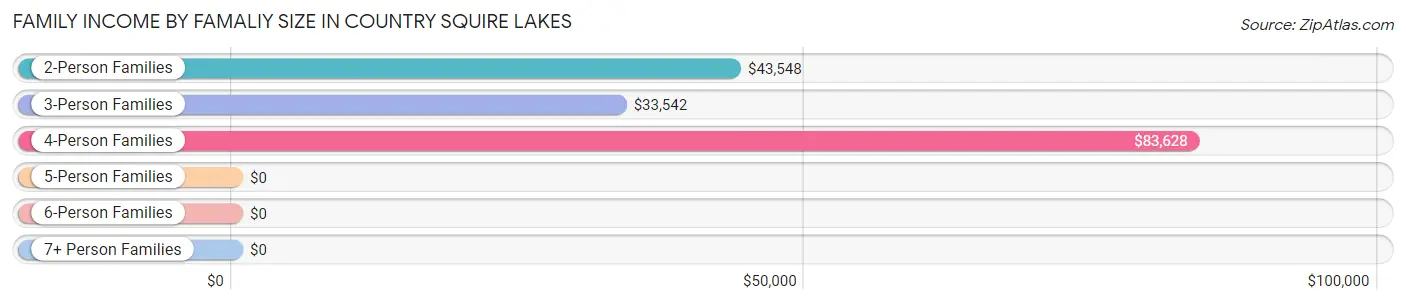
Family Income by Famaliy Size in Country Squire Lakes
4-person families (63 | 7.3%) account for the highest median family income in Country Squire Lakes with $83,628 per family, while 2-person families (433 | 49.9%) have the highest median income of $21,774 per family member.
| Income Bracket | # Families | Median Income |
| 2-Person Families | 433 (49.9%) | $43,548 |
| 3-Person Families | 90 (10.4%) | $33,542 |
| 4-Person Families | 63 (7.3%) | $83,628 |
| 5-Person Families | 227 (26.2%) | $0 |
| 6-Person Families | 49 (5.7%) | $0 |
| 7+ Person Families | 6 (0.7%) | $0 |
| Total | 868 (100.0%) | $44,829 |
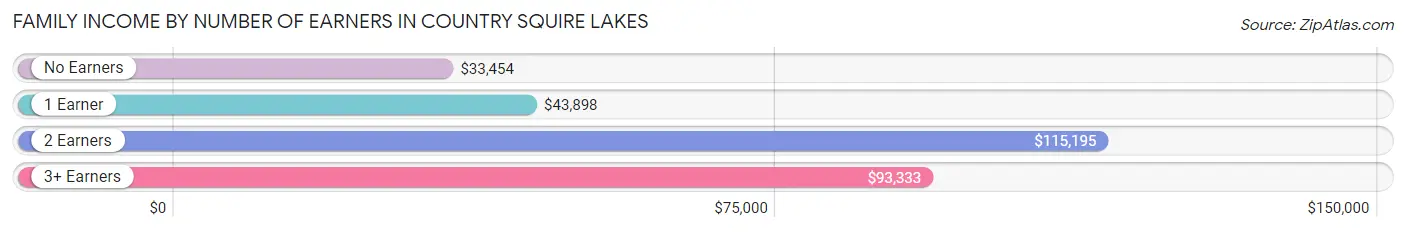
Family Income by Number of Earners in Country Squire Lakes
The median family income in Country Squire Lakes is $44,829, with families comprising 2 earners (327) having the highest median family income of $115,195, while families with no earners (67) have the lowest median family income of $33,454, accounting for 37.7% and 7.7% of families, respectively.
| Number of Earners | # Families | Median Income |
| No Earners | 67 (7.7%) | $33,454 |
| 1 Earner | 412 (47.5%) | $43,898 |
| 2 Earners | 327 (37.7%) | $115,195 |
| 3+ Earners | 62 (7.1%) | $93,333 |
| Total | 868 (100.0%) | $44,829 |
Household Income in Country Squire Lakes
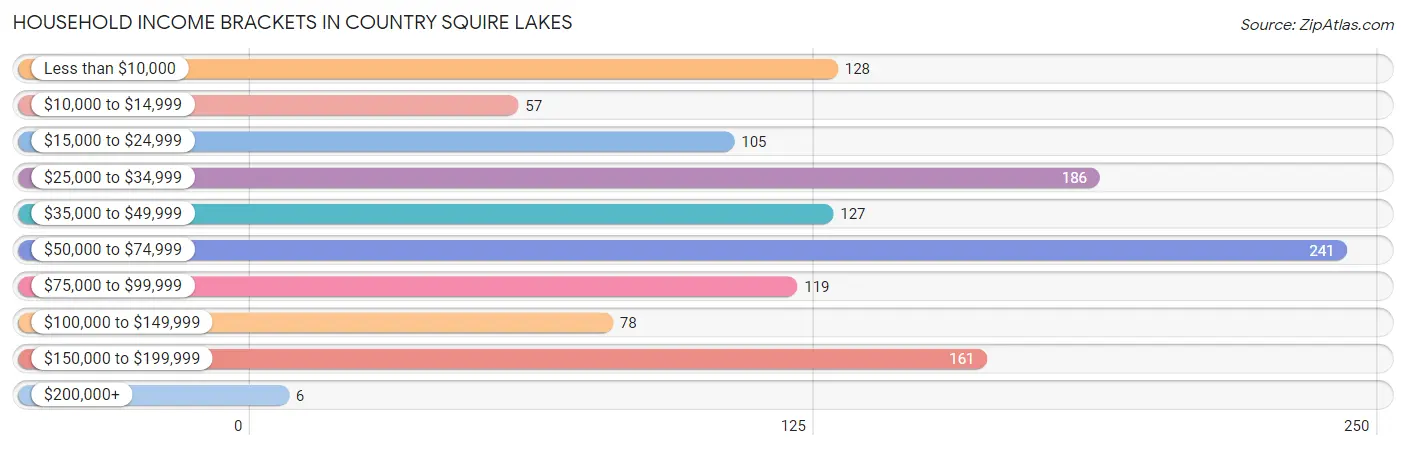
Household Income Brackets in Country Squire Lakes
With 241 households falling in the category, the $50,000 to $74,999 income range is the most frequent in Country Squire Lakes, accounting for 20.0% of all households. In contrast, only 6 households (0.5%) fall into the $200,000+ income bracket, making it the least populous group.
| Income Bracket | # Households | % Households |
| Less than $10,000 | 128 | 10.6% |
| $10,000 to $14,999 | 57 | 4.7% |
| $15,000 to $24,999 | 105 | 8.7% |
| $25,000 to $34,999 | 186 | 15.4% |
| $35,000 to $49,999 | 127 | 10.5% |
| $50,000 to $74,999 | 241 | 20.0% |
| $75,000 to $99,999 | 119 | 9.9% |
| $100,000 to $149,999 | 78 | 6.5% |
| $150,000 to $199,999 | 161 | 13.3% |
| $200,000+ | 6 | 0.5% |
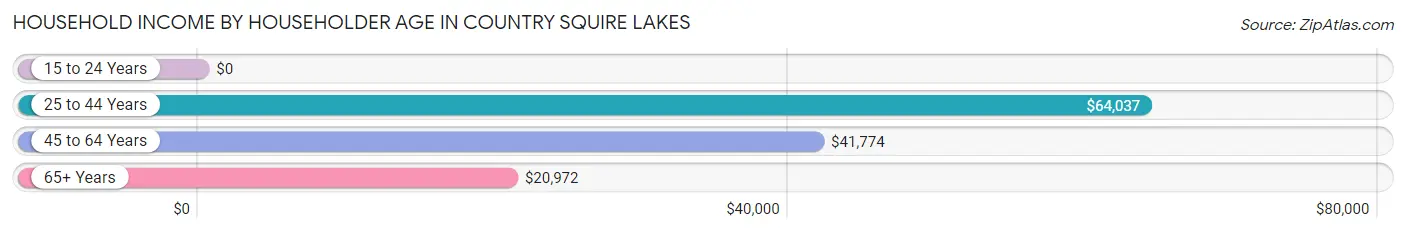
Household Income by Householder Age in Country Squire Lakes
The median household income in Country Squire Lakes is $50,078, with the highest median household income of $64,037 found in the 25 to 44 years age bracket for the primary householder. A total of 496 households (41.1%) fall into this category. Meanwhile, the 15 to 24 years age bracket for the primary householder has the lowest median household income of $0, with 26 households (2.1%) in this group.
| Income Bracket | # Households | Median Income |
| 15 to 24 Years | 26 (2.1%) | $0 |
| 25 to 44 Years | 496 (41.1%) | $64,037 |
| 45 to 64 Years | 594 (49.2%) | $41,774 |
| 65+ Years | 91 (7.5%) | $20,972 |
| Total | 1,207 (100.0%) | $50,078 |
Poverty in Country Squire Lakes
Income Below Poverty by Sex and Age in Country Squire Lakes
With 13.6% poverty level for males and 20.9% for females among the residents of Country Squire Lakes, 45 to 54 year old males and 5 year old females are the most vulnerable to poverty, with 84 males (54.5%) and 17 females (100.0%) in their respective age groups living below the poverty level.
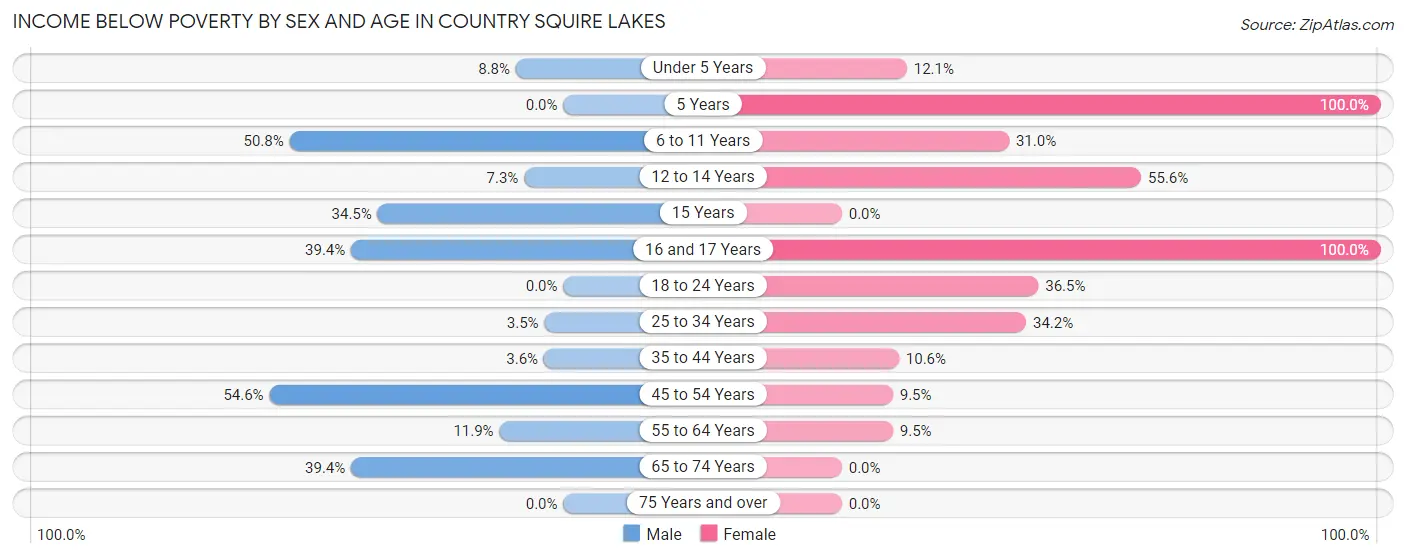
| Age Bracket | Male | Female |
| Under 5 Years | 9 (8.8%) | 17 (12.1%) |
| 5 Years | 0 (0.0%) | 17 (100.0%) |
| 6 to 11 Years | 31 (50.8%) | 18 (31.0%) |
| 12 to 14 Years | 8 (7.3%) | 10 (55.6%) |
| 15 Years | 10 (34.5%) | 0 (0.0%) |
| 16 and 17 Years | 13 (39.4%) | 10 (100.0%) |
| 18 to 24 Years | 0 (0.0%) | 62 (36.5%) |
| 25 to 34 Years | 5 (3.5%) | 92 (34.2%) |
| 35 to 44 Years | 15 (3.6%) | 25 (10.6%) |
| 45 to 54 Years | 84 (54.5%) | 14 (9.5%) |
| 55 to 64 Years | 35 (11.9%) | 23 (9.5%) |
| 65 to 74 Years | 13 (39.4%) | 0 (0.0%) |
| 75 Years and over | 0 (0.0%) | 0 (0.0%) |
| Total | 223 (13.6%) | 288 (20.9%) |
Income Above Poverty by Sex and Age in Country Squire Lakes
According to the poverty statistics in Country Squire Lakes, males aged 5 years and females aged 65 to 74 years are the age groups that are most secure financially, with 100.0% of males and 100.0% of females in these age groups living above the poverty line.
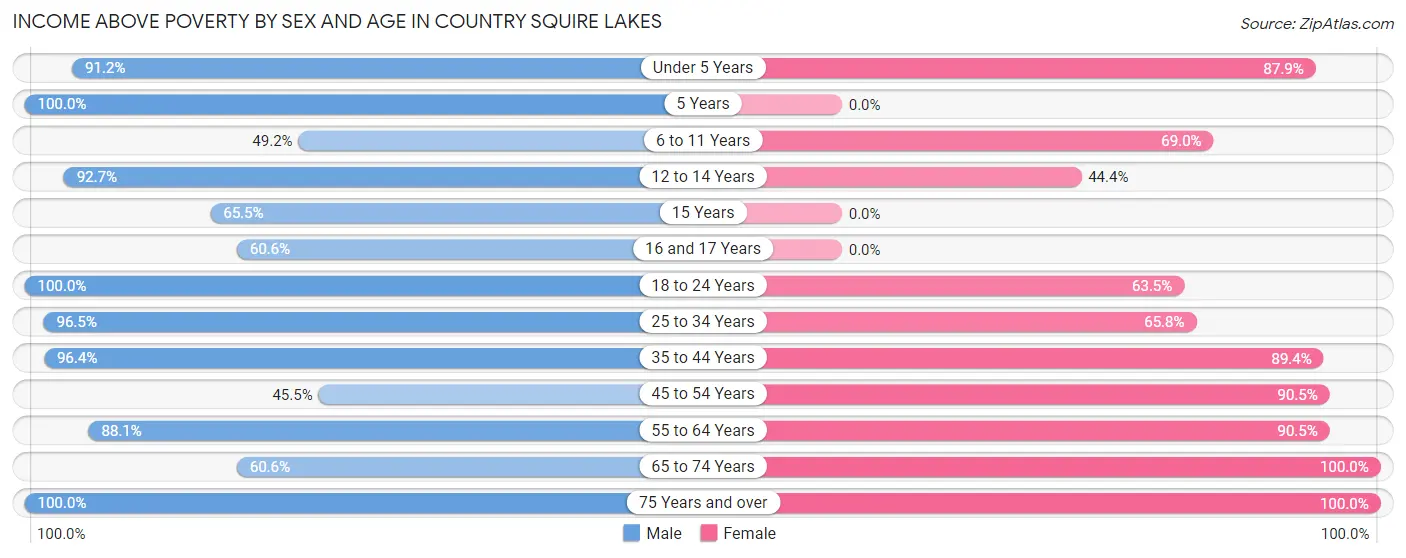
| Age Bracket | Male | Female |
| Under 5 Years | 93 (91.2%) | 124 (87.9%) |
| 5 Years | 18 (100.0%) | 0 (0.0%) |
| 6 to 11 Years | 30 (49.2%) | 40 (69.0%) |
| 12 to 14 Years | 102 (92.7%) | 8 (44.4%) |
| 15 Years | 19 (65.5%) | 0 (0.0%) |
| 16 and 17 Years | 20 (60.6%) | 0 (0.0%) |
| 18 to 24 Years | 189 (100.0%) | 108 (63.5%) |
| 25 to 34 Years | 137 (96.5%) | 177 (65.8%) |
| 35 to 44 Years | 402 (96.4%) | 211 (89.4%) |
| 45 to 54 Years | 70 (45.5%) | 134 (90.5%) |
| 55 to 64 Years | 260 (88.1%) | 220 (90.5%) |
| 65 to 74 Years | 20 (60.6%) | 50 (100.0%) |
| 75 Years and over | 60 (100.0%) | 18 (100.0%) |
| Total | 1,420 (86.4%) | 1,090 (79.1%) |
Income Below Poverty Among Married-Couple Families in Country Squire Lakes
The poverty statistics for married-couple families in Country Squire Lakes show that 2.5% or 10 of the total 408 families live below the poverty line. Families with 3 or 4 children have the highest poverty rate of 5.8%, comprising of 10 families. On the other hand, families with no children have the lowest poverty rate of 0.0%, which includes 0 families.
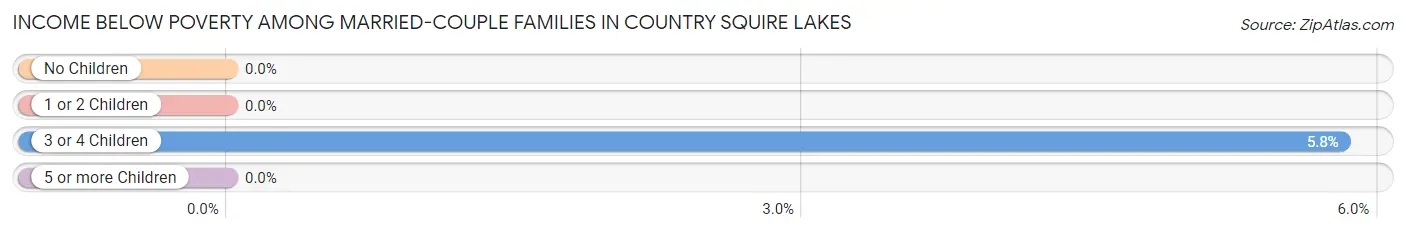
| Children | Above Poverty | Below Poverty |
| No Children | 201 (100.0%) | 0 (0.0%) |
| 1 or 2 Children | 35 (100.0%) | 0 (0.0%) |
| 3 or 4 Children | 162 (94.2%) | 10 (5.8%) |
| 5 or more Children | 0 (0.0%) | 0 (0.0%) |
| Total | 398 (97.6%) | 10 (2.5%) |
Income Below Poverty Among Single-Parent Households in Country Squire Lakes
According to the poverty data in Country Squire Lakes, 3.1% or 9 single-father households and 32.0% or 55 single-mother households are living below the poverty line. Among single-father households, those with 1 or 2 children have the highest poverty rate, with 9 households (4.1%) experiencing poverty. Likewise, among single-mother households, those with 3 or 4 children have the highest poverty rate, with 41 households (100.0%) falling below the poverty line.
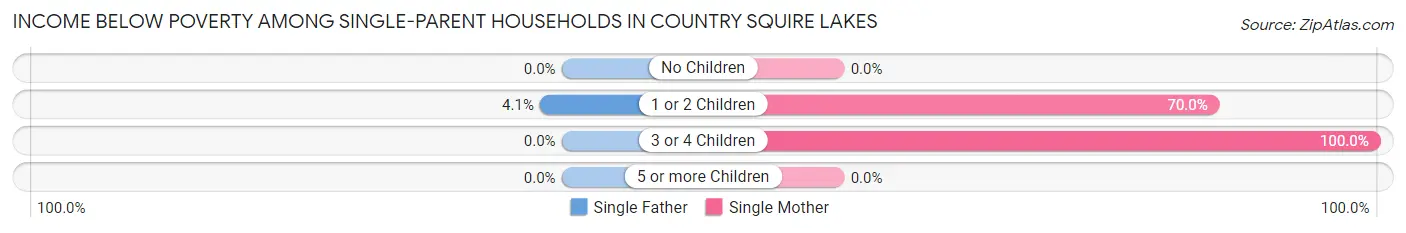
| Children | Single Father | Single Mother |
| No Children | 0 (0.0%) | 0 (0.0%) |
| 1 or 2 Children | 9 (4.1%) | 14 (70.0%) |
| 3 or 4 Children | 0 (0.0%) | 41 (100.0%) |
| 5 or more Children | 0 (0.0%) | 0 (0.0%) |
| Total | 9 (3.1%) | 55 (32.0%) |
Income Below Poverty Among Married-Couple vs Single-Parent Households in Country Squire Lakes
The poverty data for Country Squire Lakes shows that 10 of the married-couple family households (2.5%) and 64 of the single-parent households (13.9%) are living below the poverty level. Within the married-couple family households, those with 3 or 4 children have the highest poverty rate, with 10 households (5.8%) falling below the poverty line. Among the single-parent households, those with 3 or 4 children have the highest poverty rate, with 41 household (45.6%) living below poverty.
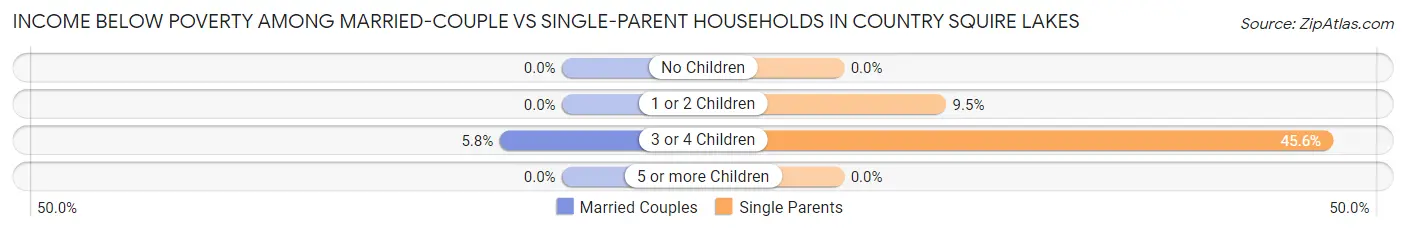
| Children | Married-Couple Families | Single-Parent Households |
| No Children | 0 (0.0%) | 0 (0.0%) |
| 1 or 2 Children | 0 (0.0%) | 23 (9.5%) |
| 3 or 4 Children | 10 (5.8%) | 41 (45.6%) |
| 5 or more Children | 0 (0.0%) | 0 (0.0%) |
| Total | 10 (2.5%) | 64 (13.9%) |
Employment Characteristics in Country Squire Lakes
Employment by Class of Employer in Country Squire Lakes
Among the 1,412 employed individuals in Country Squire Lakes, private company employees (1,331 | 94.3%), self-employed (incorporated) (49 | 3.5%), and state government employees (12 | 0.9%) make up the most common classes of employment.
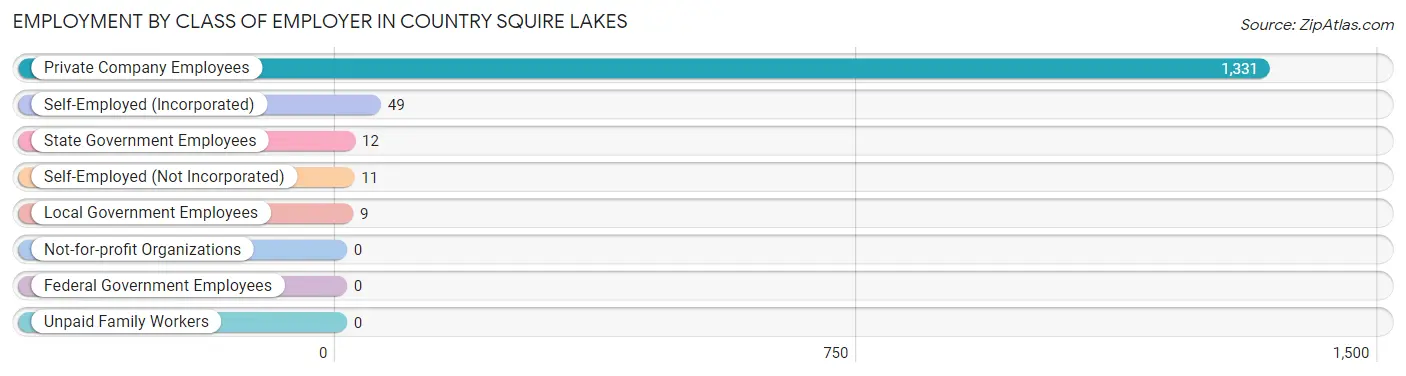
| Employer Class | # Employees | % Employees |
| Private Company Employees | 1,331 | 94.3% |
| Self-Employed (Incorporated) | 49 | 3.5% |
| Self-Employed (Not Incorporated) | 11 | 0.8% |
| Not-for-profit Organizations | 0 | 0.0% |
| Local Government Employees | 9 | 0.6% |
| State Government Employees | 12 | 0.9% |
| Federal Government Employees | 0 | 0.0% |
| Unpaid Family Workers | 0 | 0.0% |
| Total | 1,412 | 100.0% |
Employment Status by Age in Country Squire Lakes
According to the labor force statistics for Country Squire Lakes, out of the total population over 16 years of age (2,467), 69.4% or 1,712 individuals are in the labor force, with 14.6% or 250 of them unemployed. The age group with the highest labor force participation rate is 20 to 24 years, with 100.0% or 191 individuals in the labor force. Within the labor force, the 20 to 24 years age range has the highest percentage of unemployed individuals, with 52.4% or 100 of them being unemployed.
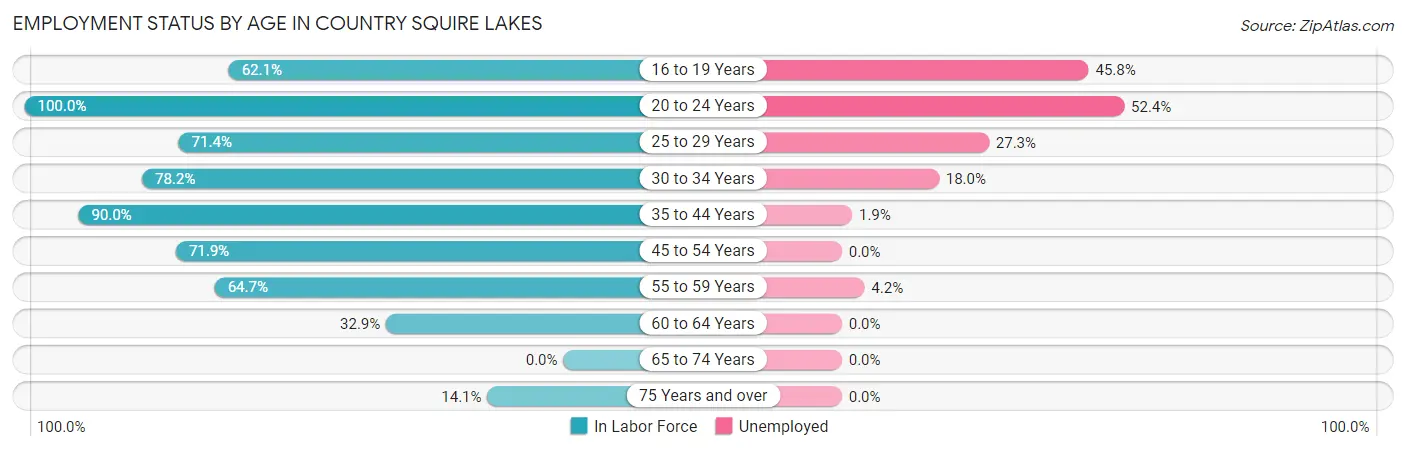
| Age Bracket | In Labor Force | Unemployed |
| 16 to 19 Years | 131 (62.1%) | 60 (45.8%) |
| 20 to 24 Years | 191 (100.0%) | 100 (52.4%) |
| 25 to 29 Years | 172 (71.4%) | 47 (27.3%) |
| 30 to 34 Years | 133 (78.2%) | 24 (18.0%) |
| 35 to 44 Years | 588 (90.0%) | 11 (1.9%) |
| 45 to 54 Years | 217 (71.9%) | 0 (0.0%) |
| 55 to 59 Years | 189 (64.7%) | 8 (4.2%) |
| 60 to 64 Years | 81 (32.9%) | 0 (0.0%) |
| 65 to 74 Years | 0 (0.0%) | 0 (0.0%) |
| 75 Years and over | 11 (14.1%) | 0 (0.0%) |
| Total | 1,712 (69.4%) | 250 (14.6%) |
Employment Status by Educational Attainment in Country Squire Lakes
According to labor force statistics for Country Squire Lakes, 72.5% of individuals (1,380) out of the total population between 25 and 64 years of age (1,904) are in the labor force, with 6.5% or 90 of them being unemployed. The group with the highest labor force participation rate are those with the educational attainment of bachelor's degree or higher, with 100.0% or 23 individuals in the labor force. Within the labor force, individuals with less than high school education have the highest percentage of unemployment, with 10.9% or 35 of them being unemployed.
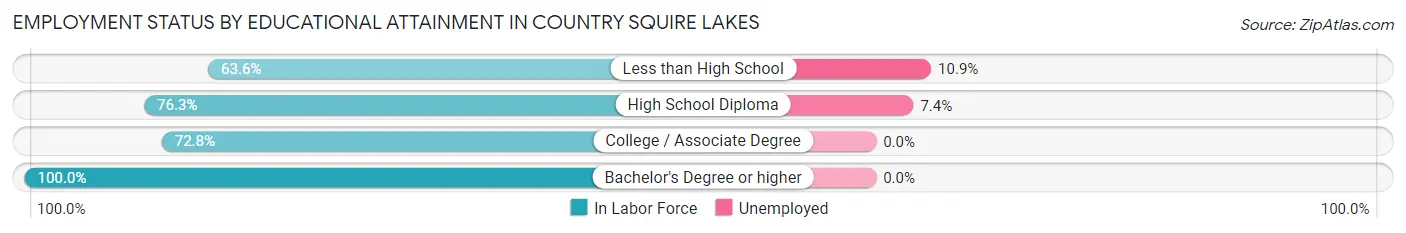
| Educational Attainment | In Labor Force | Unemployed |
| Less than High School | 320 (63.6%) | 55 (10.9%) |
| High School Diploma | 742 (76.3%) | 72 (7.4%) |
| College / Associate Degree | 295 (72.8%) | 0 (0.0%) |
| Bachelor's Degree or higher | 23 (100.0%) | 0 (0.0%) |
| Total | 1,380 (72.5%) | 124 (6.5%) |
Employment Occupations by Sex in Country Squire Lakes
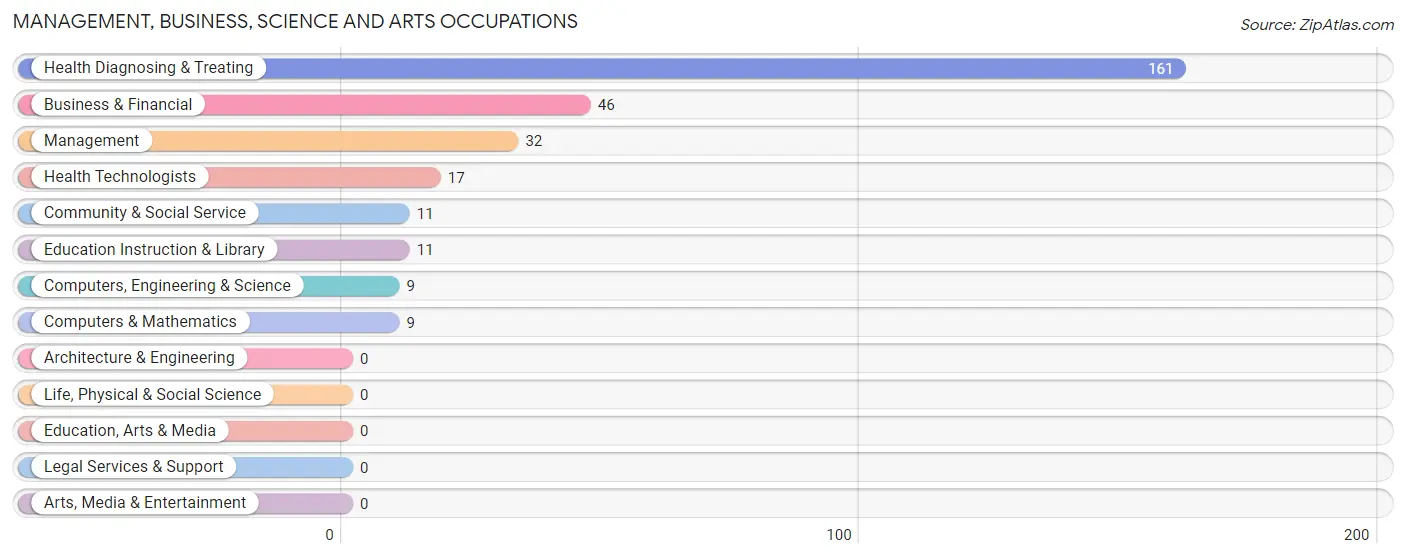
Management, Business, Science and Arts Occupations
The most common Management, Business, Science and Arts occupations in Country Squire Lakes are Health Diagnosing & Treating (161 | 11.0%), Business & Financial (46 | 3.1%), Management (32 | 2.2%), Health Technologists (17 | 1.2%), and Community & Social Service (11 | 0.7%).
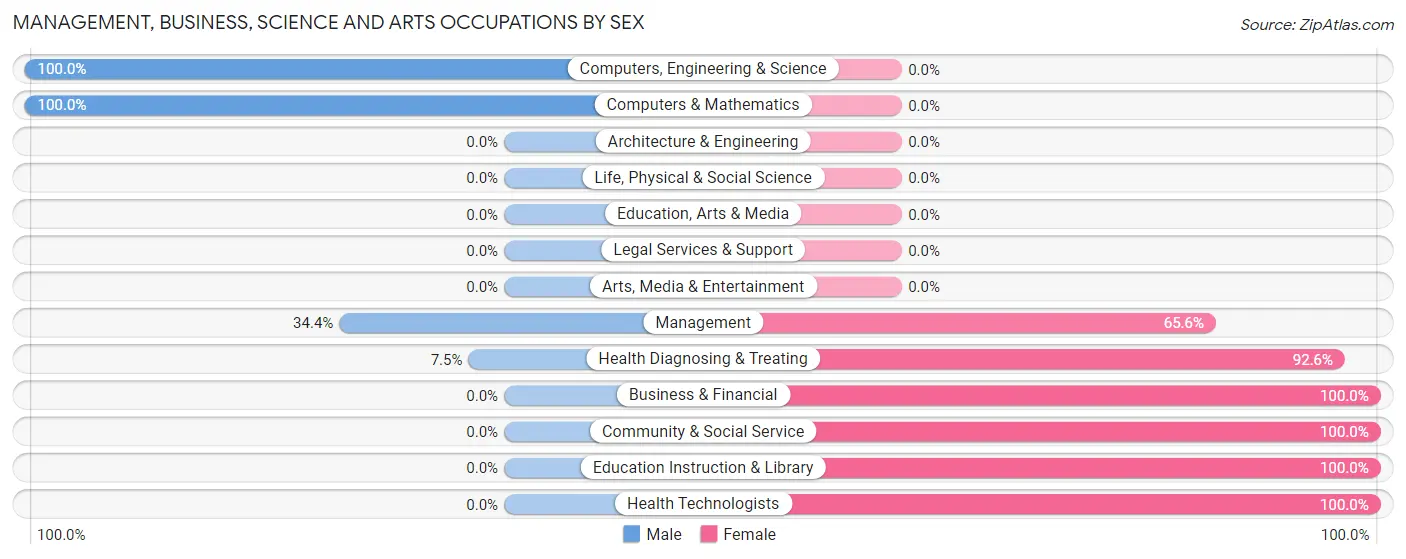
Management, Business, Science and Arts Occupations by Sex
Within the Management, Business, Science and Arts occupations in Country Squire Lakes, the most male-oriented occupations are Computers, Engineering & Science (100.0%), Computers & Mathematics (100.0%), and Management (34.4%), while the most female-oriented occupations are Business & Financial (100.0%), Community & Social Service (100.0%), and Education Instruction & Library (100.0%).
| Occupation | Male | Female |
| Management | 11 (34.4%) | 21 (65.6%) |
| Business & Financial | 0 (0.0%) | 46 (100.0%) |
| Computers, Engineering & Science | 9 (100.0%) | 0 (0.0%) |
| Computers & Mathematics | 9 (100.0%) | 0 (0.0%) |
| Architecture & Engineering | 0 (0.0%) | 0 (0.0%) |
| Life, Physical & Social Science | 0 (0.0%) | 0 (0.0%) |
| Community & Social Service | 0 (0.0%) | 11 (100.0%) |
| Education, Arts & Media | 0 (0.0%) | 0 (0.0%) |
| Legal Services & Support | 0 (0.0%) | 0 (0.0%) |
| Education Instruction & Library | 0 (0.0%) | 11 (100.0%) |
| Arts, Media & Entertainment | 0 (0.0%) | 0 (0.0%) |
| Health Diagnosing & Treating | 12 (7.4%) | 149 (92.5%) |
| Health Technologists | 0 (0.0%) | 17 (100.0%) |
| Total (Category) | 32 (12.4%) | 227 (87.6%) |
| Total (Overall) | 859 (58.7%) | 604 (41.3%) |
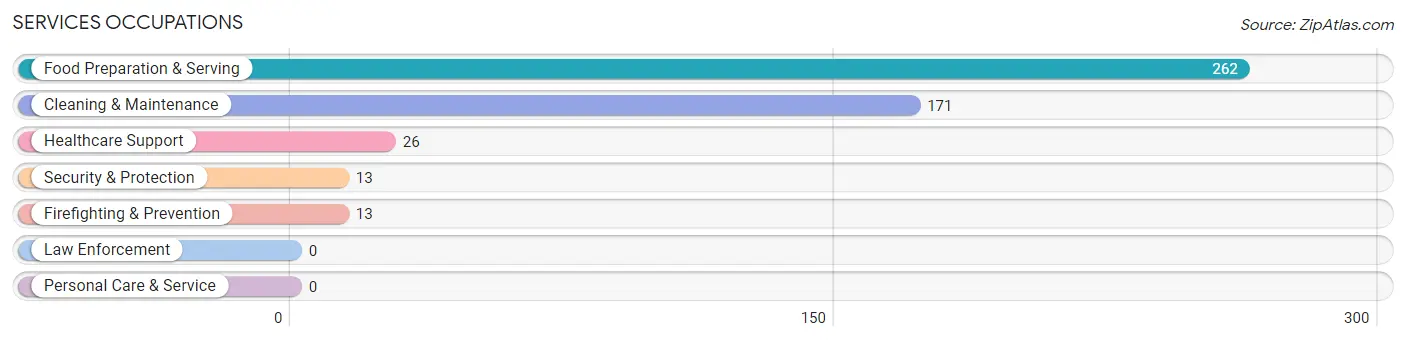
Services Occupations
The most common Services occupations in Country Squire Lakes are Food Preparation & Serving (262 | 17.9%), Cleaning & Maintenance (171 | 11.7%), Healthcare Support (26 | 1.8%), Security & Protection (13 | 0.9%), and Firefighting & Prevention (13 | 0.9%).
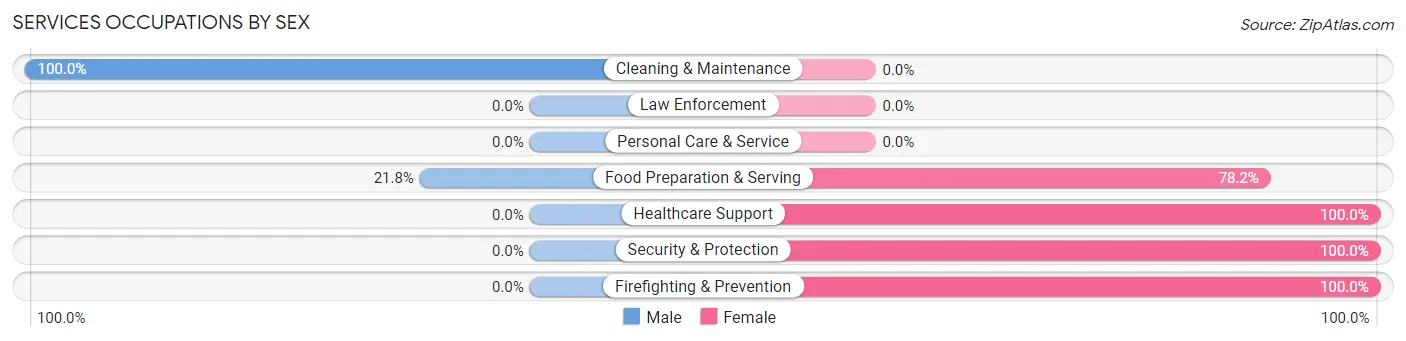
Services Occupations by Sex
Within the Services occupations in Country Squire Lakes, the most male-oriented occupations are Cleaning & Maintenance (100.0%), and Food Preparation & Serving (21.8%), while the most female-oriented occupations are Healthcare Support (100.0%), Security & Protection (100.0%), and Firefighting & Prevention (100.0%).
| Occupation | Male | Female |
| Healthcare Support | 0 (0.0%) | 26 (100.0%) |
| Security & Protection | 0 (0.0%) | 13 (100.0%) |
| Firefighting & Prevention | 0 (0.0%) | 13 (100.0%) |
| Law Enforcement | 0 (0.0%) | 0 (0.0%) |
| Food Preparation & Serving | 57 (21.8%) | 205 (78.2%) |
| Cleaning & Maintenance | 171 (100.0%) | 0 (0.0%) |
| Personal Care & Service | 0 (0.0%) | 0 (0.0%) |
| Total (Category) | 228 (48.3%) | 244 (51.7%) |
| Total (Overall) | 859 (58.7%) | 604 (41.3%) |
Sales and Office Occupations
The most common Sales and Office occupations in Country Squire Lakes are Office & Administration (111 | 7.6%), and Sales & Related (42 | 2.9%).
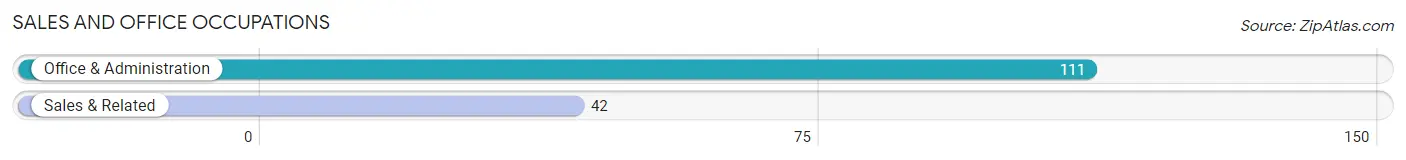
Sales and Office Occupations by Sex
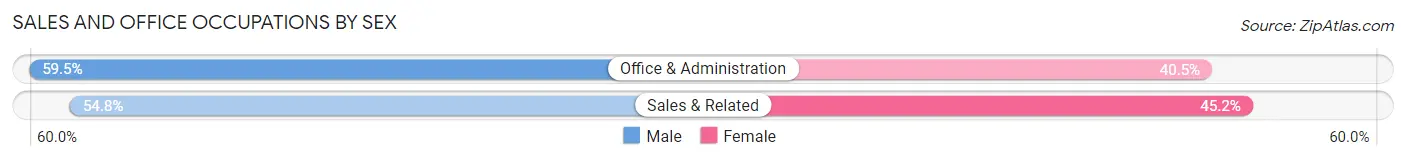
| Occupation | Male | Female |
| Sales & Related | 23 (54.8%) | 19 (45.2%) |
| Office & Administration | 66 (59.5%) | 45 (40.5%) |
| Total (Category) | 89 (58.2%) | 64 (41.8%) |
| Total (Overall) | 859 (58.7%) | 604 (41.3%) |
Natural Resources, Construction and Maintenance Occupations
The most common Natural Resources, Construction and Maintenance occupations in Country Squire Lakes are Installation, Maintenance & Repair (175 | 12.0%), and Construction & Extraction (61 | 4.2%).
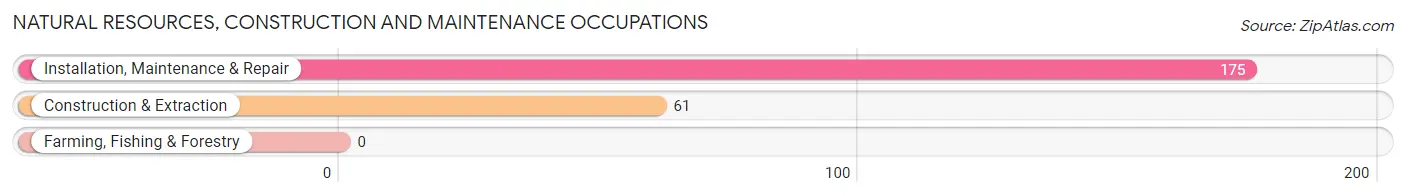
Natural Resources, Construction and Maintenance Occupations by Sex
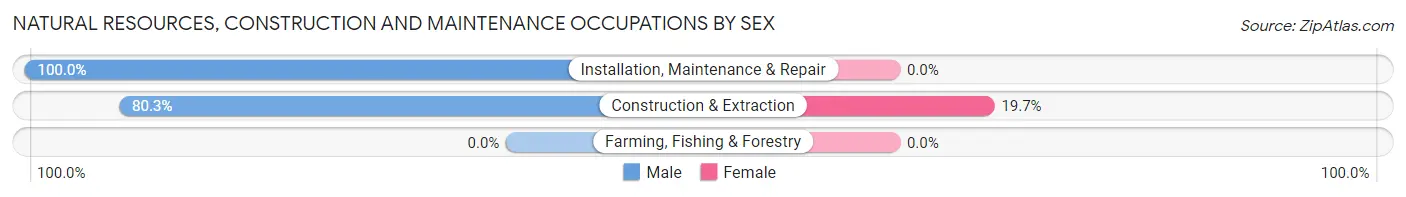
| Occupation | Male | Female |
| Farming, Fishing & Forestry | 0 (0.0%) | 0 (0.0%) |
| Construction & Extraction | 49 (80.3%) | 12 (19.7%) |
| Installation, Maintenance & Repair | 175 (100.0%) | 0 (0.0%) |
| Total (Category) | 224 (94.9%) | 12 (5.1%) |
| Total (Overall) | 859 (58.7%) | 604 (41.3%) |
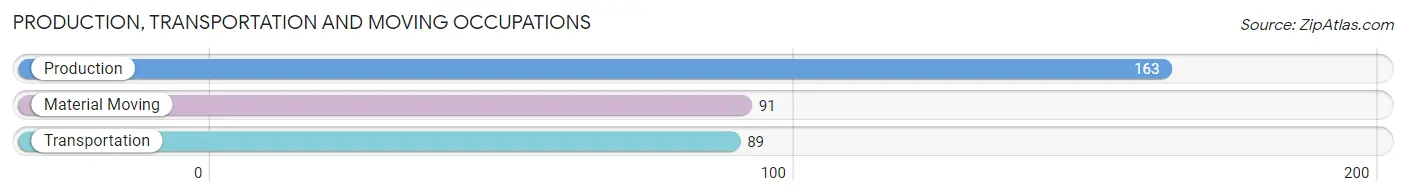
Production, Transportation and Moving Occupations
The most common Production, Transportation and Moving occupations in Country Squire Lakes are Production (163 | 11.1%), Material Moving (91 | 6.2%), and Transportation (89 | 6.1%).
Production, Transportation and Moving Occupations by Sex
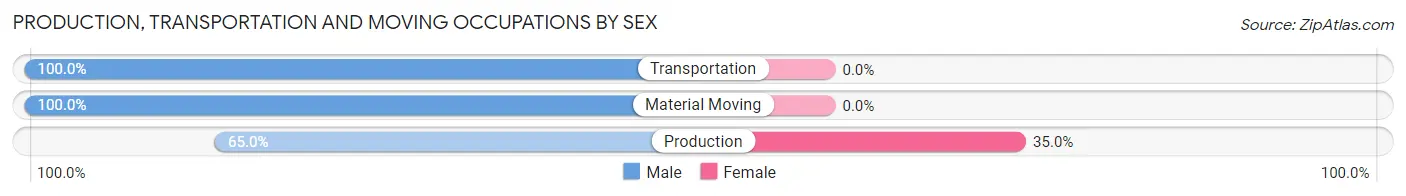
| Occupation | Male | Female |
| Production | 106 (65.0%) | 57 (35.0%) |
| Transportation | 89 (100.0%) | 0 (0.0%) |
| Material Moving | 91 (100.0%) | 0 (0.0%) |
| Total (Category) | 286 (83.4%) | 57 (16.6%) |
| Total (Overall) | 859 (58.7%) | 604 (41.3%) |
Employment Industries by Sex in Country Squire Lakes
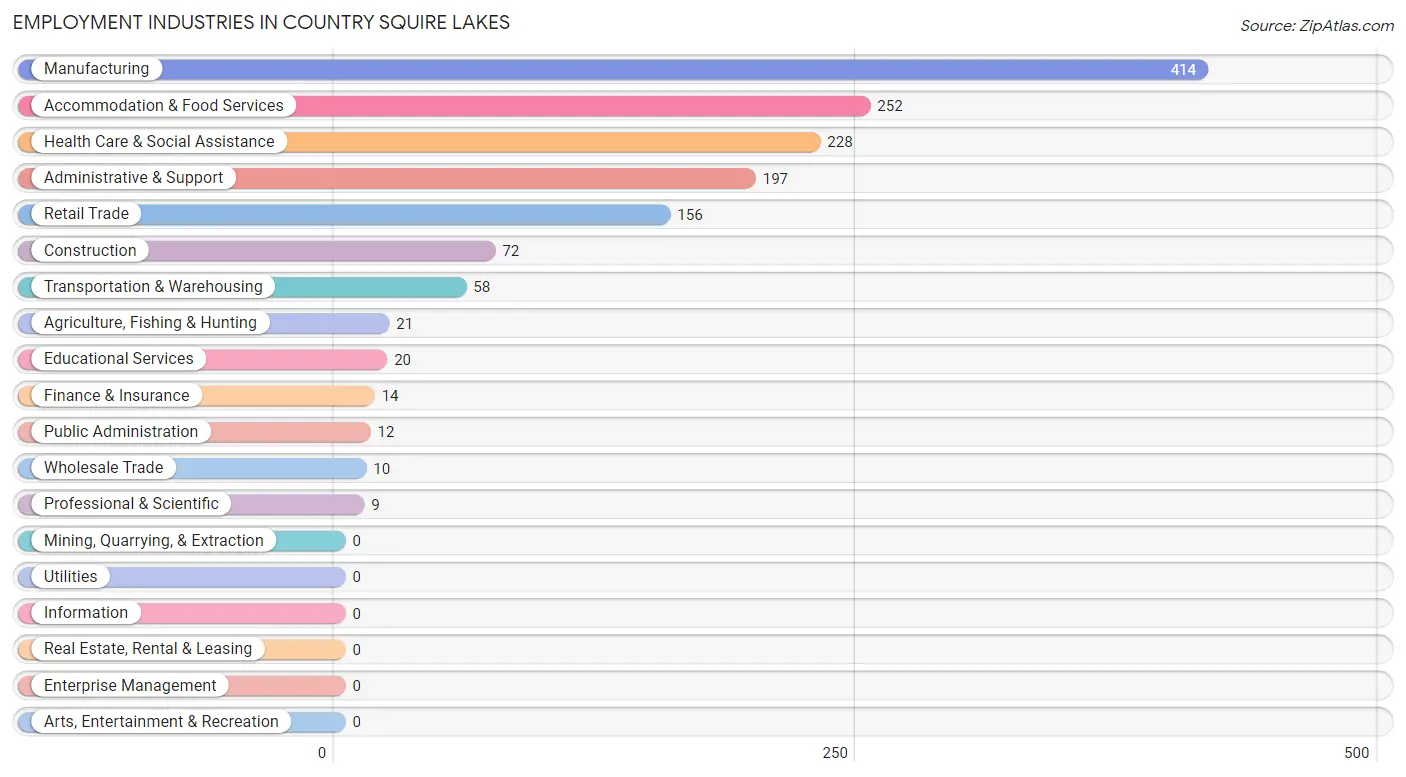
Employment Industries in Country Squire Lakes
The major employment industries in Country Squire Lakes include Manufacturing (414 | 28.3%), Accommodation & Food Services (252 | 17.2%), Health Care & Social Assistance (228 | 15.6%), Administrative & Support (197 | 13.5%), and Retail Trade (156 | 10.7%).
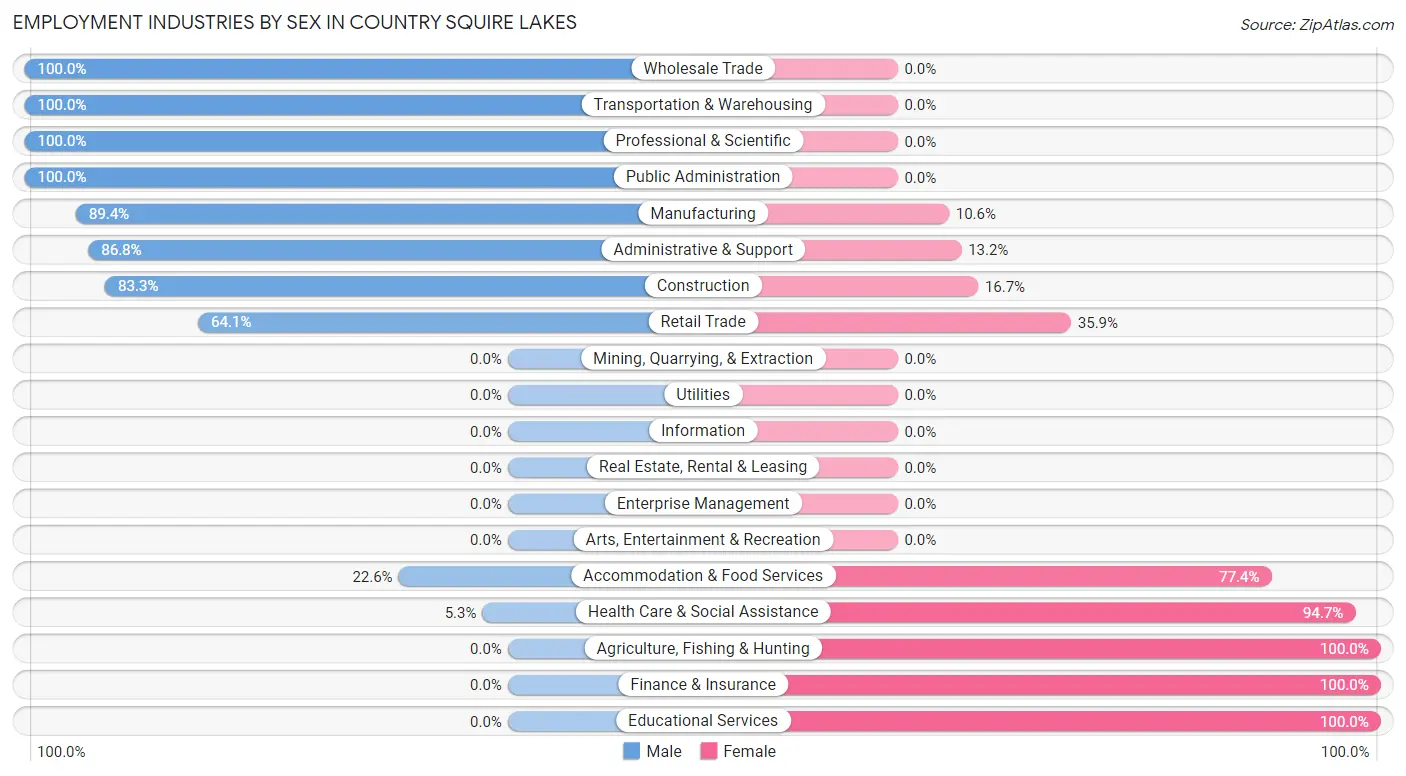
Employment Industries by Sex in Country Squire Lakes
The Country Squire Lakes industries that see more men than women are Wholesale Trade (100.0%), Transportation & Warehousing (100.0%), and Professional & Scientific (100.0%), whereas the industries that tend to have a higher number of women are Agriculture, Fishing & Hunting (100.0%), Finance & Insurance (100.0%), and Educational Services (100.0%).
| Industry | Male | Female |
| Agriculture, Fishing & Hunting | 0 (0.0%) | 21 (100.0%) |
| Mining, Quarrying, & Extraction | 0 (0.0%) | 0 (0.0%) |
| Construction | 60 (83.3%) | 12 (16.7%) |
| Manufacturing | 370 (89.4%) | 44 (10.6%) |
| Wholesale Trade | 10 (100.0%) | 0 (0.0%) |
| Retail Trade | 100 (64.1%) | 56 (35.9%) |
| Transportation & Warehousing | 58 (100.0%) | 0 (0.0%) |
| Utilities | 0 (0.0%) | 0 (0.0%) |
| Information | 0 (0.0%) | 0 (0.0%) |
| Finance & Insurance | 0 (0.0%) | 14 (100.0%) |
| Real Estate, Rental & Leasing | 0 (0.0%) | 0 (0.0%) |
| Professional & Scientific | 9 (100.0%) | 0 (0.0%) |
| Enterprise Management | 0 (0.0%) | 0 (0.0%) |
| Administrative & Support | 171 (86.8%) | 26 (13.2%) |
| Educational Services | 0 (0.0%) | 20 (100.0%) |
| Health Care & Social Assistance | 12 (5.3%) | 216 (94.7%) |
| Arts, Entertainment & Recreation | 0 (0.0%) | 0 (0.0%) |
| Accommodation & Food Services | 57 (22.6%) | 195 (77.4%) |
| Public Administration | 12 (100.0%) | 0 (0.0%) |
| Total | 859 (58.7%) | 604 (41.3%) |
Education in Country Squire Lakes
School Enrollment in Country Squire Lakes
The most common levels of schooling among the 459 students in Country Squire Lakes are middle school (162 | 35.3%), high school (108 | 23.5%), and elementary school (76 | 16.6%).
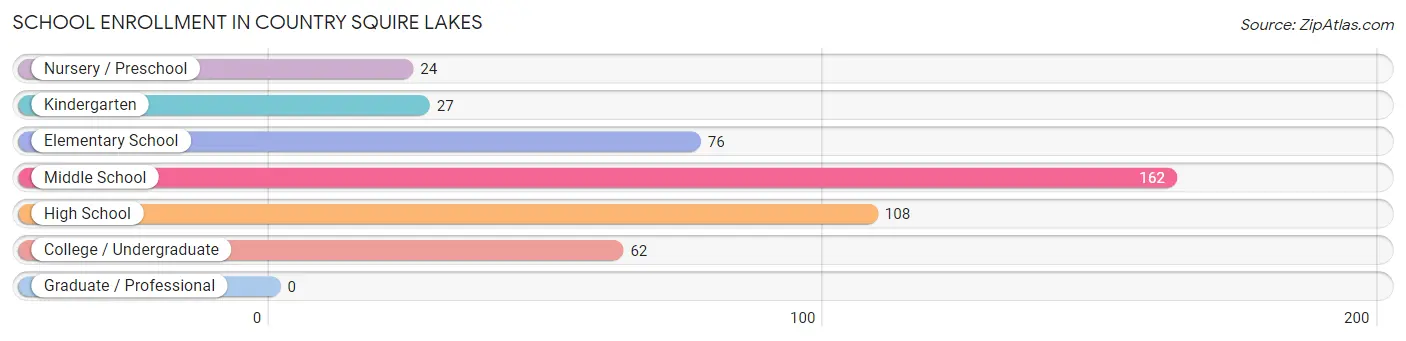
| School Level | # Students | % Students |
| Nursery / Preschool | 24 | 5.2% |
| Kindergarten | 27 | 5.9% |
| Elementary School | 76 | 16.6% |
| Middle School | 162 | 35.3% |
| High School | 108 | 23.5% |
| College / Undergraduate | 62 | 13.5% |
| Graduate / Professional | 0 | 0.0% |
| Total | 459 | 100.0% |
School Enrollment by Age by Funding Source in Country Squire Lakes
Out of a total of 459 students who are enrolled in schools in Country Squire Lakes, 30 (6.5%) attend a private institution, while the remaining 429 (93.5%) are enrolled in public schools. The age group of 15 to 17 year olds has the highest likelihood of being enrolled in private schools, with 22 (30.6% in the age bracket) enrolled. Conversely, the age group of 3 to 4 year olds has the lowest likelihood of being enrolled in a private school, with 17 (100.0% in the age bracket) attending a public institution.
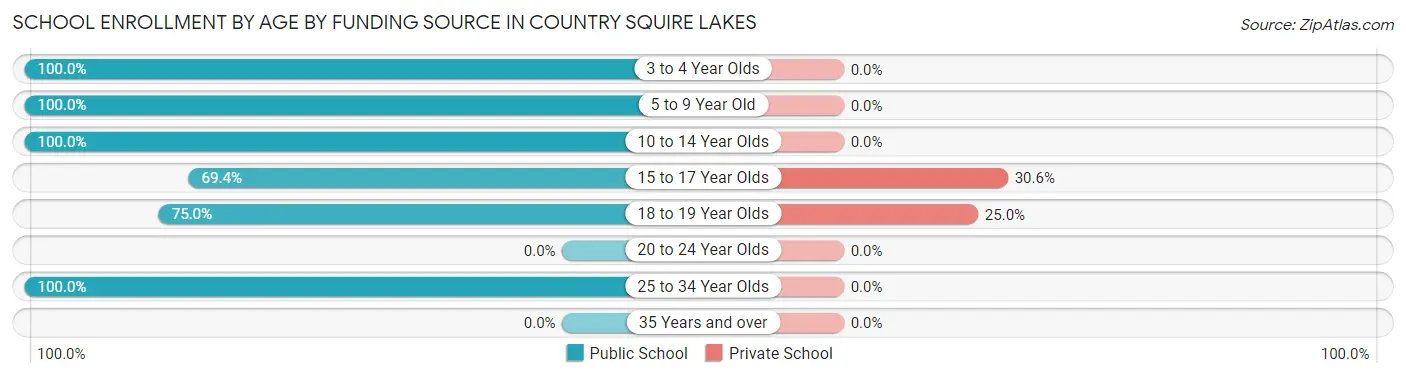
| Age Bracket | Public School | Private School |
| 3 to 4 Year Olds | 17 (100.0%) | 0 (0.0%) |
| 5 to 9 Year Old | 101 (100.0%) | 0 (0.0%) |
| 10 to 14 Year Olds | 173 (100.0%) | 0 (0.0%) |
| 15 to 17 Year Olds | 50 (69.4%) | 22 (30.6%) |
| 18 to 19 Year Olds | 24 (75.0%) | 8 (25.0%) |
| 20 to 24 Year Olds | 0 (0.0%) | 0 (0.0%) |
| 25 to 34 Year Olds | 64 (100.0%) | 0 (0.0%) |
| 35 Years and over | 0 (0.0%) | 0 (0.0%) |
| Total | 429 (93.5%) | 30 (6.5%) |
Educational Attainment by Field of Study in Country Squire Lakes
Science & technology (27 | 30.7%), computers & mathematics (15 | 17.1%), physical & health sciences (15 | 17.1%), liberal arts & history (11 | 12.5%), and social sciences (10 | 11.4%) are the most common fields of study among 88 individuals in Country Squire Lakes who have obtained a bachelor's degree or higher.
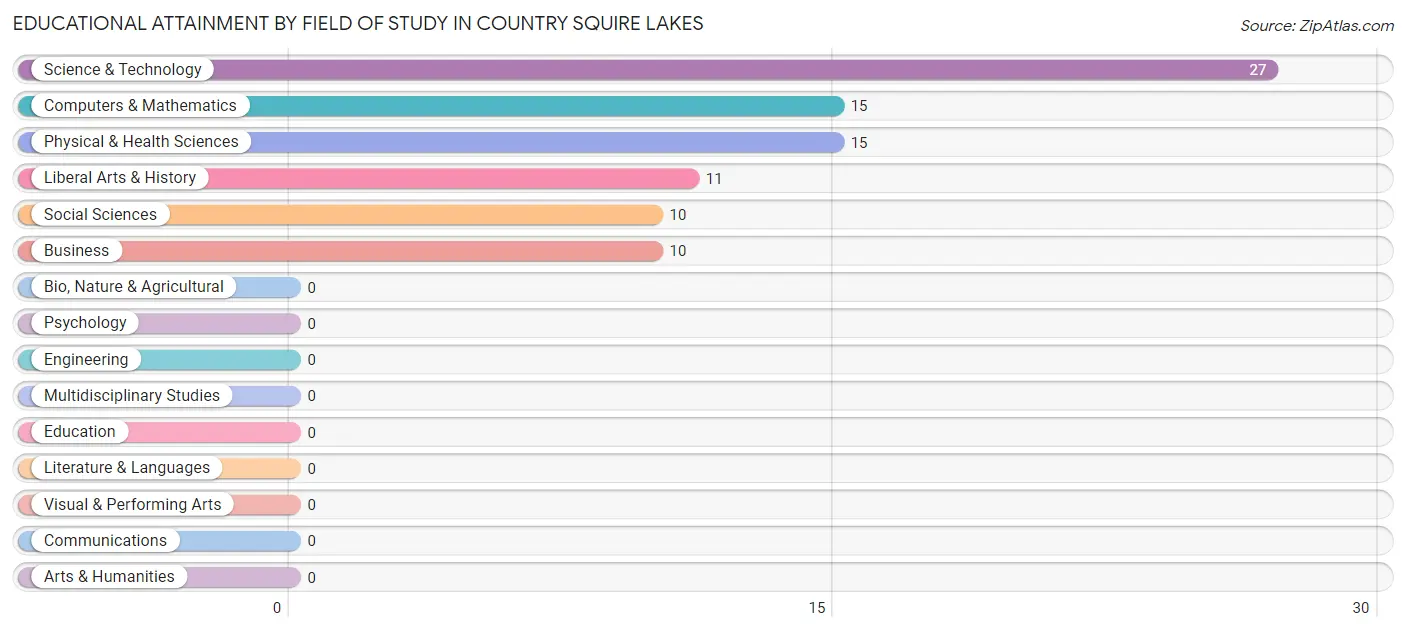
| Field of Study | # Graduates | % Graduates |
| Computers & Mathematics | 15 | 17.1% |
| Bio, Nature & Agricultural | 0 | 0.0% |
| Physical & Health Sciences | 15 | 17.1% |
| Psychology | 0 | 0.0% |
| Social Sciences | 10 | 11.4% |
| Engineering | 0 | 0.0% |
| Multidisciplinary Studies | 0 | 0.0% |
| Science & Technology | 27 | 30.7% |
| Business | 10 | 11.4% |
| Education | 0 | 0.0% |
| Literature & Languages | 0 | 0.0% |
| Liberal Arts & History | 11 | 12.5% |
| Visual & Performing Arts | 0 | 0.0% |
| Communications | 0 | 0.0% |
| Arts & Humanities | 0 | 0.0% |
| Total | 88 | 100.0% |
Transportation & Commute in Country Squire Lakes
Vehicle Availability by Sex in Country Squire Lakes
The most prevalent vehicle ownership categories in Country Squire Lakes are males with 2 vehicles (390, accounting for 45.8%) and females with 2 vehicles (291, making up 69.5%).
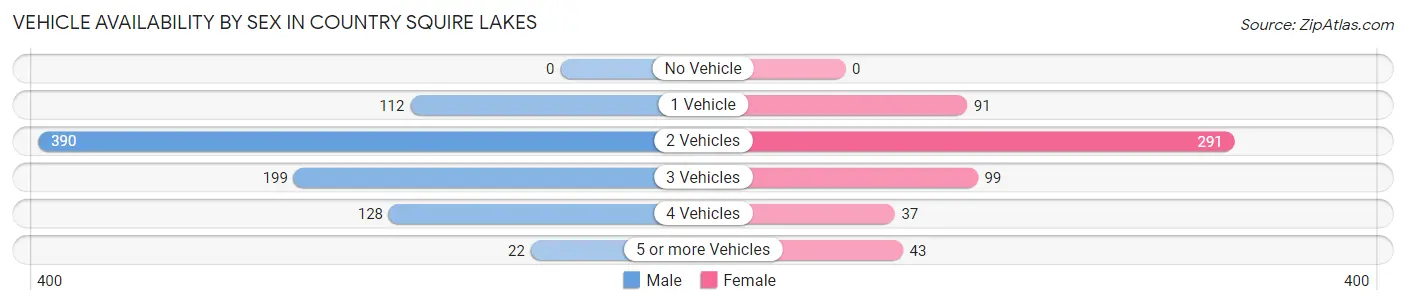
| Vehicles Available | Male | Female |
| No Vehicle | 0 (0.0%) | 0 (0.0%) |
| 1 Vehicle | 112 (13.2%) | 91 (16.2%) |
| 2 Vehicles | 390 (45.8%) | 291 (51.9%) |
| 3 Vehicles | 199 (23.4%) | 99 (17.6%) |
| 4 Vehicles | 128 (15.0%) | 37 (6.6%) |
| 5 or more Vehicles | 22 (2.6%) | 43 (7.7%) |
| Total | 851 (100.0%) | 561 (100.0%) |
Commute Time in Country Squire Lakes
The most frequently occuring commute durations in Country Squire Lakes are 10 to 14 minutes (587 commuters, 43.7%), 20 to 24 minutes (264 commuters, 19.7%), and 45 to 59 minutes (117 commuters, 8.7%).
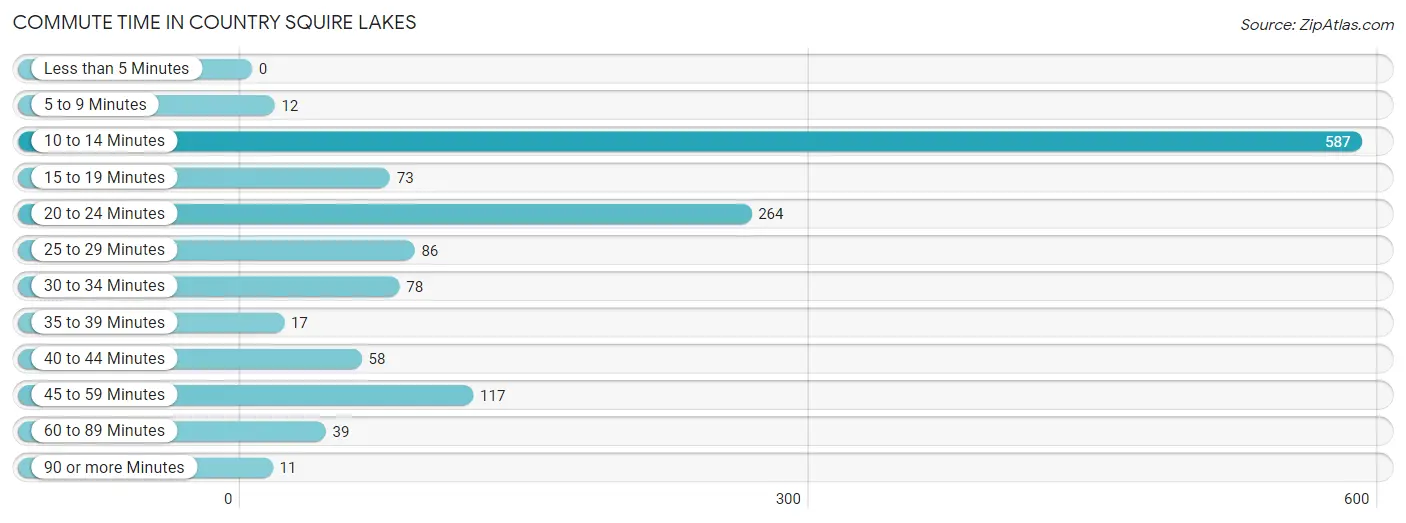
| Commute Time | # Commuters | % Commuters |
| Less than 5 Minutes | 0 | 0.0% |
| 5 to 9 Minutes | 12 | 0.9% |
| 10 to 14 Minutes | 587 | 43.7% |
| 15 to 19 Minutes | 73 | 5.4% |
| 20 to 24 Minutes | 264 | 19.7% |
| 25 to 29 Minutes | 86 | 6.4% |
| 30 to 34 Minutes | 78 | 5.8% |
| 35 to 39 Minutes | 17 | 1.3% |
| 40 to 44 Minutes | 58 | 4.3% |
| 45 to 59 Minutes | 117 | 8.7% |
| 60 to 89 Minutes | 39 | 2.9% |
| 90 or more Minutes | 11 | 0.8% |
Commute Time by Sex in Country Squire Lakes
The most common commute times in Country Squire Lakes are 10 to 14 minutes (297 commuters, 36.8%) for males and 10 to 14 minutes (290 commuters, 54.2%) for females.
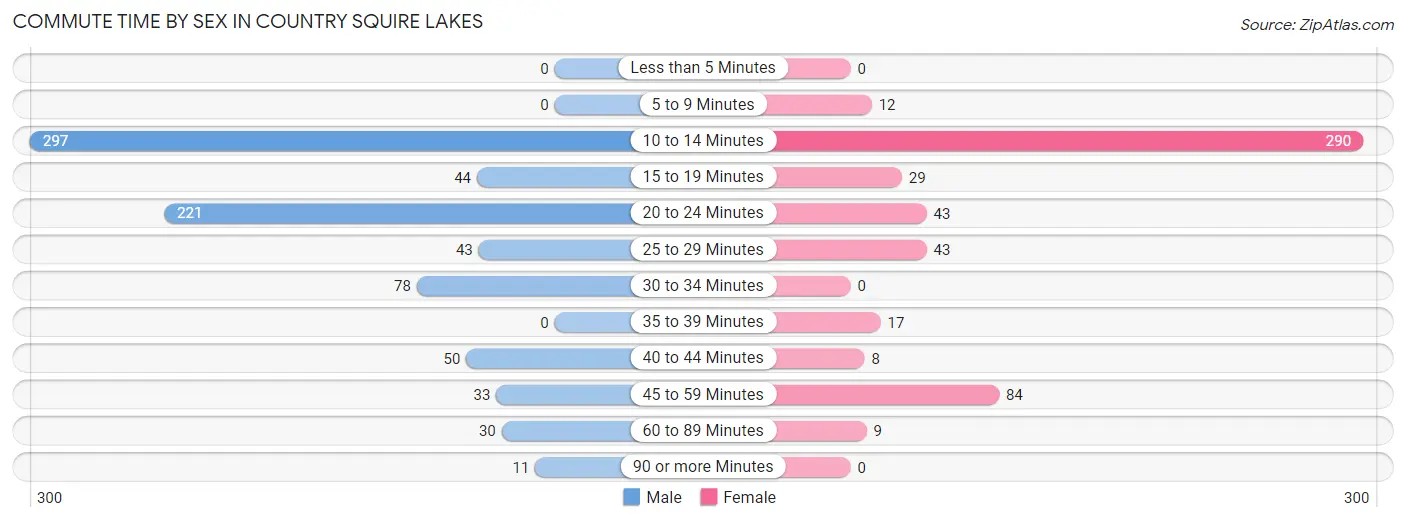
| Commute Time | Male | Female |
| Less than 5 Minutes | 0 (0.0%) | 0 (0.0%) |
| 5 to 9 Minutes | 0 (0.0%) | 12 (2.2%) |
| 10 to 14 Minutes | 297 (36.8%) | 290 (54.2%) |
| 15 to 19 Minutes | 44 (5.4%) | 29 (5.4%) |
| 20 to 24 Minutes | 221 (27.4%) | 43 (8.0%) |
| 25 to 29 Minutes | 43 (5.3%) | 43 (8.0%) |
| 30 to 34 Minutes | 78 (9.7%) | 0 (0.0%) |
| 35 to 39 Minutes | 0 (0.0%) | 17 (3.2%) |
| 40 to 44 Minutes | 50 (6.2%) | 8 (1.5%) |
| 45 to 59 Minutes | 33 (4.1%) | 84 (15.7%) |
| 60 to 89 Minutes | 30 (3.7%) | 9 (1.7%) |
| 90 or more Minutes | 11 (1.4%) | 0 (0.0%) |
Time of Departure to Work by Sex in Country Squire Lakes
The most frequent times of departure to work in Country Squire Lakes are 6:00 AM to 6:29 AM (304, 37.7%) for males and 4:00 PM to 11:59 PM (176, 32.9%) for females.
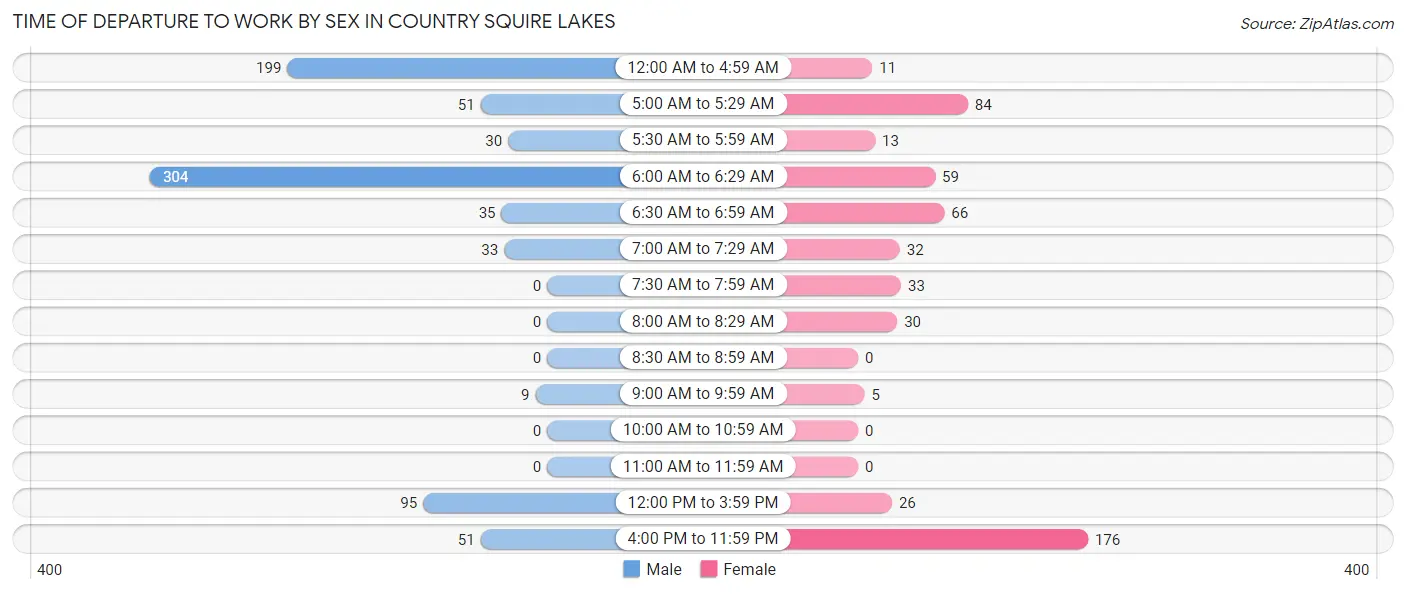
| Time of Departure | Male | Female |
| 12:00 AM to 4:59 AM | 199 (24.7%) | 11 (2.1%) |
| 5:00 AM to 5:29 AM | 51 (6.3%) | 84 (15.7%) |
| 5:30 AM to 5:59 AM | 30 (3.7%) | 13 (2.4%) |
| 6:00 AM to 6:29 AM | 304 (37.7%) | 59 (11.0%) |
| 6:30 AM to 6:59 AM | 35 (4.3%) | 66 (12.3%) |
| 7:00 AM to 7:29 AM | 33 (4.1%) | 32 (6.0%) |
| 7:30 AM to 7:59 AM | 0 (0.0%) | 33 (6.2%) |
| 8:00 AM to 8:29 AM | 0 (0.0%) | 30 (5.6%) |
| 8:30 AM to 8:59 AM | 0 (0.0%) | 0 (0.0%) |
| 9:00 AM to 9:59 AM | 9 (1.1%) | 5 (0.9%) |
| 10:00 AM to 10:59 AM | 0 (0.0%) | 0 (0.0%) |
| 11:00 AM to 11:59 AM | 0 (0.0%) | 0 (0.0%) |
| 12:00 PM to 3:59 PM | 95 (11.8%) | 26 (4.9%) |
| 4:00 PM to 11:59 PM | 51 (6.3%) | 176 (32.9%) |
| Total | 807 (100.0%) | 535 (100.0%) |
Housing Occupancy in Country Squire Lakes
Occupancy by Ownership in Country Squire Lakes
Of the total 1,207 dwellings in Country Squire Lakes, owner-occupied units account for 904 (74.9%), while renter-occupied units make up 303 (25.1%).
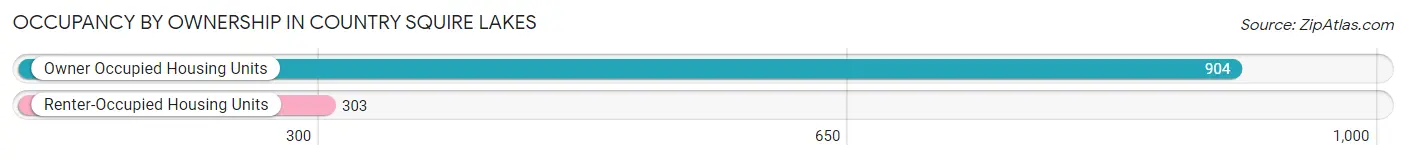
| Occupancy | # Housing Units | % Housing Units |
| Owner Occupied Housing Units | 904 | 74.9% |
| Renter-Occupied Housing Units | 303 | 25.1% |
| Total Occupied Housing Units | 1,207 | 100.0% |
Occupancy by Household Size in Country Squire Lakes
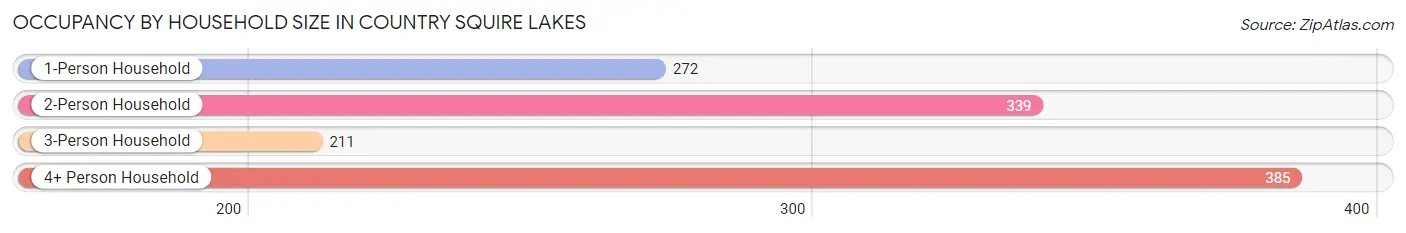
| Household Size | # Housing Units | % Housing Units |
| 1-Person Household | 272 | 22.5% |
| 2-Person Household | 339 | 28.1% |
| 3-Person Household | 211 | 17.5% |
| 4+ Person Household | 385 | 31.9% |
| Total Housing Units | 1,207 | 100.0% |
Occupancy by Ownership by Household Size in Country Squire Lakes
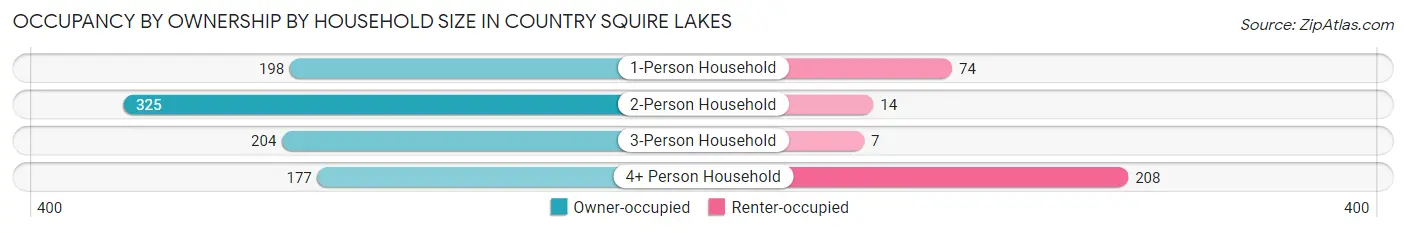
| Household Size | Owner-occupied | Renter-occupied |
| 1-Person Household | 198 (72.8%) | 74 (27.2%) |
| 2-Person Household | 325 (95.9%) | 14 (4.1%) |
| 3-Person Household | 204 (96.7%) | 7 (3.3%) |
| 4+ Person Household | 177 (46.0%) | 208 (54.0%) |
| Total Housing Units | 904 (74.9%) | 303 (25.1%) |
Occupancy by Educational Attainment in Country Squire Lakes
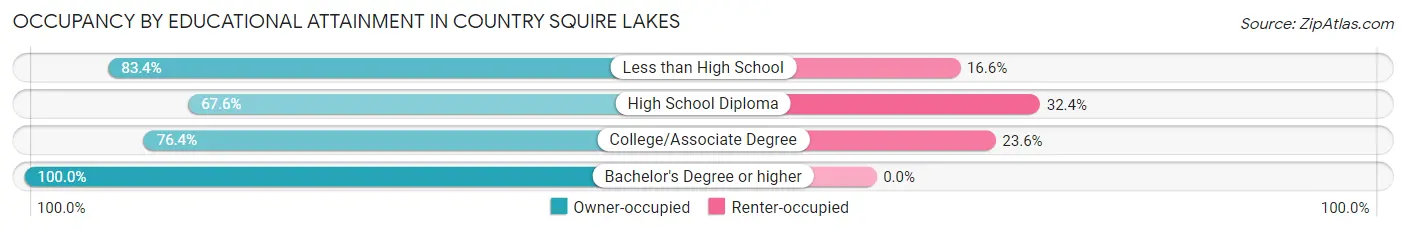
| Household Size | Owner-occupied | Renter-occupied |
| Less than High School | 276 (83.4%) | 55 (16.6%) |
| High School Diploma | 354 (67.6%) | 170 (32.4%) |
| College/Associate Degree | 252 (76.4%) | 78 (23.6%) |
| Bachelor's Degree or higher | 22 (100.0%) | 0 (0.0%) |
Occupancy by Age of Householder in Country Squire Lakes
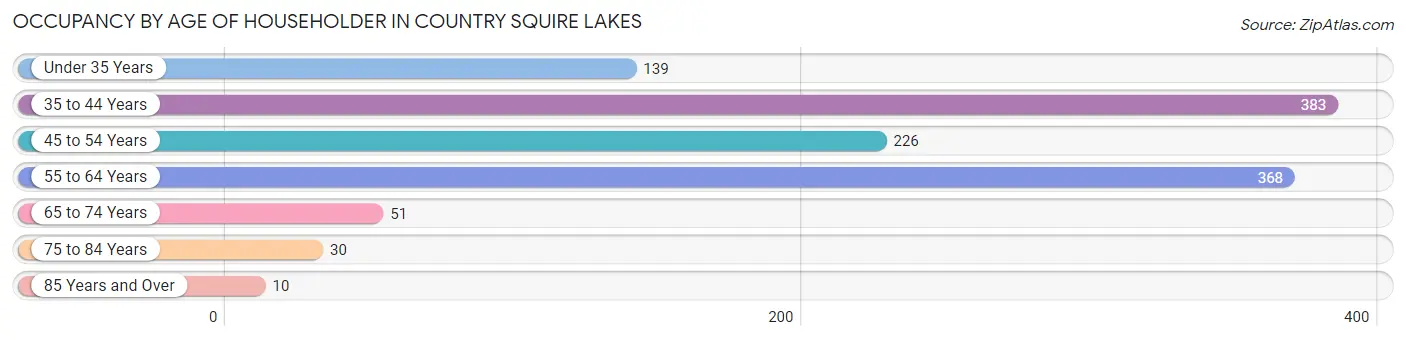
| Age Bracket | # Households | % Households |
| Under 35 Years | 139 | 11.5% |
| 35 to 44 Years | 383 | 31.7% |
| 45 to 54 Years | 226 | 18.7% |
| 55 to 64 Years | 368 | 30.5% |
| 65 to 74 Years | 51 | 4.2% |
| 75 to 84 Years | 30 | 2.5% |
| 85 Years and Over | 10 | 0.8% |
| Total | 1,207 | 100.0% |
Housing Finances in Country Squire Lakes
Median Income by Occupancy in Country Squire Lakes
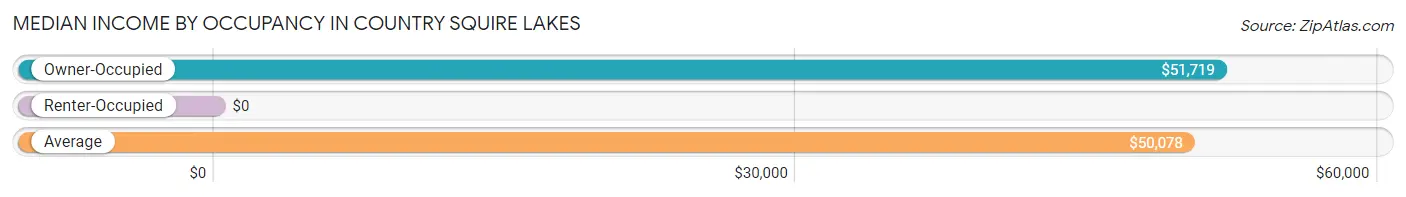
| Occupancy Type | # Households | Median Income |
| Owner-Occupied | 904 (74.9%) | $51,719 |
| Renter-Occupied | 303 (25.1%) | $0 |
| Average | 1,207 (100.0%) | $50,078 |
Occupancy by Householder Income Bracket in Country Squire Lakes
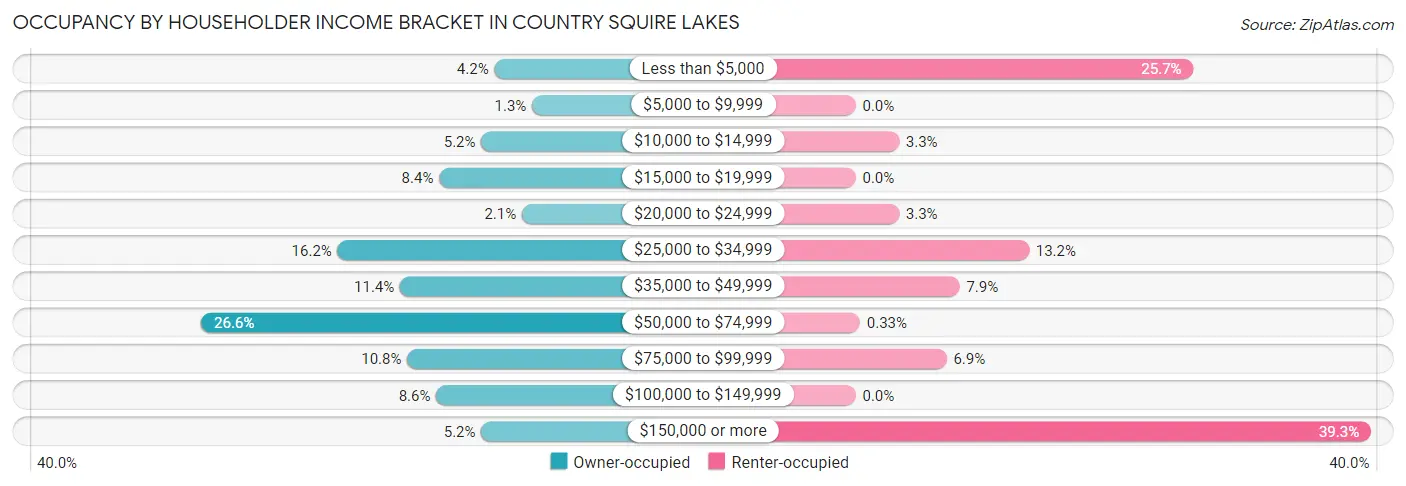
| Income Bracket | Owner-occupied | Renter-occupied |
| Less than $5,000 | 38 (4.2%) | 78 (25.7%) |
| $5,000 to $9,999 | 12 (1.3%) | 0 (0.0%) |
| $10,000 to $14,999 | 47 (5.2%) | 10 (3.3%) |
| $15,000 to $19,999 | 76 (8.4%) | 0 (0.0%) |
| $20,000 to $24,999 | 19 (2.1%) | 10 (3.3%) |
| $25,000 to $34,999 | 146 (16.2%) | 40 (13.2%) |
| $35,000 to $49,999 | 103 (11.4%) | 24 (7.9%) |
| $50,000 to $74,999 | 240 (26.6%) | 1 (0.3%) |
| $75,000 to $99,999 | 98 (10.8%) | 21 (6.9%) |
| $100,000 to $149,999 | 78 (8.6%) | 0 (0.0%) |
| $150,000 or more | 47 (5.2%) | 119 (39.3%) |
| Total | 904 (100.0%) | 303 (100.0%) |
Monthly Housing Cost Tiers in Country Squire Lakes
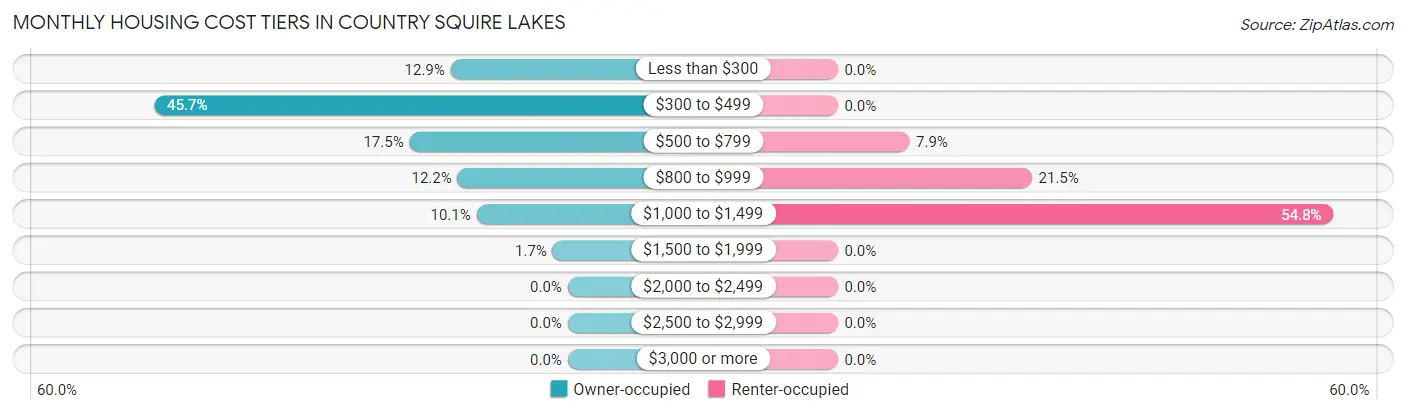
| Monthly Cost | Owner-occupied | Renter-occupied |
| Less than $300 | 117 (12.9%) | 0 (0.0%) |
| $300 to $499 | 413 (45.7%) | 0 (0.0%) |
| $500 to $799 | 158 (17.5%) | 24 (7.9%) |
| $800 to $999 | 110 (12.2%) | 65 (21.4%) |
| $1,000 to $1,499 | 91 (10.1%) | 166 (54.8%) |
| $1,500 to $1,999 | 15 (1.7%) | 0 (0.0%) |
| $2,000 to $2,499 | 0 (0.0%) | 0 (0.0%) |
| $2,500 to $2,999 | 0 (0.0%) | 0 (0.0%) |
| $3,000 or more | 0 (0.0%) | 0 (0.0%) |
| Total | 904 (100.0%) | 303 (100.0%) |
Physical Housing Characteristics in Country Squire Lakes
Housing Structures in Country Squire Lakes
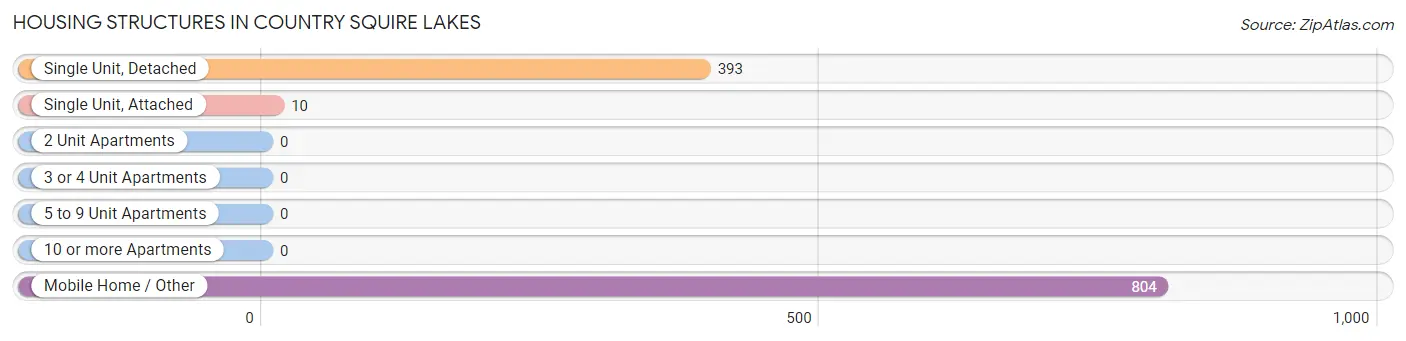
| Structure Type | # Housing Units | % Housing Units |
| Single Unit, Detached | 393 | 32.6% |
| Single Unit, Attached | 10 | 0.8% |
| 2 Unit Apartments | 0 | 0.0% |
| 3 or 4 Unit Apartments | 0 | 0.0% |
| 5 to 9 Unit Apartments | 0 | 0.0% |
| 10 or more Apartments | 0 | 0.0% |
| Mobile Home / Other | 804 | 66.6% |
| Total | 1,207 | 100.0% |
Housing Structures by Occupancy in Country Squire Lakes
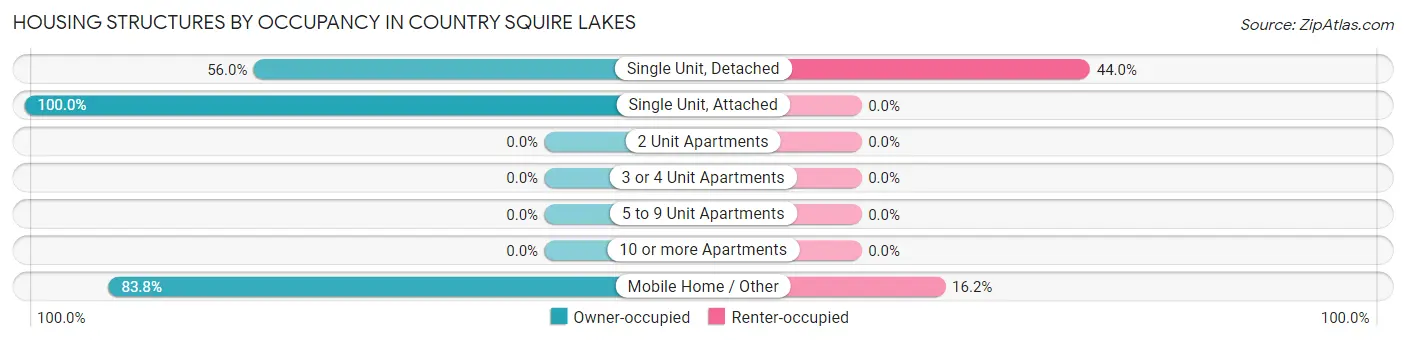
| Structure Type | Owner-occupied | Renter-occupied |
| Single Unit, Detached | 220 (56.0%) | 173 (44.0%) |
| Single Unit, Attached | 10 (100.0%) | 0 (0.0%) |
| 2 Unit Apartments | 0 (0.0%) | 0 (0.0%) |
| 3 or 4 Unit Apartments | 0 (0.0%) | 0 (0.0%) |
| 5 to 9 Unit Apartments | 0 (0.0%) | 0 (0.0%) |
| 10 or more Apartments | 0 (0.0%) | 0 (0.0%) |
| Mobile Home / Other | 674 (83.8%) | 130 (16.2%) |
| Total | 904 (74.9%) | 303 (25.1%) |
Housing Structures by Number of Rooms in Country Squire Lakes
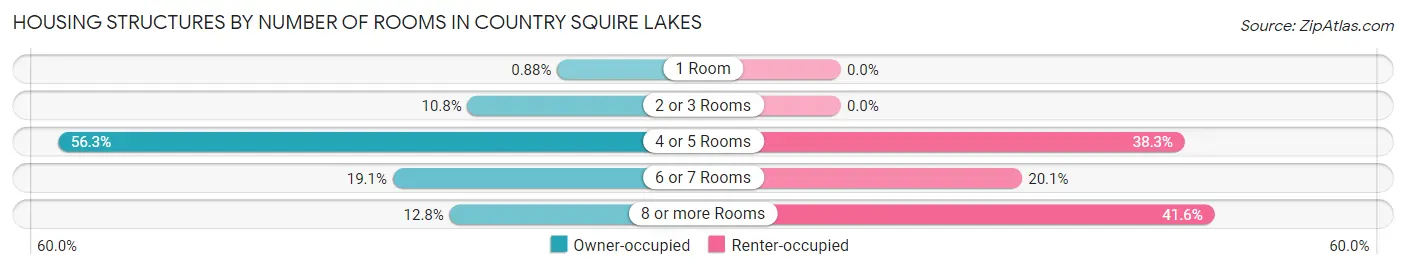
| Number of Rooms | Owner-occupied | Renter-occupied |
| 1 Room | 8 (0.9%) | 0 (0.0%) |
| 2 or 3 Rooms | 98 (10.8%) | 0 (0.0%) |
| 4 or 5 Rooms | 509 (56.3%) | 116 (38.3%) |
| 6 or 7 Rooms | 173 (19.1%) | 61 (20.1%) |
| 8 or more Rooms | 116 (12.8%) | 126 (41.6%) |
| Total | 904 (100.0%) | 303 (100.0%) |
Housing Structure by Heating Type in Country Squire Lakes
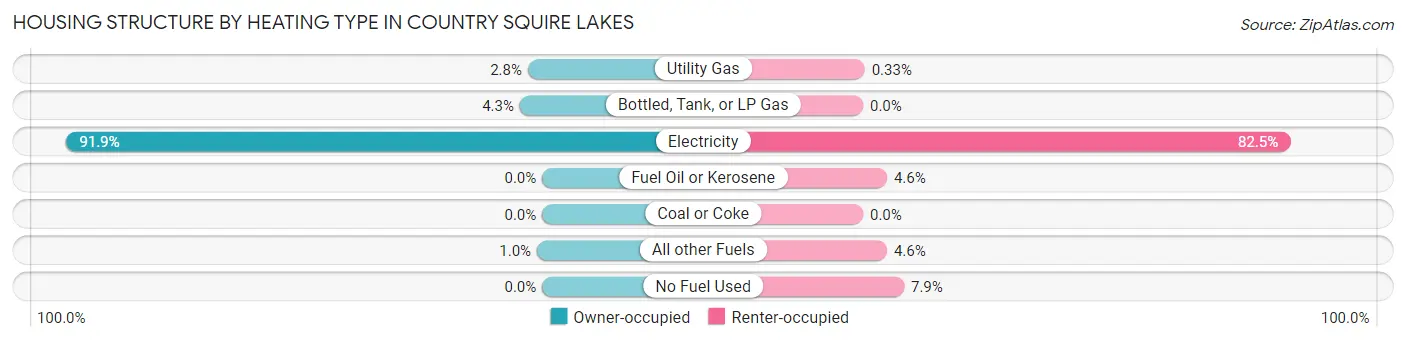
| Heating Type | Owner-occupied | Renter-occupied |
| Utility Gas | 25 (2.8%) | 1 (0.3%) |
| Bottled, Tank, or LP Gas | 39 (4.3%) | 0 (0.0%) |
| Electricity | 831 (91.9%) | 250 (82.5%) |
| Fuel Oil or Kerosene | 0 (0.0%) | 14 (4.6%) |
| Coal or Coke | 0 (0.0%) | 0 (0.0%) |
| All other Fuels | 9 (1.0%) | 14 (4.6%) |
| No Fuel Used | 0 (0.0%) | 24 (7.9%) |
| Total | 904 (100.0%) | 303 (100.0%) |
Household Vehicle Usage in Country Squire Lakes
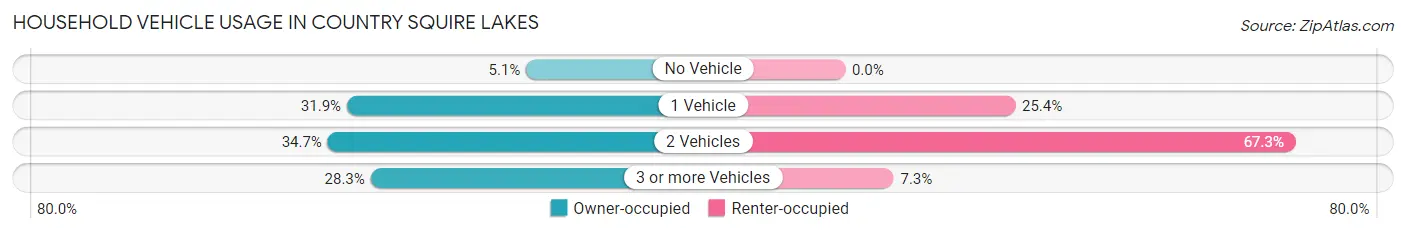
| Vehicles per Household | Owner-occupied | Renter-occupied |
| No Vehicle | 46 (5.1%) | 0 (0.0%) |
| 1 Vehicle | 288 (31.9%) | 77 (25.4%) |
| 2 Vehicles | 314 (34.7%) | 204 (67.3%) |
| 3 or more Vehicles | 256 (28.3%) | 22 (7.3%) |
| Total | 904 (100.0%) | 303 (100.0%) |
Real Estate & Mortgages in Country Squire Lakes
Real Estate and Mortgage Overview in Country Squire Lakes
| Characteristic | Without Mortgage | With Mortgage |
| Housing Units | 577 | 327 |
| Median Property Value | $20,000 | $87,000 |
| Median Household Income | $42,457 | $47 |
| Monthly Housing Costs | $407 | $0 |
| Real Estate Taxes | $268 | $65 |
Property Value by Mortgage Status in Country Squire Lakes
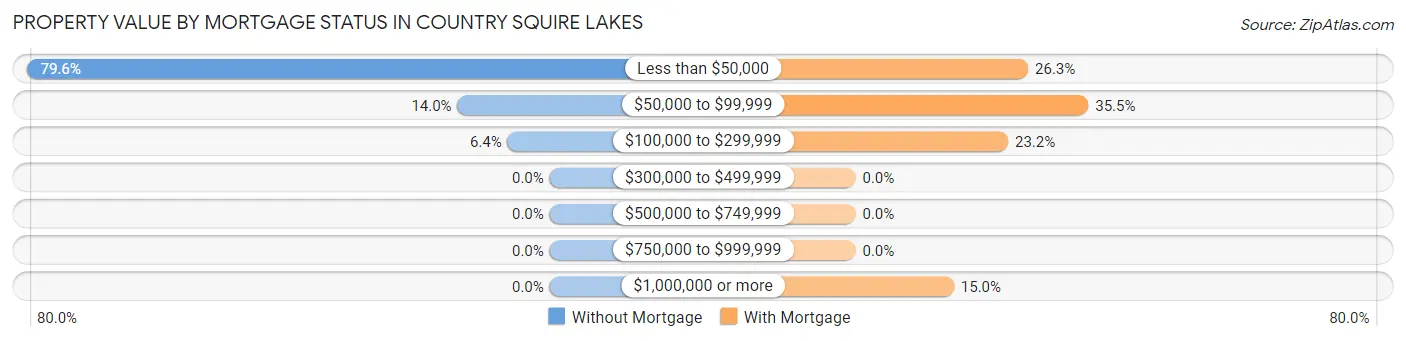
| Property Value | Without Mortgage | With Mortgage |
| Less than $50,000 | 459 (79.5%) | 86 (26.3%) |
| $50,000 to $99,999 | 81 (14.0%) | 116 (35.5%) |
| $100,000 to $299,999 | 37 (6.4%) | 76 (23.2%) |
| $300,000 to $499,999 | 0 (0.0%) | 0 (0.0%) |
| $500,000 to $749,999 | 0 (0.0%) | 0 (0.0%) |
| $750,000 to $999,999 | 0 (0.0%) | 0 (0.0%) |
| $1,000,000 or more | 0 (0.0%) | 49 (15.0%) |
| Total | 577 (100.0%) | 327 (100.0%) |
Household Income by Mortgage Status in Country Squire Lakes
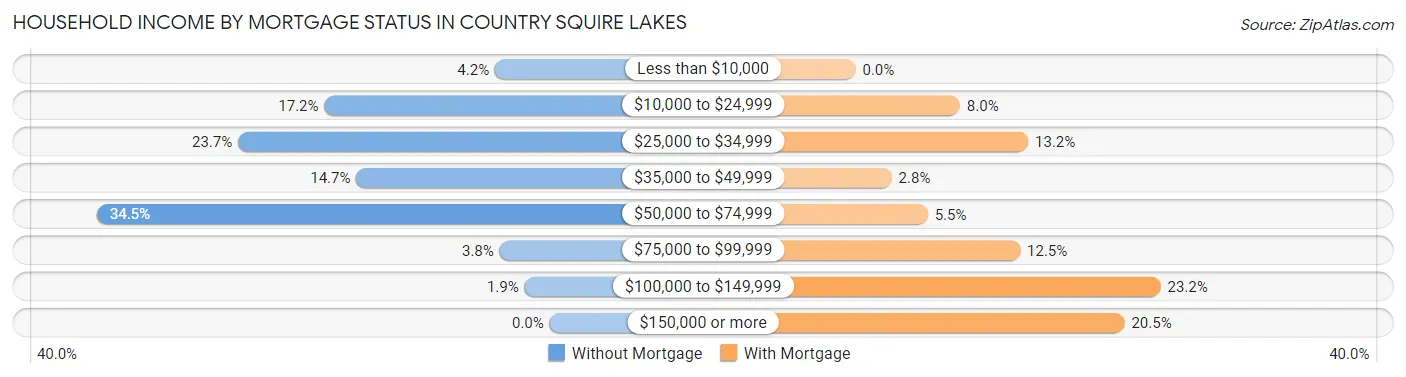
| Household Income | Without Mortgage | With Mortgage |
| Less than $10,000 | 24 (4.2%) | 0 (0.0%) |
| $10,000 to $24,999 | 99 (17.2%) | 26 (8.0%) |
| $25,000 to $34,999 | 137 (23.7%) | 43 (13.2%) |
| $35,000 to $49,999 | 85 (14.7%) | 9 (2.8%) |
| $50,000 to $74,999 | 199 (34.5%) | 18 (5.5%) |
| $75,000 to $99,999 | 22 (3.8%) | 41 (12.5%) |
| $100,000 to $149,999 | 11 (1.9%) | 76 (23.2%) |
| $150,000 or more | 0 (0.0%) | 67 (20.5%) |
| Total | 577 (100.0%) | 327 (100.0%) |
Property Value to Household Income Ratio in Country Squire Lakes
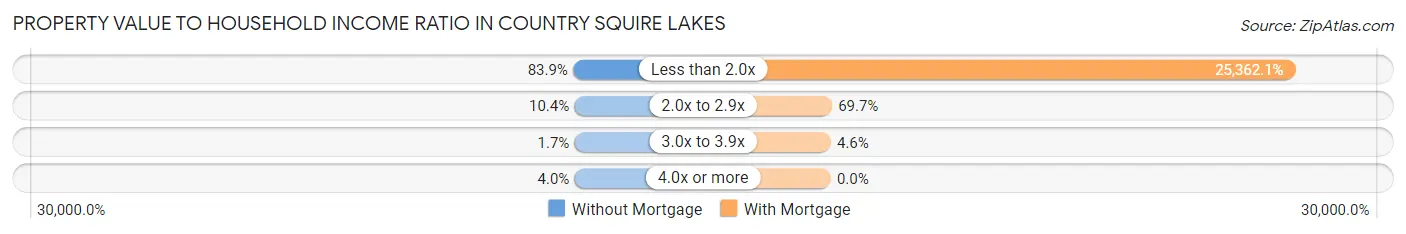
| Value-to-Income Ratio | Without Mortgage | With Mortgage |
| Less than 2.0x | 484 (83.9%) | 82,934 (25,362.1%) |
| 2.0x to 2.9x | 60 (10.4%) | 228 (69.7%) |
| 3.0x to 3.9x | 10 (1.7%) | 15 (4.6%) |
| 4.0x or more | 23 (4.0%) | 0 (0.0%) |
| Total | 577 (100.0%) | 327 (100.0%) |
Real Estate Taxes by Mortgage Status in Country Squire Lakes
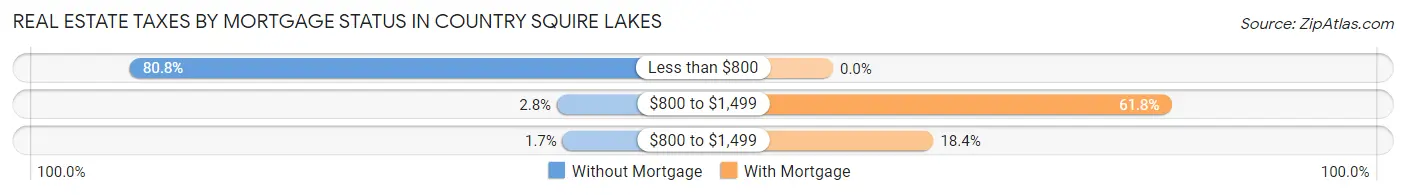
| Property Taxes | Without Mortgage | With Mortgage |
| Less than $800 | 466 (80.8%) | 0 (0.0%) |
| $800 to $1,499 | 16 (2.8%) | 202 (61.8%) |
| $800 to $1,499 | 10 (1.7%) | 60 (18.3%) |
| Total | 577 (100.0%) | 327 (100.0%) |
Health & Disability in Country Squire Lakes
Health Insurance Coverage by Age in Country Squire Lakes
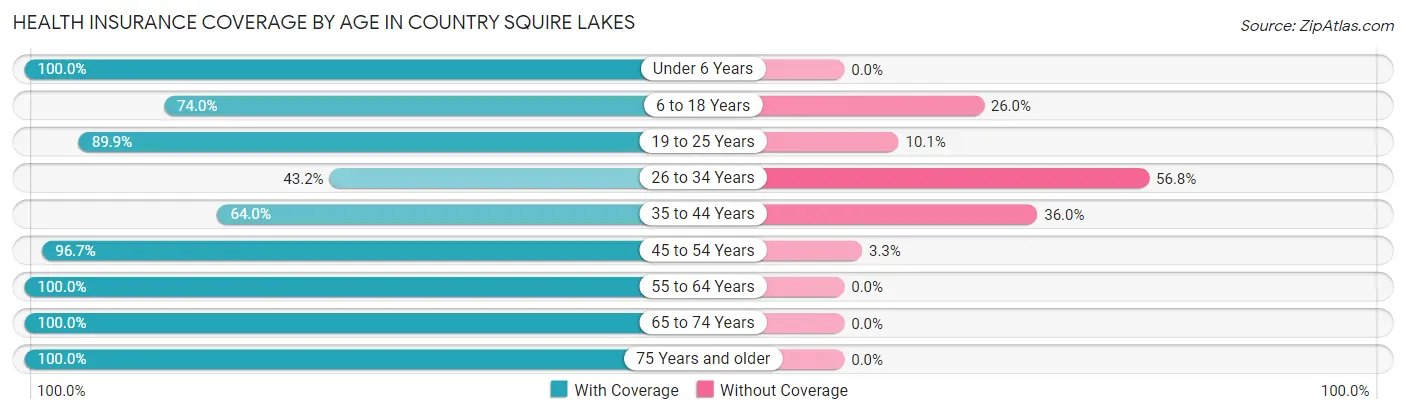
| Age Bracket | With Coverage | Without Coverage |
| Under 6 Years | 278 (100.0%) | 0 (0.0%) |
| 6 to 18 Years | 276 (74.0%) | 97 (26.0%) |
| 19 to 25 Years | 302 (89.9%) | 34 (10.1%) |
| 26 to 34 Years | 164 (43.2%) | 216 (56.8%) |
| 35 to 44 Years | 418 (64.0%) | 235 (36.0%) |
| 45 to 54 Years | 292 (96.7%) | 10 (3.3%) |
| 55 to 64 Years | 538 (100.0%) | 0 (0.0%) |
| 65 to 74 Years | 83 (100.0%) | 0 (0.0%) |
| 75 Years and older | 78 (100.0%) | 0 (0.0%) |
| Total | 2,429 (80.4%) | 592 (19.6%) |
Health Insurance Coverage by Citizenship Status in Country Squire Lakes
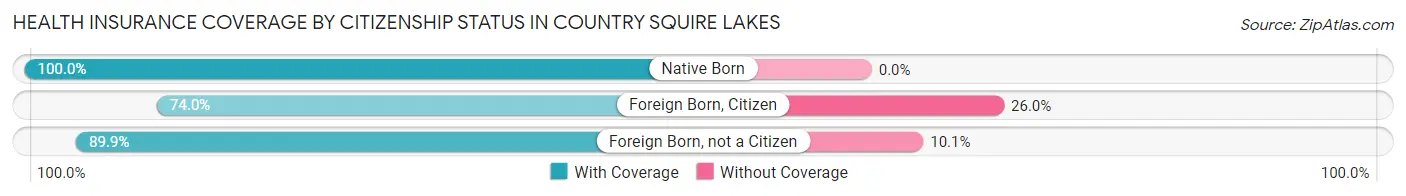
| Citizenship Status | With Coverage | Without Coverage |
| Native Born | 278 (100.0%) | 0 (0.0%) |
| Foreign Born, Citizen | 276 (74.0%) | 97 (26.0%) |
| Foreign Born, not a Citizen | 302 (89.9%) | 34 (10.1%) |
Health Insurance Coverage by Household Income in Country Squire Lakes
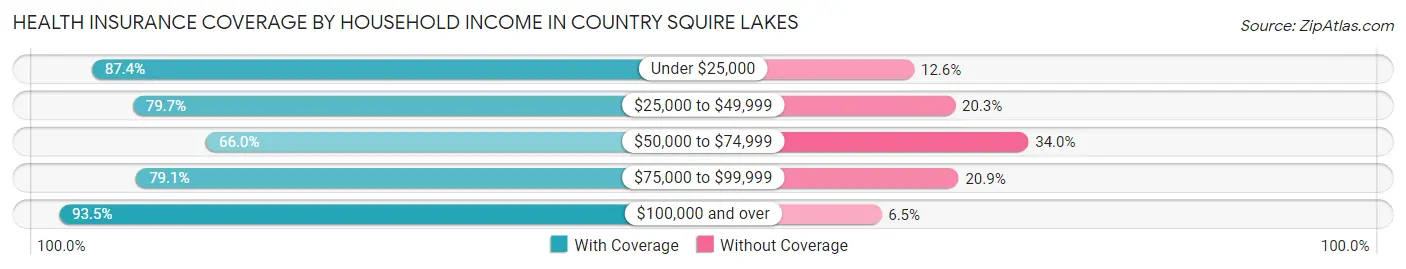
| Household Income | With Coverage | Without Coverage |
| Under $25,000 | 333 (87.4%) | 48 (12.6%) |
| $25,000 to $49,999 | 637 (79.7%) | 162 (20.3%) |
| $50,000 to $74,999 | 458 (66.0%) | 236 (34.0%) |
| $75,000 to $99,999 | 397 (79.1%) | 105 (20.9%) |
| $100,000 and over | 594 (93.5%) | 41 (6.5%) |
Public vs Private Health Insurance Coverage by Age in Country Squire Lakes
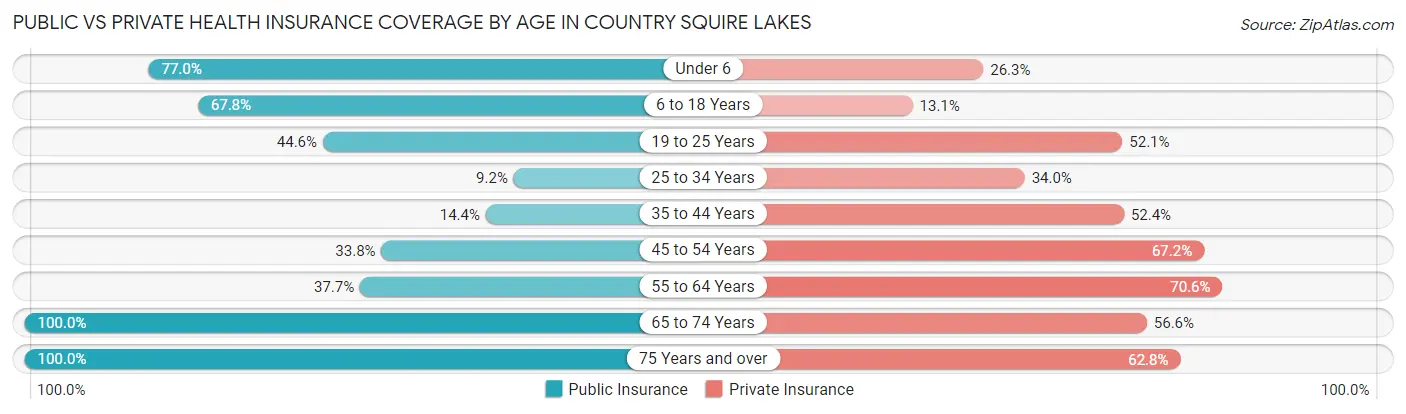
| Age Bracket | Public Insurance | Private Insurance |
| Under 6 | 214 (77.0%) | 73 (26.3%) |
| 6 to 18 Years | 253 (67.8%) | 49 (13.1%) |
| 19 to 25 Years | 150 (44.6%) | 175 (52.1%) |
| 25 to 34 Years | 35 (9.2%) | 129 (34.0%) |
| 35 to 44 Years | 94 (14.4%) | 342 (52.4%) |
| 45 to 54 Years | 102 (33.8%) | 203 (67.2%) |
| 55 to 64 Years | 203 (37.7%) | 380 (70.6%) |
| 65 to 74 Years | 83 (100.0%) | 47 (56.6%) |
| 75 Years and over | 78 (100.0%) | 49 (62.8%) |
| Total | 1,212 (40.1%) | 1,447 (47.9%) |
Disability Status by Sex by Age in Country Squire Lakes
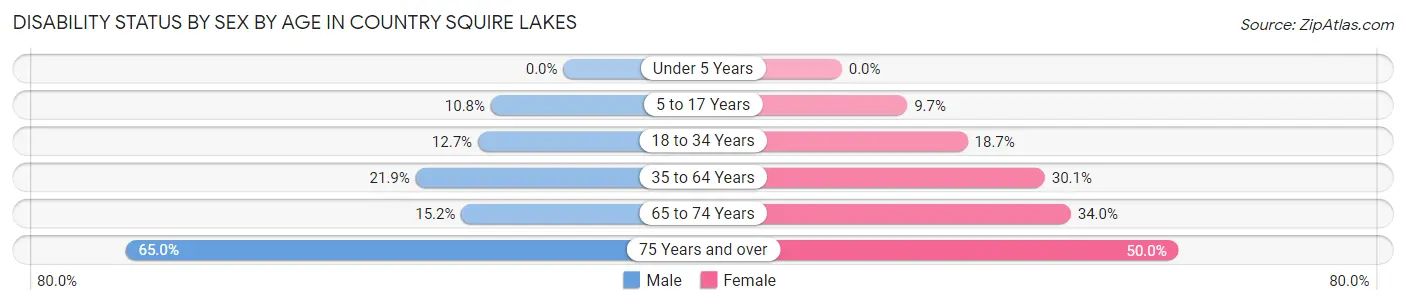
| Age Bracket | Male | Female |
| Under 5 Years | 0 (0.0%) | 0 (0.0%) |
| 5 to 17 Years | 27 (10.8%) | 10 (9.7%) |
| 18 to 34 Years | 42 (12.7%) | 82 (18.7%) |
| 35 to 64 Years | 190 (21.9%) | 189 (30.1%) |
| 65 to 74 Years | 5 (15.1%) | 17 (34.0%) |
| 75 Years and over | 39 (65.0%) | 9 (50.0%) |
Disability Class by Sex by Age in Country Squire Lakes
Disability Class: Hearing Difficulty
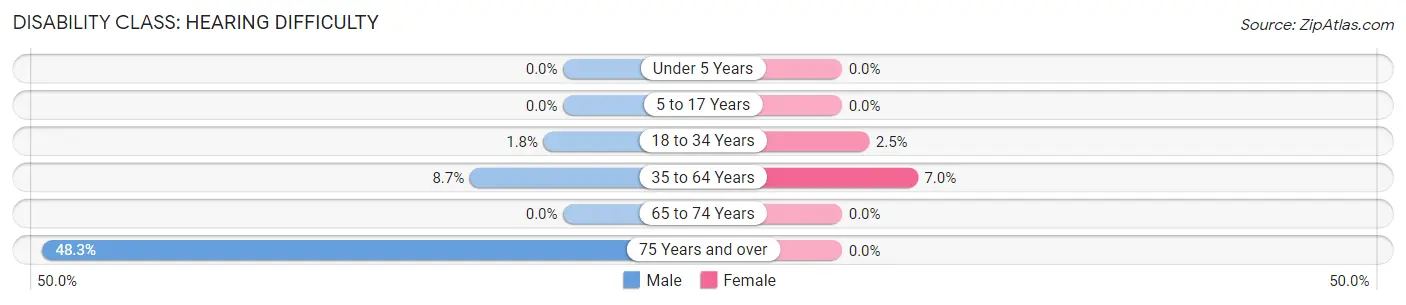
| Age Bracket | Male | Female |
| Under 5 Years | 0 (0.0%) | 0 (0.0%) |
| 5 to 17 Years | 0 (0.0%) | 0 (0.0%) |
| 18 to 34 Years | 6 (1.8%) | 11 (2.5%) |
| 35 to 64 Years | 75 (8.7%) | 44 (7.0%) |
| 65 to 74 Years | 0 (0.0%) | 0 (0.0%) |
| 75 Years and over | 29 (48.3%) | 0 (0.0%) |
Disability Class: Vision Difficulty
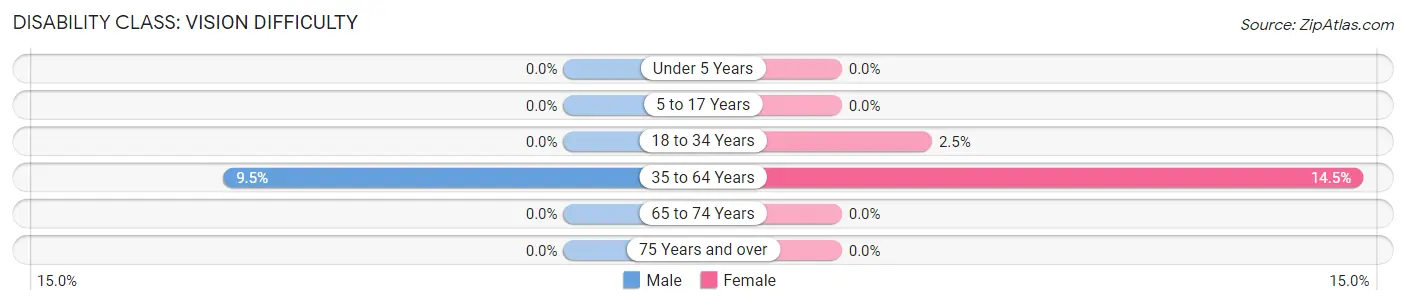
| Age Bracket | Male | Female |
| Under 5 Years | 0 (0.0%) | 0 (0.0%) |
| 5 to 17 Years | 0 (0.0%) | 0 (0.0%) |
| 18 to 34 Years | 0 (0.0%) | 11 (2.5%) |
| 35 to 64 Years | 82 (9.5%) | 91 (14.5%) |
| 65 to 74 Years | 0 (0.0%) | 0 (0.0%) |
| 75 Years and over | 0 (0.0%) | 0 (0.0%) |
Disability Class: Cognitive Difficulty
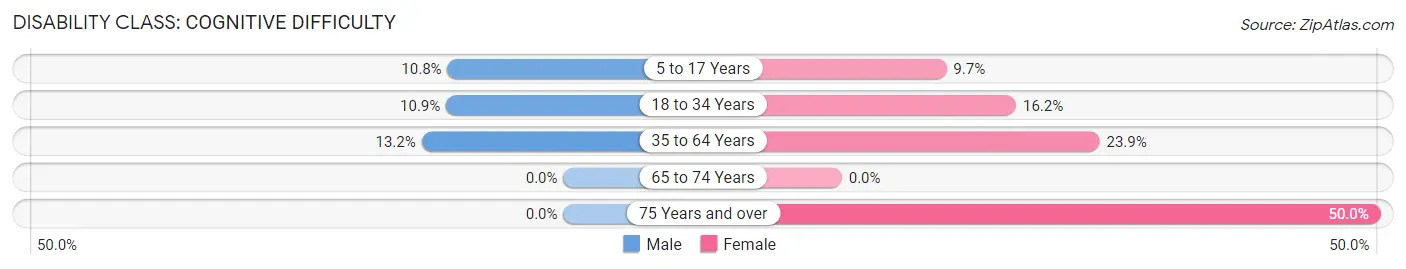
| Age Bracket | Male | Female |
| 5 to 17 Years | 27 (10.8%) | 10 (9.7%) |
| 18 to 34 Years | 36 (10.9%) | 71 (16.2%) |
| 35 to 64 Years | 114 (13.2%) | 150 (23.9%) |
| 65 to 74 Years | 0 (0.0%) | 0 (0.0%) |
| 75 Years and over | 0 (0.0%) | 9 (50.0%) |
Disability Class: Ambulatory Difficulty
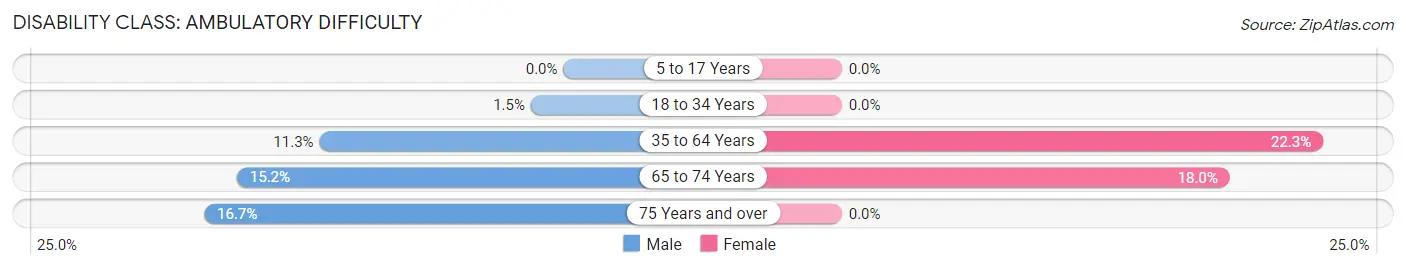
| Age Bracket | Male | Female |
| 5 to 17 Years | 0 (0.0%) | 0 (0.0%) |
| 18 to 34 Years | 5 (1.5%) | 0 (0.0%) |
| 35 to 64 Years | 98 (11.3%) | 140 (22.3%) |
| 65 to 74 Years | 5 (15.1%) | 9 (18.0%) |
| 75 Years and over | 10 (16.7%) | 0 (0.0%) |
Disability Class: Self-Care Difficulty
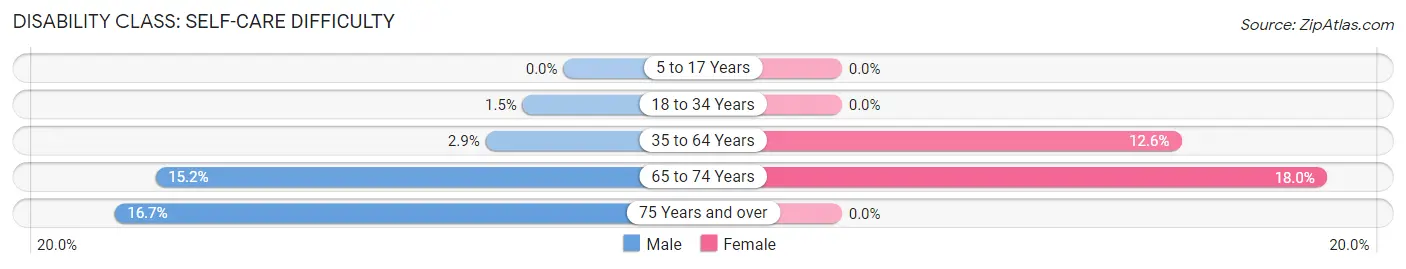
| Age Bracket | Male | Female |
| 5 to 17 Years | 0 (0.0%) | 0 (0.0%) |
| 18 to 34 Years | 5 (1.5%) | 0 (0.0%) |
| 35 to 64 Years | 25 (2.9%) | 79 (12.6%) |
| 65 to 74 Years | 5 (15.1%) | 9 (18.0%) |
| 75 Years and over | 10 (16.7%) | 0 (0.0%) |
Technology Access in Country Squire Lakes
Computing Device Access in Country Squire Lakes
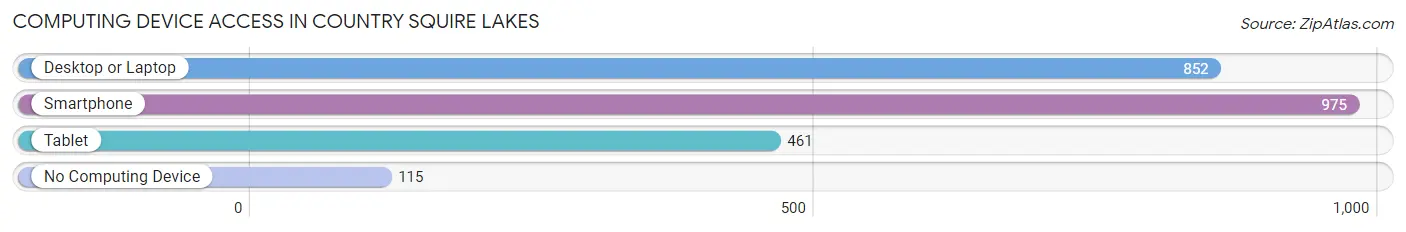
| Device Type | # Households | % Households |
| Desktop or Laptop | 852 | 70.6% |
| Smartphone | 975 | 80.8% |
| Tablet | 461 | 38.2% |
| No Computing Device | 115 | 9.5% |
| Total | 1,207 | 100.0% |
Internet Access in Country Squire Lakes
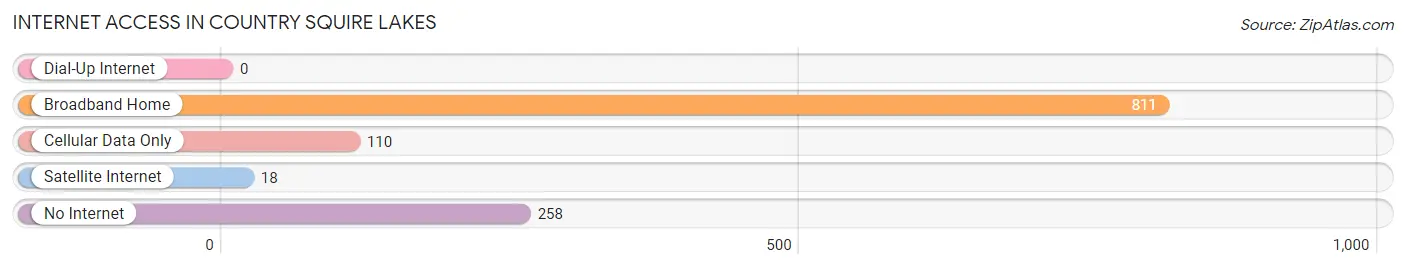
| Internet Type | # Households | % Households |
| Dial-Up Internet | 0 | 0.0% |
| Broadband Home | 811 | 67.2% |
| Cellular Data Only | 110 | 9.1% |
| Satellite Internet | 18 | 1.5% |
| No Internet | 258 | 21.4% |
| Total | 1,207 | 100.0% |
Country Squire Lakes Summary
Country Squire Lakes is a small unincorporated community located in the southeastern corner of Jackson County, Indiana. It is situated on the banks of the Muscatatuck River, approximately 10 miles south of Seymour and 40 miles north of Louisville, Kentucky. The community is part of the Seymour, Indiana Metropolitan Statistical Area.
History
Country Squire Lakes was founded in the early 1800s by settlers from the nearby town of Seymour. The area was originally known as “Squire’s Lake” after the first settler, Squire William Smith. Smith was a veteran of the War of 1812 and a prominent local businessman. He purchased the land from the local Native American tribes and established a small trading post.
The area was later renamed “Country Squire Lakes” in honor of Smith’s son, William Smith Jr., who was a prominent local politician. Smith Jr. served as a state senator and was instrumental in the development of the area.
In the late 1800s, the area began to grow as a popular vacation destination. The area was known for its beautiful scenery and abundant wildlife. It was also a popular spot for fishing and hunting.
In the early 1900s, the area began to develop as a residential community. The first homes were built in the 1920s and the area continued to grow throughout the 20th century.
Geography
Country Squire Lakes is located in the southeastern corner of Jackson County, Indiana. It is situated on the banks of the Muscatatuck River, approximately 10 miles south of Seymour and 40 miles north of Louisville, Kentucky.
The area is mostly rural, with rolling hills and wooded areas. The terrain is mostly flat, with some areas of higher elevation. The climate is humid and subtropical, with hot summers and mild winters.
Economy
The economy of Country Squire Lakes is largely based on agriculture and tourism. The area is home to several farms, which produce a variety of crops, including corn, soybeans, and wheat.
The area is also a popular tourist destination, with several lakes and rivers for fishing and boating. There are also several campgrounds and RV parks in the area.
Demographics
As of the 2010 census, the population of Country Squire Lakes was 1,845. The racial makeup of the area was 97.3% White, 0.7% African American, 0.2% Native American, 0.3% Asian, and 1.5% from other races.
The median household income in Country Squire Lakes was $45,938, and the median family income was $51,938. The per capita income was $20,938. About 8.3% of families and 10.2% of the population were below the poverty line.
Conclusion
Country Squire Lakes is a small unincorporated community located in the southeastern corner of Jackson County, Indiana. It is situated on the banks of the Muscatatuck River, approximately 10 miles south of Seymour and 40 miles north of Louisville, Kentucky. The area is mostly rural, with rolling hills and wooded areas. The economy of Country Squire Lakes is largely based on agriculture and tourism. As of the 2010 census, the population of Country Squire Lakes was 1,845. The median household income in Country Squire Lakes was $45,938, and the median family income was $51,938. The area is a popular tourist destination, with several lakes and rivers for fishing and boating.
Common Questions
What is the Total Population of Country Squire Lakes?
Total Population of Country Squire Lakes is 3,021.
What is the Total Male Population of Country Squire Lakes?
Total Male Population of Country Squire Lakes is 1,643.
What is the Total Female Population of Country Squire Lakes?
Total Female Population of Country Squire Lakes is 1,378.
What is the Ratio of Males per 100 Females in Country Squire Lakes?
There are 119.23 Males per 100 Females in Country Squire Lakes.
What is the Ratio of Females per 100 Males in Country Squire Lakes?
There are 83.87 Females per 100 Males in Country Squire Lakes.
What is the Median Population Age in Country Squire Lakes?
Median Population Age in Country Squire Lakes is 37.1 Years.
What is the Average Family Size in Country Squire Lakes
Average Family Size in Country Squire Lakes is 2.6 People.
What is the Average Household Size in Country Squire Lakes
Average Household Size in Country Squire Lakes is 2.5 People.
What is Per Capita Income in Country Squire Lakes?
Per Capita income in Country Squire Lakes is $22,727.
What is the Median Family Income in Country Squire Lakes?
Median Family Income in Country Squire Lakes is $44,829.
What is the Median Household income in Country Squire Lakes?
Median Household Income in Country Squire Lakes is $50,078.
What is Income or Wage Gap in Country Squire Lakes?
Income or Wage Gap in Country Squire Lakes is 57.5%.
Women in Country Squire Lakes earn 42.5 cents for every dollar earned by a man.
What is Inequality or Gini Index in Country Squire Lakes?
Inequality or Gini Index in Country Squire Lakes is 0.43.
How Large is the Labor Force in Country Squire Lakes?
There are 1,712 People in the Labor Forcein in Country Squire Lakes.
What is the Percentage of People in the Labor Force in Country Squire Lakes?
69.4% of People are in the Labor Force in Country Squire Lakes.
What is the Unemployment Rate in Country Squire Lakes?
Unemployment Rate in Country Squire Lakes is 14.6%.