Cities with the Highest Percentage of Population with a Degree in Physical and Health Sciences in Kansas
RELATED REPORTS & OPTIONS
Physical and Health Sciences
Kansas
Compare Cities
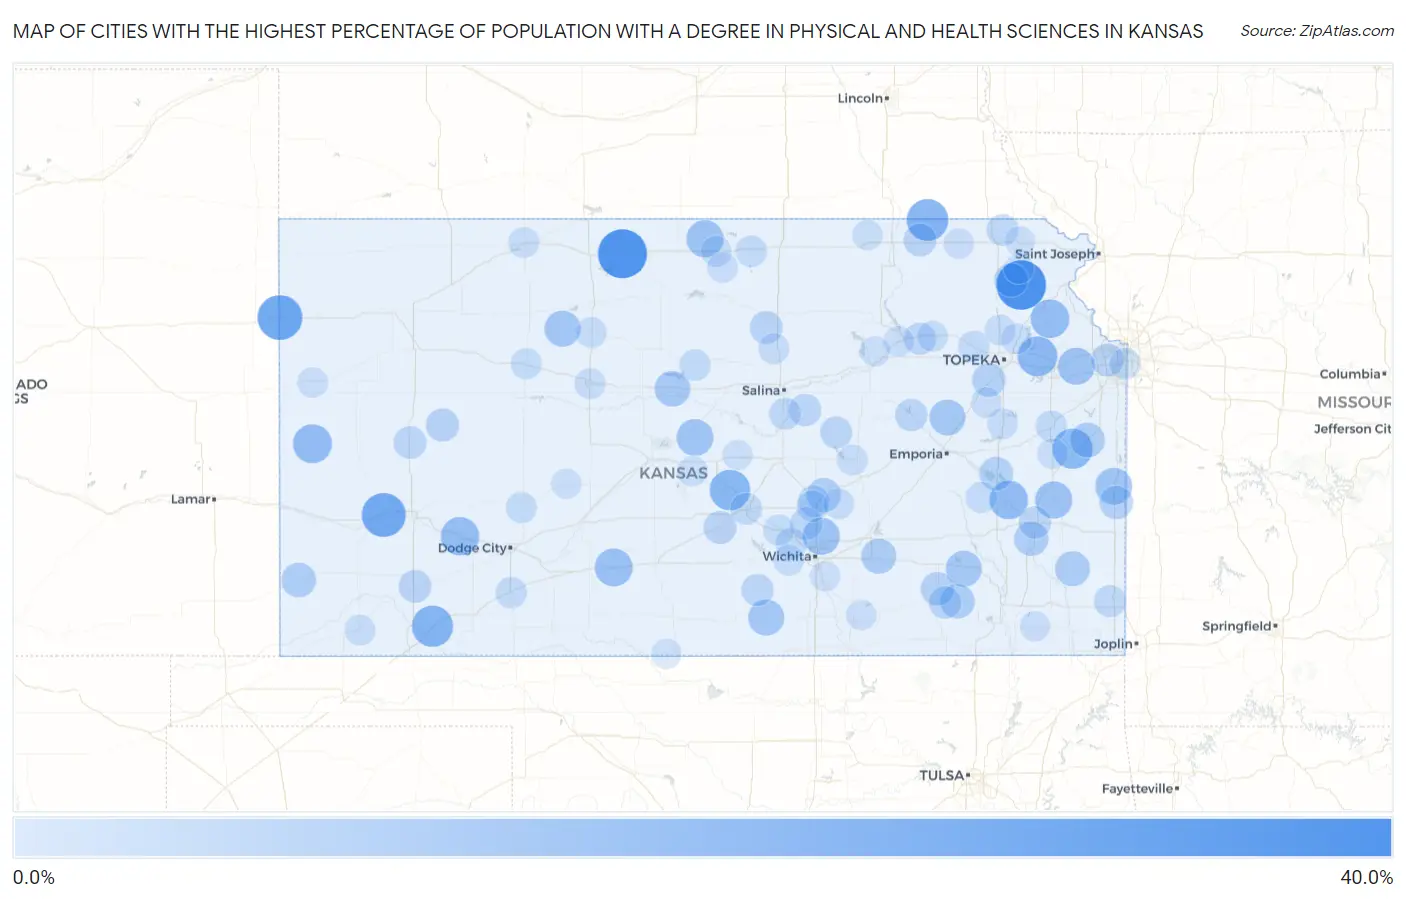
Map of Cities with the Highest Percentage of Population with a Degree in Physical and Health Sciences in Kansas
0.0%
40.0%
Cities with the Highest Percentage of Population with a Degree in Physical and Health Sciences in Kansas
| City | % Graduates | vs State | vs National | |
| 1. | Muscotah | 40.0% | 2.5%(+37.5)#1 | 3.1%(+36.9)#141 |
| 2. | Kensington | 38.9% | 2.5%(+36.4)#2 | 3.1%(+35.8)#152 |
| 3. | Kanorado | 30.8% | 2.5%(+28.2)#3 | 3.1%(+27.7)#242 |
| 4. | Deerfield | 29.2% | 2.5%(+26.6)#4 | 3.1%(+26.1)#274 |
| 5. | Summerfield | 25.0% | 2.5%(+22.5)#5 | 3.1%(+21.9)#380 |
| 6. | Kismet | 24.1% | 2.5%(+21.5)#6 | 3.1%(+21.0)#412 |
| 7. | Nickerson | 22.9% | 2.5%(+20.3)#7 | 3.1%(+19.8)#443 |
| 8. | Lane | 22.2% | 2.5%(+19.7)#8 | 3.1%(+19.1)#461 |
| 9. | Perry | 21.7% | 2.5%(+19.1)#9 | 3.1%(+18.6)#481 |
| 10. | Tribune | 19.9% | 2.5%(+17.3)#10 | 3.1%(+16.8)#559 |
| 11. | Leroy | 19.4% | 2.5%(+16.8)#11 | 3.1%(+16.3)#575 |
| 12. | Winchester | 19.2% | 2.5%(+16.7)#12 | 3.1%(+16.1)#582 |
| 13. | Ingalls | 18.9% | 2.5%(+16.4)#13 | 3.1%(+15.8)#593 |
| 14. | Haviland | 17.9% | 2.5%(+15.3)#14 | 3.1%(+14.8)#645 |
| 15. | Burr Oak | 16.7% | 2.5%(+14.1)#15 | 3.1%(+13.6)#738 |
| 16. | Lone Elm | 16.7% | 2.5%(+14.1)#16 | 3.1%(+13.6)#746 |
| 17. | Kechi | 16.4% | 2.5%(+13.9)#17 | 3.1%(+13.3)#756 |
| 18. | Linwood | 16.3% | 2.5%(+13.8)#18 | 3.1%(+13.2)#762 |
| 19. | Bushton | 16.1% | 2.5%(+13.6)#19 | 3.1%(+13.0)#779 |
| 20. | Pleasanton | 16.0% | 2.5%(+13.4)#20 | 3.1%(+12.9)#793 |
| 21. | Palco | 14.8% | 2.5%(+12.3)#21 | 3.1%(+11.7)#896 |
| 22. | Argonia | 14.6% | 2.5%(+12.1)#22 | 3.1%(+11.5)#914 |
| 23. | Allen | 14.3% | 2.5%(+11.7)#23 | 3.1%(+11.2)#956 |
| 24. | Fall River | 14.3% | 2.5%(+11.7)#24 | 3.1%(+11.2)#961 |
| 25. | Dorrance | 13.9% | 2.5%(+11.3)#25 | 3.1%(+10.8)#999 |
| 26. | Sycamore | 13.9% | 2.5%(+11.3)#26 | 3.1%(+10.8)#1,000 |
| 27. | Leon | 12.5% | 2.5%(+9.95)#27 | 3.1%(+9.40)#1,157 |
| 28. | Walnut | 12.5% | 2.5%(+9.95)#28 | 3.1%(+9.40)#1,164 |
| 29. | Osawatomie | 12.4% | 2.5%(+9.82)#29 | 3.1%(+9.27)#1,176 |
| 30. | Longton | 11.8% | 2.5%(+9.22)#30 | 3.1%(+8.66)#1,254 |
| 31. | Manter | 11.8% | 2.5%(+9.22)#31 | 3.1%(+8.66)#1,258 |
| 32. | Humboldt | 11.5% | 2.5%(+8.96)#32 | 3.1%(+8.41)#1,291 |
| 33. | Walton | 11.1% | 2.5%(+8.56)#33 | 3.1%(+8.01)#1,357 |
| 34. | New Strawn | 10.6% | 2.5%(+8.02)#34 | 3.1%(+7.47)#1,451 |
| 35. | Whiting | 10.3% | 2.5%(+7.80)#35 | 3.1%(+7.25)#1,514 |
| 36. | Auburn | 10.1% | 2.5%(+7.52)#36 | 3.1%(+6.97)#1,583 |
| 37. | Prescott | 10.0% | 2.5%(+7.45)#37 | 3.1%(+6.90)#1,610 |
| 38. | Howard | 9.9% | 2.5%(+7.33)#38 | 3.1%(+6.78)#1,640 |
| 39. | Healy | 9.3% | 2.5%(+6.71)#39 | 3.1%(+6.16)#1,800 |
| 40. | Arlington | 9.1% | 2.5%(+6.54)#40 | 3.1%(+5.99)#1,846 |
| 41. | Lake Quivira | 9.0% | 2.5%(+6.50)#41 | 3.1%(+5.95)#1,873 |
| 42. | Beattie | 8.9% | 2.5%(+6.34)#42 | 3.1%(+5.79)#1,930 |
| 43. | Delphos | 8.8% | 2.5%(+6.27)#43 | 3.1%(+5.72)#1,947 |
| 44. | Sublette | 8.7% | 2.5%(+6.12)#44 | 3.1%(+5.57)#1,996 |
| 45. | Scott City | 8.4% | 2.5%(+5.83)#45 | 3.1%(+5.28)#2,088 |
| 46. | Elk Falls | 8.1% | 2.5%(+5.56)#46 | 3.1%(+5.01)#2,191 |
| 47. | Council Grove | 8.0% | 2.5%(+5.42)#47 | 3.1%(+4.86)#2,260 |
| 48. | Iola | 7.9% | 2.5%(+5.35)#48 | 3.1%(+4.80)#2,272 |
| 49. | Gypsum | 7.9% | 2.5%(+5.35)#49 | 3.1%(+4.80)#2,278 |
| 50. | Sedgwick | 7.9% | 2.5%(+5.34)#50 | 3.1%(+4.79)#2,281 |
| 51. | Norwich | 7.6% | 2.5%(+5.03)#51 | 3.1%(+4.48)#2,440 |
| 52. | St George | 7.5% | 2.5%(+4.91)#52 | 3.1%(+4.36)#2,494 |
| 53. | Tampa | 7.4% | 2.5%(+4.86)#53 | 3.1%(+4.31)#2,535 |
| 54. | Chicopee | 7.3% | 2.5%(+4.70)#54 | 3.1%(+4.15)#2,617 |
| 55. | Assaria | 7.2% | 2.5%(+4.66)#55 | 3.1%(+4.11)#2,646 |
| 56. | Morrill | 7.1% | 2.5%(+4.59)#56 | 3.1%(+4.04)#2,702 |
| 57. | South Hutchinson | 6.9% | 2.5%(+4.38)#57 | 3.1%(+3.83)#2,815 |
| 58. | North Newton | 6.7% | 2.5%(+4.18)#58 | 3.1%(+3.63)#2,946 |
| 59. | Colwich | 6.6% | 2.5%(+4.08)#59 | 3.1%(+3.53)#3,020 |
| 60. | Courtland | 6.5% | 2.5%(+3.90)#60 | 3.1%(+3.35)#3,123 |
| 61. | Minneola | 6.3% | 2.5%(+3.74)#61 | 3.1%(+3.19)#3,227 |
| 62. | Ottawa | 6.3% | 2.5%(+3.73)#62 | 3.1%(+3.18)#3,234 |
| 63. | Newton | 6.2% | 2.5%(+3.64)#63 | 3.1%(+3.09)#3,315 |
| 64. | Mission Hills | 6.1% | 2.5%(+3.59)#64 | 3.1%(+3.03)#3,359 |
| 65. | Sylvan Grove | 6.1% | 2.5%(+3.57)#65 | 3.1%(+3.02)#3,370 |
| 66. | Rossville | 5.9% | 2.5%(+3.37)#66 | 3.1%(+2.82)#3,526 |
| 67. | Gridley | 5.9% | 2.5%(+3.33)#67 | 3.1%(+2.78)#3,565 |
| 68. | Jetmore | 5.8% | 2.5%(+3.29)#68 | 3.1%(+2.74)#3,603 |
| 69. | Mount Hope | 5.7% | 2.5%(+3.20)#69 | 3.1%(+2.65)#3,677 |
| 70. | Wakeeney | 5.6% | 2.5%(+3.05)#70 | 3.1%(+2.50)#3,797 |
| 71. | Hoyt | 5.4% | 2.5%(+2.86)#71 | 3.1%(+2.31)#3,990 |
| 72. | Hays | 5.3% | 2.5%(+2.76)#72 | 3.1%(+2.21)#4,095 |
| 73. | Norton | 5.3% | 2.5%(+2.76)#73 | 3.1%(+2.21)#4,096 |
| 74. | Goddard | 5.3% | 2.5%(+2.75)#74 | 3.1%(+2.20)#4,106 |
| 75. | Elbing | 5.3% | 2.5%(+2.71)#75 | 3.1%(+2.16)#4,157 |
| 76. | Hugoton | 5.2% | 2.5%(+2.66)#76 | 3.1%(+2.11)#4,209 |
| 77. | Plainville | 5.2% | 2.5%(+2.62)#77 | 3.1%(+2.07)#4,248 |
| 78. | Minneapolis | 5.1% | 2.5%(+2.59)#78 | 3.1%(+2.04)#4,284 |
| 79. | Wamego | 5.1% | 2.5%(+2.56)#79 | 3.1%(+2.01)#4,335 |
| 80. | Lyndon | 5.1% | 2.5%(+2.52)#80 | 3.1%(+1.97)#4,377 |
| 81. | Mankato | 5.0% | 2.5%(+2.49)#81 | 3.1%(+1.94)#4,412 |
| 82. | Marion | 5.0% | 2.5%(+2.45)#82 | 3.1%(+1.90)#4,445 |
| 83. | Meriden | 4.9% | 2.5%(+2.35)#83 | 3.1%(+1.80)#4,579 |
| 84. | Sharon Springs | 4.8% | 2.5%(+2.21)#84 | 3.1%(+1.66)#4,753 |
| 85. | Richmond | 4.8% | 2.5%(+2.21)#85 | 3.1%(+1.66)#4,764 |
| 86. | Manhattan | 4.8% | 2.5%(+2.21)#86 | 3.1%(+1.66)#4,784 |
| 87. | Burlingame | 4.7% | 2.5%(+2.10)#87 | 3.1%(+1.55)#4,903 |
| 88. | Seneca | 4.6% | 2.5%(+2.08)#88 | 3.1%(+1.53)#4,931 |
| 89. | Winfield | 4.5% | 2.5%(+2.00)#89 | 3.1%(+1.45)#5,060 |
| 90. | Jewell | 4.5% | 2.5%(+2.00)#90 | 3.1%(+1.45)#5,088 |
| 91. | Hanover | 4.5% | 2.5%(+1.96)#91 | 3.1%(+1.40)#5,151 |
| 92. | Mound Valley | 4.3% | 2.5%(+1.80)#92 | 3.1%(+1.25)#5,402 |
| 93. | Burdett | 4.3% | 2.5%(+1.74)#93 | 3.1%(+1.19)#5,495 |
| 94. | Little River | 4.3% | 2.5%(+1.71)#94 | 3.1%(+1.16)#5,541 |
| 95. | Fort Riley | 4.2% | 2.5%(+1.67)#95 | 3.1%(+1.12)#5,595 |
| 96. | Hardtner | 4.2% | 2.5%(+1.62)#96 | 3.1%(+1.07)#5,691 |
| 97. | Raymond | 4.2% | 2.5%(+1.62)#97 | 3.1%(+1.07)#5,695 |
| 98. | Derby | 4.1% | 2.5%(+1.58)#98 | 3.1%(+1.03)#5,748 |
| 99. | Horton | 4.1% | 2.5%(+1.50)#99 | 3.1%(+0.954)#5,870 |
| 100. | Hiawatha | 4.0% | 2.5%(+1.47)#100 | 3.1%(+0.916)#5,939 |
Common Questions
What are the Top 10 Cities with the Highest Percentage of Population with a Degree in Physical and Health Sciences in Kansas?
Top 10 Cities with the Highest Percentage of Population with a Degree in Physical and Health Sciences in Kansas are:
#1
40.0%
#2
38.9%
#3
30.8%
#4
29.2%
#5
25.0%
#6
24.1%
#7
22.9%
#8
22.2%
#9
21.7%
#10
19.9%
What city has the Highest Percentage of Population with a Degree in Physical and Health Sciences in Kansas?
Muscotah has the Highest Percentage of Population with a Degree in Physical and Health Sciences in Kansas with 40.0%.
What is the Percentage of Population with a Degree in Physical and Health Sciences in the State of Kansas?
Percentage of Population with a Degree in Physical and Health Sciences in Kansas is 2.5%.
What is the Percentage of Population with a Degree in Physical and Health Sciences in the United States?
Percentage of Population with a Degree in Physical and Health Sciences in the United States is 3.1%.