New Hope, VA
New Hope Map
New Hope Overview
927
TOTAL POPULATION
483
MALE POPULATION
444
FEMALE POPULATION
108.78
MALES / 100 FEMALES
91.93
FEMALES / 100 MALES
50.7
MEDIAN AGE
3.1
AVG FAMILY SIZE
2.4
AVG HOUSEHOLD SIZE
$35,647
PER CAPITA INCOME
$84,808
AVG FAMILY INCOME
$81,164
AVG HOUSEHOLD INCOME
11.5%
WAGE / INCOME GAP [ % ]
88.5¢/ $1
WAGE / INCOME GAP [ $ ]
0.30
INEQUALITY / GINI INDEX
592
LABOR FORCE [ PEOPLE ]
72.5%
PERCENT IN LABOR FORCE
New Hope Area Codes
Race in New Hope
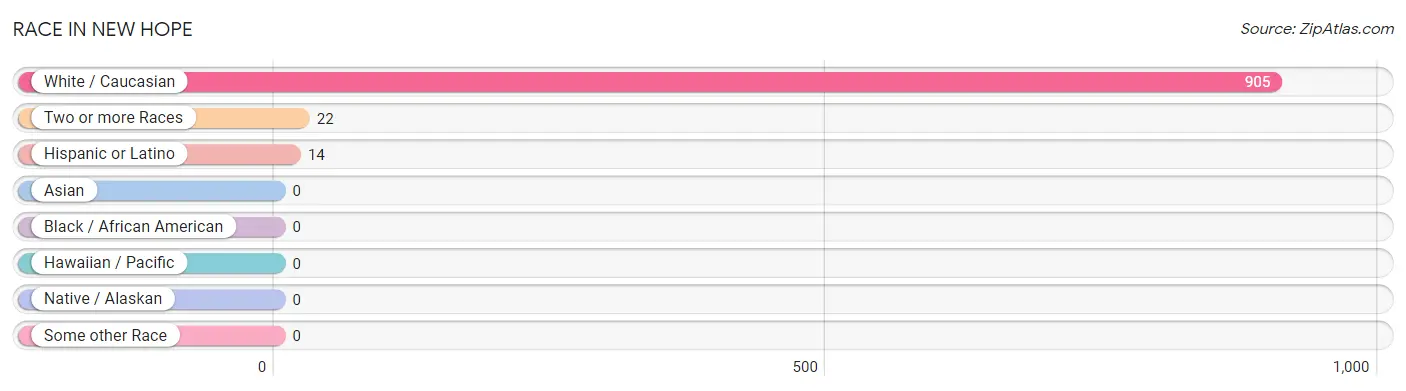
The most populous races in New Hope are White / Caucasian (905 | 97.6%), Two or more Races (22 | 2.4%), and Hispanic or Latino (14 | 1.5%).
| Race | # Population | % Population |
| Asian | 0 | 0.0% |
| Black / African American | 0 | 0.0% |
| Hawaiian / Pacific | 0 | 0.0% |
| Hispanic or Latino | 14 | 1.5% |
| Native / Alaskan | 0 | 0.0% |
| White / Caucasian | 905 | 97.6% |
| Two or more Races | 22 | 2.4% |
| Some other Race | 0 | 0.0% |
| Total | 927 | 100.0% |
Ancestry in New Hope
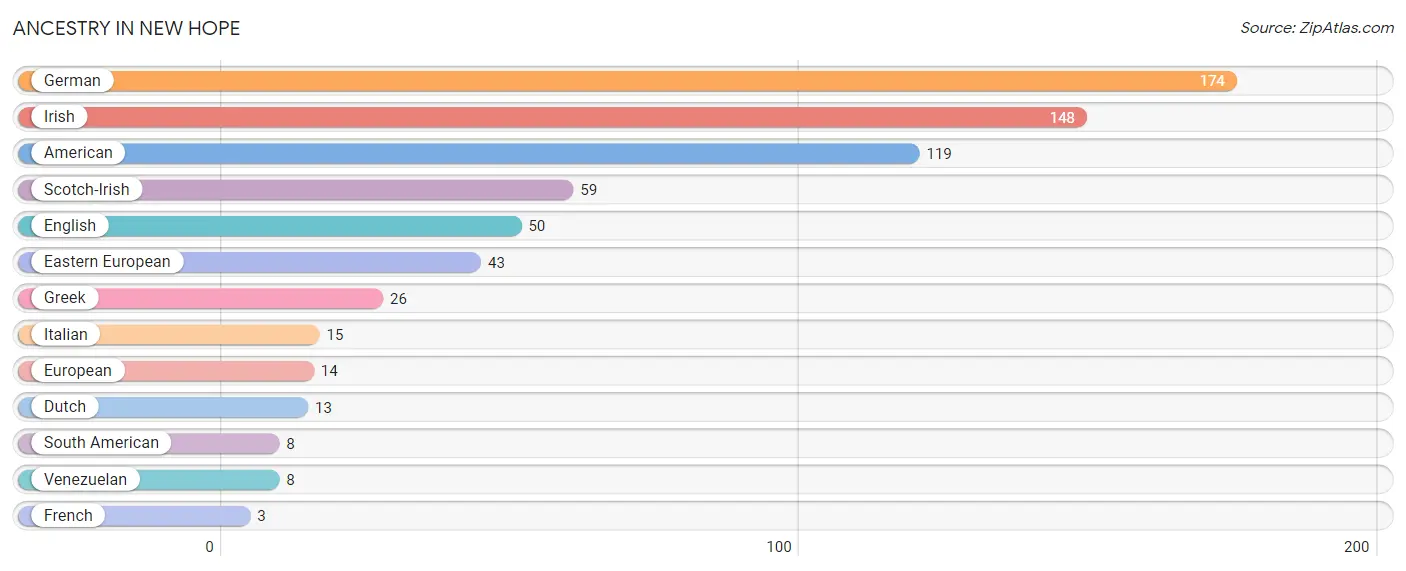
The most populous ancestries reported in New Hope are German (174 | 18.8%), Irish (148 | 16.0%), American (119 | 12.8%), Scotch-Irish (59 | 6.4%), and English (50 | 5.4%), together accounting for 59.3% of all New Hope residents.
| Ancestry | # Population | % Population |
| American | 119 | 12.8% |
| Dutch | 13 | 1.4% |
| Eastern European | 43 | 4.6% |
| English | 50 | 5.4% |
| European | 14 | 1.5% |
| French | 3 | 0.3% |
| German | 174 | 18.8% |
| Greek | 26 | 2.8% |
| Irish | 148 | 16.0% |
| Italian | 15 | 1.6% |
| Scotch-Irish | 59 | 6.4% |
| South American | 8 | 0.9% |
| Venezuelan | 8 | 0.9% | View All 13 Rows |
Immigrants in New Hope
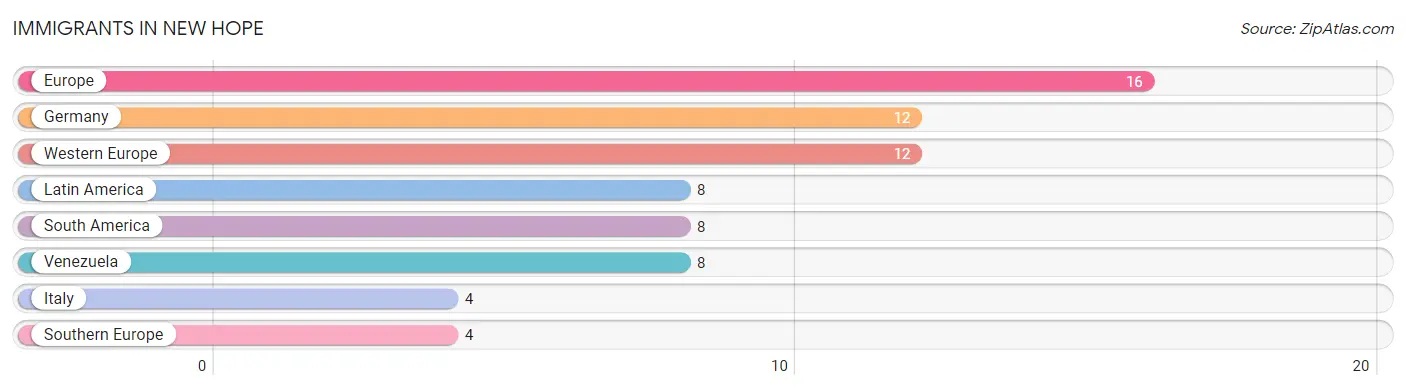
The most numerous immigrant groups reported in New Hope came from Europe (16 | 1.7%), Germany (12 | 1.3%), Western Europe (12 | 1.3%), Latin America (8 | 0.9%), and South America (8 | 0.9%), together accounting for 6.0% of all New Hope residents.
| Immigration Origin | # Population | % Population |
| Europe | 16 | 1.7% |
| Germany | 12 | 1.3% |
| Italy | 4 | 0.4% |
| Latin America | 8 | 0.9% |
| South America | 8 | 0.9% |
| Southern Europe | 4 | 0.4% |
| Venezuela | 8 | 0.9% |
| Western Europe | 12 | 1.3% | View All 8 Rows |
Sex and Age in New Hope
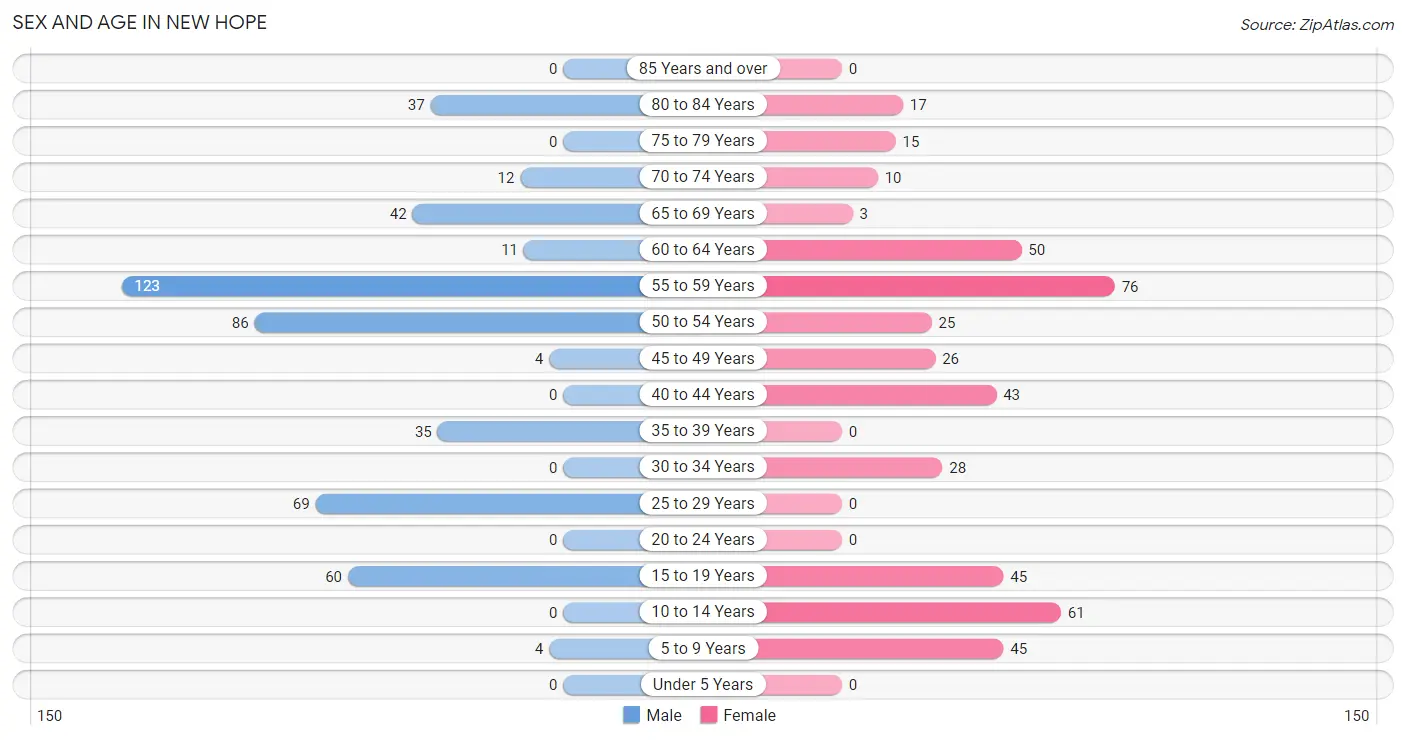
Sex and Age in New Hope
The most populous age groups in New Hope are 55 to 59 Years (123 | 25.5%) for men and 55 to 59 Years (76 | 17.1%) for women.
| Age Bracket | Male | Female |
| Under 5 Years | 0 (0.0%) | 0 (0.0%) |
| 5 to 9 Years | 4 (0.8%) | 45 (10.1%) |
| 10 to 14 Years | 0 (0.0%) | 61 (13.7%) |
| 15 to 19 Years | 60 (12.4%) | 45 (10.1%) |
| 20 to 24 Years | 0 (0.0%) | 0 (0.0%) |
| 25 to 29 Years | 69 (14.3%) | 0 (0.0%) |
| 30 to 34 Years | 0 (0.0%) | 28 (6.3%) |
| 35 to 39 Years | 35 (7.2%) | 0 (0.0%) |
| 40 to 44 Years | 0 (0.0%) | 43 (9.7%) |
| 45 to 49 Years | 4 (0.8%) | 26 (5.9%) |
| 50 to 54 Years | 86 (17.8%) | 25 (5.6%) |
| 55 to 59 Years | 123 (25.5%) | 76 (17.1%) |
| 60 to 64 Years | 11 (2.3%) | 50 (11.3%) |
| 65 to 69 Years | 42 (8.7%) | 3 (0.7%) |
| 70 to 74 Years | 12 (2.5%) | 10 (2.2%) |
| 75 to 79 Years | 0 (0.0%) | 15 (3.4%) |
| 80 to 84 Years | 37 (7.7%) | 17 (3.8%) |
| 85 Years and over | 0 (0.0%) | 0 (0.0%) |
| Total | 483 (100.0%) | 444 (100.0%) |
Families and Households in New Hope
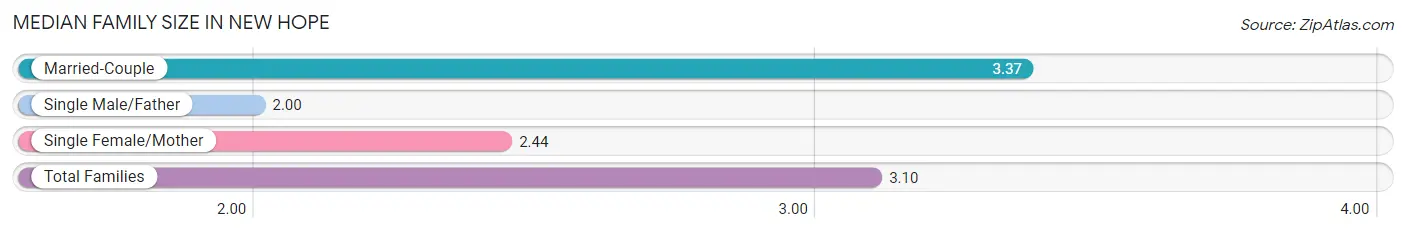
Median Family Size in New Hope
The median family size in New Hope is 3.10 persons per family, with married-couple families (198 | 77.9%) accounting for the largest median family size of 3.37 persons per family. On the other hand, single male/father families (38 | 15.0%) represent the smallest median family size with 2.00 persons per family.
| Family Type | # Families | Family Size |
| Married-Couple | 198 (77.9%) | 3.37 |
| Single Male/Father | 38 (15.0%) | 2.00 |
| Single Female/Mother | 18 (7.1%) | 2.44 |
| Total Families | 254 (100.0%) | 3.10 |
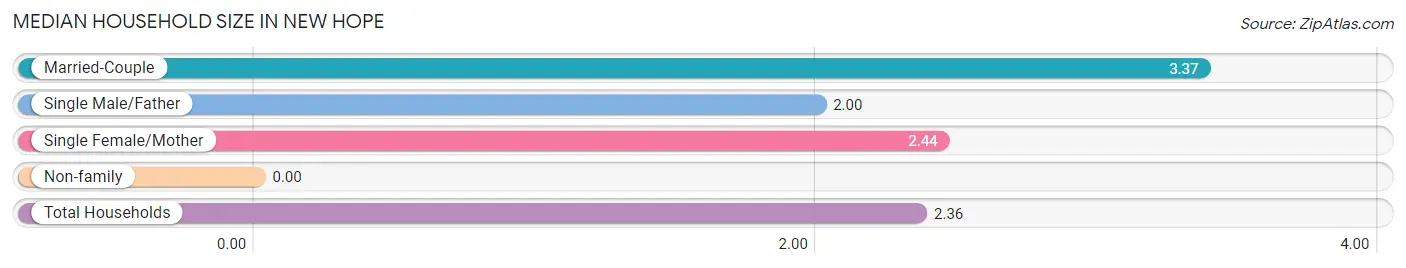
Median Household Size in New Hope
| Household Type | # Households | Household Size |
| Married-Couple | 198 (50.4%) | 3.37 |
| Single Male/Father | 38 (9.7%) | 2.00 |
| Single Female/Mother | 18 (4.6%) | 2.44 |
| Non-family | 139 (35.4%) | - |
| Total Households | 393 (100.0%) | 2.36 |
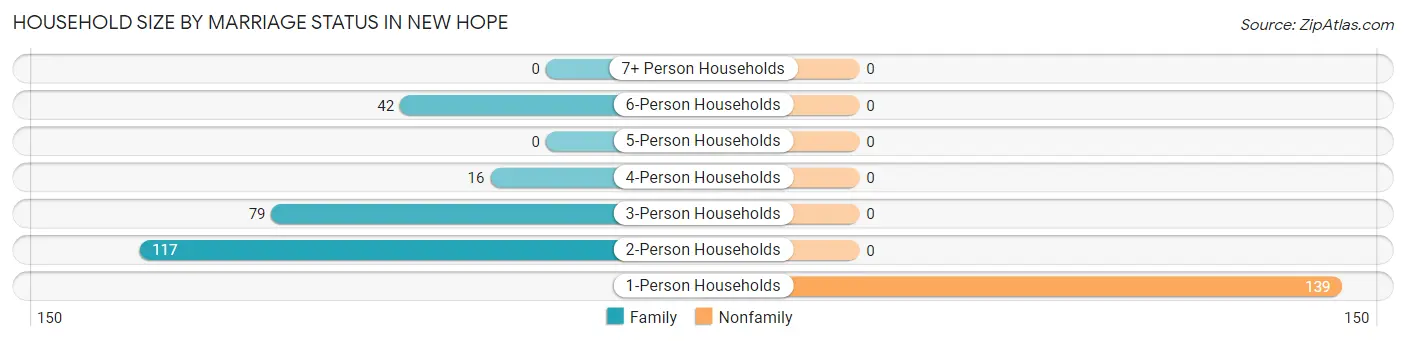
Household Size by Marriage Status in New Hope
Out of a total of 393 households in New Hope, 254 (64.6%) are family households, while 139 (35.4%) are nonfamily households. The most numerous type of family households are 2-person households, comprising 117, and the most common type of nonfamily households are 1-person households, comprising 139.
| Household Size | Family Households | Nonfamily Households |
| 1-Person Households | - | 139 (35.4%) |
| 2-Person Households | 117 (29.8%) | 0 (0.0%) |
| 3-Person Households | 79 (20.1%) | 0 (0.0%) |
| 4-Person Households | 16 (4.1%) | 0 (0.0%) |
| 5-Person Households | 0 (0.0%) | 0 (0.0%) |
| 6-Person Households | 42 (10.7%) | 0 (0.0%) |
| 7+ Person Households | 0 (0.0%) | 0 (0.0%) |
| Total | 254 (64.6%) | 139 (35.4%) |
Female Fertility in New Hope
Fertility by Age in New Hope
| Age Bracket | Women with Births | Births / 1,000 Women |
| 15 to 19 years | 0 (0.0%) | 0.0 |
| 20 to 34 years | 0 (0.0%) | 0.0 |
| 35 to 50 years | 0 (0.0%) | 0.0 |
| Total | 0 (0.0%) | 0.0 |
Fertility by Age by Marriage Status in New Hope
| Age Bracket | Married | Unmarried |
| 15 to 19 years | 0 (0.0%) | 0 (0.0%) |
| 20 to 34 years | 0 (0.0%) | 0 (0.0%) |
| 35 to 50 years | 0 (0.0%) | 0 (0.0%) |
| Total | 0 (0.0%) | 0 (0.0%) |
Fertility by Education in New Hope
| Educational Attainment | Women with Births | Births / 1,000 Women |
| Less than High School | 0 (0.0%) | 0.0 |
| High School Diploma | 0 (0.0%) | 0.0 |
| College or Associate's Degree | 0 (0.0%) | 0.0 |
| Bachelor's Degree | 0 (0.0%) | 0.0 |
| Graduate Degree | 0 (0.0%) | 0.0 |
| Total | 0 (0.0%) | 0.0 |
Fertility by Education by Marriage Status in New Hope
| Educational Attainment | Married | Unmarried |
| Less than High School | 0 (0.0%) | 0 (0.0%) |
| High School Diploma | 0 (0.0%) | 0 (0.0%) |
| College or Associate's Degree | 0 (0.0%) | 0 (0.0%) |
| Bachelor's Degree | 0 (0.0%) | 0 (0.0%) |
| Graduate Degree | 0 (0.0%) | 0 (0.0%) |
| Total | 0 (0.0%) | 0 (0.0%) |
Income in New Hope
Income Overview in New Hope
Per Capita Income in New Hope is $35,647, while median incomes of families and households are $84,808 and $81,164 respectively.
| Characteristic | Number | Measure |
| Per Capita Income | 927 | $35,647 |
| Median Family Income | 254 | $84,808 |
| Mean Family Income | 254 | $94,992 |
| Median Household Income | 393 | $81,164 |
| Mean Household Income | 393 | $84,163 |
| Income Deficit | 254 | $0 |
| Wage / Income Gap (%) | 927 | 11.53% |
| Wage / Income Gap ($) | 927 | 88.47¢ per $1 |
| Gini / Inequality Index | 927 | 0.30 |
Earnings by Sex in New Hope
Average Earnings in New Hope are $43,526, $45,814 for men and $40,532 for women, a difference of 11.5%.
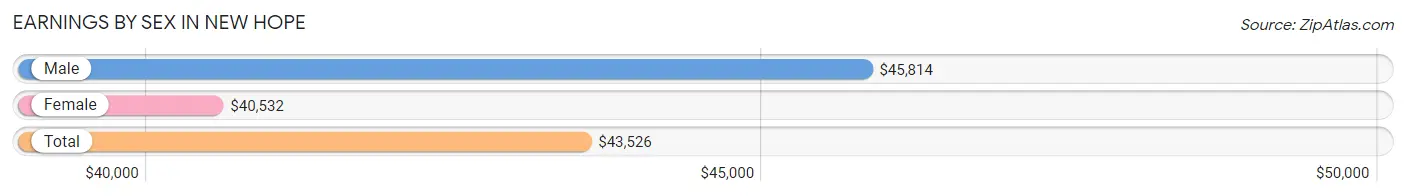
| Sex | Number | Average Earnings |
| Male | 358 (56.1%) | $45,814 |
| Female | 280 (43.9%) | $40,532 |
| Total | 638 (100.0%) | $43,526 |
Earnings by Sex by Income Bracket in New Hope
The most common earnings brackets in New Hope are $12,500 to $14,999 for men (65 | 18.2%) and $40,000 to $44,999 for women (47 | 16.8%).
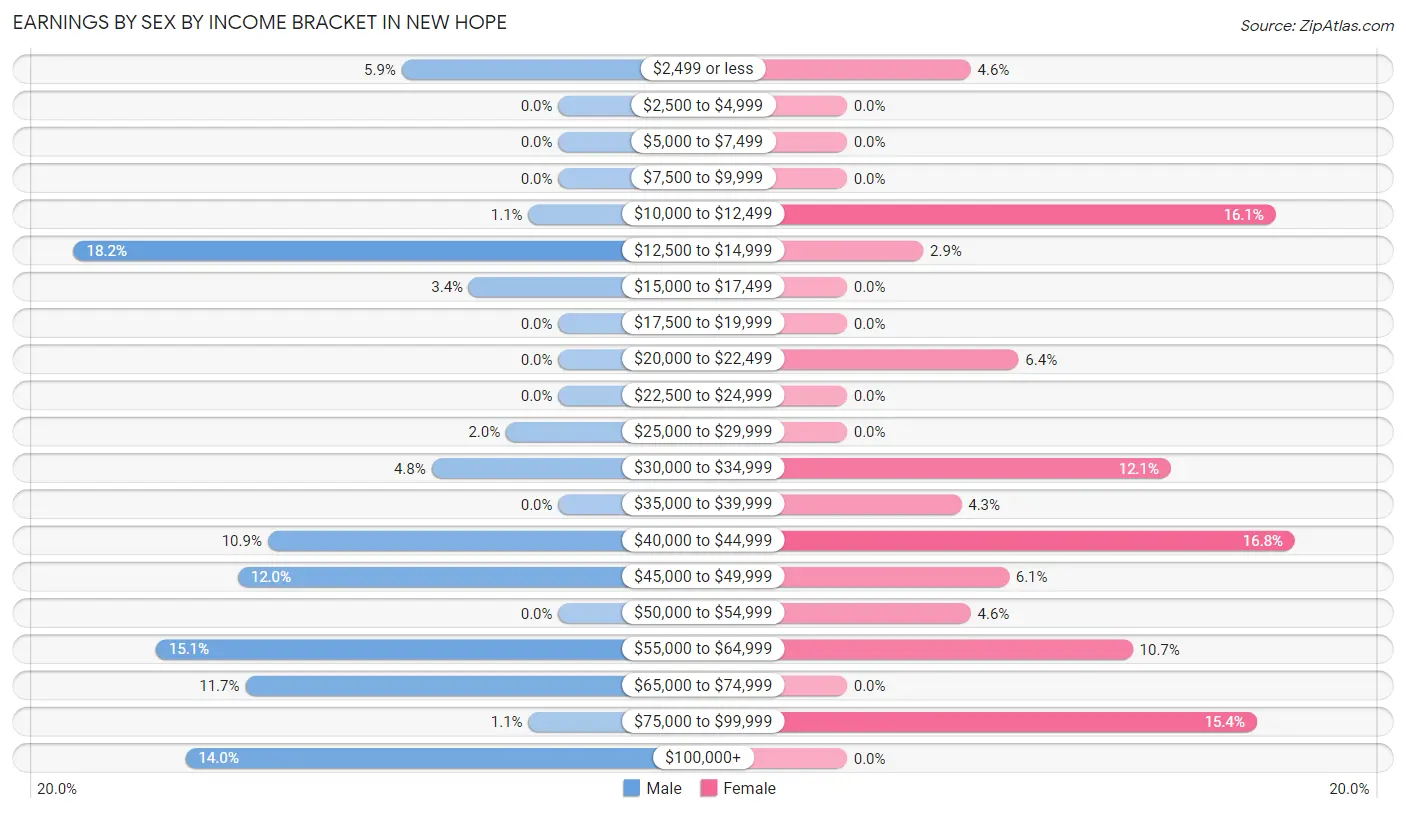
| Income | Male | Female |
| $2,499 or less | 21 (5.9%) | 13 (4.6%) |
| $2,500 to $4,999 | 0 (0.0%) | 0 (0.0%) |
| $5,000 to $7,499 | 0 (0.0%) | 0 (0.0%) |
| $7,500 to $9,999 | 0 (0.0%) | 0 (0.0%) |
| $10,000 to $12,499 | 4 (1.1%) | 45 (16.1%) |
| $12,500 to $14,999 | 65 (18.2%) | 8 (2.9%) |
| $15,000 to $17,499 | 12 (3.4%) | 0 (0.0%) |
| $17,500 to $19,999 | 0 (0.0%) | 0 (0.0%) |
| $20,000 to $22,499 | 0 (0.0%) | 18 (6.4%) |
| $22,500 to $24,999 | 0 (0.0%) | 0 (0.0%) |
| $25,000 to $29,999 | 7 (2.0%) | 0 (0.0%) |
| $30,000 to $34,999 | 17 (4.8%) | 34 (12.1%) |
| $35,000 to $39,999 | 0 (0.0%) | 12 (4.3%) |
| $40,000 to $44,999 | 39 (10.9%) | 47 (16.8%) |
| $45,000 to $49,999 | 43 (12.0%) | 17 (6.1%) |
| $50,000 to $54,999 | 0 (0.0%) | 13 (4.6%) |
| $55,000 to $64,999 | 54 (15.1%) | 30 (10.7%) |
| $65,000 to $74,999 | 42 (11.7%) | 0 (0.0%) |
| $75,000 to $99,999 | 4 (1.1%) | 43 (15.4%) |
| $100,000+ | 50 (14.0%) | 0 (0.0%) |
| Total | 358 (100.0%) | 280 (100.0%) |
Earnings by Sex by Educational Attainment in New Hope
Average earnings in New Hope are $55,132 for men and $41,729 for women, a difference of 24.3%. Men with an educational attainment of high school diploma enjoy the highest average annual earnings of $60,964, while those with high school diploma education earn the least with $60,964. Women with an educational attainment of bachelor's degree earn the most with the average annual earnings of $41,786, while those with high school diploma education have the smallest earnings of $38,958.
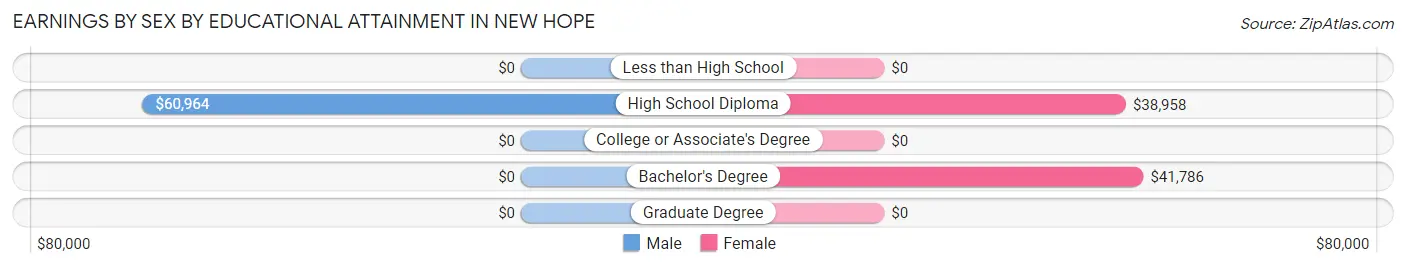
| Educational Attainment | Male Income | Female Income |
| Less than High School | - | - |
| High School Diploma | $60,964 | $38,958 |
| College or Associate's Degree | - | - |
| Bachelor's Degree | - | - |
| Graduate Degree | - | - |
| Total | $55,132 | $41,729 |
Family Income in New Hope
Family Income Brackets in New Hope
According to the New Hope family income data, there are 65 families falling into the $100,000 to $149,999 income range, which is the most common income bracket and makes up 25.6% of all families.
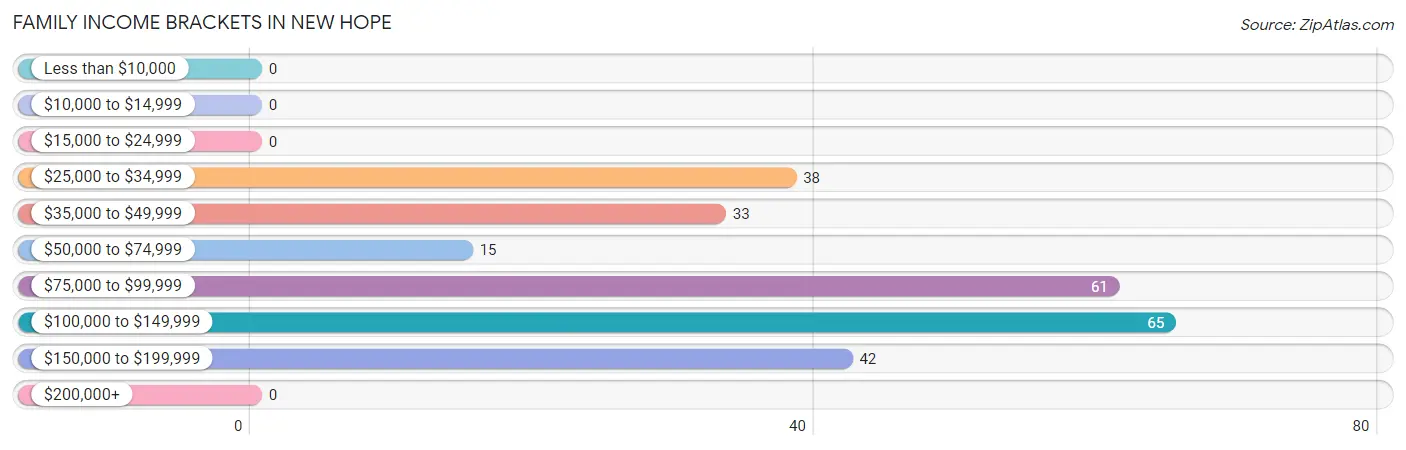
| Income Bracket | # Families | % Families |
| Less than $10,000 | 0 | 0.0% |
| $10,000 to $14,999 | 0 | 0.0% |
| $15,000 to $24,999 | 0 | 0.0% |
| $25,000 to $34,999 | 38 | 15.0% |
| $35,000 to $49,999 | 33 | 13.0% |
| $50,000 to $74,999 | 15 | 5.9% |
| $75,000 to $99,999 | 61 | 24.0% |
| $100,000 to $149,999 | 65 | 25.6% |
| $150,000 to $199,999 | 42 | 16.5% |
| $200,000+ | 0 | 0.0% |
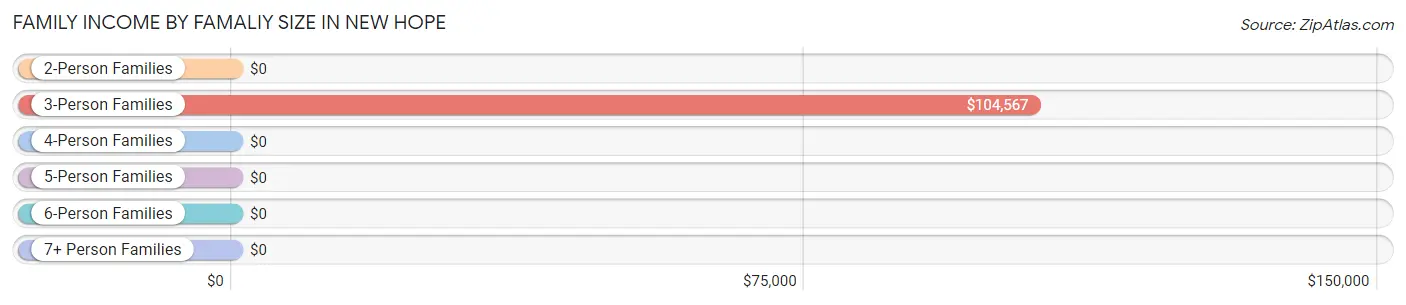
Family Income by Famaliy Size in New Hope
3-person families (79 | 31.1%) account for the highest median family income in New Hope with $104,567 per family, while 3-person families (79 | 31.1%) have the highest median income of $34,856 per family member.
| Income Bracket | # Families | Median Income |
| 2-Person Families | 117 (46.1%) | $0 |
| 3-Person Families | 79 (31.1%) | $104,567 |
| 4-Person Families | 16 (6.3%) | $0 |
| 5-Person Families | 0 (0.0%) | $0 |
| 6-Person Families | 42 (16.5%) | $0 |
| 7+ Person Families | 0 (0.0%) | $0 |
| Total | 254 (100.0%) | $84,808 |
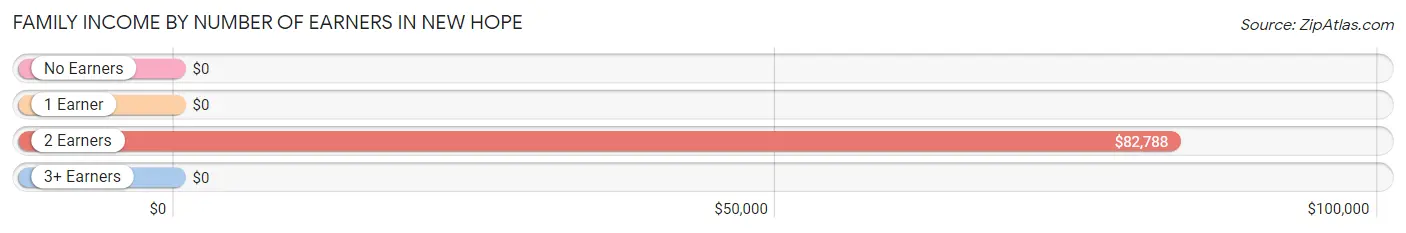
Family Income by Number of Earners in New Hope
| Number of Earners | # Families | Median Income |
| No Earners | 38 (15.0%) | $0 |
| 1 Earner | 18 (7.1%) | $0 |
| 2 Earners | 121 (47.6%) | $82,788 |
| 3+ Earners | 77 (30.3%) | $0 |
| Total | 254 (100.0%) | $84,808 |
Household Income in New Hope
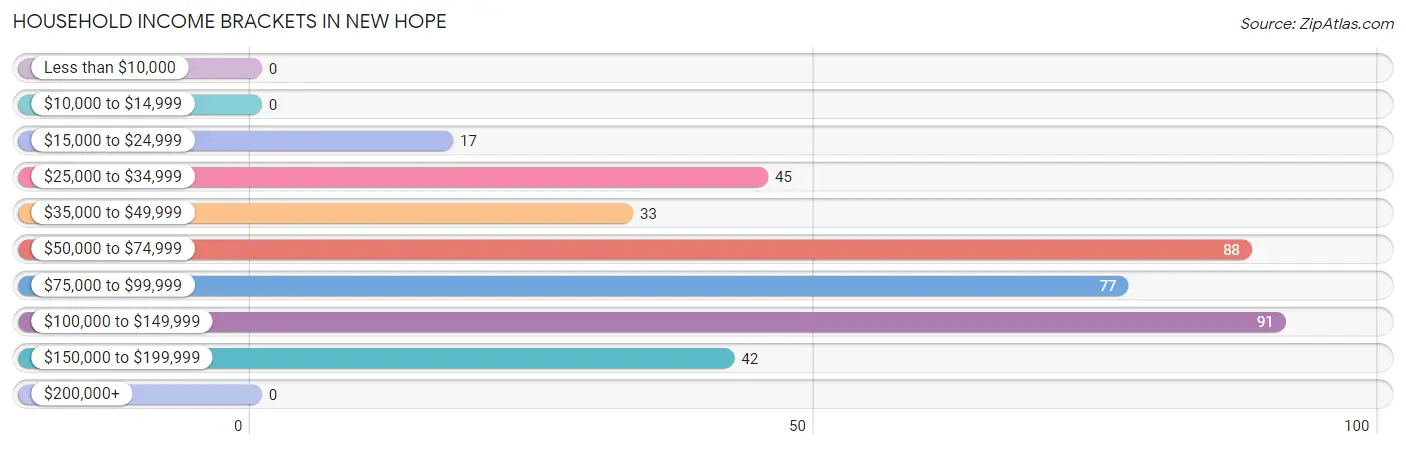
Household Income Brackets in New Hope
With 91 households falling in the category, the $100,000 to $149,999 income range is the most frequent in New Hope, accounting for 23.2% of all households.
| Income Bracket | # Households | % Households |
| Less than $10,000 | 0 | 0.0% |
| $10,000 to $14,999 | 0 | 0.0% |
| $15,000 to $24,999 | 17 | 4.3% |
| $25,000 to $34,999 | 45 | 11.5% |
| $35,000 to $49,999 | 33 | 8.4% |
| $50,000 to $74,999 | 88 | 22.4% |
| $75,000 to $99,999 | 77 | 19.6% |
| $100,000 to $149,999 | 91 | 23.2% |
| $150,000 to $199,999 | 42 | 10.7% |
| $200,000+ | 0 | 0.0% |
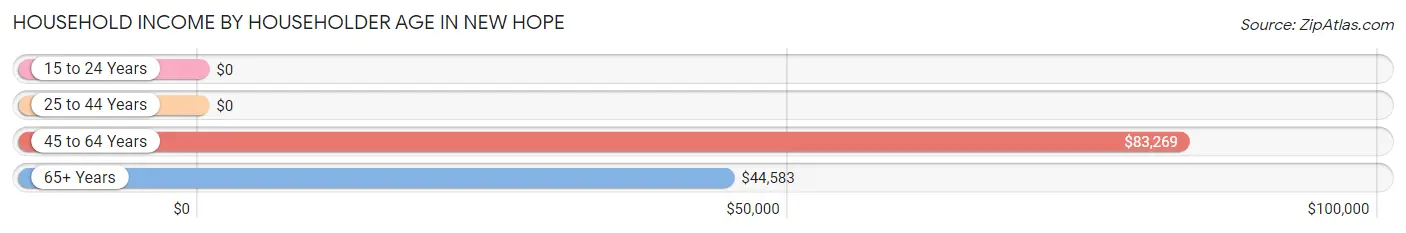
Household Income by Householder Age in New Hope
The median household income in New Hope is $81,164, with the highest median household income of $83,269 found in the 45 to 64 years age bracket for the primary householder. A total of 252 households (64.1%) fall into this category.
| Income Bracket | # Households | Median Income |
| 15 to 24 Years | 0 (0.0%) | $0 |
| 25 to 44 Years | 78 (19.9%) | $0 |
| 45 to 64 Years | 252 (64.1%) | $83,269 |
| 65+ Years | 63 (16.0%) | $44,583 |
| Total | 393 (100.0%) | $81,164 |
Poverty in New Hope
Income Below Poverty by Sex and Age in New Hope
| Age Bracket | Male | Female |
| Under 5 Years | 0 (0.0%) | 0 (0.0%) |
| 5 Years | 0 (0.0%) | 0 (0.0%) |
| 6 to 11 Years | 0 (0.0%) | 0 (0.0%) |
| 12 to 14 Years | 0 (0.0%) | 0 (0.0%) |
| 15 Years | 0 (0.0%) | 0 (0.0%) |
| 16 and 17 Years | 0 (0.0%) | 0 (0.0%) |
| 18 to 24 Years | 0 (0.0%) | 0 (0.0%) |
| 25 to 34 Years | 0 (0.0%) | 0 (0.0%) |
| 35 to 44 Years | 0 (0.0%) | 0 (0.0%) |
| 45 to 54 Years | 0 (0.0%) | 0 (0.0%) |
| 55 to 64 Years | 0 (0.0%) | 0 (0.0%) |
| 65 to 74 Years | 0 (0.0%) | 0 (0.0%) |
| 75 Years and over | 0 (0.0%) | 0 (0.0%) |
| Total | 0 (0.0%) | 0 (0.0%) |
Income Above Poverty by Sex and Age in New Hope
According to the poverty statistics in New Hope, males aged 6 to 11 years and females aged 6 to 11 years are the age groups that are most secure financially, with 100.0% of males and 100.0% of females in these age groups living above the poverty line.
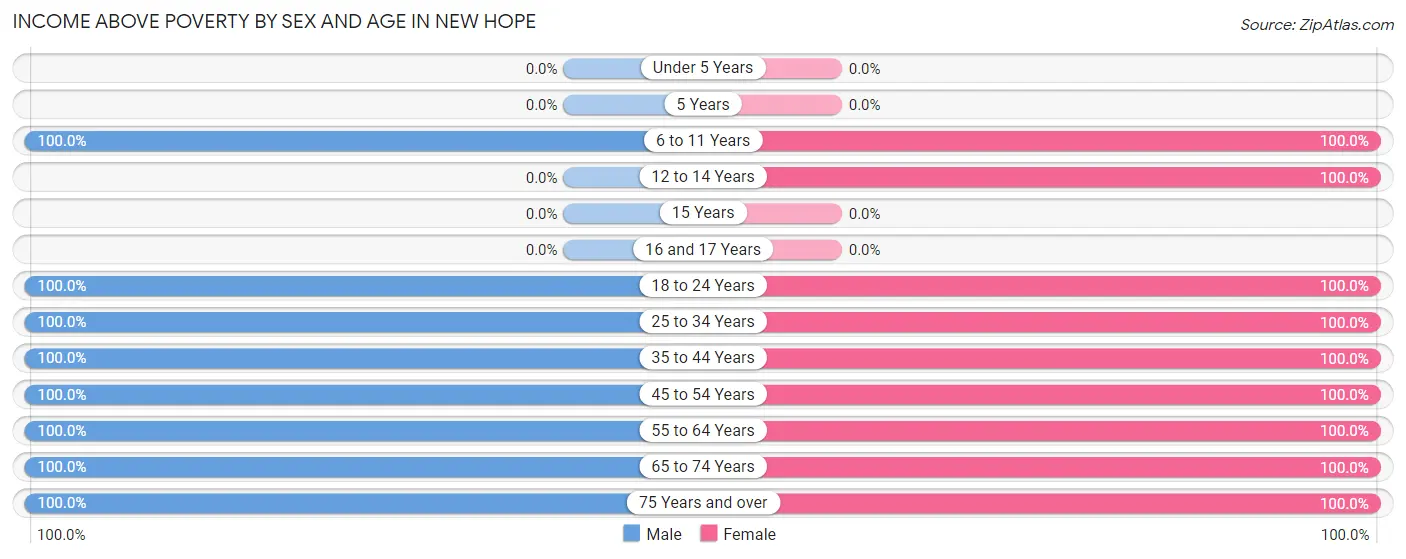
| Age Bracket | Male | Female |
| Under 5 Years | 0 (0.0%) | 0 (0.0%) |
| 5 Years | 0 (0.0%) | 0 (0.0%) |
| 6 to 11 Years | 4 (100.0%) | 95 (100.0%) |
| 12 to 14 Years | 0 (0.0%) | 11 (100.0%) |
| 15 Years | 0 (0.0%) | 0 (0.0%) |
| 16 and 17 Years | 0 (0.0%) | 0 (0.0%) |
| 18 to 24 Years | 60 (100.0%) | 45 (100.0%) |
| 25 to 34 Years | 69 (100.0%) | 28 (100.0%) |
| 35 to 44 Years | 35 (100.0%) | 43 (100.0%) |
| 45 to 54 Years | 90 (100.0%) | 51 (100.0%) |
| 55 to 64 Years | 134 (100.0%) | 126 (100.0%) |
| 65 to 74 Years | 54 (100.0%) | 13 (100.0%) |
| 75 Years and over | 37 (100.0%) | 32 (100.0%) |
| Total | 483 (100.0%) | 444 (100.0%) |
Income Below Poverty Among Married-Couple Families in New Hope
| Children | Above Poverty | Below Poverty |
| No Children | 140 (100.0%) | 0 (0.0%) |
| 1 or 2 Children | 58 (100.0%) | 0 (0.0%) |
| 3 or 4 Children | 0 (0.0%) | 0 (0.0%) |
| 5 or more Children | 0 (0.0%) | 0 (0.0%) |
| Total | 198 (100.0%) | 0 (0.0%) |
Income Below Poverty Among Single-Parent Households in New Hope
| Children | Single Father | Single Mother |
| No Children | 0 (0.0%) | 0 (0.0%) |
| 1 or 2 Children | 0 (0.0%) | 0 (0.0%) |
| 3 or 4 Children | 0 (0.0%) | 0 (0.0%) |
| 5 or more Children | 0 (0.0%) | 0 (0.0%) |
| Total | 0 (0.0%) | 0 (0.0%) |
Income Below Poverty Among Married-Couple vs Single-Parent Households in New Hope
| Children | Married-Couple Families | Single-Parent Households |
| No Children | 0 (0.0%) | 0 (0.0%) |
| 1 or 2 Children | 0 (0.0%) | 0 (0.0%) |
| 3 or 4 Children | 0 (0.0%) | 0 (0.0%) |
| 5 or more Children | 0 (0.0%) | 0 (0.0%) |
| Total | 0 (0.0%) | 0 (0.0%) |
Employment Characteristics in New Hope
Employment by Class of Employer in New Hope
Among the 592 employed individuals in New Hope, private company employees (378 | 63.8%), state government employees (62 | 10.5%), and local government employees (56 | 9.5%) make up the most common classes of employment.
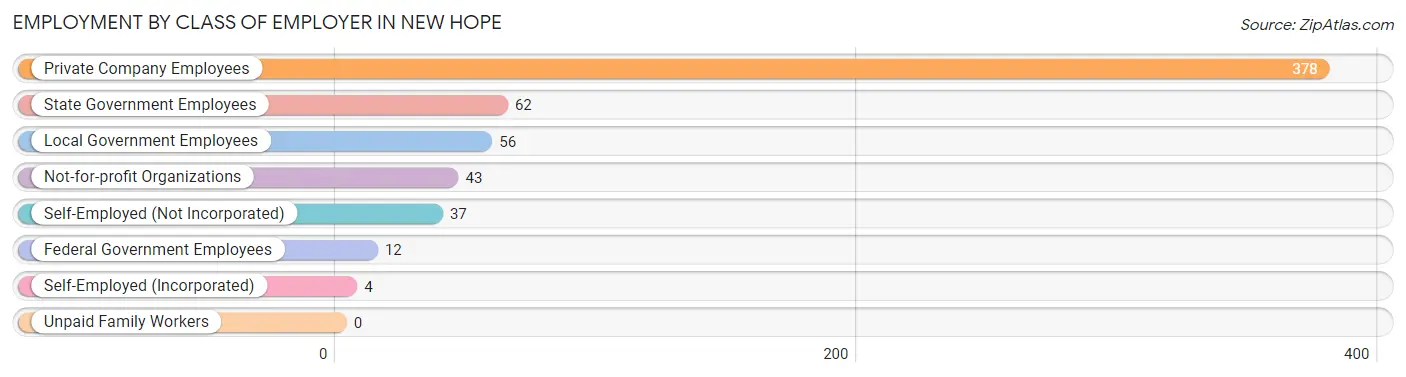
| Employer Class | # Employees | % Employees |
| Private Company Employees | 378 | 63.8% |
| Self-Employed (Incorporated) | 4 | 0.7% |
| Self-Employed (Not Incorporated) | 37 | 6.2% |
| Not-for-profit Organizations | 43 | 7.3% |
| Local Government Employees | 56 | 9.5% |
| State Government Employees | 62 | 10.5% |
| Federal Government Employees | 12 | 2.0% |
| Unpaid Family Workers | 0 | 0.0% |
| Total | 592 | 100.0% |
Employment Status by Age in New Hope
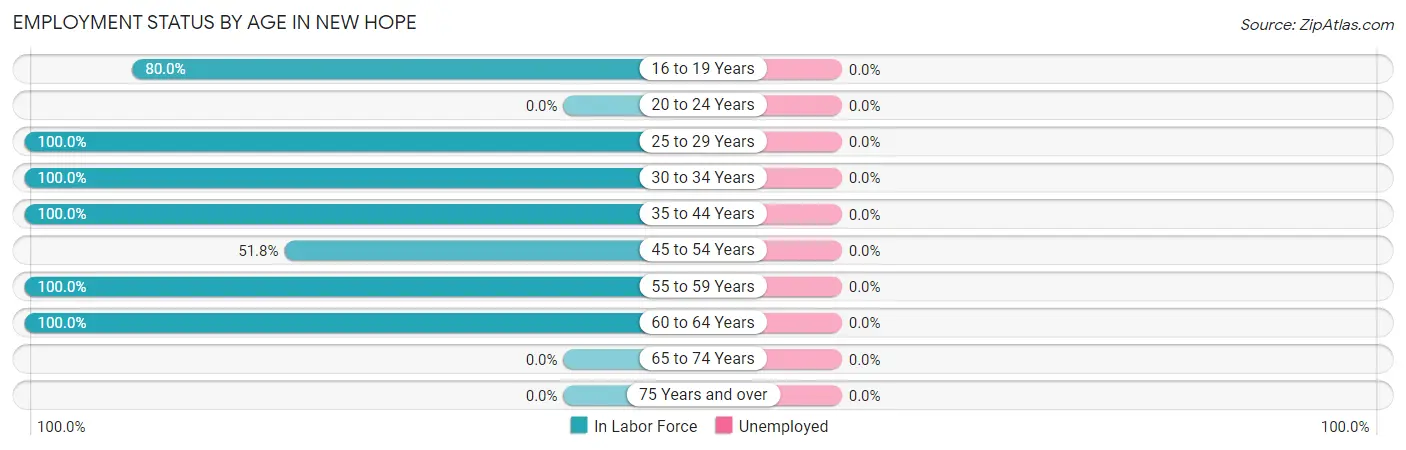
| Age Bracket | In Labor Force | Unemployed |
| 16 to 19 Years | 84 (80.0%) | 0 (0.0%) |
| 20 to 24 Years | 0 (0.0%) | 0 (0.0%) |
| 25 to 29 Years | 69 (100.0%) | 0 (0.0%) |
| 30 to 34 Years | 28 (100.0%) | 0 (0.0%) |
| 35 to 44 Years | 78 (100.0%) | 0 (0.0%) |
| 45 to 54 Years | 73 (51.8%) | 0 (0.0%) |
| 55 to 59 Years | 199 (100.0%) | 0 (0.0%) |
| 60 to 64 Years | 61 (100.0%) | 0 (0.0%) |
| 65 to 74 Years | 0 (0.0%) | 0 (0.0%) |
| 75 Years and over | 0 (0.0%) | 0 (0.0%) |
| Total | 592 (72.5%) | 0 (0.0%) |
Employment Status by Educational Attainment in New Hope
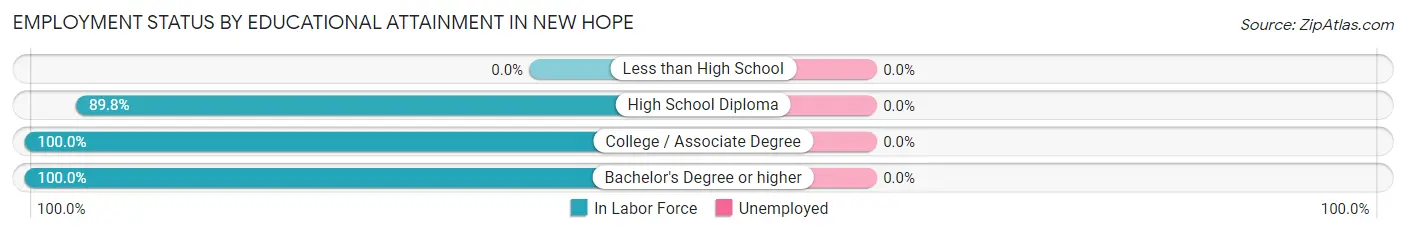
| Educational Attainment | In Labor Force | Unemployed |
| Less than High School | 0 (0.0%) | 0 (0.0%) |
| High School Diploma | 265 (89.8%) | 0 (0.0%) |
| College / Associate Degree | 54 (100.0%) | 0 (0.0%) |
| Bachelor's Degree or higher | 189 (100.0%) | 0 (0.0%) |
| Total | 508 (88.2%) | 0 (0.0%) |
Employment Occupations by Sex in New Hope
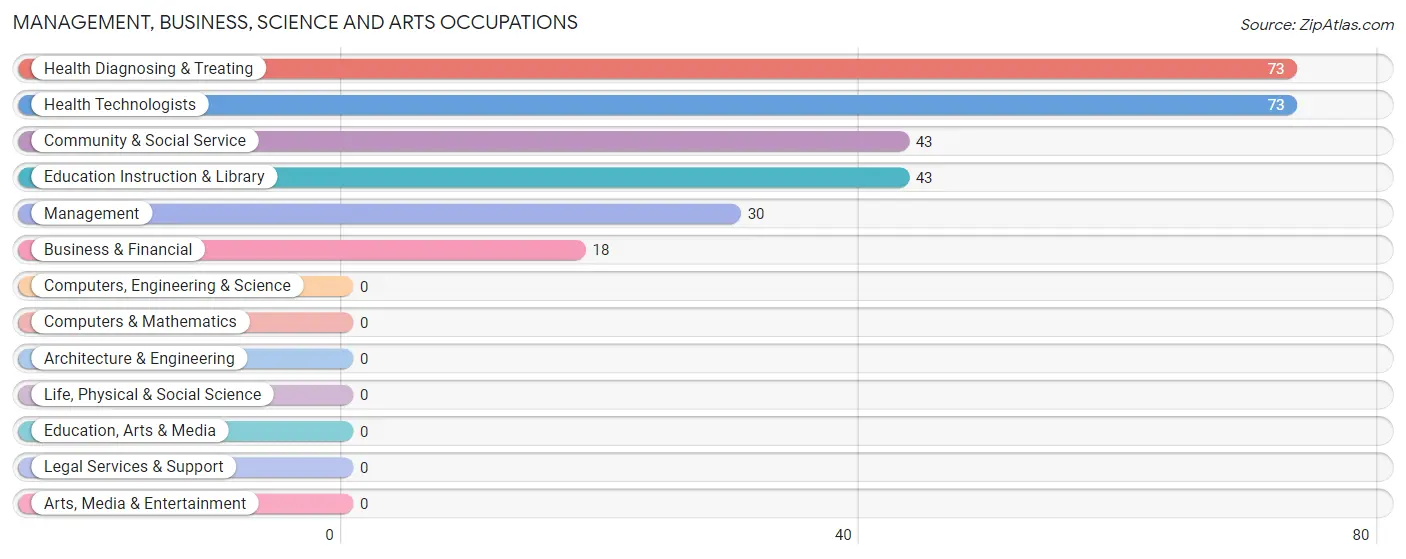
Management, Business, Science and Arts Occupations
The most common Management, Business, Science and Arts occupations in New Hope are Health Diagnosing & Treating (73 | 12.3%), Health Technologists (73 | 12.3%), Community & Social Service (43 | 7.3%), Education Instruction & Library (43 | 7.3%), and Management (30 | 5.1%).
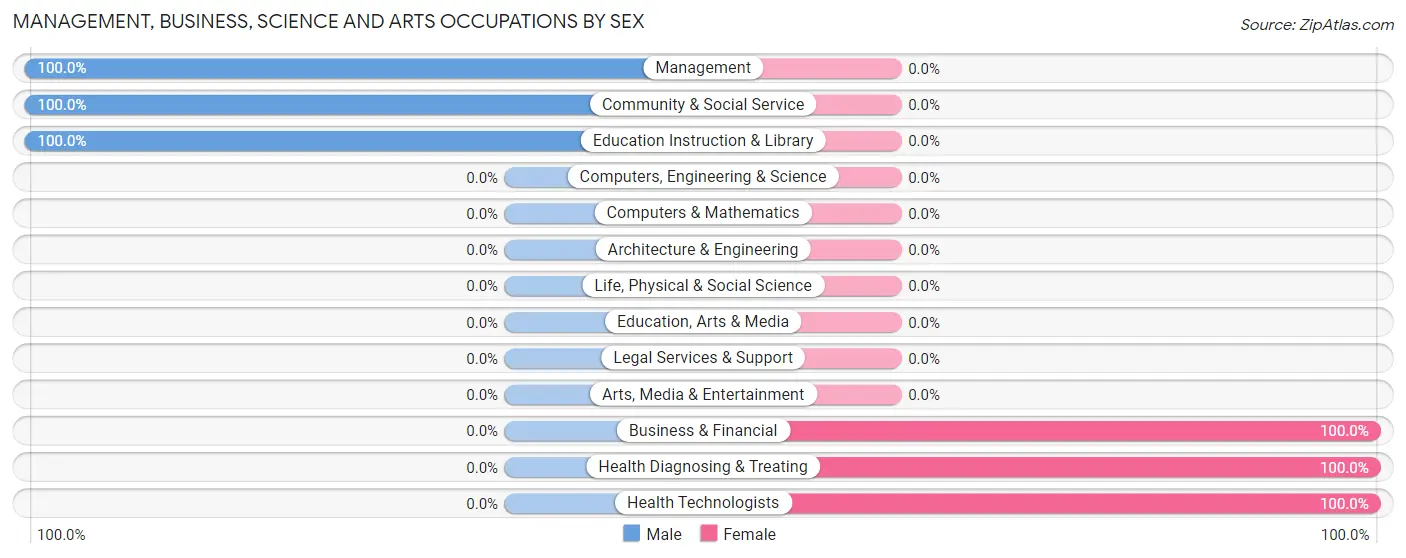
Management, Business, Science and Arts Occupations by Sex
Within the Management, Business, Science and Arts occupations in New Hope, the most male-oriented occupations are Management (100.0%), Community & Social Service (100.0%), and Education Instruction & Library (100.0%), while the most female-oriented occupations are Business & Financial (100.0%), Health Diagnosing & Treating (100.0%), and Health Technologists (100.0%).
| Occupation | Male | Female |
| Management | 30 (100.0%) | 0 (0.0%) |
| Business & Financial | 0 (0.0%) | 18 (100.0%) |
| Computers, Engineering & Science | 0 (0.0%) | 0 (0.0%) |
| Computers & Mathematics | 0 (0.0%) | 0 (0.0%) |
| Architecture & Engineering | 0 (0.0%) | 0 (0.0%) |
| Life, Physical & Social Science | 0 (0.0%) | 0 (0.0%) |
| Community & Social Service | 43 (100.0%) | 0 (0.0%) |
| Education, Arts & Media | 0 (0.0%) | 0 (0.0%) |
| Legal Services & Support | 0 (0.0%) | 0 (0.0%) |
| Education Instruction & Library | 43 (100.0%) | 0 (0.0%) |
| Arts, Media & Entertainment | 0 (0.0%) | 0 (0.0%) |
| Health Diagnosing & Treating | 0 (0.0%) | 73 (100.0%) |
| Health Technologists | 0 (0.0%) | 73 (100.0%) |
| Total (Category) | 73 (44.5%) | 91 (55.5%) |
| Total (Overall) | 325 (54.9%) | 267 (45.1%) |
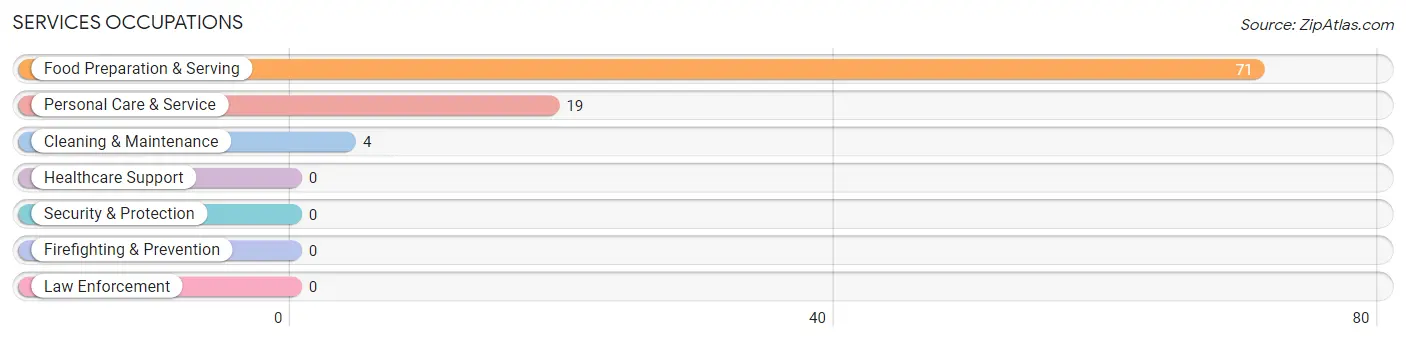
Services Occupations
The most common Services occupations in New Hope are Food Preparation & Serving (71 | 12.0%), Personal Care & Service (19 | 3.2%), and Cleaning & Maintenance (4 | 0.7%).
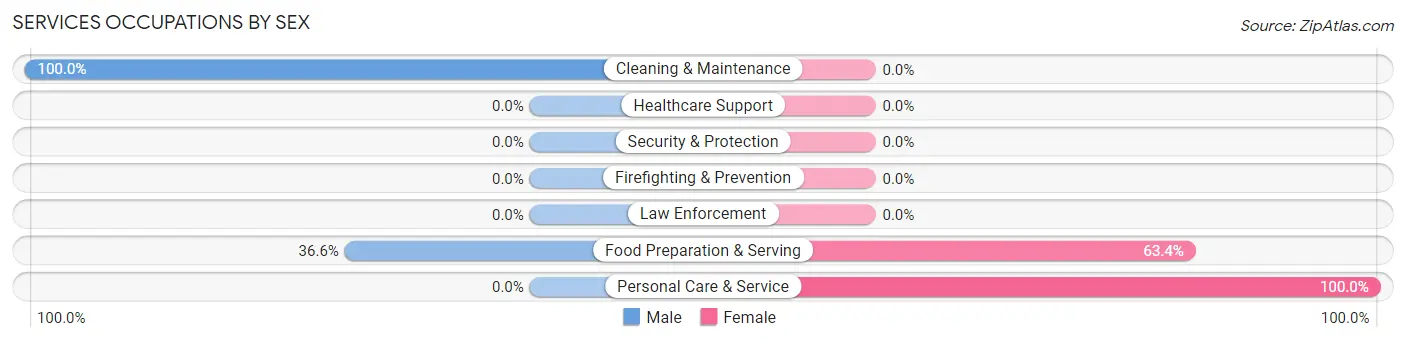
Services Occupations by Sex
Within the Services occupations in New Hope, the most male-oriented occupations are Cleaning & Maintenance (100.0%), and Food Preparation & Serving (36.6%), while the most female-oriented occupations are Personal Care & Service (100.0%), and Food Preparation & Serving (63.4%).
| Occupation | Male | Female |
| Healthcare Support | 0 (0.0%) | 0 (0.0%) |
| Security & Protection | 0 (0.0%) | 0 (0.0%) |
| Firefighting & Prevention | 0 (0.0%) | 0 (0.0%) |
| Law Enforcement | 0 (0.0%) | 0 (0.0%) |
| Food Preparation & Serving | 26 (36.6%) | 45 (63.4%) |
| Cleaning & Maintenance | 4 (100.0%) | 0 (0.0%) |
| Personal Care & Service | 0 (0.0%) | 19 (100.0%) |
| Total (Category) | 30 (31.9%) | 64 (68.1%) |
| Total (Overall) | 325 (54.9%) | 267 (45.1%) |
Sales and Office Occupations
The most common Sales and Office occupations in New Hope are Office & Administration (87 | 14.7%), and Sales & Related (67 | 11.3%).
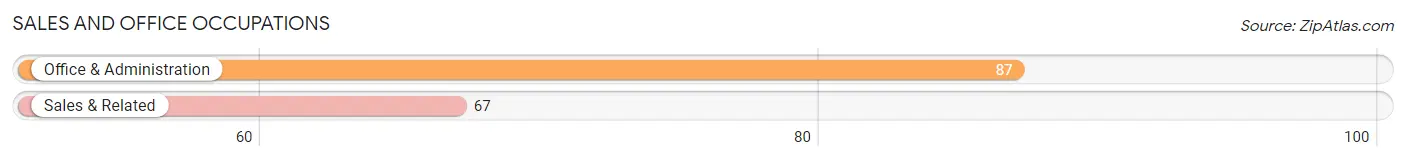
Sales and Office Occupations by Sex
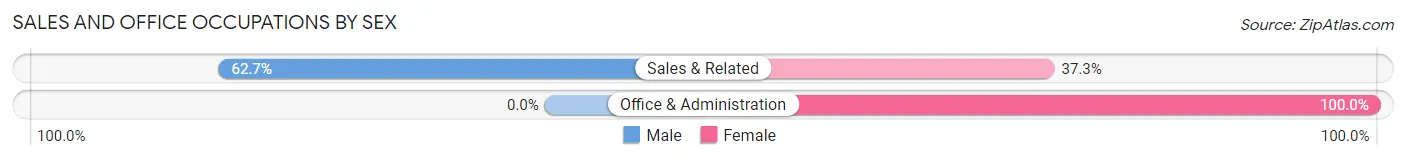
| Occupation | Male | Female |
| Sales & Related | 42 (62.7%) | 25 (37.3%) |
| Office & Administration | 0 (0.0%) | 87 (100.0%) |
| Total (Category) | 42 (27.3%) | 112 (72.7%) |
| Total (Overall) | 325 (54.9%) | 267 (45.1%) |
Natural Resources, Construction and Maintenance Occupations
The most common Natural Resources, Construction and Maintenance occupations in New Hope are , and Installation, Maintenance & Repair (36 | 6.1%).
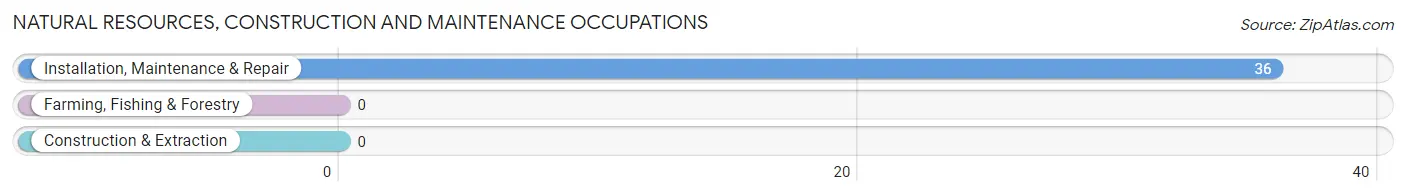
Natural Resources, Construction and Maintenance Occupations by Sex
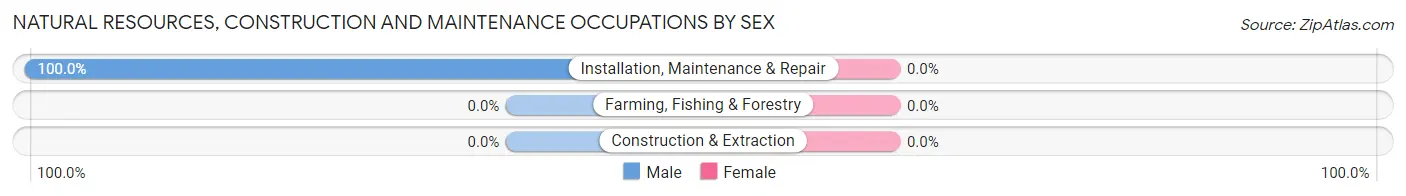
| Occupation | Male | Female |
| Farming, Fishing & Forestry | 0 (0.0%) | 0 (0.0%) |
| Construction & Extraction | 0 (0.0%) | 0 (0.0%) |
| Installation, Maintenance & Repair | 36 (100.0%) | 0 (0.0%) |
| Total (Category) | 36 (100.0%) | 0 (0.0%) |
| Total (Overall) | 325 (54.9%) | 267 (45.1%) |
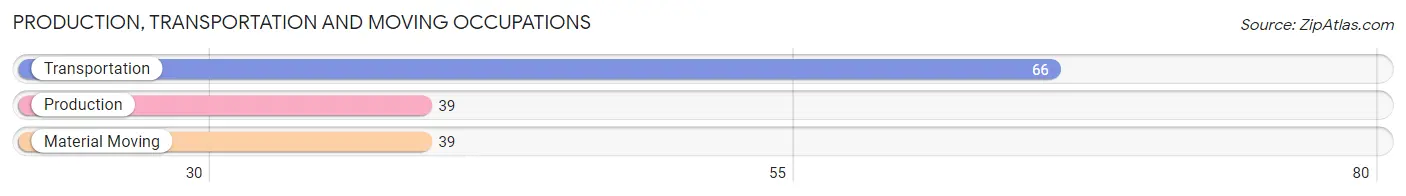
Production, Transportation and Moving Occupations
The most common Production, Transportation and Moving occupations in New Hope are Transportation (66 | 11.2%), Production (39 | 6.6%), and Material Moving (39 | 6.6%).
Production, Transportation and Moving Occupations by Sex
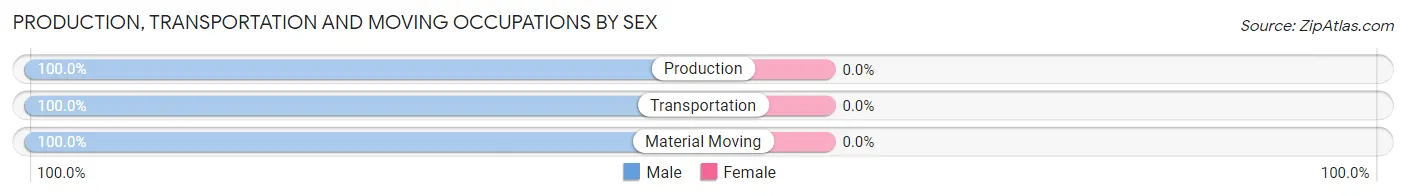
| Occupation | Male | Female |
| Production | 39 (100.0%) | 0 (0.0%) |
| Transportation | 66 (100.0%) | 0 (0.0%) |
| Material Moving | 39 (100.0%) | 0 (0.0%) |
| Total (Category) | 144 (100.0%) | 0 (0.0%) |
| Total (Overall) | 325 (54.9%) | 267 (45.1%) |
Employment Industries by Sex in New Hope
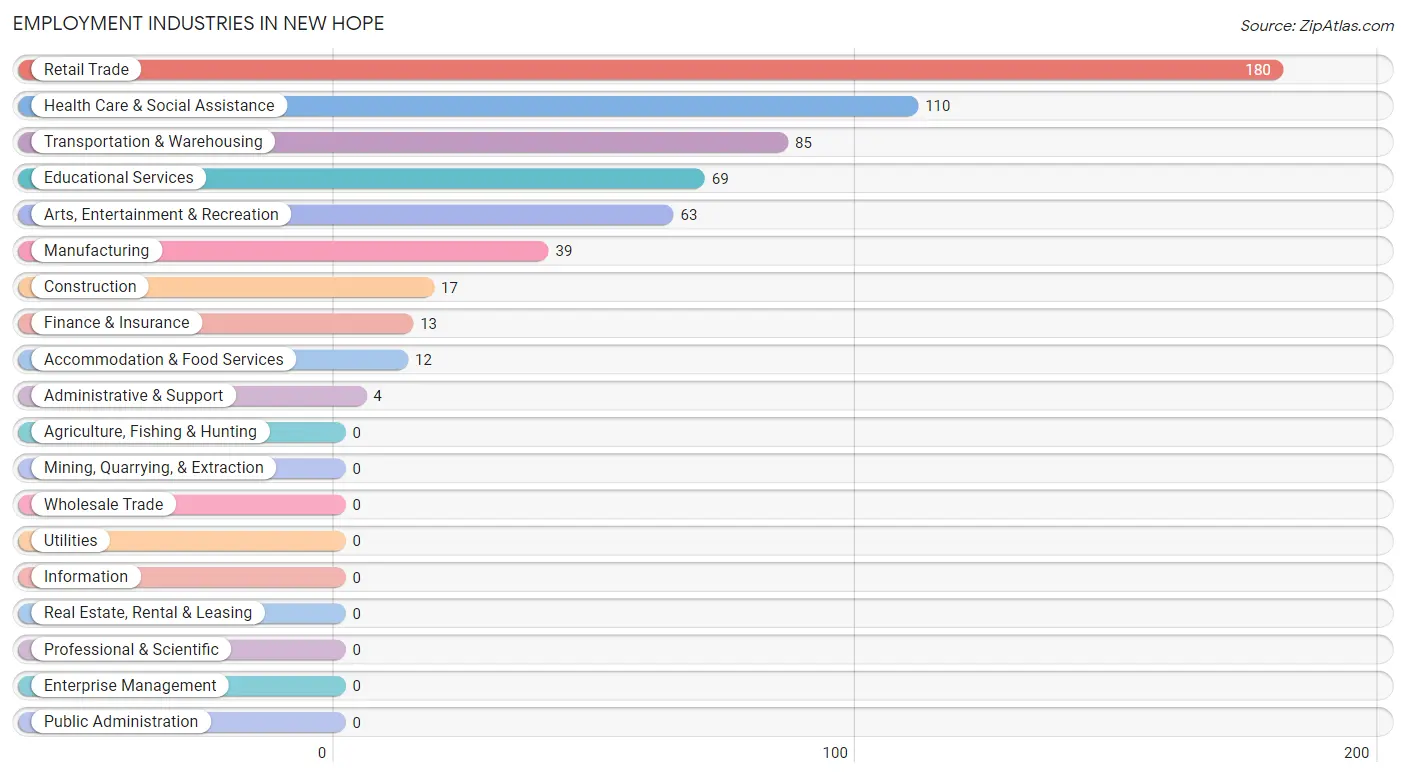
Employment Industries in New Hope
The major employment industries in New Hope include Retail Trade (180 | 30.4%), Health Care & Social Assistance (110 | 18.6%), Transportation & Warehousing (85 | 14.4%), Educational Services (69 | 11.7%), and Arts, Entertainment & Recreation (63 | 10.6%).
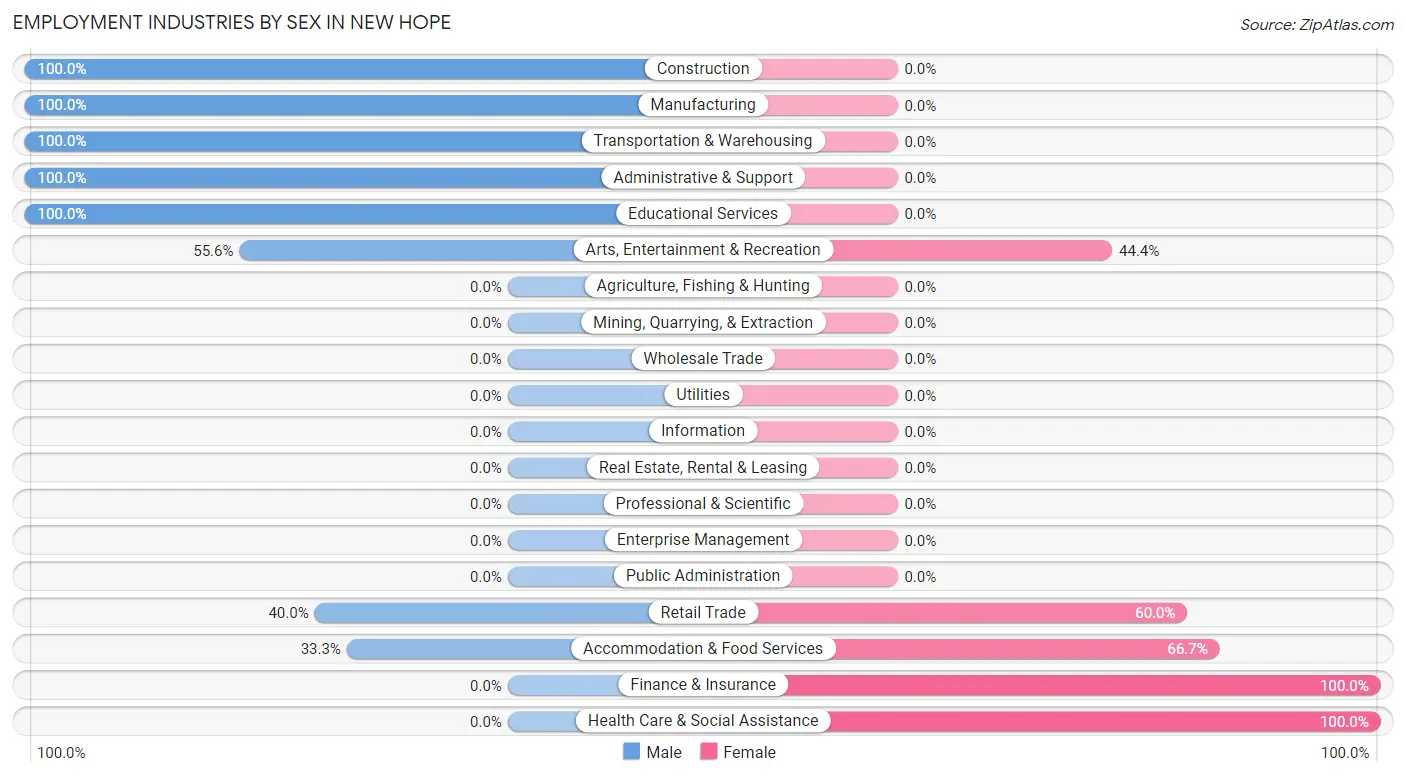
Employment Industries by Sex in New Hope
The New Hope industries that see more men than women are Construction (100.0%), Manufacturing (100.0%), and Transportation & Warehousing (100.0%), whereas the industries that tend to have a higher number of women are Finance & Insurance (100.0%), Health Care & Social Assistance (100.0%), and Accommodation & Food Services (66.7%).
| Industry | Male | Female |
| Agriculture, Fishing & Hunting | 0 (0.0%) | 0 (0.0%) |
| Mining, Quarrying, & Extraction | 0 (0.0%) | 0 (0.0%) |
| Construction | 17 (100.0%) | 0 (0.0%) |
| Manufacturing | 39 (100.0%) | 0 (0.0%) |
| Wholesale Trade | 0 (0.0%) | 0 (0.0%) |
| Retail Trade | 72 (40.0%) | 108 (60.0%) |
| Transportation & Warehousing | 85 (100.0%) | 0 (0.0%) |
| Utilities | 0 (0.0%) | 0 (0.0%) |
| Information | 0 (0.0%) | 0 (0.0%) |
| Finance & Insurance | 0 (0.0%) | 13 (100.0%) |
| Real Estate, Rental & Leasing | 0 (0.0%) | 0 (0.0%) |
| Professional & Scientific | 0 (0.0%) | 0 (0.0%) |
| Enterprise Management | 0 (0.0%) | 0 (0.0%) |
| Administrative & Support | 4 (100.0%) | 0 (0.0%) |
| Educational Services | 69 (100.0%) | 0 (0.0%) |
| Health Care & Social Assistance | 0 (0.0%) | 110 (100.0%) |
| Arts, Entertainment & Recreation | 35 (55.6%) | 28 (44.4%) |
| Accommodation & Food Services | 4 (33.3%) | 8 (66.7%) |
| Public Administration | 0 (0.0%) | 0 (0.0%) |
| Total | 325 (54.9%) | 267 (45.1%) |
Education in New Hope
School Enrollment in New Hope
The most common levels of schooling among the 174 students in New Hope are elementary school (99 | 56.9%), graduate / professional (43 | 24.7%), and college / undergraduate (21 | 12.1%).
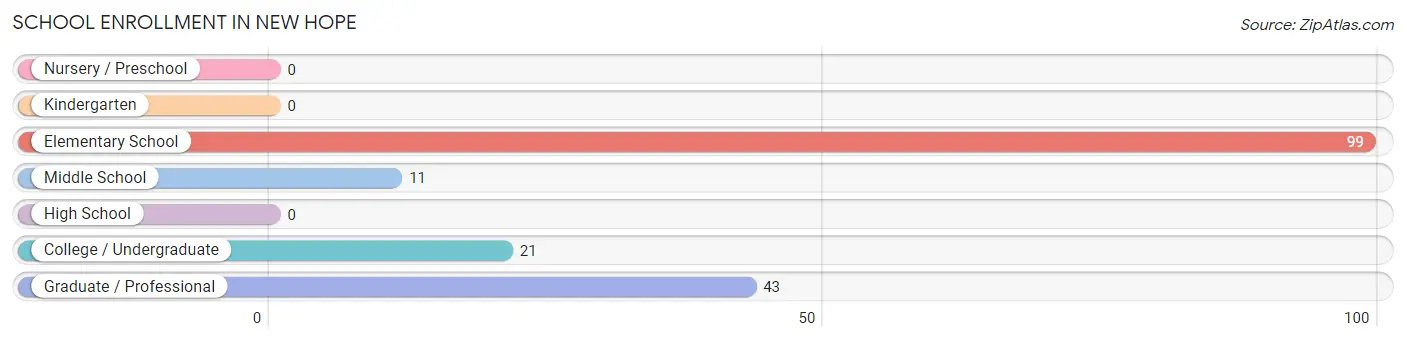
| School Level | # Students | % Students |
| Nursery / Preschool | 0 | 0.0% |
| Kindergarten | 0 | 0.0% |
| Elementary School | 99 | 56.9% |
| Middle School | 11 | 6.3% |
| High School | 0 | 0.0% |
| College / Undergraduate | 21 | 12.1% |
| Graduate / Professional | 43 | 24.7% |
| Total | 174 | 100.0% |
School Enrollment by Age by Funding Source in New Hope
Out of a total of 174 students who are enrolled in schools in New Hope, 77 (44.3%) attend a private institution, while the remaining 97 (55.7%) are enrolled in public schools. The age group of 5 to 9 year old has the highest likelihood of being enrolled in private schools, with 39 (79.6% in the age bracket) enrolled. Conversely, the age group of 18 to 19 year olds has the lowest likelihood of being enrolled in a private school, with 21 (100.0% in the age bracket) attending a public institution.
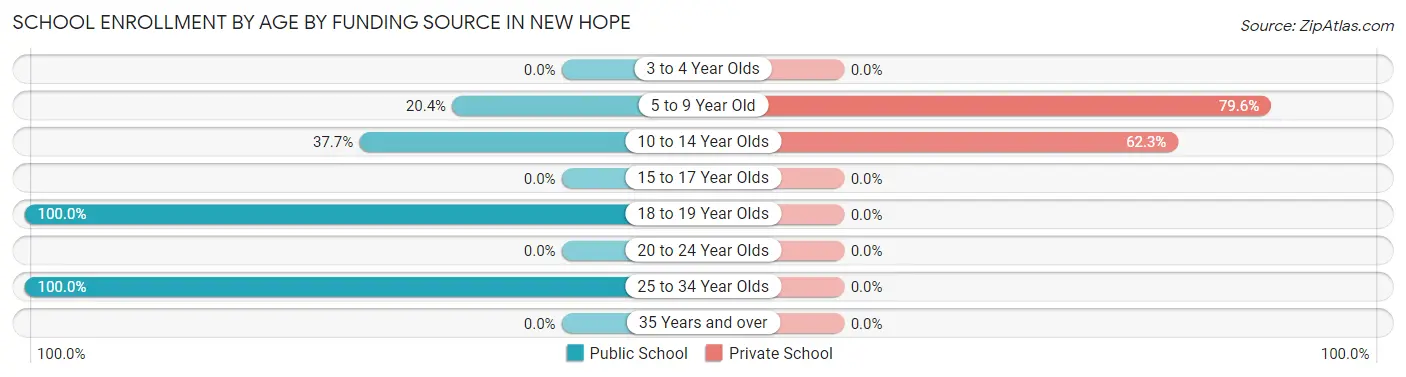
| Age Bracket | Public School | Private School |
| 3 to 4 Year Olds | 0 (0.0%) | 0 (0.0%) |
| 5 to 9 Year Old | 10 (20.4%) | 39 (79.6%) |
| 10 to 14 Year Olds | 23 (37.7%) | 38 (62.3%) |
| 15 to 17 Year Olds | 0 (0.0%) | 0 (0.0%) |
| 18 to 19 Year Olds | 21 (100.0%) | 0 (0.0%) |
| 20 to 24 Year Olds | 0 (0.0%) | 0 (0.0%) |
| 25 to 34 Year Olds | 43 (100.0%) | 0 (0.0%) |
| 35 Years and over | 0 (0.0%) | 0 (0.0%) |
| Total | 97 (55.7%) | 77 (44.3%) |
Educational Attainment by Field of Study in New Hope
Social sciences (73 | 29.2%), psychology (71 | 28.4%), communications (43 | 17.2%), visual & performing arts (27 | 10.8%), and physical & health sciences (18 | 7.2%) are the most common fields of study among 250 individuals in New Hope who have obtained a bachelor's degree or higher.
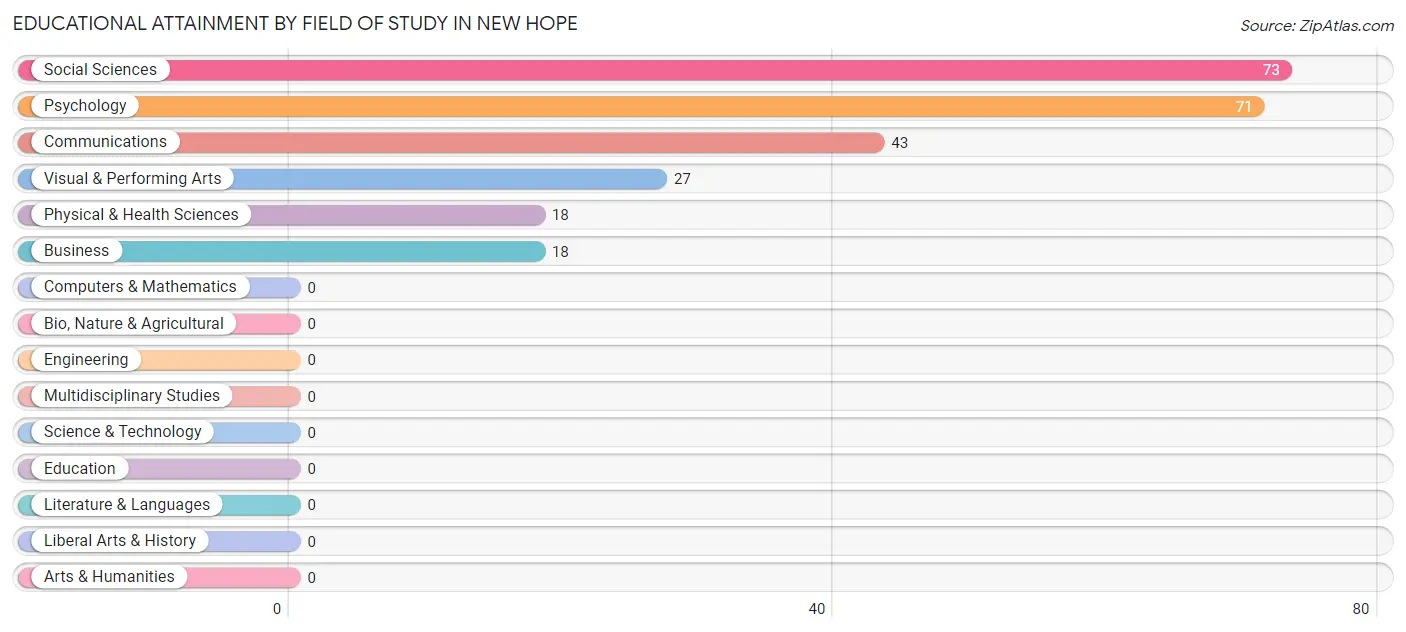
| Field of Study | # Graduates | % Graduates |
| Computers & Mathematics | 0 | 0.0% |
| Bio, Nature & Agricultural | 0 | 0.0% |
| Physical & Health Sciences | 18 | 7.2% |
| Psychology | 71 | 28.4% |
| Social Sciences | 73 | 29.2% |
| Engineering | 0 | 0.0% |
| Multidisciplinary Studies | 0 | 0.0% |
| Science & Technology | 0 | 0.0% |
| Business | 18 | 7.2% |
| Education | 0 | 0.0% |
| Literature & Languages | 0 | 0.0% |
| Liberal Arts & History | 0 | 0.0% |
| Visual & Performing Arts | 27 | 10.8% |
| Communications | 43 | 17.2% |
| Arts & Humanities | 0 | 0.0% |
| Total | 250 | 100.0% |
Transportation & Commute in New Hope
Vehicle Availability by Sex in New Hope
The most prevalent vehicle ownership categories in New Hope are males with 5 or more vehicles (108, accounting for 33.2%) and females with 5 or more vehicles (88, making up 40.5%).
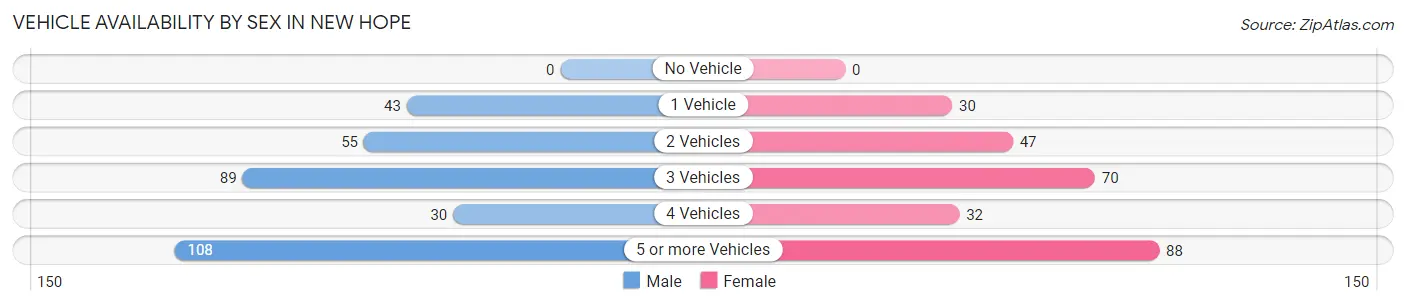
| Vehicles Available | Male | Female |
| No Vehicle | 0 (0.0%) | 0 (0.0%) |
| 1 Vehicle | 43 (13.2%) | 30 (11.2%) |
| 2 Vehicles | 55 (16.9%) | 47 (17.6%) |
| 3 Vehicles | 89 (27.4%) | 70 (26.2%) |
| 4 Vehicles | 30 (9.2%) | 32 (12.0%) |
| 5 or more Vehicles | 108 (33.2%) | 88 (33.0%) |
| Total | 325 (100.0%) | 267 (100.0%) |
Commute Time in New Hope
The most frequently occuring commute durations in New Hope are 20 to 24 minutes (162 commuters, 29.4%), 15 to 19 minutes (100 commuters, 18.1%), and 25 to 29 minutes (92 commuters, 16.7%).
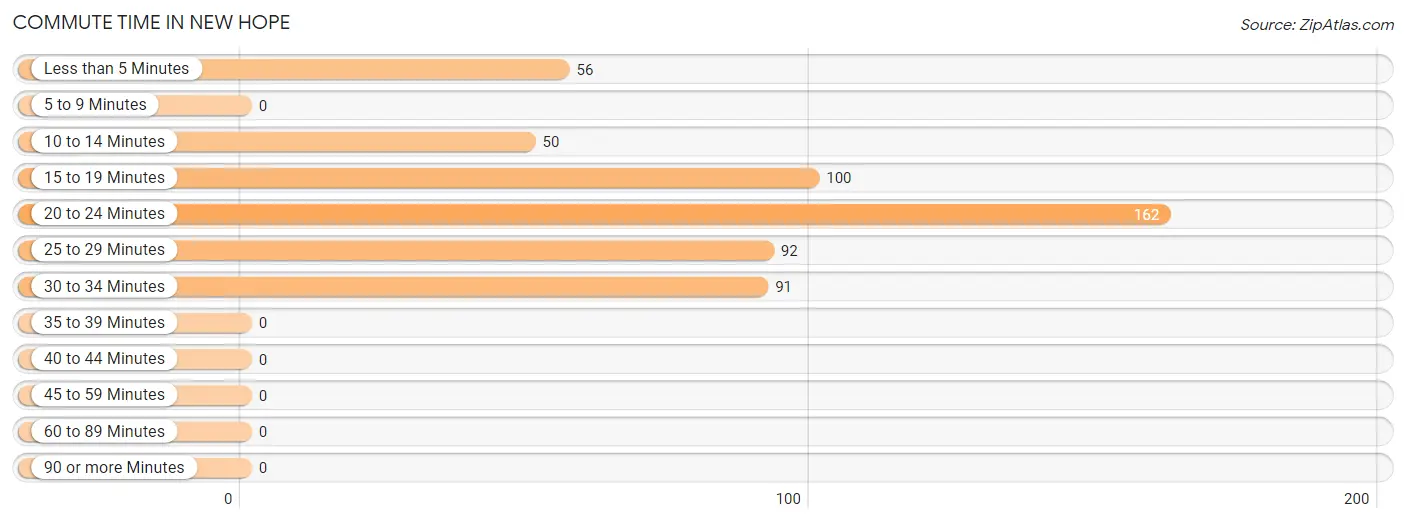
| Commute Time | # Commuters | % Commuters |
| Less than 5 Minutes | 56 | 10.2% |
| 5 to 9 Minutes | 0 | 0.0% |
| 10 to 14 Minutes | 50 | 9.1% |
| 15 to 19 Minutes | 100 | 18.1% |
| 20 to 24 Minutes | 162 | 29.4% |
| 25 to 29 Minutes | 92 | 16.7% |
| 30 to 34 Minutes | 91 | 16.5% |
| 35 to 39 Minutes | 0 | 0.0% |
| 40 to 44 Minutes | 0 | 0.0% |
| 45 to 59 Minutes | 0 | 0.0% |
| 60 to 89 Minutes | 0 | 0.0% |
| 90 or more Minutes | 0 | 0.0% |
Commute Time by Sex in New Hope
The most common commute times in New Hope are 25 to 29 minutes (92 commuters, 28.7%) for males and 15 to 19 minutes (88 commuters, 38.3%) for females.
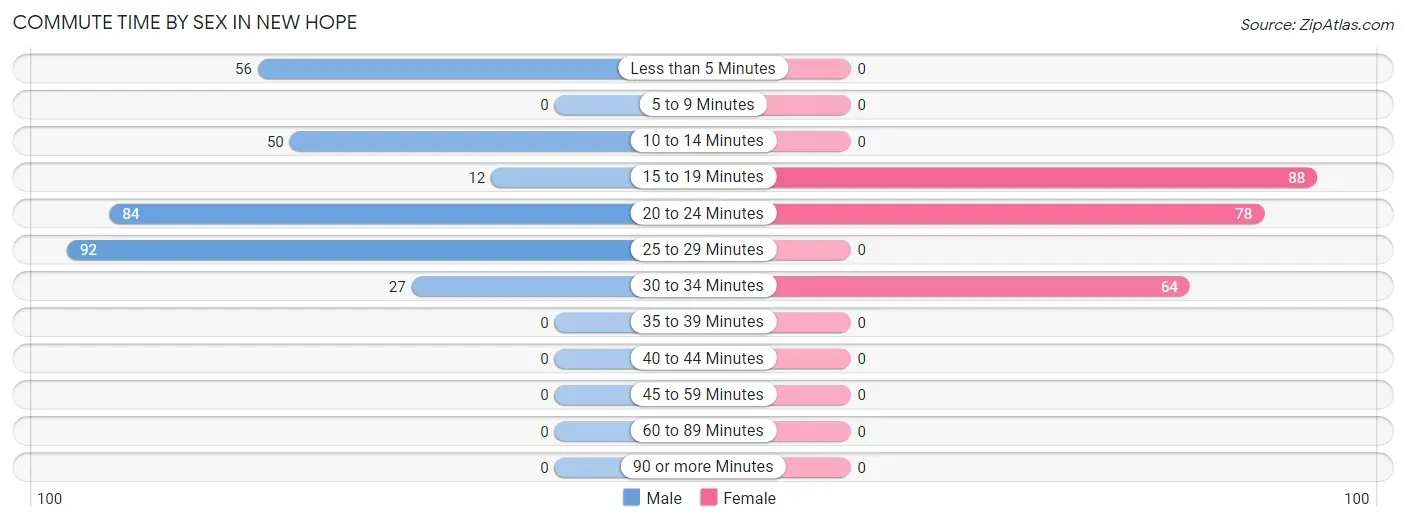
| Commute Time | Male | Female |
| Less than 5 Minutes | 56 (17.4%) | 0 (0.0%) |
| 5 to 9 Minutes | 0 (0.0%) | 0 (0.0%) |
| 10 to 14 Minutes | 50 (15.6%) | 0 (0.0%) |
| 15 to 19 Minutes | 12 (3.7%) | 88 (38.3%) |
| 20 to 24 Minutes | 84 (26.2%) | 78 (33.9%) |
| 25 to 29 Minutes | 92 (28.7%) | 0 (0.0%) |
| 30 to 34 Minutes | 27 (8.4%) | 64 (27.8%) |
| 35 to 39 Minutes | 0 (0.0%) | 0 (0.0%) |
| 40 to 44 Minutes | 0 (0.0%) | 0 (0.0%) |
| 45 to 59 Minutes | 0 (0.0%) | 0 (0.0%) |
| 60 to 89 Minutes | 0 (0.0%) | 0 (0.0%) |
| 90 or more Minutes | 0 (0.0%) | 0 (0.0%) |
Time of Departure to Work by Sex in New Hope
The most frequent times of departure to work in New Hope are 7:30 AM to 7:59 AM (82, 25.6%) for males and 8:00 AM to 8:29 AM (79, 34.4%) for females.
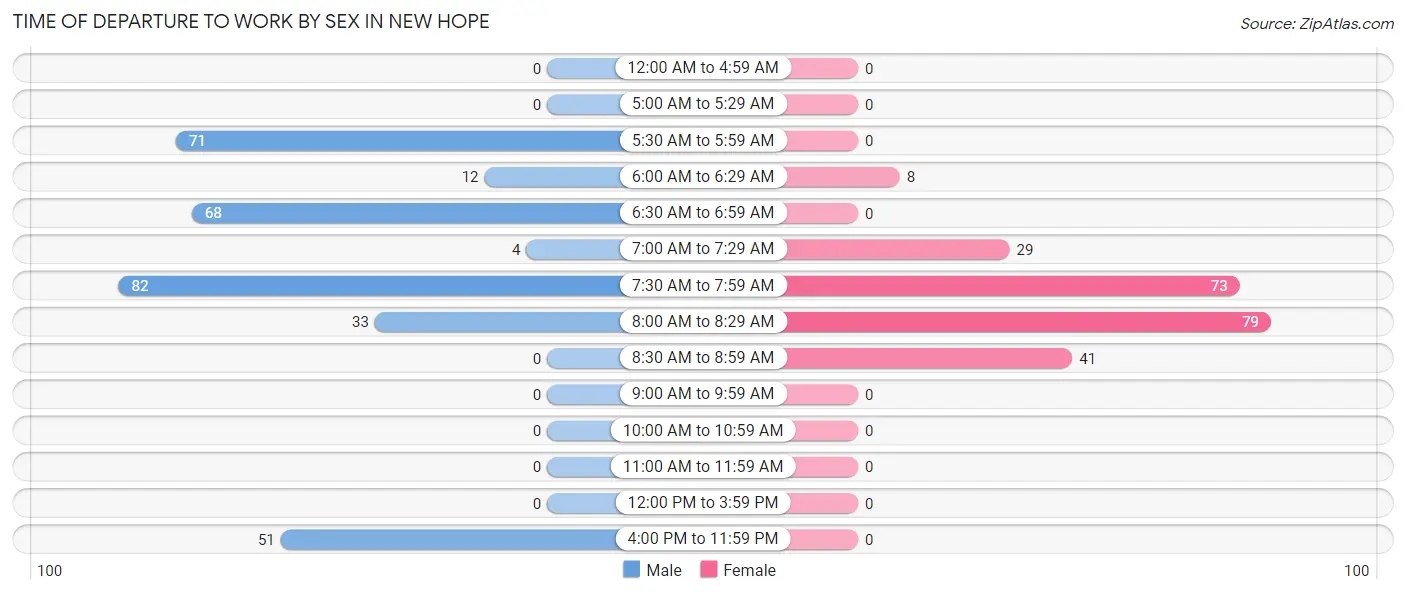
| Time of Departure | Male | Female |
| 12:00 AM to 4:59 AM | 0 (0.0%) | 0 (0.0%) |
| 5:00 AM to 5:29 AM | 0 (0.0%) | 0 (0.0%) |
| 5:30 AM to 5:59 AM | 71 (22.1%) | 0 (0.0%) |
| 6:00 AM to 6:29 AM | 12 (3.7%) | 8 (3.5%) |
| 6:30 AM to 6:59 AM | 68 (21.2%) | 0 (0.0%) |
| 7:00 AM to 7:29 AM | 4 (1.3%) | 29 (12.6%) |
| 7:30 AM to 7:59 AM | 82 (25.6%) | 73 (31.7%) |
| 8:00 AM to 8:29 AM | 33 (10.3%) | 79 (34.4%) |
| 8:30 AM to 8:59 AM | 0 (0.0%) | 41 (17.8%) |
| 9:00 AM to 9:59 AM | 0 (0.0%) | 0 (0.0%) |
| 10:00 AM to 10:59 AM | 0 (0.0%) | 0 (0.0%) |
| 11:00 AM to 11:59 AM | 0 (0.0%) | 0 (0.0%) |
| 12:00 PM to 3:59 PM | 0 (0.0%) | 0 (0.0%) |
| 4:00 PM to 11:59 PM | 51 (15.9%) | 0 (0.0%) |
| Total | 321 (100.0%) | 230 (100.0%) |
Housing Occupancy in New Hope
Occupancy by Ownership in New Hope
Of the total 393 dwellings in New Hope, owner-occupied units account for 364 (92.6%), while renter-occupied units make up 29 (7.4%).
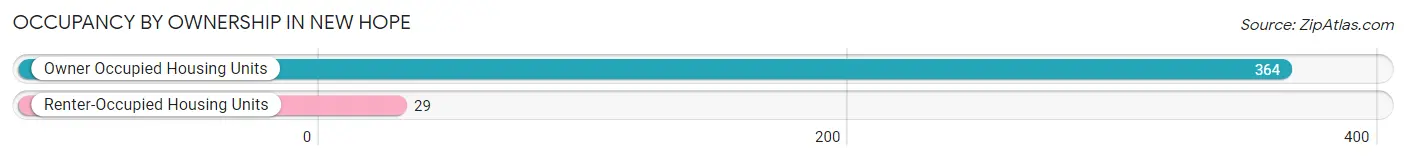
| Occupancy | # Housing Units | % Housing Units |
| Owner Occupied Housing Units | 364 | 92.6% |
| Renter-Occupied Housing Units | 29 | 7.4% |
| Total Occupied Housing Units | 393 | 100.0% |
Occupancy by Household Size in New Hope
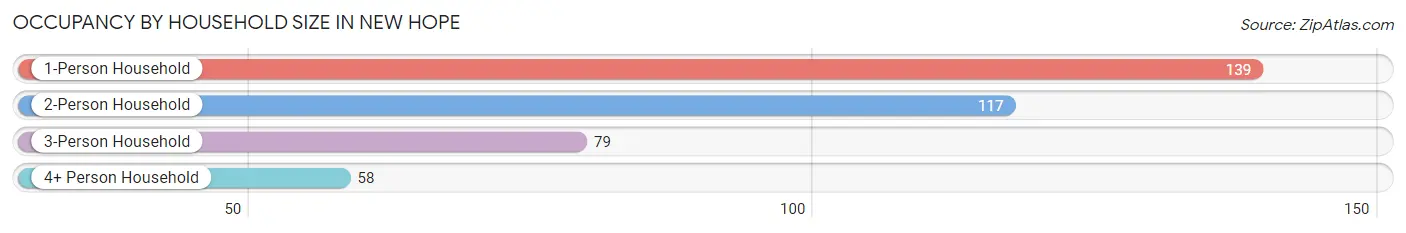
| Household Size | # Housing Units | % Housing Units |
| 1-Person Household | 139 | 35.4% |
| 2-Person Household | 117 | 29.8% |
| 3-Person Household | 79 | 20.1% |
| 4+ Person Household | 58 | 14.8% |
| Total Housing Units | 393 | 100.0% |
Occupancy by Ownership by Household Size in New Hope
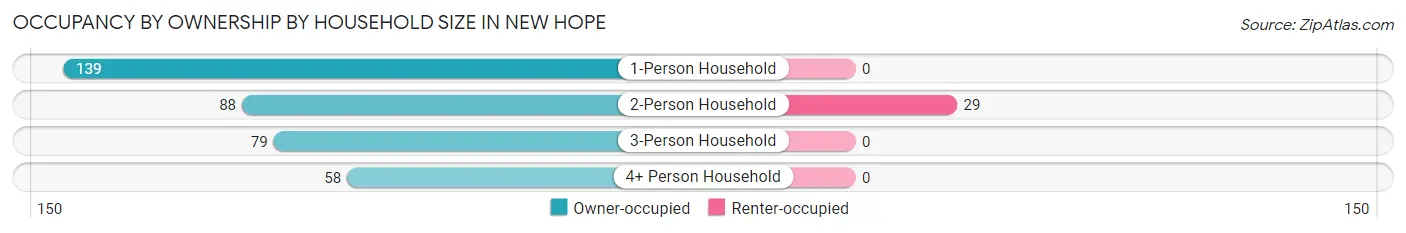
| Household Size | Owner-occupied | Renter-occupied |
| 1-Person Household | 139 (100.0%) | 0 (0.0%) |
| 2-Person Household | 88 (75.2%) | 29 (24.8%) |
| 3-Person Household | 79 (100.0%) | 0 (0.0%) |
| 4+ Person Household | 58 (100.0%) | 0 (0.0%) |
| Total Housing Units | 364 (92.6%) | 29 (7.4%) |
Occupancy by Educational Attainment in New Hope
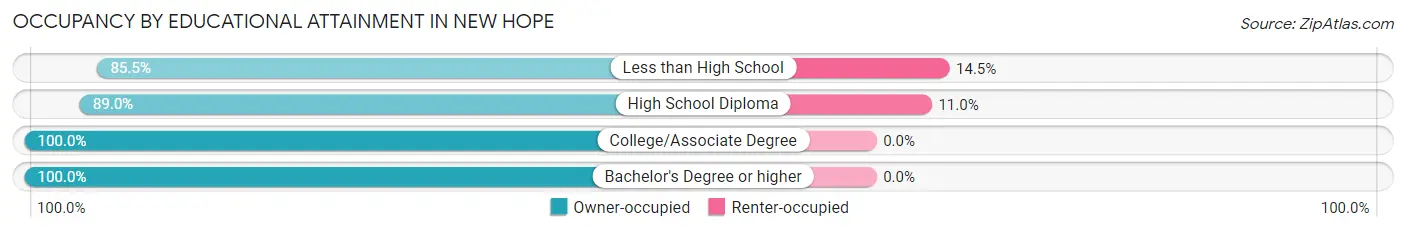
| Household Size | Owner-occupied | Renter-occupied |
| Less than High School | 71 (85.5%) | 12 (14.5%) |
| High School Diploma | 138 (89.0%) | 17 (11.0%) |
| College/Associate Degree | 64 (100.0%) | 0 (0.0%) |
| Bachelor's Degree or higher | 91 (100.0%) | 0 (0.0%) |
Occupancy by Age of Householder in New Hope
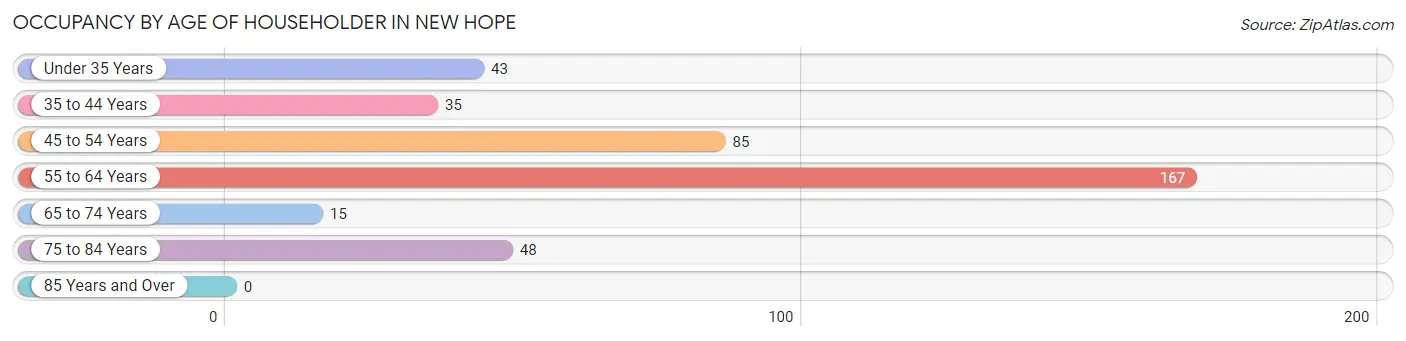
| Age Bracket | # Households | % Households |
| Under 35 Years | 43 | 10.9% |
| 35 to 44 Years | 35 | 8.9% |
| 45 to 54 Years | 85 | 21.6% |
| 55 to 64 Years | 167 | 42.5% |
| 65 to 74 Years | 15 | 3.8% |
| 75 to 84 Years | 48 | 12.2% |
| 85 Years and Over | 0 | 0.0% |
| Total | 393 | 100.0% |
Housing Finances in New Hope
Median Income by Occupancy in New Hope
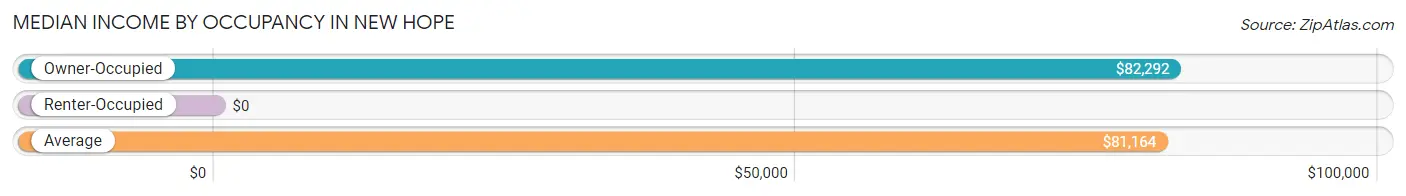
| Occupancy Type | # Households | Median Income |
| Owner-Occupied | 364 (92.6%) | $82,292 |
| Renter-Occupied | 29 (7.4%) | $0 |
| Average | 393 (100.0%) | $81,164 |
Occupancy by Householder Income Bracket in New Hope
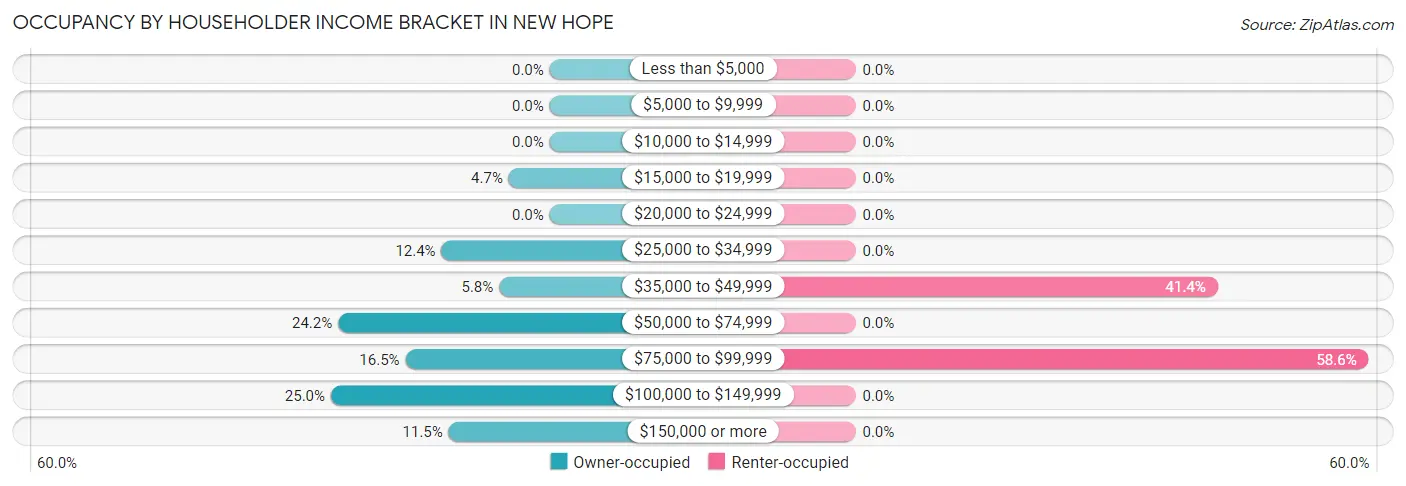
| Income Bracket | Owner-occupied | Renter-occupied |
| Less than $5,000 | 0 (0.0%) | 0 (0.0%) |
| $5,000 to $9,999 | 0 (0.0%) | 0 (0.0%) |
| $10,000 to $14,999 | 0 (0.0%) | 0 (0.0%) |
| $15,000 to $19,999 | 17 (4.7%) | 0 (0.0%) |
| $20,000 to $24,999 | 0 (0.0%) | 0 (0.0%) |
| $25,000 to $34,999 | 45 (12.4%) | 0 (0.0%) |
| $35,000 to $49,999 | 21 (5.8%) | 12 (41.4%) |
| $50,000 to $74,999 | 88 (24.2%) | 0 (0.0%) |
| $75,000 to $99,999 | 60 (16.5%) | 17 (58.6%) |
| $100,000 to $149,999 | 91 (25.0%) | 0 (0.0%) |
| $150,000 or more | 42 (11.5%) | 0 (0.0%) |
| Total | 364 (100.0%) | 29 (100.0%) |
Monthly Housing Cost Tiers in New Hope
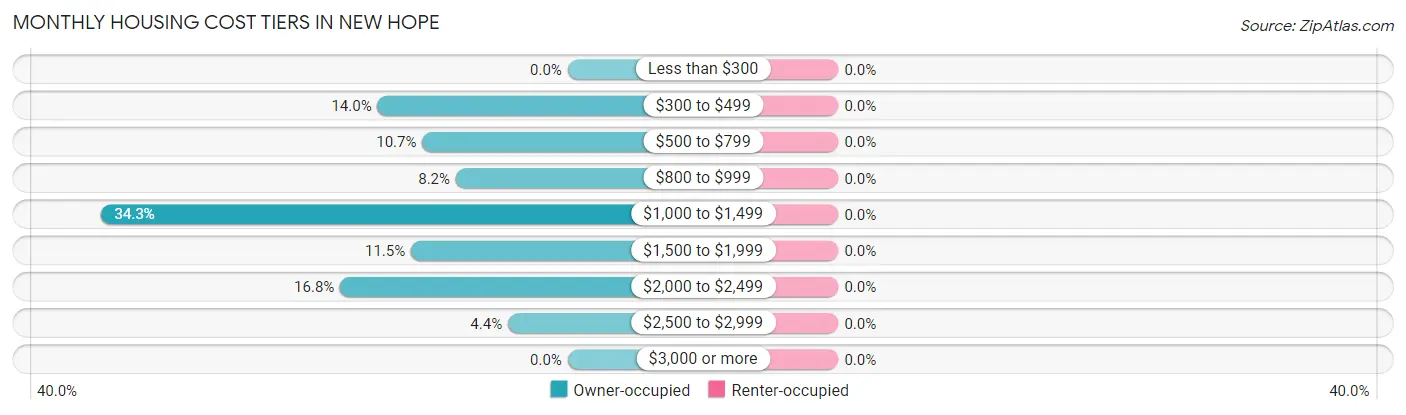
| Monthly Cost | Owner-occupied | Renter-occupied |
| Less than $300 | 0 (0.0%) | 0 (0.0%) |
| $300 to $499 | 51 (14.0%) | 0 (0.0%) |
| $500 to $799 | 39 (10.7%) | 0 (0.0%) |
| $800 to $999 | 30 (8.2%) | 0 (0.0%) |
| $1,000 to $1,499 | 125 (34.3%) | 0 (0.0%) |
| $1,500 to $1,999 | 42 (11.5%) | 0 (0.0%) |
| $2,000 to $2,499 | 61 (16.8%) | 0 (0.0%) |
| $2,500 to $2,999 | 16 (4.4%) | 0 (0.0%) |
| $3,000 or more | 0 (0.0%) | 0 (0.0%) |
| Total | 364 (100.0%) | 29 (100.0%) |
Physical Housing Characteristics in New Hope
Housing Structures in New Hope
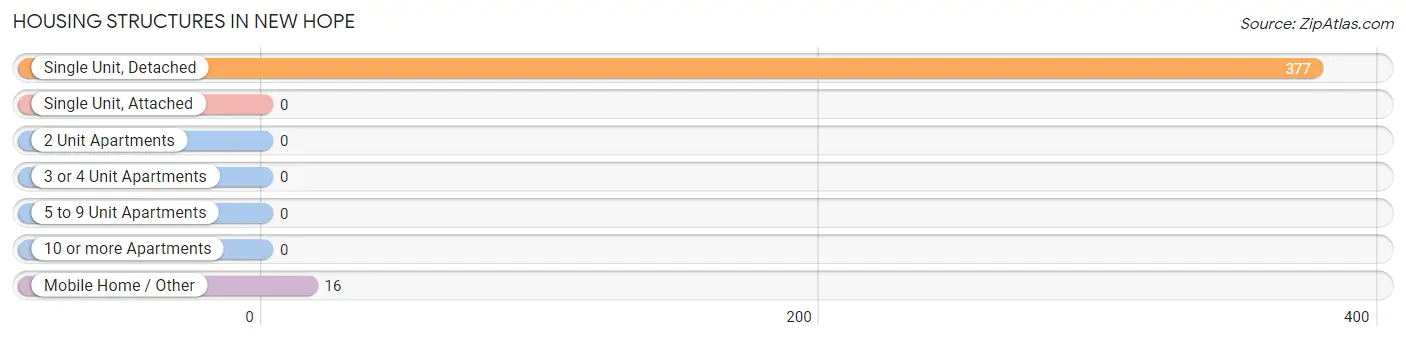
| Structure Type | # Housing Units | % Housing Units |
| Single Unit, Detached | 377 | 95.9% |
| Single Unit, Attached | 0 | 0.0% |
| 2 Unit Apartments | 0 | 0.0% |
| 3 or 4 Unit Apartments | 0 | 0.0% |
| 5 to 9 Unit Apartments | 0 | 0.0% |
| 10 or more Apartments | 0 | 0.0% |
| Mobile Home / Other | 16 | 4.1% |
| Total | 393 | 100.0% |
Housing Structures by Occupancy in New Hope
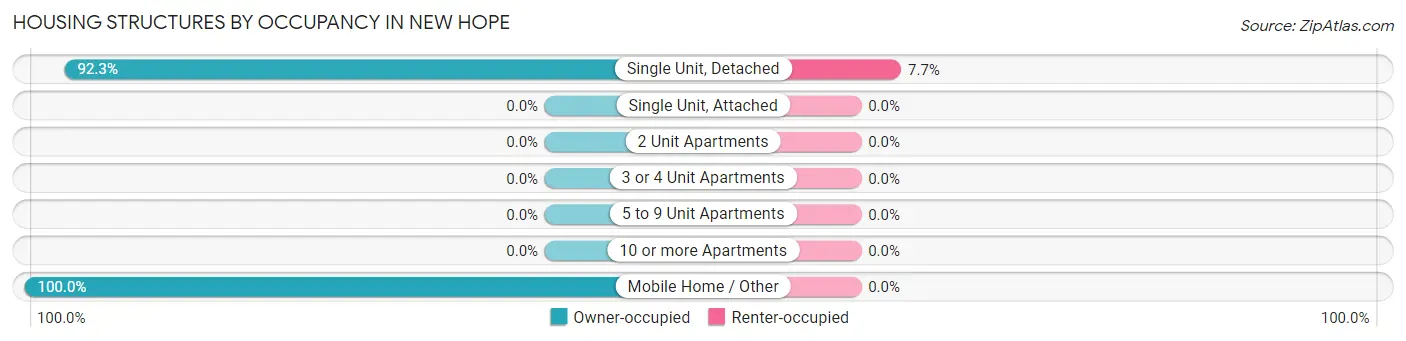
| Structure Type | Owner-occupied | Renter-occupied |
| Single Unit, Detached | 348 (92.3%) | 29 (7.7%) |
| Single Unit, Attached | 0 (0.0%) | 0 (0.0%) |
| 2 Unit Apartments | 0 (0.0%) | 0 (0.0%) |
| 3 or 4 Unit Apartments | 0 (0.0%) | 0 (0.0%) |
| 5 to 9 Unit Apartments | 0 (0.0%) | 0 (0.0%) |
| 10 or more Apartments | 0 (0.0%) | 0 (0.0%) |
| Mobile Home / Other | 16 (100.0%) | 0 (0.0%) |
| Total | 364 (92.6%) | 29 (7.4%) |
Housing Structures by Number of Rooms in New Hope
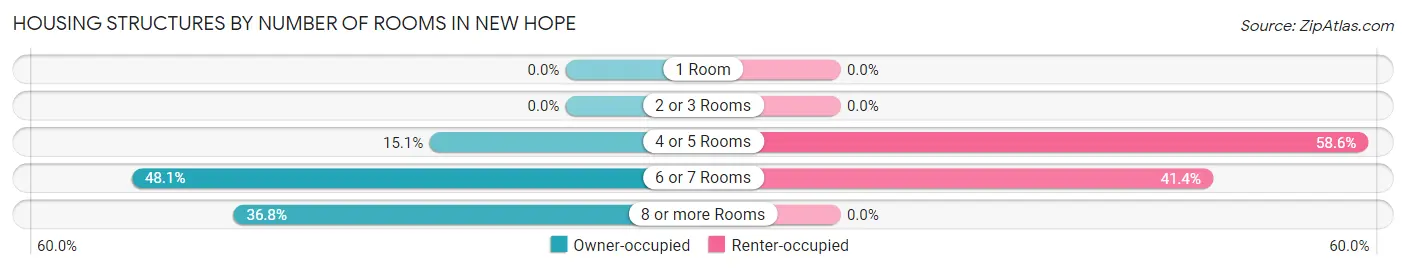
| Number of Rooms | Owner-occupied | Renter-occupied |
| 1 Room | 0 (0.0%) | 0 (0.0%) |
| 2 or 3 Rooms | 0 (0.0%) | 0 (0.0%) |
| 4 or 5 Rooms | 55 (15.1%) | 17 (58.6%) |
| 6 or 7 Rooms | 175 (48.1%) | 12 (41.4%) |
| 8 or more Rooms | 134 (36.8%) | 0 (0.0%) |
| Total | 364 (100.0%) | 29 (100.0%) |
Housing Structure by Heating Type in New Hope
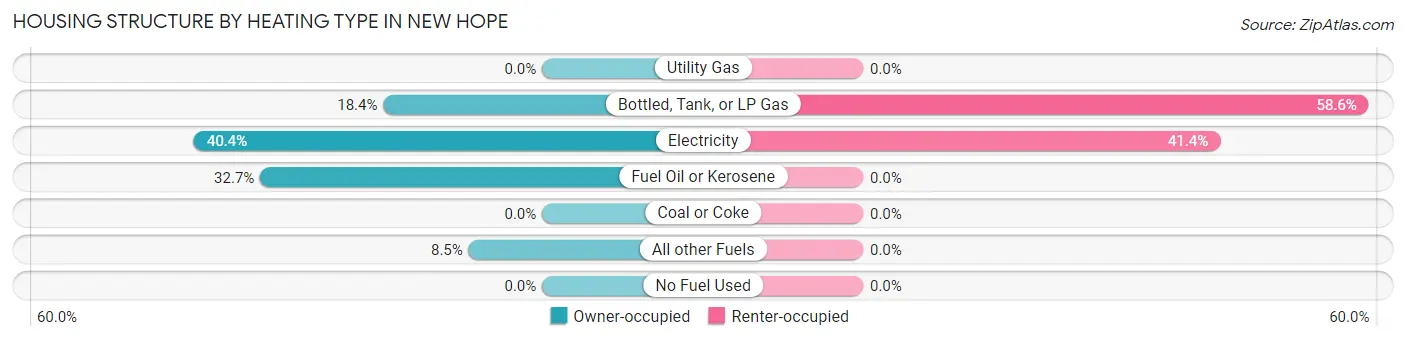
| Heating Type | Owner-occupied | Renter-occupied |
| Utility Gas | 0 (0.0%) | 0 (0.0%) |
| Bottled, Tank, or LP Gas | 67 (18.4%) | 17 (58.6%) |
| Electricity | 147 (40.4%) | 12 (41.4%) |
| Fuel Oil or Kerosene | 119 (32.7%) | 0 (0.0%) |
| Coal or Coke | 0 (0.0%) | 0 (0.0%) |
| All other Fuels | 31 (8.5%) | 0 (0.0%) |
| No Fuel Used | 0 (0.0%) | 0 (0.0%) |
| Total | 364 (100.0%) | 29 (100.0%) |
Household Vehicle Usage in New Hope
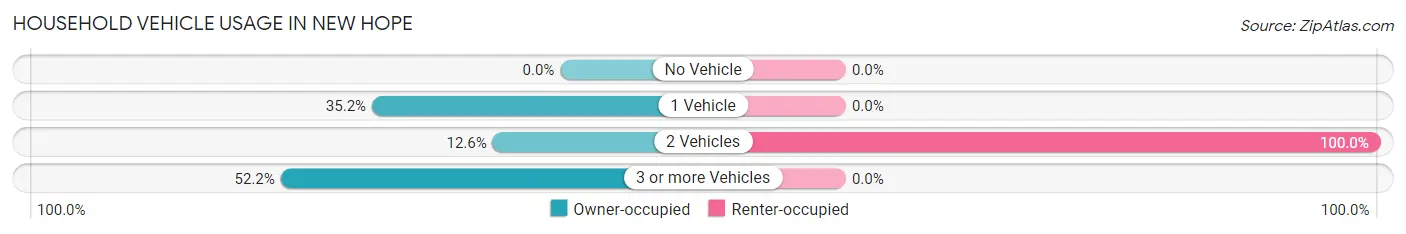
| Vehicles per Household | Owner-occupied | Renter-occupied |
| No Vehicle | 0 (0.0%) | 0 (0.0%) |
| 1 Vehicle | 128 (35.2%) | 0 (0.0%) |
| 2 Vehicles | 46 (12.6%) | 29 (100.0%) |
| 3 or more Vehicles | 190 (52.2%) | 0 (0.0%) |
| Total | 364 (100.0%) | 29 (100.0%) |
Real Estate & Mortgages in New Hope
Real Estate and Mortgage Overview in New Hope
| Characteristic | Without Mortgage | With Mortgage |
| Housing Units | 71 | 293 |
| Median Property Value | $247,000 | $315,100 |
| Median Household Income | $56,417 | $42 |
| Monthly Housing Costs | $354 | $0 |
| Real Estate Taxes | $1,657 | $0 |
Property Value by Mortgage Status in New Hope
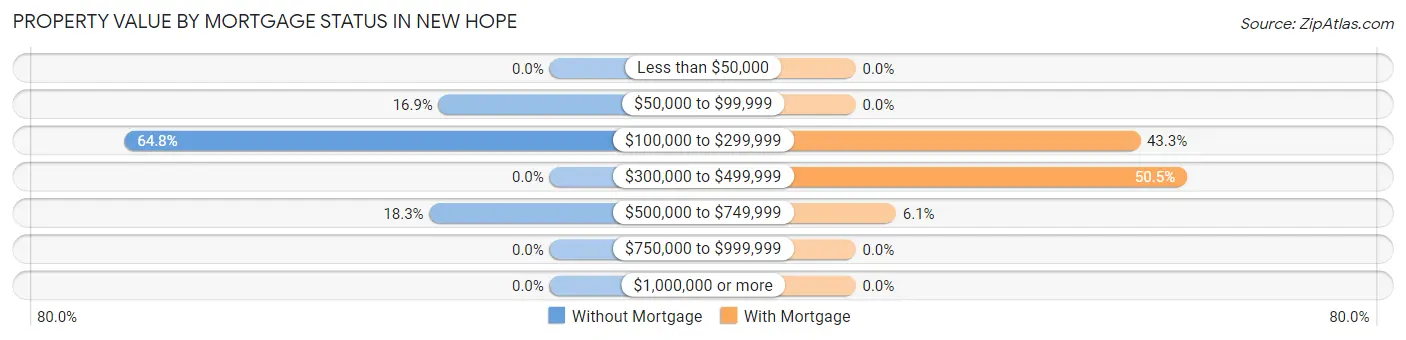
| Property Value | Without Mortgage | With Mortgage |
| Less than $50,000 | 0 (0.0%) | 0 (0.0%) |
| $50,000 to $99,999 | 12 (16.9%) | 0 (0.0%) |
| $100,000 to $299,999 | 46 (64.8%) | 127 (43.3%) |
| $300,000 to $499,999 | 0 (0.0%) | 148 (50.5%) |
| $500,000 to $749,999 | 13 (18.3%) | 18 (6.1%) |
| $750,000 to $999,999 | 0 (0.0%) | 0 (0.0%) |
| $1,000,000 or more | 0 (0.0%) | 0 (0.0%) |
| Total | 71 (100.0%) | 293 (100.0%) |
Household Income by Mortgage Status in New Hope
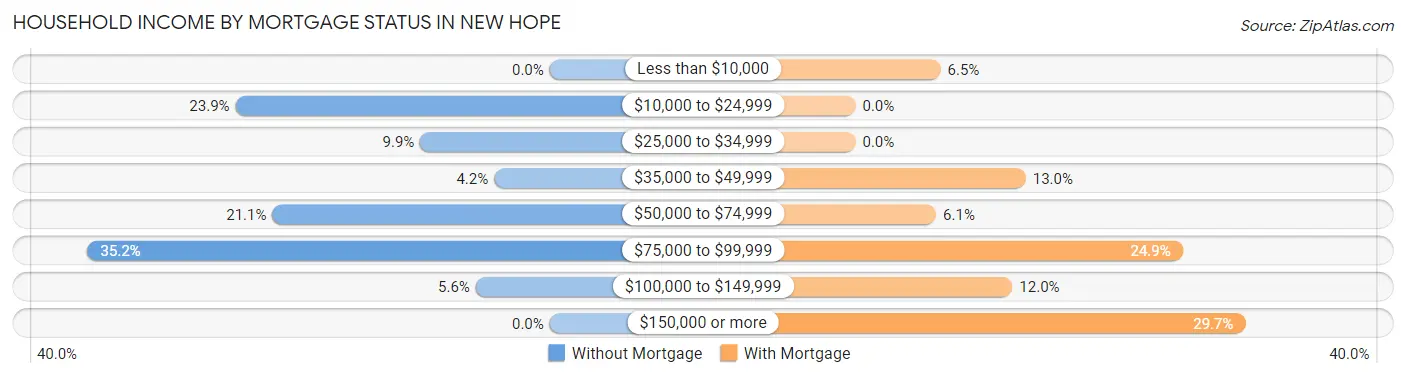
| Household Income | Without Mortgage | With Mortgage |
| Less than $10,000 | 0 (0.0%) | 19 (6.5%) |
| $10,000 to $24,999 | 17 (23.9%) | 0 (0.0%) |
| $25,000 to $34,999 | 7 (9.9%) | 0 (0.0%) |
| $35,000 to $49,999 | 3 (4.2%) | 38 (13.0%) |
| $50,000 to $74,999 | 15 (21.1%) | 18 (6.1%) |
| $75,000 to $99,999 | 25 (35.2%) | 73 (24.9%) |
| $100,000 to $149,999 | 4 (5.6%) | 35 (11.9%) |
| $150,000 or more | 0 (0.0%) | 87 (29.7%) |
| Total | 71 (100.0%) | 293 (100.0%) |
Property Value to Household Income Ratio in New Hope
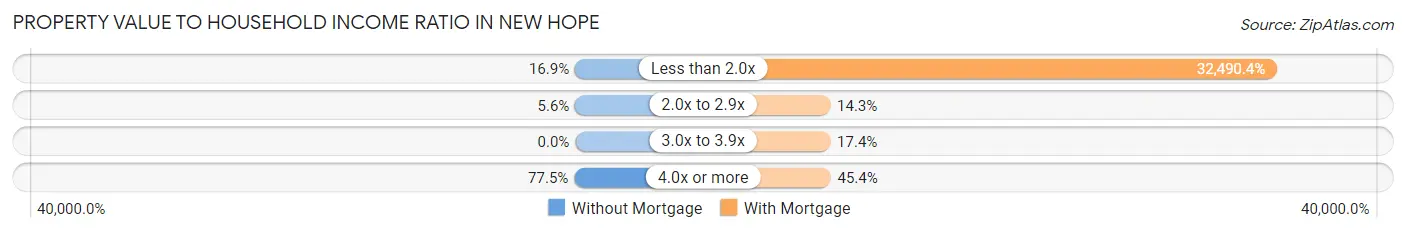
| Value-to-Income Ratio | Without Mortgage | With Mortgage |
| Less than 2.0x | 12 (16.9%) | 95,197 (32,490.4%) |
| 2.0x to 2.9x | 4 (5.6%) | 42 (14.3%) |
| 3.0x to 3.9x | 0 (0.0%) | 51 (17.4%) |
| 4.0x or more | 55 (77.5%) | 133 (45.4%) |
| Total | 71 (100.0%) | 293 (100.0%) |
Real Estate Taxes by Mortgage Status in New Hope
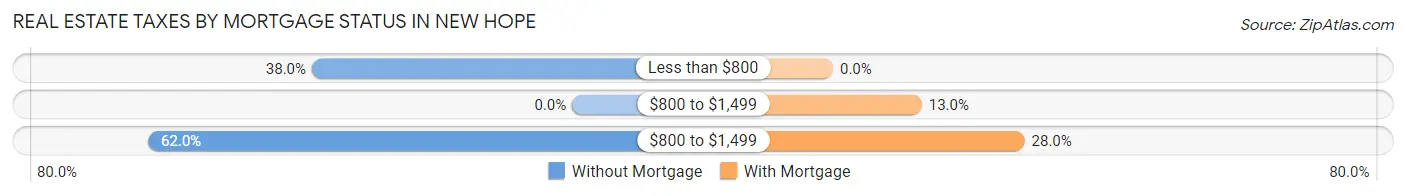
| Property Taxes | Without Mortgage | With Mortgage |
| Less than $800 | 27 (38.0%) | 0 (0.0%) |
| $800 to $1,499 | 0 (0.0%) | 38 (13.0%) |
| $800 to $1,499 | 44 (62.0%) | 82 (28.0%) |
| Total | 71 (100.0%) | 293 (100.0%) |
Health & Disability in New Hope
Health Insurance Coverage by Age in New Hope
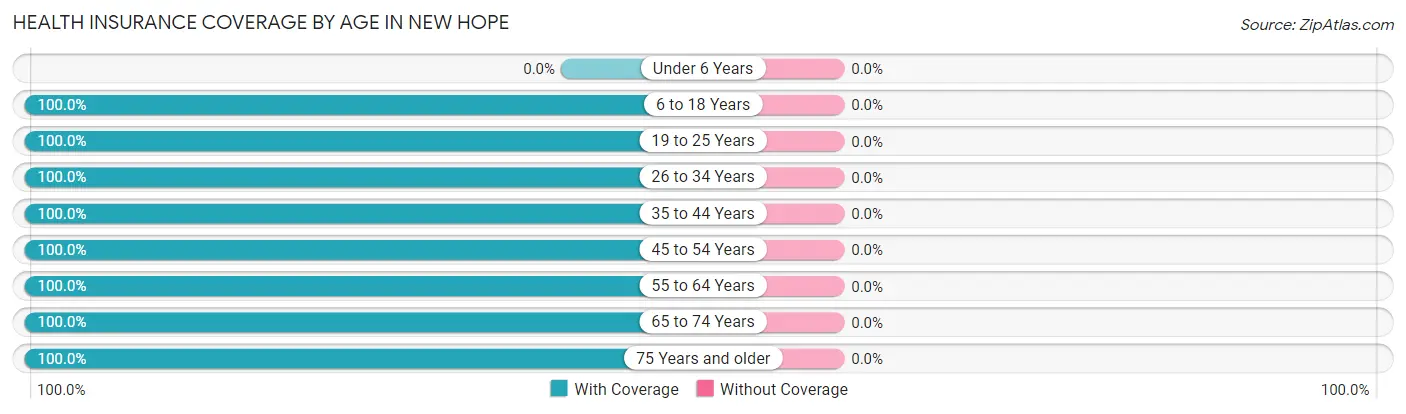
| Age Bracket | With Coverage | Without Coverage |
| Under 6 Years | 0 (0.0%) | 0 (0.0%) |
| 6 to 18 Years | 149 (100.0%) | 0 (0.0%) |
| 19 to 25 Years | 66 (100.0%) | 0 (0.0%) |
| 26 to 34 Years | 97 (100.0%) | 0 (0.0%) |
| 35 to 44 Years | 78 (100.0%) | 0 (0.0%) |
| 45 to 54 Years | 141 (100.0%) | 0 (0.0%) |
| 55 to 64 Years | 260 (100.0%) | 0 (0.0%) |
| 65 to 74 Years | 67 (100.0%) | 0 (0.0%) |
| 75 Years and older | 69 (100.0%) | 0 (0.0%) |
| Total | 927 (100.0%) | 0 (0.0%) |
Health Insurance Coverage by Citizenship Status in New Hope
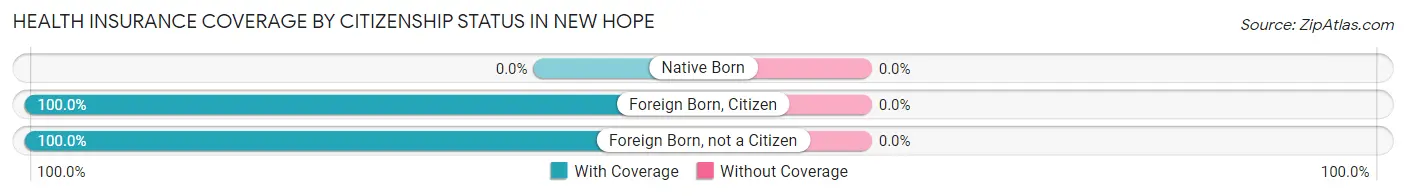
| Citizenship Status | With Coverage | Without Coverage |
| Native Born | 0 (0.0%) | 0 (0.0%) |
| Foreign Born, Citizen | 149 (100.0%) | 0 (0.0%) |
| Foreign Born, not a Citizen | 66 (100.0%) | 0 (0.0%) |
Health Insurance Coverage by Household Income in New Hope
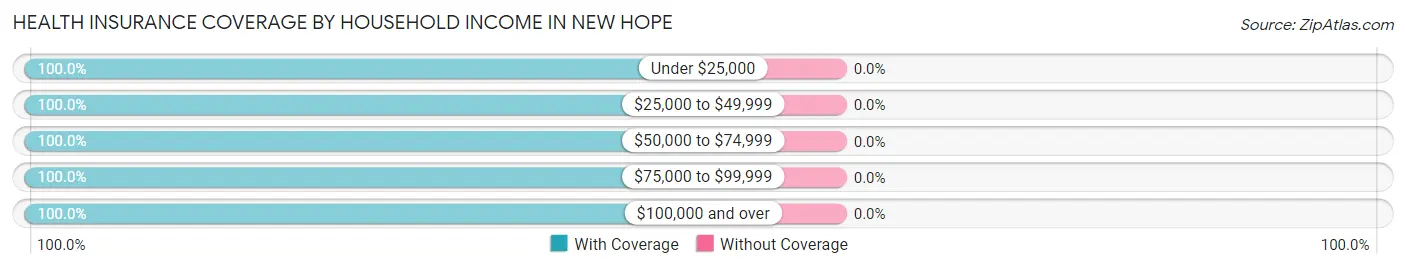
| Household Income | With Coverage | Without Coverage |
| Under $25,000 | 17 (100.0%) | 0 (0.0%) |
| $25,000 to $49,999 | 160 (100.0%) | 0 (0.0%) |
| $50,000 to $74,999 | 136 (100.0%) | 0 (0.0%) |
| $75,000 to $99,999 | 152 (100.0%) | 0 (0.0%) |
| $100,000 and over | 462 (100.0%) | 0 (0.0%) |
Public vs Private Health Insurance Coverage by Age in New Hope
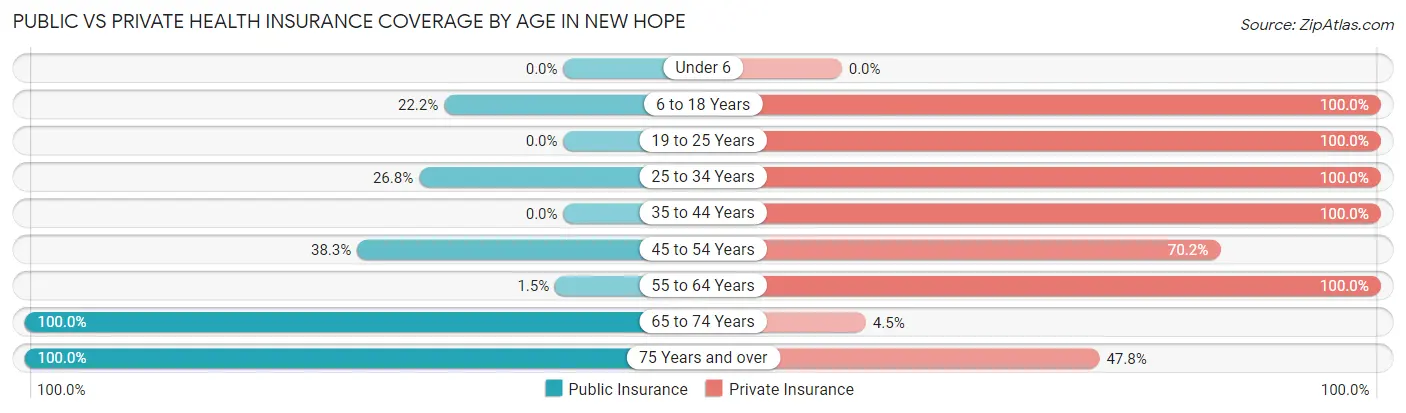
| Age Bracket | Public Insurance | Private Insurance |
| Under 6 | 0 (0.0%) | 0 (0.0%) |
| 6 to 18 Years | 33 (22.2%) | 149 (100.0%) |
| 19 to 25 Years | 0 (0.0%) | 66 (100.0%) |
| 25 to 34 Years | 26 (26.8%) | 97 (100.0%) |
| 35 to 44 Years | 0 (0.0%) | 78 (100.0%) |
| 45 to 54 Years | 54 (38.3%) | 99 (70.2%) |
| 55 to 64 Years | 4 (1.5%) | 260 (100.0%) |
| 65 to 74 Years | 67 (100.0%) | 3 (4.5%) |
| 75 Years and over | 69 (100.0%) | 33 (47.8%) |
| Total | 253 (27.3%) | 785 (84.7%) |
Disability Status by Sex by Age in New Hope
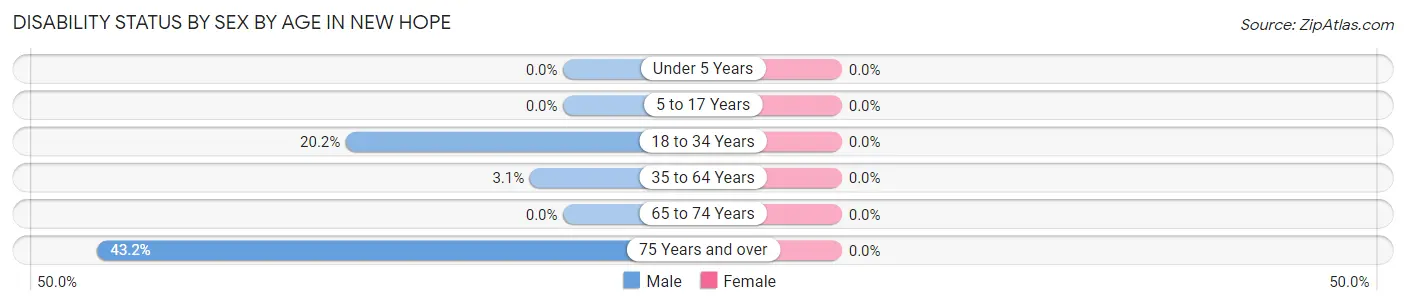
| Age Bracket | Male | Female |
| Under 5 Years | 0 (0.0%) | 0 (0.0%) |
| 5 to 17 Years | 0 (0.0%) | 0 (0.0%) |
| 18 to 34 Years | 26 (20.2%) | 0 (0.0%) |
| 35 to 64 Years | 8 (3.1%) | 0 (0.0%) |
| 65 to 74 Years | 0 (0.0%) | 0 (0.0%) |
| 75 Years and over | 16 (43.2%) | 0 (0.0%) |
Disability Class by Sex by Age in New Hope
Disability Class: Hearing Difficulty
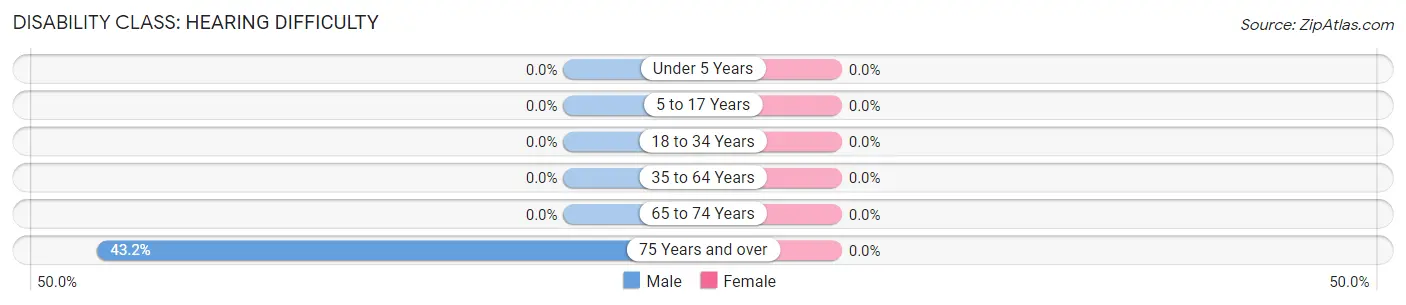
| Age Bracket | Male | Female |
| Under 5 Years | 0 (0.0%) | 0 (0.0%) |
| 5 to 17 Years | 0 (0.0%) | 0 (0.0%) |
| 18 to 34 Years | 0 (0.0%) | 0 (0.0%) |
| 35 to 64 Years | 0 (0.0%) | 0 (0.0%) |
| 65 to 74 Years | 0 (0.0%) | 0 (0.0%) |
| 75 Years and over | 16 (43.2%) | 0 (0.0%) |
Disability Class: Vision Difficulty
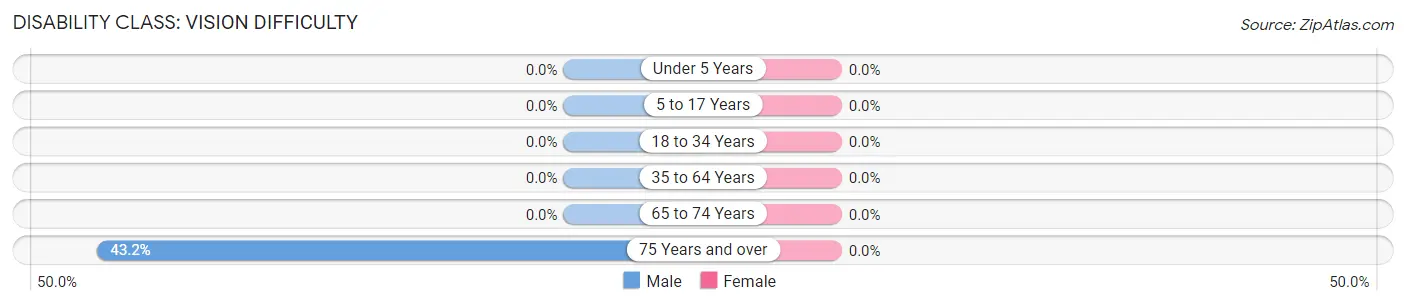
| Age Bracket | Male | Female |
| Under 5 Years | 0 (0.0%) | 0 (0.0%) |
| 5 to 17 Years | 0 (0.0%) | 0 (0.0%) |
| 18 to 34 Years | 0 (0.0%) | 0 (0.0%) |
| 35 to 64 Years | 0 (0.0%) | 0 (0.0%) |
| 65 to 74 Years | 0 (0.0%) | 0 (0.0%) |
| 75 Years and over | 16 (43.2%) | 0 (0.0%) |
Disability Class: Cognitive Difficulty
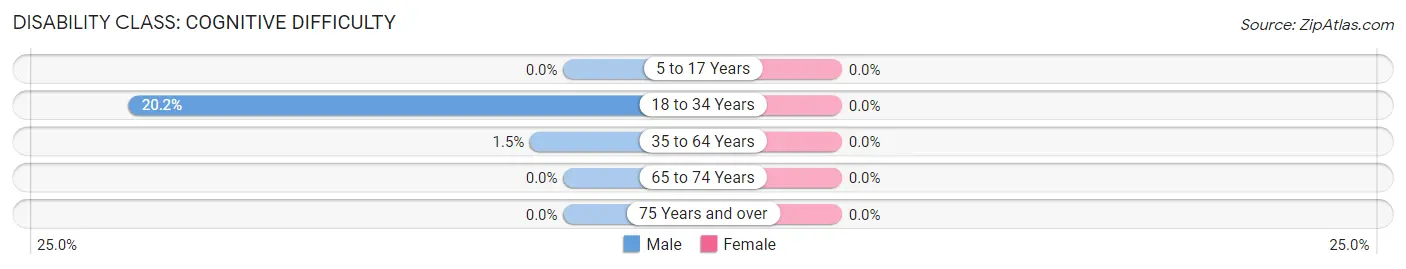
| Age Bracket | Male | Female |
| 5 to 17 Years | 0 (0.0%) | 0 (0.0%) |
| 18 to 34 Years | 26 (20.2%) | 0 (0.0%) |
| 35 to 64 Years | 4 (1.5%) | 0 (0.0%) |
| 65 to 74 Years | 0 (0.0%) | 0 (0.0%) |
| 75 Years and over | 0 (0.0%) | 0 (0.0%) |
Disability Class: Ambulatory Difficulty
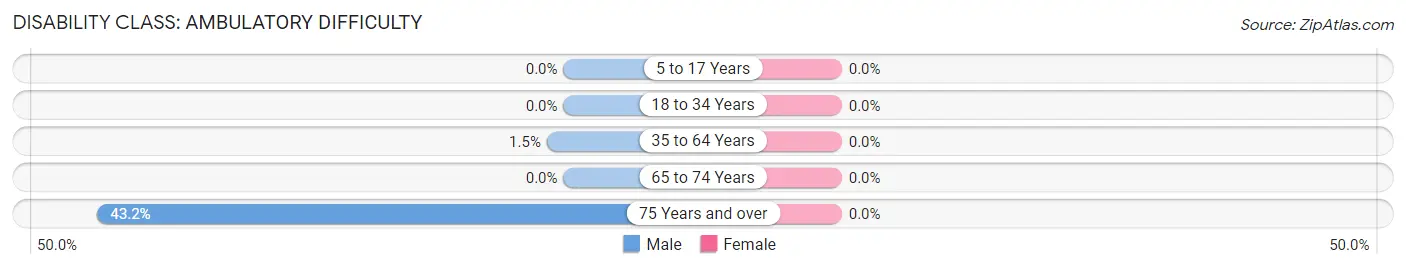
| Age Bracket | Male | Female |
| 5 to 17 Years | 0 (0.0%) | 0 (0.0%) |
| 18 to 34 Years | 0 (0.0%) | 0 (0.0%) |
| 35 to 64 Years | 4 (1.5%) | 0 (0.0%) |
| 65 to 74 Years | 0 (0.0%) | 0 (0.0%) |
| 75 Years and over | 16 (43.2%) | 0 (0.0%) |
Disability Class: Self-Care Difficulty
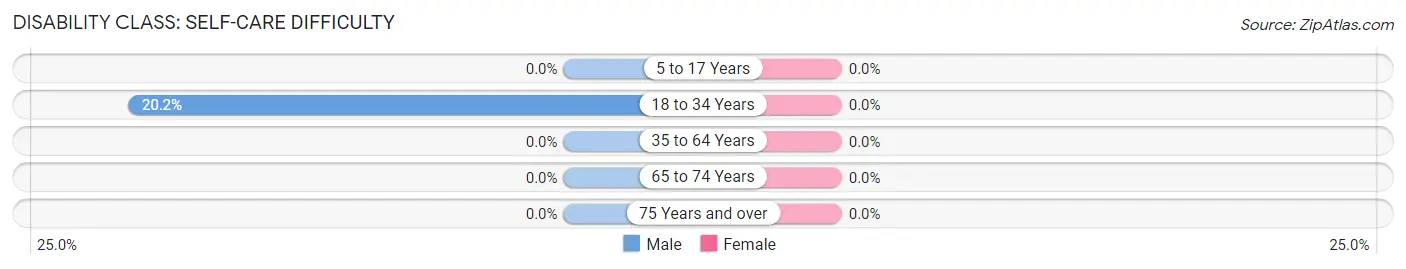
| Age Bracket | Male | Female |
| 5 to 17 Years | 0 (0.0%) | 0 (0.0%) |
| 18 to 34 Years | 26 (20.2%) | 0 (0.0%) |
| 35 to 64 Years | 0 (0.0%) | 0 (0.0%) |
| 65 to 74 Years | 0 (0.0%) | 0 (0.0%) |
| 75 Years and over | 0 (0.0%) | 0 (0.0%) |
Technology Access in New Hope
Computing Device Access in New Hope
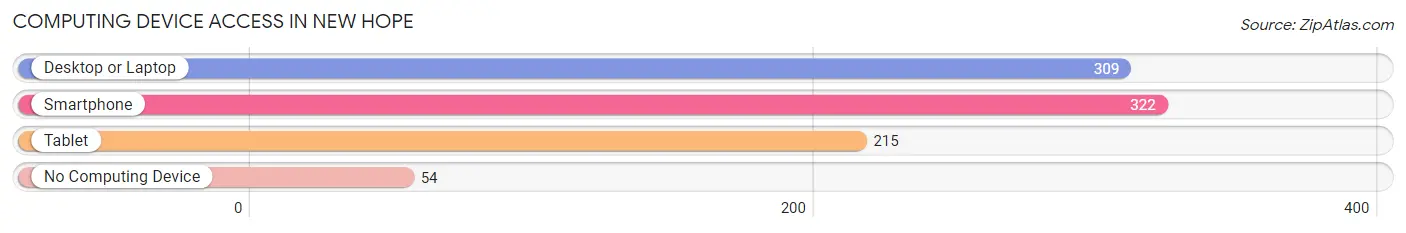
| Device Type | # Households | % Households |
| Desktop or Laptop | 309 | 78.6% |
| Smartphone | 322 | 81.9% |
| Tablet | 215 | 54.7% |
| No Computing Device | 54 | 13.7% |
| Total | 393 | 100.0% |
Internet Access in New Hope

| Internet Type | # Households | % Households |
| Dial-Up Internet | 0 | 0.0% |
| Broadband Home | 233 | 59.3% |
| Cellular Data Only | 92 | 23.4% |
| Satellite Internet | 26 | 6.6% |
| No Internet | 68 | 17.3% |
| Total | 393 | 100.0% |
New Hope Summary
History
New Hope is a small unincorporated community located in the northern part of Prince Edward County, Virginia. It is situated on the banks of the Appomattox River, about 10 miles south of Farmville. The area was first settled in the late 1700s by a group of Quakers who had migrated from Pennsylvania. The Quakers named the area New Hope, and it quickly became a thriving agricultural community.
The area was also home to a number of freed slaves who had been emancipated after the Civil War. These freed slaves established their own churches and schools, and the community of New Hope grew and prospered.
In the early 1900s, the area was home to a number of small businesses, including a general store, a blacksmith shop, and a sawmill. The area also had a post office, which was established in 1891.
In the mid-1900s, the area began to decline as the population shifted away from rural areas and towards larger cities. The post office closed in the 1950s, and the sawmill and other businesses closed soon after.
Geography
New Hope is located in the northern part of Prince Edward County, Virginia. It is situated on the banks of the Appomattox River, about 10 miles south of Farmville. The area is mostly rural, with rolling hills and forests. The climate is temperate, with hot summers and cold winters.
The area is home to a number of small streams and creeks, as well as the Appomattox River. The Appomattox River is a major tributary of the James River, and it is used for recreational activities such as fishing and boating.
Economy
The economy of New Hope is largely based on agriculture. The area is home to a number of small farms, which produce a variety of crops, including corn, soybeans, and wheat. The area is also home to a number of small businesses, including a general store, a blacksmith shop, and a sawmill.
The area is also home to a number of small manufacturing businesses, which produce a variety of products, including furniture, clothing, and textiles. The area is also home to a number of small service businesses, such as auto repair shops and restaurants.
Demographics
As of the 2010 census, the population of New Hope was 1,845. The population is mostly white (90.3%), with a small African American population (7.2%). The median household income is $37,917, and the median age is 43.
The area is home to a number of churches, including Baptist, Methodist, and Presbyterian. The area is also home to a number of schools, including a public elementary school and a private Christian school.
Common Questions
What is the Total Population of New Hope?
Total Population of New Hope is 927.
What is the Total Male Population of New Hope?
Total Male Population of New Hope is 483.
What is the Total Female Population of New Hope?
Total Female Population of New Hope is 444.
What is the Ratio of Males per 100 Females in New Hope?
There are 108.78 Males per 100 Females in New Hope.
What is the Ratio of Females per 100 Males in New Hope?
There are 91.93 Females per 100 Males in New Hope.
What is the Median Population Age in New Hope?
Median Population Age in New Hope is 50.7 Years.
What is the Average Family Size in New Hope
Average Family Size in New Hope is 3.1 People.
What is the Average Household Size in New Hope
Average Household Size in New Hope is 2.4 People.
What is Per Capita Income in New Hope?
Per Capita income in New Hope is $35,647.
What is the Median Family Income in New Hope?
Median Family Income in New Hope is $84,808.
What is the Median Household income in New Hope?
Median Household Income in New Hope is $81,164.
What is Income or Wage Gap in New Hope?
Income or Wage Gap in New Hope is 11.5%.
Women in New Hope earn 88.5 cents for every dollar earned by a man.
What is Inequality or Gini Index in New Hope?
Inequality or Gini Index in New Hope is 0.30.
How Large is the Labor Force in New Hope?
There are 592 People in the Labor Forcein in New Hope.
What is the Percentage of People in the Labor Force in New Hope?
72.5% of People are in the Labor Force in New Hope.