County Center, VA
County Center Map
County Center Overview
4,024
TOTAL POPULATION
1,897
MALE POPULATION
2,127
FEMALE POPULATION
89.19
MALES / 100 FEMALES
112.12
FEMALES / 100 MALES
35.5
MEDIAN AGE
3.7
AVG FAMILY SIZE
3.5
AVG HOUSEHOLD SIZE
$61,468
PER CAPITA INCOME
$181,938
AVG FAMILY INCOME
$182,250
AVG HOUSEHOLD INCOME
37.0%
WAGE / INCOME GAP [ % ]
63.0¢/ $1
WAGE / INCOME GAP [ $ ]
0.42
INEQUALITY / GINI INDEX
2,226
LABOR FORCE [ PEOPLE ]
77.3%
PERCENT IN LABOR FORCE
7.3%
UNEMPLOYMENT RATE
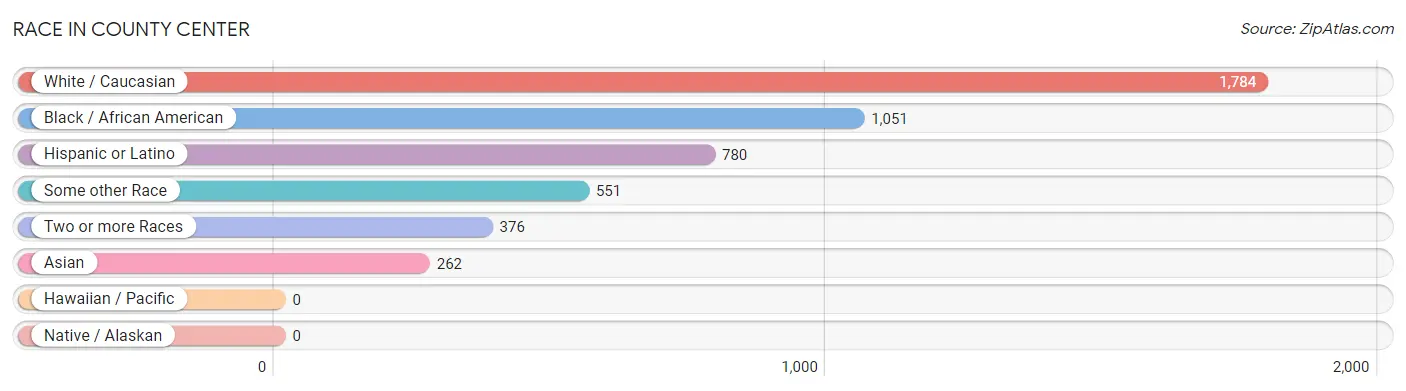
Race in County Center
The most populous races in County Center are White / Caucasian (1,784 | 44.3%), Black / African American (1,051 | 26.1%), and Hispanic or Latino (780 | 19.4%).
| Race | # Population | % Population |
| Asian | 262 | 6.5% |
| Black / African American | 1,051 | 26.1% |
| Hawaiian / Pacific | 0 | 0.0% |
| Hispanic or Latino | 780 | 19.4% |
| Native / Alaskan | 0 | 0.0% |
| White / Caucasian | 1,784 | 44.3% |
| Two or more Races | 376 | 9.3% |
| Some other Race | 551 | 13.7% |
| Total | 4,024 | 100.0% |
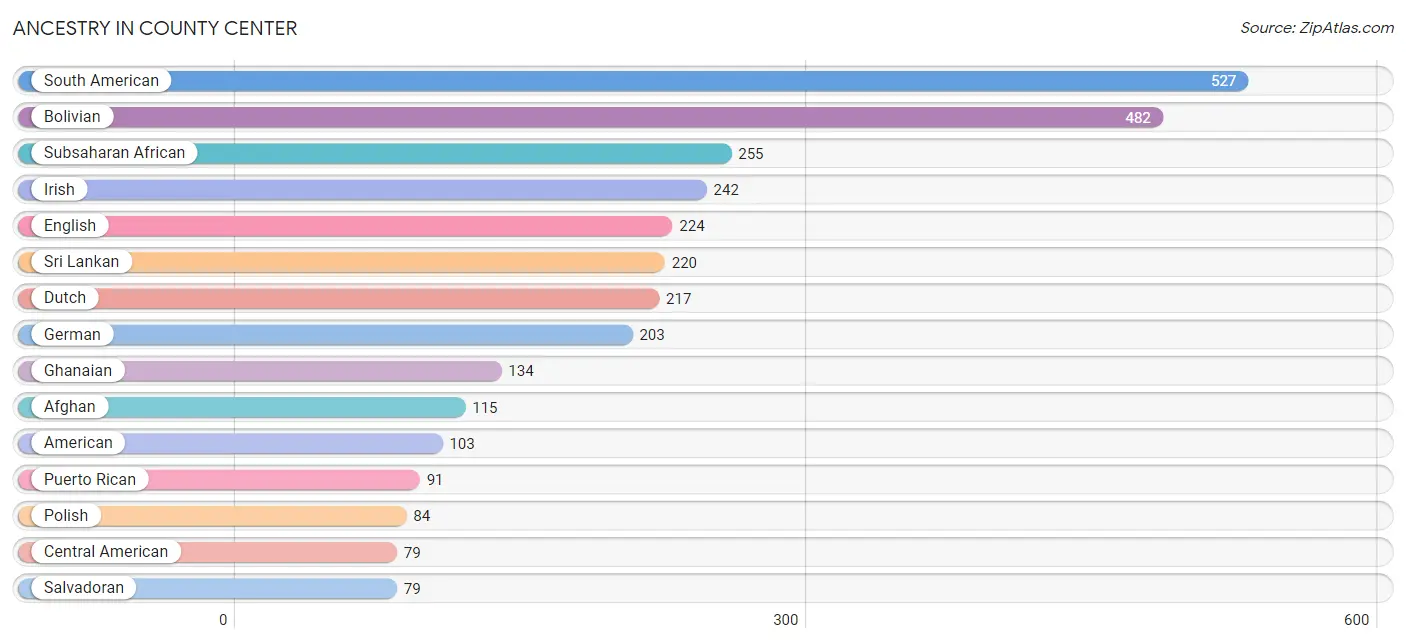
Ancestry in County Center
The most populous ancestries reported in County Center are South American (527 | 13.1%), Bolivian (482 | 12.0%), Subsaharan African (255 | 6.3%), Irish (242 | 6.0%), and English (224 | 5.6%), together accounting for 43.0% of all County Center residents.
| Ancestry | # Population | % Population |
| Afghan | 115 | 2.9% |
| African | 28 | 0.7% |
| American | 103 | 2.6% |
| Arab | 52 | 1.3% |
| Austrian | 44 | 1.1% |
| Bolivian | 482 | 12.0% |
| British | 24 | 0.6% |
| Central American | 79 | 2.0% |
| Dominican | 18 | 0.4% |
| Dutch | 217 | 5.4% |
| English | 224 | 5.6% |
| Ethiopian | 78 | 1.9% |
| European | 65 | 1.6% |
| French | 44 | 1.1% |
| German | 203 | 5.0% |
| Ghanaian | 134 | 3.3% |
| Greek | 15 | 0.4% |
| Indian (Asian) | 35 | 0.9% |
| Iranian | 50 | 1.2% |
| Irish | 242 | 6.0% |
| Italian | 31 | 0.8% |
| Lithuanian | 17 | 0.4% |
| Mexican | 43 | 1.1% |
| Nigerian | 15 | 0.4% |
| Norwegian | 42 | 1.0% |
| Peruvian | 45 | 1.1% |
| Polish | 84 | 2.1% |
| Portuguese | 15 | 0.4% |
| Puerto Rican | 91 | 2.3% |
| Russian | 6 | 0.2% |
| Salvadoran | 79 | 2.0% |
| Scottish | 30 | 0.7% |
| Slovak | 62 | 1.5% |
| South American | 527 | 13.1% |
| Sri Lankan | 220 | 5.5% |
| Subsaharan African | 255 | 6.3% |
| Swedish | 10 | 0.3% |
| Swiss | 29 | 0.7% |
| Ukrainian | 11 | 0.3% |
| West Indian | 37 | 0.9% | View All 40 Rows |
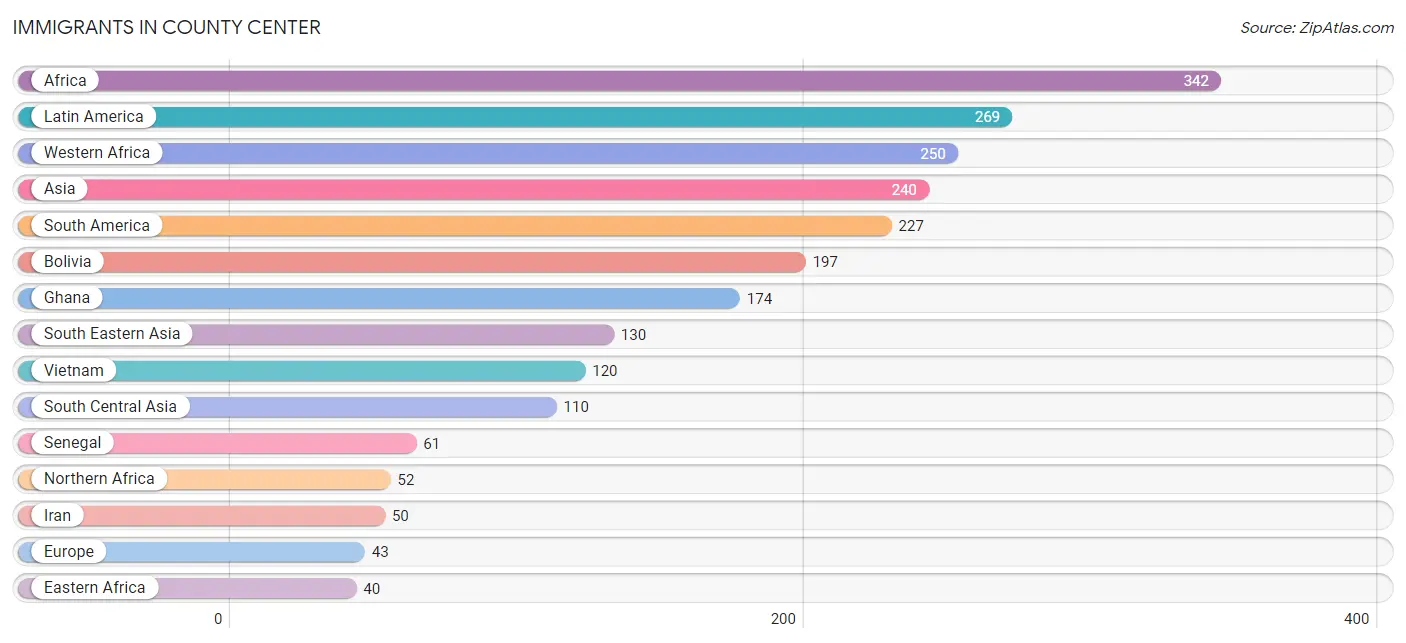
Immigrants in County Center
The most numerous immigrant groups reported in County Center came from Africa (342 | 8.5%), Latin America (269 | 6.7%), Western Africa (250 | 6.2%), Asia (240 | 6.0%), and South America (227 | 5.6%), together accounting for 33.0% of all County Center residents.
| Immigration Origin | # Population | % Population |
| Africa | 342 | 8.5% |
| Asia | 240 | 6.0% |
| Bolivia | 197 | 4.9% |
| Caribbean | 29 | 0.7% |
| Central America | 13 | 0.3% |
| Dominican Republic | 18 | 0.4% |
| Eastern Africa | 40 | 1.0% |
| Eastern Europe | 28 | 0.7% |
| El Salvador | 13 | 0.3% |
| Ethiopia | 40 | 1.0% |
| Europe | 43 | 1.1% |
| Ghana | 174 | 4.3% |
| Greece | 15 | 0.4% |
| Iran | 50 | 1.2% |
| Latin America | 269 | 6.7% |
| Lithuania | 17 | 0.4% |
| Malaysia | 10 | 0.3% |
| Nigeria | 15 | 0.4% |
| Northern Africa | 52 | 1.3% |
| Pakistan | 40 | 1.0% |
| Peru | 30 | 0.7% |
| Senegal | 61 | 1.5% |
| South America | 227 | 5.6% |
| South Central Asia | 110 | 2.7% |
| South Eastern Asia | 130 | 3.2% |
| Southern Europe | 15 | 0.4% |
| Sri Lanka | 20 | 0.5% |
| Trinidad and Tobago | 11 | 0.3% |
| Ukraine | 11 | 0.3% |
| Vietnam | 120 | 3.0% |
| Western Africa | 250 | 6.2% | View All 31 Rows |
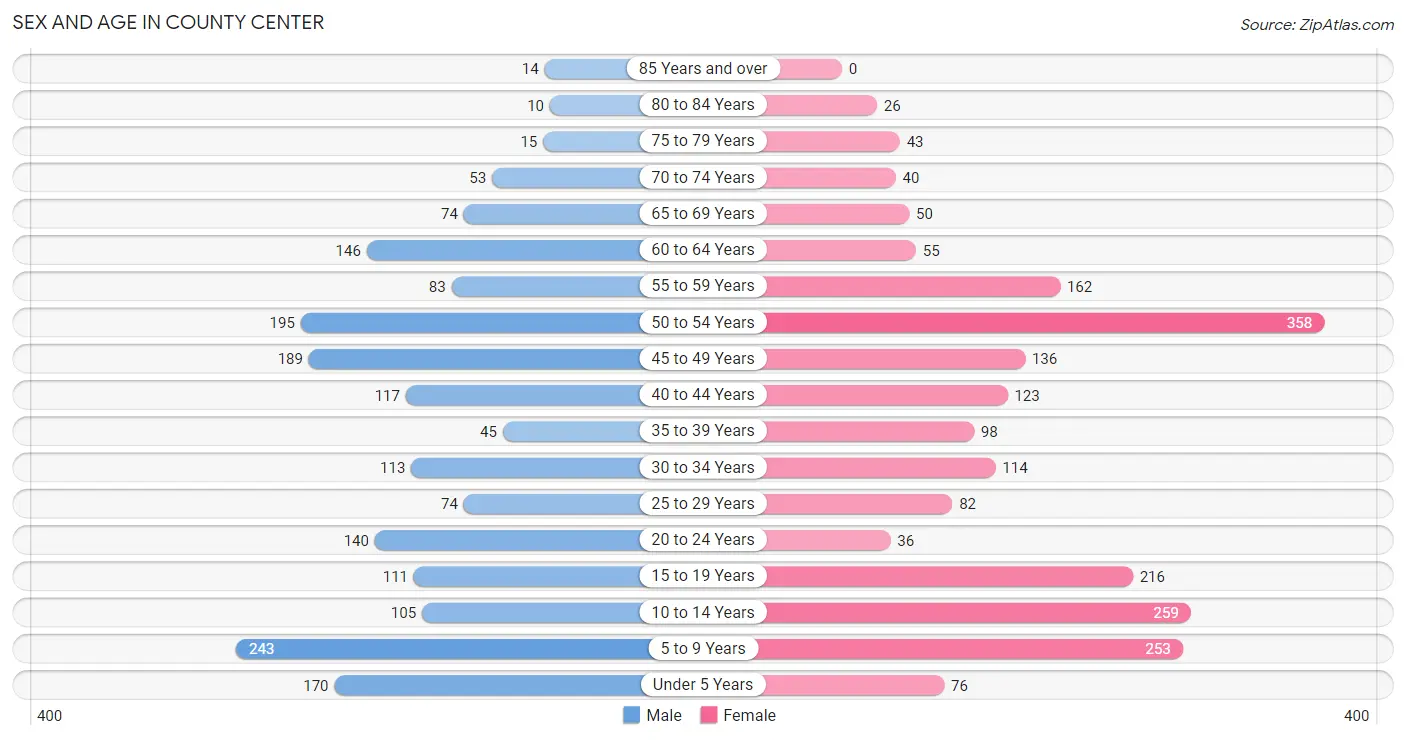
Sex and Age in County Center
Sex and Age in County Center
The most populous age groups in County Center are 5 to 9 Years (243 | 12.8%) for men and 50 to 54 Years (358 | 16.8%) for women.
| Age Bracket | Male | Female |
| Under 5 Years | 170 (9.0%) | 76 (3.6%) |
| 5 to 9 Years | 243 (12.8%) | 253 (11.9%) |
| 10 to 14 Years | 105 (5.5%) | 259 (12.2%) |
| 15 to 19 Years | 111 (5.9%) | 216 (10.2%) |
| 20 to 24 Years | 140 (7.4%) | 36 (1.7%) |
| 25 to 29 Years | 74 (3.9%) | 82 (3.9%) |
| 30 to 34 Years | 113 (6.0%) | 114 (5.4%) |
| 35 to 39 Years | 45 (2.4%) | 98 (4.6%) |
| 40 to 44 Years | 117 (6.2%) | 123 (5.8%) |
| 45 to 49 Years | 189 (10.0%) | 136 (6.4%) |
| 50 to 54 Years | 195 (10.3%) | 358 (16.8%) |
| 55 to 59 Years | 83 (4.4%) | 162 (7.6%) |
| 60 to 64 Years | 146 (7.7%) | 55 (2.6%) |
| 65 to 69 Years | 74 (3.9%) | 50 (2.4%) |
| 70 to 74 Years | 53 (2.8%) | 40 (1.9%) |
| 75 to 79 Years | 15 (0.8%) | 43 (2.0%) |
| 80 to 84 Years | 10 (0.5%) | 26 (1.2%) |
| 85 Years and over | 14 (0.7%) | 0 (0.0%) |
| Total | 1,897 (100.0%) | 2,127 (100.0%) |
Families and Households in County Center
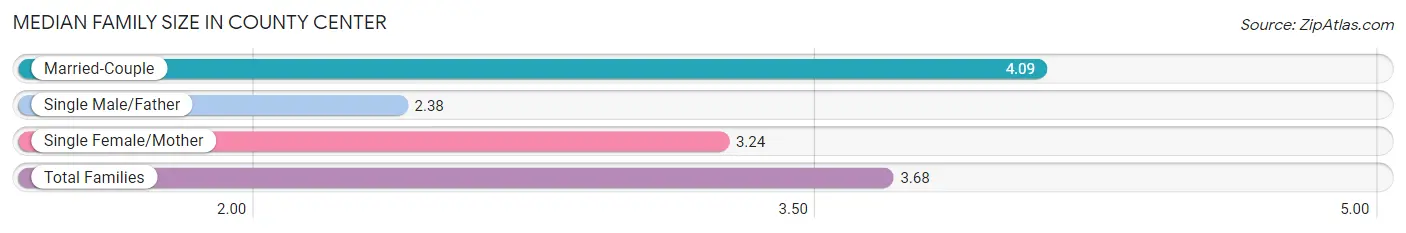
Median Family Size in County Center
The median family size in County Center is 3.68 persons per family, with married-couple families (671 | 68.3%) accounting for the largest median family size of 4.09 persons per family. On the other hand, single male/father families (156 | 15.9%) represent the smallest median family size with 2.38 persons per family.
| Family Type | # Families | Family Size |
| Married-Couple | 671 (68.3%) | 4.09 |
| Single Male/Father | 156 (15.9%) | 2.38 |
| Single Female/Mother | 156 (15.9%) | 3.24 |
| Total Families | 983 (100.0%) | 3.68 |
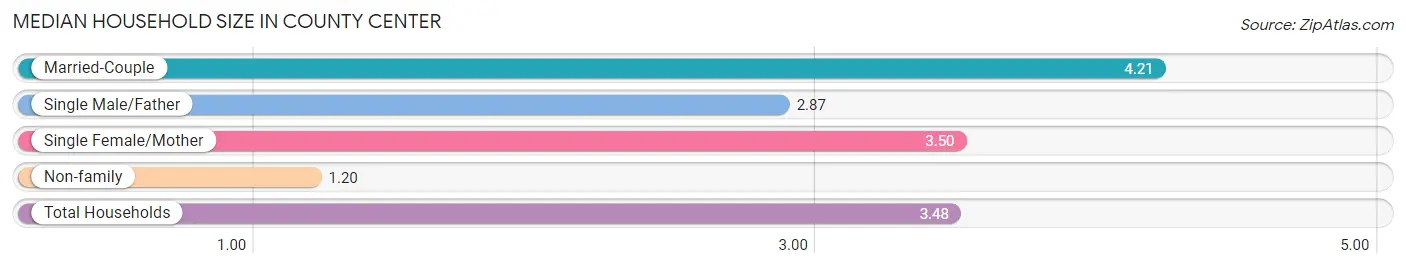
Median Household Size in County Center
The median household size in County Center is 3.48 persons per household, with married-couple households (671 | 58.0%) accounting for the largest median household size of 4.21 persons per household. non-family households (173 | 15.0%) represent the smallest median household size with 1.20 persons per household.
| Household Type | # Households | Household Size |
| Married-Couple | 671 (58.0%) | 4.21 |
| Single Male/Father | 156 (13.5%) | 2.87 |
| Single Female/Mother | 156 (13.5%) | 3.50 |
| Non-family | 173 (15.0%) | 1.20 |
| Total Households | 1,156 (100.0%) | 3.48 |
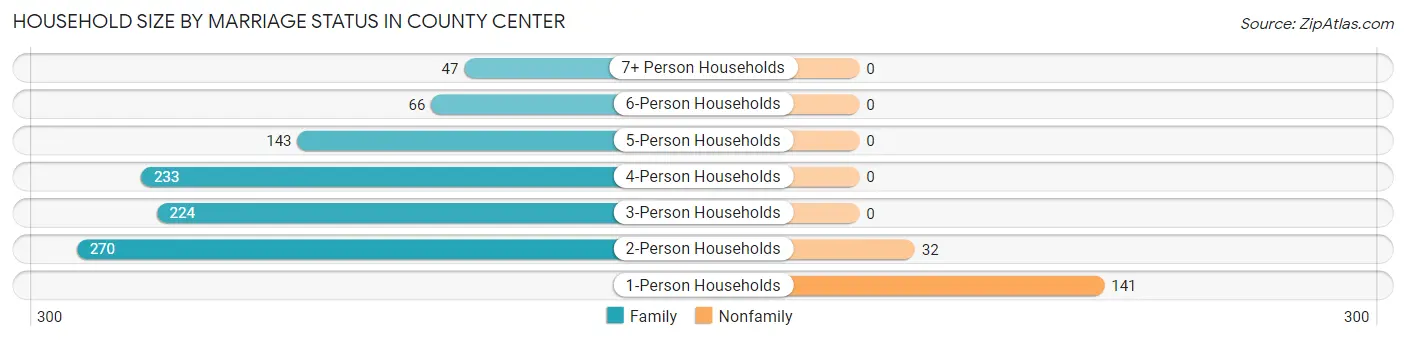
Household Size by Marriage Status in County Center
Out of a total of 1,156 households in County Center, 983 (85.0%) are family households, while 173 (15.0%) are nonfamily households. The most numerous type of family households are 2-person households, comprising 270, and the most common type of nonfamily households are 1-person households, comprising 141.
| Household Size | Family Households | Nonfamily Households |
| 1-Person Households | - | 141 (12.2%) |
| 2-Person Households | 270 (23.4%) | 32 (2.8%) |
| 3-Person Households | 224 (19.4%) | 0 (0.0%) |
| 4-Person Households | 233 (20.2%) | 0 (0.0%) |
| 5-Person Households | 143 (12.4%) | 0 (0.0%) |
| 6-Person Households | 66 (5.7%) | 0 (0.0%) |
| 7+ Person Households | 47 (4.1%) | 0 (0.0%) |
| Total | 983 (85.0%) | 173 (15.0%) |
Female Fertility in County Center
Fertility by Age in County Center
Average fertility rate in County Center is 31.0 births per 1,000 women. Women in the age bracket of 20 to 34 years have the highest fertility rate with 121.0 births per 1,000 women. Women in the age bracket of 20 to 34 years acount for 100.0% of all women with births.
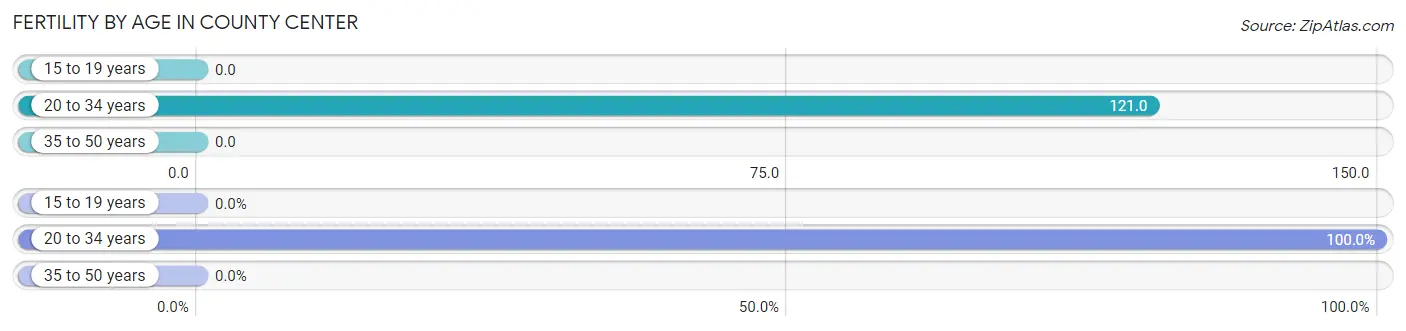
| Age Bracket | Women with Births | Births / 1,000 Women |
| 15 to 19 years | 0 (0.0%) | 0.0 |
| 20 to 34 years | 28 (100.0%) | 121.0 |
| 35 to 50 years | 0 (0.0%) | 0.0 |
| Total | 28 (100.0%) | 31.0 |
Fertility by Age by Marriage Status in County Center

| Age Bracket | Married | Unmarried |
| 15 to 19 years | 0 (0.0%) | 0 (0.0%) |
| 20 to 34 years | 0 (0.0%) | 28 (100.0%) |
| 35 to 50 years | 0 (0.0%) | 0 (0.0%) |
| Total | 0 (0.0%) | 28 (100.0%) |
Fertility by Education in County Center
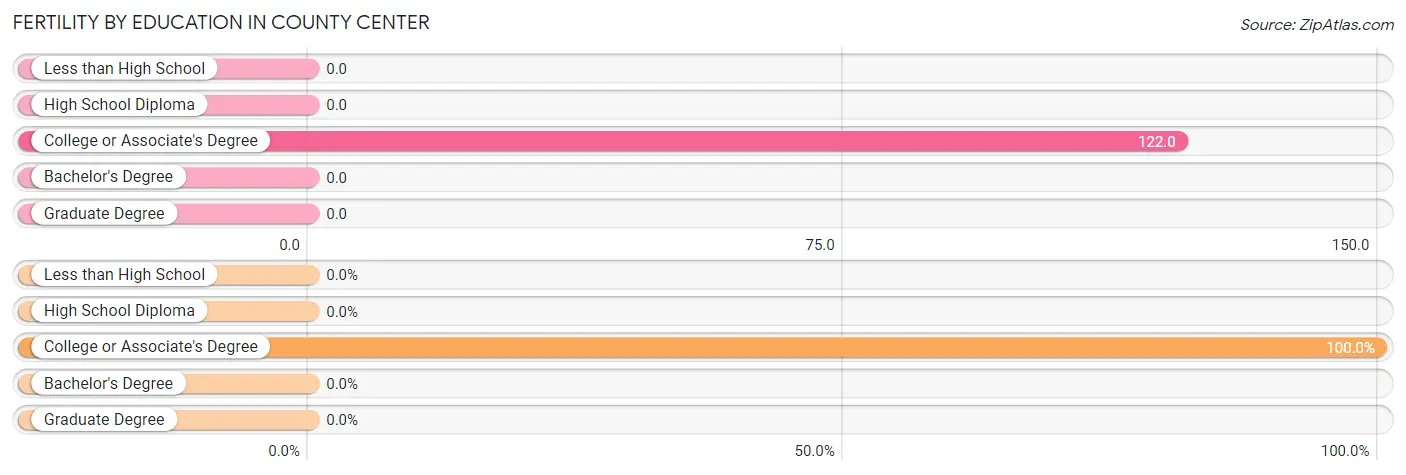
| Educational Attainment | Women with Births | Births / 1,000 Women |
| Less than High School | 0 (0.0%) | 0.0 |
| High School Diploma | 0 (0.0%) | 0.0 |
| College or Associate's Degree | 28 (100.0%) | 122.0 |
| Bachelor's Degree | 0 (0.0%) | 0.0 |
| Graduate Degree | 0 (0.0%) | 0.0 |
| Total | 28 (100.0%) | 31.0 |
Fertility by Education by Marriage Status in County Center
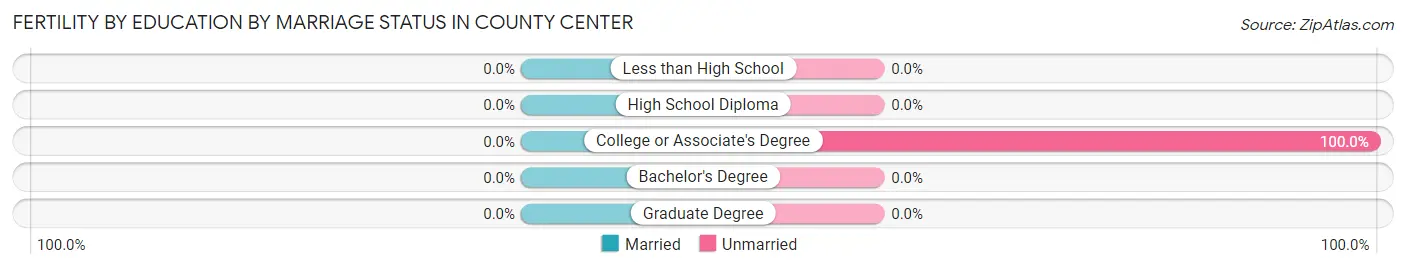
| Educational Attainment | Married | Unmarried |
| Less than High School | 0 (0.0%) | 0 (0.0%) |
| High School Diploma | 0 (0.0%) | 0 (0.0%) |
| College or Associate's Degree | 0 (0.0%) | 28 (100.0%) |
| Bachelor's Degree | 0 (0.0%) | 0 (0.0%) |
| Graduate Degree | 0 (0.0%) | 0 (0.0%) |
| Total | 0 (0.0%) | 28 (100.0%) |
Income in County Center
Income Overview in County Center
Per Capita Income in County Center is $61,468, while median incomes of families and households are $181,938 and $182,250 respectively.
| Characteristic | Number | Measure |
| Per Capita Income | 4,024 | $61,468 |
| Median Family Income | 983 | $181,938 |
| Mean Family Income | 983 | $213,201 |
| Median Household Income | 1,156 | $182,250 |
| Mean Household Income | 1,156 | $208,279 |
| Income Deficit | 983 | $0 |
| Wage / Income Gap (%) | 4,024 | 36.97% |
| Wage / Income Gap ($) | 4,024 | 63.03¢ per $1 |
| Gini / Inequality Index | 4,024 | 0.42 |
Earnings by Sex in County Center
Average Earnings in County Center are $69,009, $94,205 for men and $59,375 for women, a difference of 37.0%.
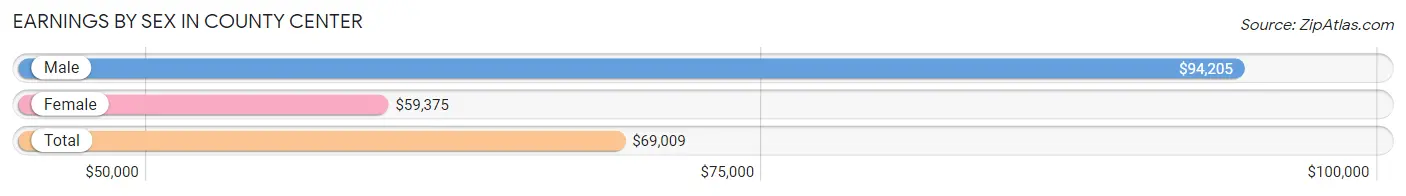
| Sex | Number | Average Earnings |
| Male | 1,133 (49.5%) | $94,205 |
| Female | 1,155 (50.5%) | $59,375 |
| Total | 2,288 (100.0%) | $69,009 |
Earnings by Sex by Income Bracket in County Center
The most common earnings brackets in County Center are $100,000+ for men (497 | 43.9%) and $100,000+ for women (373 | 32.3%).
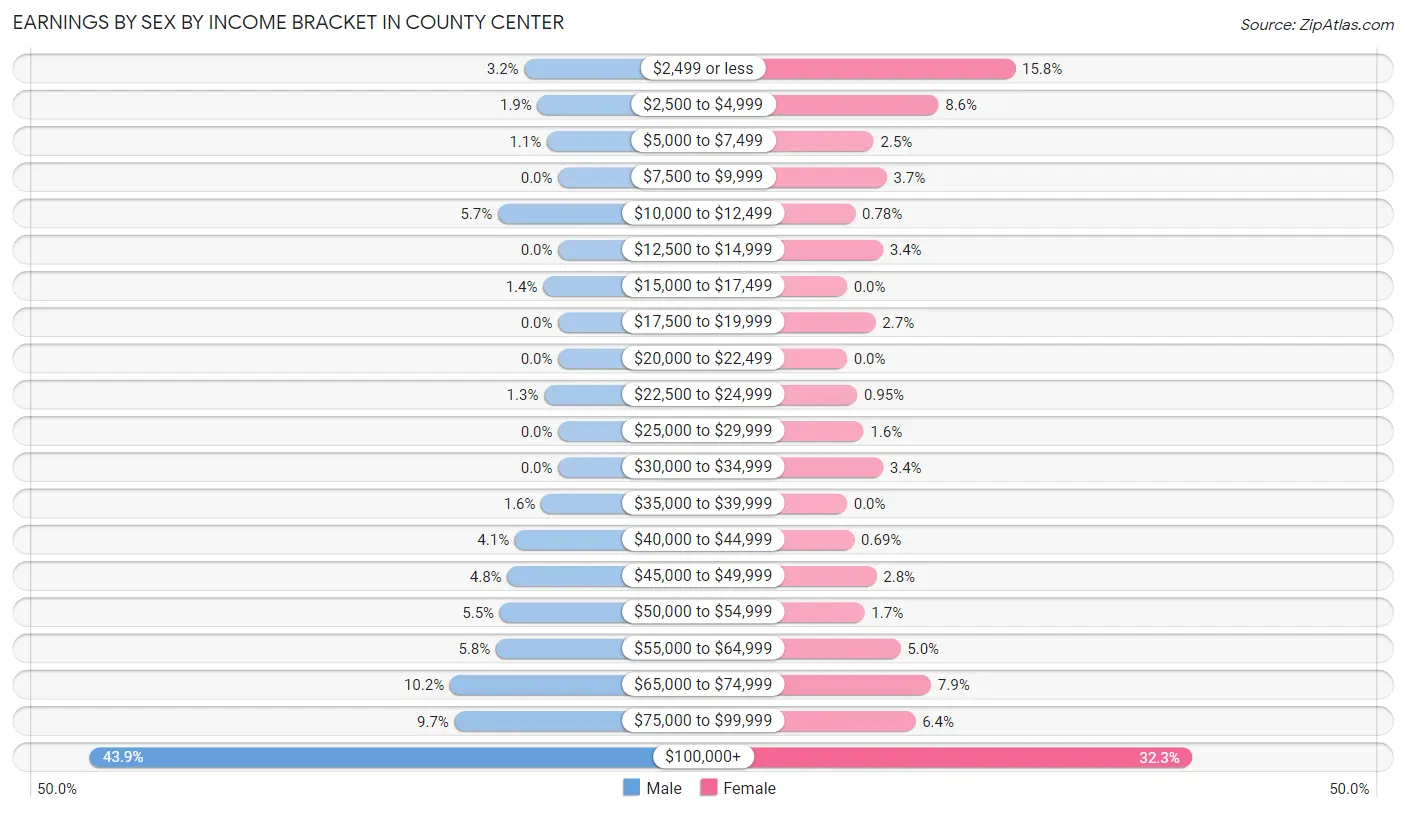
| Income | Male | Female |
| $2,499 or less | 36 (3.2%) | 182 (15.8%) |
| $2,500 to $4,999 | 22 (1.9%) | 99 (8.6%) |
| $5,000 to $7,499 | 12 (1.1%) | 29 (2.5%) |
| $7,500 to $9,999 | 0 (0.0%) | 43 (3.7%) |
| $10,000 to $12,499 | 64 (5.7%) | 9 (0.8%) |
| $12,500 to $14,999 | 0 (0.0%) | 39 (3.4%) |
| $15,000 to $17,499 | 16 (1.4%) | 0 (0.0%) |
| $17,500 to $19,999 | 0 (0.0%) | 31 (2.7%) |
| $20,000 to $22,499 | 0 (0.0%) | 0 (0.0%) |
| $22,500 to $24,999 | 15 (1.3%) | 11 (0.9%) |
| $25,000 to $29,999 | 0 (0.0%) | 18 (1.6%) |
| $30,000 to $34,999 | 0 (0.0%) | 39 (3.4%) |
| $35,000 to $39,999 | 18 (1.6%) | 0 (0.0%) |
| $40,000 to $44,999 | 46 (4.1%) | 8 (0.7%) |
| $45,000 to $49,999 | 54 (4.8%) | 32 (2.8%) |
| $50,000 to $54,999 | 62 (5.5%) | 19 (1.7%) |
| $55,000 to $64,999 | 66 (5.8%) | 58 (5.0%) |
| $65,000 to $74,999 | 115 (10.2%) | 91 (7.9%) |
| $75,000 to $99,999 | 110 (9.7%) | 74 (6.4%) |
| $100,000+ | 497 (43.9%) | 373 (32.3%) |
| Total | 1,133 (100.0%) | 1,155 (100.0%) |
Earnings by Sex by Educational Attainment in County Center
Average earnings in County Center are $113,464 for men and $68,734 for women, a difference of 39.4%. Men with an educational attainment of graduate degree enjoy the highest average annual earnings of $141,167, while those with college or associate's degree education earn the least with $56,384. Women with an educational attainment of graduate degree earn the most with the average annual earnings of $105,000, while those with high school diploma education have the smallest earnings of $13,654.
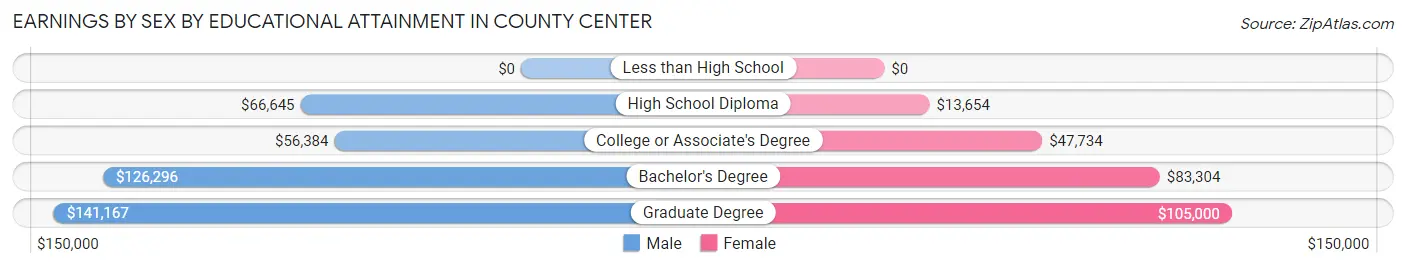
| Educational Attainment | Male Income | Female Income |
| Less than High School | - | - |
| High School Diploma | $66,645 | $13,654 |
| College or Associate's Degree | $56,384 | $47,734 |
| Bachelor's Degree | $126,296 | $83,304 |
| Graduate Degree | $141,167 | $105,000 |
| Total | $113,464 | $68,734 |
Family Income in County Center
Family Income Brackets in County Center
According to the County Center family income data, there are 398 families falling into the $200,000+ income range, which is the most common income bracket and makes up 40.5% of all families.
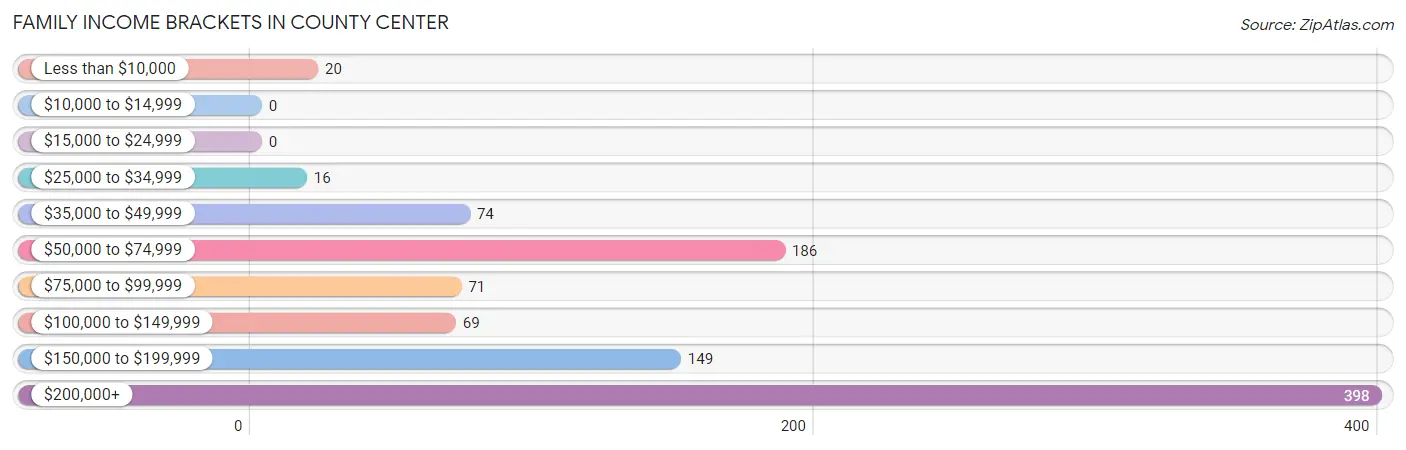
| Income Bracket | # Families | % Families |
| Less than $10,000 | 20 | 2.0% |
| $10,000 to $14,999 | 0 | 0.0% |
| $15,000 to $24,999 | 0 | 0.0% |
| $25,000 to $34,999 | 16 | 1.6% |
| $35,000 to $49,999 | 74 | 7.5% |
| $50,000 to $74,999 | 186 | 18.9% |
| $75,000 to $99,999 | 71 | 7.2% |
| $100,000 to $149,999 | 69 | 7.0% |
| $150,000 to $199,999 | 149 | 15.2% |
| $200,000+ | 398 | 40.5% |
Family Income by Famaliy Size in County Center
4-person families (196 | 19.9%) account for the highest median family income in County Center with $248,500 per family, while 2-person families (309 | 31.4%) have the highest median income of $88,958 per family member.
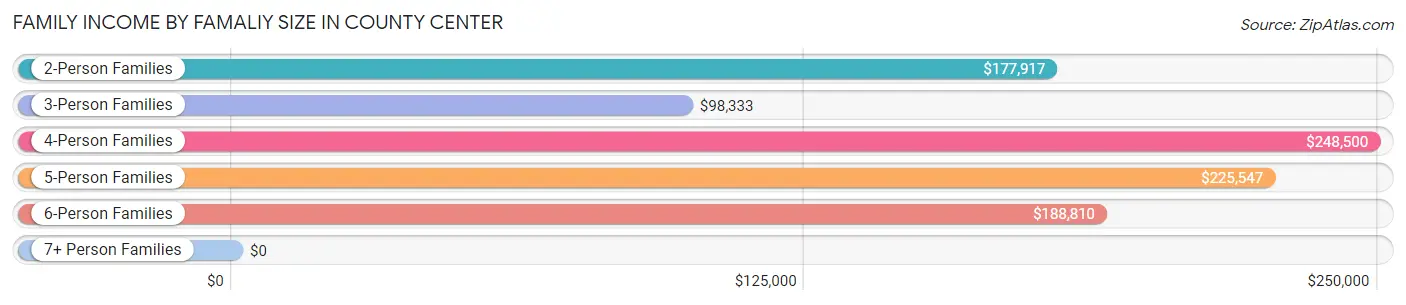
| Income Bracket | # Families | Median Income |
| 2-Person Families | 309 (31.4%) | $177,917 |
| 3-Person Families | 262 (26.7%) | $98,333 |
| 4-Person Families | 196 (19.9%) | $248,500 |
| 5-Person Families | 103 (10.5%) | $225,547 |
| 6-Person Families | 66 (6.7%) | $188,810 |
| 7+ Person Families | 47 (4.8%) | $0 |
| Total | 983 (100.0%) | $181,938 |
Family Income by Number of Earners in County Center
The median family income in County Center is $181,938, with families comprising 3+ earners (187) having the highest median family income of $248,125, while families with 1 earner (302) have the lowest median family income of $69,469, accounting for 19.0% and 30.7% of families, respectively.
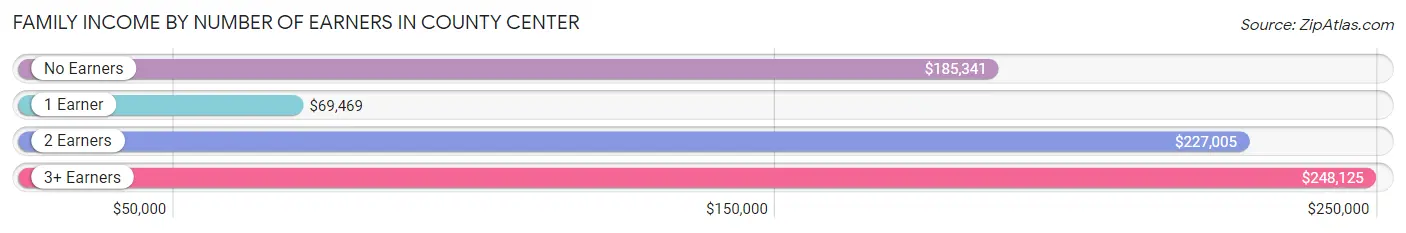
| Number of Earners | # Families | Median Income |
| No Earners | 39 (4.0%) | $185,341 |
| 1 Earner | 302 (30.7%) | $69,469 |
| 2 Earners | 455 (46.3%) | $227,005 |
| 3+ Earners | 187 (19.0%) | $248,125 |
| Total | 983 (100.0%) | $181,938 |
Household Income in County Center
Household Income Brackets in County Center
With 447 households falling in the category, the $200,000+ income range is the most frequent in County Center, accounting for 38.7% of all households.
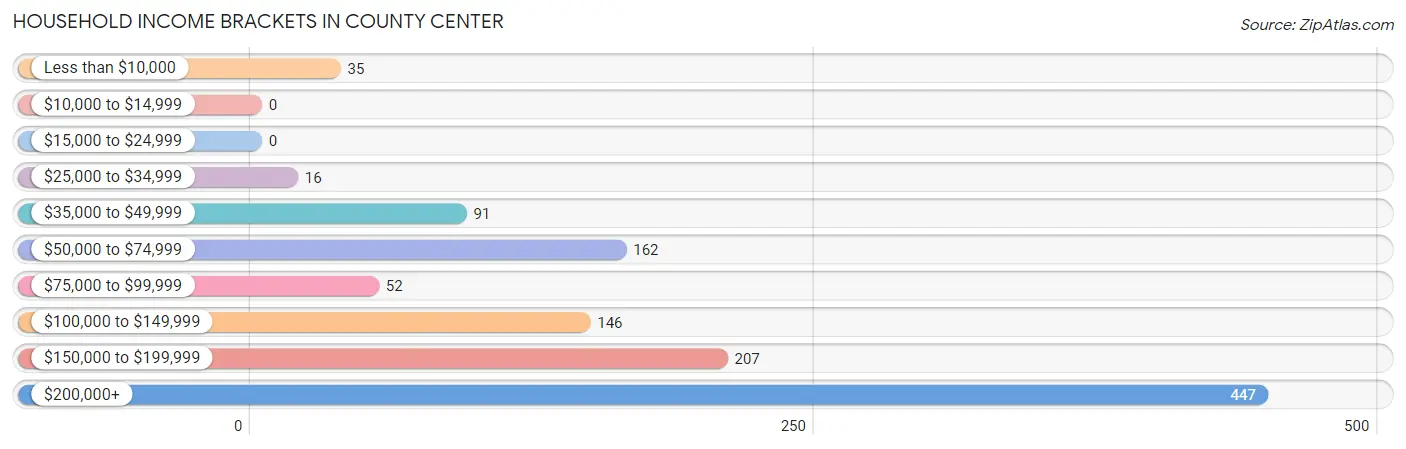
| Income Bracket | # Households | % Households |
| Less than $10,000 | 35 | 3.0% |
| $10,000 to $14,999 | 0 | 0.0% |
| $15,000 to $24,999 | 0 | 0.0% |
| $25,000 to $34,999 | 16 | 1.4% |
| $35,000 to $49,999 | 91 | 7.9% |
| $50,000 to $74,999 | 162 | 14.0% |
| $75,000 to $99,999 | 52 | 4.5% |
| $100,000 to $149,999 | 146 | 12.6% |
| $150,000 to $199,999 | 207 | 17.9% |
| $200,000+ | 447 | 38.7% |
Household Income by Householder Age in County Center
The median household income in County Center is $182,250, with the highest median household income of $187,273 found in the 65+ years age bracket for the primary householder. A total of 190 households (16.4%) fall into this category.
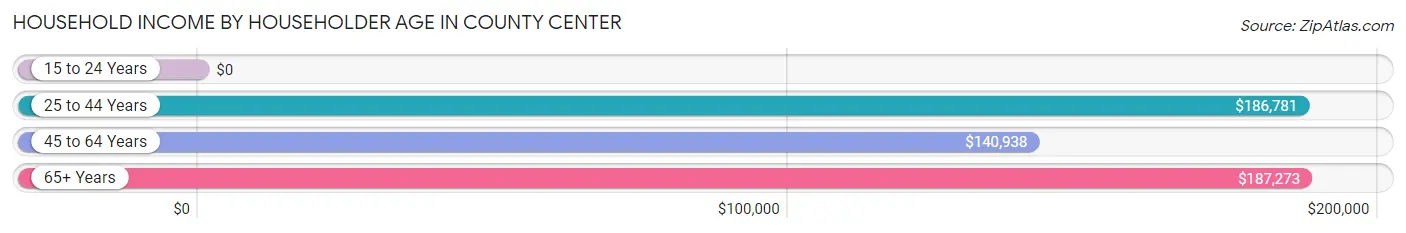
| Income Bracket | # Households | Median Income |
| 15 to 24 Years | 0 (0.0%) | $0 |
| 25 to 44 Years | 393 (34.0%) | $186,781 |
| 45 to 64 Years | 573 (49.6%) | $140,938 |
| 65+ Years | 190 (16.4%) | $187,273 |
| Total | 1,156 (100.0%) | $182,250 |
Poverty in County Center
Income Below Poverty by Sex and Age in County Center
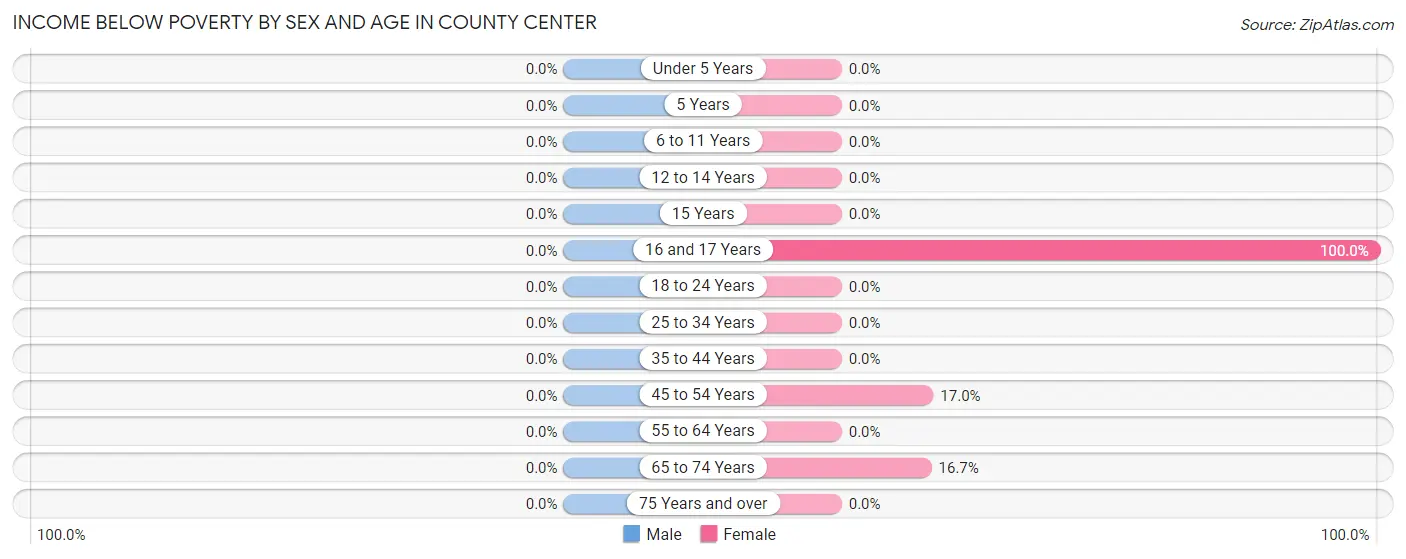
| Age Bracket | Male | Female |
| Under 5 Years | 0 (0.0%) | 0 (0.0%) |
| 5 Years | 0 (0.0%) | 0 (0.0%) |
| 6 to 11 Years | 0 (0.0%) | 0 (0.0%) |
| 12 to 14 Years | 0 (0.0%) | 0 (0.0%) |
| 15 Years | 0 (0.0%) | 0 (0.0%) |
| 16 and 17 Years | 0 (0.0%) | 21 (100.0%) |
| 18 to 24 Years | 0 (0.0%) | 0 (0.0%) |
| 25 to 34 Years | 0 (0.0%) | 0 (0.0%) |
| 35 to 44 Years | 0 (0.0%) | 0 (0.0%) |
| 45 to 54 Years | 0 (0.0%) | 84 (17.0%) |
| 55 to 64 Years | 0 (0.0%) | 0 (0.0%) |
| 65 to 74 Years | 0 (0.0%) | 15 (16.7%) |
| 75 Years and over | 0 (0.0%) | 0 (0.0%) |
| Total | 0 (0.0%) | 120 (5.6%) |
Income Above Poverty by Sex and Age in County Center
According to the poverty statistics in County Center, males aged under 5 years and females aged under 5 years are the age groups that are most secure financially, with 100.0% of males and 100.0% of females in these age groups living above the poverty line.
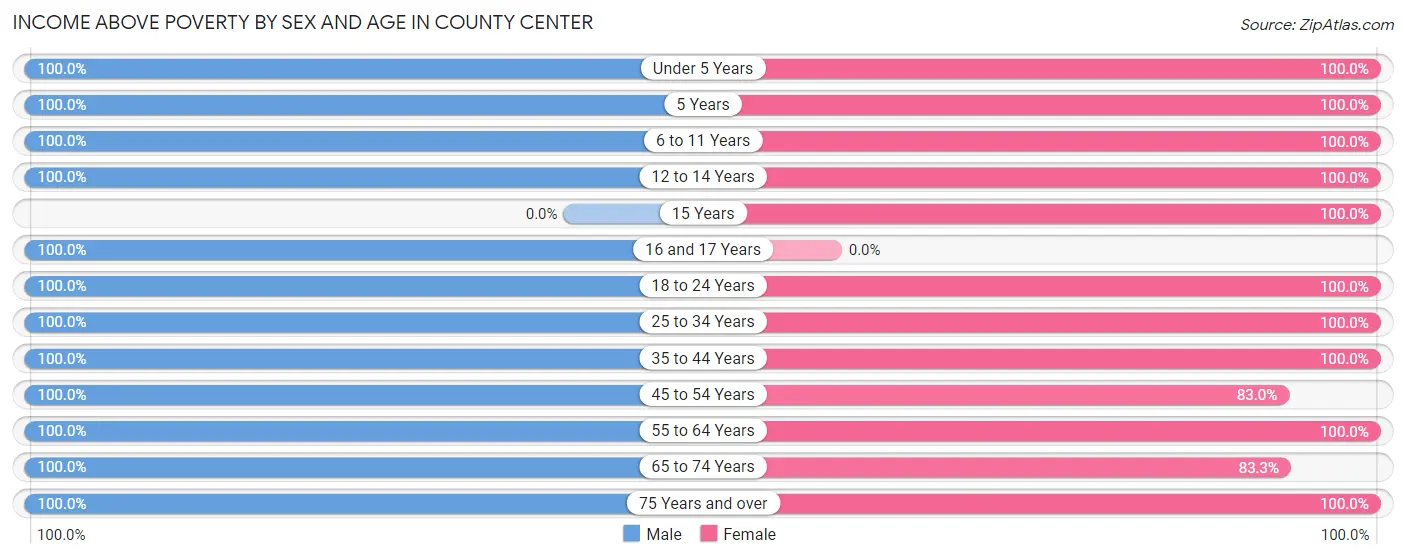
| Age Bracket | Male | Female |
| Under 5 Years | 170 (100.0%) | 76 (100.0%) |
| 5 Years | 14 (100.0%) | 43 (100.0%) |
| 6 to 11 Years | 290 (100.0%) | 326 (100.0%) |
| 12 to 14 Years | 44 (100.0%) | 143 (100.0%) |
| 15 Years | 0 (0.0%) | 38 (100.0%) |
| 16 and 17 Years | 41 (100.0%) | 0 (0.0%) |
| 18 to 24 Years | 210 (100.0%) | 193 (100.0%) |
| 25 to 34 Years | 187 (100.0%) | 196 (100.0%) |
| 35 to 44 Years | 162 (100.0%) | 221 (100.0%) |
| 45 to 54 Years | 384 (100.0%) | 410 (83.0%) |
| 55 to 64 Years | 229 (100.0%) | 217 (100.0%) |
| 65 to 74 Years | 127 (100.0%) | 75 (83.3%) |
| 75 Years and over | 39 (100.0%) | 69 (100.0%) |
| Total | 1,897 (100.0%) | 2,007 (94.4%) |
Income Below Poverty Among Married-Couple Families in County Center
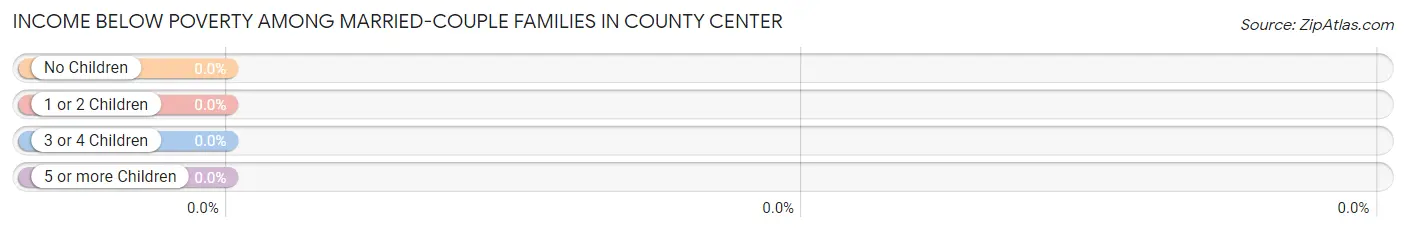
| Children | Above Poverty | Below Poverty |
| No Children | 262 (100.0%) | 0 (0.0%) |
| 1 or 2 Children | 275 (100.0%) | 0 (0.0%) |
| 3 or 4 Children | 134 (100.0%) | 0 (0.0%) |
| 5 or more Children | 0 (0.0%) | 0 (0.0%) |
| Total | 671 (100.0%) | 0 (0.0%) |
Income Below Poverty Among Single-Parent Households in County Center
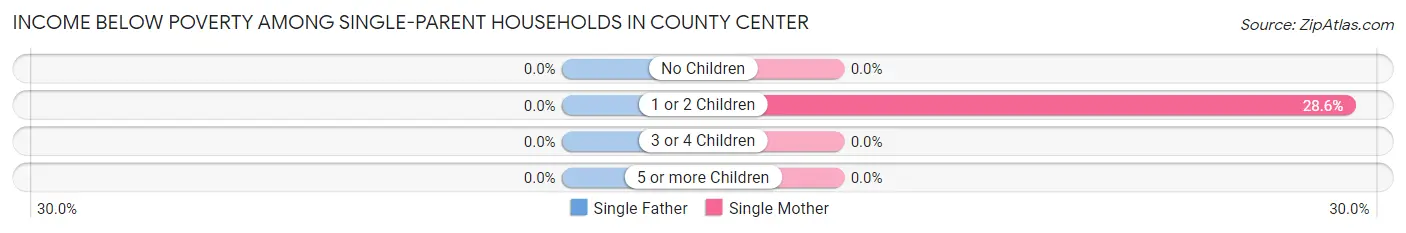
| Children | Single Father | Single Mother |
| No Children | 0 (0.0%) | 0 (0.0%) |
| 1 or 2 Children | 0 (0.0%) | 20 (28.6%) |
| 3 or 4 Children | 0 (0.0%) | 0 (0.0%) |
| 5 or more Children | 0 (0.0%) | 0 (0.0%) |
| Total | 0 (0.0%) | 20 (12.8%) |
Income Below Poverty Among Married-Couple vs Single-Parent Households in County Center
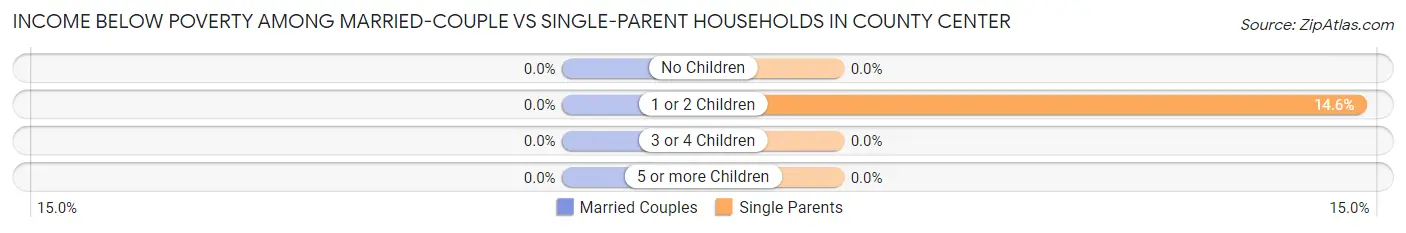
| Children | Married-Couple Families | Single-Parent Households |
| No Children | 0 (0.0%) | 0 (0.0%) |
| 1 or 2 Children | 0 (0.0%) | 20 (14.6%) |
| 3 or 4 Children | 0 (0.0%) | 0 (0.0%) |
| 5 or more Children | 0 (0.0%) | 0 (0.0%) |
| Total | 0 (0.0%) | 20 (6.4%) |
Employment Characteristics in County Center
Employment by Class of Employer in County Center
Among the 2,055 employed individuals in County Center, private company employees (942 | 45.8%), federal government employees (459 | 22.3%), and local government employees (201 | 9.8%) make up the most common classes of employment.
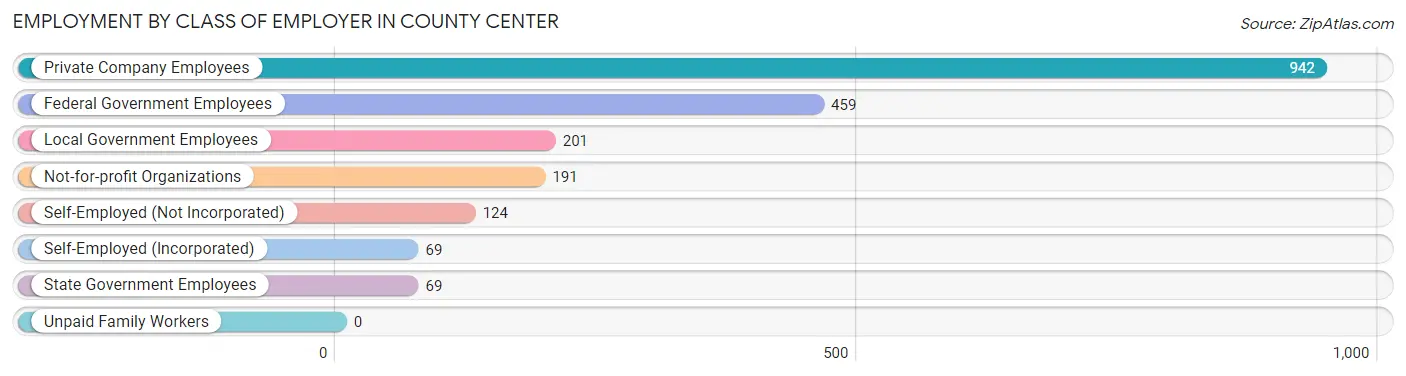
| Employer Class | # Employees | % Employees |
| Private Company Employees | 942 | 45.8% |
| Self-Employed (Incorporated) | 69 | 3.4% |
| Self-Employed (Not Incorporated) | 124 | 6.0% |
| Not-for-profit Organizations | 191 | 9.3% |
| Local Government Employees | 201 | 9.8% |
| State Government Employees | 69 | 3.4% |
| Federal Government Employees | 459 | 22.3% |
| Unpaid Family Workers | 0 | 0.0% |
| Total | 2,055 | 100.0% |
Employment Status by Age in County Center
According to the labor force statistics for County Center, out of the total population over 16 years of age (2,880), 77.3% or 2,226 individuals are in the labor force, with 7.3% or 162 of them unemployed. The age group with the highest labor force participation rate is 35 to 44 years, with 100.0% or 383 individuals in the labor force. Within the labor force, the 20 to 24 years age range has the highest percentage of unemployed individuals, with 30.5% or 50 of them being unemployed.
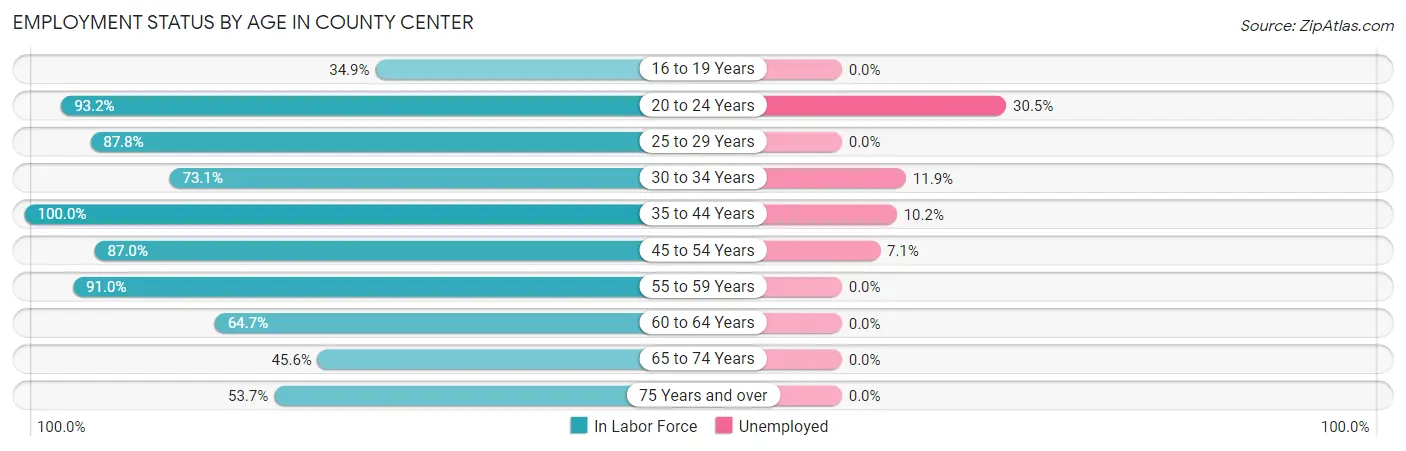
| Age Bracket | In Labor Force | Unemployed |
| 16 to 19 Years | 101 (34.9%) | 0 (0.0%) |
| 20 to 24 Years | 164 (93.2%) | 50 (30.5%) |
| 25 to 29 Years | 137 (87.8%) | 0 (0.0%) |
| 30 to 34 Years | 166 (73.1%) | 20 (11.9%) |
| 35 to 44 Years | 383 (100.0%) | 39 (10.2%) |
| 45 to 54 Years | 764 (87.0%) | 54 (7.1%) |
| 55 to 59 Years | 223 (91.0%) | 0 (0.0%) |
| 60 to 64 Years | 130 (64.7%) | 0 (0.0%) |
| 65 to 74 Years | 99 (45.6%) | 0 (0.0%) |
| 75 Years and over | 58 (53.7%) | 0 (0.0%) |
| Total | 2,226 (77.3%) | 162 (7.3%) |
Employment Status by Educational Attainment in County Center
According to labor force statistics for County Center, 86.3% of individuals (1,804) out of the total population between 25 and 64 years of age (2,090) are in the labor force, with 6.2% or 112 of them being unemployed. The group with the highest labor force participation rate are those with the educational attainment of college / associate degree, with 94.3% or 465 individuals in the labor force. Within the labor force, individuals with high school diploma education have the highest percentage of unemployment, with 14.4% or 37 of them being unemployed.
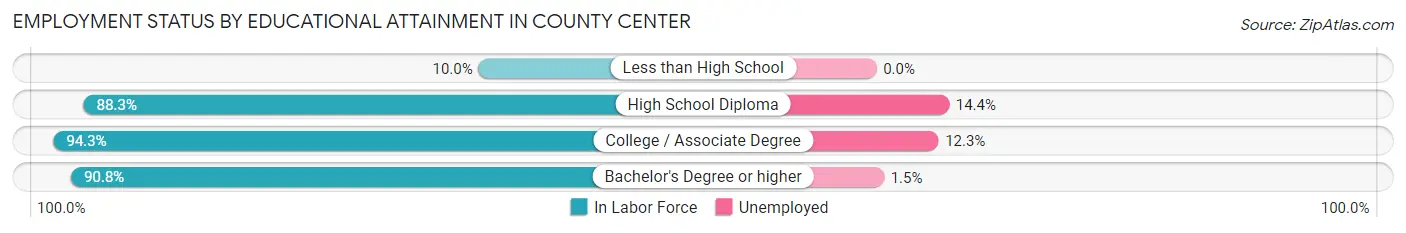
| Educational Attainment | In Labor Force | Unemployed |
| Less than High School | 13 (10.0%) | 0 (0.0%) |
| High School Diploma | 257 (88.3%) | 42 (14.4%) |
| College / Associate Degree | 465 (94.3%) | 61 (12.3%) |
| Bachelor's Degree or higher | 1,068 (90.8%) | 18 (1.5%) |
| Total | 1,804 (86.3%) | 130 (6.2%) |
Employment Occupations by Sex in County Center
Management, Business, Science and Arts Occupations
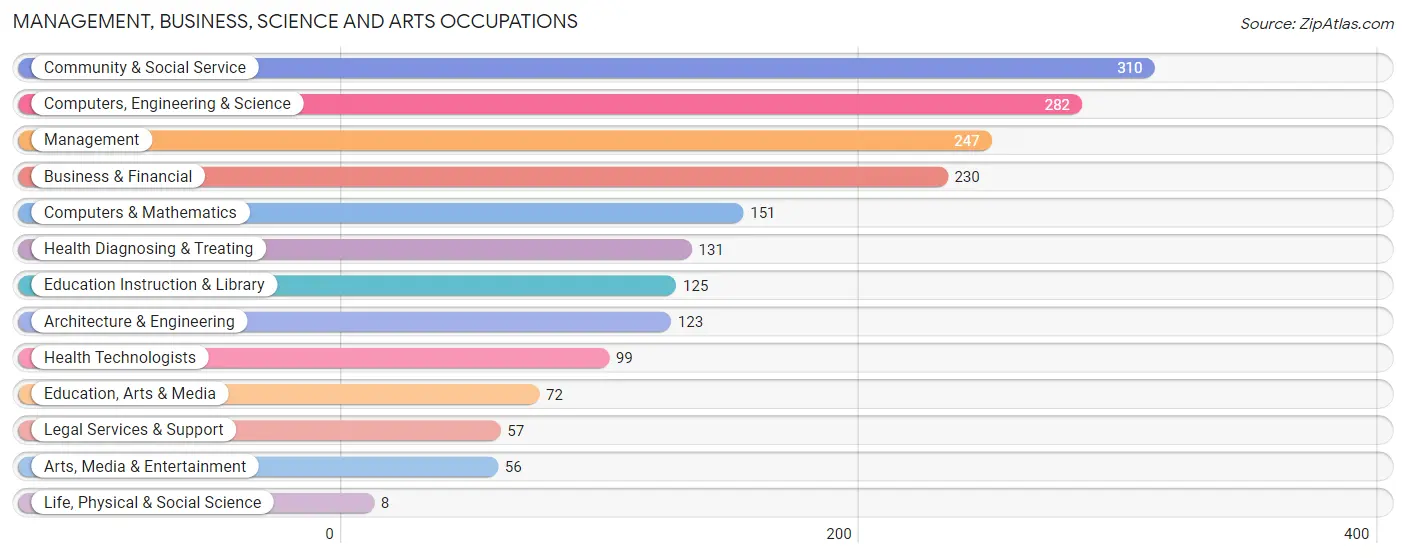
The most common Management, Business, Science and Arts occupations in County Center are Community & Social Service (310 | 15.3%), Computers, Engineering & Science (282 | 13.9%), Management (247 | 12.2%), Business & Financial (230 | 11.3%), and Computers & Mathematics (151 | 7.4%).
Management, Business, Science and Arts Occupations by Sex
Within the Management, Business, Science and Arts occupations in County Center, the most male-oriented occupations are Arts, Media & Entertainment (75.0%), Management (61.1%), and Architecture & Engineering (60.2%), while the most female-oriented occupations are Life, Physical & Social Science (100.0%), Education Instruction & Library (95.2%), and Education, Arts & Media (86.1%).
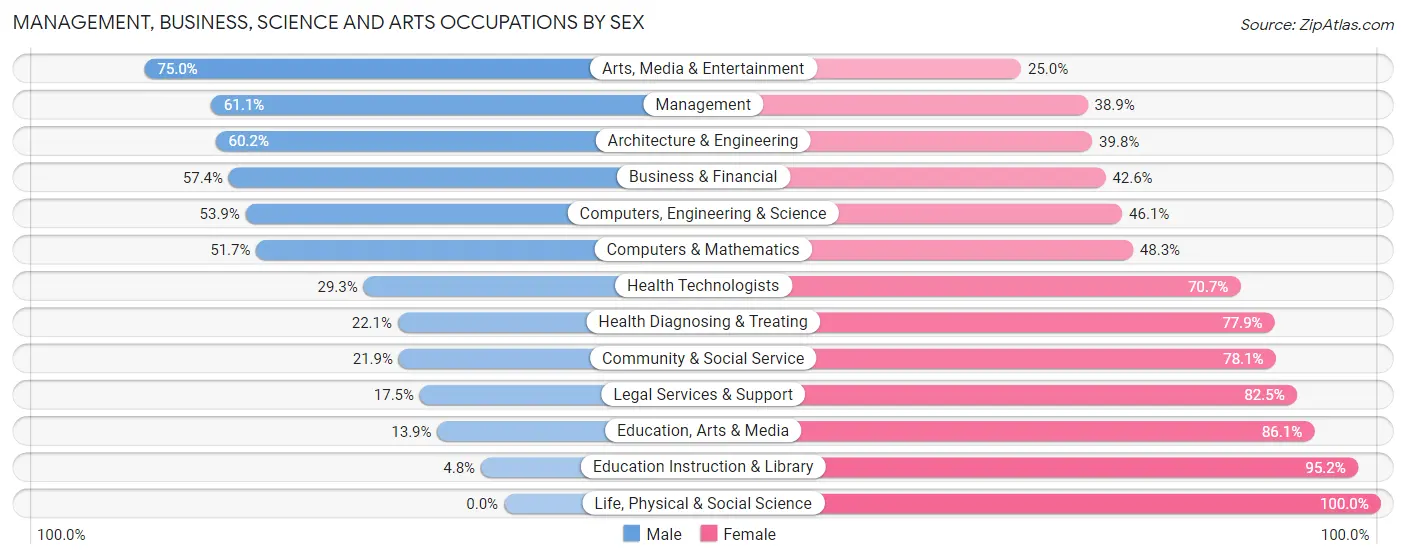
| Occupation | Male | Female |
| Management | 151 (61.1%) | 96 (38.9%) |
| Business & Financial | 132 (57.4%) | 98 (42.6%) |
| Computers, Engineering & Science | 152 (53.9%) | 130 (46.1%) |
| Computers & Mathematics | 78 (51.7%) | 73 (48.3%) |
| Architecture & Engineering | 74 (60.2%) | 49 (39.8%) |
| Life, Physical & Social Science | 0 (0.0%) | 8 (100.0%) |
| Community & Social Service | 68 (21.9%) | 242 (78.1%) |
| Education, Arts & Media | 10 (13.9%) | 62 (86.1%) |
| Legal Services & Support | 10 (17.5%) | 47 (82.5%) |
| Education Instruction & Library | 6 (4.8%) | 119 (95.2%) |
| Arts, Media & Entertainment | 42 (75.0%) | 14 (25.0%) |
| Health Diagnosing & Treating | 29 (22.1%) | 102 (77.9%) |
| Health Technologists | 29 (29.3%) | 70 (70.7%) |
| Total (Category) | 532 (44.3%) | 668 (55.7%) |
| Total (Overall) | 1,049 (51.6%) | 982 (48.3%) |
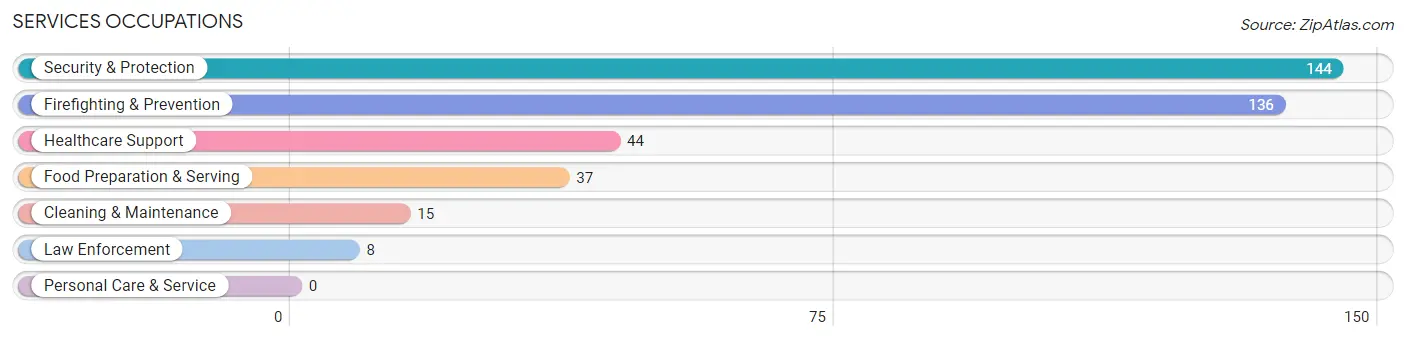
Services Occupations
The most common Services occupations in County Center are Security & Protection (144 | 7.1%), Firefighting & Prevention (136 | 6.7%), Healthcare Support (44 | 2.2%), Food Preparation & Serving (37 | 1.8%), and Cleaning & Maintenance (15 | 0.7%).
Services Occupations by Sex
Within the Services occupations in County Center, the most male-oriented occupations are Law Enforcement (100.0%), Security & Protection (73.6%), and Firefighting & Prevention (72.1%), while the most female-oriented occupations are Food Preparation & Serving (100.0%), Cleaning & Maintenance (100.0%), and Healthcare Support (59.1%).
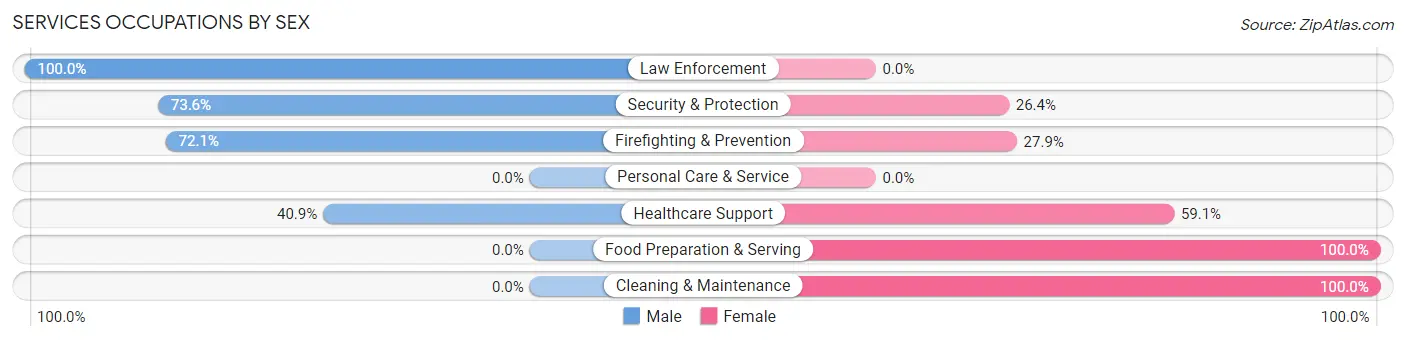
| Occupation | Male | Female |
| Healthcare Support | 18 (40.9%) | 26 (59.1%) |
| Security & Protection | 106 (73.6%) | 38 (26.4%) |
| Firefighting & Prevention | 98 (72.1%) | 38 (27.9%) |
| Law Enforcement | 8 (100.0%) | 0 (0.0%) |
| Food Preparation & Serving | 0 (0.0%) | 37 (100.0%) |
| Cleaning & Maintenance | 0 (0.0%) | 15 (100.0%) |
| Personal Care & Service | 0 (0.0%) | 0 (0.0%) |
| Total (Category) | 124 (51.7%) | 116 (48.3%) |
| Total (Overall) | 1,049 (51.6%) | 982 (48.3%) |
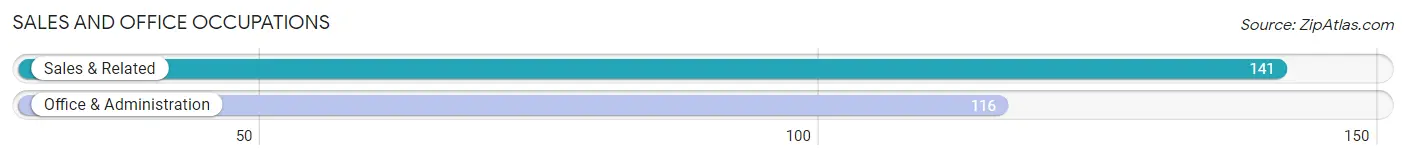
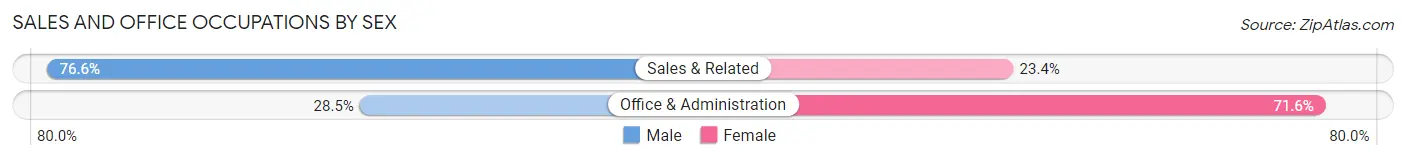
Sales and Office Occupations
The most common Sales and Office occupations in County Center are Sales & Related (141 | 6.9%), and Office & Administration (116 | 5.7%).
Sales and Office Occupations by Sex
| Occupation | Male | Female |
| Sales & Related | 108 (76.6%) | 33 (23.4%) |
| Office & Administration | 33 (28.4%) | 83 (71.6%) |
| Total (Category) | 141 (54.9%) | 116 (45.1%) |
| Total (Overall) | 1,049 (51.6%) | 982 (48.3%) |
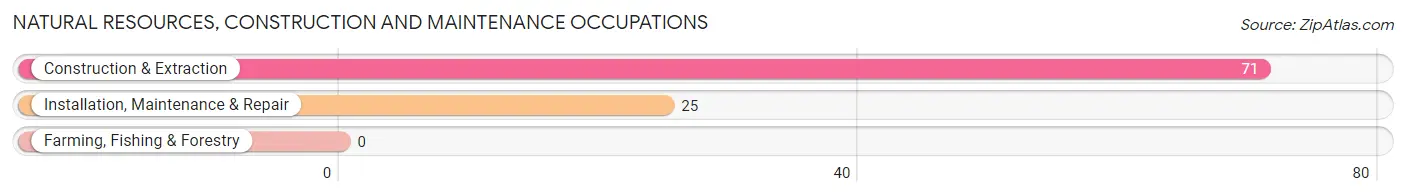
Natural Resources, Construction and Maintenance Occupations
The most common Natural Resources, Construction and Maintenance occupations in County Center are Construction & Extraction (71 | 3.5%), and Installation, Maintenance & Repair (25 | 1.2%).
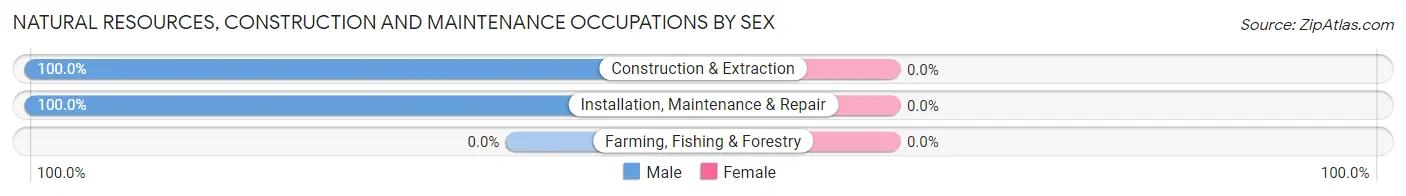
Natural Resources, Construction and Maintenance Occupations by Sex
| Occupation | Male | Female |
| Farming, Fishing & Forestry | 0 (0.0%) | 0 (0.0%) |
| Construction & Extraction | 71 (100.0%) | 0 (0.0%) |
| Installation, Maintenance & Repair | 25 (100.0%) | 0 (0.0%) |
| Total (Category) | 96 (100.0%) | 0 (0.0%) |
| Total (Overall) | 1,049 (51.6%) | 982 (48.3%) |
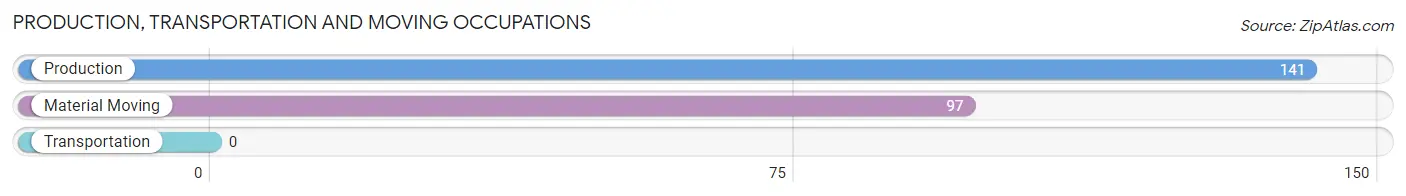
Production, Transportation and Moving Occupations
The most common Production, Transportation and Moving occupations in County Center are Production (141 | 6.9%), and Material Moving (97 | 4.8%).
Production, Transportation and Moving Occupations by Sex
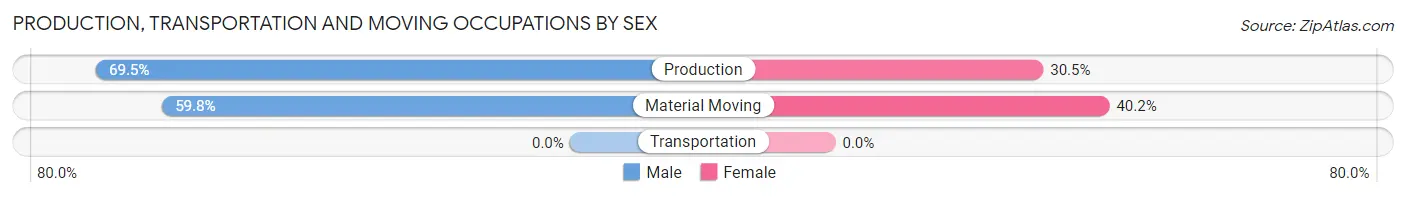
| Occupation | Male | Female |
| Production | 98 (69.5%) | 43 (30.5%) |
| Transportation | 0 (0.0%) | 0 (0.0%) |
| Material Moving | 58 (59.8%) | 39 (40.2%) |
| Total (Category) | 156 (65.5%) | 82 (34.4%) |
| Total (Overall) | 1,049 (51.6%) | 982 (48.3%) |
Employment Industries by Sex in County Center
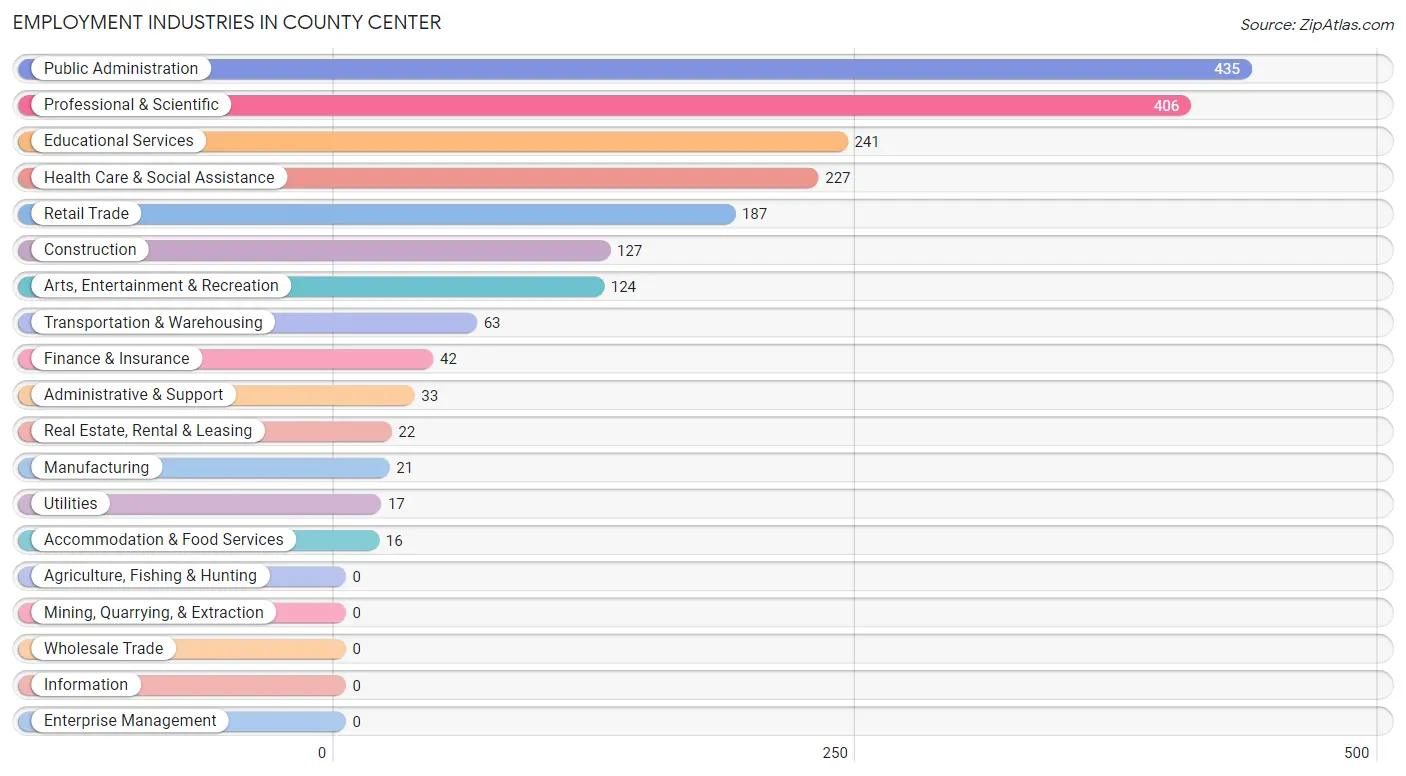
Employment Industries in County Center
The major employment industries in County Center include Public Administration (435 | 21.4%), Professional & Scientific (406 | 20.0%), Educational Services (241 | 11.9%), Health Care & Social Assistance (227 | 11.2%), and Retail Trade (187 | 9.2%).
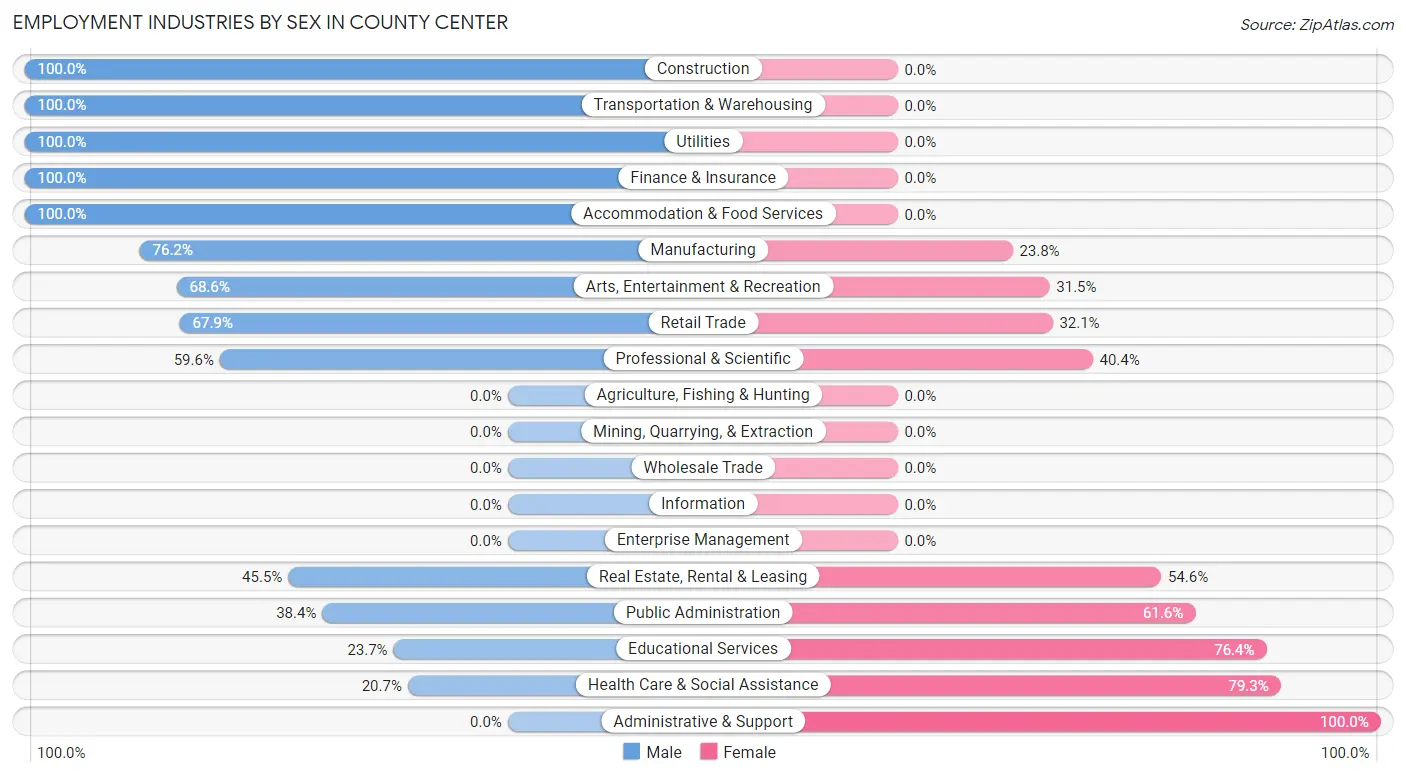
Employment Industries by Sex in County Center
The County Center industries that see more men than women are Construction (100.0%), Transportation & Warehousing (100.0%), and Utilities (100.0%), whereas the industries that tend to have a higher number of women are Administrative & Support (100.0%), Health Care & Social Assistance (79.3%), and Educational Services (76.3%).
| Industry | Male | Female |
| Agriculture, Fishing & Hunting | 0 (0.0%) | 0 (0.0%) |
| Mining, Quarrying, & Extraction | 0 (0.0%) | 0 (0.0%) |
| Construction | 127 (100.0%) | 0 (0.0%) |
| Manufacturing | 16 (76.2%) | 5 (23.8%) |
| Wholesale Trade | 0 (0.0%) | 0 (0.0%) |
| Retail Trade | 127 (67.9%) | 60 (32.1%) |
| Transportation & Warehousing | 63 (100.0%) | 0 (0.0%) |
| Utilities | 17 (100.0%) | 0 (0.0%) |
| Information | 0 (0.0%) | 0 (0.0%) |
| Finance & Insurance | 42 (100.0%) | 0 (0.0%) |
| Real Estate, Rental & Leasing | 10 (45.5%) | 12 (54.5%) |
| Professional & Scientific | 242 (59.6%) | 164 (40.4%) |
| Enterprise Management | 0 (0.0%) | 0 (0.0%) |
| Administrative & Support | 0 (0.0%) | 33 (100.0%) |
| Educational Services | 57 (23.6%) | 184 (76.3%) |
| Health Care & Social Assistance | 47 (20.7%) | 180 (79.3%) |
| Arts, Entertainment & Recreation | 85 (68.5%) | 39 (31.5%) |
| Accommodation & Food Services | 16 (100.0%) | 0 (0.0%) |
| Public Administration | 167 (38.4%) | 268 (61.6%) |
| Total | 1,049 (51.6%) | 982 (48.3%) |
Education in County Center
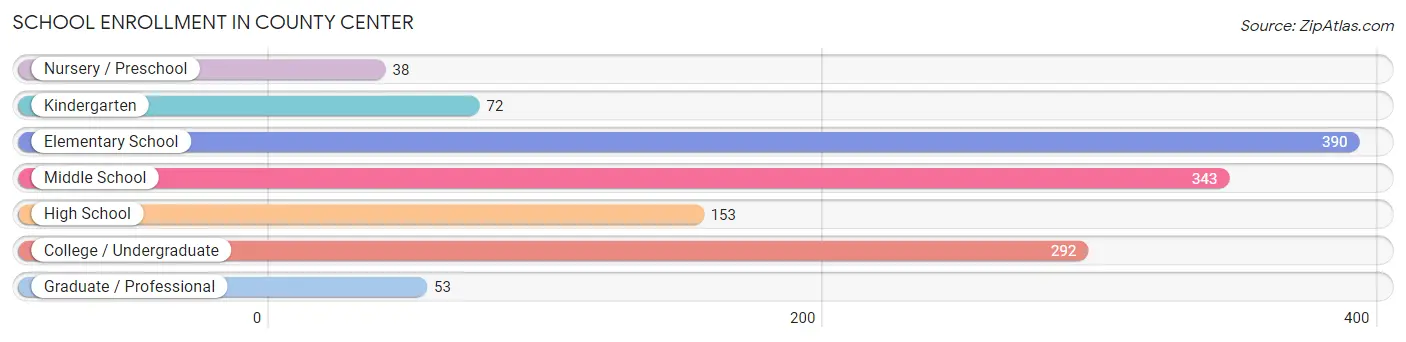
School Enrollment in County Center
The most common levels of schooling among the 1,341 students in County Center are elementary school (390 | 29.1%), middle school (343 | 25.6%), and college / undergraduate (292 | 21.8%).
| School Level | # Students | % Students |
| Nursery / Preschool | 38 | 2.8% |
| Kindergarten | 72 | 5.4% |
| Elementary School | 390 | 29.1% |
| Middle School | 343 | 25.6% |
| High School | 153 | 11.4% |
| College / Undergraduate | 292 | 21.8% |
| Graduate / Professional | 53 | 4.0% |
| Total | 1,341 | 100.0% |
School Enrollment by Age by Funding Source in County Center
Out of a total of 1,341 students who are enrolled in schools in County Center, 153 (11.4%) attend a private institution, while the remaining 1,188 (88.6%) are enrolled in public schools. The age group of 3 to 4 year olds has the highest likelihood of being enrolled in private schools, with 54 (100.0% in the age bracket) enrolled. Conversely, the age group of 5 to 9 year old has the lowest likelihood of being enrolled in a private school, with 446 (100.0% in the age bracket) attending a public institution.
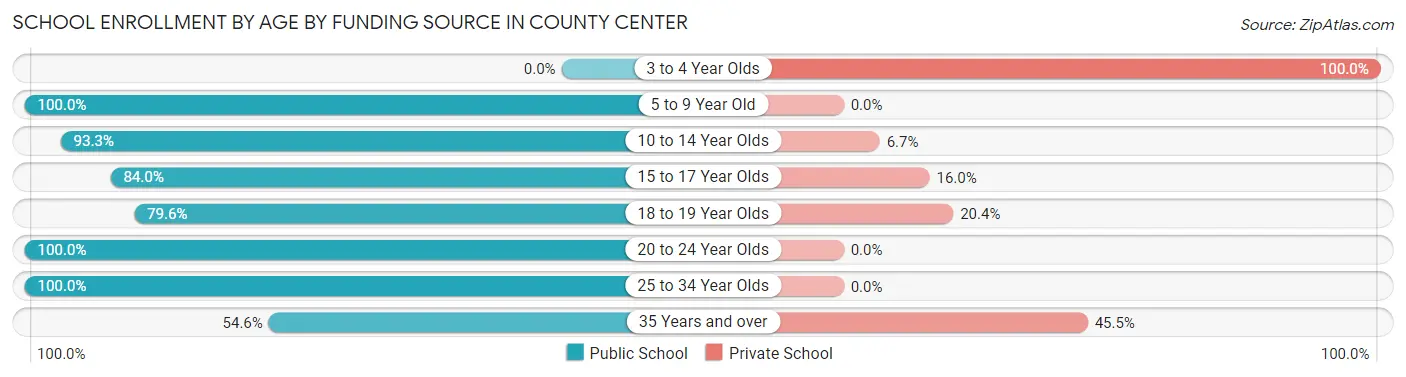
| Age Bracket | Public School | Private School |
| 3 to 4 Year Olds | 0 (0.0%) | 54 (100.0%) |
| 5 to 9 Year Old | 446 (100.0%) | 0 (0.0%) |
| 10 to 14 Year Olds | 320 (93.3%) | 23 (6.7%) |
| 15 to 17 Year Olds | 84 (84.0%) | 16 (16.0%) |
| 18 to 19 Year Olds | 156 (79.6%) | 40 (20.4%) |
| 20 to 24 Year Olds | 94 (100.0%) | 0 (0.0%) |
| 25 to 34 Year Olds | 64 (100.0%) | 0 (0.0%) |
| 35 Years and over | 24 (54.5%) | 20 (45.5%) |
| Total | 1,188 (88.6%) | 153 (11.4%) |
Educational Attainment by Field of Study in County Center
Business (474 | 31.8%), social sciences (189 | 12.7%), education (162 | 10.9%), computers & mathematics (155 | 10.4%), and arts & humanities (151 | 10.1%) are the most common fields of study among 1,492 individuals in County Center who have obtained a bachelor's degree or higher.
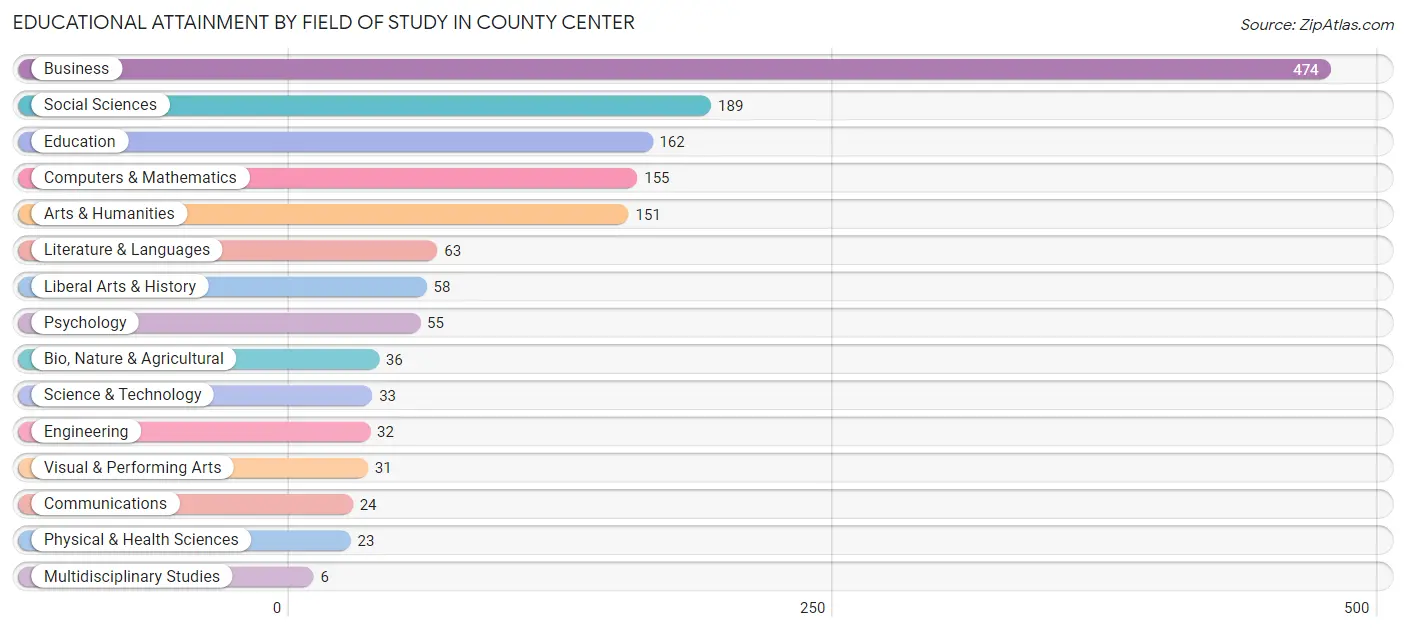
| Field of Study | # Graduates | % Graduates |
| Computers & Mathematics | 155 | 10.4% |
| Bio, Nature & Agricultural | 36 | 2.4% |
| Physical & Health Sciences | 23 | 1.5% |
| Psychology | 55 | 3.7% |
| Social Sciences | 189 | 12.7% |
| Engineering | 32 | 2.1% |
| Multidisciplinary Studies | 6 | 0.4% |
| Science & Technology | 33 | 2.2% |
| Business | 474 | 31.8% |
| Education | 162 | 10.9% |
| Literature & Languages | 63 | 4.2% |
| Liberal Arts & History | 58 | 3.9% |
| Visual & Performing Arts | 31 | 2.1% |
| Communications | 24 | 1.6% |
| Arts & Humanities | 151 | 10.1% |
| Total | 1,492 | 100.0% |
Transportation & Commute in County Center
Vehicle Availability by Sex in County Center
The most prevalent vehicle ownership categories in County Center are males with 2 vehicles (442, accounting for 41.2%) and females with 2 vehicles (387, making up 45.0%).
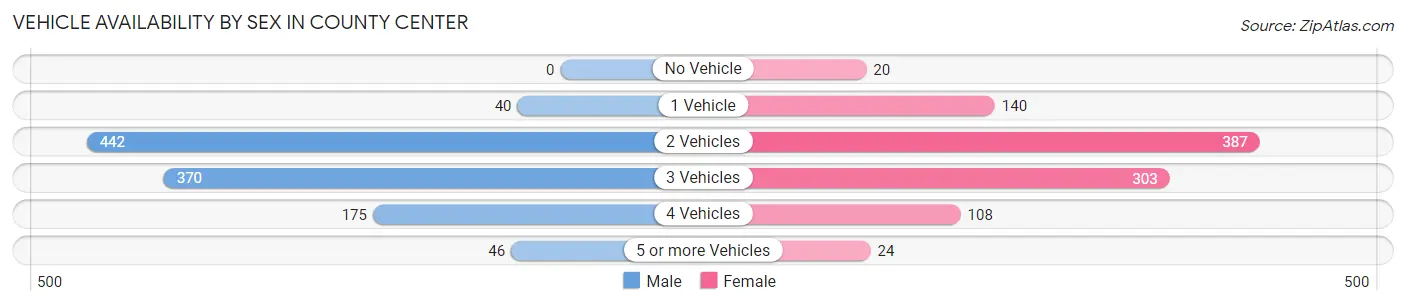
| Vehicles Available | Male | Female |
| No Vehicle | 0 (0.0%) | 20 (2.0%) |
| 1 Vehicle | 40 (3.7%) | 140 (14.3%) |
| 2 Vehicles | 442 (41.2%) | 387 (39.4%) |
| 3 Vehicles | 370 (34.5%) | 303 (30.9%) |
| 4 Vehicles | 175 (16.3%) | 108 (11.0%) |
| 5 or more Vehicles | 46 (4.3%) | 24 (2.4%) |
| Total | 1,073 (100.0%) | 982 (100.0%) |
Commute Time in County Center
The most frequently occuring commute durations in County Center are 45 to 59 minutes (494 commuters, 28.3%), 60 to 89 minutes (477 commuters, 27.4%), and 30 to 34 minutes (146 commuters, 8.4%).
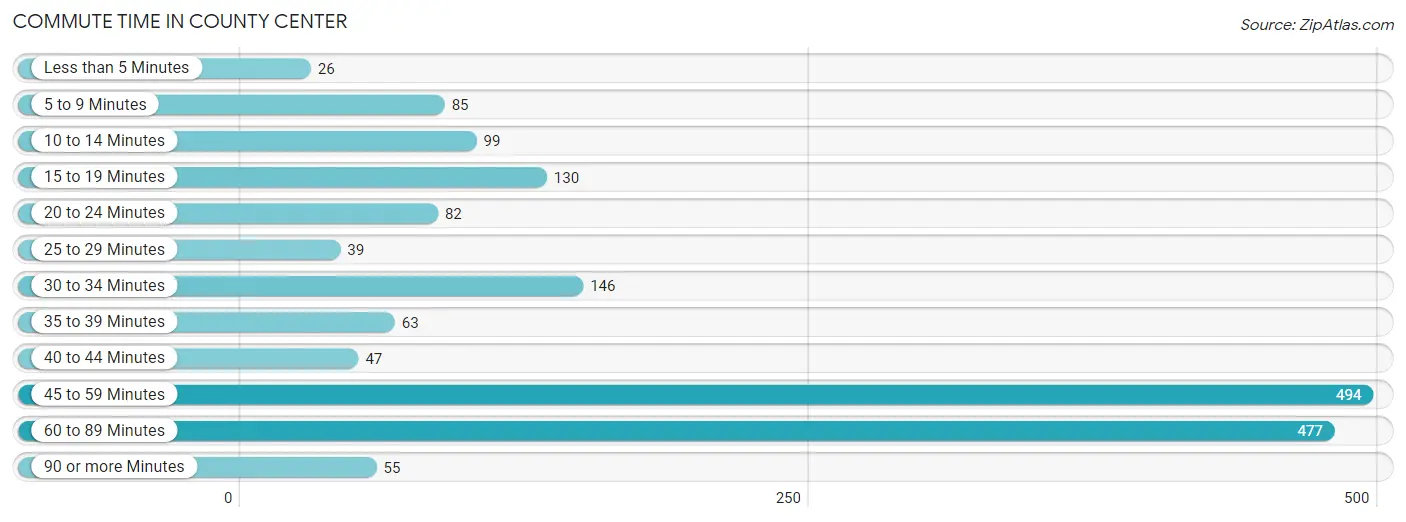
| Commute Time | # Commuters | % Commuters |
| Less than 5 Minutes | 26 | 1.5% |
| 5 to 9 Minutes | 85 | 4.9% |
| 10 to 14 Minutes | 99 | 5.7% |
| 15 to 19 Minutes | 130 | 7.5% |
| 20 to 24 Minutes | 82 | 4.7% |
| 25 to 29 Minutes | 39 | 2.2% |
| 30 to 34 Minutes | 146 | 8.4% |
| 35 to 39 Minutes | 63 | 3.6% |
| 40 to 44 Minutes | 47 | 2.7% |
| 45 to 59 Minutes | 494 | 28.3% |
| 60 to 89 Minutes | 477 | 27.4% |
| 90 or more Minutes | 55 | 3.2% |
Commute Time by Sex in County Center
The most common commute times in County Center are 45 to 59 minutes (356 commuters, 40.6%) for males and 60 to 89 minutes (206 commuters, 23.8%) for females.
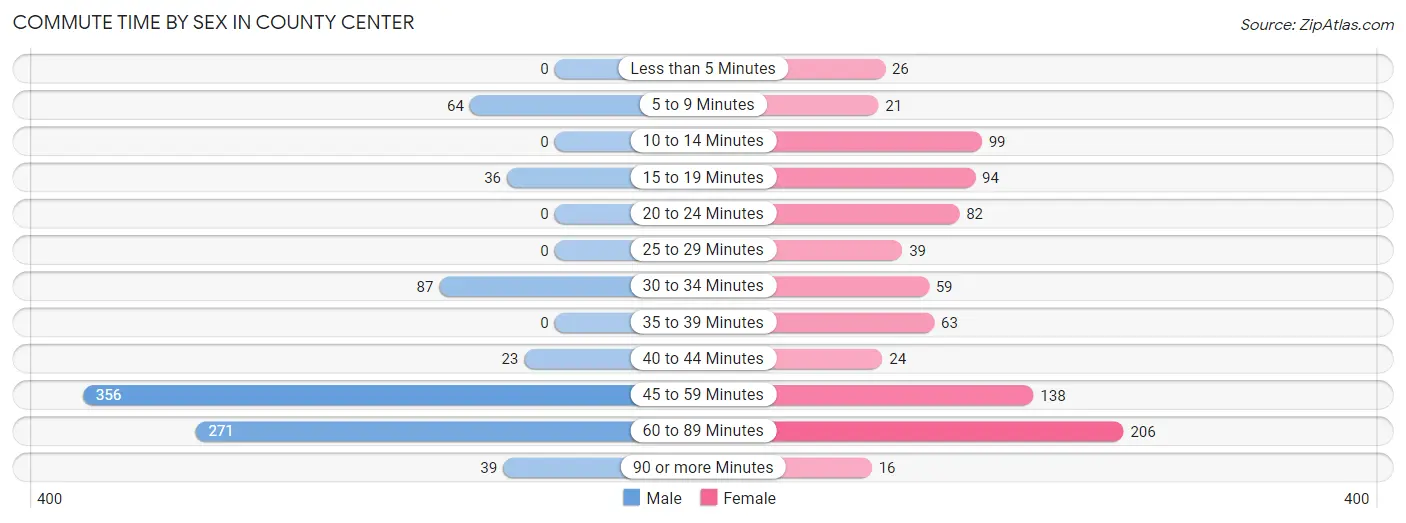
| Commute Time | Male | Female |
| Less than 5 Minutes | 0 (0.0%) | 26 (3.0%) |
| 5 to 9 Minutes | 64 (7.3%) | 21 (2.4%) |
| 10 to 14 Minutes | 0 (0.0%) | 99 (11.4%) |
| 15 to 19 Minutes | 36 (4.1%) | 94 (10.8%) |
| 20 to 24 Minutes | 0 (0.0%) | 82 (9.5%) |
| 25 to 29 Minutes | 0 (0.0%) | 39 (4.5%) |
| 30 to 34 Minutes | 87 (9.9%) | 59 (6.8%) |
| 35 to 39 Minutes | 0 (0.0%) | 63 (7.3%) |
| 40 to 44 Minutes | 23 (2.6%) | 24 (2.8%) |
| 45 to 59 Minutes | 356 (40.6%) | 138 (15.9%) |
| 60 to 89 Minutes | 271 (30.9%) | 206 (23.8%) |
| 90 or more Minutes | 39 (4.4%) | 16 (1.8%) |
Time of Departure to Work by Sex in County Center
The most frequent times of departure to work in County Center are 7:00 AM to 7:29 AM (170, 19.4%) for males and 12:00 PM to 3:59 PM (193, 22.3%) for females.
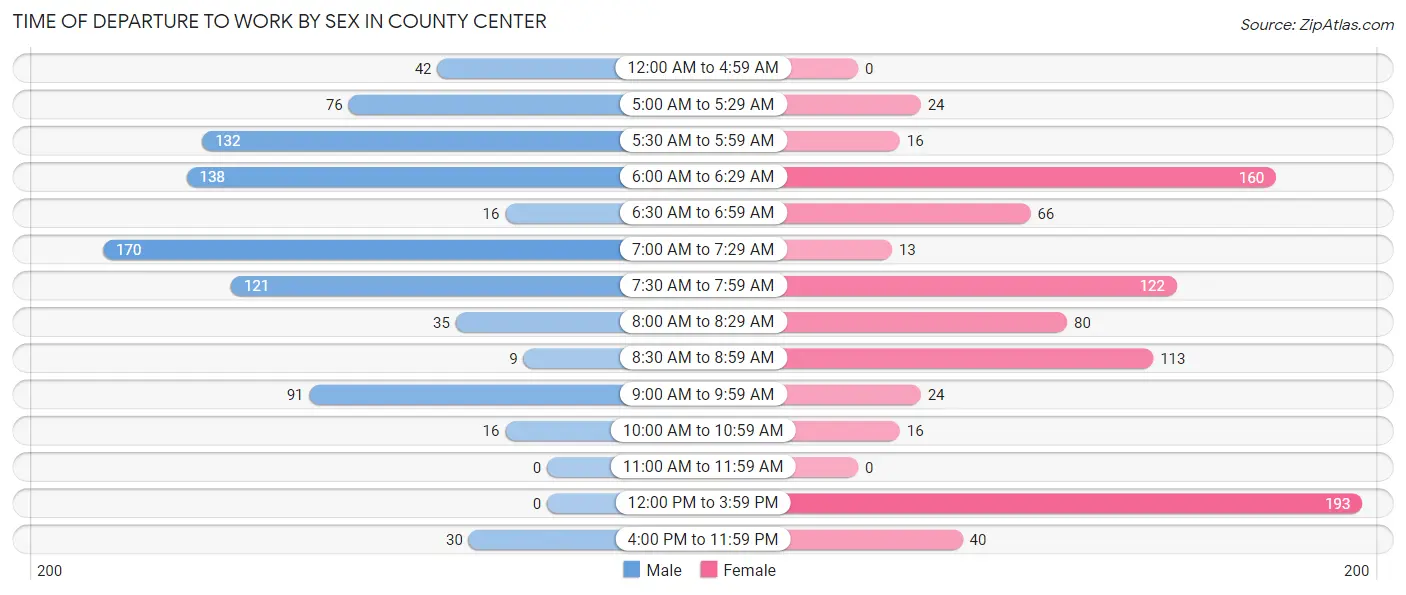
| Time of Departure | Male | Female |
| 12:00 AM to 4:59 AM | 42 (4.8%) | 0 (0.0%) |
| 5:00 AM to 5:29 AM | 76 (8.7%) | 24 (2.8%) |
| 5:30 AM to 5:59 AM | 132 (15.1%) | 16 (1.8%) |
| 6:00 AM to 6:29 AM | 138 (15.8%) | 160 (18.4%) |
| 6:30 AM to 6:59 AM | 16 (1.8%) | 66 (7.6%) |
| 7:00 AM to 7:29 AM | 170 (19.4%) | 13 (1.5%) |
| 7:30 AM to 7:59 AM | 121 (13.8%) | 122 (14.1%) |
| 8:00 AM to 8:29 AM | 35 (4.0%) | 80 (9.2%) |
| 8:30 AM to 8:59 AM | 9 (1.0%) | 113 (13.0%) |
| 9:00 AM to 9:59 AM | 91 (10.4%) | 24 (2.8%) |
| 10:00 AM to 10:59 AM | 16 (1.8%) | 16 (1.8%) |
| 11:00 AM to 11:59 AM | 0 (0.0%) | 0 (0.0%) |
| 12:00 PM to 3:59 PM | 0 (0.0%) | 193 (22.3%) |
| 4:00 PM to 11:59 PM | 30 (3.4%) | 40 (4.6%) |
| Total | 876 (100.0%) | 867 (100.0%) |
Housing Occupancy in County Center
Occupancy by Ownership in County Center
Of the total 1,156 dwellings in County Center, owner-occupied units account for 905 (78.3%), while renter-occupied units make up 251 (21.7%).
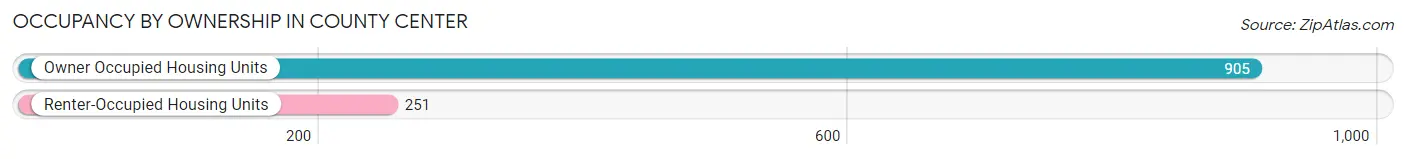
| Occupancy | # Housing Units | % Housing Units |
| Owner Occupied Housing Units | 905 | 78.3% |
| Renter-Occupied Housing Units | 251 | 21.7% |
| Total Occupied Housing Units | 1,156 | 100.0% |
Occupancy by Household Size in County Center
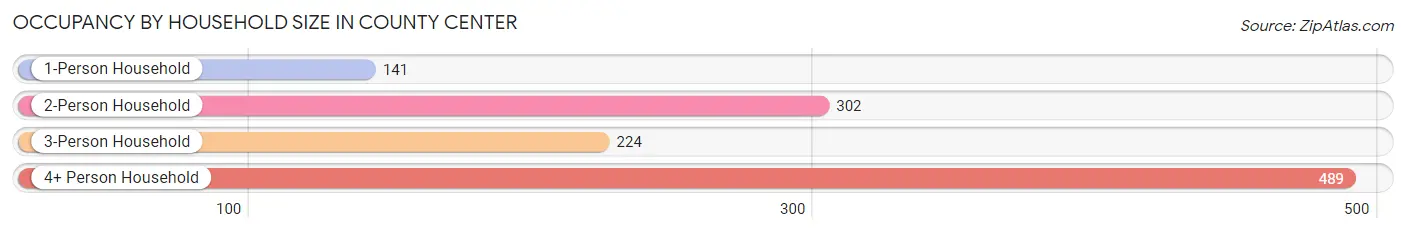
| Household Size | # Housing Units | % Housing Units |
| 1-Person Household | 141 | 12.2% |
| 2-Person Household | 302 | 26.1% |
| 3-Person Household | 224 | 19.4% |
| 4+ Person Household | 489 | 42.3% |
| Total Housing Units | 1,156 | 100.0% |
Occupancy by Ownership by Household Size in County Center
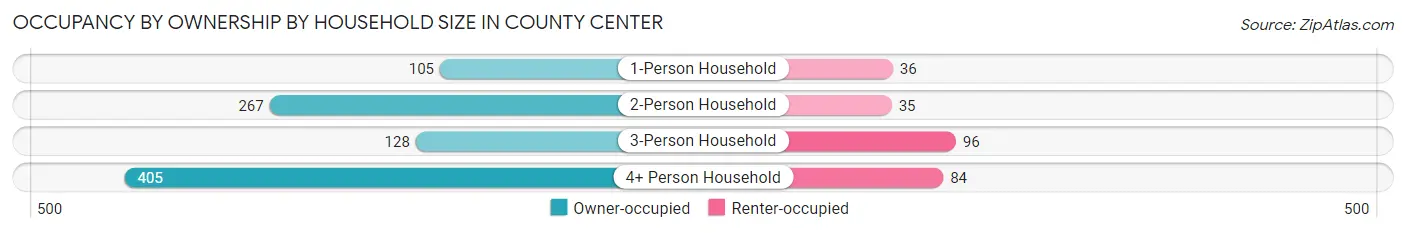
| Household Size | Owner-occupied | Renter-occupied |
| 1-Person Household | 105 (74.5%) | 36 (25.5%) |
| 2-Person Household | 267 (88.4%) | 35 (11.6%) |
| 3-Person Household | 128 (57.1%) | 96 (42.9%) |
| 4+ Person Household | 405 (82.8%) | 84 (17.2%) |
| Total Housing Units | 905 (78.3%) | 251 (21.7%) |
Occupancy by Educational Attainment in County Center
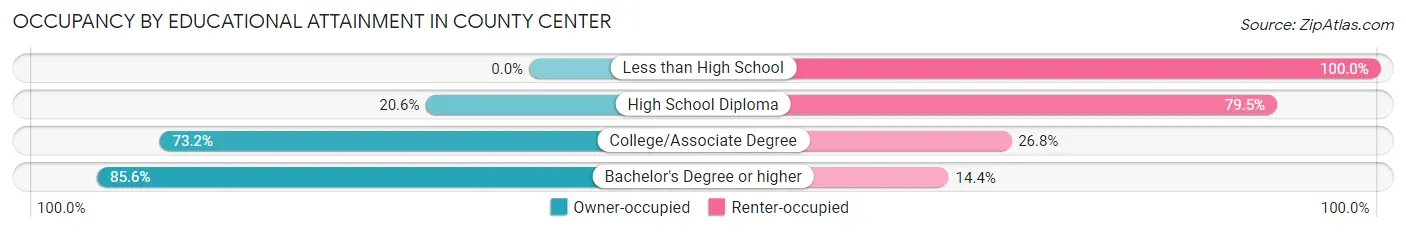
| Household Size | Owner-occupied | Renter-occupied |
| Less than High School | 0 (0.0%) | 15 (100.0%) |
| High School Diploma | 15 (20.5%) | 58 (79.4%) |
| College/Associate Degree | 145 (73.2%) | 53 (26.8%) |
| Bachelor's Degree or higher | 745 (85.6%) | 125 (14.4%) |
Occupancy by Age of Householder in County Center
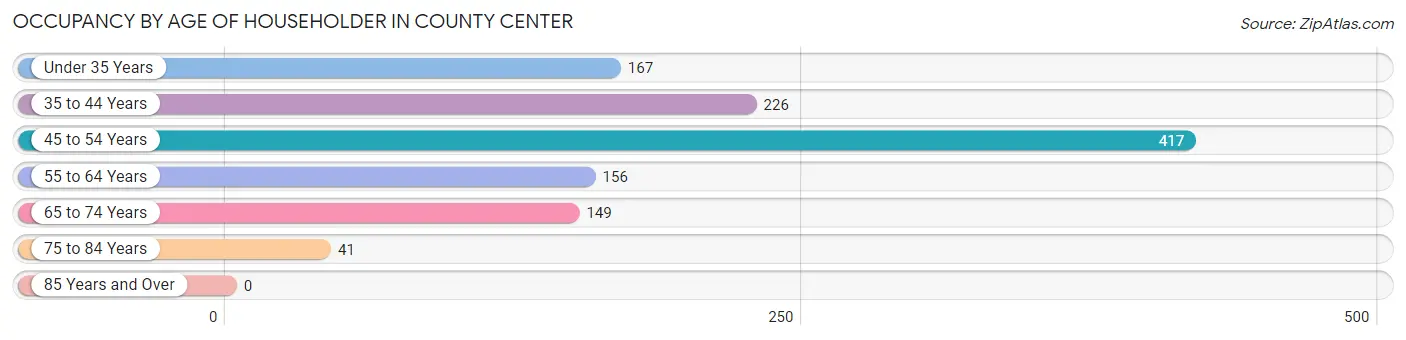
| Age Bracket | # Households | % Households |
| Under 35 Years | 167 | 14.4% |
| 35 to 44 Years | 226 | 19.6% |
| 45 to 54 Years | 417 | 36.1% |
| 55 to 64 Years | 156 | 13.5% |
| 65 to 74 Years | 149 | 12.9% |
| 75 to 84 Years | 41 | 3.5% |
| 85 Years and Over | 0 | 0.0% |
| Total | 1,156 | 100.0% |
Housing Finances in County Center
Median Income by Occupancy in County Center
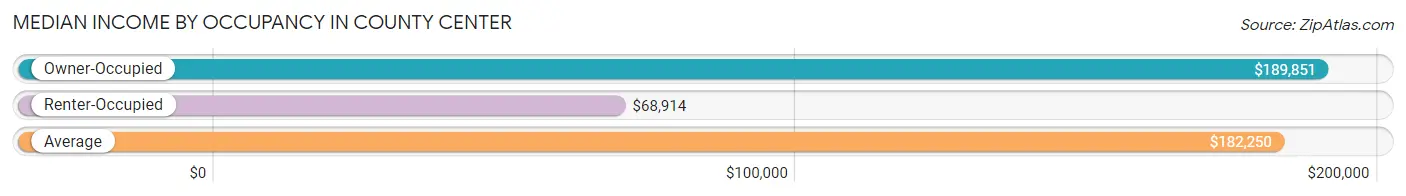
| Occupancy Type | # Households | Median Income |
| Owner-Occupied | 905 (78.3%) | $189,851 |
| Renter-Occupied | 251 (21.7%) | $68,914 |
| Average | 1,156 (100.0%) | $182,250 |
Occupancy by Householder Income Bracket in County Center
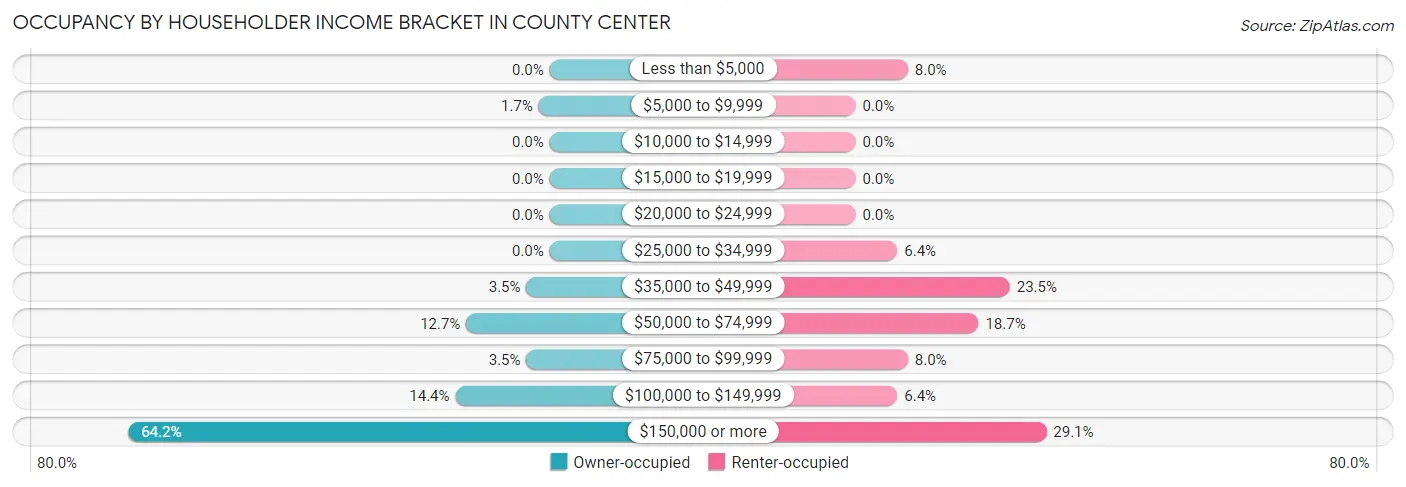
| Income Bracket | Owner-occupied | Renter-occupied |
| Less than $5,000 | 0 (0.0%) | 20 (8.0%) |
| $5,000 to $9,999 | 15 (1.7%) | 0 (0.0%) |
| $10,000 to $14,999 | 0 (0.0%) | 0 (0.0%) |
| $15,000 to $19,999 | 0 (0.0%) | 0 (0.0%) |
| $20,000 to $24,999 | 0 (0.0%) | 0 (0.0%) |
| $25,000 to $34,999 | 0 (0.0%) | 16 (6.4%) |
| $35,000 to $49,999 | 32 (3.5%) | 59 (23.5%) |
| $50,000 to $74,999 | 115 (12.7%) | 47 (18.7%) |
| $75,000 to $99,999 | 32 (3.5%) | 20 (8.0%) |
| $100,000 to $149,999 | 130 (14.4%) | 16 (6.4%) |
| $150,000 or more | 581 (64.2%) | 73 (29.1%) |
| Total | 905 (100.0%) | 251 (100.0%) |
Monthly Housing Cost Tiers in County Center
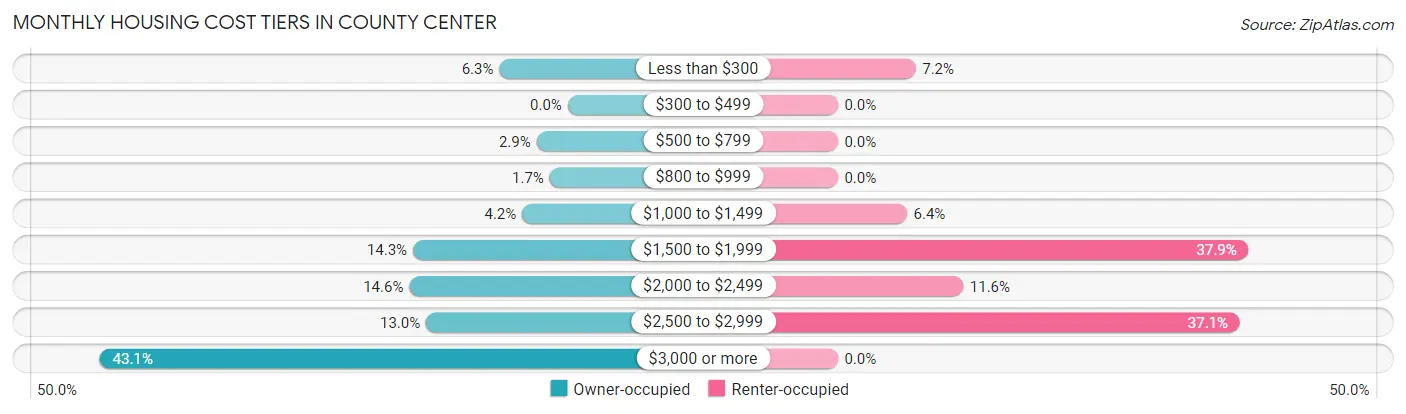
| Monthly Cost | Owner-occupied | Renter-occupied |
| Less than $300 | 57 (6.3%) | 18 (7.2%) |
| $300 to $499 | 0 (0.0%) | 0 (0.0%) |
| $500 to $799 | 26 (2.9%) | 0 (0.0%) |
| $800 to $999 | 15 (1.7%) | 0 (0.0%) |
| $1,000 to $1,499 | 38 (4.2%) | 16 (6.4%) |
| $1,500 to $1,999 | 129 (14.2%) | 95 (37.9%) |
| $2,000 to $2,499 | 132 (14.6%) | 29 (11.6%) |
| $2,500 to $2,999 | 118 (13.0%) | 93 (37.0%) |
| $3,000 or more | 390 (43.1%) | 0 (0.0%) |
| Total | 905 (100.0%) | 251 (100.0%) |
Physical Housing Characteristics in County Center
Housing Structures in County Center
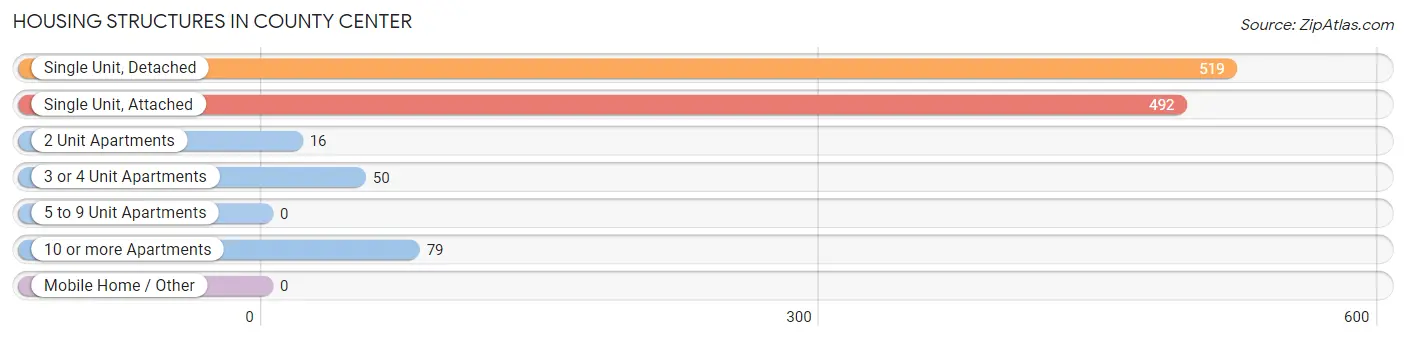
| Structure Type | # Housing Units | % Housing Units |
| Single Unit, Detached | 519 | 44.9% |
| Single Unit, Attached | 492 | 42.6% |
| 2 Unit Apartments | 16 | 1.4% |
| 3 or 4 Unit Apartments | 50 | 4.3% |
| 5 to 9 Unit Apartments | 0 | 0.0% |
| 10 or more Apartments | 79 | 6.8% |
| Mobile Home / Other | 0 | 0.0% |
| Total | 1,156 | 100.0% |
Housing Structures by Occupancy in County Center
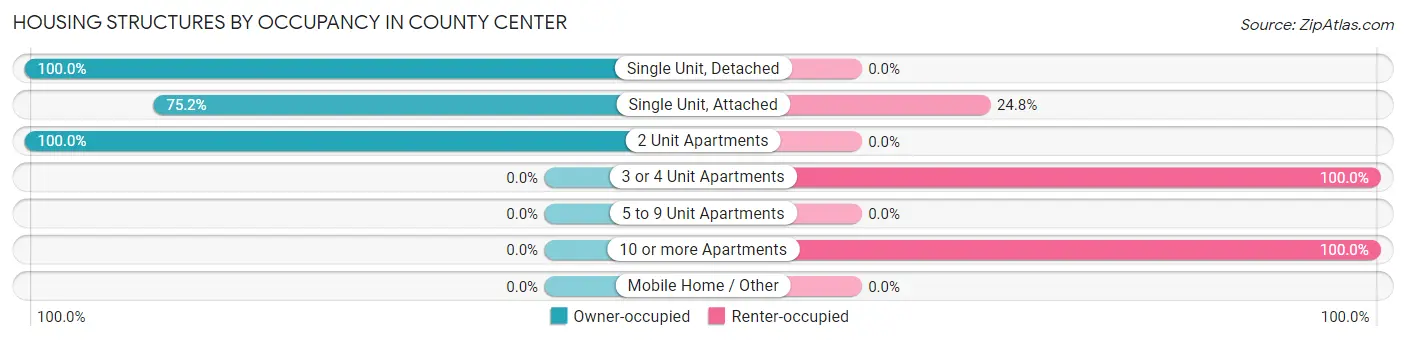
| Structure Type | Owner-occupied | Renter-occupied |
| Single Unit, Detached | 519 (100.0%) | 0 (0.0%) |
| Single Unit, Attached | 370 (75.2%) | 122 (24.8%) |
| 2 Unit Apartments | 16 (100.0%) | 0 (0.0%) |
| 3 or 4 Unit Apartments | 0 (0.0%) | 50 (100.0%) |
| 5 to 9 Unit Apartments | 0 (0.0%) | 0 (0.0%) |
| 10 or more Apartments | 0 (0.0%) | 79 (100.0%) |
| Mobile Home / Other | 0 (0.0%) | 0 (0.0%) |
| Total | 905 (78.3%) | 251 (21.7%) |
Housing Structures by Number of Rooms in County Center
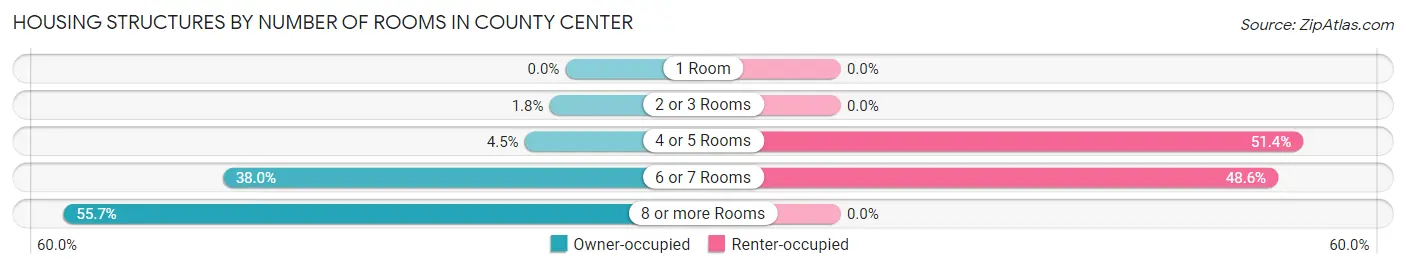
| Number of Rooms | Owner-occupied | Renter-occupied |
| 1 Room | 0 (0.0%) | 0 (0.0%) |
| 2 or 3 Rooms | 16 (1.8%) | 0 (0.0%) |
| 4 or 5 Rooms | 41 (4.5%) | 129 (51.4%) |
| 6 or 7 Rooms | 344 (38.0%) | 122 (48.6%) |
| 8 or more Rooms | 504 (55.7%) | 0 (0.0%) |
| Total | 905 (100.0%) | 251 (100.0%) |
Housing Structure by Heating Type in County Center
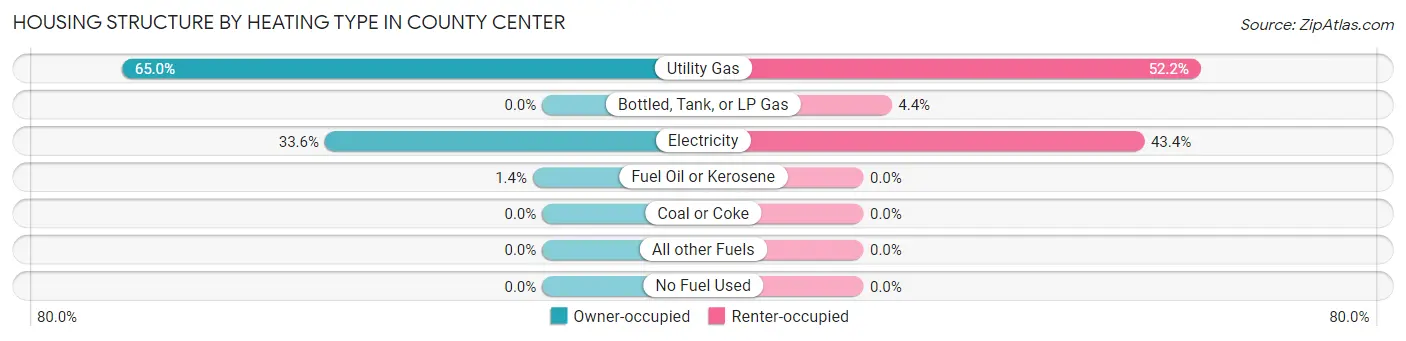
| Heating Type | Owner-occupied | Renter-occupied |
| Utility Gas | 588 (65.0%) | 131 (52.2%) |
| Bottled, Tank, or LP Gas | 0 (0.0%) | 11 (4.4%) |
| Electricity | 304 (33.6%) | 109 (43.4%) |
| Fuel Oil or Kerosene | 13 (1.4%) | 0 (0.0%) |
| Coal or Coke | 0 (0.0%) | 0 (0.0%) |
| All other Fuels | 0 (0.0%) | 0 (0.0%) |
| No Fuel Used | 0 (0.0%) | 0 (0.0%) |
| Total | 905 (100.0%) | 251 (100.0%) |
Household Vehicle Usage in County Center
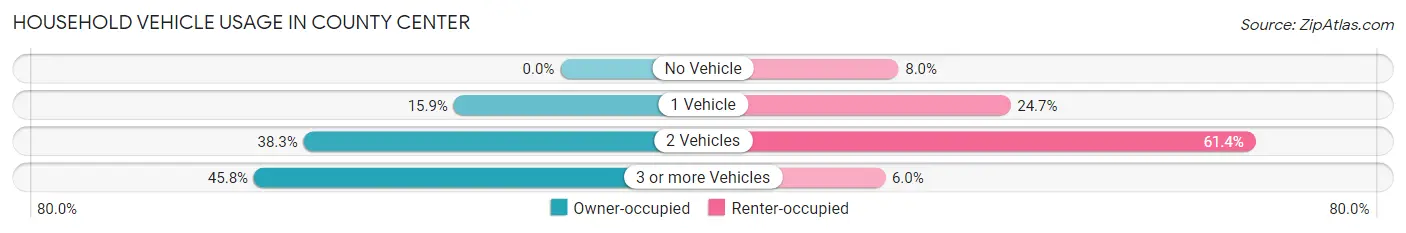
| Vehicles per Household | Owner-occupied | Renter-occupied |
| No Vehicle | 0 (0.0%) | 20 (8.0%) |
| 1 Vehicle | 144 (15.9%) | 62 (24.7%) |
| 2 Vehicles | 347 (38.3%) | 154 (61.4%) |
| 3 or more Vehicles | 414 (45.8%) | 15 (6.0%) |
| Total | 905 (100.0%) | 251 (100.0%) |
Real Estate & Mortgages in County Center
Real Estate and Mortgage Overview in County Center
| Characteristic | Without Mortgage | With Mortgage |
| Housing Units | 98 | 807 |
| Median Property Value | - | - |
| Median Household Income | $187,976 | $513 |
| Monthly Housing Costs | - | - |
| Real Estate Taxes | $8,000 | $0 |
Property Value by Mortgage Status in County Center
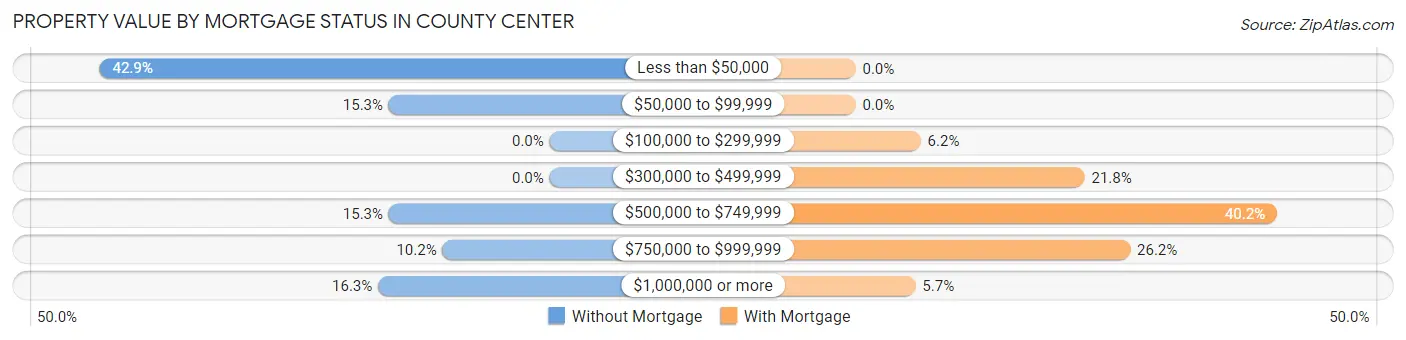
| Property Value | Without Mortgage | With Mortgage |
| Less than $50,000 | 42 (42.9%) | 0 (0.0%) |
| $50,000 to $99,999 | 15 (15.3%) | 0 (0.0%) |
| $100,000 to $299,999 | 0 (0.0%) | 50 (6.2%) |
| $300,000 to $499,999 | 0 (0.0%) | 176 (21.8%) |
| $500,000 to $749,999 | 15 (15.3%) | 324 (40.2%) |
| $750,000 to $999,999 | 10 (10.2%) | 211 (26.2%) |
| $1,000,000 or more | 16 (16.3%) | 46 (5.7%) |
| Total | 98 (100.0%) | 807 (100.0%) |
Household Income by Mortgage Status in County Center
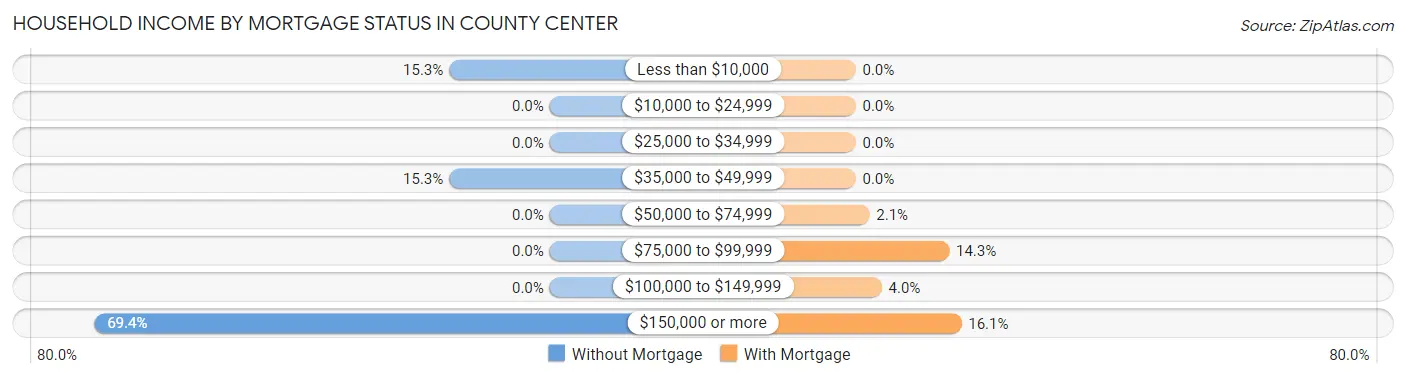
| Household Income | Without Mortgage | With Mortgage |
| Less than $10,000 | 15 (15.3%) | 0 (0.0%) |
| $10,000 to $24,999 | 0 (0.0%) | 0 (0.0%) |
| $25,000 to $34,999 | 0 (0.0%) | 0 (0.0%) |
| $35,000 to $49,999 | 15 (15.3%) | 0 (0.0%) |
| $50,000 to $74,999 | 0 (0.0%) | 17 (2.1%) |
| $75,000 to $99,999 | 0 (0.0%) | 115 (14.2%) |
| $100,000 to $149,999 | 0 (0.0%) | 32 (4.0%) |
| $150,000 or more | 68 (69.4%) | 130 (16.1%) |
| Total | 98 (100.0%) | 807 (100.0%) |
Property Value to Household Income Ratio in County Center
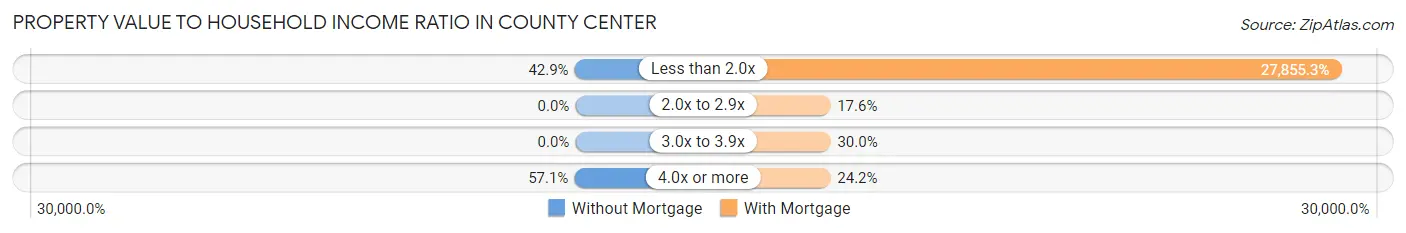
| Value-to-Income Ratio | Without Mortgage | With Mortgage |
| Less than 2.0x | 42 (42.9%) | 224,792 (27,855.3%) |
| 2.0x to 2.9x | 0 (0.0%) | 142 (17.6%) |
| 3.0x to 3.9x | 0 (0.0%) | 242 (30.0%) |
| 4.0x or more | 56 (57.1%) | 195 (24.2%) |
| Total | 98 (100.0%) | 807 (100.0%) |
Real Estate Taxes by Mortgage Status in County Center
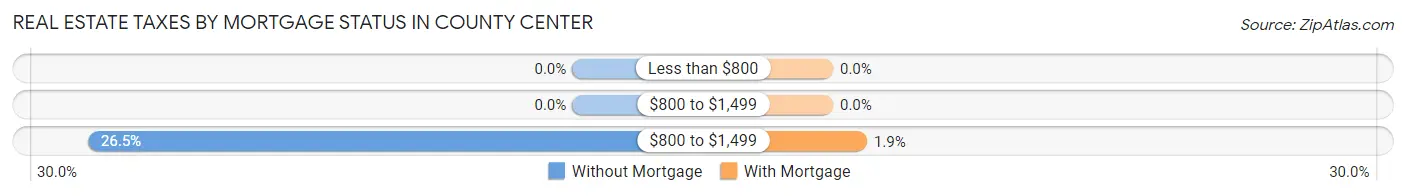
| Property Taxes | Without Mortgage | With Mortgage |
| Less than $800 | 0 (0.0%) | 0 (0.0%) |
| $800 to $1,499 | 0 (0.0%) | 0 (0.0%) |
| $800 to $1,499 | 26 (26.5%) | 15 (1.9%) |
| Total | 98 (100.0%) | 807 (100.0%) |
Health & Disability in County Center
Health Insurance Coverage by Age in County Center
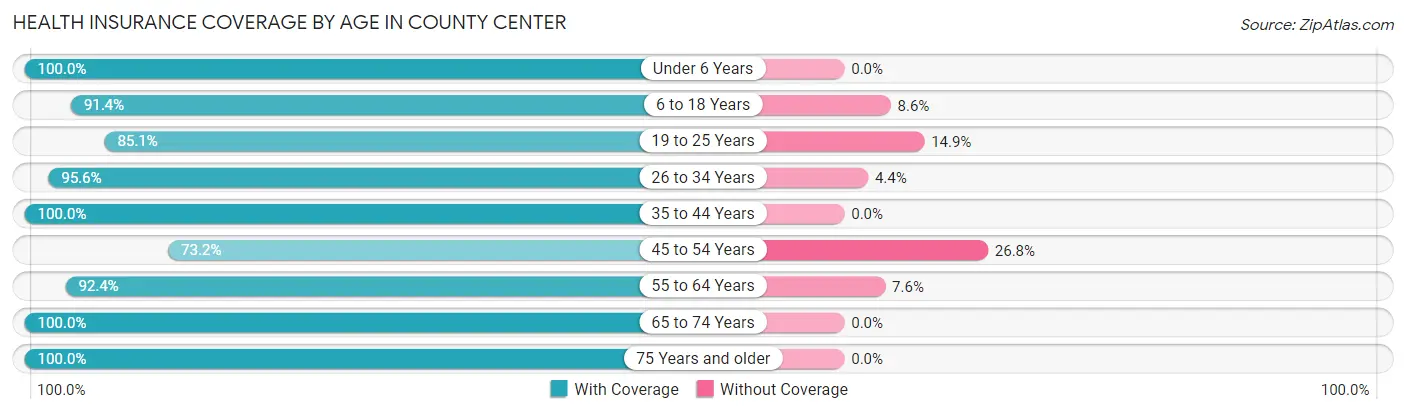
| Age Bracket | With Coverage | Without Coverage |
| Under 6 Years | 303 (100.0%) | 0 (0.0%) |
| 6 to 18 Years | 985 (91.4%) | 93 (8.6%) |
| 19 to 25 Years | 257 (85.1%) | 45 (14.9%) |
| 26 to 34 Years | 281 (95.6%) | 13 (4.4%) |
| 35 to 44 Years | 363 (100.0%) | 0 (0.0%) |
| 45 to 54 Years | 643 (73.2%) | 235 (26.8%) |
| 55 to 64 Years | 412 (92.4%) | 34 (7.6%) |
| 65 to 74 Years | 217 (100.0%) | 0 (0.0%) |
| 75 Years and older | 108 (100.0%) | 0 (0.0%) |
| Total | 3,569 (89.5%) | 420 (10.5%) |
Health Insurance Coverage by Citizenship Status in County Center
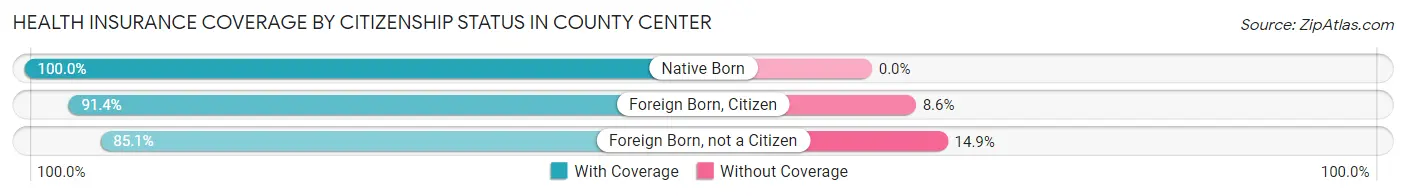
| Citizenship Status | With Coverage | Without Coverage |
| Native Born | 303 (100.0%) | 0 (0.0%) |
| Foreign Born, Citizen | 985 (91.4%) | 93 (8.6%) |
| Foreign Born, not a Citizen | 257 (85.1%) | 45 (14.9%) |
Health Insurance Coverage by Household Income in County Center
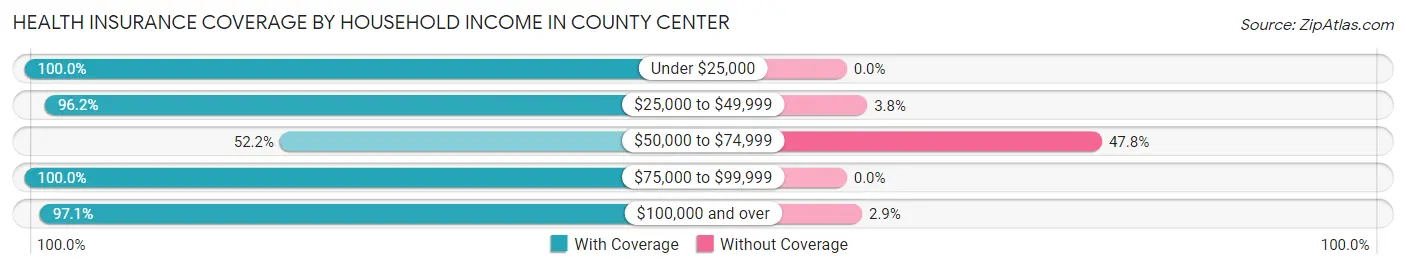
| Household Income | With Coverage | Without Coverage |
| Under $25,000 | 56 (100.0%) | 0 (0.0%) |
| $25,000 to $49,999 | 326 (96.2%) | 13 (3.8%) |
| $50,000 to $74,999 | 357 (52.2%) | 327 (47.8%) |
| $75,000 to $99,999 | 113 (100.0%) | 0 (0.0%) |
| $100,000 and over | 2,717 (97.1%) | 80 (2.9%) |
Public vs Private Health Insurance Coverage by Age in County Center
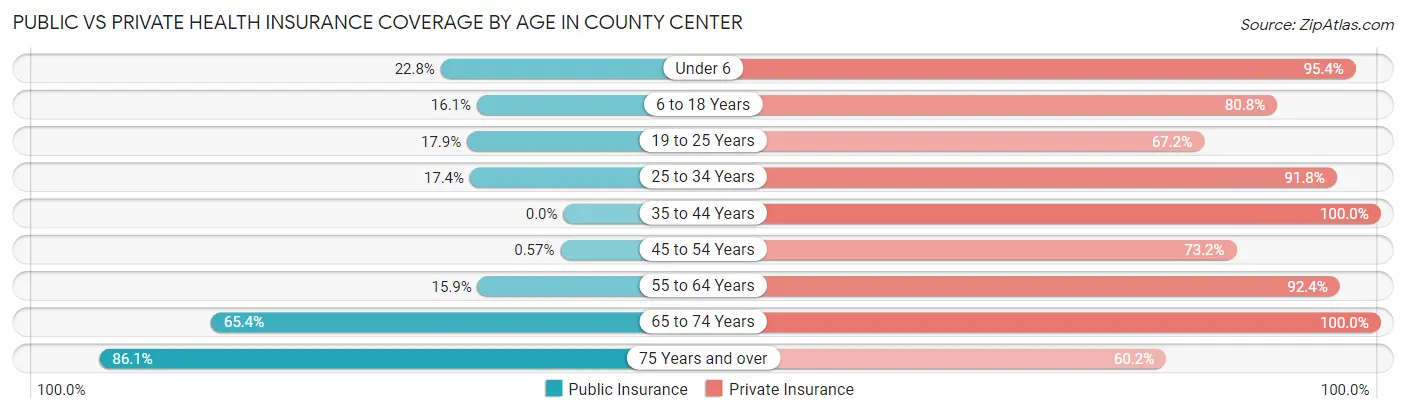
| Age Bracket | Public Insurance | Private Insurance |
| Under 6 | 69 (22.8%) | 289 (95.4%) |
| 6 to 18 Years | 173 (16.1%) | 871 (80.8%) |
| 19 to 25 Years | 54 (17.9%) | 203 (67.2%) |
| 25 to 34 Years | 51 (17.3%) | 270 (91.8%) |
| 35 to 44 Years | 0 (0.0%) | 363 (100.0%) |
| 45 to 54 Years | 5 (0.6%) | 643 (73.2%) |
| 55 to 64 Years | 71 (15.9%) | 412 (92.4%) |
| 65 to 74 Years | 142 (65.4%) | 217 (100.0%) |
| 75 Years and over | 93 (86.1%) | 65 (60.2%) |
| Total | 658 (16.5%) | 3,333 (83.6%) |
Disability Status by Sex by Age in County Center
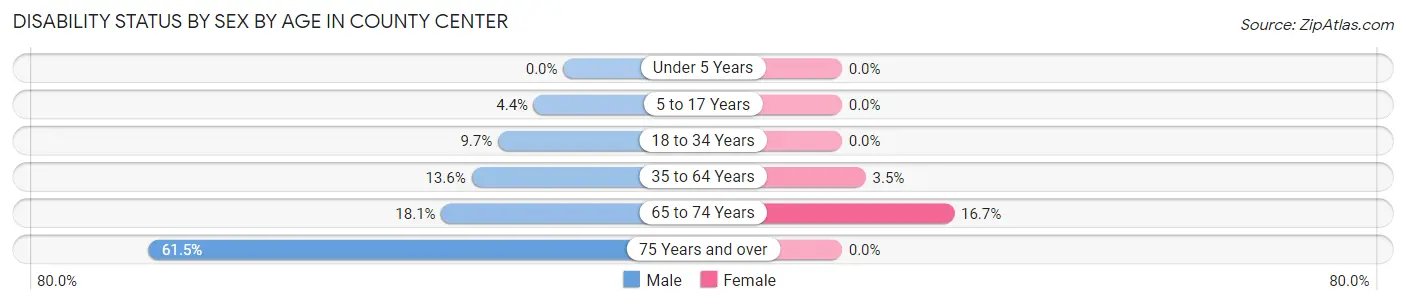
| Age Bracket | Male | Female |
| Under 5 Years | 0 (0.0%) | 0 (0.0%) |
| 5 to 17 Years | 17 (4.4%) | 0 (0.0%) |
| 18 to 34 Years | 37 (9.7%) | 0 (0.0%) |
| 35 to 64 Years | 103 (13.6%) | 33 (3.5%) |
| 65 to 74 Years | 23 (18.1%) | 15 (16.7%) |
| 75 Years and over | 24 (61.5%) | 0 (0.0%) |
Disability Class by Sex by Age in County Center
Disability Class: Hearing Difficulty
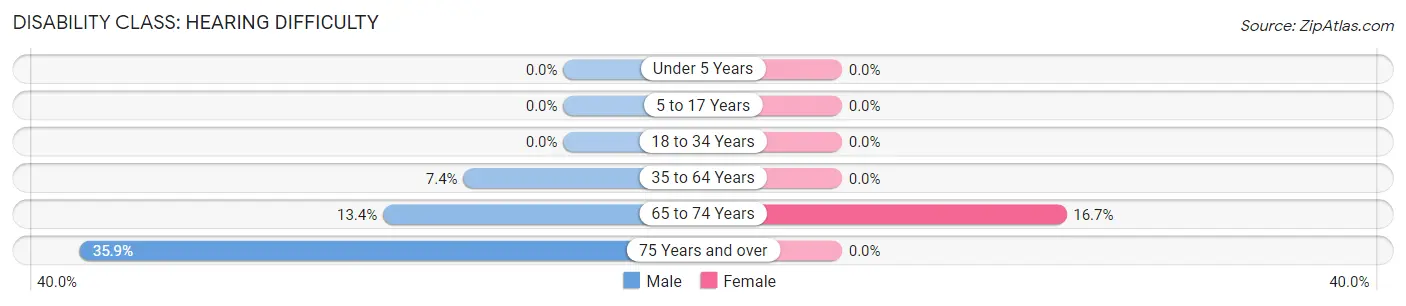
| Age Bracket | Male | Female |
| Under 5 Years | 0 (0.0%) | 0 (0.0%) |
| 5 to 17 Years | 0 (0.0%) | 0 (0.0%) |
| 18 to 34 Years | 0 (0.0%) | 0 (0.0%) |
| 35 to 64 Years | 56 (7.4%) | 0 (0.0%) |
| 65 to 74 Years | 17 (13.4%) | 15 (16.7%) |
| 75 Years and over | 14 (35.9%) | 0 (0.0%) |
Disability Class: Vision Difficulty
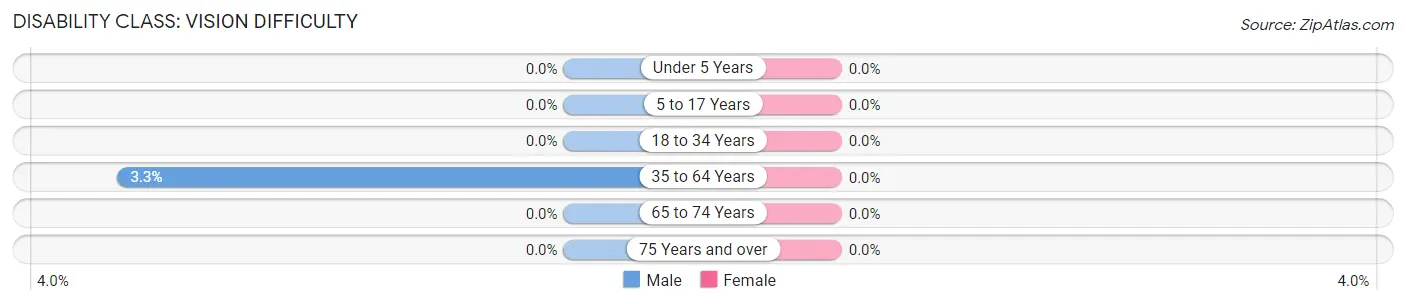
| Age Bracket | Male | Female |
| Under 5 Years | 0 (0.0%) | 0 (0.0%) |
| 5 to 17 Years | 0 (0.0%) | 0 (0.0%) |
| 18 to 34 Years | 0 (0.0%) | 0 (0.0%) |
| 35 to 64 Years | 25 (3.3%) | 0 (0.0%) |
| 65 to 74 Years | 0 (0.0%) | 0 (0.0%) |
| 75 Years and over | 0 (0.0%) | 0 (0.0%) |
Disability Class: Cognitive Difficulty
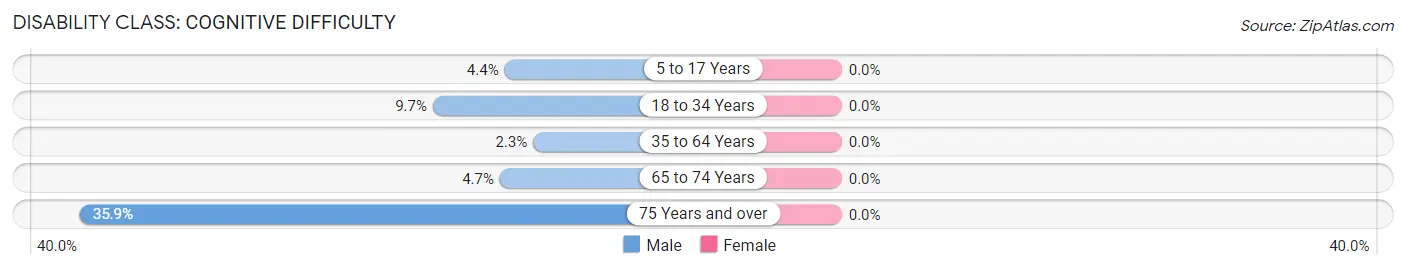
| Age Bracket | Male | Female |
| 5 to 17 Years | 17 (4.4%) | 0 (0.0%) |
| 18 to 34 Years | 37 (9.7%) | 0 (0.0%) |
| 35 to 64 Years | 17 (2.2%) | 0 (0.0%) |
| 65 to 74 Years | 6 (4.7%) | 0 (0.0%) |
| 75 Years and over | 14 (35.9%) | 0 (0.0%) |
Disability Class: Ambulatory Difficulty
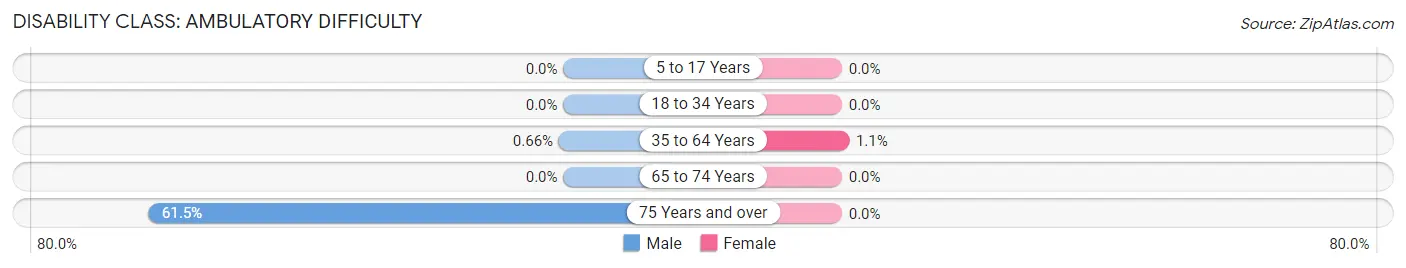
| Age Bracket | Male | Female |
| 5 to 17 Years | 0 (0.0%) | 0 (0.0%) |
| 18 to 34 Years | 0 (0.0%) | 0 (0.0%) |
| 35 to 64 Years | 5 (0.7%) | 10 (1.1%) |
| 65 to 74 Years | 0 (0.0%) | 0 (0.0%) |
| 75 Years and over | 24 (61.5%) | 0 (0.0%) |
Disability Class: Self-Care Difficulty
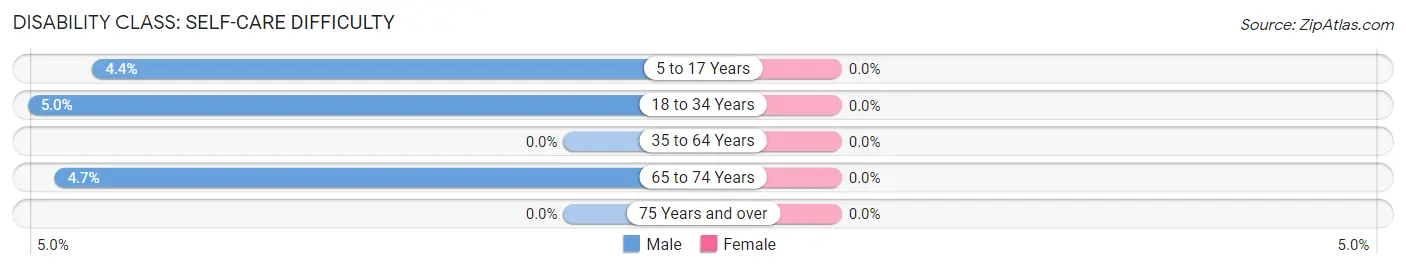
| Age Bracket | Male | Female |
| 5 to 17 Years | 17 (4.4%) | 0 (0.0%) |
| 18 to 34 Years | 19 (5.0%) | 0 (0.0%) |
| 35 to 64 Years | 0 (0.0%) | 0 (0.0%) |
| 65 to 74 Years | 6 (4.7%) | 0 (0.0%) |
| 75 Years and over | 0 (0.0%) | 0 (0.0%) |
Technology Access in County Center
Computing Device Access in County Center
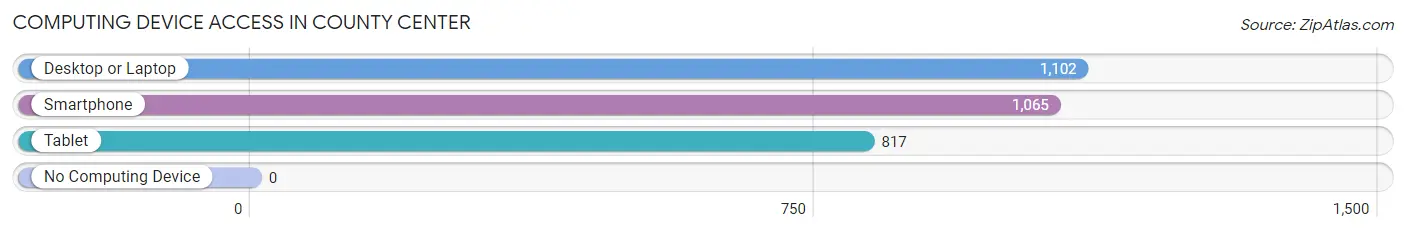
| Device Type | # Households | % Households |
| Desktop or Laptop | 1,102 | 95.3% |
| Smartphone | 1,065 | 92.1% |
| Tablet | 817 | 70.7% |
| No Computing Device | 0 | 0.0% |
| Total | 1,156 | 100.0% |
Internet Access in County Center
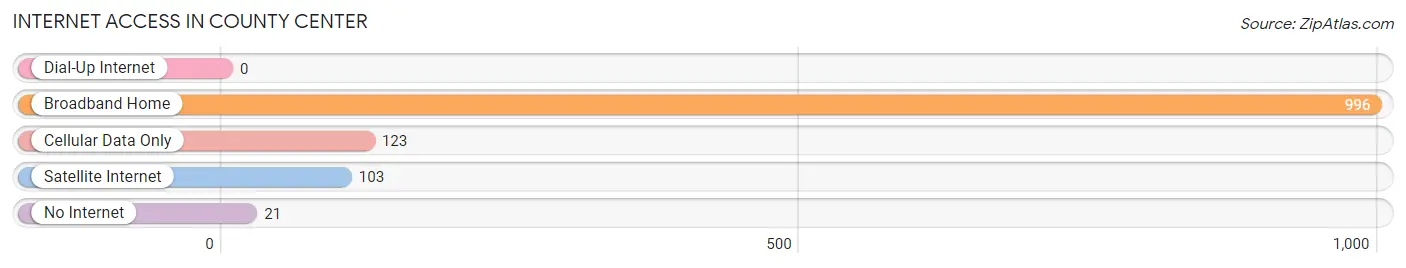
| Internet Type | # Households | % Households |
| Dial-Up Internet | 0 | 0.0% |
| Broadband Home | 996 | 86.2% |
| Cellular Data Only | 123 | 10.6% |
| Satellite Internet | 103 | 8.9% |
| No Internet | 21 | 1.8% |
| Total | 1,156 | 100.0% |
County Center Summary
County Center, Virginia is a small town located in the heart of the Shenandoah Valley in the United States. It is situated in the northern part of Rockingham County, Virginia, and is part of the Harrisonburg Metropolitan Statistical Area. The town has a population of approximately 1,500 people and is known for its rural charm and small-town atmosphere.
History
The area that is now County Center was first settled in the late 1700s by German immigrants. The town was originally known as “Hoffman’s Crossroads”, named after the first settler, Jacob Hoffman. In 1820, the town was renamed “County Center”, as it was the center of Rockingham County.
The town was an important stop on the Valley Turnpike, a major transportation route in the 19th century. The turnpike connected the Shenandoah Valley to the rest of the state, and County Center was a popular stop for travelers.
In the late 19th century, County Center was a thriving agricultural community. The town was home to several mills, a cannery, and a number of other businesses. The town also had a railroad station, which connected it to the rest of the state.
Geography
County Center is located in the northern part of Rockingham County, Virginia. The town is situated in the Shenandoah Valley, which is a large valley that stretches from the Blue Ridge Mountains to the Allegheny Mountains. The town is surrounded by rolling hills and farmland, and is located near the North Fork of the Shenandoah River.
The climate in County Center is temperate, with hot summers and cold winters. The average temperature in the summer is around 80 degrees Fahrenheit, and the average temperature in the winter is around 40 degrees Fahrenheit.
Economy
The economy of County Center is largely based on agriculture. The town is home to several farms, which produce a variety of crops, including corn, soybeans, wheat, and hay. The town also has a number of small businesses, including a grocery store, a hardware store, and a few restaurants.
Demographics
As of the 2010 census, the population of County Center was 1,500 people. The town is predominantly white, with a small African American population. The median household income in the town is $41,000, and the median home value is $150,000.
Conclusion
County Center, Virginia is a small town located in the heart of the Shenandoah Valley. The town has a population of approximately 1,500 people and is known for its rural charm and small-town atmosphere. The economy of County Center is largely based on agriculture, and the town is predominantly white, with a small African American population. County Center is a great place to live and work, and is a great example of small-town America.
Common Questions
What is the Total Population of County Center?
Total Population of County Center is 4,024.
What is the Total Male Population of County Center?
Total Male Population of County Center is 1,897.
What is the Total Female Population of County Center?
Total Female Population of County Center is 2,127.
What is the Ratio of Males per 100 Females in County Center?
There are 89.19 Males per 100 Females in County Center.
What is the Ratio of Females per 100 Males in County Center?
There are 112.12 Females per 100 Males in County Center.
What is the Median Population Age in County Center?
Median Population Age in County Center is 35.5 Years.
What is the Average Family Size in County Center
Average Family Size in County Center is 3.7 People.
What is the Average Household Size in County Center
Average Household Size in County Center is 3.5 People.
What is Per Capita Income in County Center?
Per Capita income in County Center is $61,468.
What is the Median Family Income in County Center?
Median Family Income in County Center is $181,938.
What is the Median Household income in County Center?
Median Household Income in County Center is $182,250.
What is Income or Wage Gap in County Center?
Income or Wage Gap in County Center is 37.0%.
Women in County Center earn 63.0 cents for every dollar earned by a man.
What is Inequality or Gini Index in County Center?
Inequality or Gini Index in County Center is 0.42.
How Large is the Labor Force in County Center?
There are 2,226 People in the Labor Forcein in County Center.
What is the Percentage of People in the Labor Force in County Center?
77.3% of People are in the Labor Force in County Center.
What is the Unemployment Rate in County Center?
Unemployment Rate in County Center is 7.3%.