Ivy, VA
Ivy Map
Ivy Overview
682
TOTAL POPULATION
280
MALE POPULATION
402
FEMALE POPULATION
69.65
MALES / 100 FEMALES
143.57
FEMALES / 100 MALES
60.7
MEDIAN AGE
2.6
AVG FAMILY SIZE
1.9
AVG HOUSEHOLD SIZE
$95,055
PER CAPITA INCOME
$148,846
AVG FAMILY INCOME
$176,304
AVG HOUSEHOLD INCOME
0.21
INEQUALITY / GINI INDEX
469
LABOR FORCE [ PEOPLE ]
74.8%
PERCENT IN LABOR FORCE
22.0%
UNEMPLOYMENT RATE
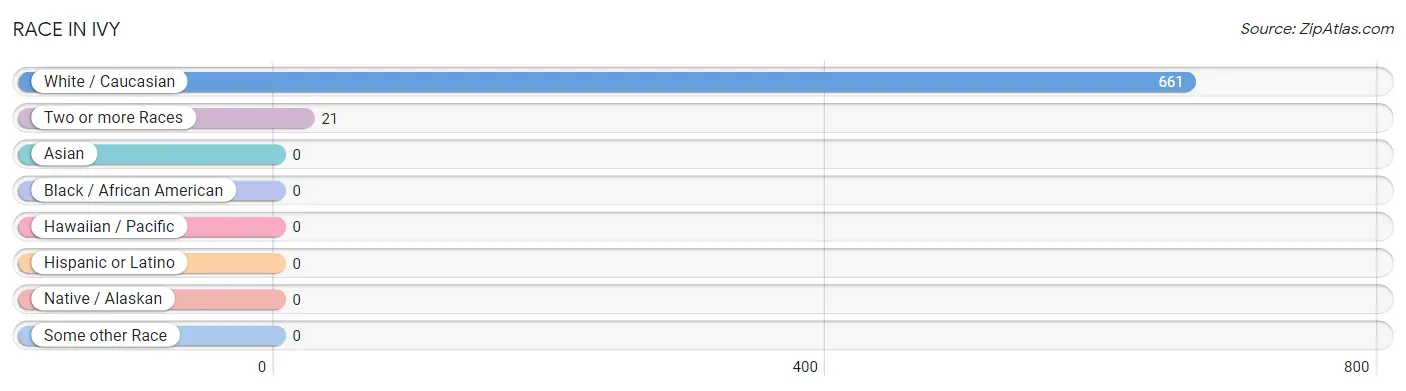
Race in Ivy
The most populous races in Ivy are White / Caucasian (661 | 96.9%), and Two or more Races (21 | 3.1%).
| Race | # Population | % Population |
| Asian | 0 | 0.0% |
| Black / African American | 0 | 0.0% |
| Hawaiian / Pacific | 0 | 0.0% |
| Hispanic or Latino | 0 | 0.0% |
| Native / Alaskan | 0 | 0.0% |
| White / Caucasian | 661 | 96.9% |
| Two or more Races | 21 | 3.1% |
| Some other Race | 0 | 0.0% |
| Total | 682 | 100.0% |
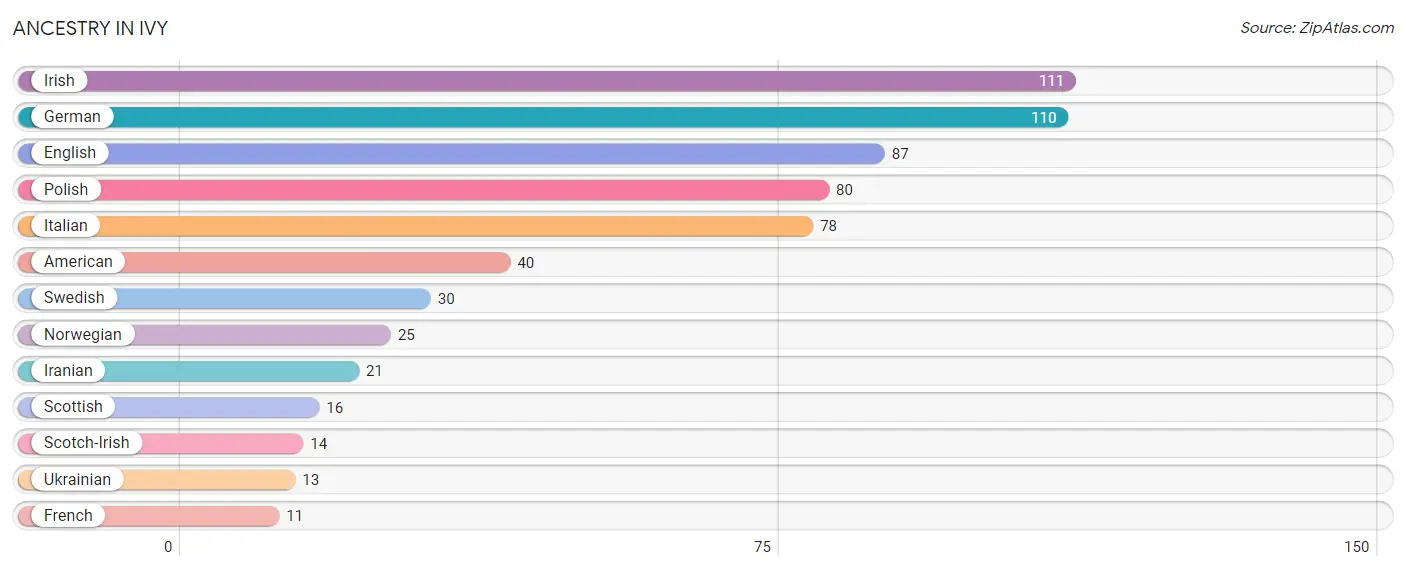
Ancestry in Ivy
The most populous ancestries reported in Ivy are Irish (111 | 16.3%), German (110 | 16.1%), English (87 | 12.8%), Polish (80 | 11.7%), and Italian (78 | 11.4%), together accounting for 68.3% of all Ivy residents.
| Ancestry | # Population | % Population |
| American | 40 | 5.9% |
| English | 87 | 12.8% |
| French | 11 | 1.6% |
| German | 110 | 16.1% |
| Iranian | 21 | 3.1% |
| Irish | 111 | 16.3% |
| Italian | 78 | 11.4% |
| Norwegian | 25 | 3.7% |
| Polish | 80 | 11.7% |
| Scotch-Irish | 14 | 2.1% |
| Scottish | 16 | 2.4% |
| Swedish | 30 | 4.4% |
| Ukrainian | 13 | 1.9% | View All 13 Rows |
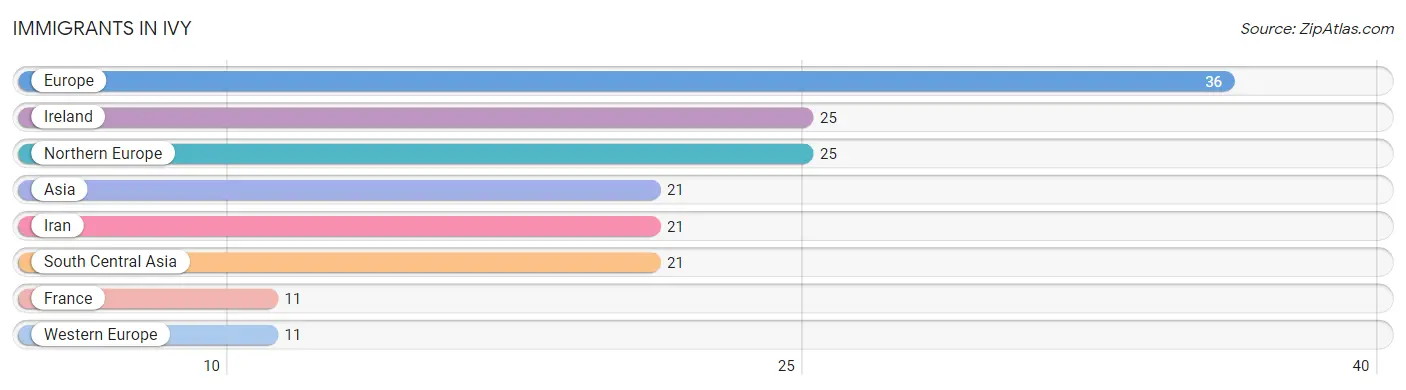
Immigrants in Ivy
The most numerous immigrant groups reported in Ivy came from Europe (36 | 5.3%), Ireland (25 | 3.7%), Northern Europe (25 | 3.7%), Asia (21 | 3.1%), and Iran (21 | 3.1%), together accounting for 18.8% of all Ivy residents.
| Immigration Origin | # Population | % Population |
| Asia | 21 | 3.1% |
| Europe | 36 | 5.3% |
| France | 11 | 1.6% |
| Iran | 21 | 3.1% |
| Ireland | 25 | 3.7% |
| Northern Europe | 25 | 3.7% |
| South Central Asia | 21 | 3.1% |
| Western Europe | 11 | 1.6% | View All 8 Rows |
Sex and Age in Ivy
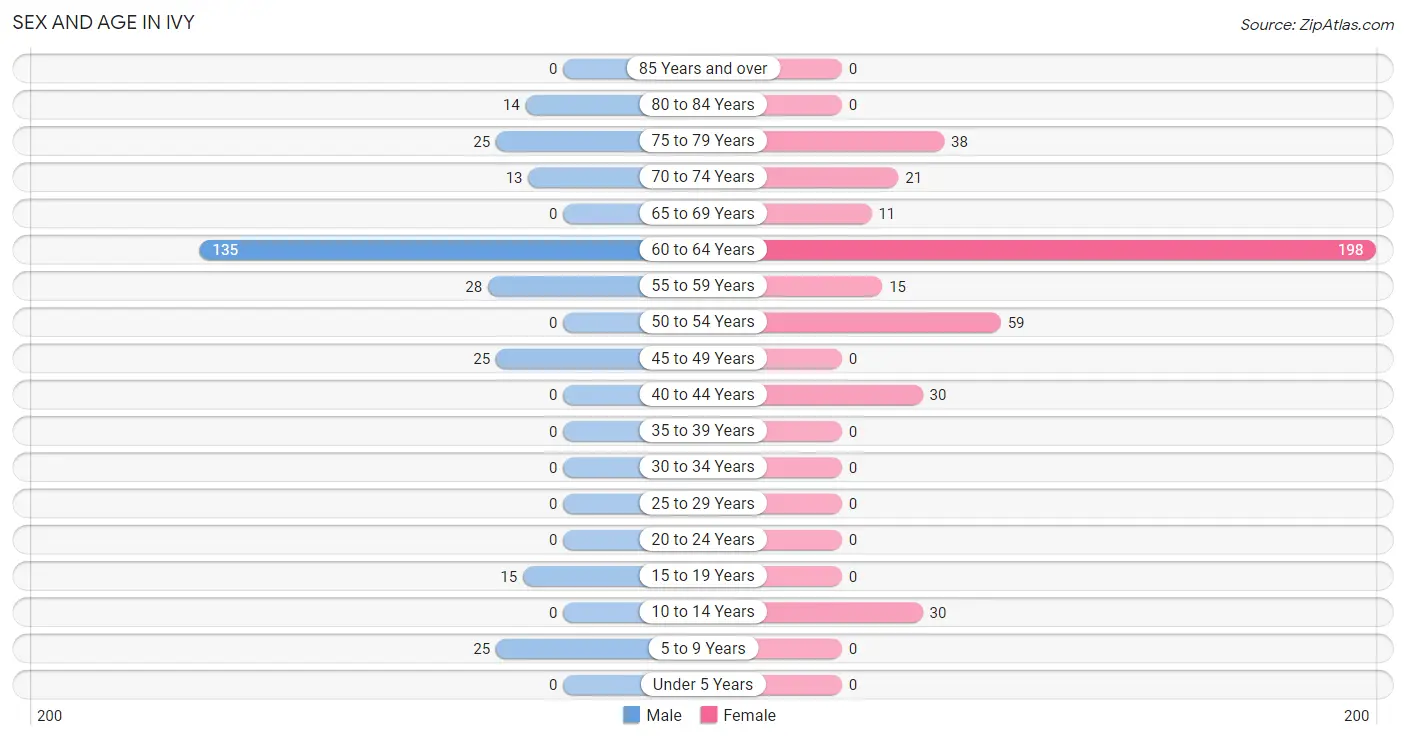
Sex and Age in Ivy
The most populous age groups in Ivy are 60 to 64 Years (135 | 48.2%) for men and 60 to 64 Years (198 | 49.2%) for women.
| Age Bracket | Male | Female |
| Under 5 Years | 0 (0.0%) | 0 (0.0%) |
| 5 to 9 Years | 25 (8.9%) | 0 (0.0%) |
| 10 to 14 Years | 0 (0.0%) | 30 (7.5%) |
| 15 to 19 Years | 15 (5.4%) | 0 (0.0%) |
| 20 to 24 Years | 0 (0.0%) | 0 (0.0%) |
| 25 to 29 Years | 0 (0.0%) | 0 (0.0%) |
| 30 to 34 Years | 0 (0.0%) | 0 (0.0%) |
| 35 to 39 Years | 0 (0.0%) | 0 (0.0%) |
| 40 to 44 Years | 0 (0.0%) | 30 (7.5%) |
| 45 to 49 Years | 25 (8.9%) | 0 (0.0%) |
| 50 to 54 Years | 0 (0.0%) | 59 (14.7%) |
| 55 to 59 Years | 28 (10.0%) | 15 (3.7%) |
| 60 to 64 Years | 135 (48.2%) | 198 (49.2%) |
| 65 to 69 Years | 0 (0.0%) | 11 (2.7%) |
| 70 to 74 Years | 13 (4.6%) | 21 (5.2%) |
| 75 to 79 Years | 25 (8.9%) | 38 (9.5%) |
| 80 to 84 Years | 14 (5.0%) | 0 (0.0%) |
| 85 Years and over | 0 (0.0%) | 0 (0.0%) |
| Total | 280 (100.0%) | 402 (100.0%) |
Families and Households in Ivy
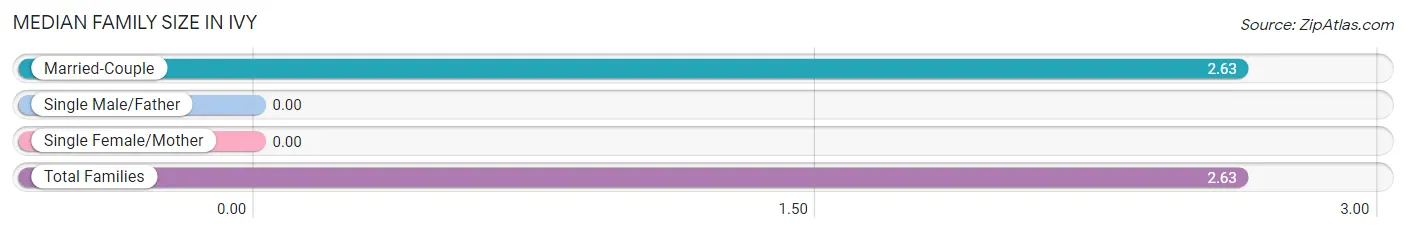
Median Family Size in Ivy
| Family Type | # Families | Family Size |
| Married-Couple | 118 (100.0%) | 2.63 |
| Single Male/Father | 0 (0.0%) | - |
| Single Female/Mother | 0 (0.0%) | - |
| Total Families | 118 (100.0%) | 2.63 |
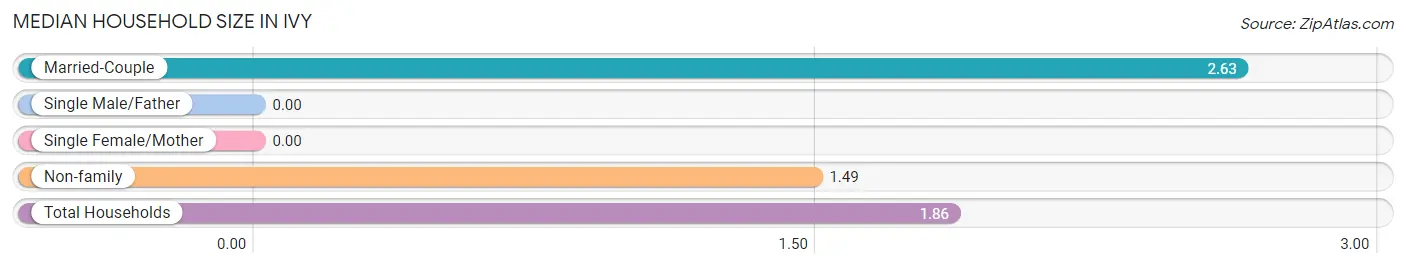
Median Household Size in Ivy
| Household Type | # Households | Household Size |
| Married-Couple | 118 (32.2%) | 2.63 |
| Single Male/Father | 0 (0.0%) | - |
| Single Female/Mother | 0 (0.0%) | - |
| Non-family | 249 (67.8%) | 1.49 |
| Total Households | 367 (100.0%) | 1.86 |
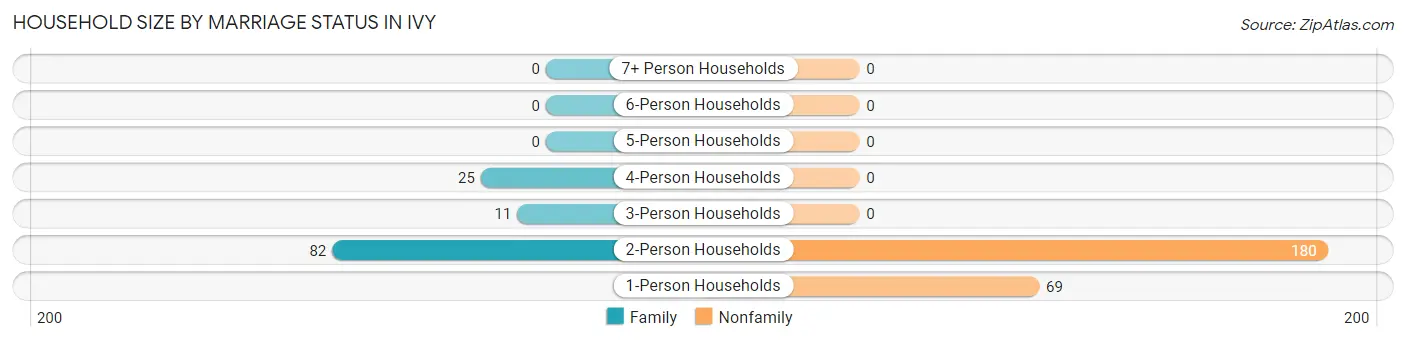
Household Size by Marriage Status in Ivy
Out of a total of 367 households in Ivy, 118 (32.2%) are family households, while 249 (67.8%) are nonfamily households. The most numerous type of family households are 2-person households, comprising 82, and the most common type of nonfamily households are 2-person households, comprising 180.
| Household Size | Family Households | Nonfamily Households |
| 1-Person Households | - | 69 (18.8%) |
| 2-Person Households | 82 (22.3%) | 180 (49.0%) |
| 3-Person Households | 11 (3.0%) | 0 (0.0%) |
| 4-Person Households | 25 (6.8%) | 0 (0.0%) |
| 5-Person Households | 0 (0.0%) | 0 (0.0%) |
| 6-Person Households | 0 (0.0%) | 0 (0.0%) |
| 7+ Person Households | 0 (0.0%) | 0 (0.0%) |
| Total | 118 (32.2%) | 249 (67.8%) |
Female Fertility in Ivy
Fertility by Age in Ivy
| Age Bracket | Women with Births | Births / 1,000 Women |
| 15 to 19 years | 0 (0.0%) | 0.0 |
| 20 to 34 years | 0 (0.0%) | 0.0 |
| 35 to 50 years | 0 (0.0%) | 0.0 |
| Total | 0 (0.0%) | 0.0 |
Fertility by Age by Marriage Status in Ivy
| Age Bracket | Married | Unmarried |
| 15 to 19 years | 0 (0.0%) | 0 (0.0%) |
| 20 to 34 years | 0 (0.0%) | 0 (0.0%) |
| 35 to 50 years | 0 (0.0%) | 0 (0.0%) |
| Total | 0 (0.0%) | 0 (0.0%) |
Fertility by Education in Ivy
| Educational Attainment | Women with Births | Births / 1,000 Women |
| Less than High School | 0 (0.0%) | 0.0 |
| High School Diploma | 0 (0.0%) | 0.0 |
| College or Associate's Degree | 0 (0.0%) | 0.0 |
| Bachelor's Degree | 0 (0.0%) | 0.0 |
| Graduate Degree | 0 (0.0%) | 0.0 |
| Total | 0 (0.0%) | 0.0 |
Fertility by Education by Marriage Status in Ivy
| Educational Attainment | Married | Unmarried |
| Less than High School | 0 (0.0%) | 0 (0.0%) |
| High School Diploma | 0 (0.0%) | 0 (0.0%) |
| College or Associate's Degree | 0 (0.0%) | 0 (0.0%) |
| Bachelor's Degree | 0 (0.0%) | 0 (0.0%) |
| Graduate Degree | 0 (0.0%) | 0 (0.0%) |
| Total | 0 (0.0%) | 0 (0.0%) |
Income in Ivy
Income Overview in Ivy
Per Capita Income in Ivy is $95,055, while median incomes of families and households are $148,846 and $176,304 respectively.
| Characteristic | Number | Measure |
| Per Capita Income | 682 | $95,055 |
| Median Family Income | 118 | $148,846 |
| Mean Family Income | 118 | $172,728 |
| Median Household Income | 367 | $176,304 |
| Mean Household Income | 367 | $187,740 |
| Income Deficit | 118 | $0 |
| Wage / Income Gap (%) | 682 | 0.00% |
| Wage / Income Gap ($) | 682 | 100.00¢ per $1 |
| Gini / Inequality Index | 682 | 0.21 |
Earnings by Sex in Ivy
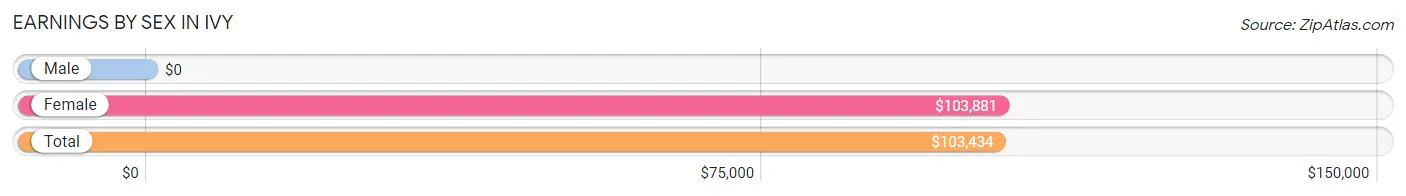
| Sex | Number | Average Earnings |
| Male | 58 (14.7%) | $0 |
| Female | 337 (85.3%) | $103,881 |
| Total | 395 (100.0%) | $103,434 |
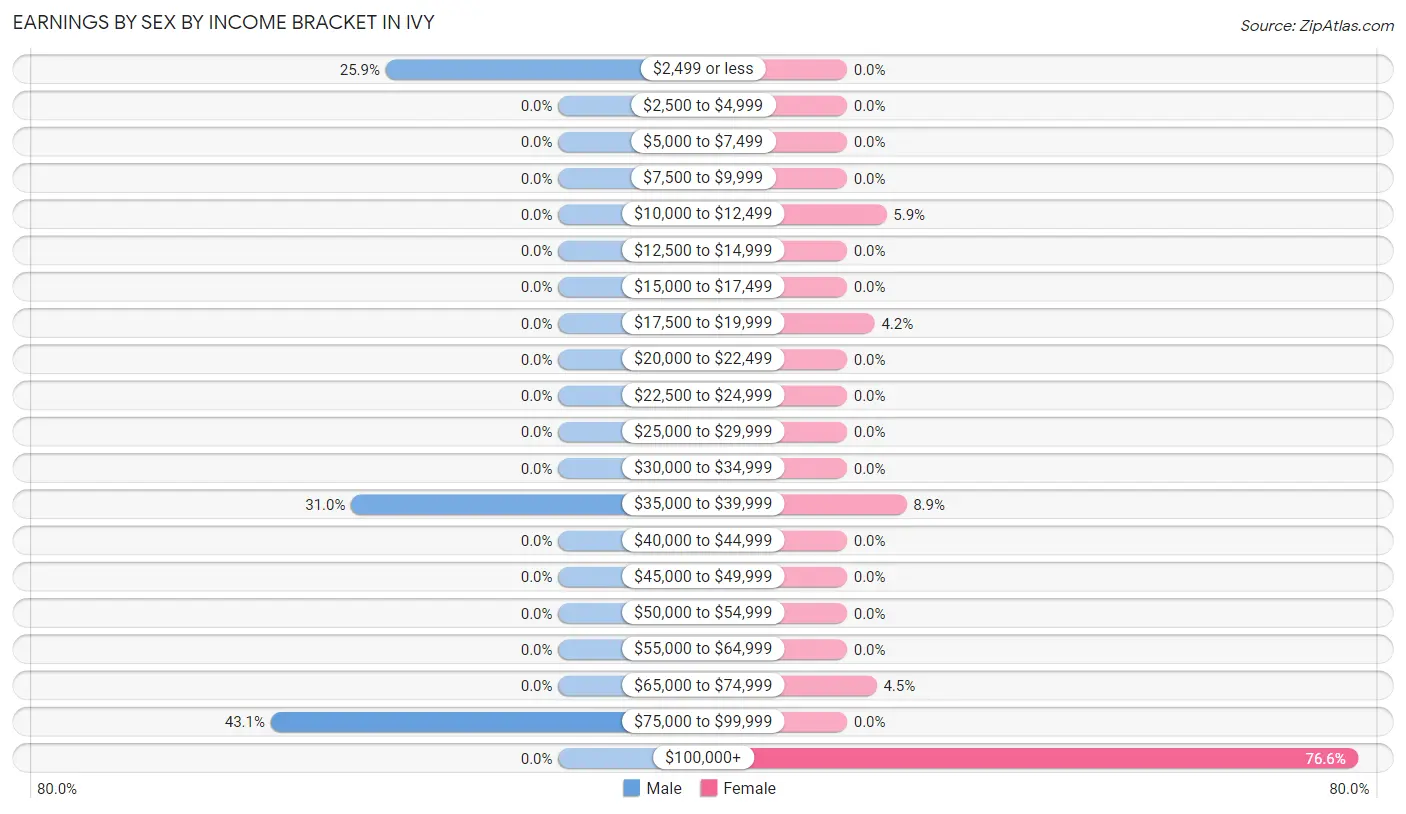
Earnings by Sex by Income Bracket in Ivy
The most common earnings brackets in Ivy are $75,000 to $99,999 for men (25 | 43.1%) and $100,000+ for women (258 | 76.6%).
| Income | Male | Female |
| $2,499 or less | 15 (25.9%) | 0 (0.0%) |
| $2,500 to $4,999 | 0 (0.0%) | 0 (0.0%) |
| $5,000 to $7,499 | 0 (0.0%) | 0 (0.0%) |
| $7,500 to $9,999 | 0 (0.0%) | 0 (0.0%) |
| $10,000 to $12,499 | 0 (0.0%) | 20 (5.9%) |
| $12,500 to $14,999 | 0 (0.0%) | 0 (0.0%) |
| $15,000 to $17,499 | 0 (0.0%) | 0 (0.0%) |
| $17,500 to $19,999 | 0 (0.0%) | 14 (4.2%) |
| $20,000 to $22,499 | 0 (0.0%) | 0 (0.0%) |
| $22,500 to $24,999 | 0 (0.0%) | 0 (0.0%) |
| $25,000 to $29,999 | 0 (0.0%) | 0 (0.0%) |
| $30,000 to $34,999 | 0 (0.0%) | 0 (0.0%) |
| $35,000 to $39,999 | 18 (31.0%) | 30 (8.9%) |
| $40,000 to $44,999 | 0 (0.0%) | 0 (0.0%) |
| $45,000 to $49,999 | 0 (0.0%) | 0 (0.0%) |
| $50,000 to $54,999 | 0 (0.0%) | 0 (0.0%) |
| $55,000 to $64,999 | 0 (0.0%) | 0 (0.0%) |
| $65,000 to $74,999 | 0 (0.0%) | 15 (4.4%) |
| $75,000 to $99,999 | 25 (43.1%) | 0 (0.0%) |
| $100,000+ | 0 (0.0%) | 258 (76.6%) |
| Total | 58 (100.0%) | 337 (100.0%) |
Earnings by Sex by Educational Attainment in Ivy
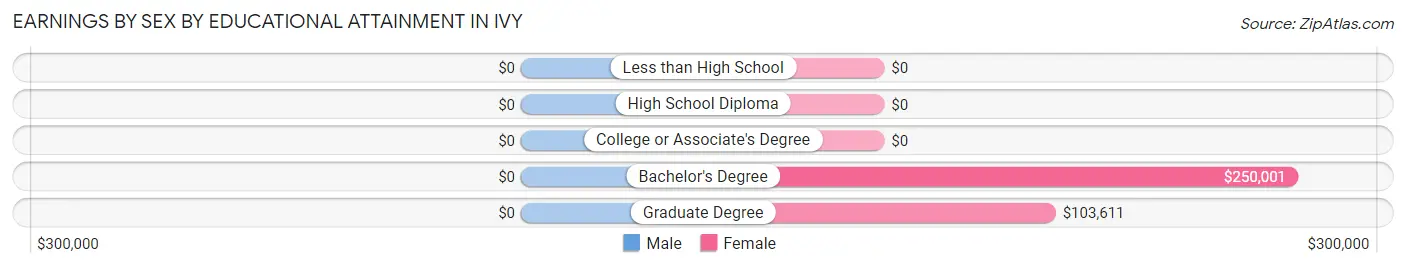
| Educational Attainment | Male Income | Female Income |
| Less than High School | - | - |
| High School Diploma | - | - |
| College or Associate's Degree | - | - |
| Bachelor's Degree | - | - |
| Graduate Degree | - | - |
| Total | - | - |
Family Income in Ivy
Family Income Brackets in Ivy
According to the Ivy family income data, there are 51 families falling into the $100,000 to $149,999 income range, which is the most common income bracket and makes up 43.2% of all families.
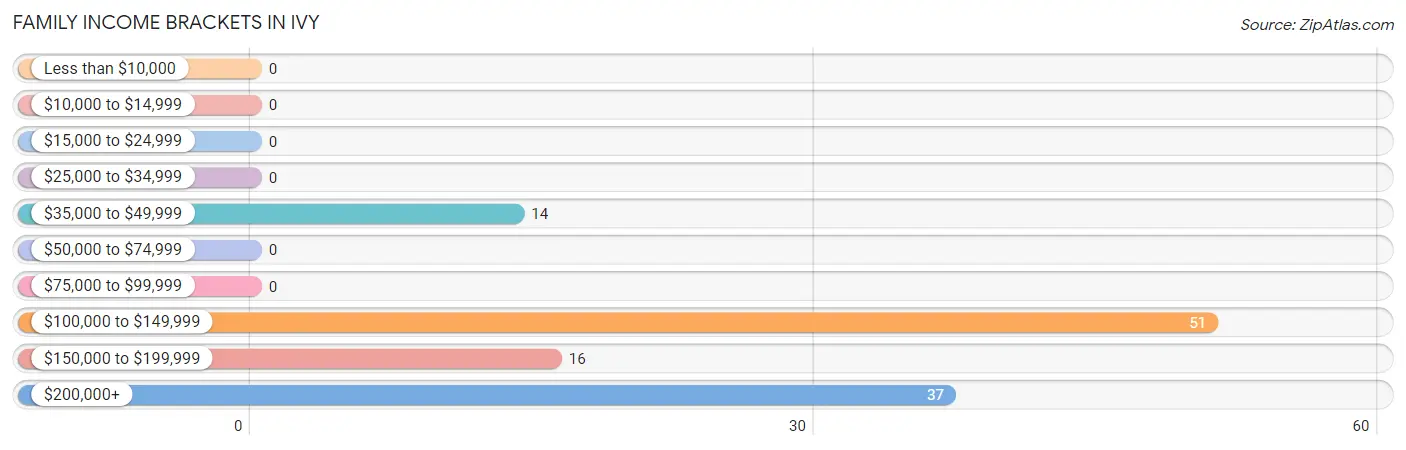
| Income Bracket | # Families | % Families |
| Less than $10,000 | 0 | 0.0% |
| $10,000 to $14,999 | 0 | 0.0% |
| $15,000 to $24,999 | 0 | 0.0% |
| $25,000 to $34,999 | 0 | 0.0% |
| $35,000 to $49,999 | 14 | 11.9% |
| $50,000 to $74,999 | 0 | 0.0% |
| $75,000 to $99,999 | 0 | 0.0% |
| $100,000 to $149,999 | 51 | 43.2% |
| $150,000 to $199,999 | 16 | 13.6% |
| $200,000+ | 37 | 31.4% |
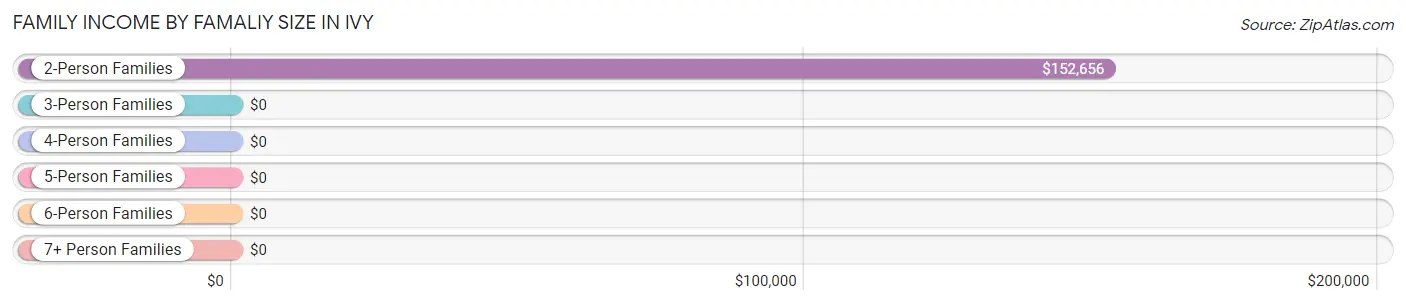
Family Income by Famaliy Size in Ivy
2-person families (82 | 69.5%) account for the highest median family income in Ivy with $152,656 per family, while 2-person families (82 | 69.5%) have the highest median income of $76,328 per family member.
| Income Bracket | # Families | Median Income |
| 2-Person Families | 82 (69.5%) | $152,656 |
| 3-Person Families | 11 (9.3%) | $0 |
| 4-Person Families | 25 (21.2%) | $0 |
| 5-Person Families | 0 (0.0%) | $0 |
| 6-Person Families | 0 (0.0%) | $0 |
| 7+ Person Families | 0 (0.0%) | $0 |
| Total | 118 (100.0%) | $148,846 |
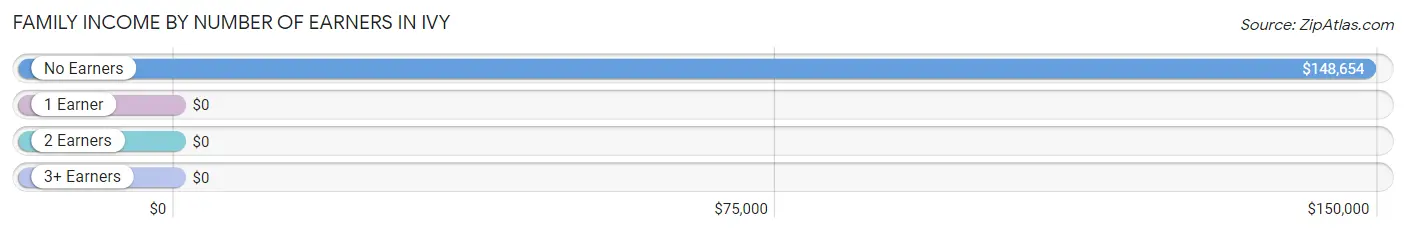
Family Income by Number of Earners in Ivy
| Number of Earners | # Families | Median Income |
| No Earners | 38 (32.2%) | $148,654 |
| 1 Earner | 44 (37.3%) | $0 |
| 2 Earners | 36 (30.5%) | $0 |
| 3+ Earners | 0 (0.0%) | $0 |
| Total | 118 (100.0%) | $148,846 |
Household Income in Ivy
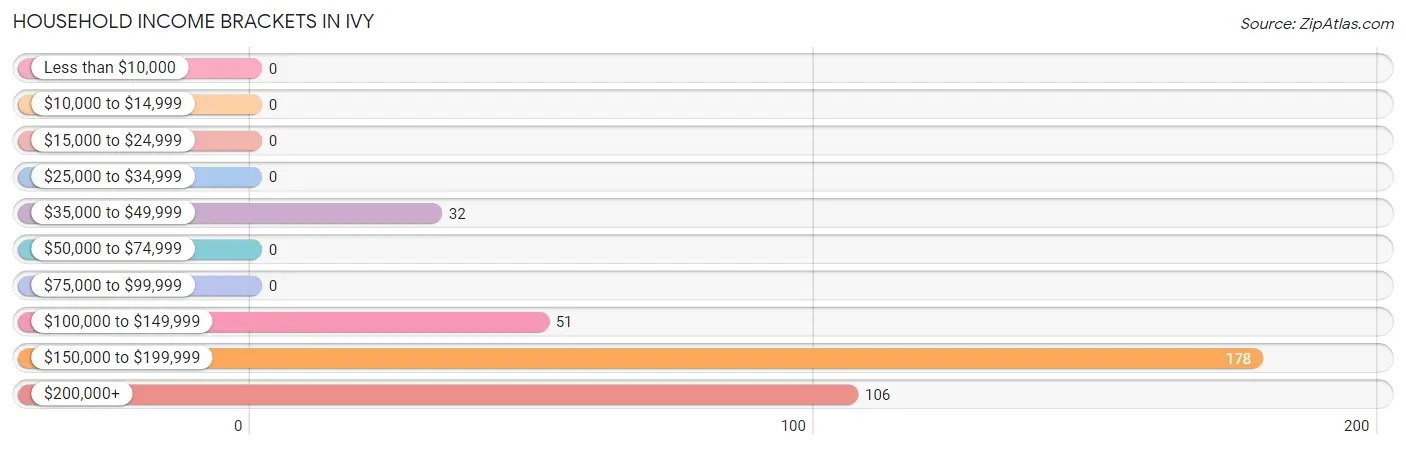
Household Income Brackets in Ivy
With 178 households falling in the category, the $150,000 to $199,999 income range is the most frequent in Ivy, accounting for 48.5% of all households.
| Income Bracket | # Households | % Households |
| Less than $10,000 | 0 | 0.0% |
| $10,000 to $14,999 | 0 | 0.0% |
| $15,000 to $24,999 | 0 | 0.0% |
| $25,000 to $34,999 | 0 | 0.0% |
| $35,000 to $49,999 | 32 | 8.7% |
| $50,000 to $74,999 | 0 | 0.0% |
| $75,000 to $99,999 | 0 | 0.0% |
| $100,000 to $149,999 | 51 | 13.9% |
| $150,000 to $199,999 | 178 | 48.5% |
| $200,000+ | 106 | 28.9% |
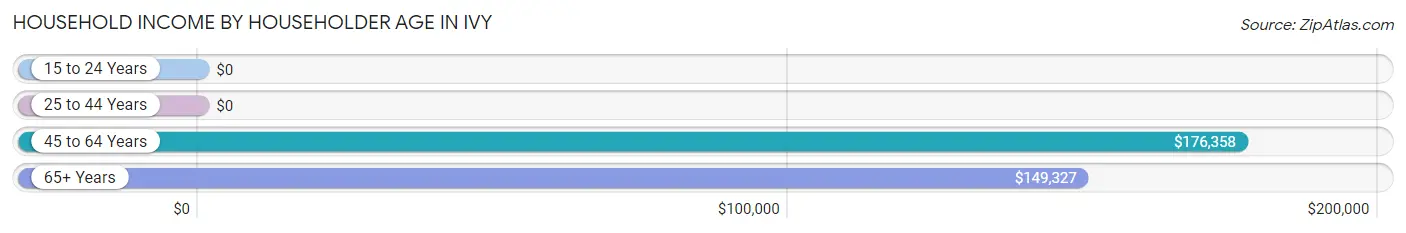
Household Income by Householder Age in Ivy
The median household income in Ivy is $176,304, with the highest median household income of $176,358 found in the 45 to 64 years age bracket for the primary householder. A total of 294 households (80.1%) fall into this category.
| Income Bracket | # Households | Median Income |
| 15 to 24 Years | 0 (0.0%) | $0 |
| 25 to 44 Years | 0 (0.0%) | $0 |
| 45 to 64 Years | 294 (80.1%) | $176,358 |
| 65+ Years | 73 (19.9%) | $149,327 |
| Total | 367 (100.0%) | $176,304 |
Poverty in Ivy
Income Below Poverty by Sex and Age in Ivy
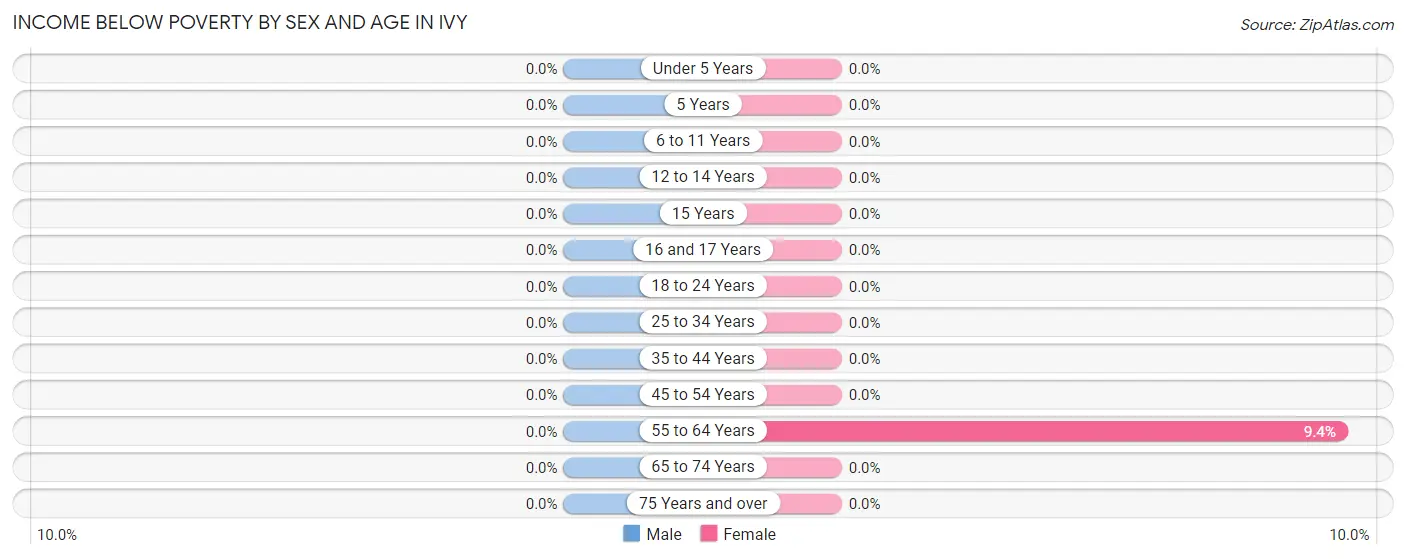
| Age Bracket | Male | Female |
| Under 5 Years | 0 (0.0%) | 0 (0.0%) |
| 5 Years | 0 (0.0%) | 0 (0.0%) |
| 6 to 11 Years | 0 (0.0%) | 0 (0.0%) |
| 12 to 14 Years | 0 (0.0%) | 0 (0.0%) |
| 15 Years | 0 (0.0%) | 0 (0.0%) |
| 16 and 17 Years | 0 (0.0%) | 0 (0.0%) |
| 18 to 24 Years | 0 (0.0%) | 0 (0.0%) |
| 25 to 34 Years | 0 (0.0%) | 0 (0.0%) |
| 35 to 44 Years | 0 (0.0%) | 0 (0.0%) |
| 45 to 54 Years | 0 (0.0%) | 0 (0.0%) |
| 55 to 64 Years | 0 (0.0%) | 20 (9.4%) |
| 65 to 74 Years | 0 (0.0%) | 0 (0.0%) |
| 75 Years and over | 0 (0.0%) | 0 (0.0%) |
| Total | 0 (0.0%) | 20 (5.0%) |
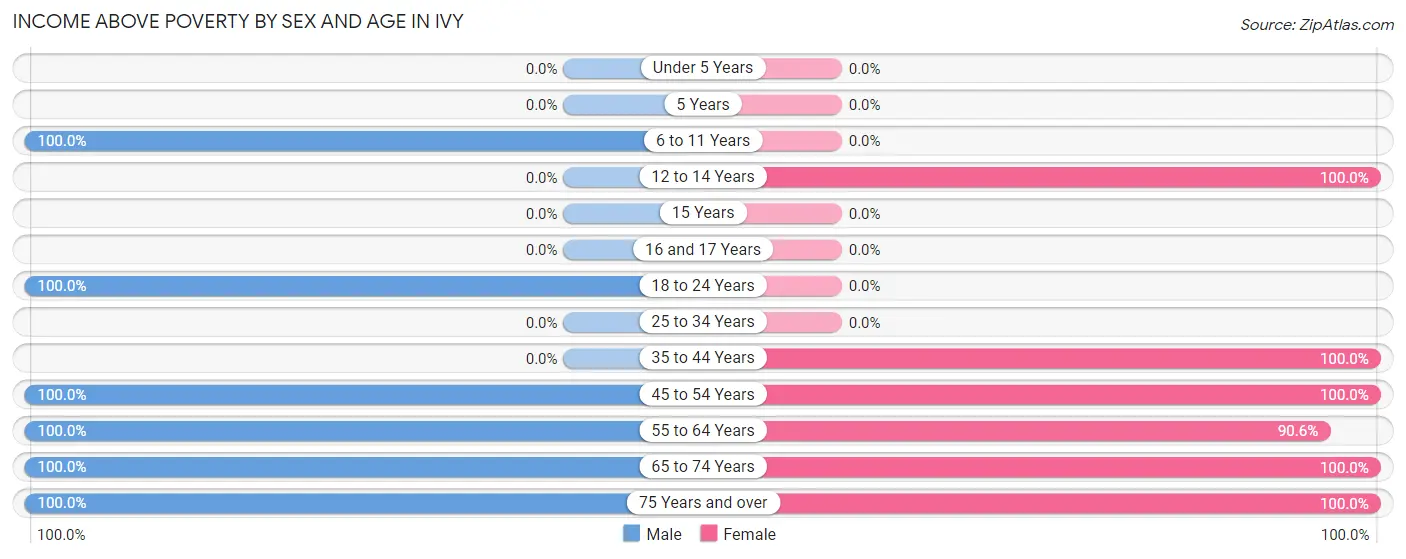
Income Above Poverty by Sex and Age in Ivy
According to the poverty statistics in Ivy, males aged 6 to 11 years and females aged 12 to 14 years are the age groups that are most secure financially, with 100.0% of males and 100.0% of females in these age groups living above the poverty line.
| Age Bracket | Male | Female |
| Under 5 Years | 0 (0.0%) | 0 (0.0%) |
| 5 Years | 0 (0.0%) | 0 (0.0%) |
| 6 to 11 Years | 25 (100.0%) | 0 (0.0%) |
| 12 to 14 Years | 0 (0.0%) | 30 (100.0%) |
| 15 Years | 0 (0.0%) | 0 (0.0%) |
| 16 and 17 Years | 0 (0.0%) | 0 (0.0%) |
| 18 to 24 Years | 15 (100.0%) | 0 (0.0%) |
| 25 to 34 Years | 0 (0.0%) | 0 (0.0%) |
| 35 to 44 Years | 0 (0.0%) | 30 (100.0%) |
| 45 to 54 Years | 25 (100.0%) | 59 (100.0%) |
| 55 to 64 Years | 163 (100.0%) | 193 (90.6%) |
| 65 to 74 Years | 13 (100.0%) | 32 (100.0%) |
| 75 Years and over | 39 (100.0%) | 38 (100.0%) |
| Total | 280 (100.0%) | 382 (95.0%) |
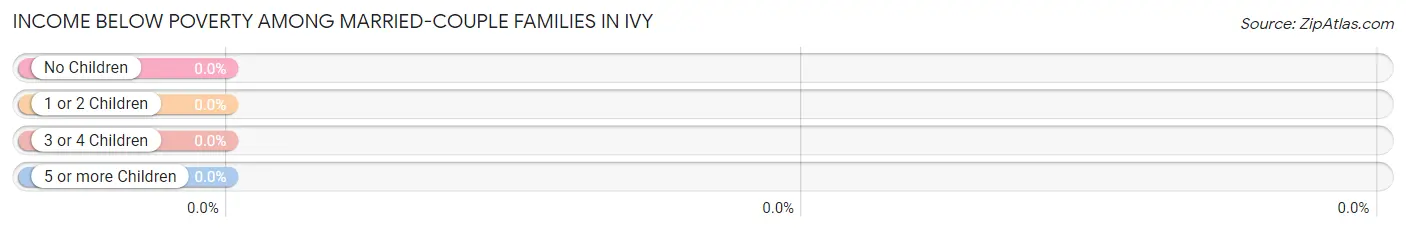
Income Below Poverty Among Married-Couple Families in Ivy
| Children | Above Poverty | Below Poverty |
| No Children | 93 (100.0%) | 0 (0.0%) |
| 1 or 2 Children | 25 (100.0%) | 0 (0.0%) |
| 3 or 4 Children | 0 (0.0%) | 0 (0.0%) |
| 5 or more Children | 0 (0.0%) | 0 (0.0%) |
| Total | 118 (100.0%) | 0 (0.0%) |
Income Below Poverty Among Single-Parent Households in Ivy
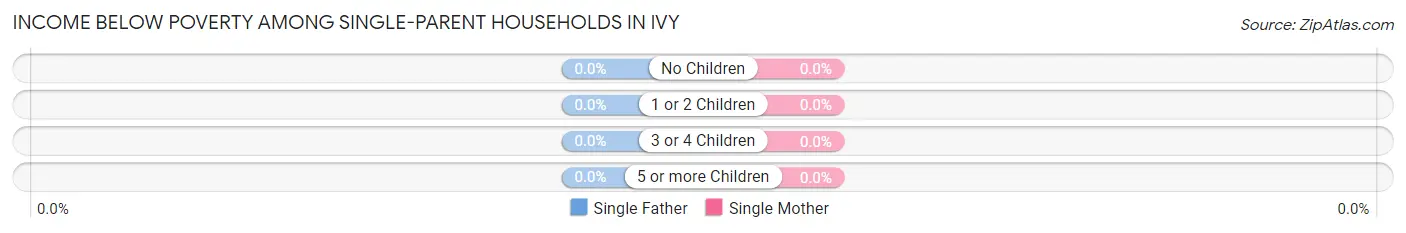
| Children | Single Father | Single Mother |
| No Children | 0 (0.0%) | 0 (0.0%) |
| 1 or 2 Children | 0 (0.0%) | 0 (0.0%) |
| 3 or 4 Children | 0 (0.0%) | 0 (0.0%) |
| 5 or more Children | 0 (0.0%) | 0 (0.0%) |
| Total | 0 (0.0%) | 0 (0.0%) |
Income Below Poverty Among Married-Couple vs Single-Parent Households in Ivy
| Children | Married-Couple Families | Single-Parent Households |
| No Children | 0 (0.0%) | 0 (0.0%) |
| 1 or 2 Children | 0 (0.0%) | 0 (0.0%) |
| 3 or 4 Children | 0 (0.0%) | 0 (0.0%) |
| 5 or more Children | 0 (0.0%) | 0 (0.0%) |
| Total | 0 (0.0%) | 0 (0.0%) |
Employment Characteristics in Ivy
Employment by Class of Employer in Ivy
Among the 366 employed individuals in Ivy, private company employees (276 | 75.4%), state government employees (57 | 15.6%), and self-employed (not incorporated) (18 | 4.9%) make up the most common classes of employment.
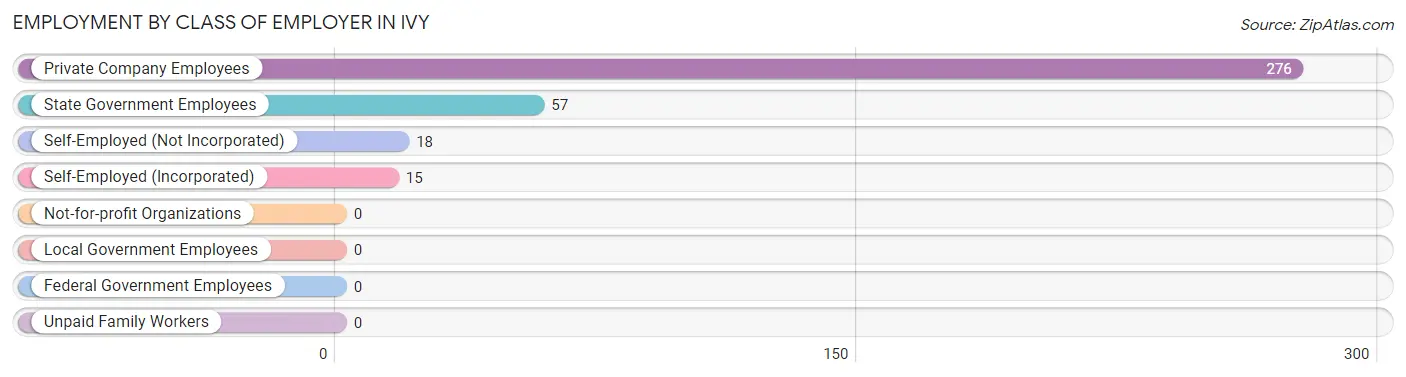
| Employer Class | # Employees | % Employees |
| Private Company Employees | 276 | 75.4% |
| Self-Employed (Incorporated) | 15 | 4.1% |
| Self-Employed (Not Incorporated) | 18 | 4.9% |
| Not-for-profit Organizations | 0 | 0.0% |
| Local Government Employees | 0 | 0.0% |
| State Government Employees | 57 | 15.6% |
| Federal Government Employees | 0 | 0.0% |
| Unpaid Family Workers | 0 | 0.0% |
| Total | 366 | 100.0% |
Employment Status by Age in Ivy
According to the labor force statistics for Ivy, out of the total population over 16 years of age (627), 74.8% or 469 individuals are in the labor force, with 22.0% or 103 of them unemployed. The age group with the highest labor force participation rate is 35 to 44 years, with 100.0% or 30 individuals in the labor force. Within the labor force, the 60 to 64 years age range has the highest percentage of unemployed individuals, with 32.3% or 103 of them being unemployed.
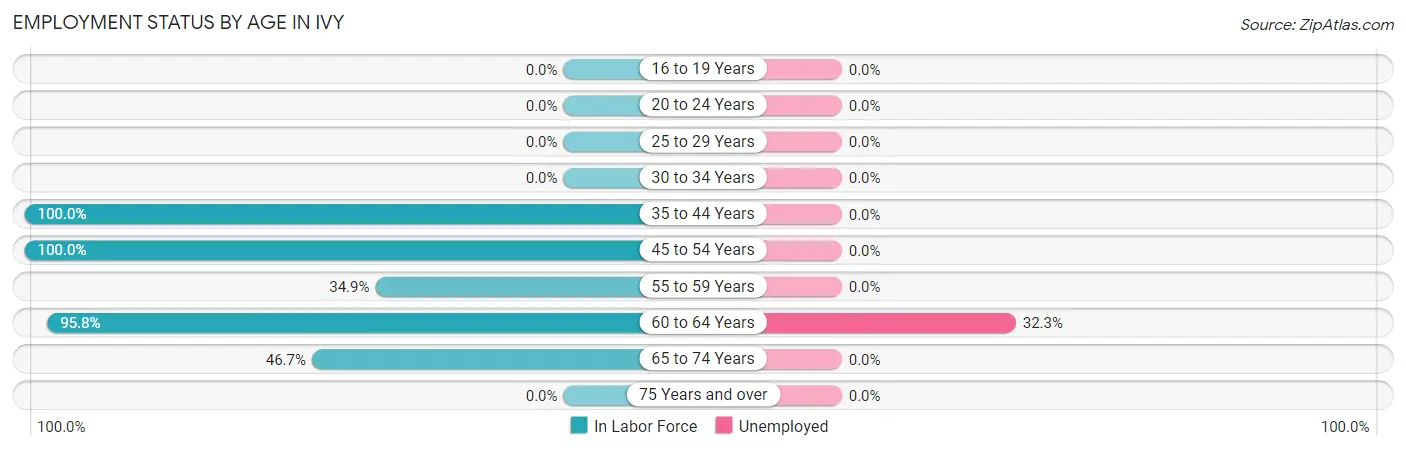
| Age Bracket | In Labor Force | Unemployed |
| 16 to 19 Years | 0 (0.0%) | 0 (0.0%) |
| 20 to 24 Years | 0 (0.0%) | 0 (0.0%) |
| 25 to 29 Years | 0 (0.0%) | 0 (0.0%) |
| 30 to 34 Years | 0 (0.0%) | 0 (0.0%) |
| 35 to 44 Years | 30 (100.0%) | 0 (0.0%) |
| 45 to 54 Years | 84 (100.0%) | 0 (0.0%) |
| 55 to 59 Years | 15 (34.9%) | 0 (0.0%) |
| 60 to 64 Years | 319 (95.8%) | 103 (32.3%) |
| 65 to 74 Years | 21 (46.7%) | 0 (0.0%) |
| 75 Years and over | 0 (0.0%) | 0 (0.0%) |
| Total | 469 (74.8%) | 103 (22.0%) |
Employment Status by Educational Attainment in Ivy
According to labor force statistics for Ivy, 91.4% of individuals (448) out of the total population between 25 and 64 years of age (490) are in the labor force, with 23.0% or 103 of them being unemployed. The group with the highest labor force participation rate are those with the educational attainment of bachelor's degree or higher, with 94.3% or 448 individuals in the labor force. Within the labor force, individuals with bachelor's degree or higher education have the highest percentage of unemployment, with 23.0% or 103 of them being unemployed.
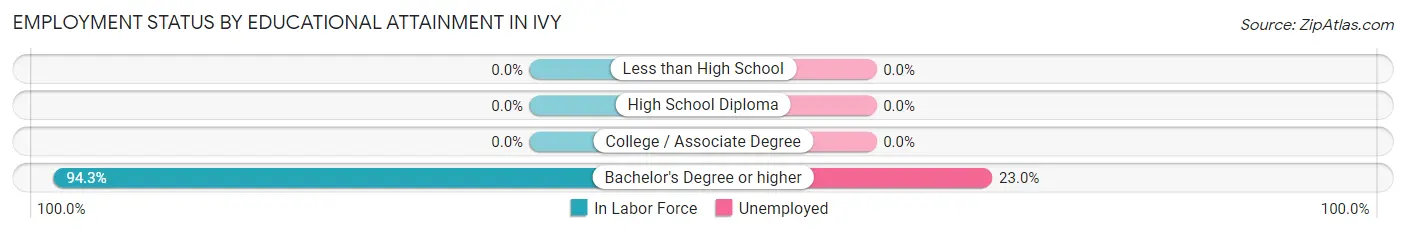
| Educational Attainment | In Labor Force | Unemployed |
| Less than High School | 0 (0.0%) | 0 (0.0%) |
| High School Diploma | 0 (0.0%) | 0 (0.0%) |
| College / Associate Degree | 0 (0.0%) | 0 (0.0%) |
| Bachelor's Degree or higher | 448 (94.3%) | 109 (23.0%) |
| Total | 448 (91.4%) | 113 (23.0%) |
Employment Occupations by Sex in Ivy
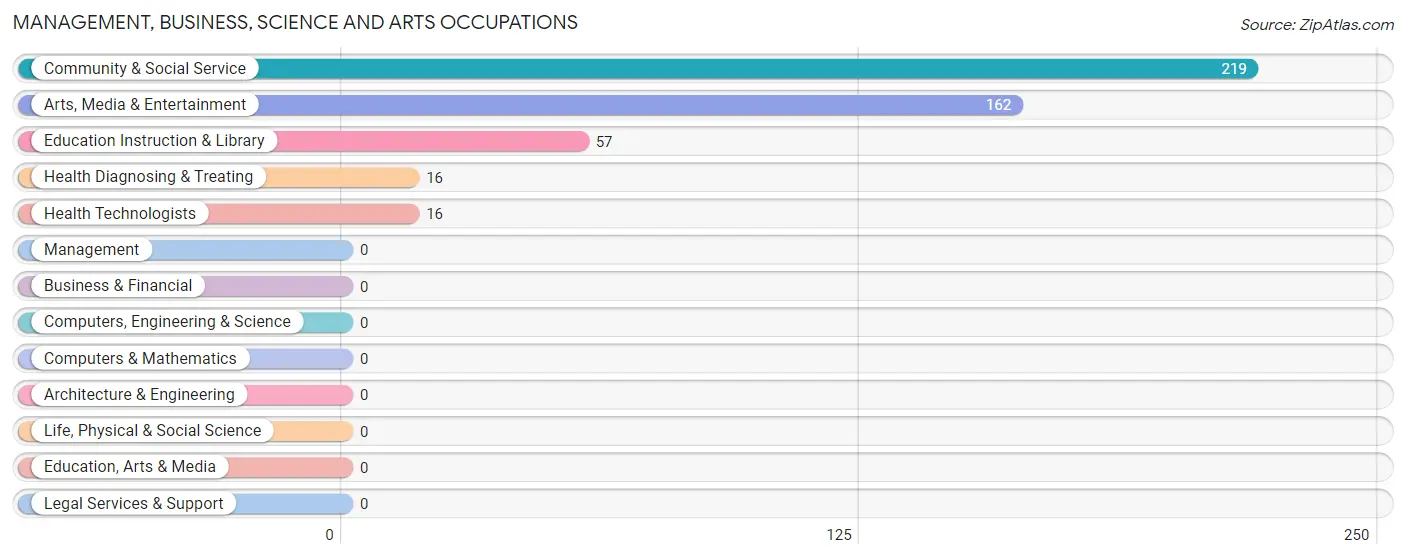
Management, Business, Science and Arts Occupations
The most common Management, Business, Science and Arts occupations in Ivy are Community & Social Service (219 | 59.8%), Arts, Media & Entertainment (162 | 44.3%), Education Instruction & Library (57 | 15.6%), Health Diagnosing & Treating (16 | 4.4%), and Health Technologists (16 | 4.4%).
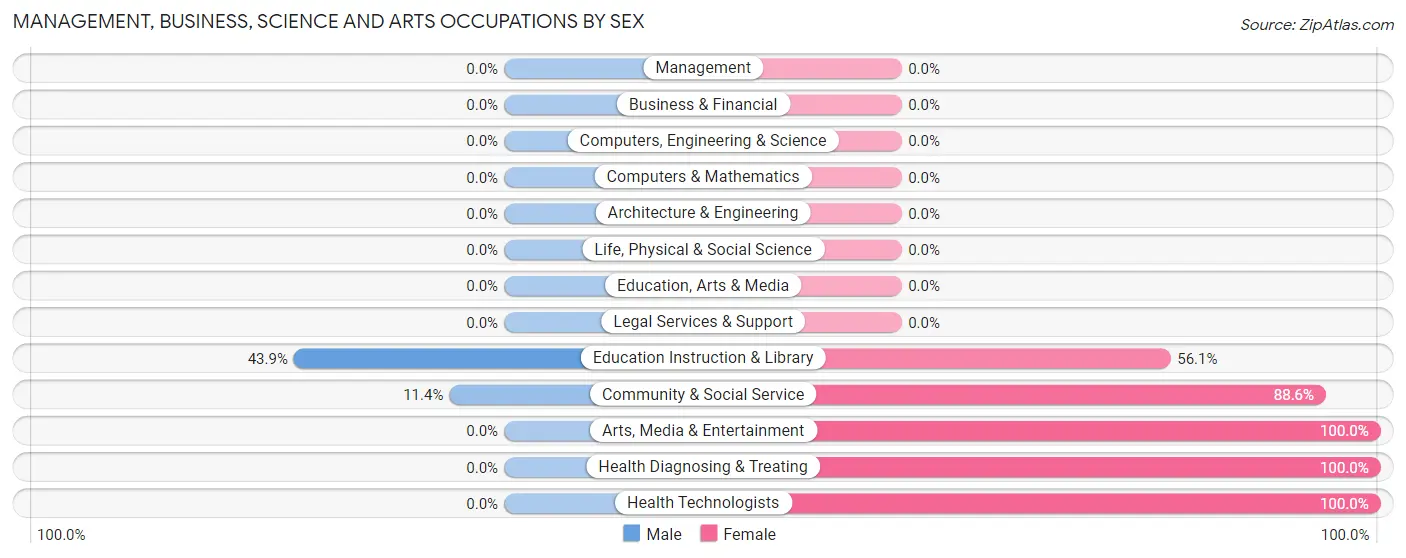
Management, Business, Science and Arts Occupations by Sex
Within the Management, Business, Science and Arts occupations in Ivy, the most male-oriented occupations are Education Instruction & Library (43.9%), and Community & Social Service (11.4%), while the most female-oriented occupations are Arts, Media & Entertainment (100.0%), Health Diagnosing & Treating (100.0%), and Health Technologists (100.0%).
| Occupation | Male | Female |
| Management | 0 (0.0%) | 0 (0.0%) |
| Business & Financial | 0 (0.0%) | 0 (0.0%) |
| Computers, Engineering & Science | 0 (0.0%) | 0 (0.0%) |
| Computers & Mathematics | 0 (0.0%) | 0 (0.0%) |
| Architecture & Engineering | 0 (0.0%) | 0 (0.0%) |
| Life, Physical & Social Science | 0 (0.0%) | 0 (0.0%) |
| Community & Social Service | 25 (11.4%) | 194 (88.6%) |
| Education, Arts & Media | 0 (0.0%) | 0 (0.0%) |
| Legal Services & Support | 0 (0.0%) | 0 (0.0%) |
| Education Instruction & Library | 25 (43.9%) | 32 (56.1%) |
| Arts, Media & Entertainment | 0 (0.0%) | 162 (100.0%) |
| Health Diagnosing & Treating | 0 (0.0%) | 16 (100.0%) |
| Health Technologists | 0 (0.0%) | 16 (100.0%) |
| Total (Category) | 25 (10.6%) | 210 (89.4%) |
| Total (Overall) | 43 (11.7%) | 323 (88.2%) |
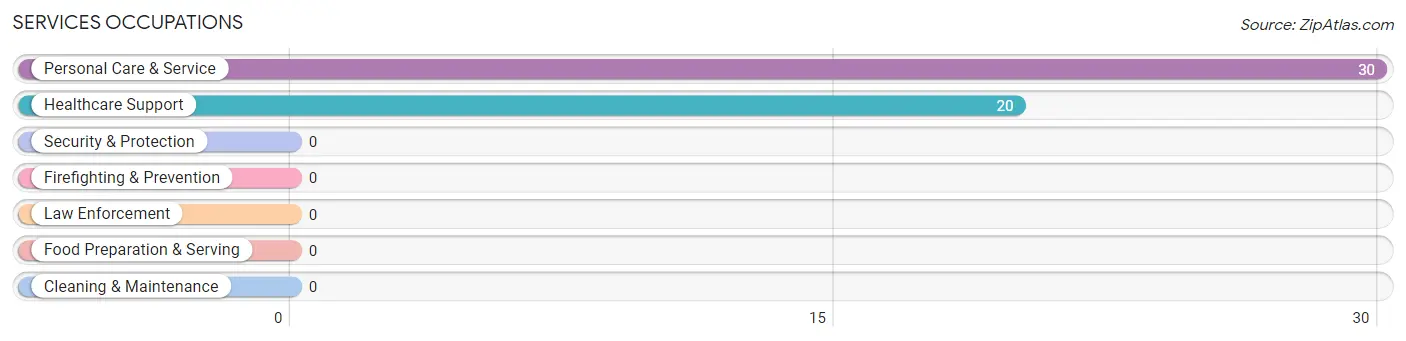
Services Occupations
The most common Services occupations in Ivy are Personal Care & Service (30 | 8.2%), and Healthcare Support (20 | 5.5%).
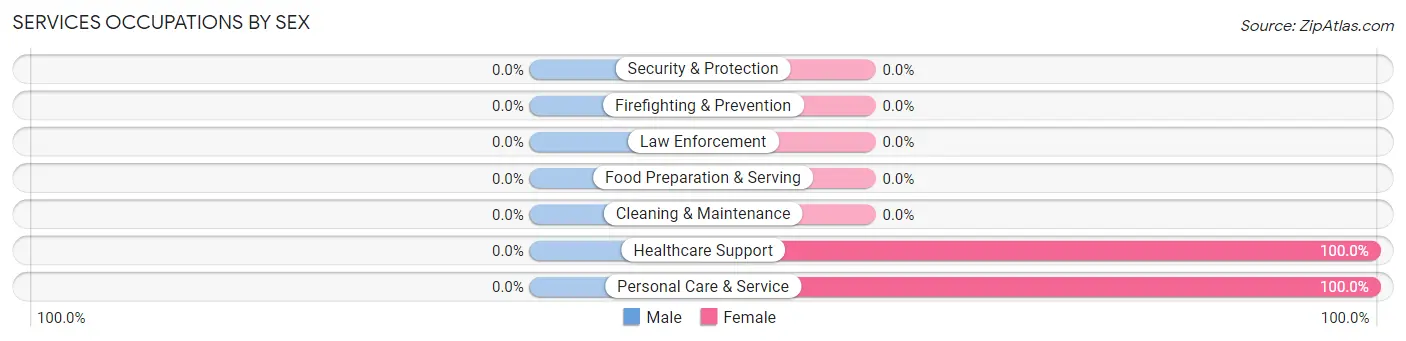
Services Occupations by Sex
| Occupation | Male | Female |
| Healthcare Support | 0 (0.0%) | 20 (100.0%) |
| Security & Protection | 0 (0.0%) | 0 (0.0%) |
| Firefighting & Prevention | 0 (0.0%) | 0 (0.0%) |
| Law Enforcement | 0 (0.0%) | 0 (0.0%) |
| Food Preparation & Serving | 0 (0.0%) | 0 (0.0%) |
| Cleaning & Maintenance | 0 (0.0%) | 0 (0.0%) |
| Personal Care & Service | 0 (0.0%) | 30 (100.0%) |
| Total (Category) | 0 (0.0%) | 50 (100.0%) |
| Total (Overall) | 43 (11.7%) | 323 (88.2%) |
Sales and Office Occupations
The most common Sales and Office occupations in Ivy are , and Sales & Related (63 | 17.2%).
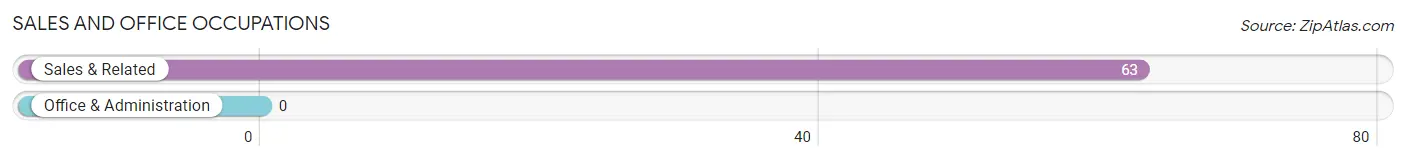
Sales and Office Occupations by Sex
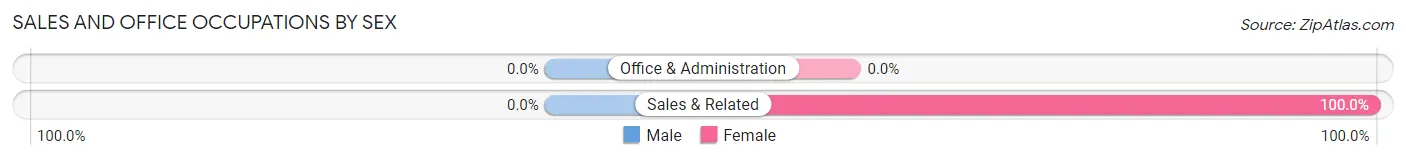
| Occupation | Male | Female |
| Sales & Related | 0 (0.0%) | 63 (100.0%) |
| Office & Administration | 0 (0.0%) | 0 (0.0%) |
| Total (Category) | 0 (0.0%) | 63 (100.0%) |
| Total (Overall) | 43 (11.7%) | 323 (88.2%) |
Natural Resources, Construction and Maintenance Occupations
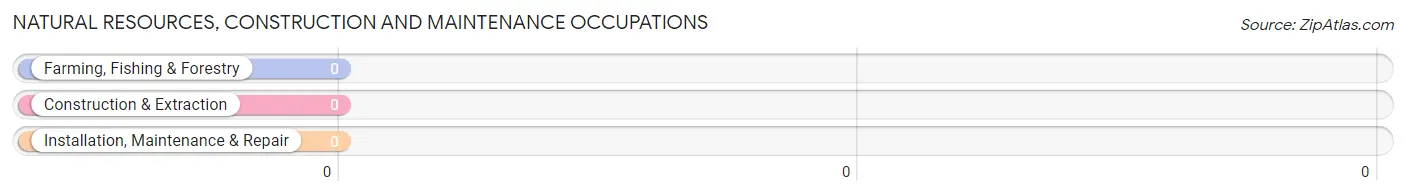
Natural Resources, Construction and Maintenance Occupations by Sex
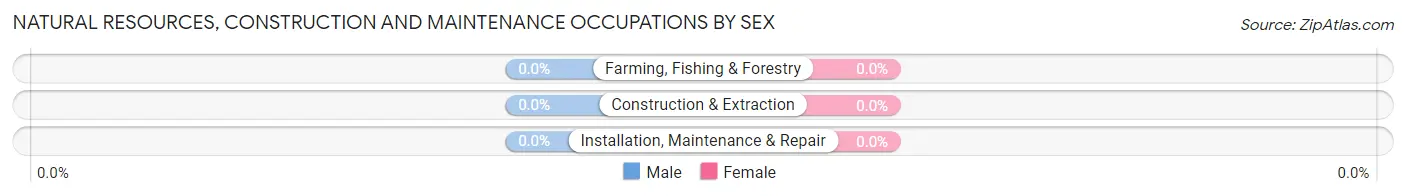
| Occupation | Male | Female |
| Farming, Fishing & Forestry | 0 (0.0%) | 0 (0.0%) |
| Construction & Extraction | 0 (0.0%) | 0 (0.0%) |
| Installation, Maintenance & Repair | 0 (0.0%) | 0 (0.0%) |
| Total (Category) | 0 (0.0%) | 0 (0.0%) |
| Total (Overall) | 43 (11.7%) | 323 (88.2%) |
Production, Transportation and Moving Occupations
The most common Production, Transportation and Moving occupations in Ivy are , and Material Moving (18 | 4.9%).
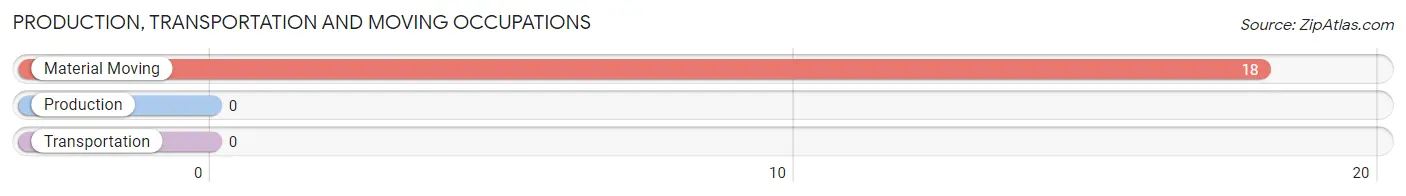
Production, Transportation and Moving Occupations by Sex
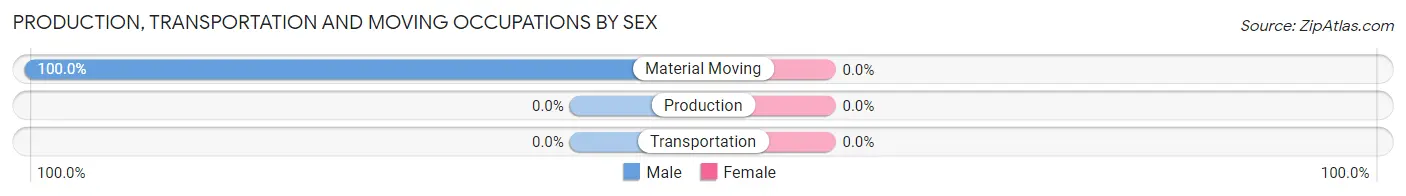
| Occupation | Male | Female |
| Production | 0 (0.0%) | 0 (0.0%) |
| Transportation | 0 (0.0%) | 0 (0.0%) |
| Material Moving | 18 (100.0%) | 0 (0.0%) |
| Total (Category) | 18 (100.0%) | 0 (0.0%) |
| Total (Overall) | 43 (11.7%) | 323 (88.2%) |
Employment Industries by Sex in Ivy
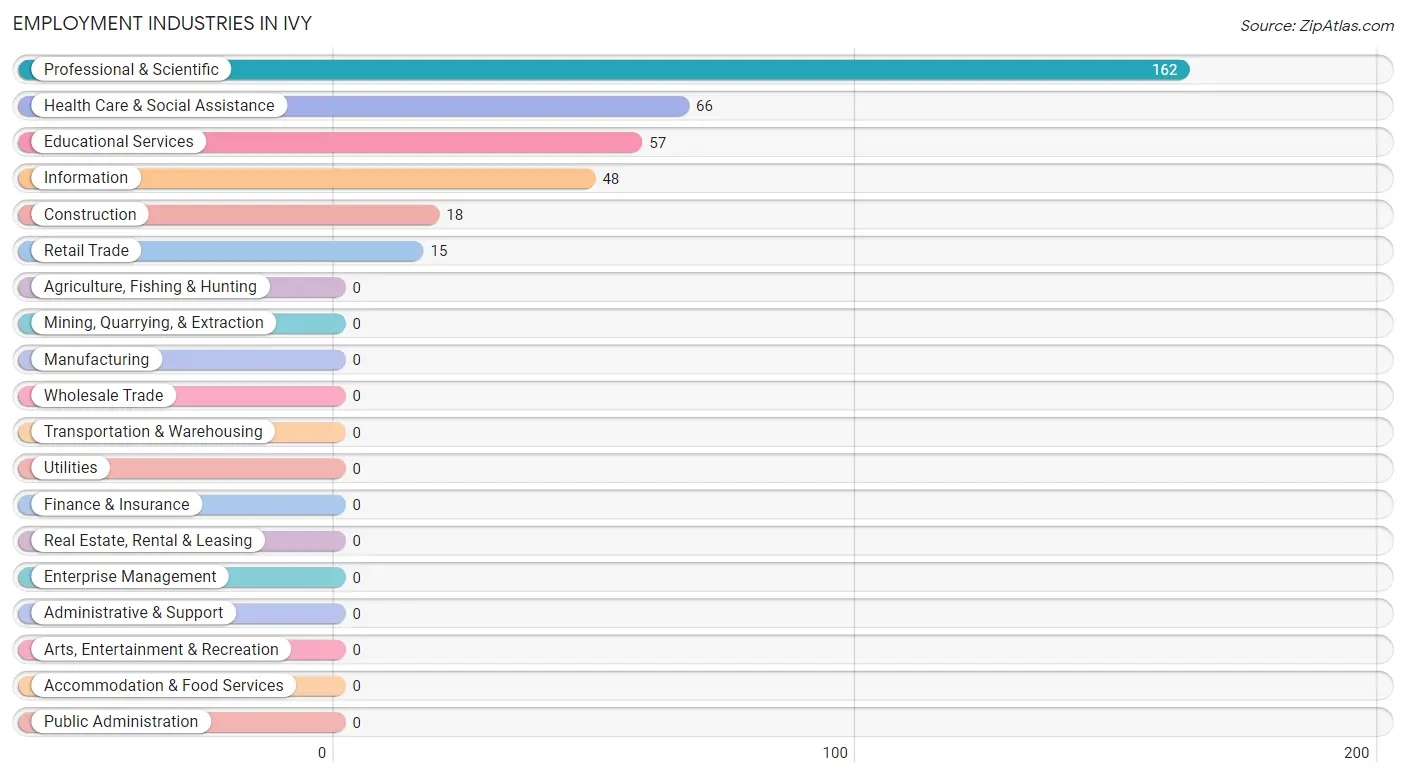
Employment Industries in Ivy
The major employment industries in Ivy include Professional & Scientific (162 | 44.3%), Health Care & Social Assistance (66 | 18.0%), Educational Services (57 | 15.6%), Information (48 | 13.1%), and Construction (18 | 4.9%).
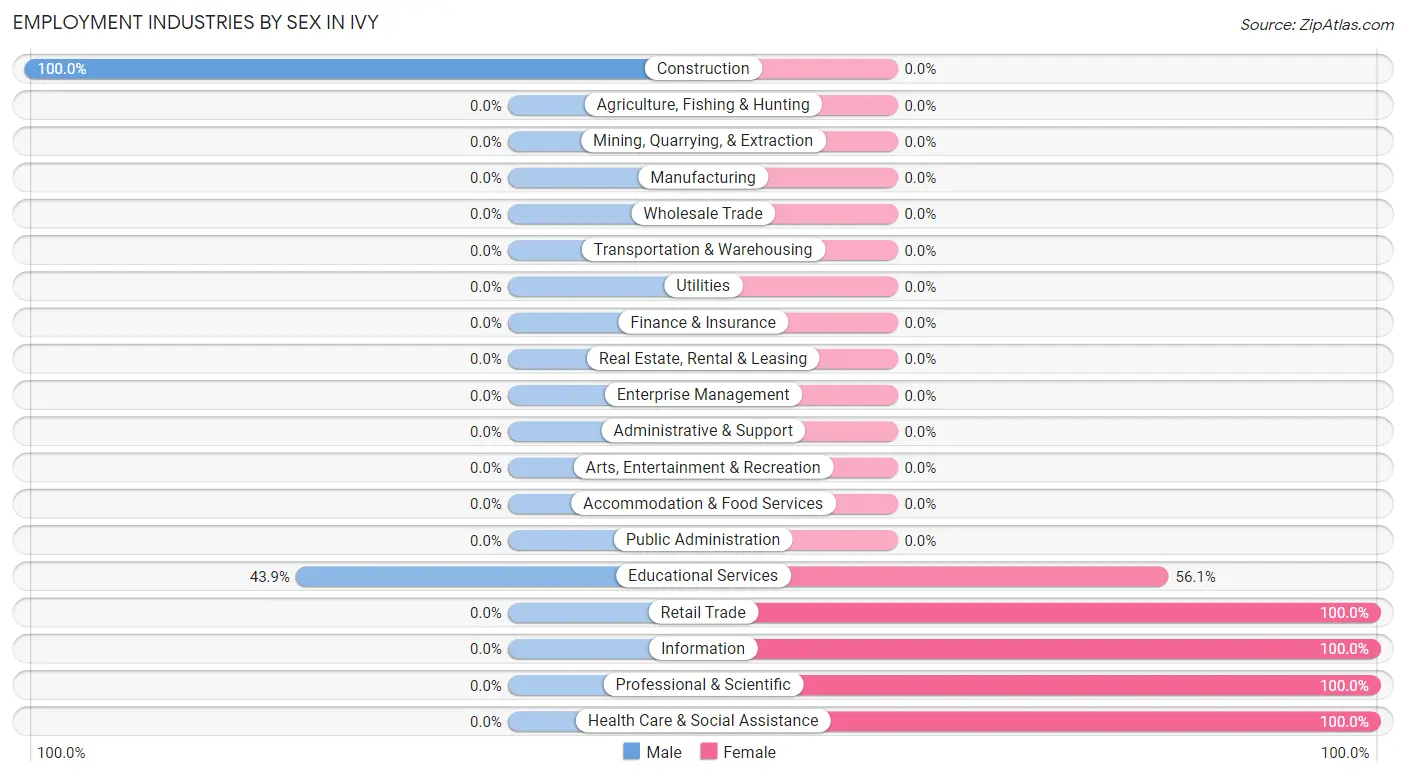
Employment Industries by Sex in Ivy
The Ivy industries that see more men than women are Construction (100.0%), and Educational Services (43.9%), whereas the industries that tend to have a higher number of women are Retail Trade (100.0%), Information (100.0%), and Professional & Scientific (100.0%).
| Industry | Male | Female |
| Agriculture, Fishing & Hunting | 0 (0.0%) | 0 (0.0%) |
| Mining, Quarrying, & Extraction | 0 (0.0%) | 0 (0.0%) |
| Construction | 18 (100.0%) | 0 (0.0%) |
| Manufacturing | 0 (0.0%) | 0 (0.0%) |
| Wholesale Trade | 0 (0.0%) | 0 (0.0%) |
| Retail Trade | 0 (0.0%) | 15 (100.0%) |
| Transportation & Warehousing | 0 (0.0%) | 0 (0.0%) |
| Utilities | 0 (0.0%) | 0 (0.0%) |
| Information | 0 (0.0%) | 48 (100.0%) |
| Finance & Insurance | 0 (0.0%) | 0 (0.0%) |
| Real Estate, Rental & Leasing | 0 (0.0%) | 0 (0.0%) |
| Professional & Scientific | 0 (0.0%) | 162 (100.0%) |
| Enterprise Management | 0 (0.0%) | 0 (0.0%) |
| Administrative & Support | 0 (0.0%) | 0 (0.0%) |
| Educational Services | 25 (43.9%) | 32 (56.1%) |
| Health Care & Social Assistance | 0 (0.0%) | 66 (100.0%) |
| Arts, Entertainment & Recreation | 0 (0.0%) | 0 (0.0%) |
| Accommodation & Food Services | 0 (0.0%) | 0 (0.0%) |
| Public Administration | 0 (0.0%) | 0 (0.0%) |
| Total | 43 (11.7%) | 323 (88.2%) |
Education in Ivy
School Enrollment in Ivy
The most common levels of schooling among the 70 students in Ivy are middle school (30 | 42.9%), elementary school (25 | 35.7%), and high school (15 | 21.4%).
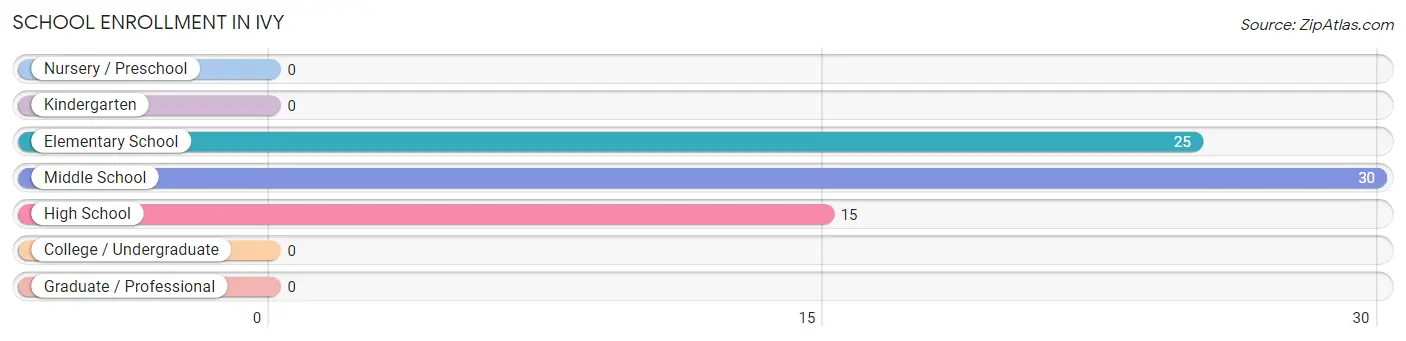
| School Level | # Students | % Students |
| Nursery / Preschool | 0 | 0.0% |
| Kindergarten | 0 | 0.0% |
| Elementary School | 25 | 35.7% |
| Middle School | 30 | 42.9% |
| High School | 15 | 21.4% |
| College / Undergraduate | 0 | 0.0% |
| Graduate / Professional | 0 | 0.0% |
| Total | 70 | 100.0% |
School Enrollment by Age by Funding Source in Ivy
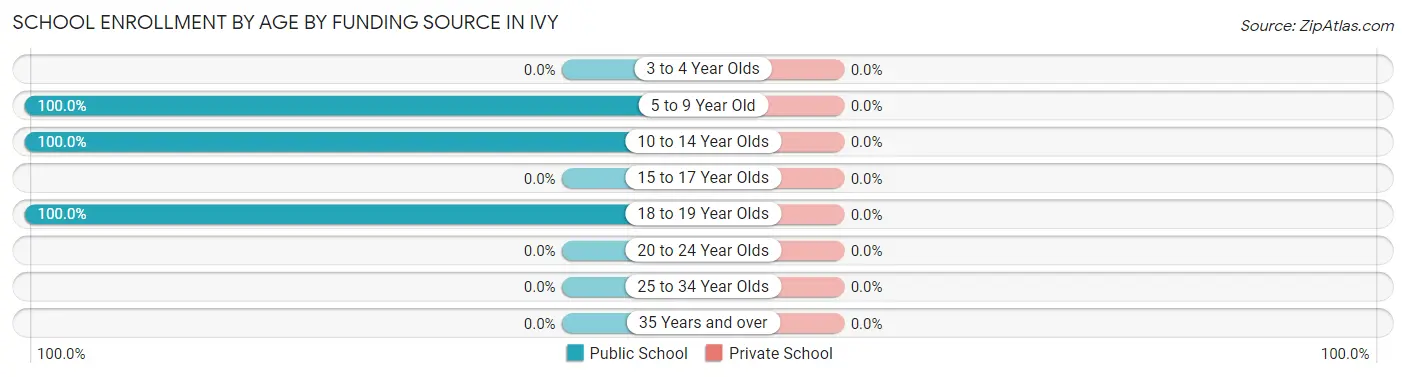
| Age Bracket | Public School | Private School |
| 3 to 4 Year Olds | 0 (0.0%) | 0 (0.0%) |
| 5 to 9 Year Old | 25 (100.0%) | 0 (0.0%) |
| 10 to 14 Year Olds | 30 (100.0%) | 0 (0.0%) |
| 15 to 17 Year Olds | 0 (0.0%) | 0 (0.0%) |
| 18 to 19 Year Olds | 15 (100.0%) | 0 (0.0%) |
| 20 to 24 Year Olds | 0 (0.0%) | 0 (0.0%) |
| 25 to 34 Year Olds | 0 (0.0%) | 0 (0.0%) |
| 35 Years and over | 0 (0.0%) | 0 (0.0%) |
| Total | 70 (100.0%) | 0 (0.0%) |
Educational Attainment by Field of Study in Ivy
Literature & languages (172 | 28.6%), visual & performing arts (162 | 27.0%), liberal arts & history (88 | 14.6%), psychology (48 | 8.0%), and bio, nature & agricultural (31 | 5.2%) are the most common fields of study among 601 individuals in Ivy who have obtained a bachelor's degree or higher.
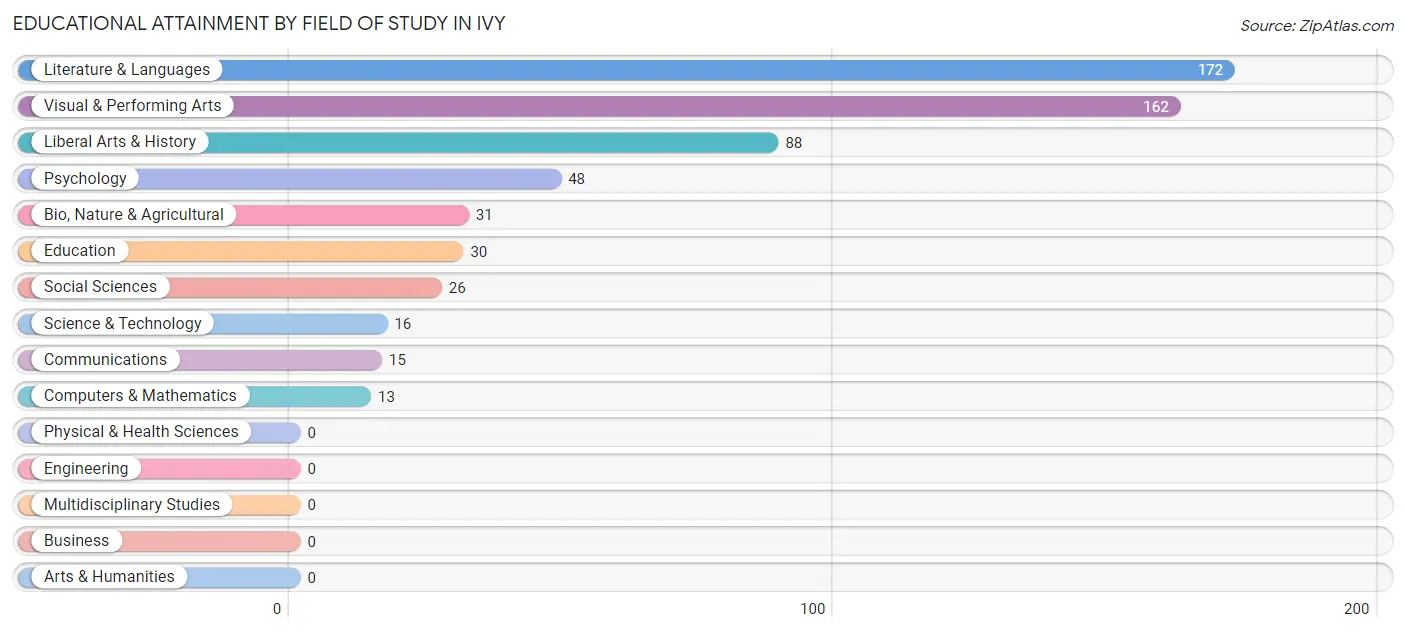
| Field of Study | # Graduates | % Graduates |
| Computers & Mathematics | 13 | 2.2% |
| Bio, Nature & Agricultural | 31 | 5.2% |
| Physical & Health Sciences | 0 | 0.0% |
| Psychology | 48 | 8.0% |
| Social Sciences | 26 | 4.3% |
| Engineering | 0 | 0.0% |
| Multidisciplinary Studies | 0 | 0.0% |
| Science & Technology | 16 | 2.7% |
| Business | 0 | 0.0% |
| Education | 30 | 5.0% |
| Literature & Languages | 172 | 28.6% |
| Liberal Arts & History | 88 | 14.6% |
| Visual & Performing Arts | 162 | 27.0% |
| Communications | 15 | 2.5% |
| Arts & Humanities | 0 | 0.0% |
| Total | 601 | 100.0% |
Transportation & Commute in Ivy
Vehicle Availability by Sex in Ivy
The most prevalent vehicle ownership categories in Ivy are males with 2 vehicles (25, accounting for 58.1%) and females with 2 vehicles (255, making up 7.7%).
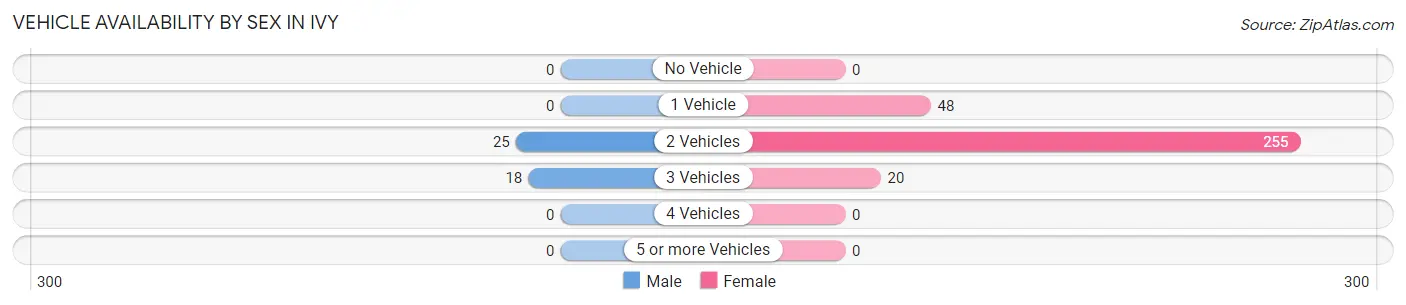
| Vehicles Available | Male | Female |
| No Vehicle | 0 (0.0%) | 0 (0.0%) |
| 1 Vehicle | 0 (0.0%) | 48 (14.9%) |
| 2 Vehicles | 25 (58.1%) | 255 (78.9%) |
| 3 Vehicles | 18 (41.9%) | 20 (6.2%) |
| 4 Vehicles | 0 (0.0%) | 0 (0.0%) |
| 5 or more Vehicles | 0 (0.0%) | 0 (0.0%) |
| Total | 43 (100.0%) | 323 (100.0%) |
Commute Time in Ivy
The most frequently occuring commute durations in Ivy are 45 to 59 minutes (187 commuters, 60.9%), 15 to 19 minutes (61 commuters, 19.9%), and 10 to 14 minutes (21 commuters, 6.8%).
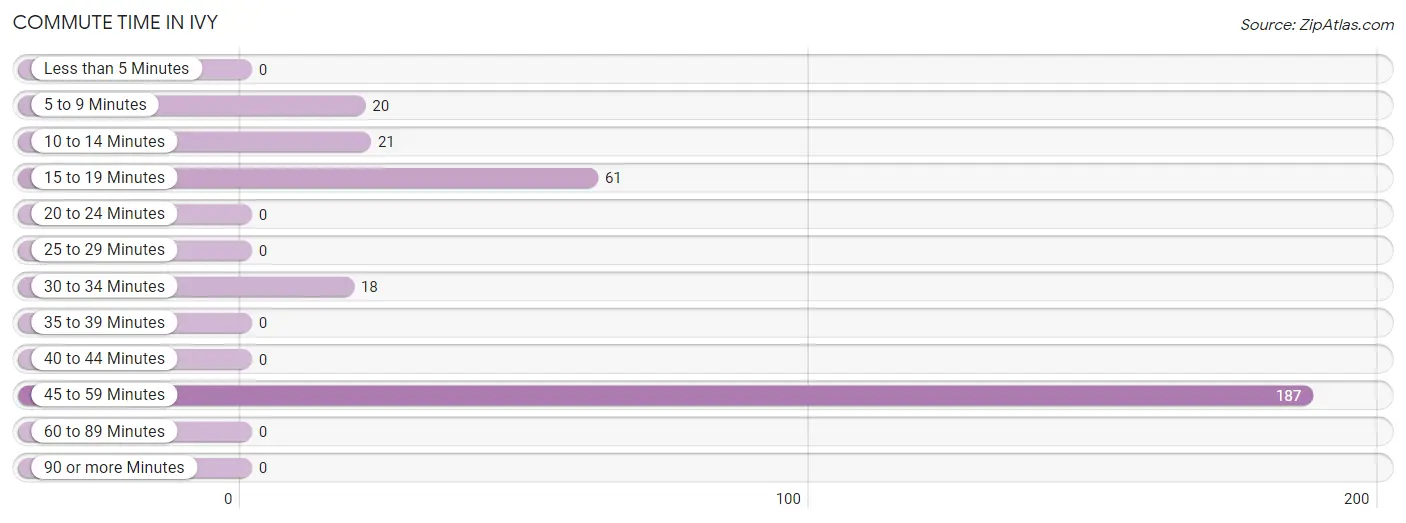
| Commute Time | # Commuters | % Commuters |
| Less than 5 Minutes | 0 | 0.0% |
| 5 to 9 Minutes | 20 | 6.5% |
| 10 to 14 Minutes | 21 | 6.8% |
| 15 to 19 Minutes | 61 | 19.9% |
| 20 to 24 Minutes | 0 | 0.0% |
| 25 to 29 Minutes | 0 | 0.0% |
| 30 to 34 Minutes | 18 | 5.9% |
| 35 to 39 Minutes | 0 | 0.0% |
| 40 to 44 Minutes | 0 | 0.0% |
| 45 to 59 Minutes | 187 | 60.9% |
| 60 to 89 Minutes | 0 | 0.0% |
| 90 or more Minutes | 0 | 0.0% |
Commute Time by Sex in Ivy
The most common commute times in Ivy are 45 to 59 minutes (25 commuters, 58.1%) for males and 45 to 59 minutes (162 commuters, 61.4%) for females.
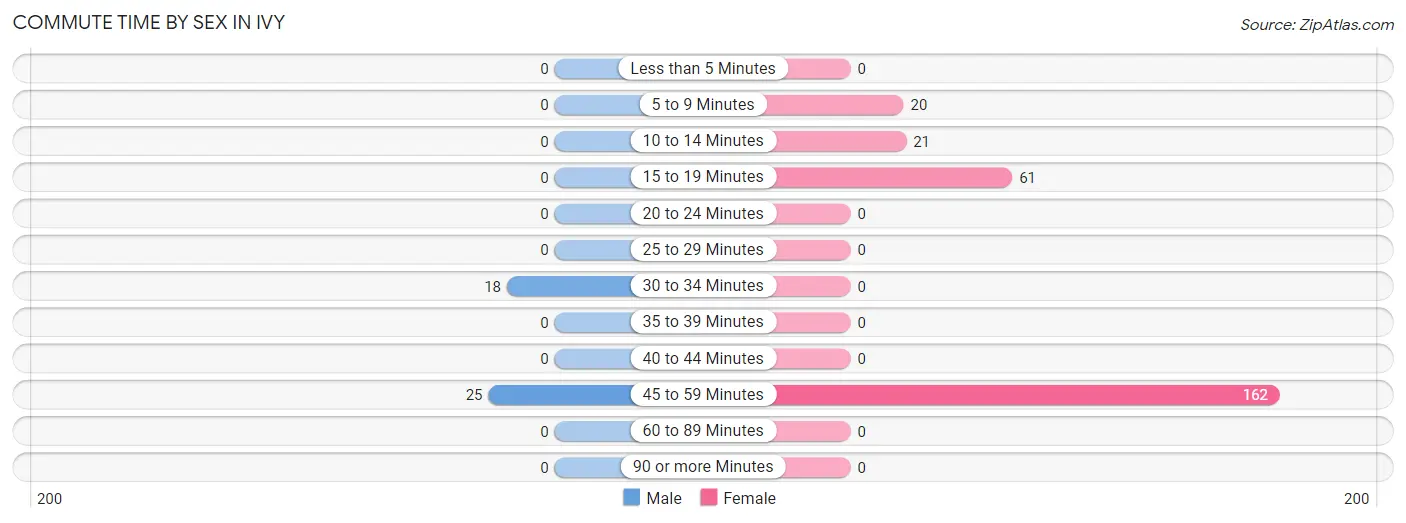
| Commute Time | Male | Female |
| Less than 5 Minutes | 0 (0.0%) | 0 (0.0%) |
| 5 to 9 Minutes | 0 (0.0%) | 20 (7.6%) |
| 10 to 14 Minutes | 0 (0.0%) | 21 (8.0%) |
| 15 to 19 Minutes | 0 (0.0%) | 61 (23.1%) |
| 20 to 24 Minutes | 0 (0.0%) | 0 (0.0%) |
| 25 to 29 Minutes | 0 (0.0%) | 0 (0.0%) |
| 30 to 34 Minutes | 18 (41.9%) | 0 (0.0%) |
| 35 to 39 Minutes | 0 (0.0%) | 0 (0.0%) |
| 40 to 44 Minutes | 0 (0.0%) | 0 (0.0%) |
| 45 to 59 Minutes | 25 (58.1%) | 162 (61.4%) |
| 60 to 89 Minutes | 0 (0.0%) | 0 (0.0%) |
| 90 or more Minutes | 0 (0.0%) | 0 (0.0%) |
Time of Departure to Work by Sex in Ivy
The most frequent times of departure to work in Ivy are 10:00 AM to 10:59 AM (25, 58.1%) for males and 8:00 AM to 8:29 AM (162, 61.4%) for females.
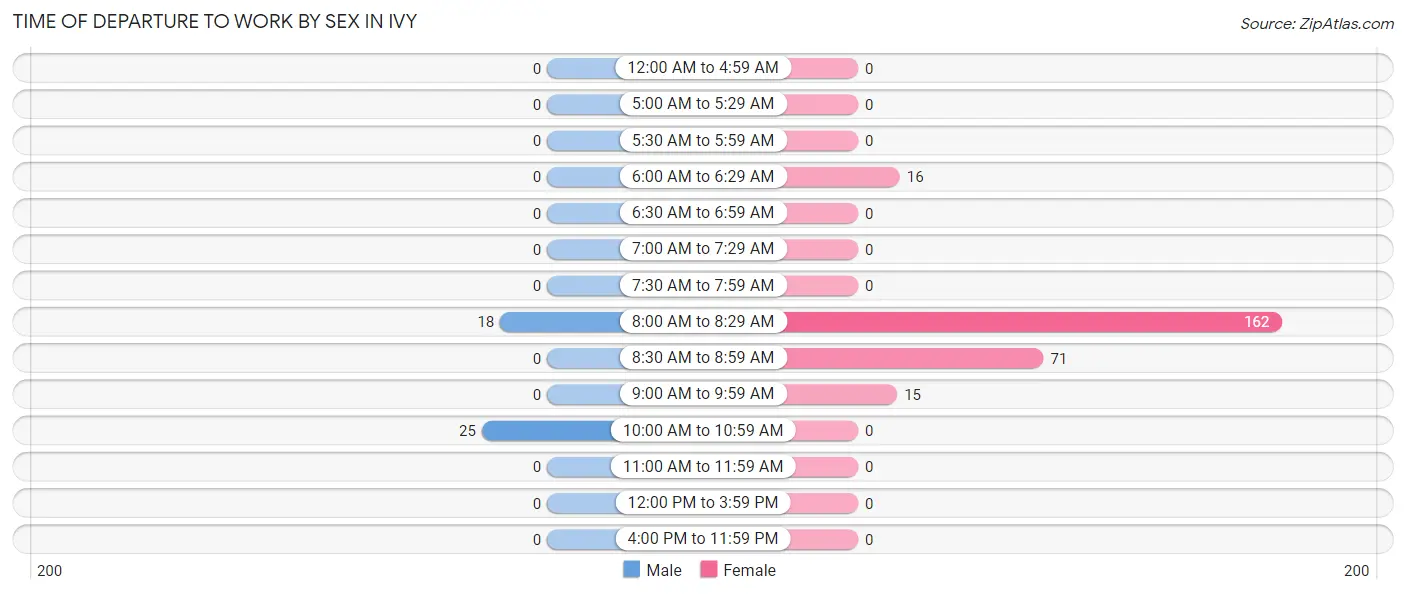
| Time of Departure | Male | Female |
| 12:00 AM to 4:59 AM | 0 (0.0%) | 0 (0.0%) |
| 5:00 AM to 5:29 AM | 0 (0.0%) | 0 (0.0%) |
| 5:30 AM to 5:59 AM | 0 (0.0%) | 0 (0.0%) |
| 6:00 AM to 6:29 AM | 0 (0.0%) | 16 (6.1%) |
| 6:30 AM to 6:59 AM | 0 (0.0%) | 0 (0.0%) |
| 7:00 AM to 7:29 AM | 0 (0.0%) | 0 (0.0%) |
| 7:30 AM to 7:59 AM | 0 (0.0%) | 0 (0.0%) |
| 8:00 AM to 8:29 AM | 18 (41.9%) | 162 (61.4%) |
| 8:30 AM to 8:59 AM | 0 (0.0%) | 71 (26.9%) |
| 9:00 AM to 9:59 AM | 0 (0.0%) | 15 (5.7%) |
| 10:00 AM to 10:59 AM | 25 (58.1%) | 0 (0.0%) |
| 11:00 AM to 11:59 AM | 0 (0.0%) | 0 (0.0%) |
| 12:00 PM to 3:59 PM | 0 (0.0%) | 0 (0.0%) |
| 4:00 PM to 11:59 PM | 0 (0.0%) | 0 (0.0%) |
| Total | 43 (100.0%) | 264 (100.0%) |
Housing Occupancy in Ivy
Occupancy by Ownership in Ivy
Of the total 367 dwellings in Ivy, owner-occupied units account for 367 (100.0%), while renter-occupied units make up 0 (0.0%).
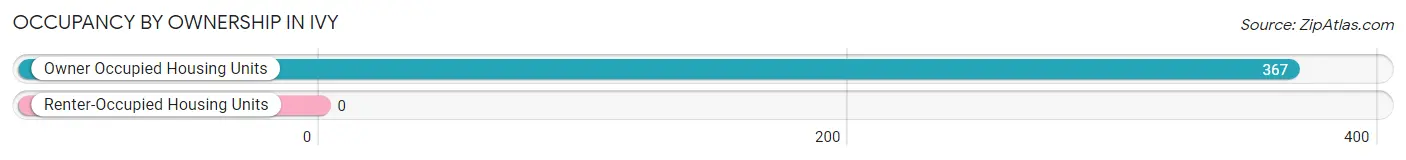
| Occupancy | # Housing Units | % Housing Units |
| Owner Occupied Housing Units | 367 | 100.0% |
| Renter-Occupied Housing Units | 0 | 0.0% |
| Total Occupied Housing Units | 367 | 100.0% |
Occupancy by Household Size in Ivy
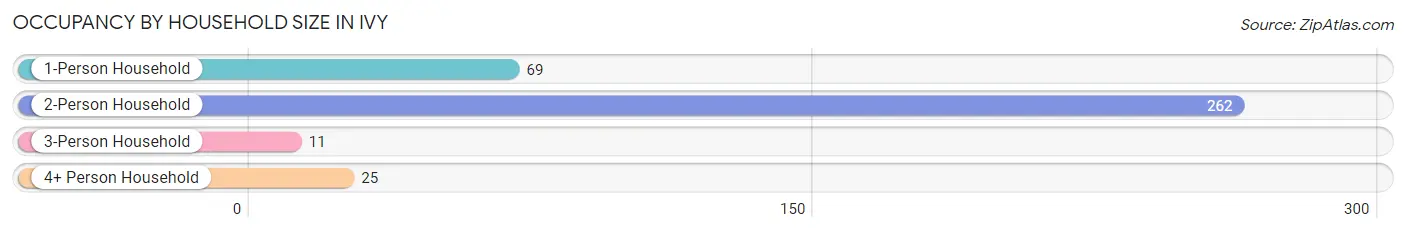
| Household Size | # Housing Units | % Housing Units |
| 1-Person Household | 69 | 18.8% |
| 2-Person Household | 262 | 71.4% |
| 3-Person Household | 11 | 3.0% |
| 4+ Person Household | 25 | 6.8% |
| Total Housing Units | 367 | 100.0% |
Occupancy by Ownership by Household Size in Ivy
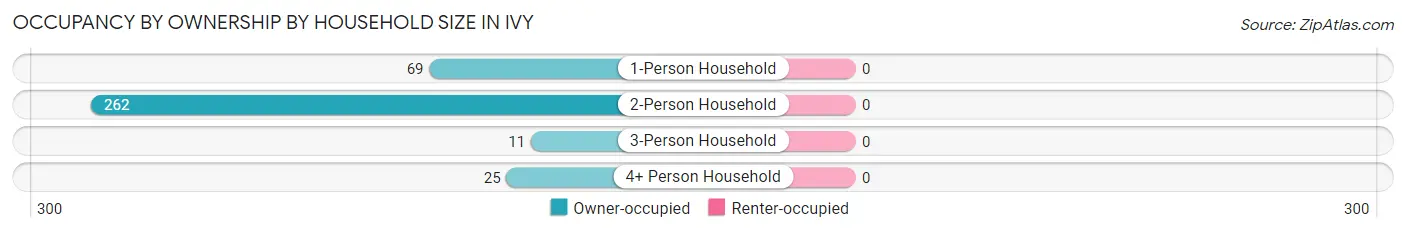
| Household Size | Owner-occupied | Renter-occupied |
| 1-Person Household | 69 (100.0%) | 0 (0.0%) |
| 2-Person Household | 262 (100.0%) | 0 (0.0%) |
| 3-Person Household | 11 (100.0%) | 0 (0.0%) |
| 4+ Person Household | 25 (100.0%) | 0 (0.0%) |
| Total Housing Units | 367 (100.0%) | 0 (0.0%) |
Occupancy by Educational Attainment in Ivy
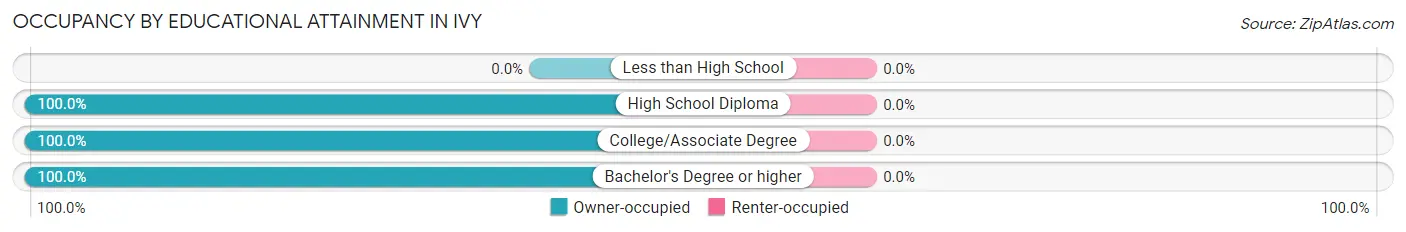
| Household Size | Owner-occupied | Renter-occupied |
| Less than High School | 0 (0.0%) | 0 (0.0%) |
| High School Diploma | 14 (100.0%) | 0 (0.0%) |
| College/Associate Degree | 13 (100.0%) | 0 (0.0%) |
| Bachelor's Degree or higher | 340 (100.0%) | 0 (0.0%) |
Occupancy by Age of Householder in Ivy
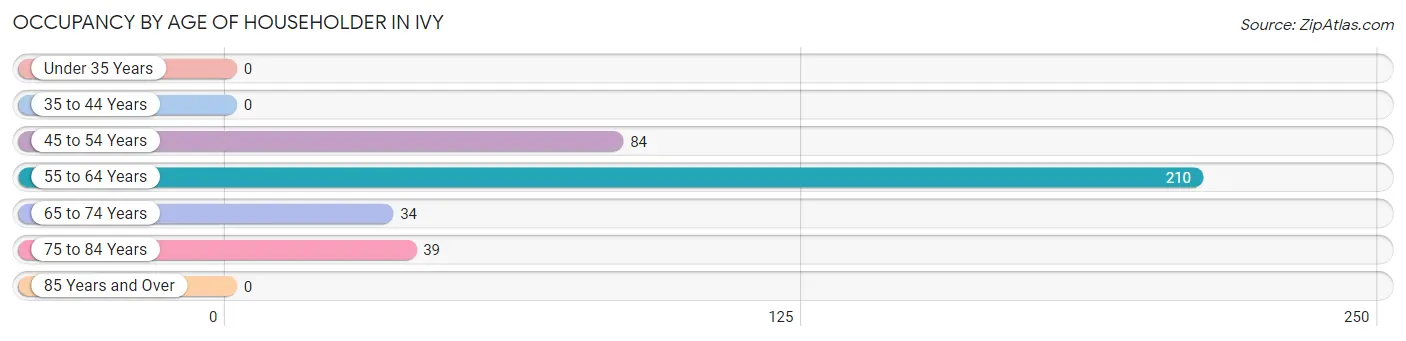
| Age Bracket | # Households | % Households |
| Under 35 Years | 0 | 0.0% |
| 35 to 44 Years | 0 | 0.0% |
| 45 to 54 Years | 84 | 22.9% |
| 55 to 64 Years | 210 | 57.2% |
| 65 to 74 Years | 34 | 9.3% |
| 75 to 84 Years | 39 | 10.6% |
| 85 Years and Over | 0 | 0.0% |
| Total | 367 | 100.0% |
Housing Finances in Ivy
Median Income by Occupancy in Ivy
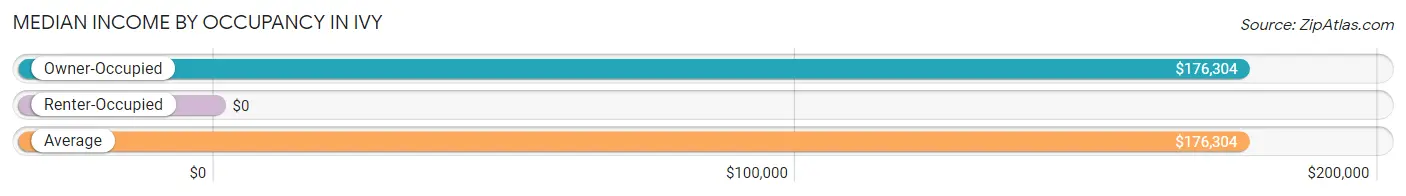
| Occupancy Type | # Households | Median Income |
| Owner-Occupied | 367 (100.0%) | $176,304 |
| Renter-Occupied | 0 (0.0%) | $0 |
| Average | 367 (100.0%) | $176,304 |
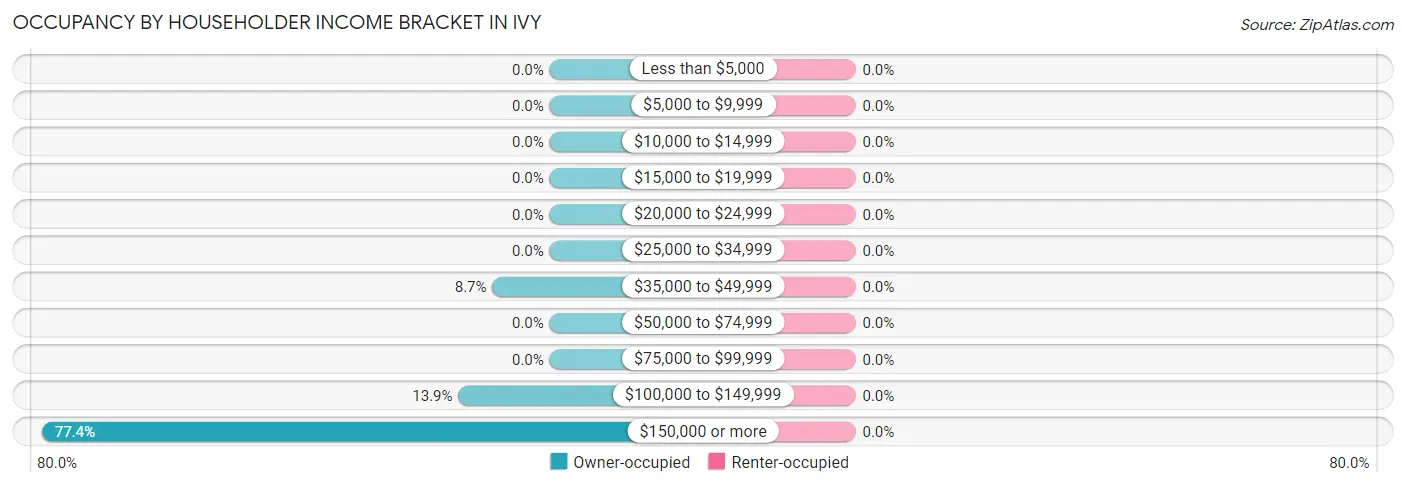
Occupancy by Householder Income Bracket in Ivy
| Income Bracket | Owner-occupied | Renter-occupied |
| Less than $5,000 | 0 (0.0%) | 0 (0.0%) |
| $5,000 to $9,999 | 0 (0.0%) | 0 (0.0%) |
| $10,000 to $14,999 | 0 (0.0%) | 0 (0.0%) |
| $15,000 to $19,999 | 0 (0.0%) | 0 (0.0%) |
| $20,000 to $24,999 | 0 (0.0%) | 0 (0.0%) |
| $25,000 to $34,999 | 0 (0.0%) | 0 (0.0%) |
| $35,000 to $49,999 | 32 (8.7%) | 0 (0.0%) |
| $50,000 to $74,999 | 0 (0.0%) | 0 (0.0%) |
| $75,000 to $99,999 | 0 (0.0%) | 0 (0.0%) |
| $100,000 to $149,999 | 51 (13.9%) | 0 (0.0%) |
| $150,000 or more | 284 (77.4%) | 0 (0.0%) |
| Total | 367 (100.0%) | 0 (0.0%) |
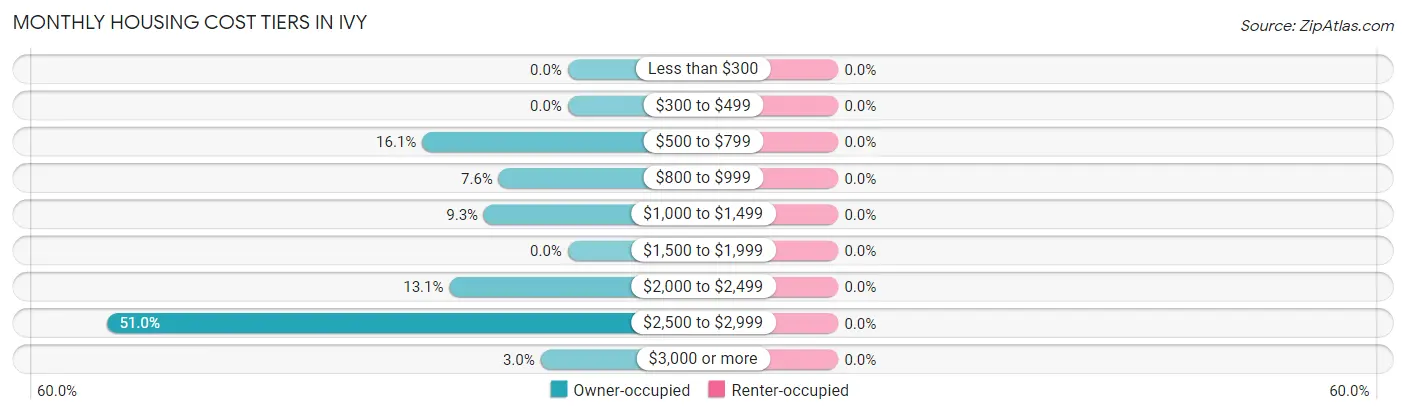
Monthly Housing Cost Tiers in Ivy
| Monthly Cost | Owner-occupied | Renter-occupied |
| Less than $300 | 0 (0.0%) | 0 (0.0%) |
| $300 to $499 | 0 (0.0%) | 0 (0.0%) |
| $500 to $799 | 59 (16.1%) | 0 (0.0%) |
| $800 to $999 | 28 (7.6%) | 0 (0.0%) |
| $1,000 to $1,499 | 34 (9.3%) | 0 (0.0%) |
| $1,500 to $1,999 | 0 (0.0%) | 0 (0.0%) |
| $2,000 to $2,499 | 48 (13.1%) | 0 (0.0%) |
| $2,500 to $2,999 | 187 (50.9%) | 0 (0.0%) |
| $3,000 or more | 11 (3.0%) | 0 (0.0%) |
| Total | 367 (100.0%) | 0 (0.0%) |
Physical Housing Characteristics in Ivy
Housing Structures in Ivy
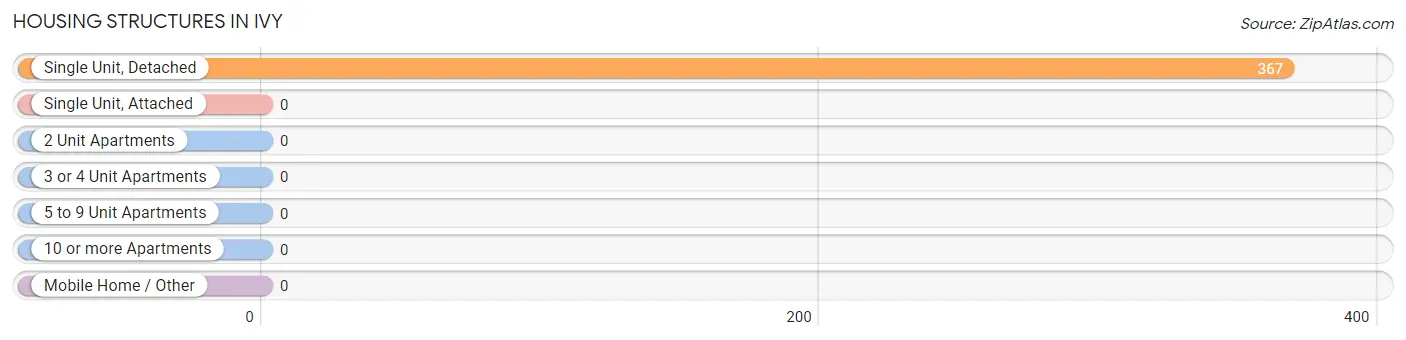
| Structure Type | # Housing Units | % Housing Units |
| Single Unit, Detached | 367 | 100.0% |
| Single Unit, Attached | 0 | 0.0% |
| 2 Unit Apartments | 0 | 0.0% |
| 3 or 4 Unit Apartments | 0 | 0.0% |
| 5 to 9 Unit Apartments | 0 | 0.0% |
| 10 or more Apartments | 0 | 0.0% |
| Mobile Home / Other | 0 | 0.0% |
| Total | 367 | 100.0% |
Housing Structures by Occupancy in Ivy
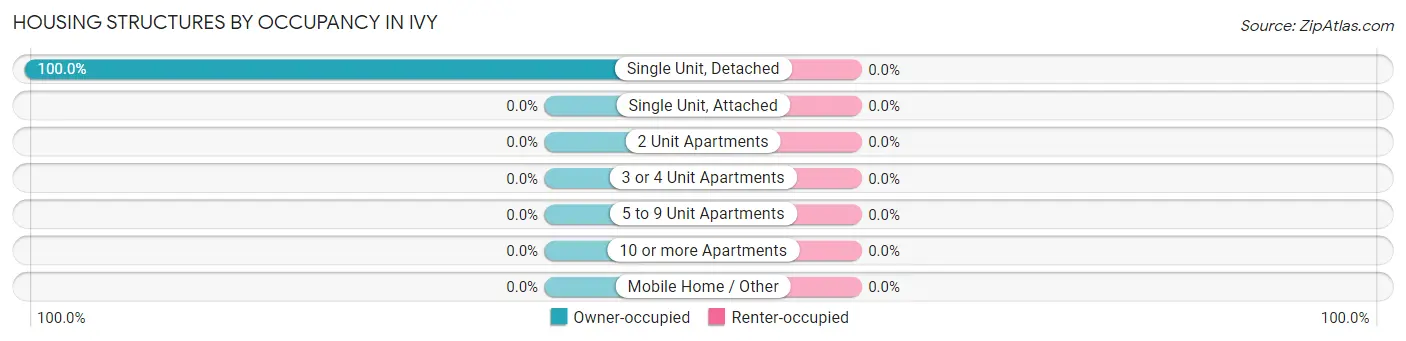
| Structure Type | Owner-occupied | Renter-occupied |
| Single Unit, Detached | 367 (100.0%) | 0 (0.0%) |
| Single Unit, Attached | 0 (0.0%) | 0 (0.0%) |
| 2 Unit Apartments | 0 (0.0%) | 0 (0.0%) |
| 3 or 4 Unit Apartments | 0 (0.0%) | 0 (0.0%) |
| 5 to 9 Unit Apartments | 0 (0.0%) | 0 (0.0%) |
| 10 or more Apartments | 0 (0.0%) | 0 (0.0%) |
| Mobile Home / Other | 0 (0.0%) | 0 (0.0%) |
| Total | 367 (100.0%) | 0 (0.0%) |
Housing Structures by Number of Rooms in Ivy
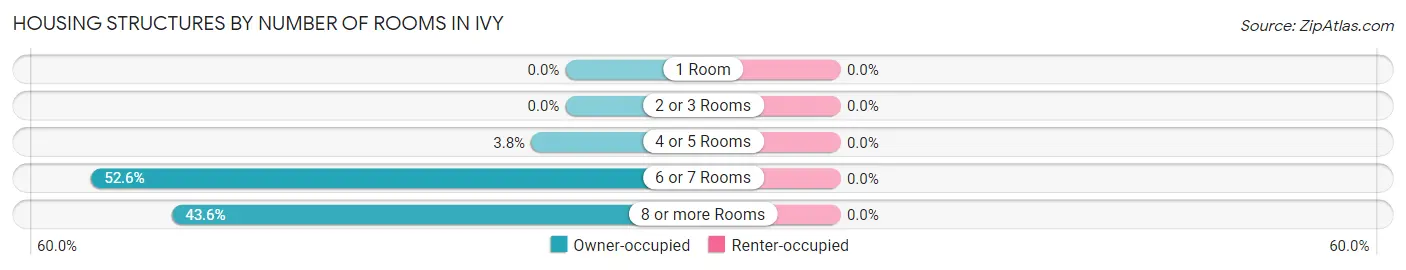
| Number of Rooms | Owner-occupied | Renter-occupied |
| 1 Room | 0 (0.0%) | 0 (0.0%) |
| 2 or 3 Rooms | 0 (0.0%) | 0 (0.0%) |
| 4 or 5 Rooms | 14 (3.8%) | 0 (0.0%) |
| 6 or 7 Rooms | 193 (52.6%) | 0 (0.0%) |
| 8 or more Rooms | 160 (43.6%) | 0 (0.0%) |
| Total | 367 (100.0%) | 0 (0.0%) |
Housing Structure by Heating Type in Ivy
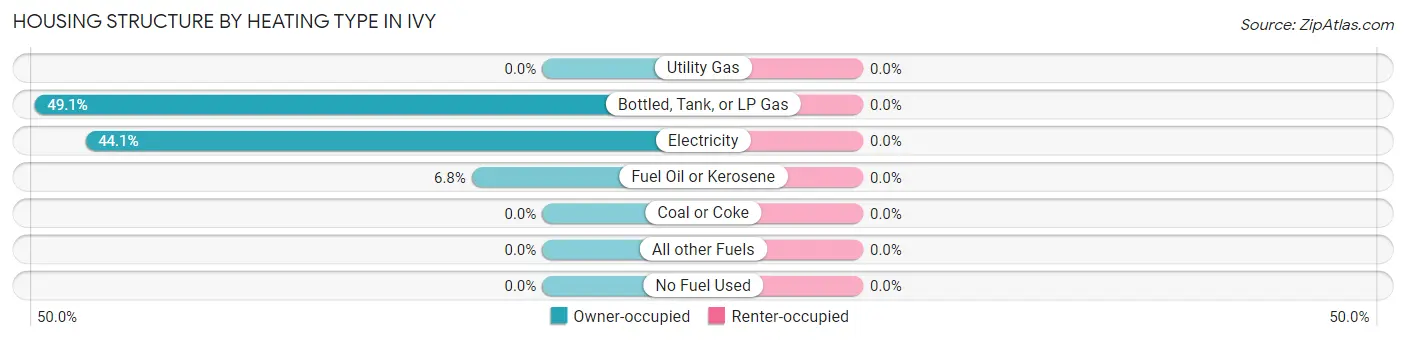
| Heating Type | Owner-occupied | Renter-occupied |
| Utility Gas | 0 (0.0%) | 0 (0.0%) |
| Bottled, Tank, or LP Gas | 180 (49.0%) | 0 (0.0%) |
| Electricity | 162 (44.1%) | 0 (0.0%) |
| Fuel Oil or Kerosene | 25 (6.8%) | 0 (0.0%) |
| Coal or Coke | 0 (0.0%) | 0 (0.0%) |
| All other Fuels | 0 (0.0%) | 0 (0.0%) |
| No Fuel Used | 0 (0.0%) | 0 (0.0%) |
| Total | 367 (100.0%) | 0 (0.0%) |
Household Vehicle Usage in Ivy
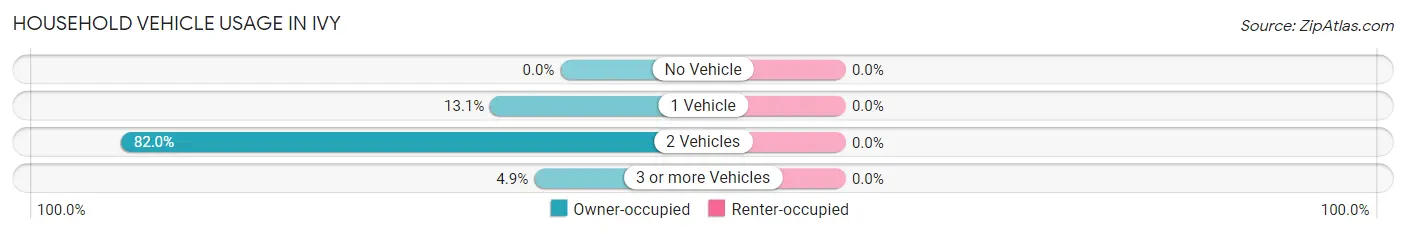
| Vehicles per Household | Owner-occupied | Renter-occupied |
| No Vehicle | 0 (0.0%) | 0 (0.0%) |
| 1 Vehicle | 48 (13.1%) | 0 (0.0%) |
| 2 Vehicles | 301 (82.0%) | 0 (0.0%) |
| 3 or more Vehicles | 18 (4.9%) | 0 (0.0%) |
| Total | 367 (100.0%) | 0 (0.0%) |
Real Estate & Mortgages in Ivy
Real Estate and Mortgage Overview in Ivy
| Characteristic | Without Mortgage | With Mortgage |
| Housing Units | 105 | 262 |
| Median Property Value | $601,900 | $601,800 |
| Median Household Income | - | - |
| Monthly Housing Costs | $781 | $11 |
| Real Estate Taxes | $4,510 | $0 |
Property Value by Mortgage Status in Ivy
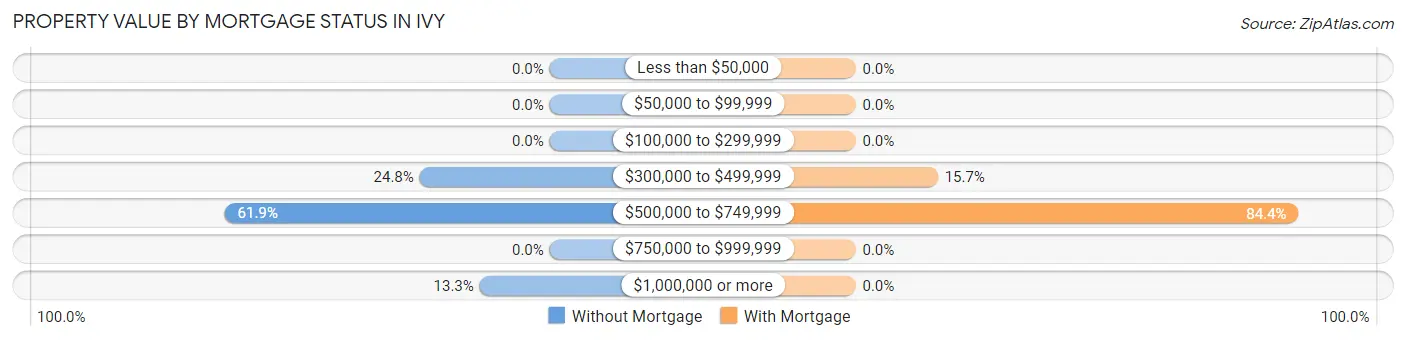
| Property Value | Without Mortgage | With Mortgage |
| Less than $50,000 | 0 (0.0%) | 0 (0.0%) |
| $50,000 to $99,999 | 0 (0.0%) | 0 (0.0%) |
| $100,000 to $299,999 | 0 (0.0%) | 0 (0.0%) |
| $300,000 to $499,999 | 26 (24.8%) | 41 (15.7%) |
| $500,000 to $749,999 | 65 (61.9%) | 221 (84.4%) |
| $750,000 to $999,999 | 0 (0.0%) | 0 (0.0%) |
| $1,000,000 or more | 14 (13.3%) | 0 (0.0%) |
| Total | 105 (100.0%) | 262 (100.0%) |
Household Income by Mortgage Status in Ivy
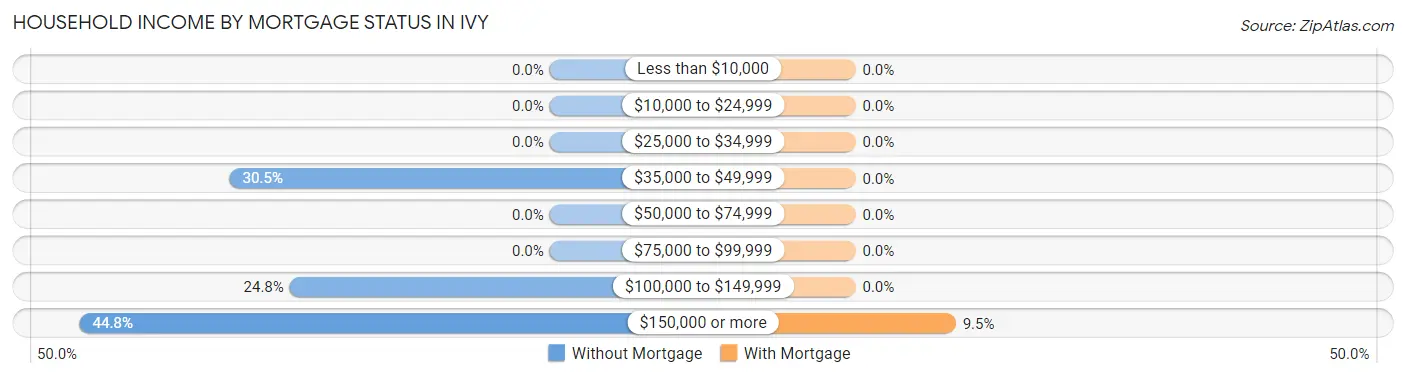
| Household Income | Without Mortgage | With Mortgage |
| Less than $10,000 | 0 (0.0%) | 0 (0.0%) |
| $10,000 to $24,999 | 0 (0.0%) | 0 (0.0%) |
| $25,000 to $34,999 | 0 (0.0%) | 0 (0.0%) |
| $35,000 to $49,999 | 32 (30.5%) | 0 (0.0%) |
| $50,000 to $74,999 | 0 (0.0%) | 0 (0.0%) |
| $75,000 to $99,999 | 0 (0.0%) | 0 (0.0%) |
| $100,000 to $149,999 | 26 (24.8%) | 0 (0.0%) |
| $150,000 or more | 47 (44.8%) | 25 (9.5%) |
| Total | 105 (100.0%) | 262 (100.0%) |
Property Value to Household Income Ratio in Ivy
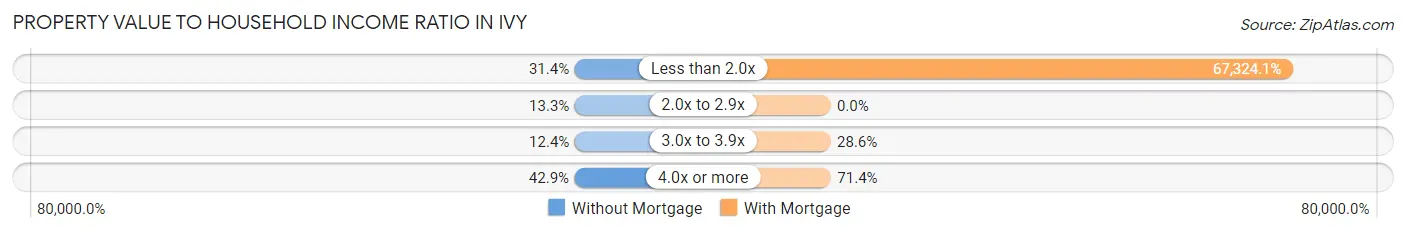
| Value-to-Income Ratio | Without Mortgage | With Mortgage |
| Less than 2.0x | 33 (31.4%) | 176,389 (67,324.0%) |
| 2.0x to 2.9x | 14 (13.3%) | 0 (0.0%) |
| 3.0x to 3.9x | 13 (12.4%) | 75 (28.6%) |
| 4.0x or more | 45 (42.9%) | 187 (71.4%) |
| Total | 105 (100.0%) | 262 (100.0%) |
Real Estate Taxes by Mortgage Status in Ivy
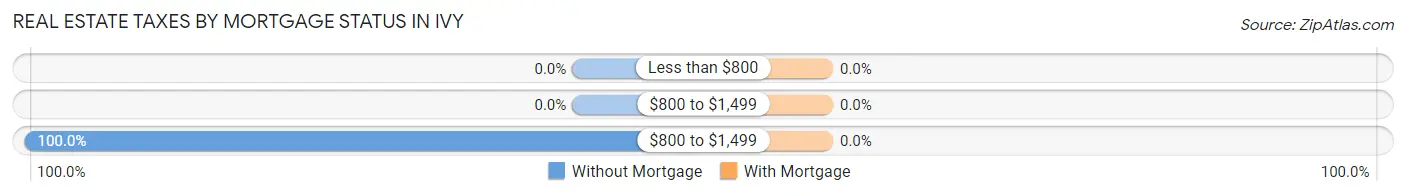
| Property Taxes | Without Mortgage | With Mortgage |
| Less than $800 | 0 (0.0%) | 0 (0.0%) |
| $800 to $1,499 | 0 (0.0%) | 0 (0.0%) |
| $800 to $1,499 | 105 (100.0%) | 0 (0.0%) |
| Total | 105 (100.0%) | 262 (100.0%) |
Health & Disability in Ivy
Health Insurance Coverage by Age in Ivy
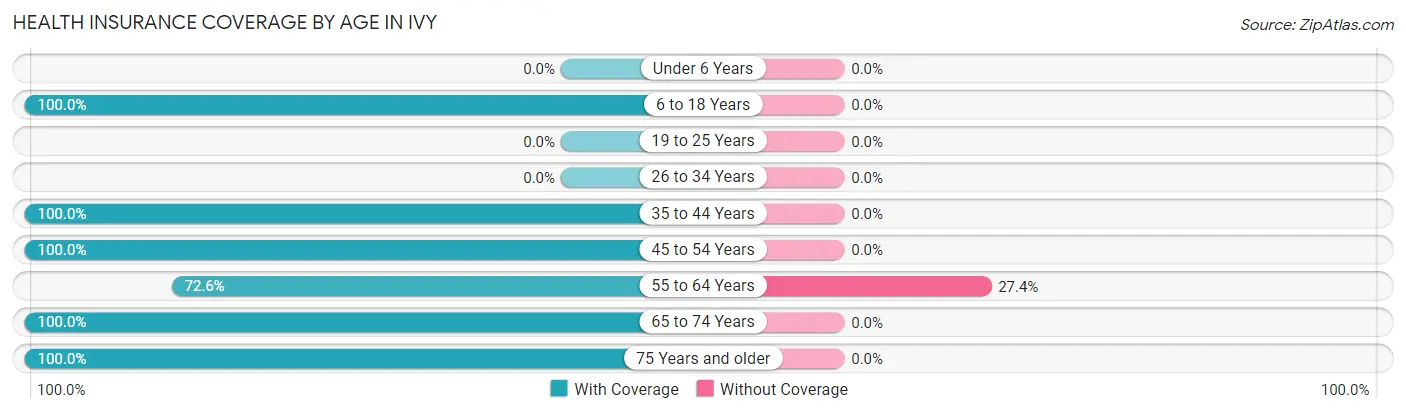
| Age Bracket | With Coverage | Without Coverage |
| Under 6 Years | 0 (0.0%) | 0 (0.0%) |
| 6 to 18 Years | 70 (100.0%) | 0 (0.0%) |
| 19 to 25 Years | 0 (0.0%) | 0 (0.0%) |
| 26 to 34 Years | 0 (0.0%) | 0 (0.0%) |
| 35 to 44 Years | 30 (100.0%) | 0 (0.0%) |
| 45 to 54 Years | 84 (100.0%) | 0 (0.0%) |
| 55 to 64 Years | 273 (72.6%) | 103 (27.4%) |
| 65 to 74 Years | 45 (100.0%) | 0 (0.0%) |
| 75 Years and older | 77 (100.0%) | 0 (0.0%) |
| Total | 579 (84.9%) | 103 (15.1%) |
Health Insurance Coverage by Citizenship Status in Ivy
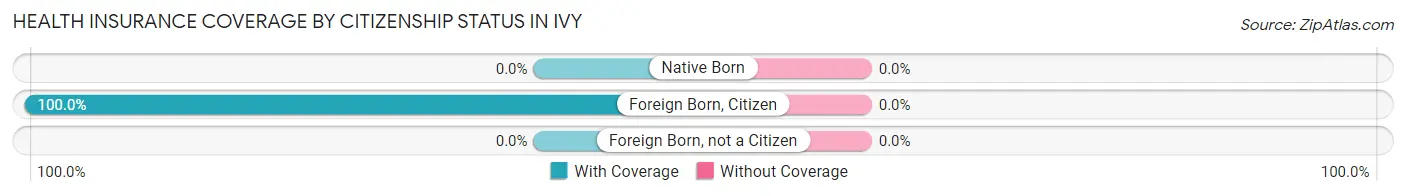
| Citizenship Status | With Coverage | Without Coverage |
| Native Born | 0 (0.0%) | 0 (0.0%) |
| Foreign Born, Citizen | 70 (100.0%) | 0 (0.0%) |
| Foreign Born, not a Citizen | 0 (0.0%) | 0 (0.0%) |
Health Insurance Coverage by Household Income in Ivy
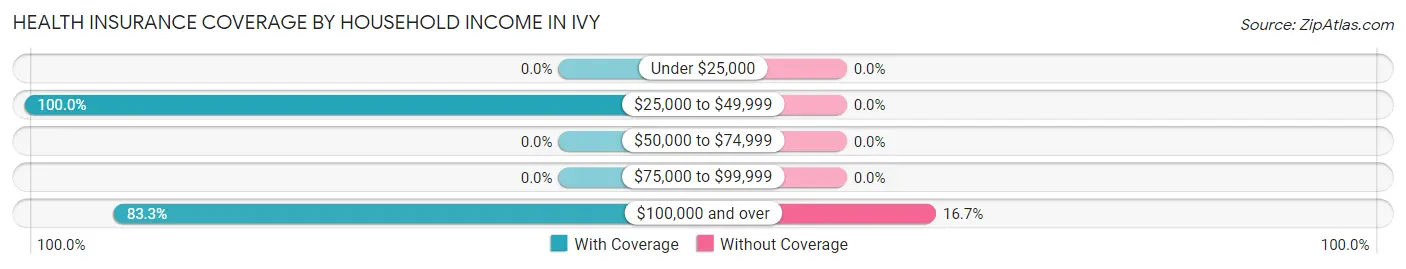
| Household Income | With Coverage | Without Coverage |
| Under $25,000 | 0 (0.0%) | 0 (0.0%) |
| $25,000 to $49,999 | 66 (100.0%) | 0 (0.0%) |
| $50,000 to $74,999 | 0 (0.0%) | 0 (0.0%) |
| $75,000 to $99,999 | 0 (0.0%) | 0 (0.0%) |
| $100,000 and over | 513 (83.3%) | 103 (16.7%) |
Public vs Private Health Insurance Coverage by Age in Ivy
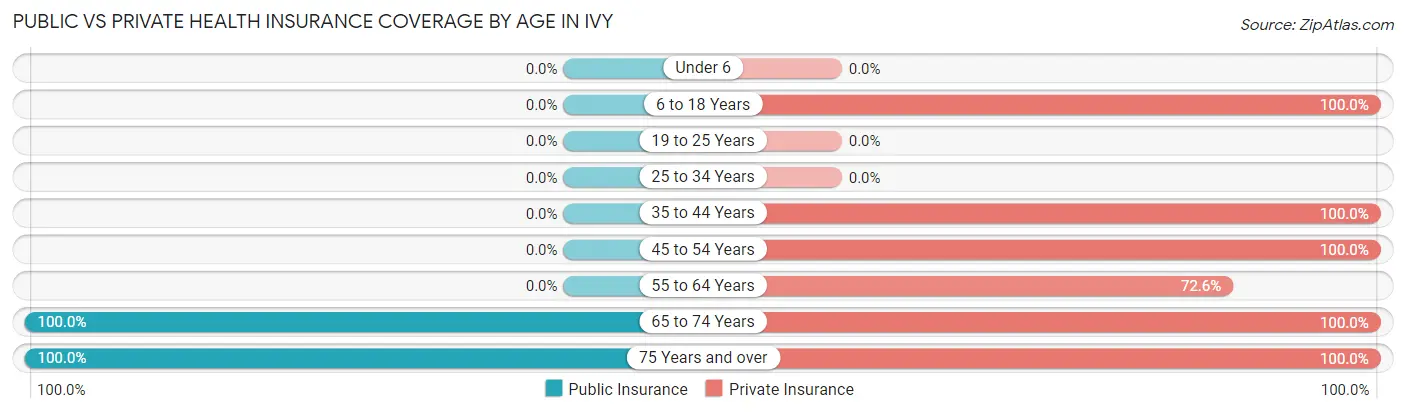
| Age Bracket | Public Insurance | Private Insurance |
| Under 6 | 0 (0.0%) | 0 (0.0%) |
| 6 to 18 Years | 0 (0.0%) | 70 (100.0%) |
| 19 to 25 Years | 0 (0.0%) | 0 (0.0%) |
| 25 to 34 Years | 0 (0.0%) | 0 (0.0%) |
| 35 to 44 Years | 0 (0.0%) | 30 (100.0%) |
| 45 to 54 Years | 0 (0.0%) | 84 (100.0%) |
| 55 to 64 Years | 0 (0.0%) | 273 (72.6%) |
| 65 to 74 Years | 45 (100.0%) | 45 (100.0%) |
| 75 Years and over | 77 (100.0%) | 77 (100.0%) |
| Total | 122 (17.9%) | 579 (84.9%) |
Disability Status by Sex by Age in Ivy
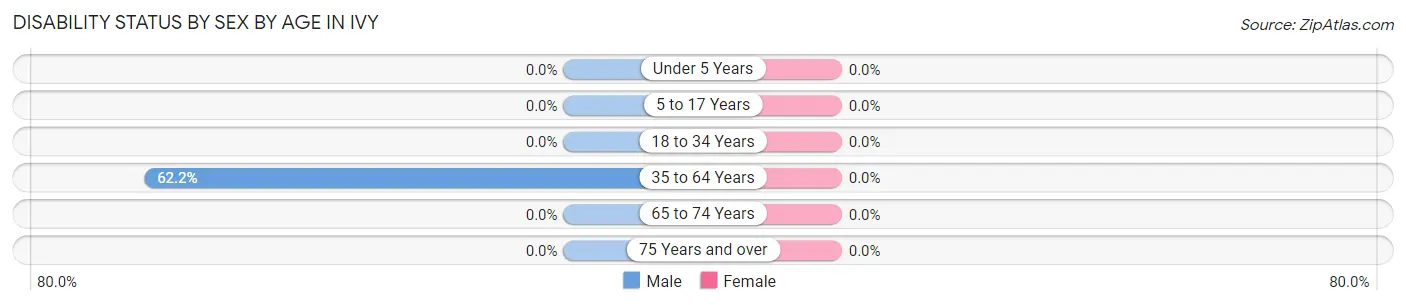
| Age Bracket | Male | Female |
| Under 5 Years | 0 (0.0%) | 0 (0.0%) |
| 5 to 17 Years | 0 (0.0%) | 0 (0.0%) |
| 18 to 34 Years | 0 (0.0%) | 0 (0.0%) |
| 35 to 64 Years | 117 (62.2%) | 0 (0.0%) |
| 65 to 74 Years | 0 (0.0%) | 0 (0.0%) |
| 75 Years and over | 0 (0.0%) | 0 (0.0%) |
Disability Class by Sex by Age in Ivy
Disability Class: Hearing Difficulty
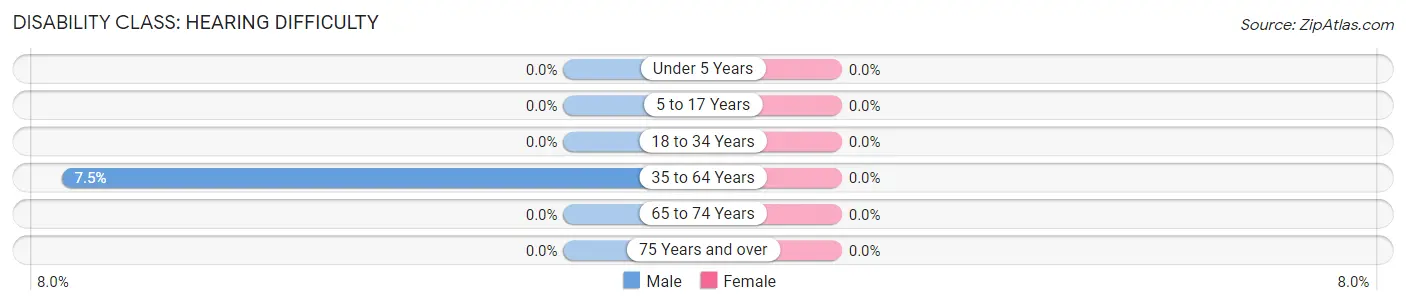
| Age Bracket | Male | Female |
| Under 5 Years | 0 (0.0%) | 0 (0.0%) |
| 5 to 17 Years | 0 (0.0%) | 0 (0.0%) |
| 18 to 34 Years | 0 (0.0%) | 0 (0.0%) |
| 35 to 64 Years | 14 (7.4%) | 0 (0.0%) |
| 65 to 74 Years | 0 (0.0%) | 0 (0.0%) |
| 75 Years and over | 0 (0.0%) | 0 (0.0%) |
Disability Class: Vision Difficulty

| Age Bracket | Male | Female |
| Under 5 Years | 0 (0.0%) | 0 (0.0%) |
| 5 to 17 Years | 0 (0.0%) | 0 (0.0%) |
| 18 to 34 Years | 0 (0.0%) | 0 (0.0%) |
| 35 to 64 Years | 117 (62.2%) | 0 (0.0%) |
| 65 to 74 Years | 0 (0.0%) | 0 (0.0%) |
| 75 Years and over | 0 (0.0%) | 0 (0.0%) |
Disability Class: Cognitive Difficulty
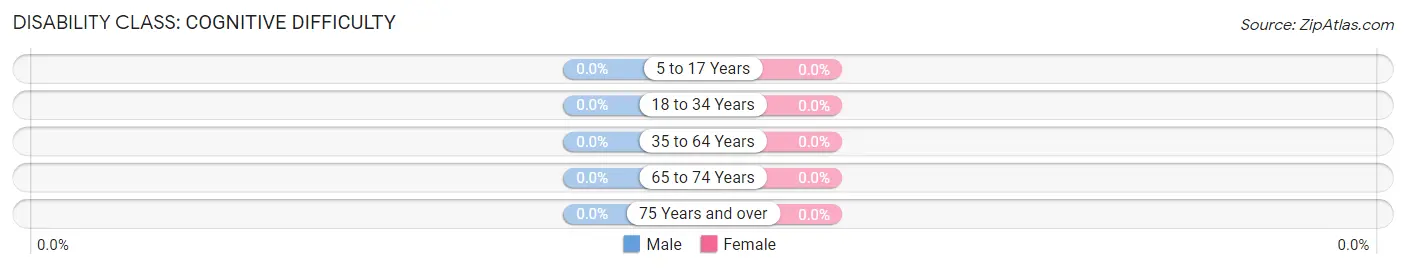
| Age Bracket | Male | Female |
| 5 to 17 Years | 0 (0.0%) | 0 (0.0%) |
| 18 to 34 Years | 0 (0.0%) | 0 (0.0%) |
| 35 to 64 Years | 0 (0.0%) | 0 (0.0%) |
| 65 to 74 Years | 0 (0.0%) | 0 (0.0%) |
| 75 Years and over | 0 (0.0%) | 0 (0.0%) |
Disability Class: Ambulatory Difficulty
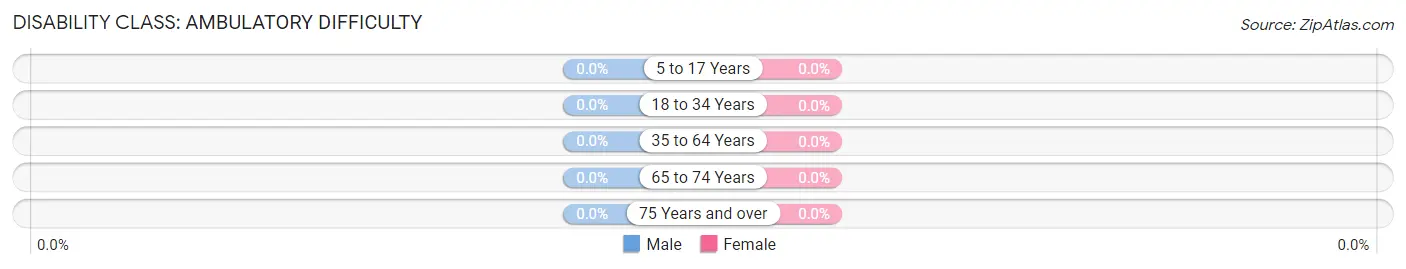
| Age Bracket | Male | Female |
| 5 to 17 Years | 0 (0.0%) | 0 (0.0%) |
| 18 to 34 Years | 0 (0.0%) | 0 (0.0%) |
| 35 to 64 Years | 0 (0.0%) | 0 (0.0%) |
| 65 to 74 Years | 0 (0.0%) | 0 (0.0%) |
| 75 Years and over | 0 (0.0%) | 0 (0.0%) |
Disability Class: Self-Care Difficulty
| Age Bracket | Male | Female |
| 5 to 17 Years | 0 (0.0%) | 0 (0.0%) |
| 18 to 34 Years | 0 (0.0%) | 0 (0.0%) |
| 35 to 64 Years | 0 (0.0%) | 0 (0.0%) |
| 65 to 74 Years | 0 (0.0%) | 0 (0.0%) |
| 75 Years and over | 0 (0.0%) | 0 (0.0%) |
Technology Access in Ivy
Computing Device Access in Ivy
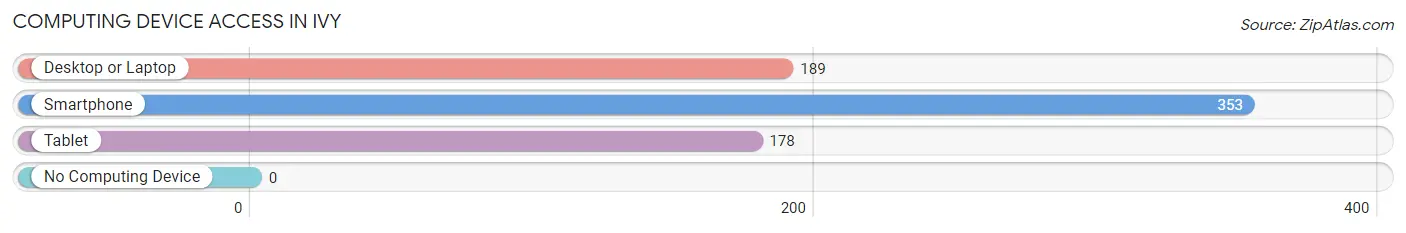
| Device Type | # Households | % Households |
| Desktop or Laptop | 189 | 51.5% |
| Smartphone | 353 | 96.2% |
| Tablet | 178 | 48.5% |
| No Computing Device | 0 | 0.0% |
| Total | 367 | 100.0% |
Internet Access in Ivy
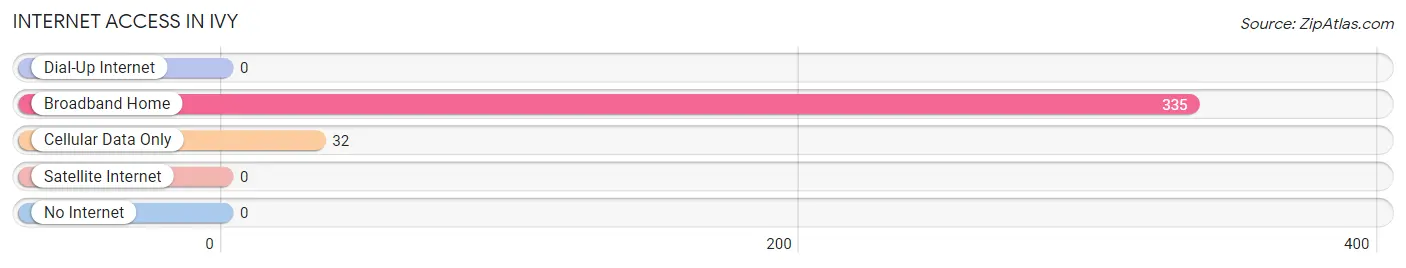
| Internet Type | # Households | % Households |
| Dial-Up Internet | 0 | 0.0% |
| Broadband Home | 335 | 91.3% |
| Cellular Data Only | 32 | 8.7% |
| Satellite Internet | 0 | 0.0% |
| No Internet | 0 | 0.0% |
| Total | 367 | 100.0% |
Ivy Summary
Ivy is an unincorporated community located in Albemarle County, Virginia. It is situated in the foothills of the Blue Ridge Mountains, approximately 10 miles northwest of Charlottesville. The community is home to a variety of businesses, including a winery, a brewery, a distillery, and a cidery.
History
The area that is now Ivy was first settled in the late 1700s by German and Scots-Irish immigrants. The community was originally known as “Ivy Mills”, named after the Ivy Creek that runs through the area. The creek was named after the abundance of ivy that grew along its banks.
In the early 1800s, the Ivy Mills area was home to a number of mills, including a grist mill, a saw mill, and a woolen mill. The mills were powered by the Ivy Creek, and provided employment for many of the local residents.
In the late 1800s, the Ivy Mills area began to transition from an agricultural community to a residential one. The Ivy Mills Post Office was established in 1891, and the community was officially incorporated as the Town of Ivy in 1895.
Geography
Ivy is located in the foothills of the Blue Ridge Mountains, approximately 10 miles northwest of Charlottesville. The community is situated on the banks of the Ivy Creek, which flows through the area. The creek is a tributary of the Rivanna River, which is a major tributary of the James River.
The area is characterized by rolling hills and valleys, with elevations ranging from 500 to 1,000 feet above sea level. The climate is temperate, with mild winters and warm summers.
Economy
Ivy is home to a variety of businesses, including a winery, a brewery, a distillery, and a cidery. The community is also home to a number of small businesses, including restaurants, shops, and art galleries.
The area is also home to a number of farms, which produce a variety of crops, including apples, peaches, and grapes. The farms also produce hay, beef, and dairy products.
Demographics
As of the 2010 census, the population of Ivy was 1,845. The racial makeup of the community was 94.3% White, 2.2% African American, 0.3% Native American, 0.7% Asian, 0.1% Pacific Islander, and 2.4% from other races.
The median household income in Ivy was $50,977, and the median family income was $60,977. The per capita income was $25,977. Approximately 8.3% of the population was below the poverty line.
Common Questions
What is the Total Population of Ivy?
Total Population of Ivy is 682.
What is the Total Male Population of Ivy?
Total Male Population of Ivy is 280.
What is the Total Female Population of Ivy?
Total Female Population of Ivy is 402.
What is the Ratio of Males per 100 Females in Ivy?
There are 69.65 Males per 100 Females in Ivy.
What is the Ratio of Females per 100 Males in Ivy?
There are 143.57 Females per 100 Males in Ivy.
What is the Median Population Age in Ivy?
Median Population Age in Ivy is 60.7 Years.
What is the Average Family Size in Ivy
Average Family Size in Ivy is 2.6 People.
What is the Average Household Size in Ivy
Average Household Size in Ivy is 1.9 People.
What is Per Capita Income in Ivy?
Per Capita income in Ivy is $95,055.
What is the Median Family Income in Ivy?
Median Family Income in Ivy is $148,846.
What is the Median Household income in Ivy?
Median Household Income in Ivy is $176,304.
What is Inequality or Gini Index in Ivy?
Inequality or Gini Index in Ivy is 0.21.
How Large is the Labor Force in Ivy?
There are 469 People in the Labor Forcein in Ivy.
What is the Percentage of People in the Labor Force in Ivy?
74.8% of People are in the Labor Force in Ivy.
What is the Unemployment Rate in Ivy?
Unemployment Rate in Ivy is 22.0%.