Orchard Park, NY
Orchard Park Map
Orchard Park Overview
3,084
TOTAL POPULATION
1,697
MALE POPULATION
1,387
FEMALE POPULATION
122.35
MALES / 100 FEMALES
81.73
FEMALES / 100 MALES
46.8
MEDIAN AGE
2.8
AVG FAMILY SIZE
2.1
AVG HOUSEHOLD SIZE
$57,107
PER CAPITA INCOME
$144,292
AVG FAMILY INCOME
$91,705
AVG HOUSEHOLD INCOME
8.4%
WAGE / INCOME GAP [ % ]
91.6¢/ $1
WAGE / INCOME GAP [ $ ]
0.45
INEQUALITY / GINI INDEX
1,813
LABOR FORCE [ PEOPLE ]
69.8%
PERCENT IN LABOR FORCE
4.3%
UNEMPLOYMENT RATE
Orchard Park Zip Codes
Orchard Park Area Codes
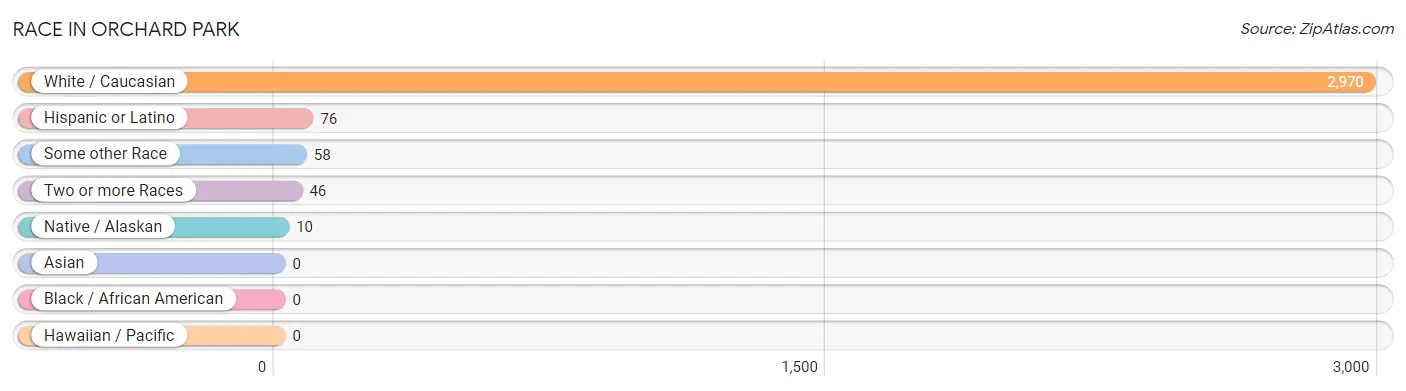
Race in Orchard Park
The most populous races in Orchard Park are White / Caucasian (2,970 | 96.3%), Hispanic or Latino (76 | 2.5%), and Some other Race (58 | 1.9%).
| Race | # Population | % Population |
| Asian | 0 | 0.0% |
| Black / African American | 0 | 0.0% |
| Hawaiian / Pacific | 0 | 0.0% |
| Hispanic or Latino | 76 | 2.5% |
| Native / Alaskan | 10 | 0.3% |
| White / Caucasian | 2,970 | 96.3% |
| Two or more Races | 46 | 1.5% |
| Some other Race | 58 | 1.9% |
| Total | 3,084 | 100.0% |
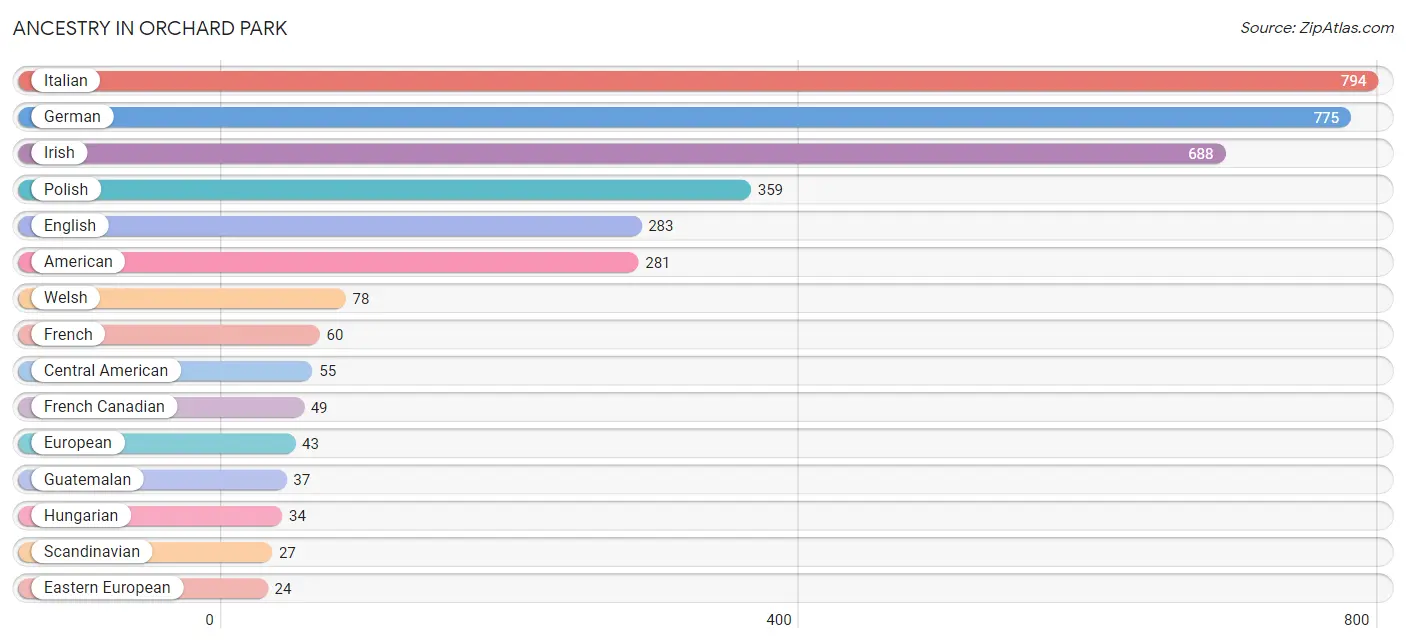
Ancestry in Orchard Park
The most populous ancestries reported in Orchard Park are Italian (794 | 25.8%), German (775 | 25.1%), Irish (688 | 22.3%), Polish (359 | 11.6%), and English (283 | 9.2%), together accounting for 94.0% of all Orchard Park residents.
| Ancestry | # Population | % Population |
| African | 9 | 0.3% |
| American | 281 | 9.1% |
| Austrian | 9 | 0.3% |
| Central American | 55 | 1.8% |
| Eastern European | 24 | 0.8% |
| English | 283 | 9.2% |
| European | 43 | 1.4% |
| French | 60 | 1.9% |
| French Canadian | 49 | 1.6% |
| German | 775 | 25.1% |
| Guatemalan | 37 | 1.2% |
| Hungarian | 34 | 1.1% |
| Irish | 688 | 22.3% |
| Iroquois | 10 | 0.3% |
| Italian | 794 | 25.8% |
| Lithuanian | 6 | 0.2% |
| Mexican | 1 | 0.0% |
| Norwegian | 17 | 0.5% |
| Panamanian | 18 | 0.6% |
| Polish | 359 | 11.6% |
| Puerto Rican | 20 | 0.6% |
| Scandinavian | 27 | 0.9% |
| Slovak | 13 | 0.4% |
| Subsaharan African | 9 | 0.3% |
| Swedish | 11 | 0.4% |
| Swiss | 10 | 0.3% |
| Welsh | 78 | 2.5% |
| West Indian | 9 | 0.3% | View All 28 Rows |
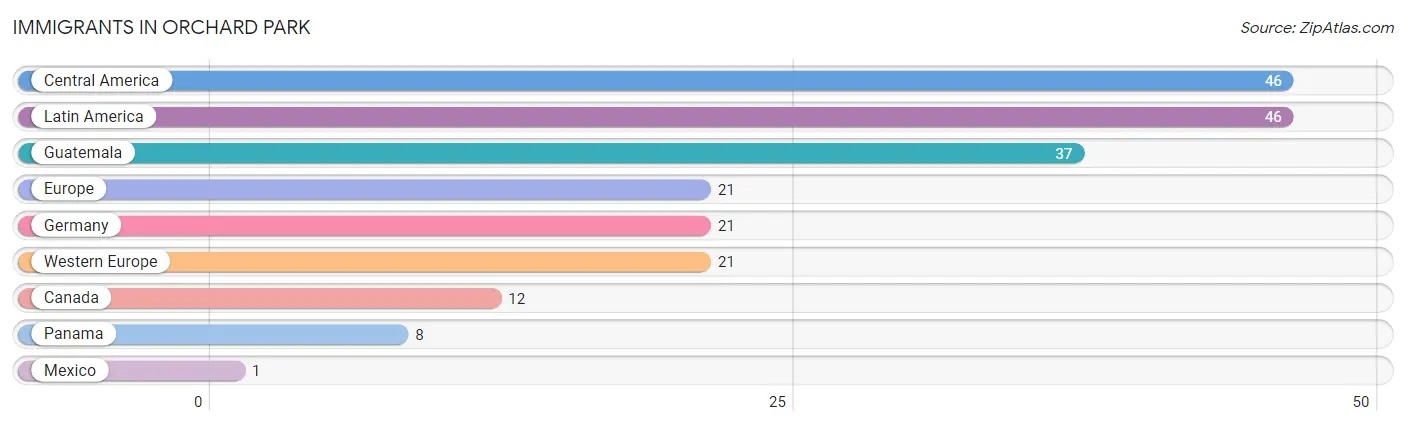
Immigrants in Orchard Park
The most numerous immigrant groups reported in Orchard Park came from Central America (46 | 1.5%), Latin America (46 | 1.5%), Guatemala (37 | 1.2%), Europe (21 | 0.7%), and Germany (21 | 0.7%), together accounting for 5.5% of all Orchard Park residents.
| Immigration Origin | # Population | % Population |
| Canada | 12 | 0.4% |
| Central America | 46 | 1.5% |
| Europe | 21 | 0.7% |
| Germany | 21 | 0.7% |
| Guatemala | 37 | 1.2% |
| Latin America | 46 | 1.5% |
| Mexico | 1 | 0.0% |
| Panama | 8 | 0.3% |
| Western Europe | 21 | 0.7% | View All 9 Rows |
Sex and Age in Orchard Park
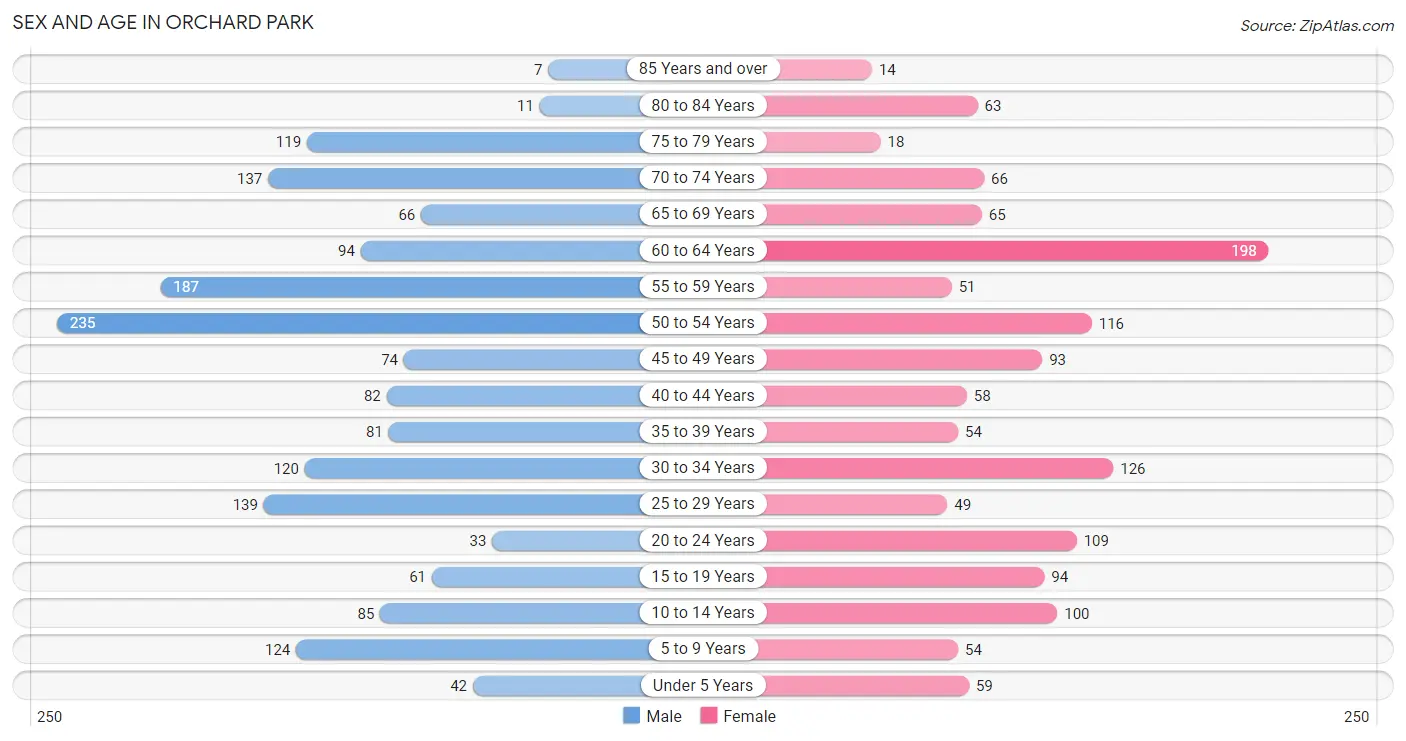
Sex and Age in Orchard Park
The most populous age groups in Orchard Park are 50 to 54 Years (235 | 13.9%) for men and 60 to 64 Years (198 | 14.3%) for women.
| Age Bracket | Male | Female |
| Under 5 Years | 42 (2.5%) | 59 (4.3%) |
| 5 to 9 Years | 124 (7.3%) | 54 (3.9%) |
| 10 to 14 Years | 85 (5.0%) | 100 (7.2%) |
| 15 to 19 Years | 61 (3.6%) | 94 (6.8%) |
| 20 to 24 Years | 33 (1.9%) | 109 (7.9%) |
| 25 to 29 Years | 139 (8.2%) | 49 (3.5%) |
| 30 to 34 Years | 120 (7.1%) | 126 (9.1%) |
| 35 to 39 Years | 81 (4.8%) | 54 (3.9%) |
| 40 to 44 Years | 82 (4.8%) | 58 (4.2%) |
| 45 to 49 Years | 74 (4.4%) | 93 (6.7%) |
| 50 to 54 Years | 235 (13.9%) | 116 (8.4%) |
| 55 to 59 Years | 187 (11.0%) | 51 (3.7%) |
| 60 to 64 Years | 94 (5.5%) | 198 (14.3%) |
| 65 to 69 Years | 66 (3.9%) | 65 (4.7%) |
| 70 to 74 Years | 137 (8.1%) | 66 (4.8%) |
| 75 to 79 Years | 119 (7.0%) | 18 (1.3%) |
| 80 to 84 Years | 11 (0.6%) | 63 (4.5%) |
| 85 Years and over | 7 (0.4%) | 14 (1.0%) |
| Total | 1,697 (100.0%) | 1,387 (100.0%) |
Families and Households in Orchard Park
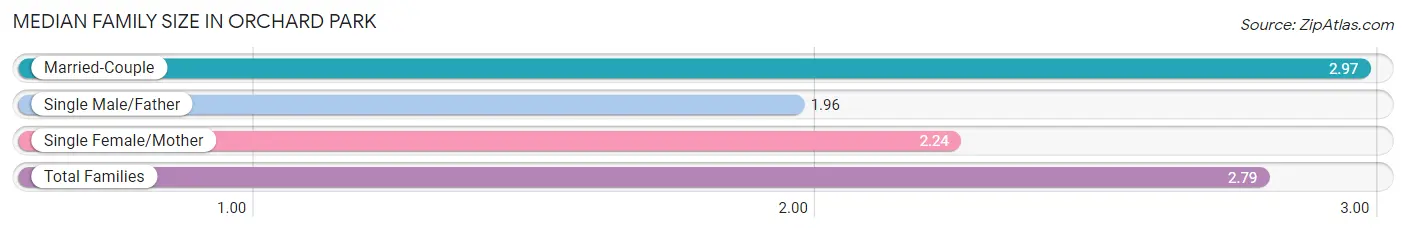
Median Family Size in Orchard Park
The median family size in Orchard Park is 2.79 persons per family, with married-couple families (627 | 79.1%) accounting for the largest median family size of 2.97 persons per family. On the other hand, single male/father families (81 | 10.2%) represent the smallest median family size with 1.96 persons per family.
| Family Type | # Families | Family Size |
| Married-Couple | 627 (79.1%) | 2.97 |
| Single Male/Father | 81 (10.2%) | 1.96 |
| Single Female/Mother | 85 (10.7%) | 2.24 |
| Total Families | 793 (100.0%) | 2.79 |
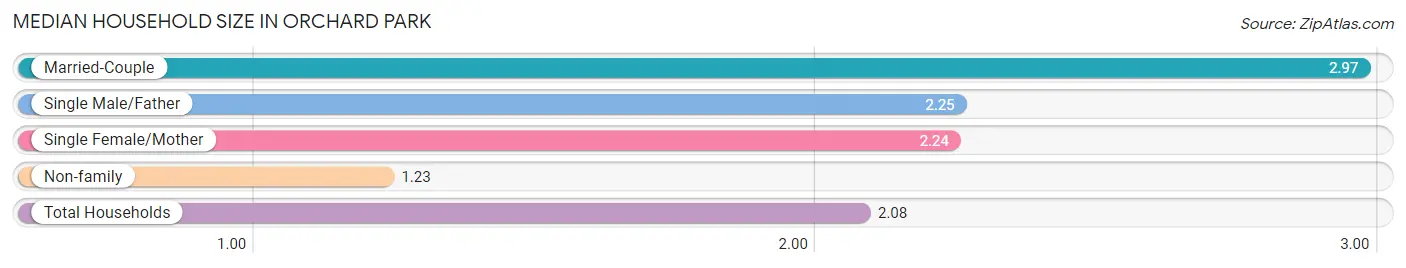
Median Household Size in Orchard Park
The median household size in Orchard Park is 2.08 persons per household, with married-couple households (627 | 42.4%) accounting for the largest median household size of 2.97 persons per household. non-family households (686 | 46.4%) represent the smallest median household size with 1.23 persons per household.
| Household Type | # Households | Household Size |
| Married-Couple | 627 (42.4%) | 2.97 |
| Single Male/Father | 81 (5.5%) | 2.25 |
| Single Female/Mother | 85 (5.8%) | 2.24 |
| Non-family | 686 (46.4%) | 1.23 |
| Total Households | 1,479 (100.0%) | 2.08 |
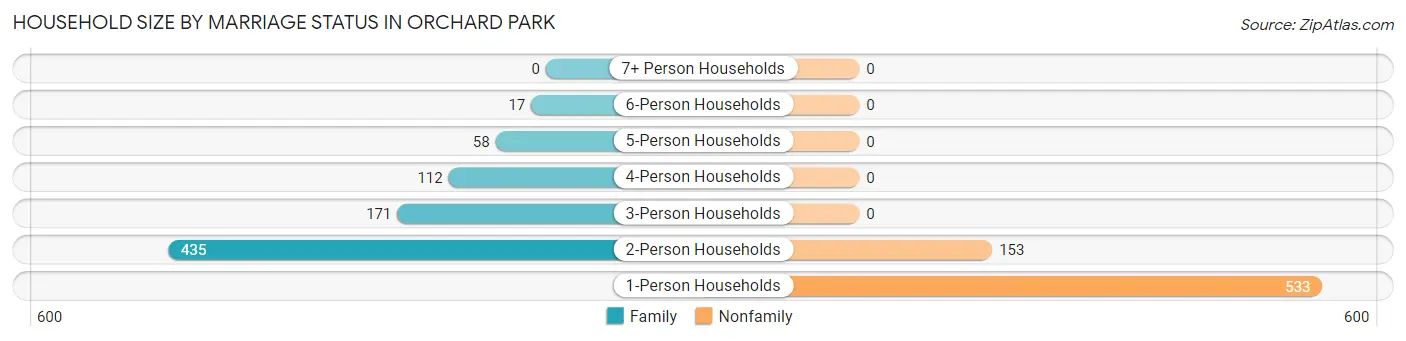
Household Size by Marriage Status in Orchard Park
Out of a total of 1,479 households in Orchard Park, 793 (53.6%) are family households, while 686 (46.4%) are nonfamily households. The most numerous type of family households are 2-person households, comprising 435, and the most common type of nonfamily households are 1-person households, comprising 533.
| Household Size | Family Households | Nonfamily Households |
| 1-Person Households | - | 533 (36.0%) |
| 2-Person Households | 435 (29.4%) | 153 (10.3%) |
| 3-Person Households | 171 (11.6%) | 0 (0.0%) |
| 4-Person Households | 112 (7.6%) | 0 (0.0%) |
| 5-Person Households | 58 (3.9%) | 0 (0.0%) |
| 6-Person Households | 17 (1.1%) | 0 (0.0%) |
| 7+ Person Households | 0 (0.0%) | 0 (0.0%) |
| Total | 793 (53.6%) | 686 (46.4%) |
Female Fertility in Orchard Park
Fertility by Age in Orchard Park
Average fertility rate in Orchard Park is 43.0 births per 1,000 women. Women in the age bracket of 20 to 34 years have the highest fertility rate with 95.0 births per 1,000 women. Women in the age bracket of 20 to 34 years acount for 100.0% of all women with births.
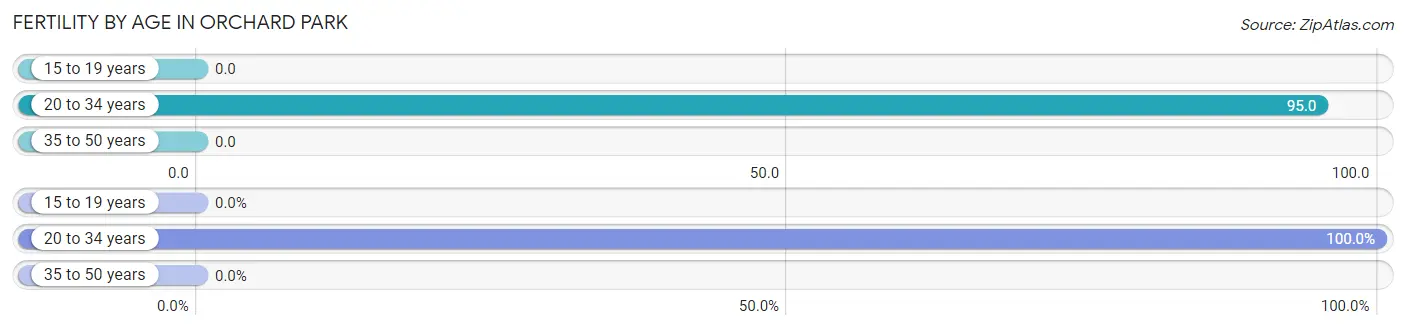
| Age Bracket | Women with Births | Births / 1,000 Women |
| 15 to 19 years | 0 (0.0%) | 0.0 |
| 20 to 34 years | 27 (100.0%) | 95.0 |
| 35 to 50 years | 0 (0.0%) | 0.0 |
| Total | 27 (100.0%) | 43.0 |
Fertility by Age by Marriage Status in Orchard Park
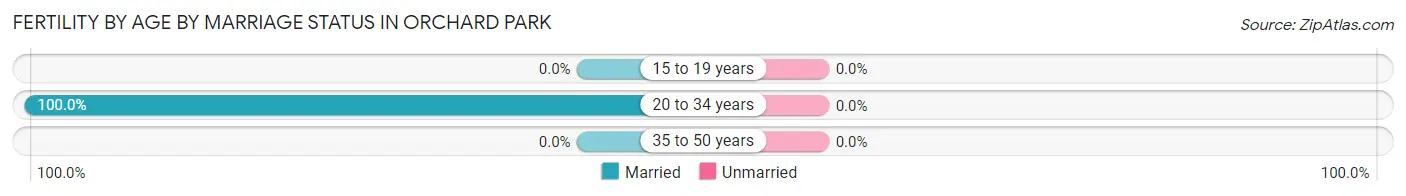
| Age Bracket | Married | Unmarried |
| 15 to 19 years | 0 (0.0%) | 0 (0.0%) |
| 20 to 34 years | 27 (100.0%) | 0 (0.0%) |
| 35 to 50 years | 0 (0.0%) | 0 (0.0%) |
| Total | 27 (100.0%) | 0 (0.0%) |
Fertility by Education in Orchard Park
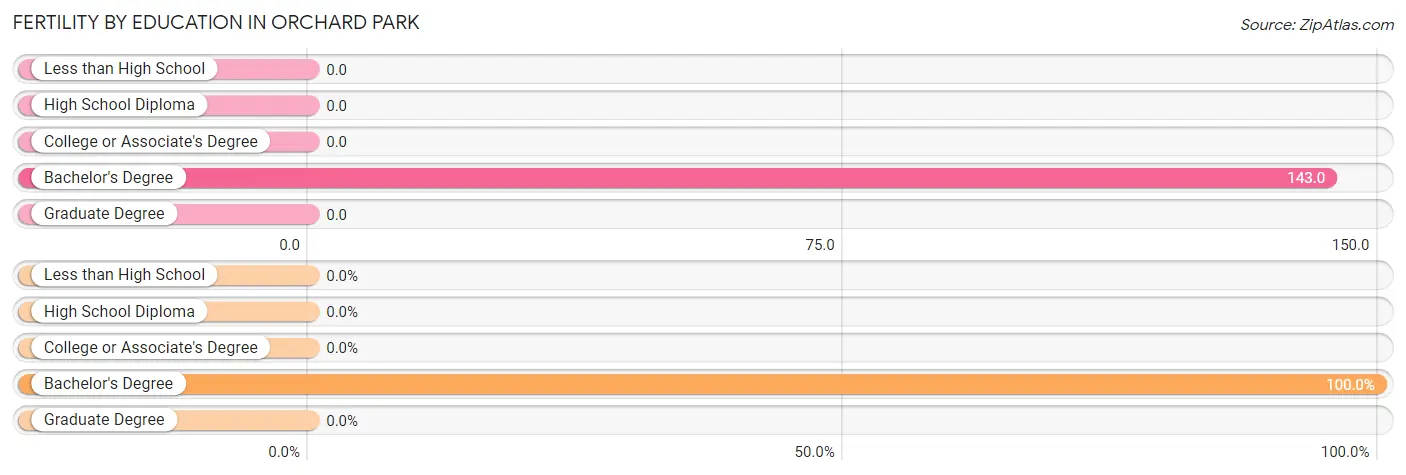
| Educational Attainment | Women with Births | Births / 1,000 Women |
| Less than High School | 0 (0.0%) | 0.0 |
| High School Diploma | 0 (0.0%) | 0.0 |
| College or Associate's Degree | 0 (0.0%) | 0.0 |
| Bachelor's Degree | 27 (100.0%) | 143.0 |
| Graduate Degree | 0 (0.0%) | 0.0 |
| Total | 27 (100.0%) | 43.0 |
Fertility by Education by Marriage Status in Orchard Park
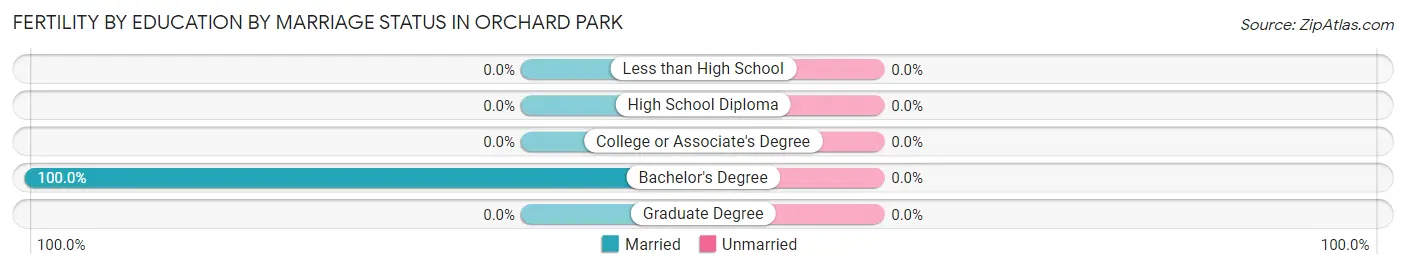
| Educational Attainment | Married | Unmarried |
| Less than High School | 0 (0.0%) | 0 (0.0%) |
| High School Diploma | 0 (0.0%) | 0 (0.0%) |
| College or Associate's Degree | 0 (0.0%) | 0 (0.0%) |
| Bachelor's Degree | 27 (100.0%) | 0 (0.0%) |
| Graduate Degree | 0 (0.0%) | 0 (0.0%) |
| Total | 27 (100.0%) | 0 (0.0%) |
Income in Orchard Park
Income Overview in Orchard Park
Per Capita Income in Orchard Park is $57,107, while median incomes of families and households are $144,292 and $91,705 respectively.
| Characteristic | Number | Measure |
| Per Capita Income | 3,084 | $57,107 |
| Median Family Income | 793 | $144,292 |
| Mean Family Income | 793 | $153,707 |
| Median Household Income | 1,479 | $91,705 |
| Mean Household Income | 1,479 | $118,196 |
| Income Deficit | 793 | $0 |
| Wage / Income Gap (%) | 3,084 | 8.42% |
| Wage / Income Gap ($) | 3,084 | 91.58¢ per $1 |
| Gini / Inequality Index | 3,084 | 0.45 |
Earnings by Sex in Orchard Park
Average Earnings in Orchard Park are $54,949, $57,056 for men and $52,250 for women, a difference of 8.4%.
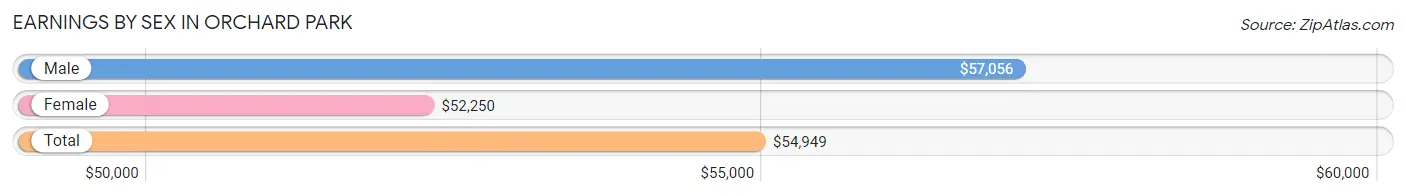
| Sex | Number | Average Earnings |
| Male | 1,055 (55.6%) | $57,056 |
| Female | 841 (44.4%) | $52,250 |
| Total | 1,896 (100.0%) | $54,949 |
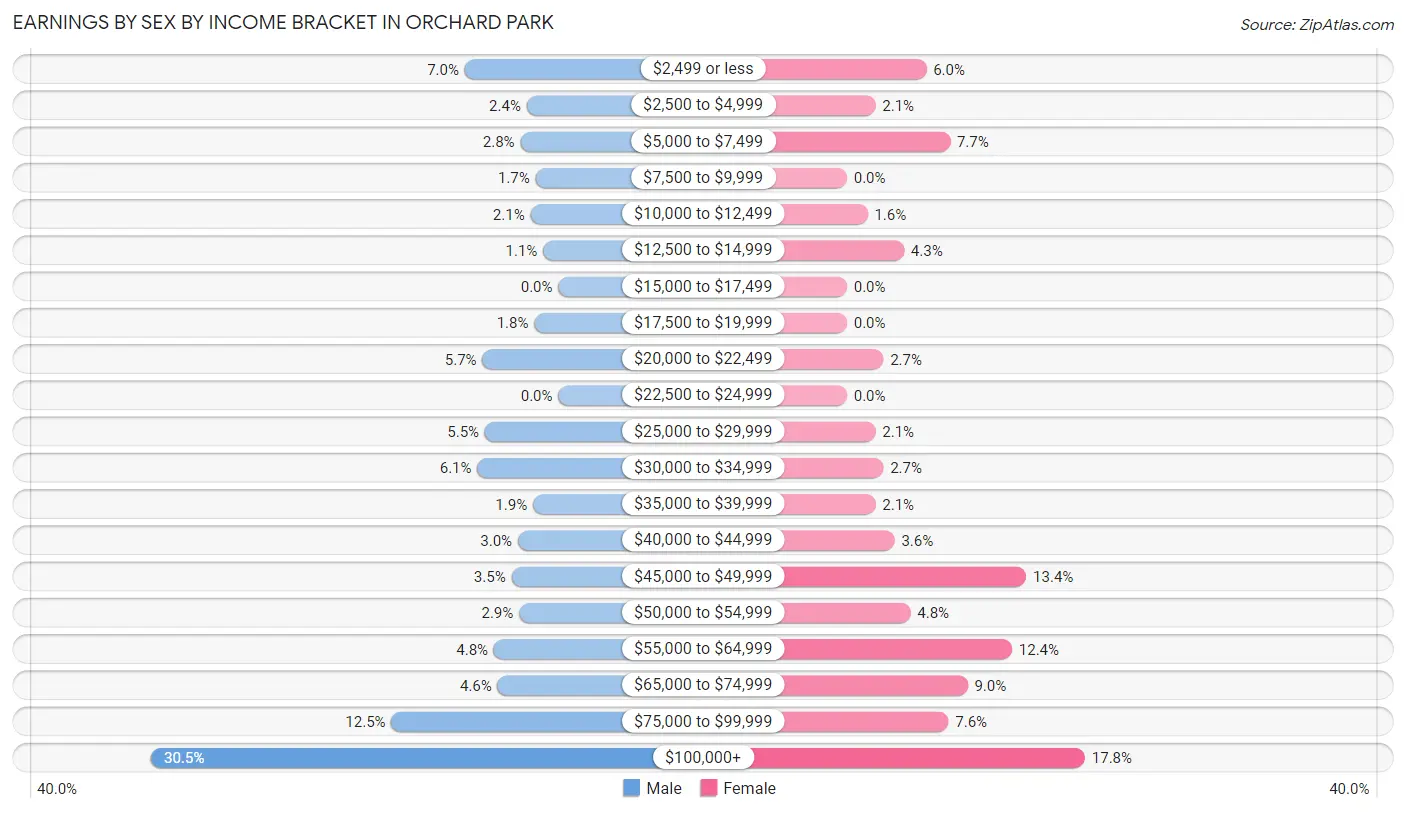
Earnings by Sex by Income Bracket in Orchard Park
The most common earnings brackets in Orchard Park are $100,000+ for men (322 | 30.5%) and $100,000+ for women (150 | 17.8%).
| Income | Male | Female |
| $2,499 or less | 74 (7.0%) | 50 (5.9%) |
| $2,500 to $4,999 | 25 (2.4%) | 18 (2.1%) |
| $5,000 to $7,499 | 30 (2.8%) | 65 (7.7%) |
| $7,500 to $9,999 | 18 (1.7%) | 0 (0.0%) |
| $10,000 to $12,499 | 22 (2.1%) | 13 (1.5%) |
| $12,500 to $14,999 | 12 (1.1%) | 36 (4.3%) |
| $15,000 to $17,499 | 0 (0.0%) | 0 (0.0%) |
| $17,500 to $19,999 | 19 (1.8%) | 0 (0.0%) |
| $20,000 to $22,499 | 60 (5.7%) | 23 (2.7%) |
| $22,500 to $24,999 | 0 (0.0%) | 0 (0.0%) |
| $25,000 to $29,999 | 58 (5.5%) | 18 (2.1%) |
| $30,000 to $34,999 | 64 (6.1%) | 23 (2.7%) |
| $35,000 to $39,999 | 20 (1.9%) | 18 (2.1%) |
| $40,000 to $44,999 | 32 (3.0%) | 30 (3.6%) |
| $45,000 to $49,999 | 37 (3.5%) | 113 (13.4%) |
| $50,000 to $54,999 | 31 (2.9%) | 40 (4.8%) |
| $55,000 to $64,999 | 51 (4.8%) | 104 (12.4%) |
| $65,000 to $74,999 | 48 (4.5%) | 76 (9.0%) |
| $75,000 to $99,999 | 132 (12.5%) | 64 (7.6%) |
| $100,000+ | 322 (30.5%) | 150 (17.8%) |
| Total | 1,055 (100.0%) | 841 (100.0%) |
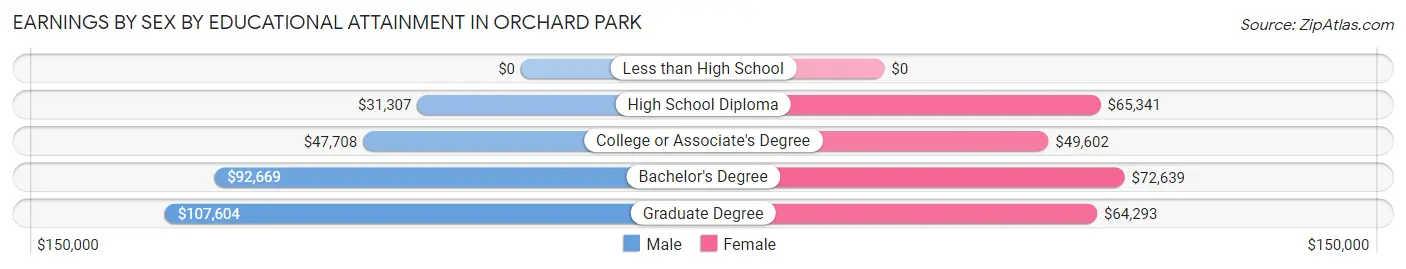
Earnings by Sex by Educational Attainment in Orchard Park
Average earnings in Orchard Park are $68,107 for men and $56,334 for women, a difference of 17.3%. Men with an educational attainment of graduate degree enjoy the highest average annual earnings of $107,604, while those with high school diploma education earn the least with $31,307. Women with an educational attainment of bachelor's degree earn the most with the average annual earnings of $72,639, while those with college or associate's degree education have the smallest earnings of $49,602.
| Educational Attainment | Male Income | Female Income |
| Less than High School | - | - |
| High School Diploma | $31,307 | $65,341 |
| College or Associate's Degree | $47,708 | $49,602 |
| Bachelor's Degree | $92,669 | $72,639 |
| Graduate Degree | $107,604 | $64,293 |
| Total | $68,107 | $56,334 |
Family Income in Orchard Park
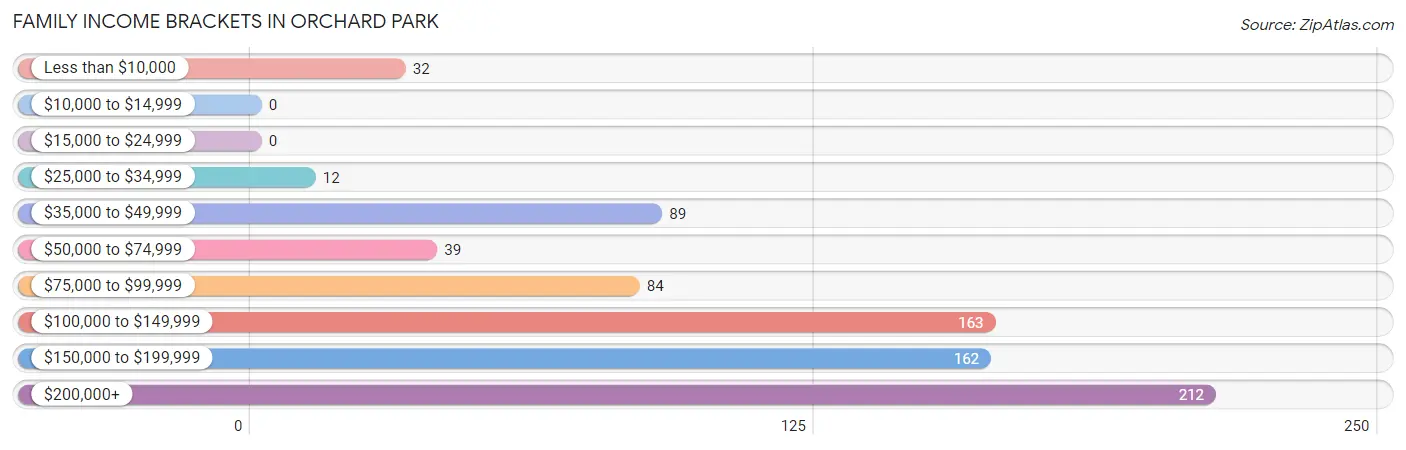
Family Income Brackets in Orchard Park
According to the Orchard Park family income data, there are 212 families falling into the $200,000+ income range, which is the most common income bracket and makes up 26.7% of all families.
| Income Bracket | # Families | % Families |
| Less than $10,000 | 32 | 4.0% |
| $10,000 to $14,999 | 0 | 0.0% |
| $15,000 to $24,999 | 0 | 0.0% |
| $25,000 to $34,999 | 12 | 1.5% |
| $35,000 to $49,999 | 89 | 11.2% |
| $50,000 to $74,999 | 39 | 4.9% |
| $75,000 to $99,999 | 84 | 10.6% |
| $100,000 to $149,999 | 163 | 20.6% |
| $150,000 to $199,999 | 162 | 20.4% |
| $200,000+ | 212 | 26.7% |
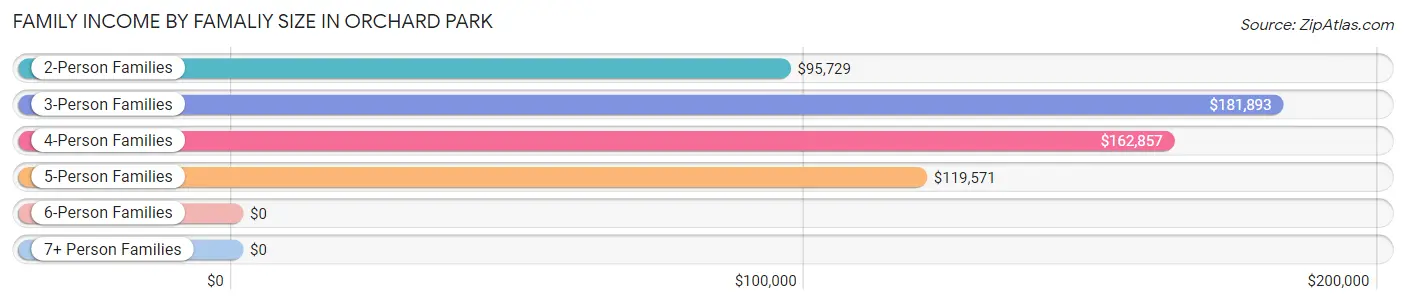
Family Income by Famaliy Size in Orchard Park
3-person families (147 | 18.5%) account for the highest median family income in Orchard Park with $181,893 per family, while 3-person families (147 | 18.5%) have the highest median income of $60,631 per family member.
| Income Bracket | # Families | Median Income |
| 2-Person Families | 459 (57.9%) | $95,729 |
| 3-Person Families | 147 (18.5%) | $181,893 |
| 4-Person Families | 112 (14.1%) | $162,857 |
| 5-Person Families | 58 (7.3%) | $119,571 |
| 6-Person Families | 17 (2.1%) | $0 |
| 7+ Person Families | 0 (0.0%) | $0 |
| Total | 793 (100.0%) | $144,292 |
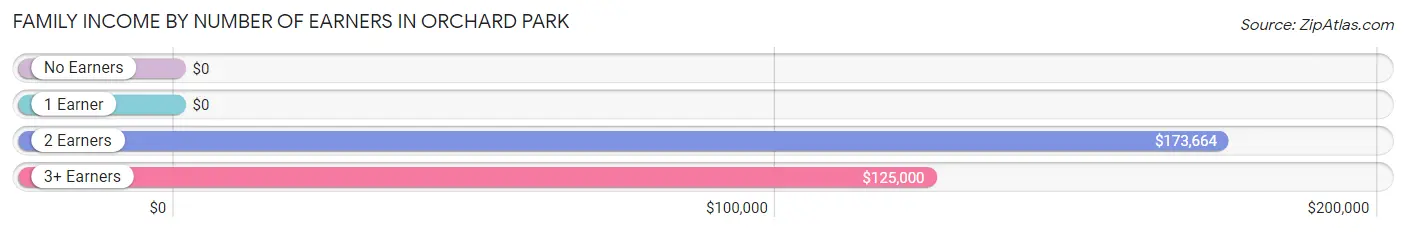
Family Income by Number of Earners in Orchard Park
| Number of Earners | # Families | Median Income |
| No Earners | 77 (9.7%) | $0 |
| 1 Earner | 241 (30.4%) | $0 |
| 2 Earners | 339 (42.7%) | $173,664 |
| 3+ Earners | 136 (17.2%) | $125,000 |
| Total | 793 (100.0%) | $144,292 |
Household Income in Orchard Park
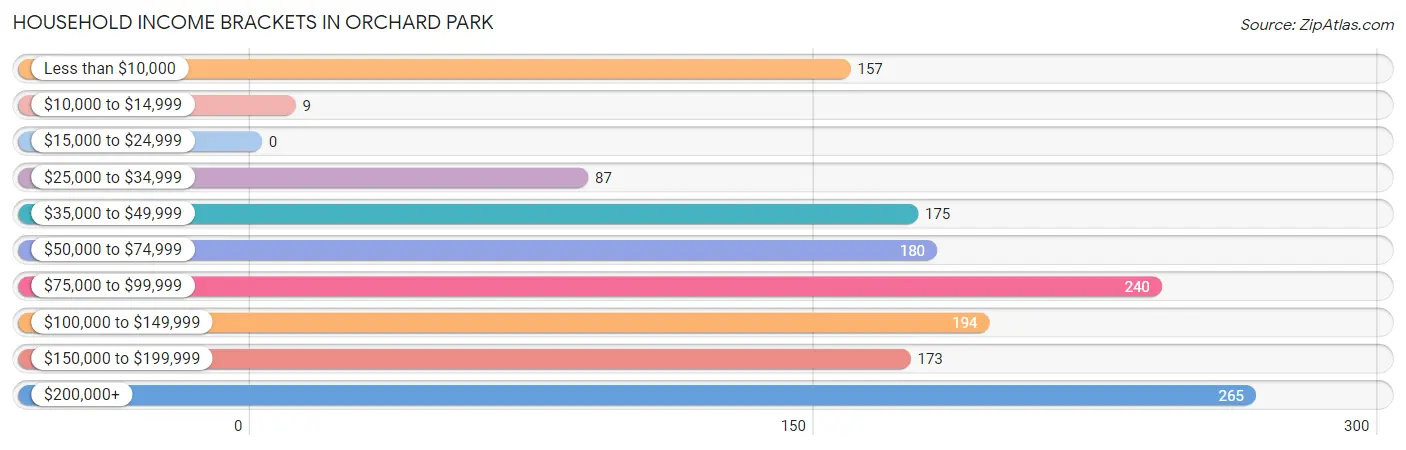
Household Income Brackets in Orchard Park
With 265 households falling in the category, the $200,000+ income range is the most frequent in Orchard Park, accounting for 17.9% of all households.
| Income Bracket | # Households | % Households |
| Less than $10,000 | 157 | 10.6% |
| $10,000 to $14,999 | 9 | 0.6% |
| $15,000 to $24,999 | 0 | 0.0% |
| $25,000 to $34,999 | 87 | 5.9% |
| $35,000 to $49,999 | 175 | 11.8% |
| $50,000 to $74,999 | 180 | 12.2% |
| $75,000 to $99,999 | 240 | 16.2% |
| $100,000 to $149,999 | 194 | 13.1% |
| $150,000 to $199,999 | 173 | 11.7% |
| $200,000+ | 265 | 17.9% |
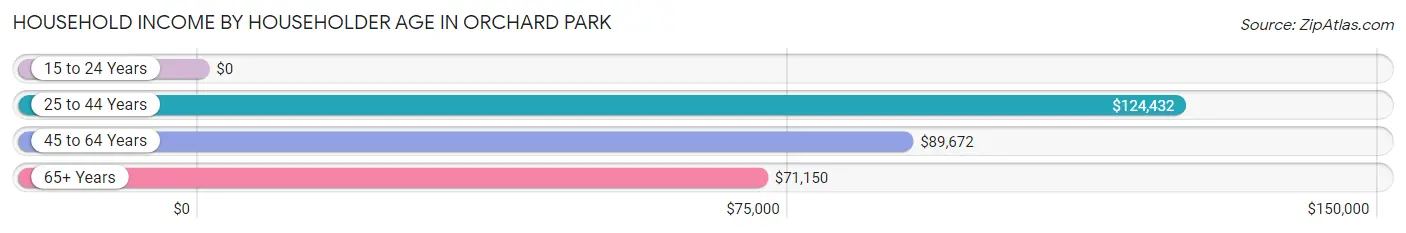
Household Income by Householder Age in Orchard Park
The median household income in Orchard Park is $91,705, with the highest median household income of $124,432 found in the 25 to 44 years age bracket for the primary householder. A total of 369 households (24.9%) fall into this category. Meanwhile, the 15 to 24 years age bracket for the primary householder has the lowest median household income of $0, with 29 households (2.0%) in this group.
| Income Bracket | # Households | Median Income |
| 15 to 24 Years | 29 (2.0%) | $0 |
| 25 to 44 Years | 369 (24.9%) | $124,432 |
| 45 to 64 Years | 736 (49.8%) | $89,672 |
| 65+ Years | 345 (23.3%) | $71,150 |
| Total | 1,479 (100.0%) | $91,705 |
Poverty in Orchard Park
Income Below Poverty by Sex and Age in Orchard Park
With 13.4% poverty level for males and 5.5% for females among the residents of Orchard Park, 45 to 54 year old males and 5 year old females are the most vulnerable to poverty, with 125 males (40.5%) and 7 females (38.9%) in their respective age groups living below the poverty level.
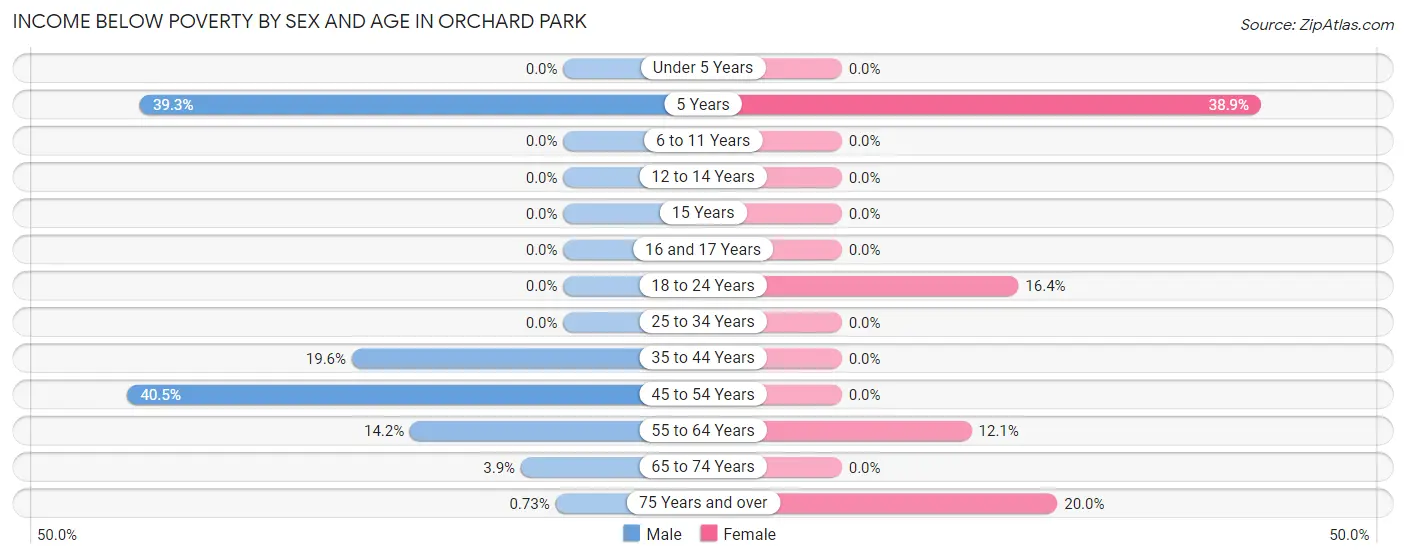
| Age Bracket | Male | Female |
| Under 5 Years | 0 (0.0%) | 0 (0.0%) |
| 5 Years | 22 (39.3%) | 7 (38.9%) |
| 6 to 11 Years | 0 (0.0%) | 0 (0.0%) |
| 12 to 14 Years | 0 (0.0%) | 0 (0.0%) |
| 15 Years | 0 (0.0%) | 0 (0.0%) |
| 16 and 17 Years | 0 (0.0%) | 0 (0.0%) |
| 18 to 24 Years | 0 (0.0%) | 20 (16.4%) |
| 25 to 34 Years | 0 (0.0%) | 0 (0.0%) |
| 35 to 44 Years | 32 (19.6%) | 0 (0.0%) |
| 45 to 54 Years | 125 (40.5%) | 0 (0.0%) |
| 55 to 64 Years | 40 (14.2%) | 30 (12.0%) |
| 65 to 74 Years | 8 (3.9%) | 0 (0.0%) |
| 75 Years and over | 1 (0.7%) | 19 (20.0%) |
| Total | 228 (13.4%) | 76 (5.5%) |
Income Above Poverty by Sex and Age in Orchard Park
According to the poverty statistics in Orchard Park, males aged under 5 years and females aged under 5 years are the age groups that are most secure financially, with 100.0% of males and 100.0% of females in these age groups living above the poverty line.
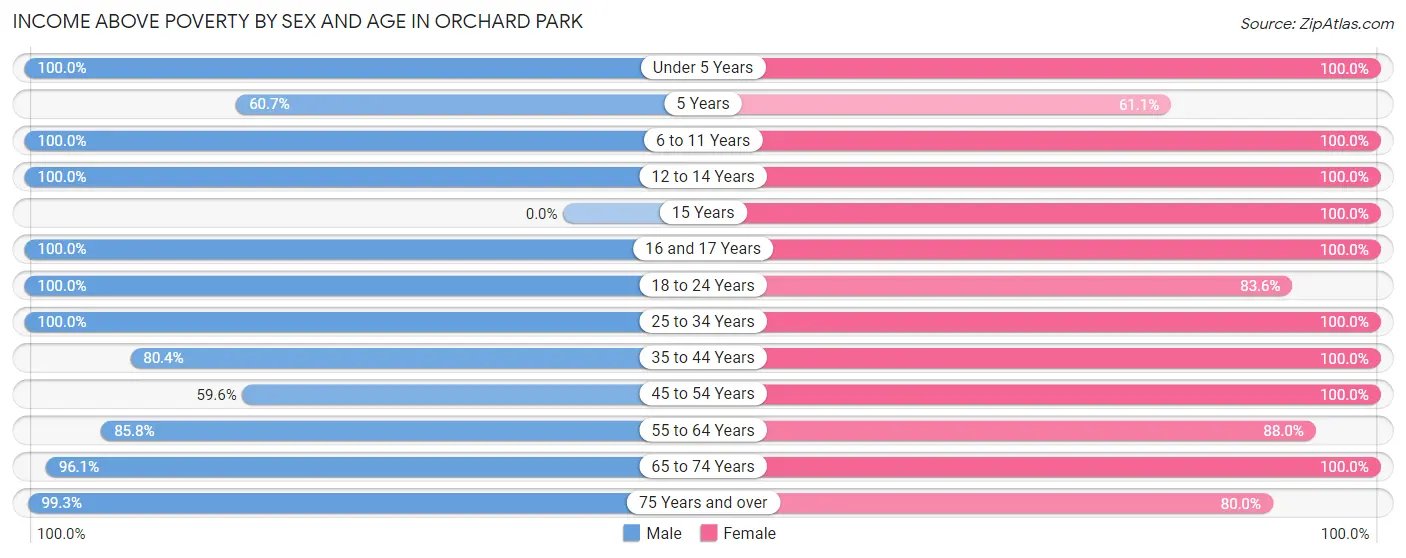
| Age Bracket | Male | Female |
| Under 5 Years | 42 (100.0%) | 59 (100.0%) |
| 5 Years | 34 (60.7%) | 11 (61.1%) |
| 6 to 11 Years | 81 (100.0%) | 47 (100.0%) |
| 12 to 14 Years | 72 (100.0%) | 89 (100.0%) |
| 15 Years | 0 (0.0%) | 23 (100.0%) |
| 16 and 17 Years | 61 (100.0%) | 58 (100.0%) |
| 18 to 24 Years | 33 (100.0%) | 102 (83.6%) |
| 25 to 34 Years | 259 (100.0%) | 175 (100.0%) |
| 35 to 44 Years | 131 (80.4%) | 112 (100.0%) |
| 45 to 54 Years | 184 (59.6%) | 209 (100.0%) |
| 55 to 64 Years | 241 (85.8%) | 219 (87.9%) |
| 65 to 74 Years | 195 (96.1%) | 131 (100.0%) |
| 75 Years and over | 136 (99.3%) | 76 (80.0%) |
| Total | 1,469 (86.6%) | 1,311 (94.5%) |
Income Below Poverty Among Married-Couple Families in Orchard Park
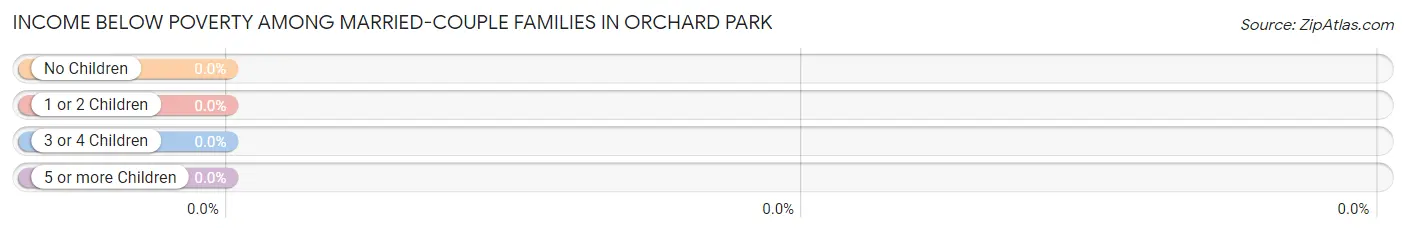
| Children | Above Poverty | Below Poverty |
| No Children | 371 (100.0%) | 0 (0.0%) |
| 1 or 2 Children | 190 (100.0%) | 0 (0.0%) |
| 3 or 4 Children | 66 (100.0%) | 0 (0.0%) |
| 5 or more Children | 0 (0.0%) | 0 (0.0%) |
| Total | 627 (100.0%) | 0 (0.0%) |
Income Below Poverty Among Single-Parent Households in Orchard Park
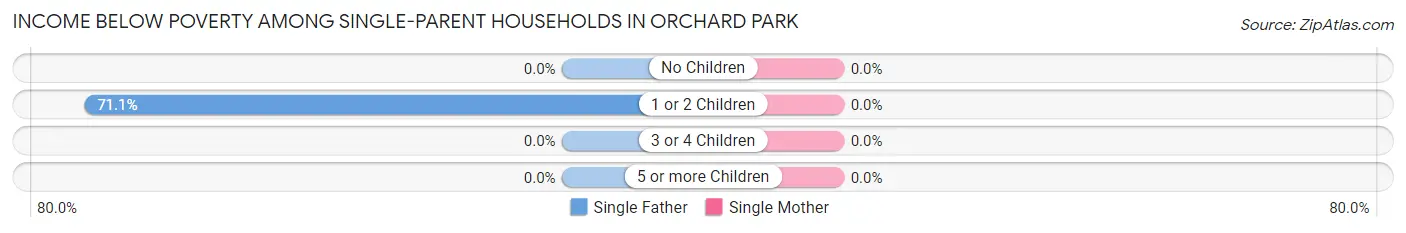
| Children | Single Father | Single Mother |
| No Children | 0 (0.0%) | 0 (0.0%) |
| 1 or 2 Children | 32 (71.1%) | 0 (0.0%) |
| 3 or 4 Children | 0 (0.0%) | 0 (0.0%) |
| 5 or more Children | 0 (0.0%) | 0 (0.0%) |
| Total | 32 (39.5%) | 0 (0.0%) |
Income Below Poverty Among Married-Couple vs Single-Parent Households in Orchard Park
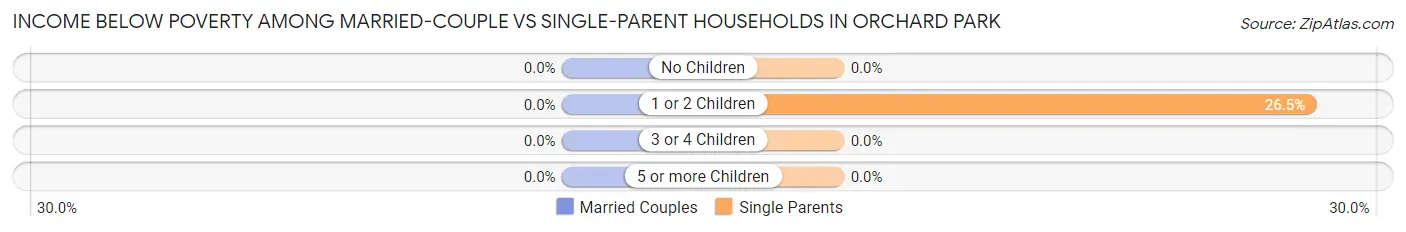
| Children | Married-Couple Families | Single-Parent Households |
| No Children | 0 (0.0%) | 0 (0.0%) |
| 1 or 2 Children | 0 (0.0%) | 32 (26.5%) |
| 3 or 4 Children | 0 (0.0%) | 0 (0.0%) |
| 5 or more Children | 0 (0.0%) | 0 (0.0%) |
| Total | 0 (0.0%) | 32 (19.3%) |
Employment Characteristics in Orchard Park
Employment by Class of Employer in Orchard Park
Among the 1,701 employed individuals in Orchard Park, private company employees (1,093 | 64.3%), not-for-profit organizations (194 | 11.4%), and local government employees (163 | 9.6%) make up the most common classes of employment.
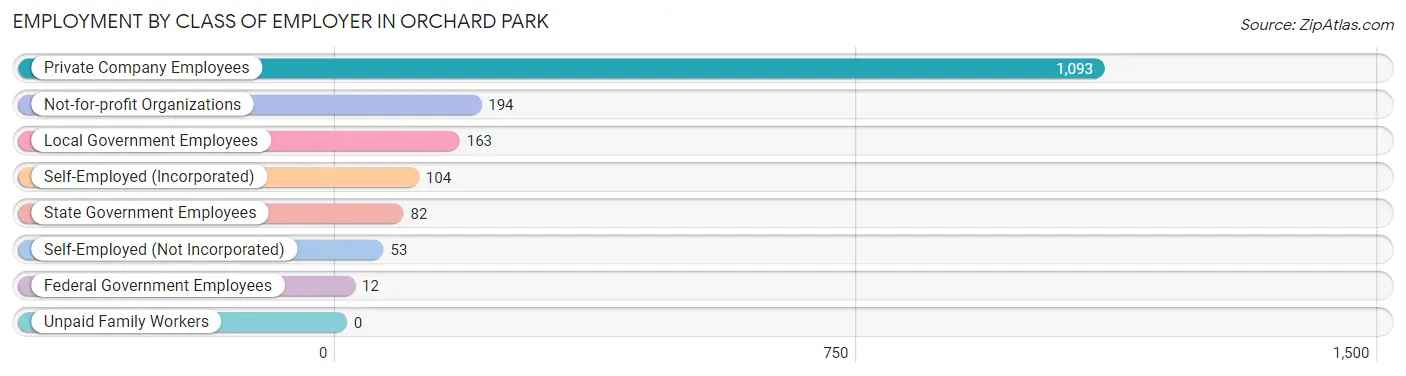
| Employer Class | # Employees | % Employees |
| Private Company Employees | 1,093 | 64.3% |
| Self-Employed (Incorporated) | 104 | 6.1% |
| Self-Employed (Not Incorporated) | 53 | 3.1% |
| Not-for-profit Organizations | 194 | 11.4% |
| Local Government Employees | 163 | 9.6% |
| State Government Employees | 82 | 4.8% |
| Federal Government Employees | 12 | 0.7% |
| Unpaid Family Workers | 0 | 0.0% |
| Total | 1,701 | 100.0% |
Employment Status by Age in Orchard Park
According to the labor force statistics for Orchard Park, out of the total population over 16 years of age (2,597), 69.8% or 1,813 individuals are in the labor force, with 4.3% or 78 of them unemployed. The age group with the highest labor force participation rate is 25 to 29 years, with 100.0% or 188 individuals in the labor force. Within the labor force, the 55 to 59 years age range has the highest percentage of unemployed individuals, with 24.5% or 48 of them being unemployed.
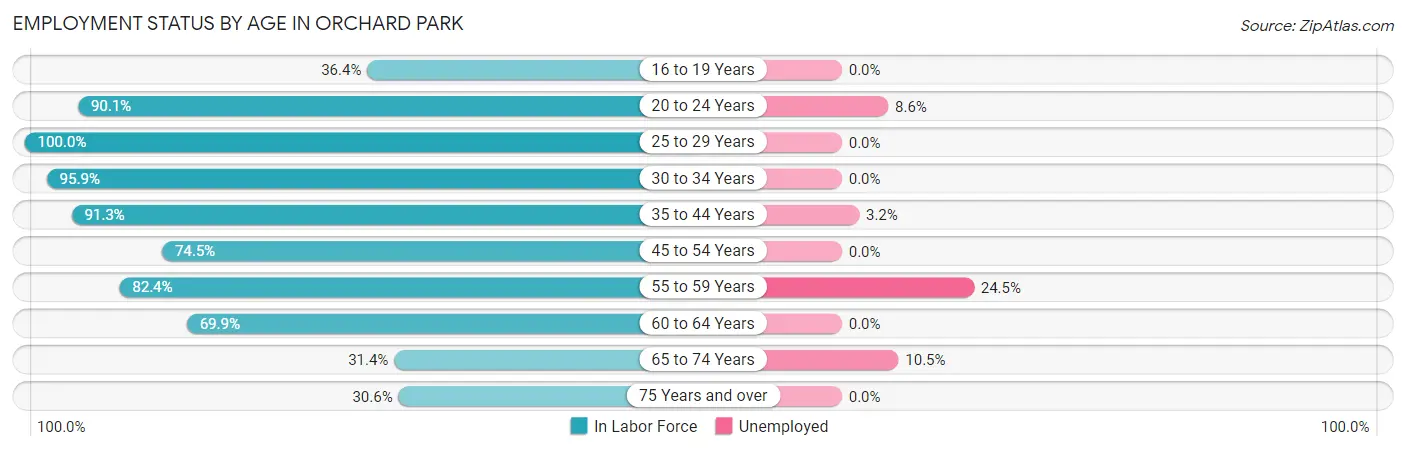
| Age Bracket | In Labor Force | Unemployed |
| 16 to 19 Years | 48 (36.4%) | 0 (0.0%) |
| 20 to 24 Years | 128 (90.1%) | 11 (8.6%) |
| 25 to 29 Years | 188 (100.0%) | 0 (0.0%) |
| 30 to 34 Years | 236 (95.9%) | 0 (0.0%) |
| 35 to 44 Years | 251 (91.3%) | 8 (3.2%) |
| 45 to 54 Years | 386 (74.5%) | 0 (0.0%) |
| 55 to 59 Years | 196 (82.4%) | 48 (24.5%) |
| 60 to 64 Years | 204 (69.9%) | 0 (0.0%) |
| 65 to 74 Years | 105 (31.4%) | 11 (10.5%) |
| 75 Years and over | 71 (30.6%) | 0 (0.0%) |
| Total | 1,813 (69.8%) | 78 (4.3%) |
Employment Status by Educational Attainment in Orchard Park
According to labor force statistics for Orchard Park, 83.2% of individuals (1,462) out of the total population between 25 and 64 years of age (1,757) are in the labor force, with 3.8% or 56 of them being unemployed. The group with the highest labor force participation rate are those with the educational attainment of less than high school, with 100.0% or 38 individuals in the labor force. Within the labor force, individuals with less than high school education have the highest percentage of unemployment, with 78.9% or 30 of them being unemployed.
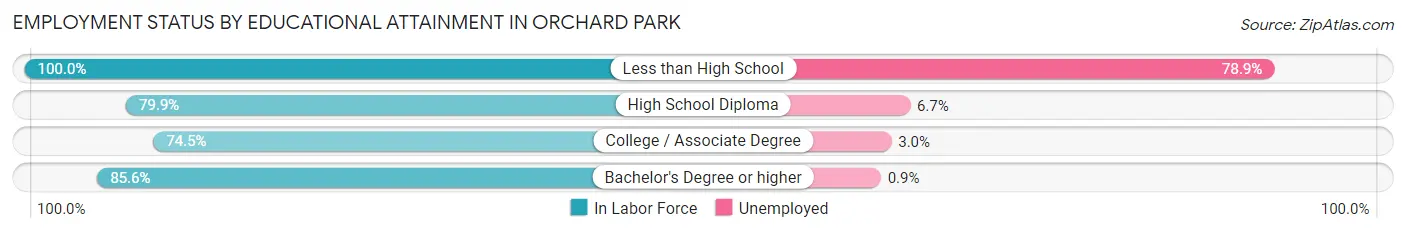
| Educational Attainment | In Labor Force | Unemployed |
| Less than High School | 38 (100.0%) | 30 (78.9%) |
| High School Diploma | 135 (79.9%) | 11 (6.7%) |
| College / Associate Degree | 263 (74.5%) | 11 (3.0%) |
| Bachelor's Degree or higher | 1,025 (85.6%) | 11 (0.9%) |
| Total | 1,462 (83.2%) | 67 (3.8%) |
Employment Occupations by Sex in Orchard Park
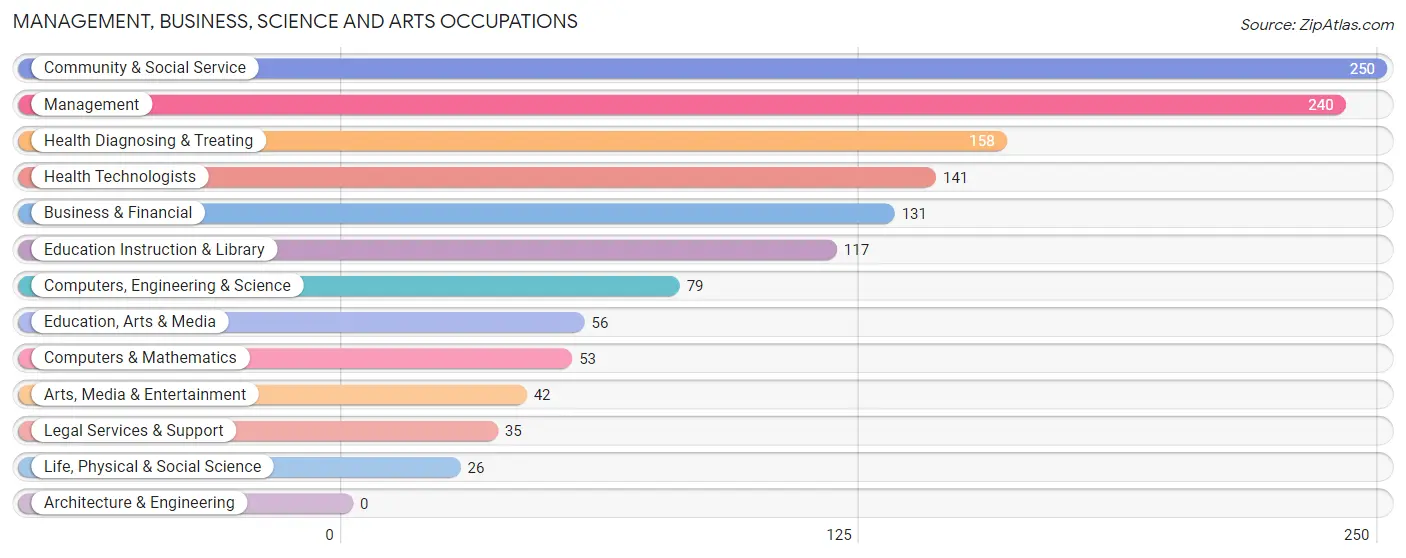
Management, Business, Science and Arts Occupations
The most common Management, Business, Science and Arts occupations in Orchard Park are Community & Social Service (250 | 14.4%), Management (240 | 13.8%), Health Diagnosing & Treating (158 | 9.1%), Health Technologists (141 | 8.1%), and Business & Financial (131 | 7.5%).
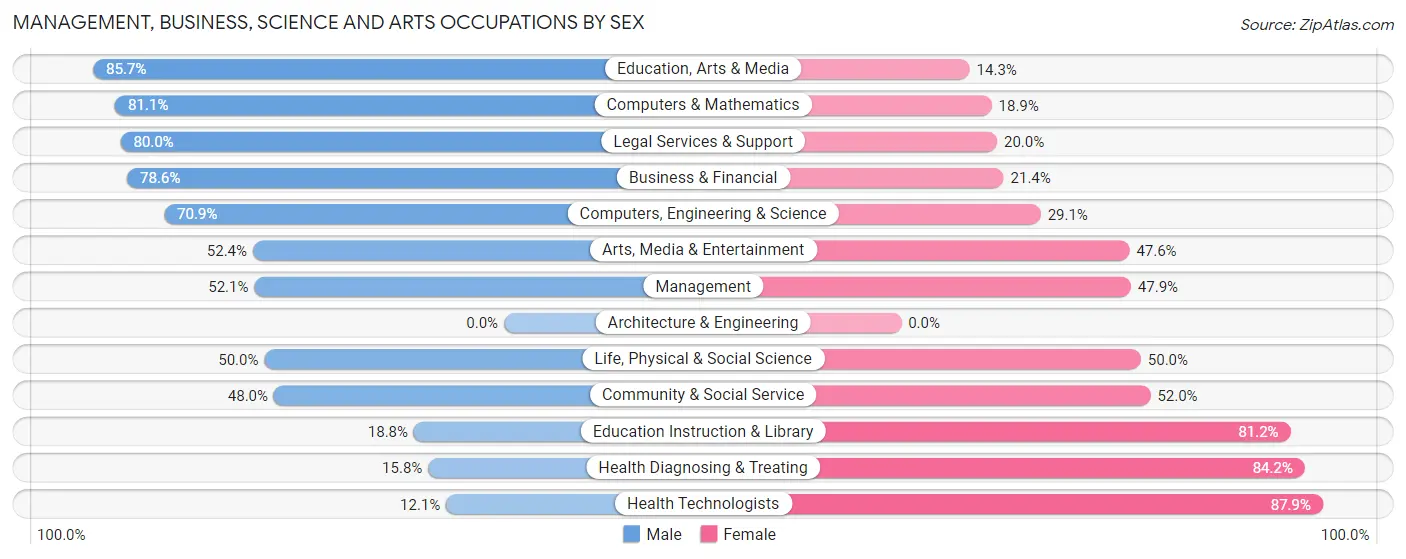
Management, Business, Science and Arts Occupations by Sex
Within the Management, Business, Science and Arts occupations in Orchard Park, the most male-oriented occupations are Education, Arts & Media (85.7%), Computers & Mathematics (81.1%), and Legal Services & Support (80.0%), while the most female-oriented occupations are Health Technologists (87.9%), Health Diagnosing & Treating (84.2%), and Education Instruction & Library (81.2%).
| Occupation | Male | Female |
| Management | 125 (52.1%) | 115 (47.9%) |
| Business & Financial | 103 (78.6%) | 28 (21.4%) |
| Computers, Engineering & Science | 56 (70.9%) | 23 (29.1%) |
| Computers & Mathematics | 43 (81.1%) | 10 (18.9%) |
| Architecture & Engineering | 0 (0.0%) | 0 (0.0%) |
| Life, Physical & Social Science | 13 (50.0%) | 13 (50.0%) |
| Community & Social Service | 120 (48.0%) | 130 (52.0%) |
| Education, Arts & Media | 48 (85.7%) | 8 (14.3%) |
| Legal Services & Support | 28 (80.0%) | 7 (20.0%) |
| Education Instruction & Library | 22 (18.8%) | 95 (81.2%) |
| Arts, Media & Entertainment | 22 (52.4%) | 20 (47.6%) |
| Health Diagnosing & Treating | 25 (15.8%) | 133 (84.2%) |
| Health Technologists | 17 (12.1%) | 124 (87.9%) |
| Total (Category) | 429 (50.0%) | 429 (50.0%) |
| Total (Overall) | 926 (53.4%) | 809 (46.6%) |
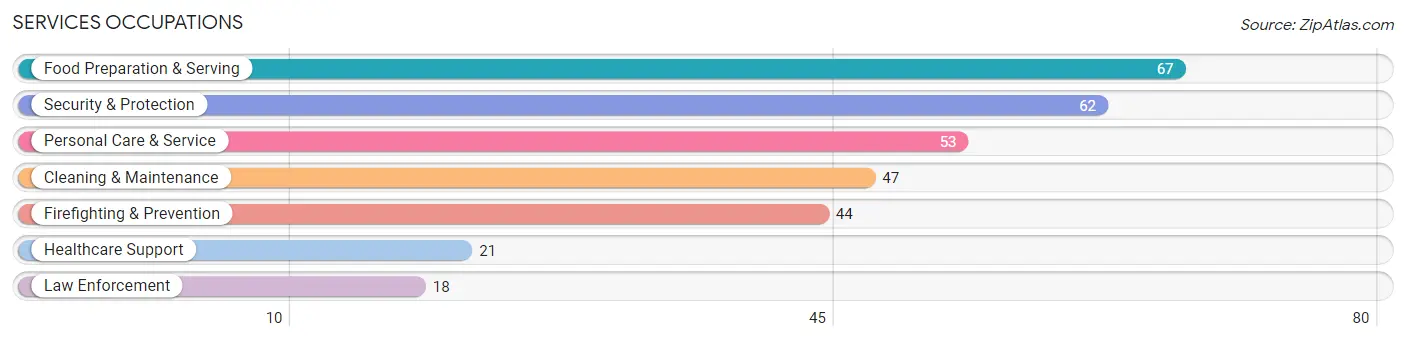
Services Occupations
The most common Services occupations in Orchard Park are Food Preparation & Serving (67 | 3.9%), Security & Protection (62 | 3.6%), Personal Care & Service (53 | 3.0%), Cleaning & Maintenance (47 | 2.7%), and Firefighting & Prevention (44 | 2.5%).
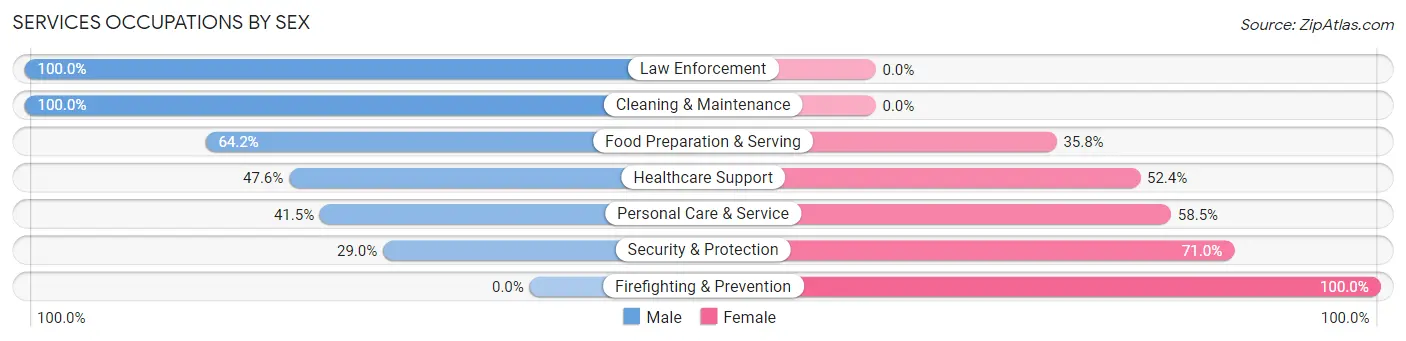
Services Occupations by Sex
Within the Services occupations in Orchard Park, the most male-oriented occupations are Law Enforcement (100.0%), Cleaning & Maintenance (100.0%), and Food Preparation & Serving (64.2%), while the most female-oriented occupations are Firefighting & Prevention (100.0%), Security & Protection (71.0%), and Personal Care & Service (58.5%).
| Occupation | Male | Female |
| Healthcare Support | 10 (47.6%) | 11 (52.4%) |
| Security & Protection | 18 (29.0%) | 44 (71.0%) |
| Firefighting & Prevention | 0 (0.0%) | 44 (100.0%) |
| Law Enforcement | 18 (100.0%) | 0 (0.0%) |
| Food Preparation & Serving | 43 (64.2%) | 24 (35.8%) |
| Cleaning & Maintenance | 47 (100.0%) | 0 (0.0%) |
| Personal Care & Service | 22 (41.5%) | 31 (58.5%) |
| Total (Category) | 140 (56.0%) | 110 (44.0%) |
| Total (Overall) | 926 (53.4%) | 809 (46.6%) |
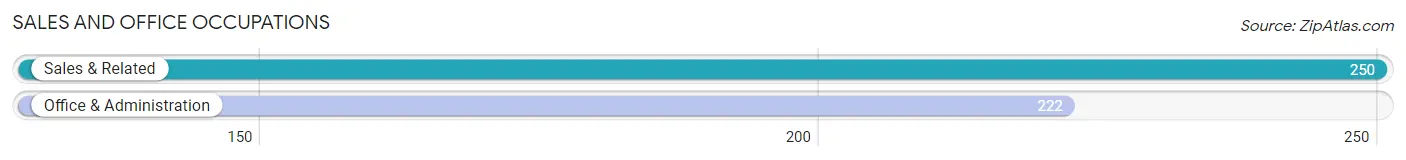
Sales and Office Occupations
The most common Sales and Office occupations in Orchard Park are Sales & Related (250 | 14.4%), and Office & Administration (222 | 12.8%).
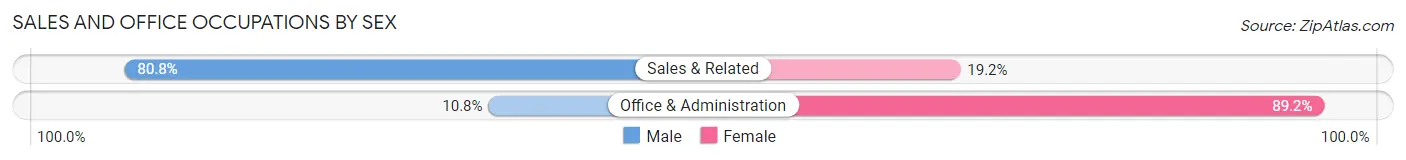
Sales and Office Occupations by Sex
| Occupation | Male | Female |
| Sales & Related | 202 (80.8%) | 48 (19.2%) |
| Office & Administration | 24 (10.8%) | 198 (89.2%) |
| Total (Category) | 226 (47.9%) | 246 (52.1%) |
| Total (Overall) | 926 (53.4%) | 809 (46.6%) |
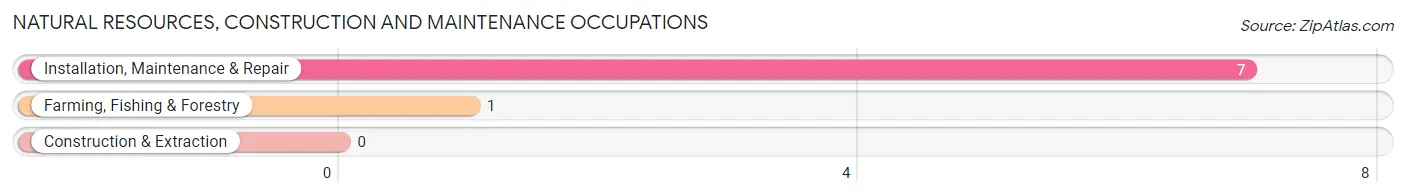
Natural Resources, Construction and Maintenance Occupations
The most common Natural Resources, Construction and Maintenance occupations in Orchard Park are Installation, Maintenance & Repair (7 | 0.4%), and Farming, Fishing & Forestry (1 | 0.1%).
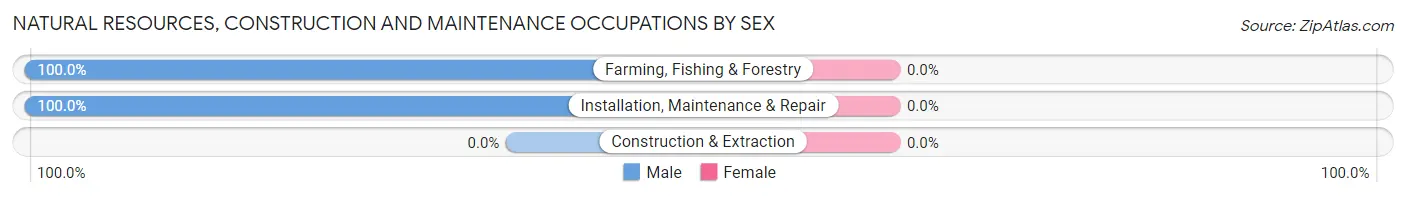
Natural Resources, Construction and Maintenance Occupations by Sex
| Occupation | Male | Female |
| Farming, Fishing & Forestry | 1 (100.0%) | 0 (0.0%) |
| Construction & Extraction | 0 (0.0%) | 0 (0.0%) |
| Installation, Maintenance & Repair | 7 (100.0%) | 0 (0.0%) |
| Total (Category) | 8 (100.0%) | 0 (0.0%) |
| Total (Overall) | 926 (53.4%) | 809 (46.6%) |
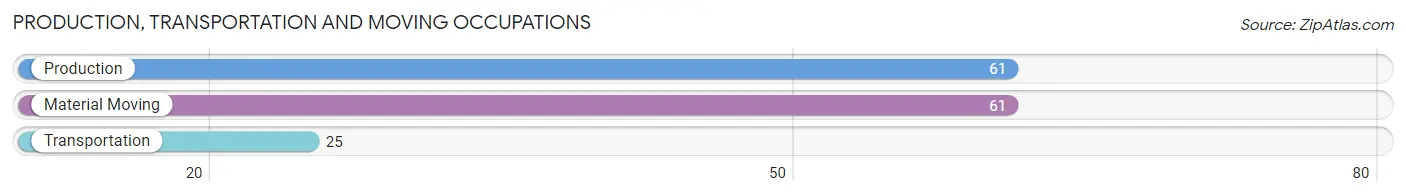
Production, Transportation and Moving Occupations
The most common Production, Transportation and Moving occupations in Orchard Park are Production (61 | 3.5%), Material Moving (61 | 3.5%), and Transportation (25 | 1.4%).
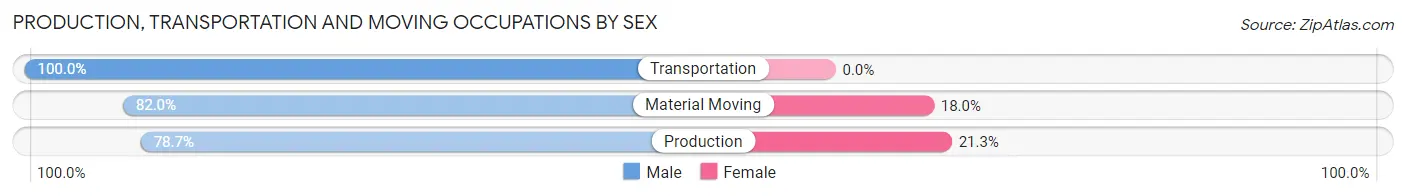
Production, Transportation and Moving Occupations by Sex
| Occupation | Male | Female |
| Production | 48 (78.7%) | 13 (21.3%) |
| Transportation | 25 (100.0%) | 0 (0.0%) |
| Material Moving | 50 (82.0%) | 11 (18.0%) |
| Total (Category) | 123 (83.7%) | 24 (16.3%) |
| Total (Overall) | 926 (53.4%) | 809 (46.6%) |
Employment Industries by Sex in Orchard Park
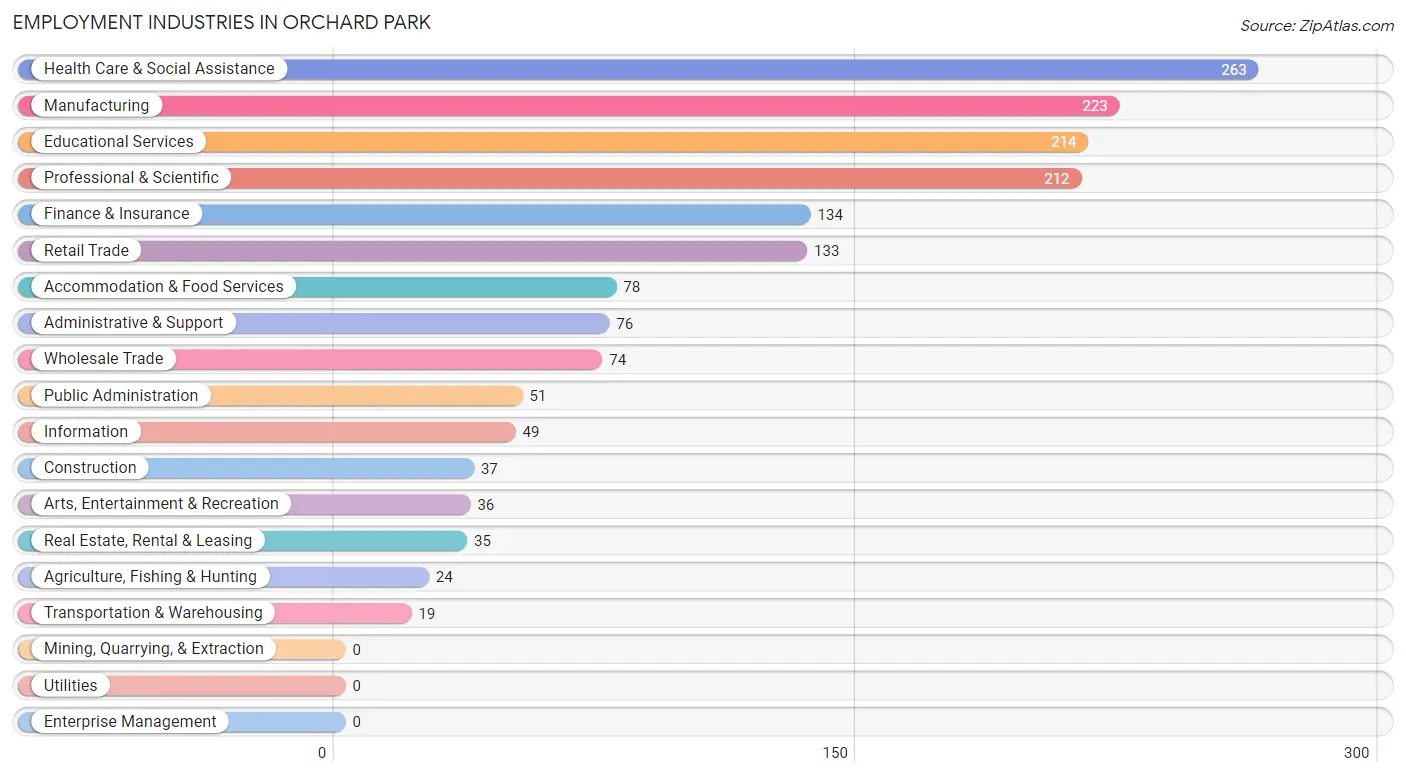
Employment Industries in Orchard Park
The major employment industries in Orchard Park include Health Care & Social Assistance (263 | 15.2%), Manufacturing (223 | 12.9%), Educational Services (214 | 12.3%), Professional & Scientific (212 | 12.2%), and Finance & Insurance (134 | 7.7%).
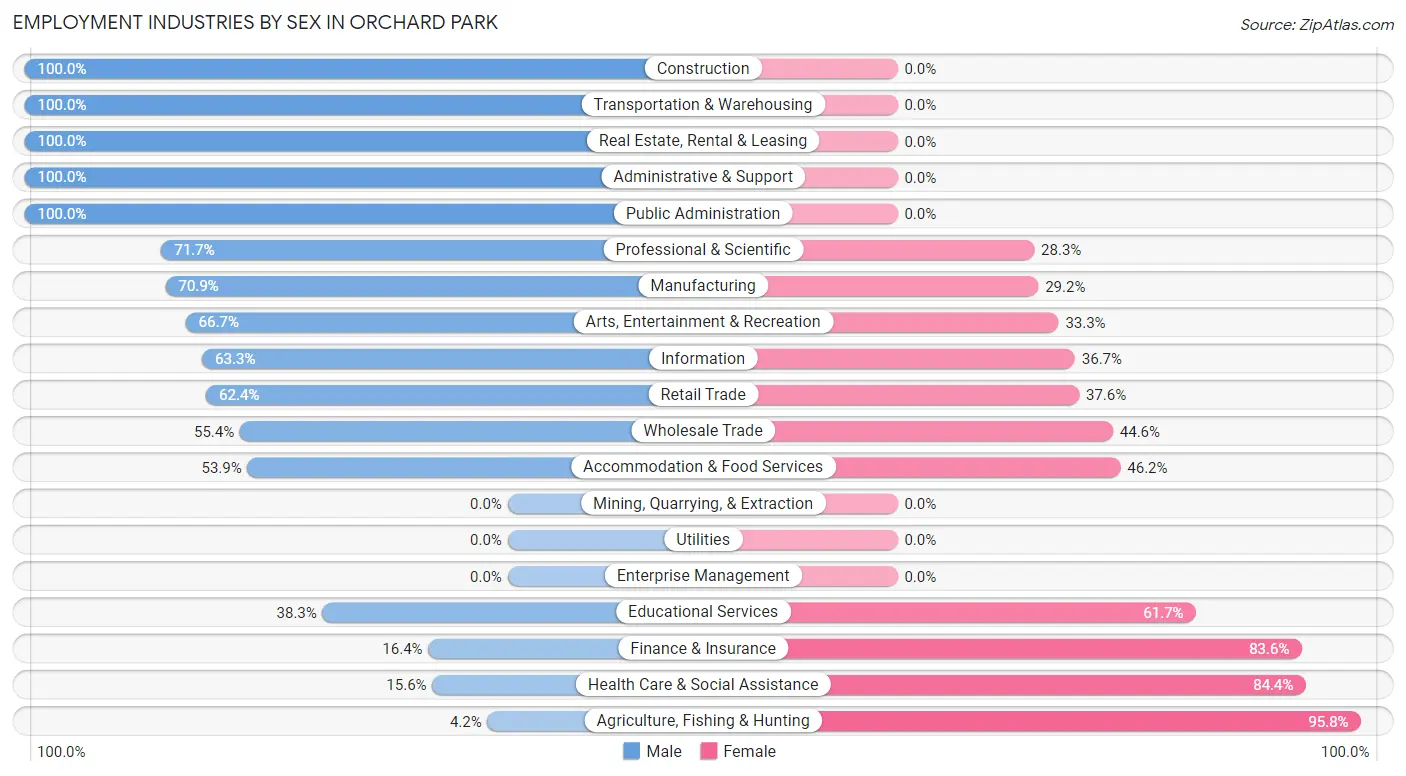
Employment Industries by Sex in Orchard Park
The Orchard Park industries that see more men than women are Construction (100.0%), Transportation & Warehousing (100.0%), and Real Estate, Rental & Leasing (100.0%), whereas the industries that tend to have a higher number of women are Agriculture, Fishing & Hunting (95.8%), Health Care & Social Assistance (84.4%), and Finance & Insurance (83.6%).
| Industry | Male | Female |
| Agriculture, Fishing & Hunting | 1 (4.2%) | 23 (95.8%) |
| Mining, Quarrying, & Extraction | 0 (0.0%) | 0 (0.0%) |
| Construction | 37 (100.0%) | 0 (0.0%) |
| Manufacturing | 158 (70.9%) | 65 (29.1%) |
| Wholesale Trade | 41 (55.4%) | 33 (44.6%) |
| Retail Trade | 83 (62.4%) | 50 (37.6%) |
| Transportation & Warehousing | 19 (100.0%) | 0 (0.0%) |
| Utilities | 0 (0.0%) | 0 (0.0%) |
| Information | 31 (63.3%) | 18 (36.7%) |
| Finance & Insurance | 22 (16.4%) | 112 (83.6%) |
| Real Estate, Rental & Leasing | 35 (100.0%) | 0 (0.0%) |
| Professional & Scientific | 152 (71.7%) | 60 (28.3%) |
| Enterprise Management | 0 (0.0%) | 0 (0.0%) |
| Administrative & Support | 76 (100.0%) | 0 (0.0%) |
| Educational Services | 82 (38.3%) | 132 (61.7%) |
| Health Care & Social Assistance | 41 (15.6%) | 222 (84.4%) |
| Arts, Entertainment & Recreation | 24 (66.7%) | 12 (33.3%) |
| Accommodation & Food Services | 42 (53.8%) | 36 (46.2%) |
| Public Administration | 51 (100.0%) | 0 (0.0%) |
| Total | 926 (53.4%) | 809 (46.6%) |
Education in Orchard Park
School Enrollment in Orchard Park
The most common levels of schooling among the 579 students in Orchard Park are middle school (184 | 31.8%), high school (136 | 23.5%), and elementary school (98 | 16.9%).
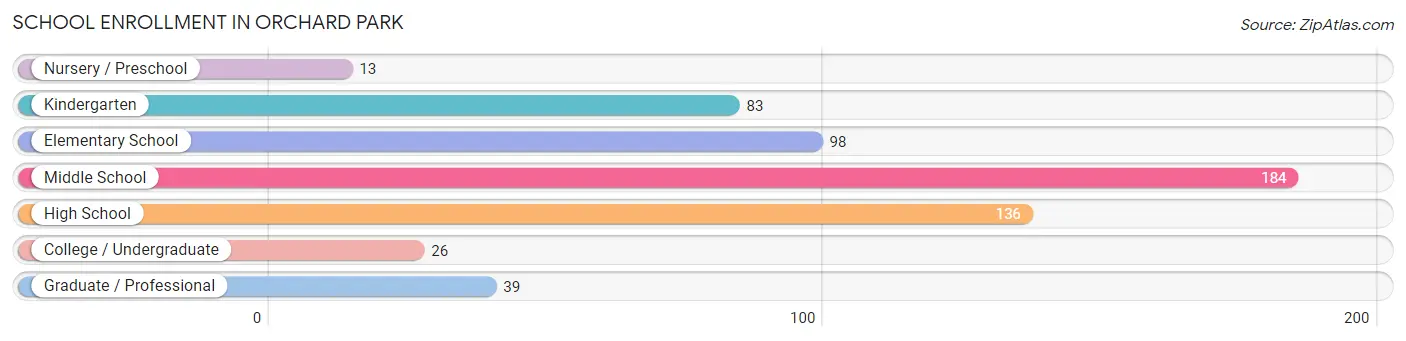
| School Level | # Students | % Students |
| Nursery / Preschool | 13 | 2.2% |
| Kindergarten | 83 | 14.3% |
| Elementary School | 98 | 16.9% |
| Middle School | 184 | 31.8% |
| High School | 136 | 23.5% |
| College / Undergraduate | 26 | 4.5% |
| Graduate / Professional | 39 | 6.7% |
| Total | 579 | 100.0% |
School Enrollment by Age by Funding Source in Orchard Park
Out of a total of 579 students who are enrolled in schools in Orchard Park, 71 (12.3%) attend a private institution, while the remaining 508 (87.7%) are enrolled in public schools. The age group of 18 to 19 year olds has the highest likelihood of being enrolled in private schools, with 13 (100.0% in the age bracket) enrolled. Conversely, the age group of 3 to 4 year olds has the lowest likelihood of being enrolled in a private school, with 20 (100.0% in the age bracket) attending a public institution.
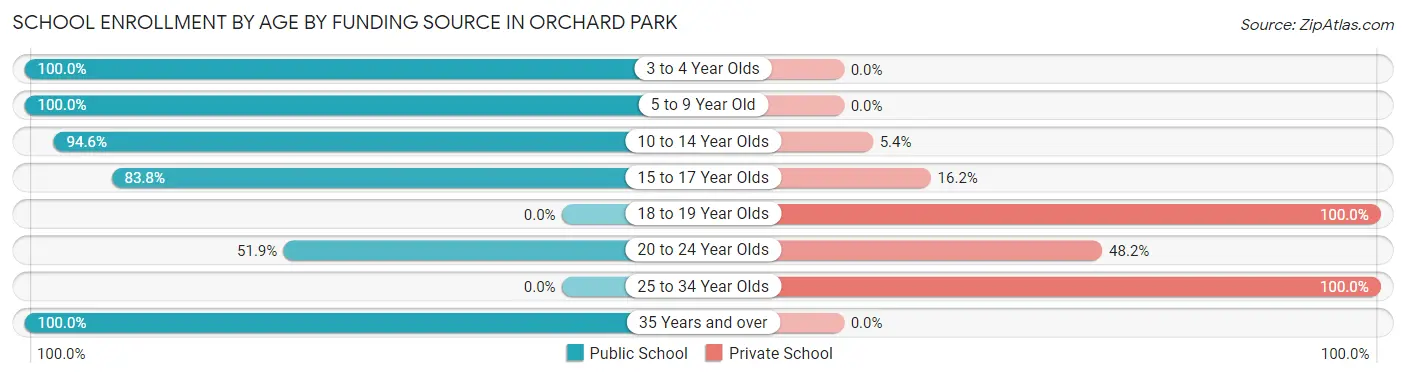
| Age Bracket | Public School | Private School |
| 3 to 4 Year Olds | 20 (100.0%) | 0 (0.0%) |
| 5 to 9 Year Old | 167 (100.0%) | 0 (0.0%) |
| 10 to 14 Year Olds | 175 (94.6%) | 10 (5.4%) |
| 15 to 17 Year Olds | 119 (83.8%) | 23 (16.2%) |
| 18 to 19 Year Olds | 0 (0.0%) | 13 (100.0%) |
| 20 to 24 Year Olds | 14 (51.8%) | 13 (48.1%) |
| 25 to 34 Year Olds | 0 (0.0%) | 12 (100.0%) |
| 35 Years and over | 13 (100.0%) | 0 (0.0%) |
| Total | 508 (87.7%) | 71 (12.3%) |
Educational Attainment by Field of Study in Orchard Park
Business (323 | 20.7%), social sciences (244 | 15.6%), science & technology (213 | 13.6%), bio, nature & agricultural (169 | 10.8%), and education (159 | 10.2%) are the most common fields of study among 1,563 individuals in Orchard Park who have obtained a bachelor's degree or higher.
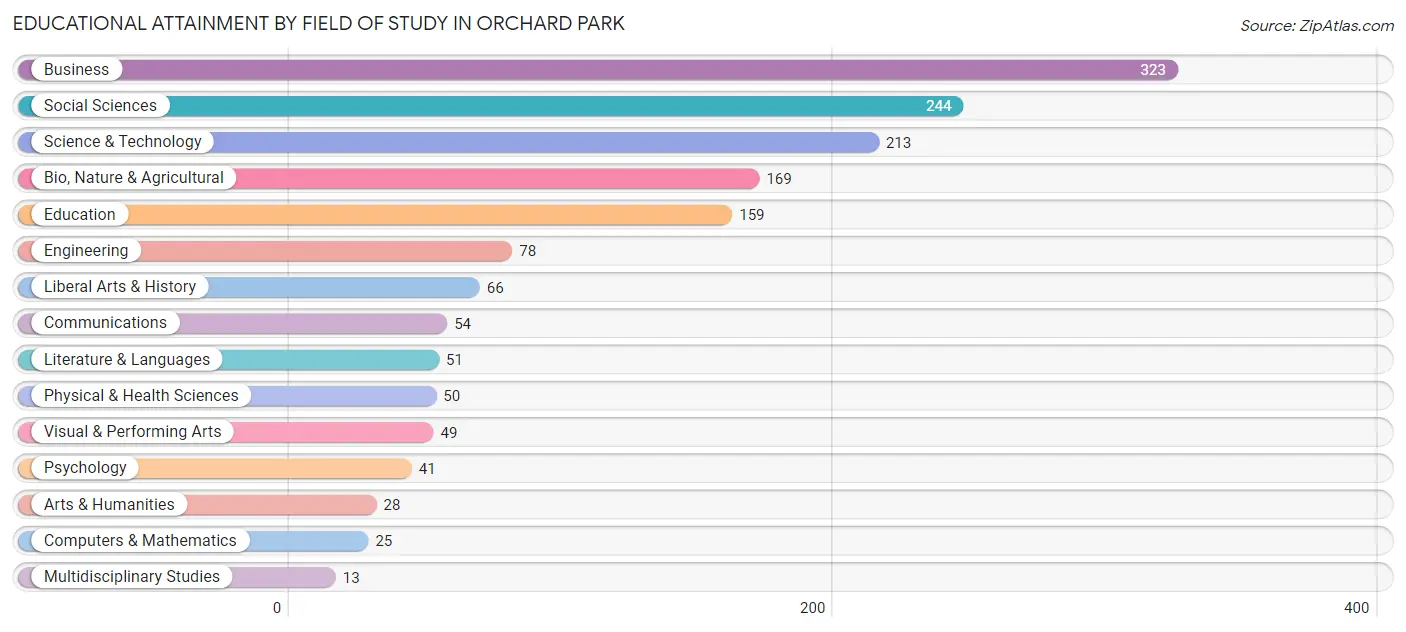
| Field of Study | # Graduates | % Graduates |
| Computers & Mathematics | 25 | 1.6% |
| Bio, Nature & Agricultural | 169 | 10.8% |
| Physical & Health Sciences | 50 | 3.2% |
| Psychology | 41 | 2.6% |
| Social Sciences | 244 | 15.6% |
| Engineering | 78 | 5.0% |
| Multidisciplinary Studies | 13 | 0.8% |
| Science & Technology | 213 | 13.6% |
| Business | 323 | 20.7% |
| Education | 159 | 10.2% |
| Literature & Languages | 51 | 3.3% |
| Liberal Arts & History | 66 | 4.2% |
| Visual & Performing Arts | 49 | 3.1% |
| Communications | 54 | 3.5% |
| Arts & Humanities | 28 | 1.8% |
| Total | 1,563 | 100.0% |
Transportation & Commute in Orchard Park
Vehicle Availability by Sex in Orchard Park
The most prevalent vehicle ownership categories in Orchard Park are males with 2 vehicles (443, accounting for 47.9%) and females with 2 vehicles (415, making up 57.2%).
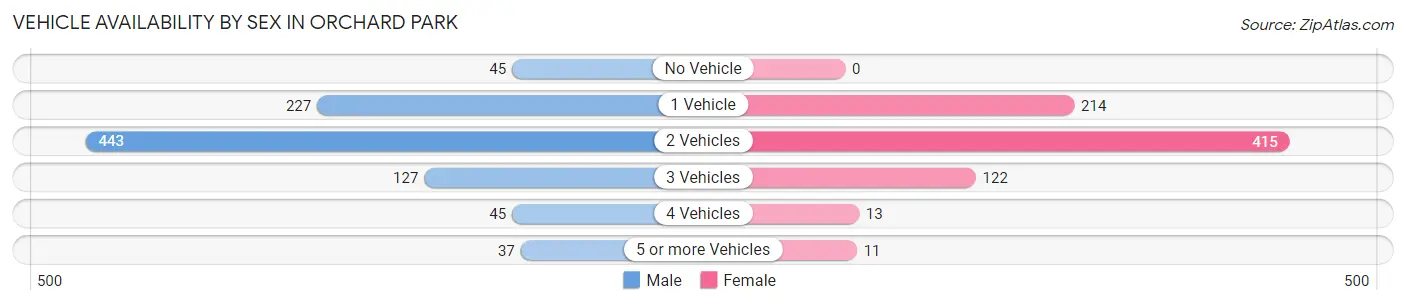
| Vehicles Available | Male | Female |
| No Vehicle | 45 (4.9%) | 0 (0.0%) |
| 1 Vehicle | 227 (24.6%) | 214 (27.6%) |
| 2 Vehicles | 443 (47.9%) | 415 (53.5%) |
| 3 Vehicles | 127 (13.7%) | 122 (15.7%) |
| 4 Vehicles | 45 (4.9%) | 13 (1.7%) |
| 5 or more Vehicles | 37 (4.0%) | 11 (1.4%) |
| Total | 924 (100.0%) | 775 (100.0%) |
Commute Time in Orchard Park
The most frequently occuring commute durations in Orchard Park are 5 to 9 minutes (267 commuters, 18.1%), 10 to 14 minutes (266 commuters, 18.0%), and 15 to 19 minutes (206 commuters, 14.0%).
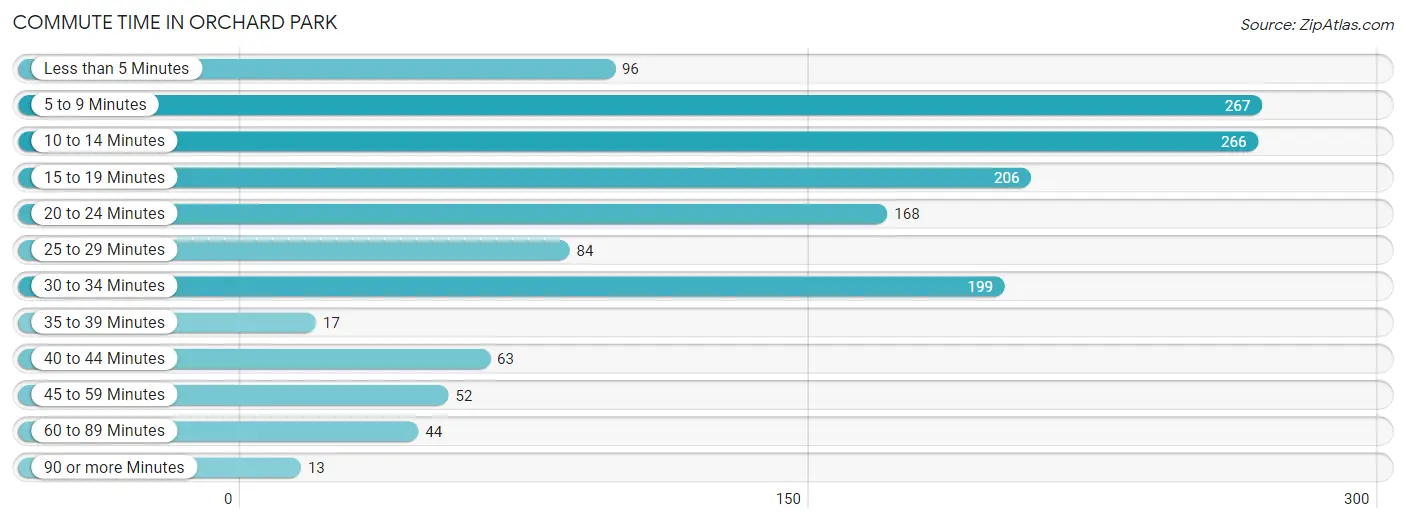
| Commute Time | # Commuters | % Commuters |
| Less than 5 Minutes | 96 | 6.5% |
| 5 to 9 Minutes | 267 | 18.1% |
| 10 to 14 Minutes | 266 | 18.0% |
| 15 to 19 Minutes | 206 | 14.0% |
| 20 to 24 Minutes | 168 | 11.4% |
| 25 to 29 Minutes | 84 | 5.7% |
| 30 to 34 Minutes | 199 | 13.5% |
| 35 to 39 Minutes | 17 | 1.1% |
| 40 to 44 Minutes | 63 | 4.3% |
| 45 to 59 Minutes | 52 | 3.5% |
| 60 to 89 Minutes | 44 | 3.0% |
| 90 or more Minutes | 13 | 0.9% |
Commute Time by Sex in Orchard Park
The most common commute times in Orchard Park are 5 to 9 minutes (187 commuters, 22.2%) for males and 10 to 14 minutes (147 commuters, 23.2%) for females.
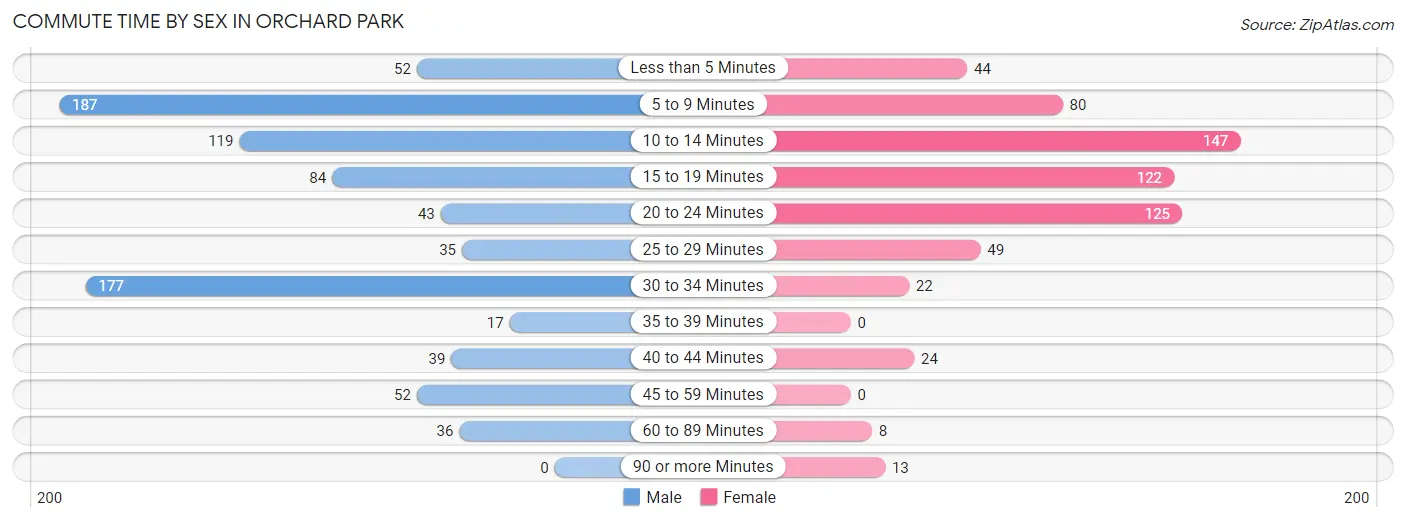
| Commute Time | Male | Female |
| Less than 5 Minutes | 52 (6.2%) | 44 (6.9%) |
| 5 to 9 Minutes | 187 (22.2%) | 80 (12.6%) |
| 10 to 14 Minutes | 119 (14.1%) | 147 (23.2%) |
| 15 to 19 Minutes | 84 (10.0%) | 122 (19.2%) |
| 20 to 24 Minutes | 43 (5.1%) | 125 (19.7%) |
| 25 to 29 Minutes | 35 (4.2%) | 49 (7.7%) |
| 30 to 34 Minutes | 177 (21.0%) | 22 (3.5%) |
| 35 to 39 Minutes | 17 (2.0%) | 0 (0.0%) |
| 40 to 44 Minutes | 39 (4.6%) | 24 (3.8%) |
| 45 to 59 Minutes | 52 (6.2%) | 0 (0.0%) |
| 60 to 89 Minutes | 36 (4.3%) | 8 (1.3%) |
| 90 or more Minutes | 0 (0.0%) | 13 (2.1%) |
Time of Departure to Work by Sex in Orchard Park
The most frequent times of departure to work in Orchard Park are 7:30 AM to 7:59 AM (197, 23.4%) for males and 6:30 AM to 6:59 AM (106, 16.7%) for females.
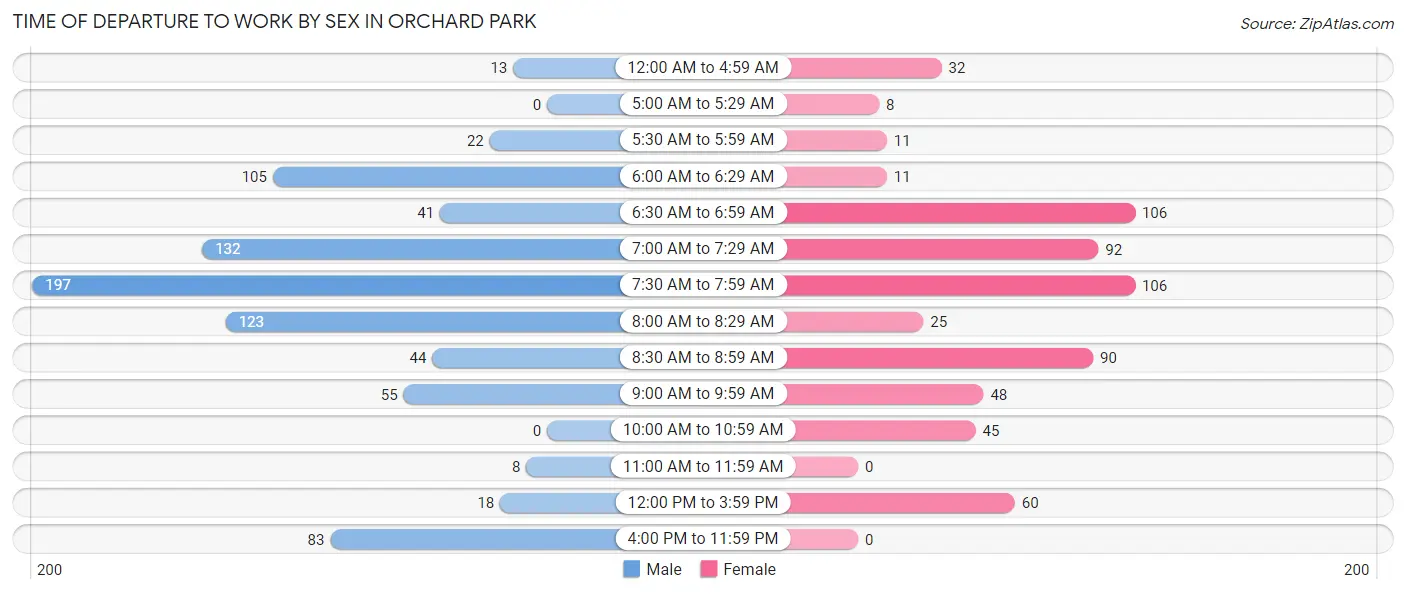
| Time of Departure | Male | Female |
| 12:00 AM to 4:59 AM | 13 (1.5%) | 32 (5.1%) |
| 5:00 AM to 5:29 AM | 0 (0.0%) | 8 (1.3%) |
| 5:30 AM to 5:59 AM | 22 (2.6%) | 11 (1.7%) |
| 6:00 AM to 6:29 AM | 105 (12.5%) | 11 (1.7%) |
| 6:30 AM to 6:59 AM | 41 (4.9%) | 106 (16.7%) |
| 7:00 AM to 7:29 AM | 132 (15.7%) | 92 (14.5%) |
| 7:30 AM to 7:59 AM | 197 (23.4%) | 106 (16.7%) |
| 8:00 AM to 8:29 AM | 123 (14.6%) | 25 (3.9%) |
| 8:30 AM to 8:59 AM | 44 (5.2%) | 90 (14.2%) |
| 9:00 AM to 9:59 AM | 55 (6.5%) | 48 (7.6%) |
| 10:00 AM to 10:59 AM | 0 (0.0%) | 45 (7.1%) |
| 11:00 AM to 11:59 AM | 8 (0.9%) | 0 (0.0%) |
| 12:00 PM to 3:59 PM | 18 (2.1%) | 60 (9.5%) |
| 4:00 PM to 11:59 PM | 83 (9.9%) | 0 (0.0%) |
| Total | 841 (100.0%) | 634 (100.0%) |
Housing Occupancy in Orchard Park
Occupancy by Ownership in Orchard Park
Of the total 1,479 dwellings in Orchard Park, owner-occupied units account for 837 (56.6%), while renter-occupied units make up 642 (43.4%).
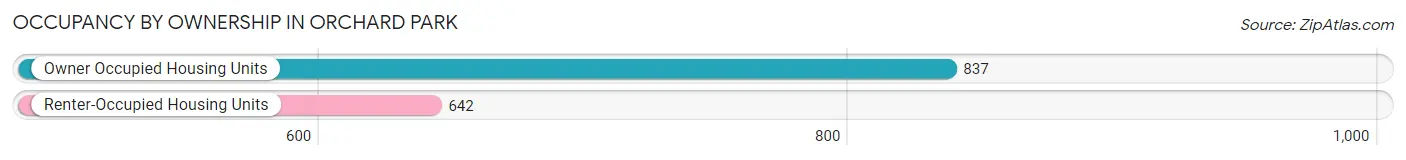
| Occupancy | # Housing Units | % Housing Units |
| Owner Occupied Housing Units | 837 | 56.6% |
| Renter-Occupied Housing Units | 642 | 43.4% |
| Total Occupied Housing Units | 1,479 | 100.0% |
Occupancy by Household Size in Orchard Park
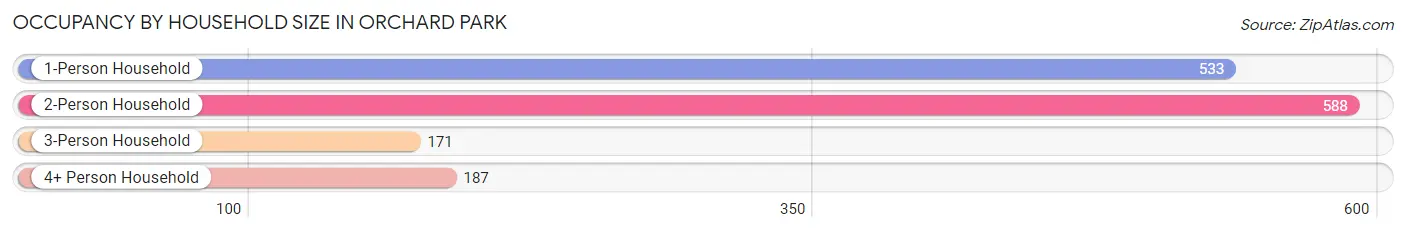
| Household Size | # Housing Units | % Housing Units |
| 1-Person Household | 533 | 36.0% |
| 2-Person Household | 588 | 39.8% |
| 3-Person Household | 171 | 11.6% |
| 4+ Person Household | 187 | 12.6% |
| Total Housing Units | 1,479 | 100.0% |
Occupancy by Ownership by Household Size in Orchard Park
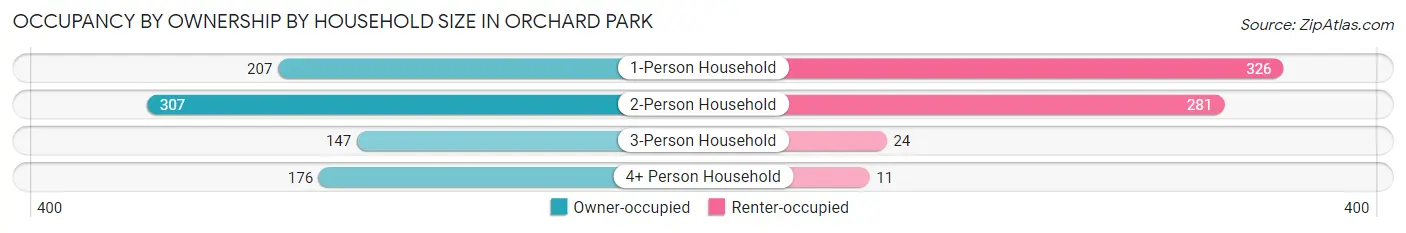
| Household Size | Owner-occupied | Renter-occupied |
| 1-Person Household | 207 (38.8%) | 326 (61.2%) |
| 2-Person Household | 307 (52.2%) | 281 (47.8%) |
| 3-Person Household | 147 (86.0%) | 24 (14.0%) |
| 4+ Person Household | 176 (94.1%) | 11 (5.9%) |
| Total Housing Units | 837 (56.6%) | 642 (43.4%) |
Occupancy by Educational Attainment in Orchard Park
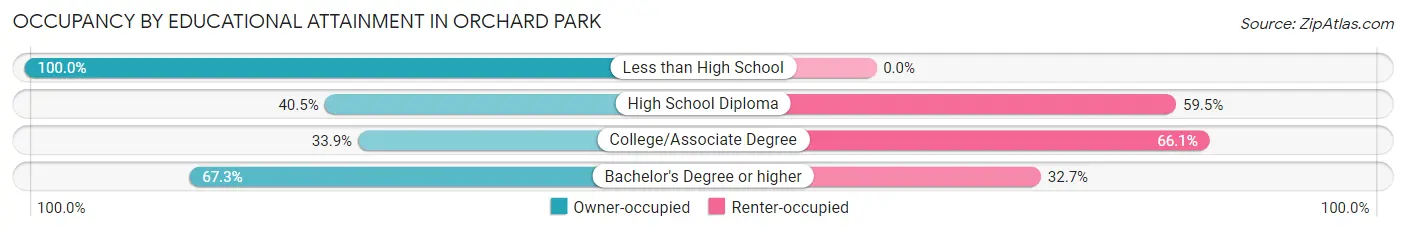
| Household Size | Owner-occupied | Renter-occupied |
| Less than High School | 12 (100.0%) | 0 (0.0%) |
| High School Diploma | 75 (40.5%) | 110 (59.5%) |
| College/Associate Degree | 115 (33.9%) | 224 (66.1%) |
| Bachelor's Degree or higher | 635 (67.3%) | 308 (32.7%) |
Occupancy by Age of Householder in Orchard Park
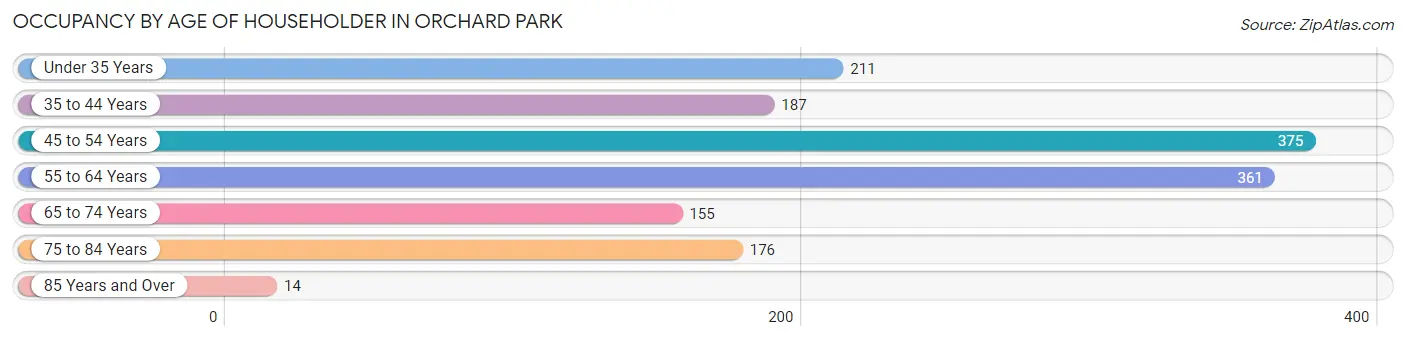
| Age Bracket | # Households | % Households |
| Under 35 Years | 211 | 14.3% |
| 35 to 44 Years | 187 | 12.6% |
| 45 to 54 Years | 375 | 25.4% |
| 55 to 64 Years | 361 | 24.4% |
| 65 to 74 Years | 155 | 10.5% |
| 75 to 84 Years | 176 | 11.9% |
| 85 Years and Over | 14 | 0.9% |
| Total | 1,479 | 100.0% |
Housing Finances in Orchard Park
Median Income by Occupancy in Orchard Park
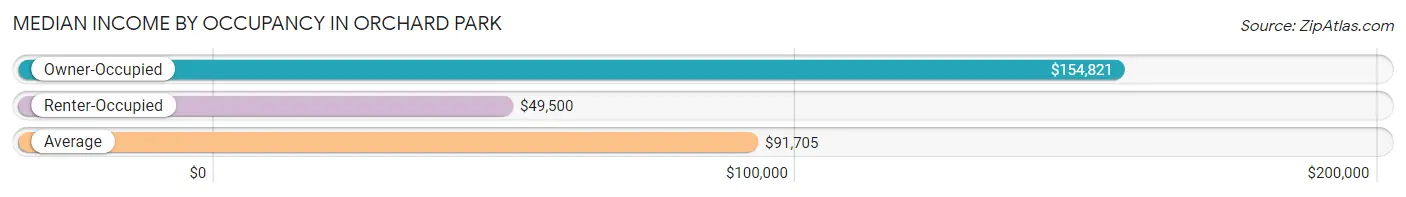
| Occupancy Type | # Households | Median Income |
| Owner-Occupied | 837 (56.6%) | $154,821 |
| Renter-Occupied | 642 (43.4%) | $49,500 |
| Average | 1,479 (100.0%) | $91,705 |
Occupancy by Householder Income Bracket in Orchard Park
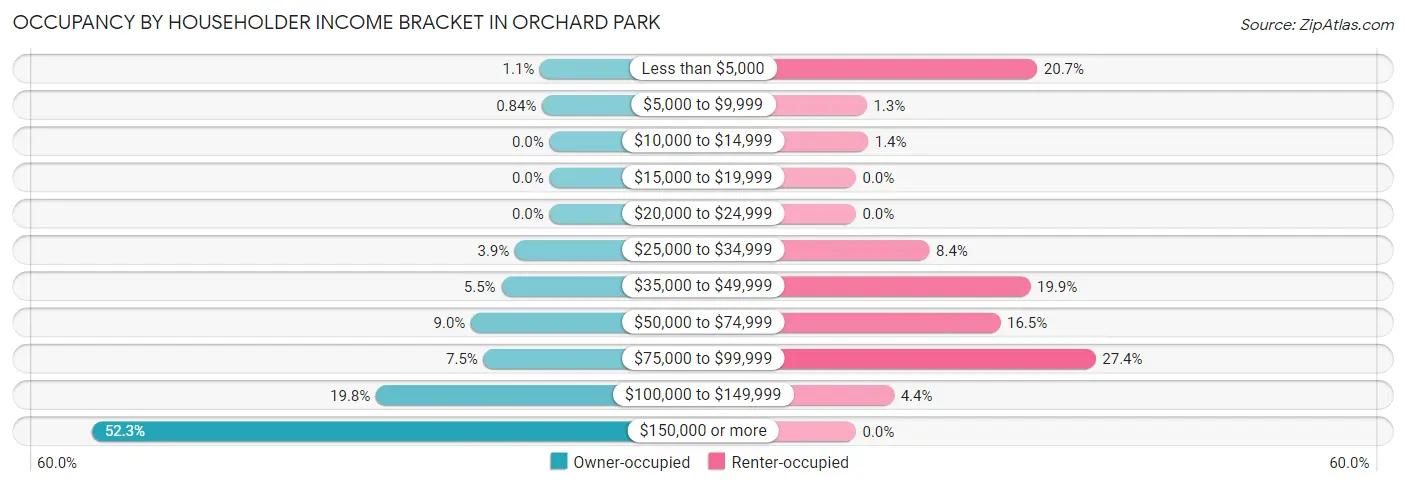
| Income Bracket | Owner-occupied | Renter-occupied |
| Less than $5,000 | 9 (1.1%) | 133 (20.7%) |
| $5,000 to $9,999 | 7 (0.8%) | 8 (1.3%) |
| $10,000 to $14,999 | 0 (0.0%) | 9 (1.4%) |
| $15,000 to $19,999 | 0 (0.0%) | 0 (0.0%) |
| $20,000 to $24,999 | 0 (0.0%) | 0 (0.0%) |
| $25,000 to $34,999 | 33 (3.9%) | 54 (8.4%) |
| $35,000 to $49,999 | 46 (5.5%) | 128 (19.9%) |
| $50,000 to $74,999 | 75 (9.0%) | 106 (16.5%) |
| $75,000 to $99,999 | 63 (7.5%) | 176 (27.4%) |
| $100,000 to $149,999 | 166 (19.8%) | 28 (4.4%) |
| $150,000 or more | 438 (52.3%) | 0 (0.0%) |
| Total | 837 (100.0%) | 642 (100.0%) |
Monthly Housing Cost Tiers in Orchard Park
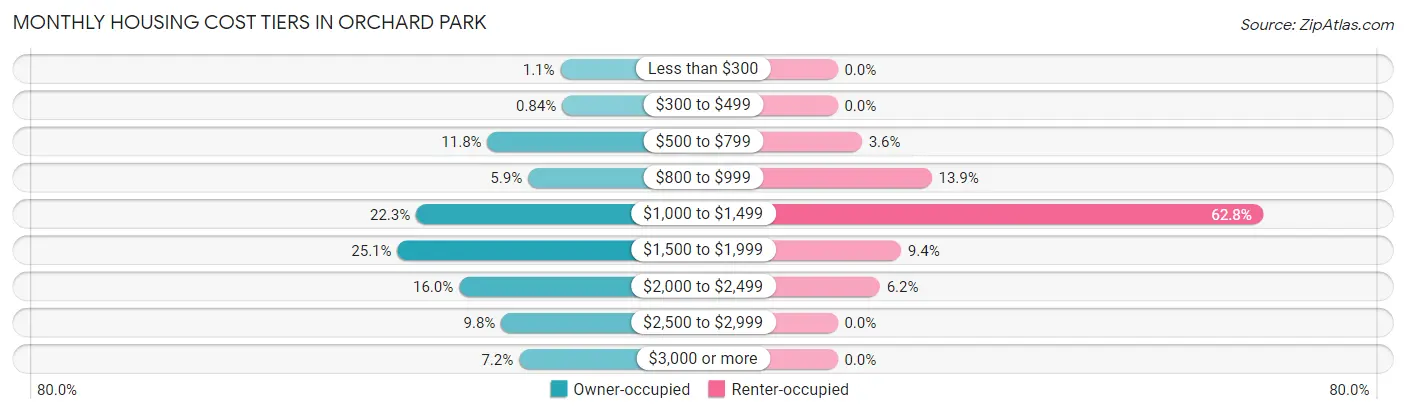
| Monthly Cost | Owner-occupied | Renter-occupied |
| Less than $300 | 9 (1.1%) | 0 (0.0%) |
| $300 to $499 | 7 (0.8%) | 0 (0.0%) |
| $500 to $799 | 99 (11.8%) | 23 (3.6%) |
| $800 to $999 | 49 (5.9%) | 89 (13.9%) |
| $1,000 to $1,499 | 187 (22.3%) | 403 (62.8%) |
| $1,500 to $1,999 | 210 (25.1%) | 60 (9.3%) |
| $2,000 to $2,499 | 134 (16.0%) | 40 (6.2%) |
| $2,500 to $2,999 | 82 (9.8%) | 0 (0.0%) |
| $3,000 or more | 60 (7.2%) | 0 (0.0%) |
| Total | 837 (100.0%) | 642 (100.0%) |
Physical Housing Characteristics in Orchard Park
Housing Structures in Orchard Park
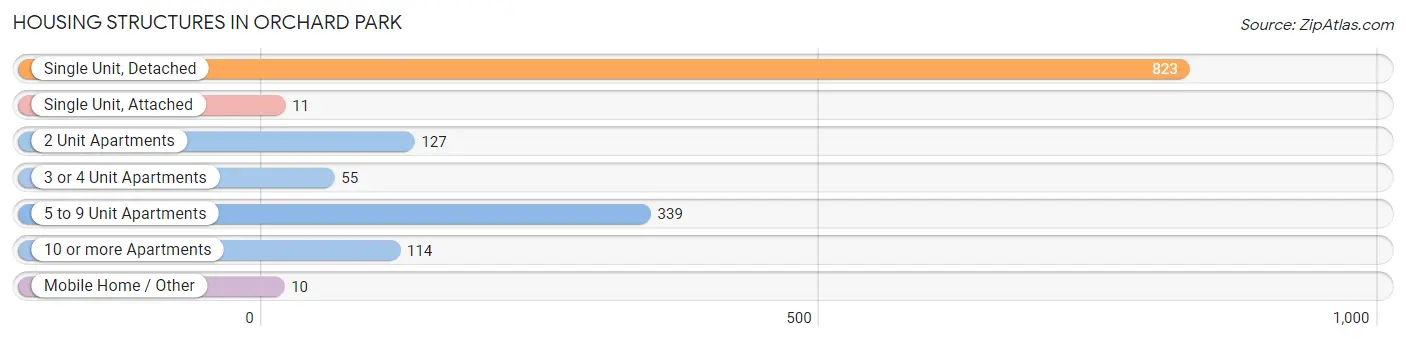
| Structure Type | # Housing Units | % Housing Units |
| Single Unit, Detached | 823 | 55.6% |
| Single Unit, Attached | 11 | 0.7% |
| 2 Unit Apartments | 127 | 8.6% |
| 3 or 4 Unit Apartments | 55 | 3.7% |
| 5 to 9 Unit Apartments | 339 | 22.9% |
| 10 or more Apartments | 114 | 7.7% |
| Mobile Home / Other | 10 | 0.7% |
| Total | 1,479 | 100.0% |
Housing Structures by Occupancy in Orchard Park
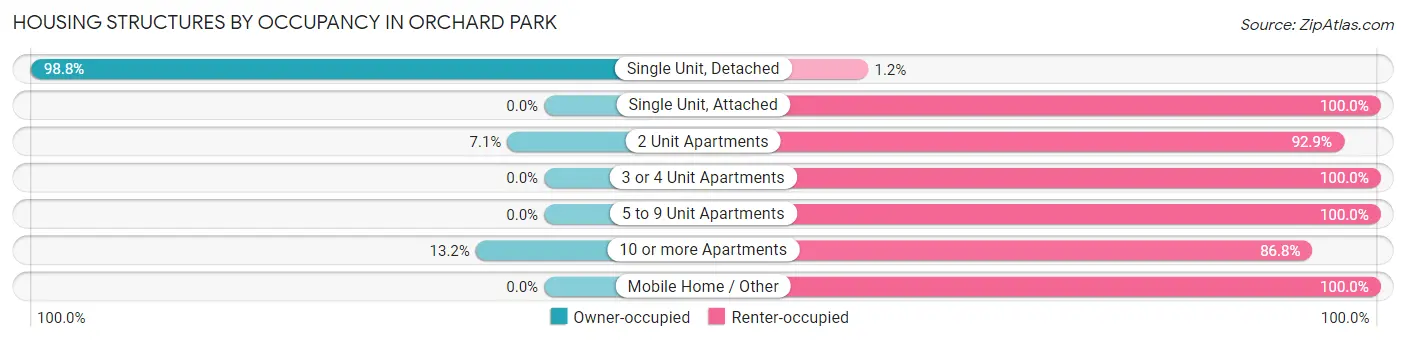
| Structure Type | Owner-occupied | Renter-occupied |
| Single Unit, Detached | 813 (98.8%) | 10 (1.2%) |
| Single Unit, Attached | 0 (0.0%) | 11 (100.0%) |
| 2 Unit Apartments | 9 (7.1%) | 118 (92.9%) |
| 3 or 4 Unit Apartments | 0 (0.0%) | 55 (100.0%) |
| 5 to 9 Unit Apartments | 0 (0.0%) | 339 (100.0%) |
| 10 or more Apartments | 15 (13.2%) | 99 (86.8%) |
| Mobile Home / Other | 0 (0.0%) | 10 (100.0%) |
| Total | 837 (56.6%) | 642 (43.4%) |
Housing Structures by Number of Rooms in Orchard Park
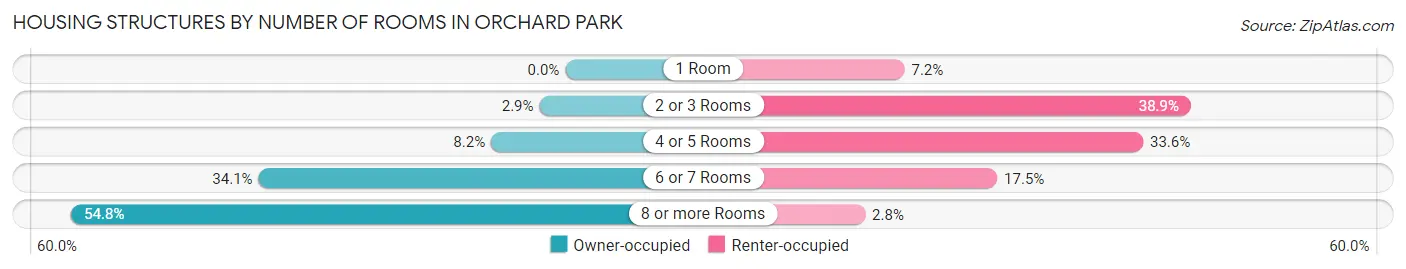
| Number of Rooms | Owner-occupied | Renter-occupied |
| 1 Room | 0 (0.0%) | 46 (7.2%) |
| 2 or 3 Rooms | 24 (2.9%) | 250 (38.9%) |
| 4 or 5 Rooms | 69 (8.2%) | 216 (33.6%) |
| 6 or 7 Rooms | 285 (34.1%) | 112 (17.4%) |
| 8 or more Rooms | 459 (54.8%) | 18 (2.8%) |
| Total | 837 (100.0%) | 642 (100.0%) |
Housing Structure by Heating Type in Orchard Park
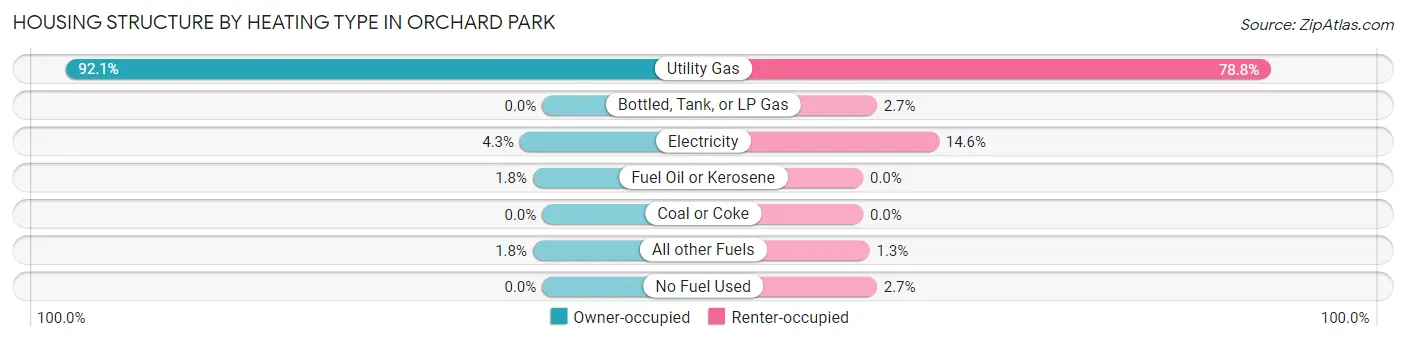
| Heating Type | Owner-occupied | Renter-occupied |
| Utility Gas | 771 (92.1%) | 506 (78.8%) |
| Bottled, Tank, or LP Gas | 0 (0.0%) | 17 (2.6%) |
| Electricity | 36 (4.3%) | 94 (14.6%) |
| Fuel Oil or Kerosene | 15 (1.8%) | 0 (0.0%) |
| Coal or Coke | 0 (0.0%) | 0 (0.0%) |
| All other Fuels | 15 (1.8%) | 8 (1.3%) |
| No Fuel Used | 0 (0.0%) | 17 (2.6%) |
| Total | 837 (100.0%) | 642 (100.0%) |
Household Vehicle Usage in Orchard Park
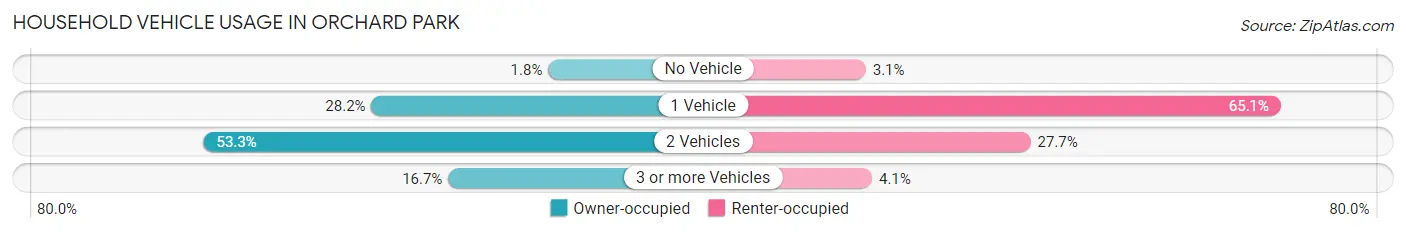
| Vehicles per Household | Owner-occupied | Renter-occupied |
| No Vehicle | 15 (1.8%) | 20 (3.1%) |
| 1 Vehicle | 236 (28.2%) | 418 (65.1%) |
| 2 Vehicles | 446 (53.3%) | 178 (27.7%) |
| 3 or more Vehicles | 140 (16.7%) | 26 (4.1%) |
| Total | 837 (100.0%) | 642 (100.0%) |
Real Estate & Mortgages in Orchard Park
Real Estate and Mortgage Overview in Orchard Park
| Characteristic | Without Mortgage | With Mortgage |
| Housing Units | 240 | 597 |
| Median Property Value | $337,800 | $324,300 |
| Median Household Income | $128,750 | $332 |
| Monthly Housing Costs | $961 | $60 |
| Real Estate Taxes | $7,135 | $0 |
Property Value by Mortgage Status in Orchard Park
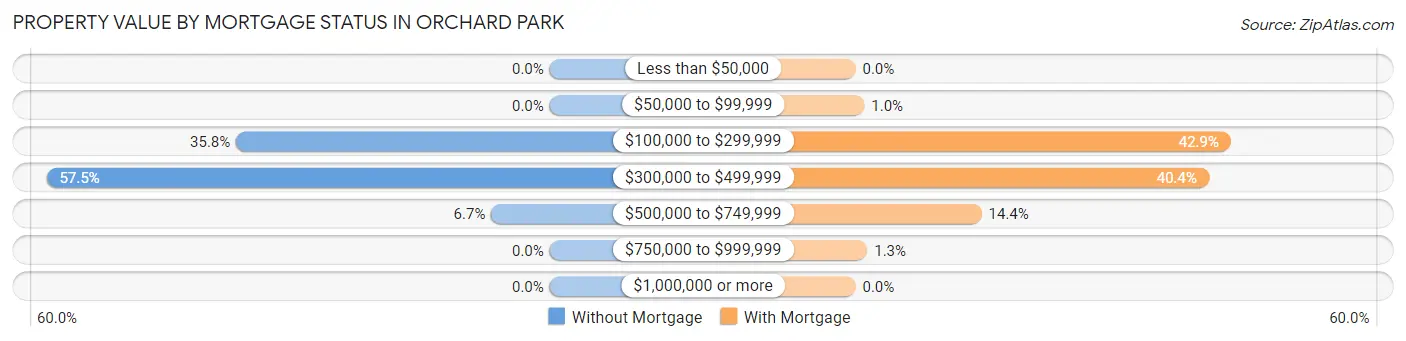
| Property Value | Without Mortgage | With Mortgage |
| Less than $50,000 | 0 (0.0%) | 0 (0.0%) |
| $50,000 to $99,999 | 0 (0.0%) | 6 (1.0%) |
| $100,000 to $299,999 | 86 (35.8%) | 256 (42.9%) |
| $300,000 to $499,999 | 138 (57.5%) | 241 (40.4%) |
| $500,000 to $749,999 | 16 (6.7%) | 86 (14.4%) |
| $750,000 to $999,999 | 0 (0.0%) | 8 (1.3%) |
| $1,000,000 or more | 0 (0.0%) | 0 (0.0%) |
| Total | 240 (100.0%) | 597 (100.0%) |
Household Income by Mortgage Status in Orchard Park
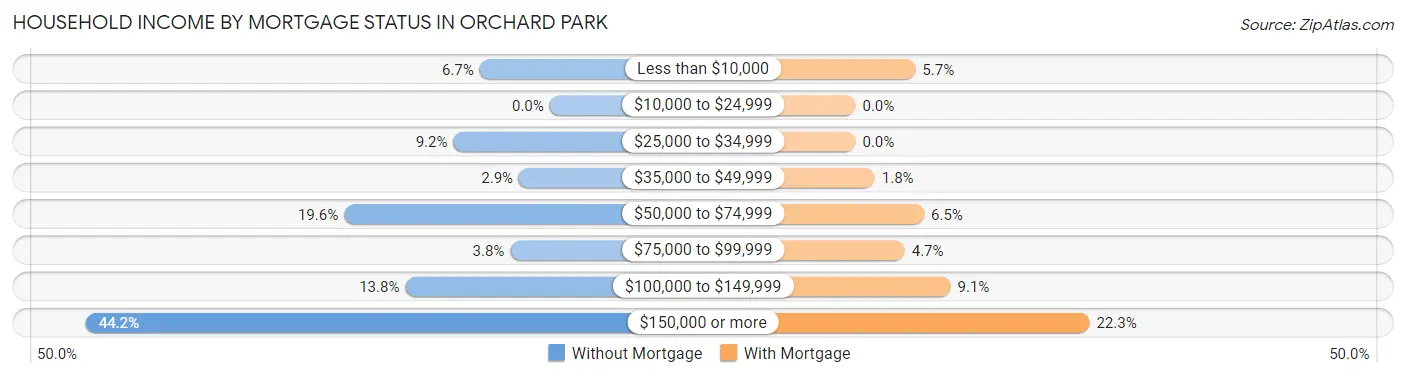
| Household Income | Without Mortgage | With Mortgage |
| Less than $10,000 | 16 (6.7%) | 34 (5.7%) |
| $10,000 to $24,999 | 0 (0.0%) | 0 (0.0%) |
| $25,000 to $34,999 | 22 (9.2%) | 0 (0.0%) |
| $35,000 to $49,999 | 7 (2.9%) | 11 (1.8%) |
| $50,000 to $74,999 | 47 (19.6%) | 39 (6.5%) |
| $75,000 to $99,999 | 9 (3.7%) | 28 (4.7%) |
| $100,000 to $149,999 | 33 (13.8%) | 54 (9.0%) |
| $150,000 or more | 106 (44.2%) | 133 (22.3%) |
| Total | 240 (100.0%) | 597 (100.0%) |
Property Value to Household Income Ratio in Orchard Park
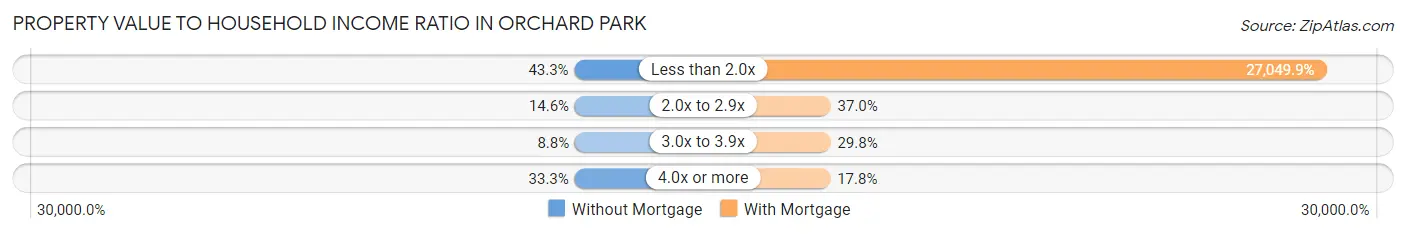
| Value-to-Income Ratio | Without Mortgage | With Mortgage |
| Less than 2.0x | 104 (43.3%) | 161,488 (27,049.9%) |
| 2.0x to 2.9x | 35 (14.6%) | 221 (37.0%) |
| 3.0x to 3.9x | 21 (8.7%) | 178 (29.8%) |
| 4.0x or more | 80 (33.3%) | 106 (17.8%) |
| Total | 240 (100.0%) | 597 (100.0%) |
Real Estate Taxes by Mortgage Status in Orchard Park
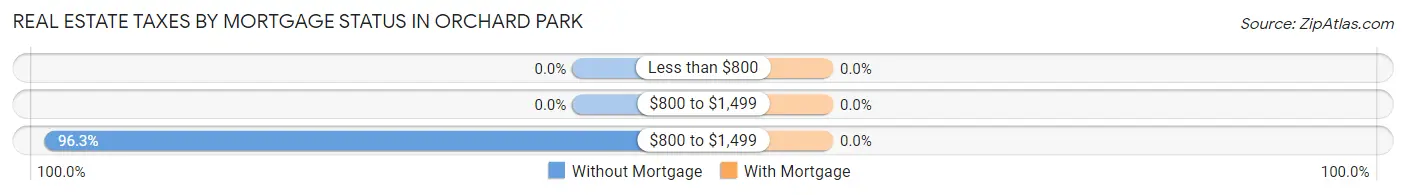
| Property Taxes | Without Mortgage | With Mortgage |
| Less than $800 | 0 (0.0%) | 0 (0.0%) |
| $800 to $1,499 | 0 (0.0%) | 0 (0.0%) |
| $800 to $1,499 | 231 (96.3%) | 0 (0.0%) |
| Total | 240 (100.0%) | 597 (100.0%) |
Health & Disability in Orchard Park
Health Insurance Coverage by Age in Orchard Park
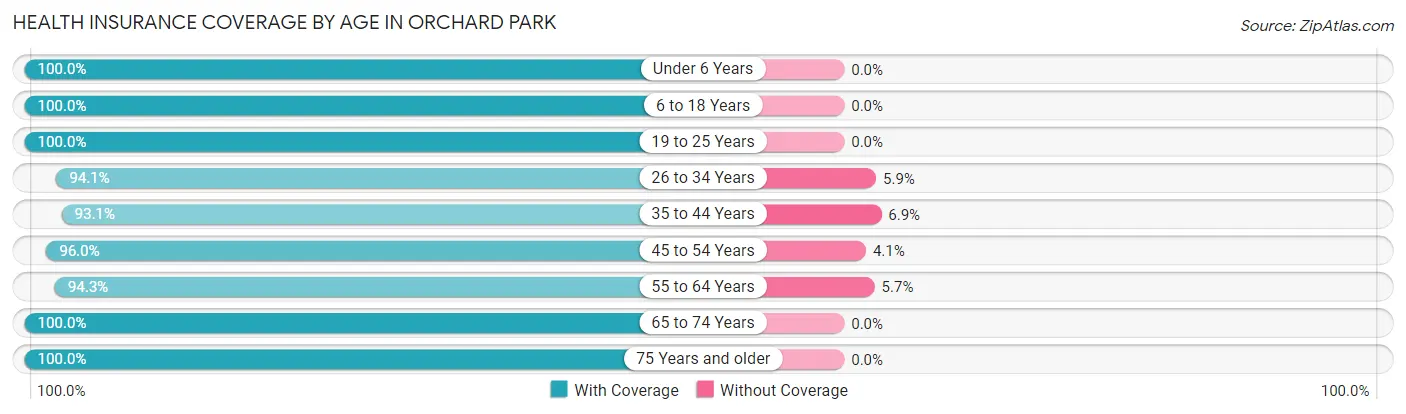
| Age Bracket | With Coverage | Without Coverage |
| Under 6 Years | 175 (100.0%) | 0 (0.0%) |
| 6 to 18 Years | 431 (100.0%) | 0 (0.0%) |
| 19 to 25 Years | 201 (100.0%) | 0 (0.0%) |
| 26 to 34 Years | 365 (94.1%) | 23 (5.9%) |
| 35 to 44 Years | 256 (93.1%) | 19 (6.9%) |
| 45 to 54 Years | 497 (96.0%) | 21 (4.1%) |
| 55 to 64 Years | 500 (94.3%) | 30 (5.7%) |
| 65 to 74 Years | 334 (100.0%) | 0 (0.0%) |
| 75 Years and older | 232 (100.0%) | 0 (0.0%) |
| Total | 2,991 (97.0%) | 93 (3.0%) |
Health Insurance Coverage by Citizenship Status in Orchard Park
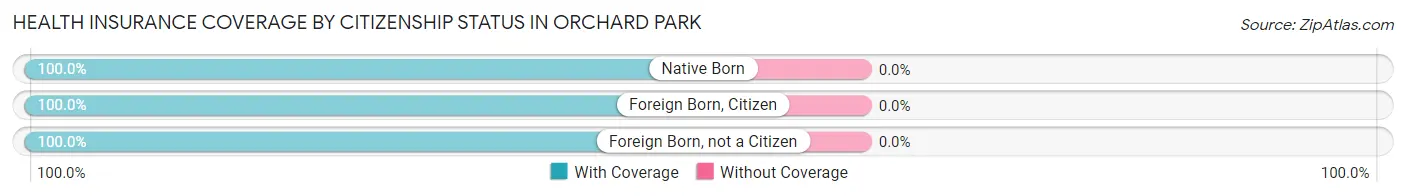
| Citizenship Status | With Coverage | Without Coverage |
| Native Born | 175 (100.0%) | 0 (0.0%) |
| Foreign Born, Citizen | 431 (100.0%) | 0 (0.0%) |
| Foreign Born, not a Citizen | 201 (100.0%) | 0 (0.0%) |
Health Insurance Coverage by Household Income in Orchard Park
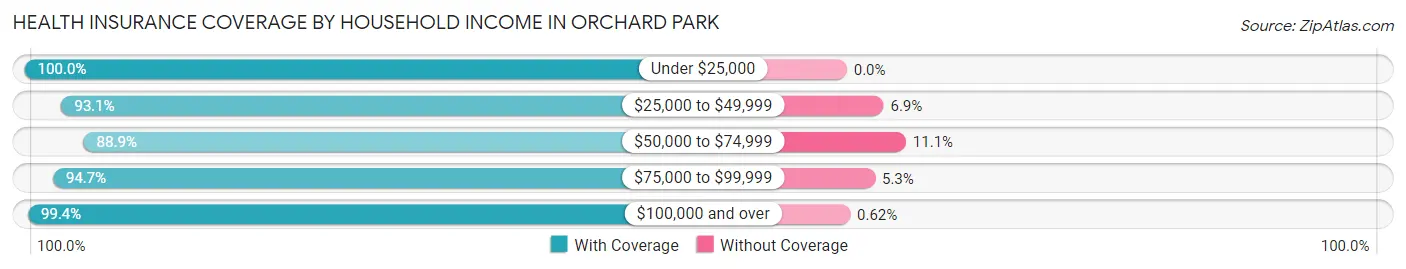
| Household Income | With Coverage | Without Coverage |
| Under $25,000 | 173 (100.0%) | 0 (0.0%) |
| $25,000 to $49,999 | 406 (93.1%) | 30 (6.9%) |
| $50,000 to $74,999 | 233 (88.9%) | 29 (11.1%) |
| $75,000 to $99,999 | 412 (94.7%) | 23 (5.3%) |
| $100,000 and over | 1,762 (99.4%) | 11 (0.6%) |
Public vs Private Health Insurance Coverage by Age in Orchard Park
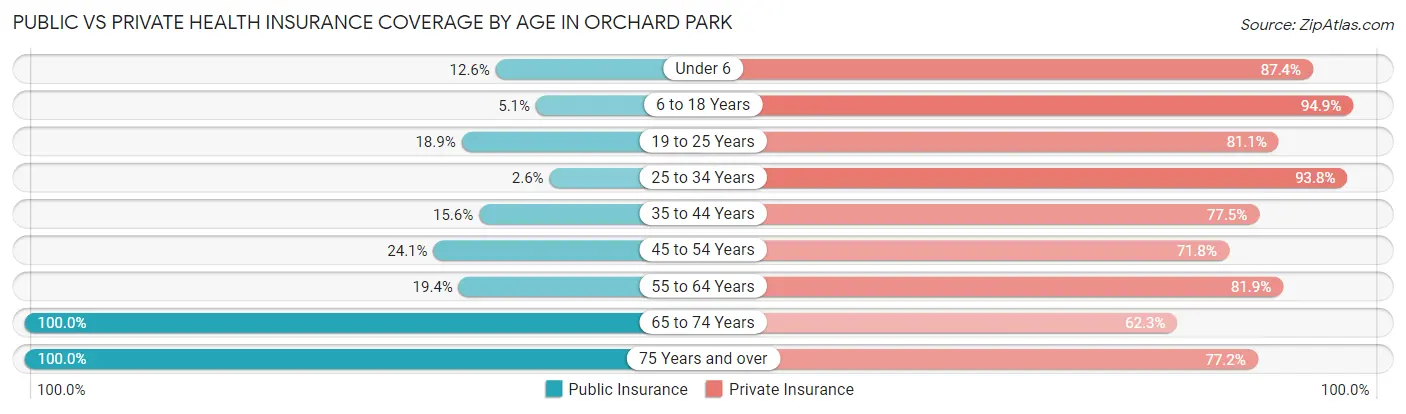
| Age Bracket | Public Insurance | Private Insurance |
| Under 6 | 22 (12.6%) | 153 (87.4%) |
| 6 to 18 Years | 22 (5.1%) | 409 (94.9%) |
| 19 to 25 Years | 38 (18.9%) | 163 (81.1%) |
| 25 to 34 Years | 10 (2.6%) | 364 (93.8%) |
| 35 to 44 Years | 43 (15.6%) | 213 (77.4%) |
| 45 to 54 Years | 125 (24.1%) | 372 (71.8%) |
| 55 to 64 Years | 103 (19.4%) | 434 (81.9%) |
| 65 to 74 Years | 334 (100.0%) | 208 (62.3%) |
| 75 Years and over | 232 (100.0%) | 179 (77.2%) |
| Total | 929 (30.1%) | 2,495 (80.9%) |
Disability Status by Sex by Age in Orchard Park
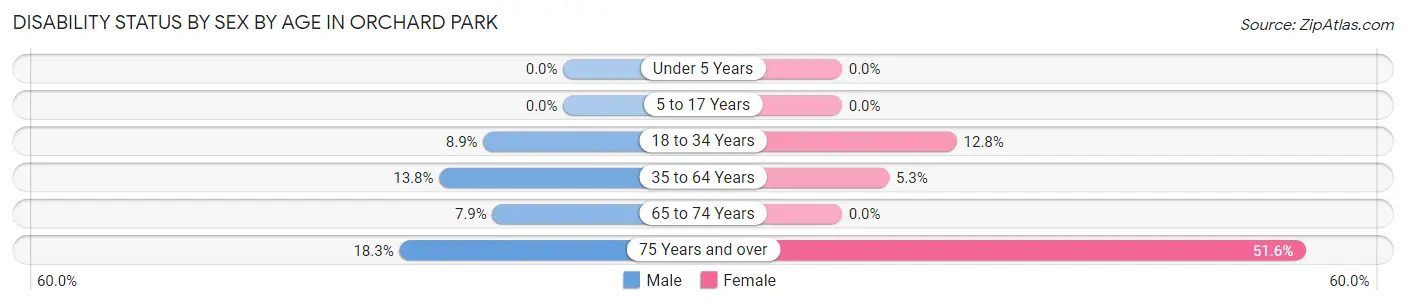
| Age Bracket | Male | Female |
| Under 5 Years | 0 (0.0%) | 0 (0.0%) |
| 5 to 17 Years | 0 (0.0%) | 0 (0.0%) |
| 18 to 34 Years | 26 (8.9%) | 38 (12.8%) |
| 35 to 64 Years | 104 (13.8%) | 30 (5.3%) |
| 65 to 74 Years | 16 (7.9%) | 0 (0.0%) |
| 75 Years and over | 25 (18.2%) | 49 (51.6%) |
Disability Class by Sex by Age in Orchard Park
Disability Class: Hearing Difficulty
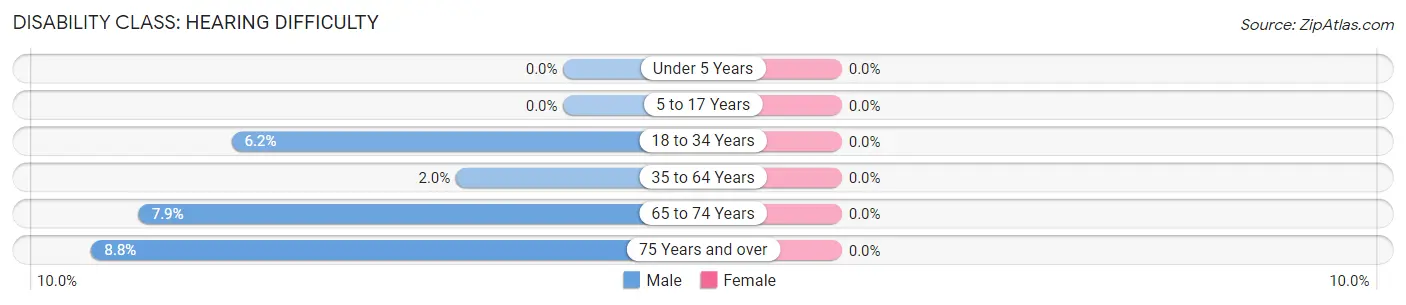
| Age Bracket | Male | Female |
| Under 5 Years | 0 (0.0%) | 0 (0.0%) |
| 5 to 17 Years | 0 (0.0%) | 0 (0.0%) |
| 18 to 34 Years | 18 (6.2%) | 0 (0.0%) |
| 35 to 64 Years | 15 (2.0%) | 0 (0.0%) |
| 65 to 74 Years | 16 (7.9%) | 0 (0.0%) |
| 75 Years and over | 12 (8.8%) | 0 (0.0%) |
Disability Class: Vision Difficulty
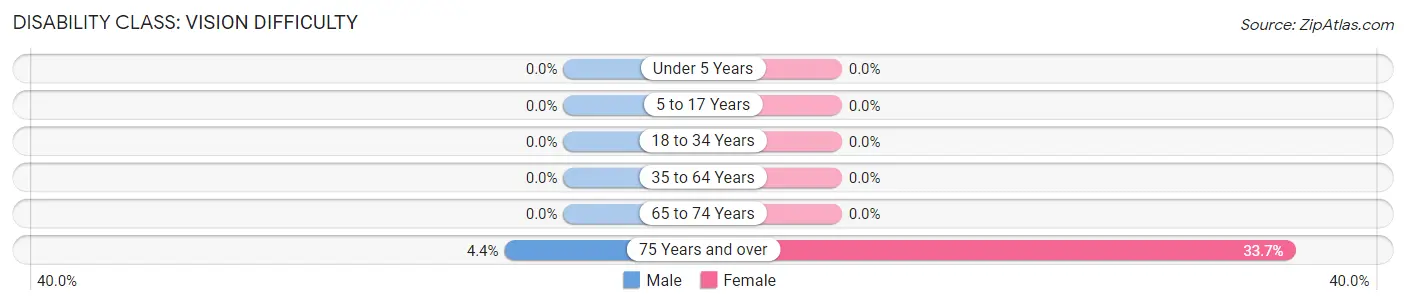
| Age Bracket | Male | Female |
| Under 5 Years | 0 (0.0%) | 0 (0.0%) |
| 5 to 17 Years | 0 (0.0%) | 0 (0.0%) |
| 18 to 34 Years | 0 (0.0%) | 0 (0.0%) |
| 35 to 64 Years | 0 (0.0%) | 0 (0.0%) |
| 65 to 74 Years | 0 (0.0%) | 0 (0.0%) |
| 75 Years and over | 6 (4.4%) | 32 (33.7%) |
Disability Class: Cognitive Difficulty
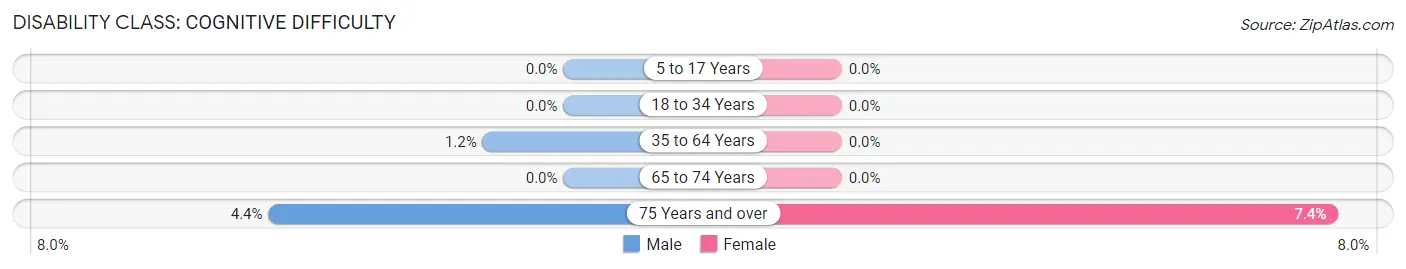
| Age Bracket | Male | Female |
| 5 to 17 Years | 0 (0.0%) | 0 (0.0%) |
| 18 to 34 Years | 0 (0.0%) | 0 (0.0%) |
| 35 to 64 Years | 9 (1.2%) | 0 (0.0%) |
| 65 to 74 Years | 0 (0.0%) | 0 (0.0%) |
| 75 Years and over | 6 (4.4%) | 7 (7.4%) |
Disability Class: Ambulatory Difficulty
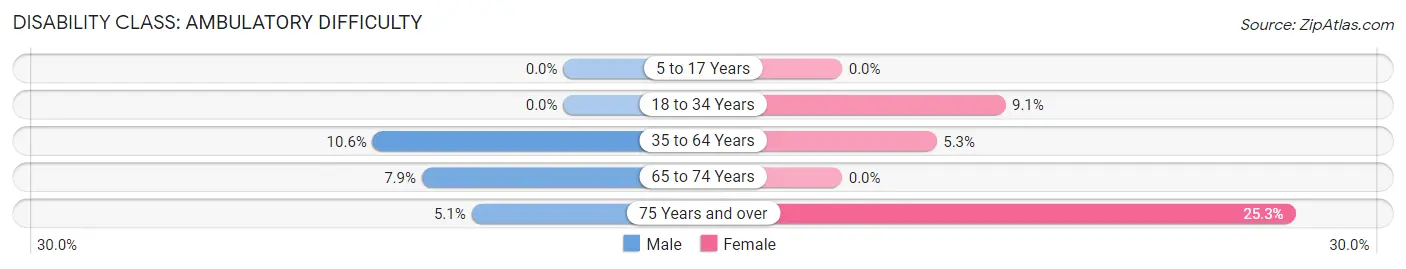
| Age Bracket | Male | Female |
| 5 to 17 Years | 0 (0.0%) | 0 (0.0%) |
| 18 to 34 Years | 0 (0.0%) | 27 (9.1%) |
| 35 to 64 Years | 80 (10.6%) | 30 (5.3%) |
| 65 to 74 Years | 16 (7.9%) | 0 (0.0%) |
| 75 Years and over | 7 (5.1%) | 24 (25.3%) |
Disability Class: Self-Care Difficulty
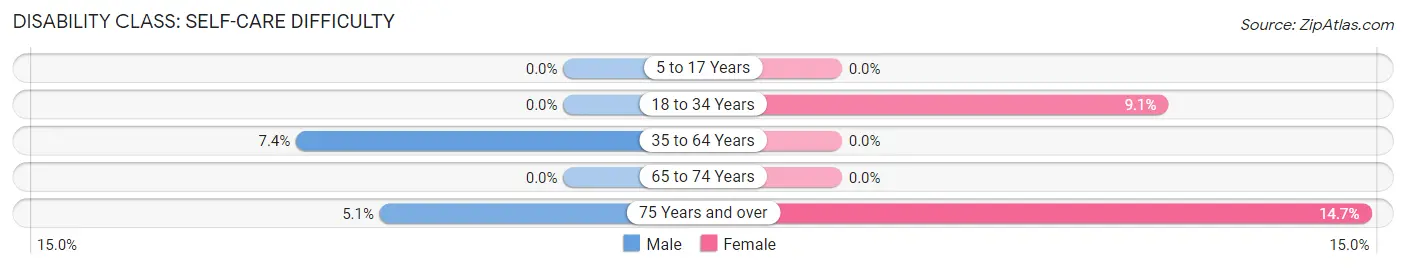
| Age Bracket | Male | Female |
| 5 to 17 Years | 0 (0.0%) | 0 (0.0%) |
| 18 to 34 Years | 0 (0.0%) | 27 (9.1%) |
| 35 to 64 Years | 56 (7.4%) | 0 (0.0%) |
| 65 to 74 Years | 0 (0.0%) | 0 (0.0%) |
| 75 Years and over | 7 (5.1%) | 14 (14.7%) |
Technology Access in Orchard Park
Computing Device Access in Orchard Park
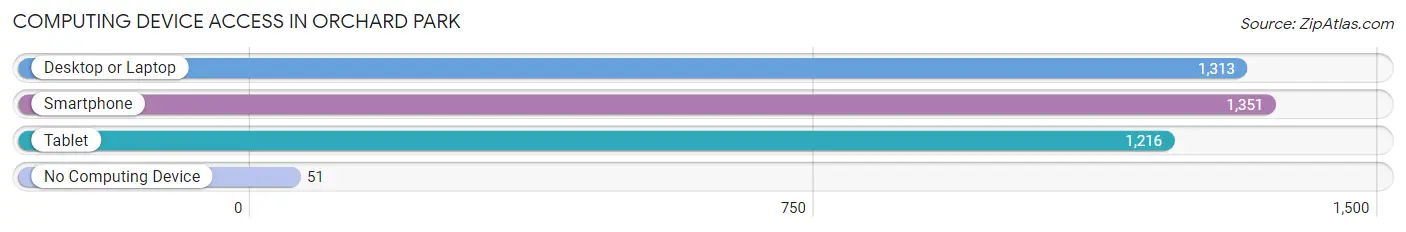
| Device Type | # Households | % Households |
| Desktop or Laptop | 1,313 | 88.8% |
| Smartphone | 1,351 | 91.3% |
| Tablet | 1,216 | 82.2% |
| No Computing Device | 51 | 3.5% |
| Total | 1,479 | 100.0% |
Internet Access in Orchard Park
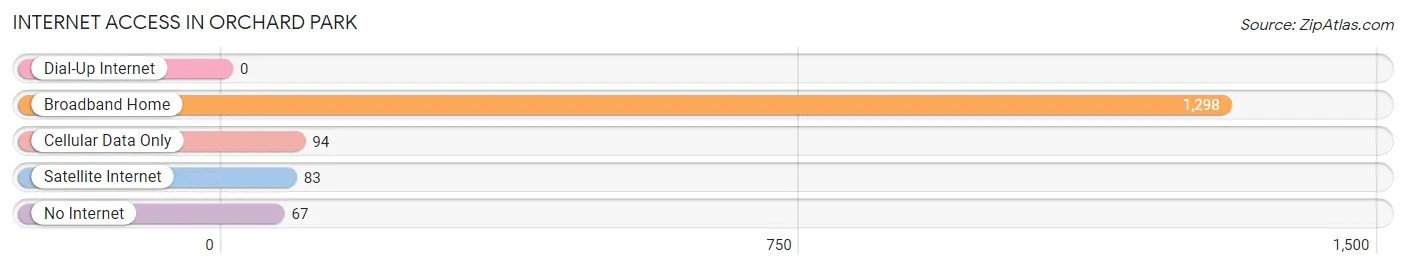
| Internet Type | # Households | % Households |
| Dial-Up Internet | 0 | 0.0% |
| Broadband Home | 1,298 | 87.8% |
| Cellular Data Only | 94 | 6.4% |
| Satellite Internet | 83 | 5.6% |
| No Internet | 67 | 4.5% |
| Total | 1,479 | 100.0% |
Orchard Park Summary
Orchard Park is a town located in Erie County, New York, United States. It is a suburb of Buffalo, located south of the city. As of the 2010 census, the town had a total population of 29,054.
Geography
Orchard Park is located at 42°45'N 78°45'W (42.75, -78.75). According to the United States Census Bureau, the town has a total area of 33.2 square miles (86.1 km2), of which 32.9 square miles (85.2 km2) is land and 0.3 square miles (0.9 km2) (0.86%) is water.
The town is bordered on the north by the town of Hamburg, on the east by the town of Aurora, on the south by the town of Boston, and on the west by the town of West Seneca.
History
The area that is now Orchard Park was first settled in 1804 by a group of settlers from Connecticut. The town was originally known as "Hardscrabble" due to the rocky soil and difficult terrain. The town was renamed "East Hamburgh" in 1806, and then "Hamburgh" in 1808. The town was renamed "Orchard Park" in 1820, after the orchards that were planted by the settlers.
The town was officially incorporated in 1829. In the late 19th century, the town became a popular summer resort for wealthy Buffalo residents. The town was also home to a number of large farms, which produced a variety of crops, including apples, peaches, pears, and cherries.
Economy
Orchard Park is home to a number of businesses, including retail stores, restaurants, and professional services. The town is also home to a number of corporate headquarters, including M&T Bank, Rich Products Corporation, and New Era Cap Company.
The town is also home to a number of industrial parks, including the Orchard Park Industrial Park, the Orchard Park Business Park, and the Orchard Park Technology Park.
Demographics
As of the 2010 census, there were 29,054 people, 11,845 households, and 8,072 families residing in the town. The population density was 881.3 people per square mile (341.2/km2). There were 12,541 housing units at an average density of 381.2 per square mile (147.3/km2). The racial makeup of the town was 95.2% White, 1.3% African American, 0.2% Native American, 1.7% Asian, 0.1% Pacific Islander, 0.6% from other races, and 1.1% from two or more races. Hispanic or Latino of any race were 2.7% of the population.
There were 11,845 households, out of which 32.2% had children under the age of 18 living with them, 56.2% were married couples living together, 9.7% had a female householder with no husband present, and 30.3% were non-families. 24.7% of all households were made up of individuals, and 10.2% had someone living alone who was 65 years of age or older. The average household size was 2.45 and the average family size was 2.94.
In the town, the population was spread out, with 24.2% under the age of 18, 6.2% from 18 to 24, 28.2% from 25 to 44, 25.3% from 45 to 64, and 16.1% who were 65 years of age or older. The median age was 40 years. For every 100 females, there were 93.2 males. For every 100 females age 18 and over, there were 90.2 males.
The median income for a household in the town was $60,945, and the median income for a family was $71,945. Males had a median income of $50,945 versus $35,945 for females. The per capita income for the town was $29,945. About 2.7% of families and 4.2% of the population were below the poverty line, including 4.7% of those under age 18 and 4.2% of those age 65 or over.
Common Questions
What is the Total Population of Orchard Park?
Total Population of Orchard Park is 3,084.
What is the Total Male Population of Orchard Park?
Total Male Population of Orchard Park is 1,697.
What is the Total Female Population of Orchard Park?
Total Female Population of Orchard Park is 1,387.
What is the Ratio of Males per 100 Females in Orchard Park?
There are 122.35 Males per 100 Females in Orchard Park.
What is the Ratio of Females per 100 Males in Orchard Park?
There are 81.73 Females per 100 Males in Orchard Park.
What is the Median Population Age in Orchard Park?
Median Population Age in Orchard Park is 46.8 Years.
What is the Average Family Size in Orchard Park
Average Family Size in Orchard Park is 2.8 People.
What is the Average Household Size in Orchard Park
Average Household Size in Orchard Park is 2.1 People.
What is Per Capita Income in Orchard Park?
Per Capita income in Orchard Park is $57,107.
What is the Median Family Income in Orchard Park?
Median Family Income in Orchard Park is $144,292.
What is the Median Household income in Orchard Park?
Median Household Income in Orchard Park is $91,705.
What is Income or Wage Gap in Orchard Park?
Income or Wage Gap in Orchard Park is 8.4%.
Women in Orchard Park earn 91.6 cents for every dollar earned by a man.
What is Inequality or Gini Index in Orchard Park?
Inequality or Gini Index in Orchard Park is 0.45.
How Large is the Labor Force in Orchard Park?
There are 1,813 People in the Labor Forcein in Orchard Park.
What is the Percentage of People in the Labor Force in Orchard Park?
69.8% of People are in the Labor Force in Orchard Park.
What is the Unemployment Rate in Orchard Park?
Unemployment Rate in Orchard Park is 4.3%.