Cities with the Most Immigrants from Panama in Florida
RELATED REPORTS & OPTIONS
Panama
Florida
Compare Cities
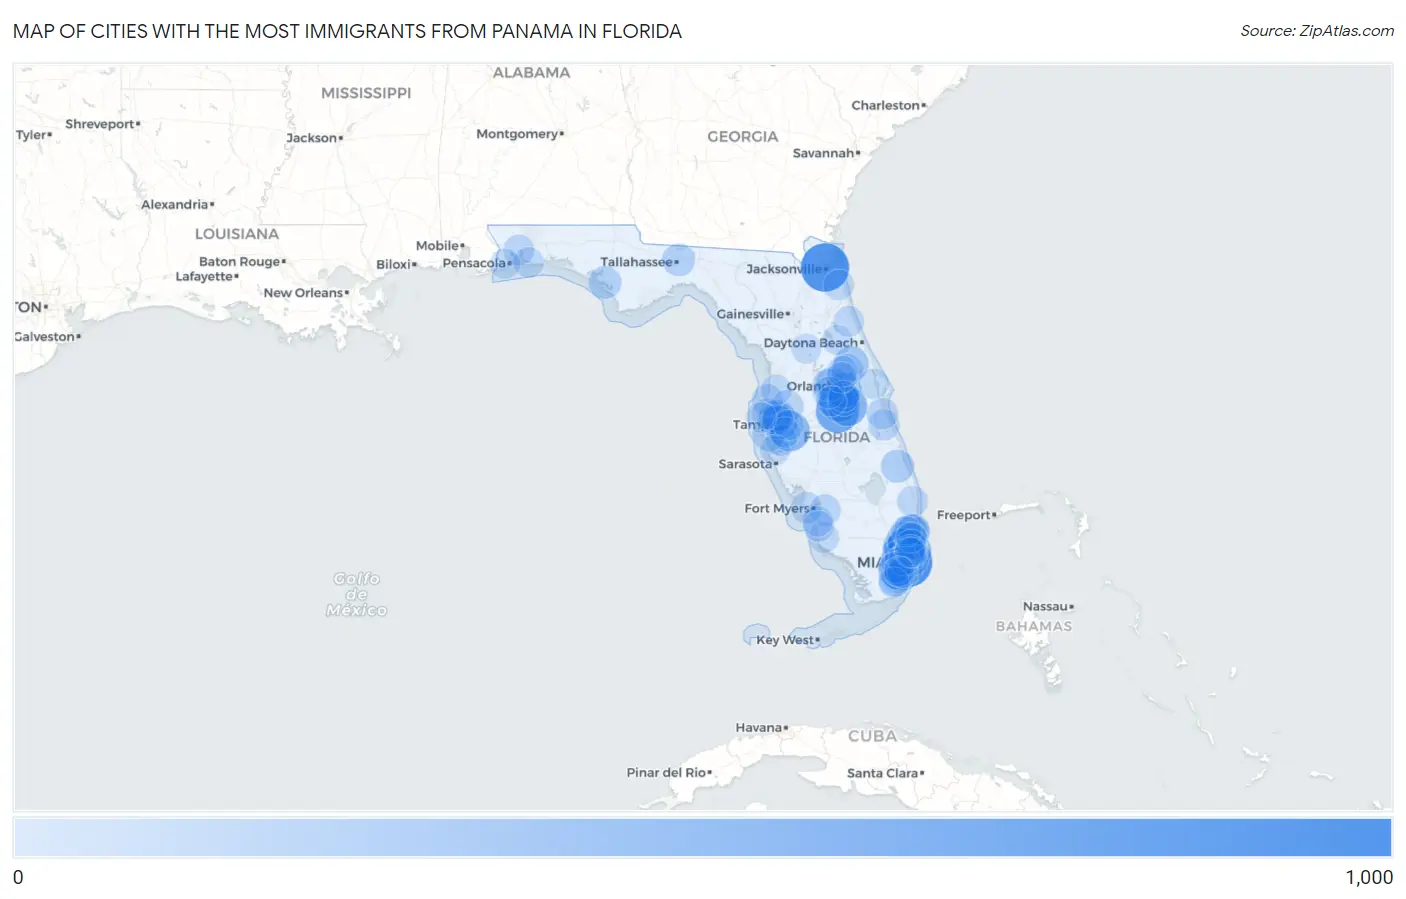
Map of Cities with the Most Immigrants from Panama in Florida
0
1,000
Cities with the Most Immigrants from Panama in Florida
| City | Panama | vs State | vs National | |
| 1. | Miami | 900 | 22,972(3.92%)#1 | 105,274(0.85%)#3 |
| 2. | Jacksonville | 850 | 22,972(3.70%)#2 | 105,274(0.81%)#5 |
| 3. | Poinciana | 619 | 22,972(2.69%)#3 | 105,274(0.59%)#7 |
| 4. | Kissimmee | 536 | 22,972(2.33%)#4 | 105,274(0.51%)#10 |
| 5. | Miami Gardens | 504 | 22,972(2.19%)#5 | 105,274(0.48%)#11 |
| 6. | Country Club | 477 | 22,972(2.08%)#6 | 105,274(0.45%)#13 |
| 7. | Riverview | 466 | 22,972(2.03%)#7 | 105,274(0.44%)#15 |
| 8. | St Cloud | 460 | 22,972(2.00%)#8 | 105,274(0.44%)#16 |
| 9. | The Crossings | 403 | 22,972(1.75%)#9 | 105,274(0.38%)#22 |
| 10. | Doral | 377 | 22,972(1.64%)#10 | 105,274(0.36%)#23 |
| 11. | Aventura | 377 | 22,972(1.64%)#11 | 105,274(0.36%)#24 |
| 12. | Pembroke Pines | 314 | 22,972(1.37%)#12 | 105,274(0.30%)#31 |
| 13. | Tampa | 293 | 22,972(1.28%)#13 | 105,274(0.28%)#35 |
| 14. | Hialeah | 283 | 22,972(1.23%)#14 | 105,274(0.27%)#37 |
| 15. | Orlando | 282 | 22,972(1.23%)#15 | 105,274(0.27%)#38 |
| 16. | Deltona | 258 | 22,972(1.12%)#16 | 105,274(0.25%)#42 |
| 17. | Miramar | 255 | 22,972(1.11%)#17 | 105,274(0.24%)#44 |
| 18. | Pompano Beach | 239 | 22,972(1.04%)#18 | 105,274(0.23%)#47 |
| 19. | Westchester | 233 | 22,972(1.01%)#19 | 105,274(0.22%)#51 |
| 20. | Davie | 218 | 22,972(0.95%)#20 | 105,274(0.21%)#56 |
| 21. | Sunrise | 206 | 22,972(0.90%)#21 | 105,274(0.20%)#59 |
| 22. | Coconut Creek | 203 | 22,972(0.88%)#22 | 105,274(0.19%)#62 |
| 23. | Ocoee | 191 | 22,972(0.83%)#23 | 105,274(0.18%)#67 |
| 24. | Fort Lauderdale | 181 | 22,972(0.79%)#24 | 105,274(0.17%)#70 |
| 25. | Port St Lucie | 180 | 22,972(0.78%)#25 | 105,274(0.17%)#72 |
| 26. | Cutler Bay | 171 | 22,972(0.74%)#26 | 105,274(0.16%)#73 |
| 27. | Callaway | 169 | 22,972(0.74%)#27 | 105,274(0.16%)#76 |
| 28. | St Petersburg | 168 | 22,972(0.73%)#28 | 105,274(0.16%)#77 |
| 29. | North Miami | 168 | 22,972(0.73%)#29 | 105,274(0.16%)#78 |
| 30. | Cooper City | 168 | 22,972(0.73%)#30 | 105,274(0.16%)#79 |
| 31. | Hollywood | 165 | 22,972(0.72%)#31 | 105,274(0.16%)#82 |
| 32. | Coral Gables | 161 | 22,972(0.70%)#32 | 105,274(0.15%)#85 |
| 33. | Tallahassee | 160 | 22,972(0.70%)#33 | 105,274(0.15%)#86 |
| 34. | The Hammocks | 158 | 22,972(0.69%)#34 | 105,274(0.15%)#89 |
| 35. | Leisure City | 152 | 22,972(0.66%)#35 | 105,274(0.14%)#96 |
| 36. | Winter Garden | 149 | 22,972(0.65%)#36 | 105,274(0.14%)#99 |
| 37. | University Cdp Orange County | 143 | 22,972(0.62%)#37 | 105,274(0.14%)#104 |
| 38. | Sanford | 142 | 22,972(0.62%)#38 | 105,274(0.13%)#105 |
| 39. | Tamiami | 137 | 22,972(0.60%)#39 | 105,274(0.13%)#107 |
| 40. | Wesley Chapel | 136 | 22,972(0.59%)#40 | 105,274(0.13%)#108 |
| 41. | Ojus | 128 | 22,972(0.56%)#41 | 105,274(0.12%)#115 |
| 42. | Buenaventura Lakes | 125 | 22,972(0.54%)#42 | 105,274(0.12%)#122 |
| 43. | Kendall | 123 | 22,972(0.54%)#43 | 105,274(0.12%)#124 |
| 44. | Citrus Park | 123 | 22,972(0.54%)#44 | 105,274(0.12%)#125 |
| 45. | Town N Country | 121 | 22,972(0.53%)#45 | 105,274(0.11%)#127 |
| 46. | Ives Estates | 119 | 22,972(0.52%)#46 | 105,274(0.11%)#130 |
| 47. | Deerfield Beach | 110 | 22,972(0.48%)#47 | 105,274(0.10%)#144 |
| 48. | Horizon West | 110 | 22,972(0.48%)#48 | 105,274(0.10%)#145 |
| 49. | Glenvar Heights | 107 | 22,972(0.47%)#49 | 105,274(0.10%)#152 |
| 50. | Lake Magdalene | 106 | 22,972(0.46%)#50 | 105,274(0.10%)#155 |
| 51. | Miami Beach | 105 | 22,972(0.46%)#51 | 105,274(0.10%)#157 |
| 52. | Cape Coral | 104 | 22,972(0.45%)#52 | 105,274(0.10%)#160 |
| 53. | Carrollwood | 104 | 22,972(0.45%)#53 | 105,274(0.10%)#163 |
| 54. | Palm Bay | 101 | 22,972(0.44%)#54 | 105,274(0.10%)#167 |
| 55. | Melbourne | 101 | 22,972(0.44%)#55 | 105,274(0.10%)#168 |
| 56. | Princeton | 100 | 22,972(0.44%)#56 | 105,274(0.09%)#171 |
| 57. | Bayonet Point | 100 | 22,972(0.44%)#57 | 105,274(0.09%)#172 |
| 58. | Lehigh Acres | 97 | 22,972(0.42%)#58 | 105,274(0.09%)#176 |
| 59. | Kendale Lakes | 96 | 22,972(0.42%)#59 | 105,274(0.09%)#179 |
| 60. | Ruskin | 95 | 22,972(0.41%)#60 | 105,274(0.09%)#181 |
| 61. | Fountainebleau | 93 | 22,972(0.40%)#61 | 105,274(0.09%)#184 |
| 62. | Meadow Woods | 93 | 22,972(0.40%)#62 | 105,274(0.09%)#185 |
| 63. | South Miami Heights | 92 | 22,972(0.40%)#63 | 105,274(0.09%)#186 |
| 64. | East Lake | 89 | 22,972(0.39%)#64 | 105,274(0.08%)#192 |
| 65. | Hialeah Gardens | 88 | 22,972(0.38%)#65 | 105,274(0.08%)#195 |
| 66. | Egypt Lake Leto | 86 | 22,972(0.37%)#66 | 105,274(0.08%)#197 |
| 67. | Milton | 84 | 22,972(0.37%)#67 | 105,274(0.08%)#203 |
| 68. | West Palm Beach | 82 | 22,972(0.36%)#68 | 105,274(0.08%)#208 |
| 69. | Kendall West | 82 | 22,972(0.36%)#69 | 105,274(0.08%)#211 |
| 70. | Palm Coast | 77 | 22,972(0.34%)#70 | 105,274(0.07%)#228 |
| 71. | Golden Gate | 76 | 22,972(0.33%)#71 | 105,274(0.07%)#231 |
| 72. | Liberty Triangle | 76 | 22,972(0.33%)#72 | 105,274(0.07%)#232 |
| 73. | Richmond West | 75 | 22,972(0.33%)#73 | 105,274(0.07%)#235 |
| 74. | Spring Hill | 74 | 22,972(0.32%)#74 | 105,274(0.07%)#239 |
| 75. | Bonita Springs | 72 | 22,972(0.31%)#75 | 105,274(0.07%)#249 |
| 76. | Nocatee | 72 | 22,972(0.31%)#76 | 105,274(0.07%)#252 |
| 77. | Heathrow | 72 | 22,972(0.31%)#77 | 105,274(0.07%)#253 |
| 78. | Estero | 71 | 22,972(0.31%)#78 | 105,274(0.07%)#257 |
| 79. | Dania Beach | 70 | 22,972(0.30%)#79 | 105,274(0.07%)#261 |
| 80. | Altamonte Springs | 69 | 22,972(0.30%)#80 | 105,274(0.07%)#266 |
| 81. | Navarre | 69 | 22,972(0.30%)#81 | 105,274(0.07%)#267 |
| 82. | Palmetto Estates | 68 | 22,972(0.30%)#82 | 105,274(0.06%)#272 |
| 83. | Titusville | 66 | 22,972(0.29%)#83 | 105,274(0.06%)#280 |
| 84. | Myrtle Grove | 65 | 22,972(0.28%)#84 | 105,274(0.06%)#287 |
| 85. | Gibsonton | 63 | 22,972(0.27%)#85 | 105,274(0.06%)#300 |
| 86. | Miami Springs | 63 | 22,972(0.27%)#86 | 105,274(0.06%)#301 |
| 87. | Pembroke Park | 63 | 22,972(0.27%)#87 | 105,274(0.06%)#302 |
| 88. | Palmetto Bay | 61 | 22,972(0.27%)#88 | 105,274(0.06%)#311 |
| 89. | Homestead | 60 | 22,972(0.26%)#89 | 105,274(0.06%)#313 |
| 90. | Sunny Isles Beach | 59 | 22,972(0.26%)#90 | 105,274(0.06%)#317 |
| 91. | Coral Springs | 58 | 22,972(0.25%)#91 | 105,274(0.06%)#319 |
| 92. | Oakland Park | 58 | 22,972(0.25%)#92 | 105,274(0.06%)#321 |
| 93. | Celebration | 57 | 22,972(0.25%)#93 | 105,274(0.05%)#331 |
| 94. | Pierson | 57 | 22,972(0.25%)#94 | 105,274(0.05%)#332 |
| 95. | Brandon | 56 | 22,972(0.24%)#95 | 105,274(0.05%)#334 |
| 96. | North Miami Beach | 55 | 22,972(0.24%)#96 | 105,274(0.05%)#341 |
| 97. | Dunedin | 55 | 22,972(0.24%)#97 | 105,274(0.05%)#342 |
| 98. | Richmond Heights | 55 | 22,972(0.24%)#98 | 105,274(0.05%)#347 |
| 99. | Silver Springs Shores | 54 | 22,972(0.24%)#99 | 105,274(0.05%)#354 |
| 100. | Memphis | 54 | 22,972(0.24%)#100 | 105,274(0.05%)#356 |
Common Questions
What are the Top 10 Cities with the Most Immigrants from Panama in Florida?
Top 10 Cities with the Most Immigrants from Panama in Florida are:
#1
900
#2
850
#3
619
#4
536
#5
504
#6
477
#7
466
#8
460
#9
403
#10
377
What city has the Most Immigrants from Panama in Florida?
Miami has the Most Immigrants from Panama in Florida with 900.
What is the Total Immigrants from Panama in the State of Florida?
Total Immigrants from Panama in Florida is 22,972.
What is the Total Immigrants from Panama in the United States?
Total Immigrants from Panama in the United States is 105,274.