Cutchogue, NY
Cutchogue Map
Cutchogue Overview
2,792
TOTAL POPULATION
1,438
MALE POPULATION
1,354
FEMALE POPULATION
106.20
MALES / 100 FEMALES
94.16
FEMALES / 100 MALES
59.9
MEDIAN AGE
2.6
AVG FAMILY SIZE
2.3
AVG HOUSEHOLD SIZE
$93,722
PER CAPITA INCOME
$138,299
AVG FAMILY INCOME
$124,485
AVG HOUSEHOLD INCOME
36.2%
WAGE / INCOME GAP [ % ]
63.8¢/ $1
WAGE / INCOME GAP [ $ ]
0.58
INEQUALITY / GINI INDEX
1,377
LABOR FORCE [ PEOPLE ]
56.4%
PERCENT IN LABOR FORCE
1.2%
UNEMPLOYMENT RATE
Cutchogue Zip Codes
Cutchogue Area Codes
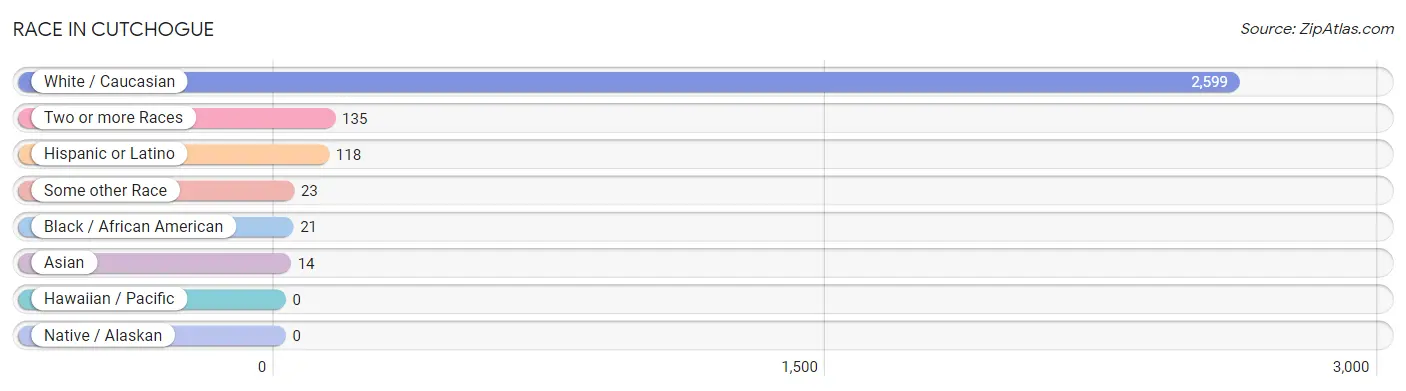
Race in Cutchogue
The most populous races in Cutchogue are White / Caucasian (2,599 | 93.1%), Two or more Races (135 | 4.8%), and Hispanic or Latino (118 | 4.2%).
| Race | # Population | % Population |
| Asian | 14 | 0.5% |
| Black / African American | 21 | 0.7% |
| Hawaiian / Pacific | 0 | 0.0% |
| Hispanic or Latino | 118 | 4.2% |
| Native / Alaskan | 0 | 0.0% |
| White / Caucasian | 2,599 | 93.1% |
| Two or more Races | 135 | 4.8% |
| Some other Race | 23 | 0.8% |
| Total | 2,792 | 100.0% |
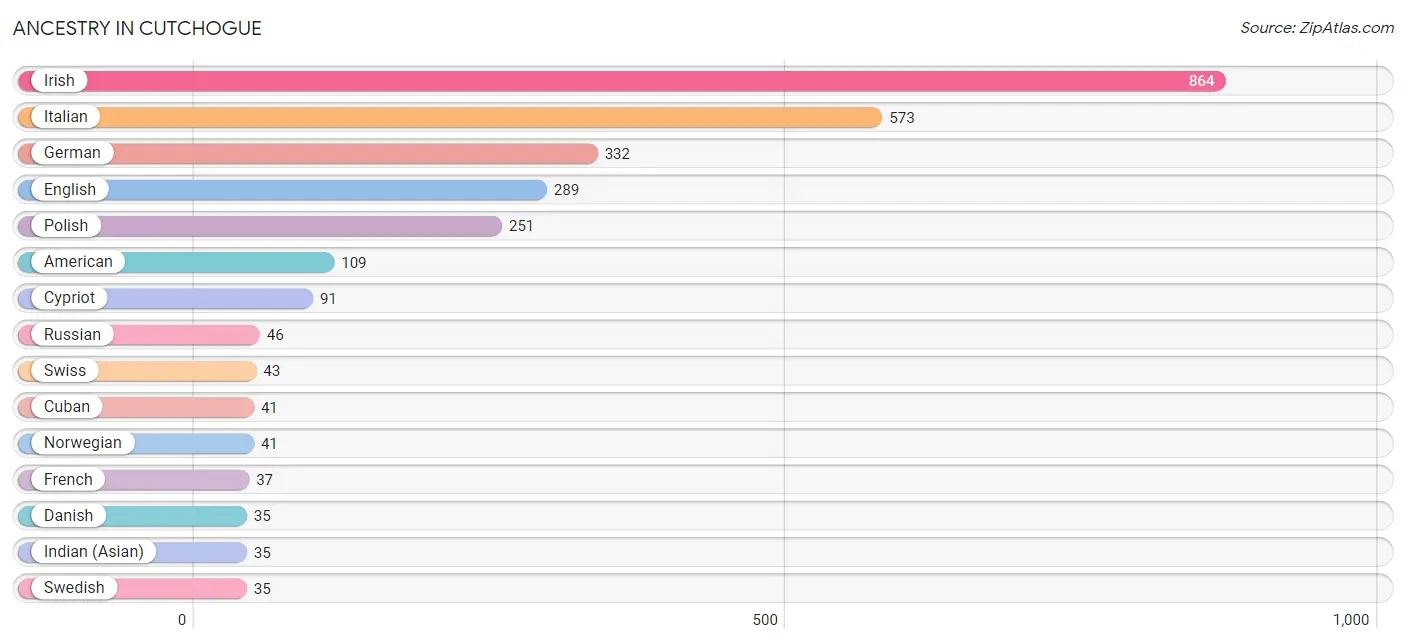
Ancestry in Cutchogue
The most populous ancestries reported in Cutchogue are Irish (864 | 30.9%), Italian (573 | 20.5%), German (332 | 11.9%), English (289 | 10.3%), and Polish (251 | 9.0%), together accounting for 82.7% of all Cutchogue residents.
| Ancestry | # Population | % Population |
| American | 109 | 3.9% |
| Austrian | 18 | 0.6% |
| Cuban | 41 | 1.5% |
| Cypriot | 91 | 3.3% |
| Danish | 35 | 1.3% |
| Dutch | 26 | 0.9% |
| Eastern European | 31 | 1.1% |
| English | 289 | 10.3% |
| European | 23 | 0.8% |
| French | 37 | 1.3% |
| French Canadian | 18 | 0.6% |
| German | 332 | 11.9% |
| Haitian | 14 | 0.5% |
| Hungarian | 14 | 0.5% |
| Indian (Asian) | 35 | 1.3% |
| Irish | 864 | 30.9% |
| Italian | 573 | 20.5% |
| Latvian | 15 | 0.5% |
| Lithuanian | 29 | 1.0% |
| Mexican | 21 | 0.7% |
| Norwegian | 41 | 1.5% |
| Polish | 251 | 9.0% |
| Portuguese | 16 | 0.6% |
| Puerto Rican | 16 | 0.6% |
| Russian | 46 | 1.7% |
| Scottish | 15 | 0.5% |
| Slovak | 11 | 0.4% |
| Spanish | 8 | 0.3% |
| Swedish | 35 | 1.3% |
| Swiss | 43 | 1.5% |
| Ukrainian | 34 | 1.2% | View All 31 Rows |
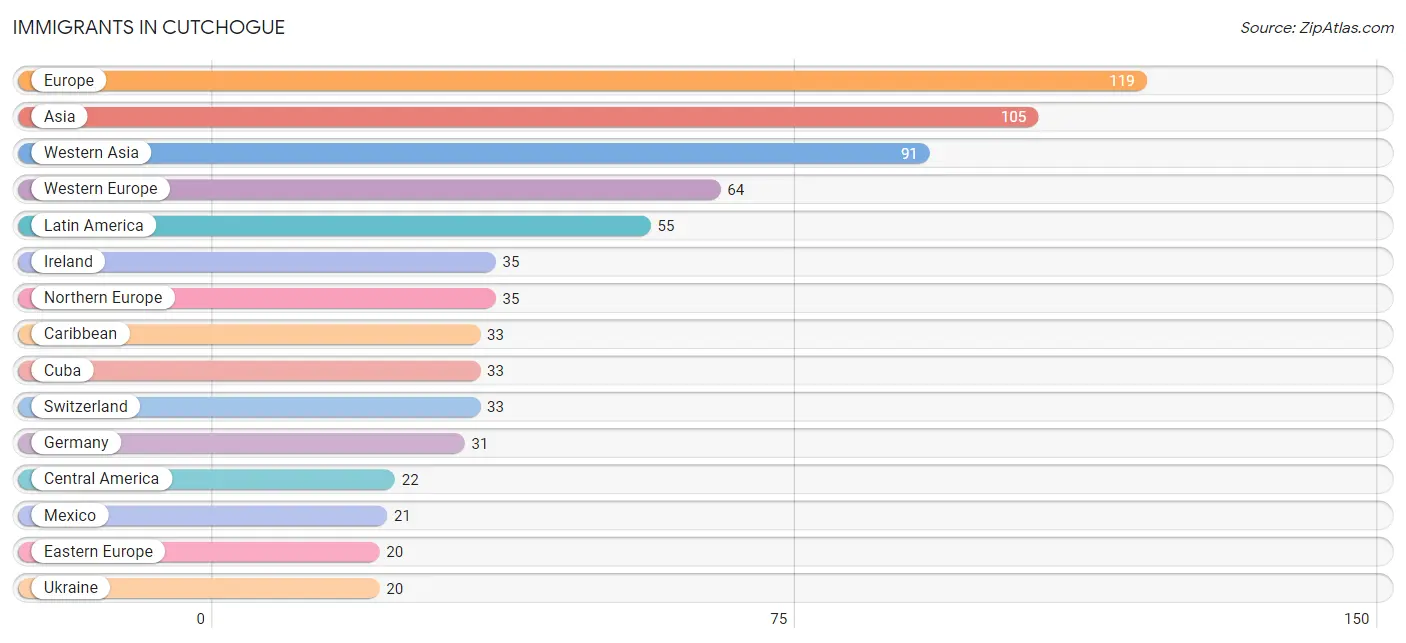
Immigrants in Cutchogue
The most numerous immigrant groups reported in Cutchogue came from Europe (119 | 4.3%), Asia (105 | 3.8%), Western Asia (91 | 3.3%), Western Europe (64 | 2.3%), and Latin America (55 | 2.0%), together accounting for 15.5% of all Cutchogue residents.
| Immigration Origin | # Population | % Population |
| Asia | 105 | 3.8% |
| Caribbean | 33 | 1.2% |
| Central America | 22 | 0.8% |
| China | 14 | 0.5% |
| Cuba | 33 | 1.2% |
| Eastern Asia | 14 | 0.5% |
| Eastern Europe | 20 | 0.7% |
| El Salvador | 1 | 0.0% |
| Europe | 119 | 4.3% |
| Germany | 31 | 1.1% |
| Hong Kong | 14 | 0.5% |
| Ireland | 35 | 1.3% |
| Latin America | 55 | 2.0% |
| Mexico | 21 | 0.7% |
| Northern Europe | 35 | 1.3% |
| Switzerland | 33 | 1.2% |
| Ukraine | 20 | 0.7% |
| Western Asia | 91 | 3.3% |
| Western Europe | 64 | 2.3% | View All 19 Rows |
Sex and Age in Cutchogue
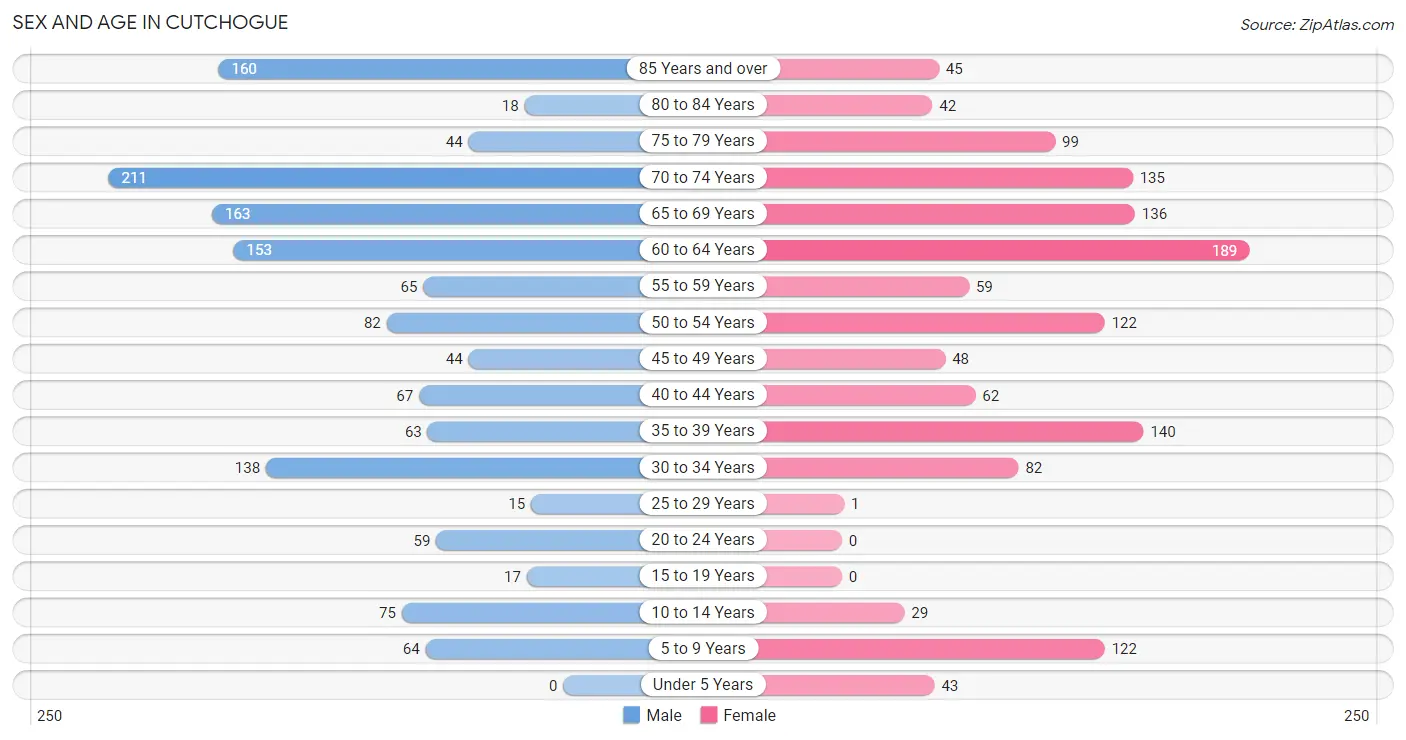
Sex and Age in Cutchogue
The most populous age groups in Cutchogue are 70 to 74 Years (211 | 14.7%) for men and 60 to 64 Years (189 | 14.0%) for women.
| Age Bracket | Male | Female |
| Under 5 Years | 0 (0.0%) | 43 (3.2%) |
| 5 to 9 Years | 64 (4.4%) | 122 (9.0%) |
| 10 to 14 Years | 75 (5.2%) | 29 (2.1%) |
| 15 to 19 Years | 17 (1.2%) | 0 (0.0%) |
| 20 to 24 Years | 59 (4.1%) | 0 (0.0%) |
| 25 to 29 Years | 15 (1.0%) | 1 (0.1%) |
| 30 to 34 Years | 138 (9.6%) | 82 (6.1%) |
| 35 to 39 Years | 63 (4.4%) | 140 (10.3%) |
| 40 to 44 Years | 67 (4.7%) | 62 (4.6%) |
| 45 to 49 Years | 44 (3.1%) | 48 (3.5%) |
| 50 to 54 Years | 82 (5.7%) | 122 (9.0%) |
| 55 to 59 Years | 65 (4.5%) | 59 (4.4%) |
| 60 to 64 Years | 153 (10.6%) | 189 (14.0%) |
| 65 to 69 Years | 163 (11.3%) | 136 (10.0%) |
| 70 to 74 Years | 211 (14.7%) | 135 (10.0%) |
| 75 to 79 Years | 44 (3.1%) | 99 (7.3%) |
| 80 to 84 Years | 18 (1.3%) | 42 (3.1%) |
| 85 Years and over | 160 (11.1%) | 45 (3.3%) |
| Total | 1,438 (100.0%) | 1,354 (100.0%) |
Families and Households in Cutchogue
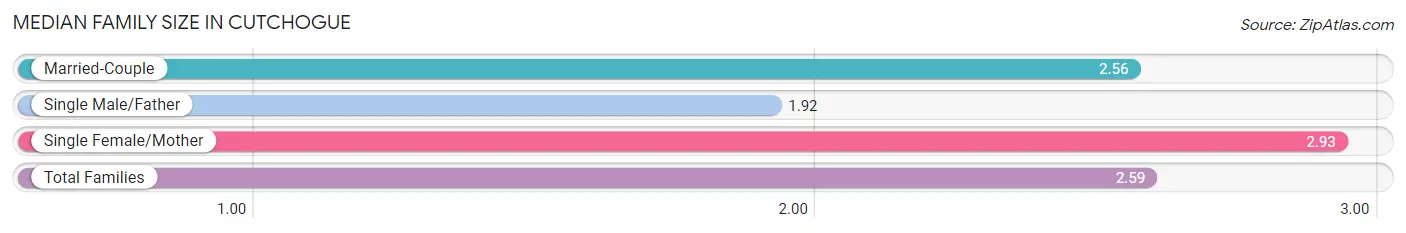
Median Family Size in Cutchogue
The median family size in Cutchogue is 2.59 persons per family, with single female/mother families (97 | 10.7%) accounting for the largest median family size of 2.93 persons per family. On the other hand, single male/father families (13 | 1.4%) represent the smallest median family size with 1.92 persons per family.
| Family Type | # Families | Family Size |
| Married-Couple | 795 (87.8%) | 2.56 |
| Single Male/Father | 13 (1.4%) | 1.92 |
| Single Female/Mother | 97 (10.7%) | 2.93 |
| Total Families | 905 (100.0%) | 2.59 |
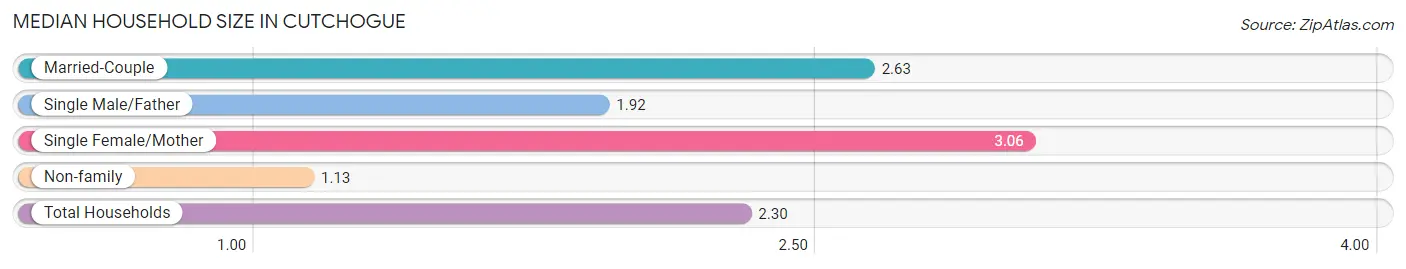
Median Household Size in Cutchogue
The median household size in Cutchogue is 2.30 persons per household, with single female/mother households (97 | 8.2%) accounting for the largest median household size of 3.06 persons per household. non-family households (284 | 23.9%) represent the smallest median household size with 1.13 persons per household.
| Household Type | # Households | Household Size |
| Married-Couple | 795 (66.9%) | 2.63 |
| Single Male/Father | 13 (1.1%) | 1.92 |
| Single Female/Mother | 97 (8.2%) | 3.06 |
| Non-family | 284 (23.9%) | 1.13 |
| Total Households | 1,189 (100.0%) | 2.30 |
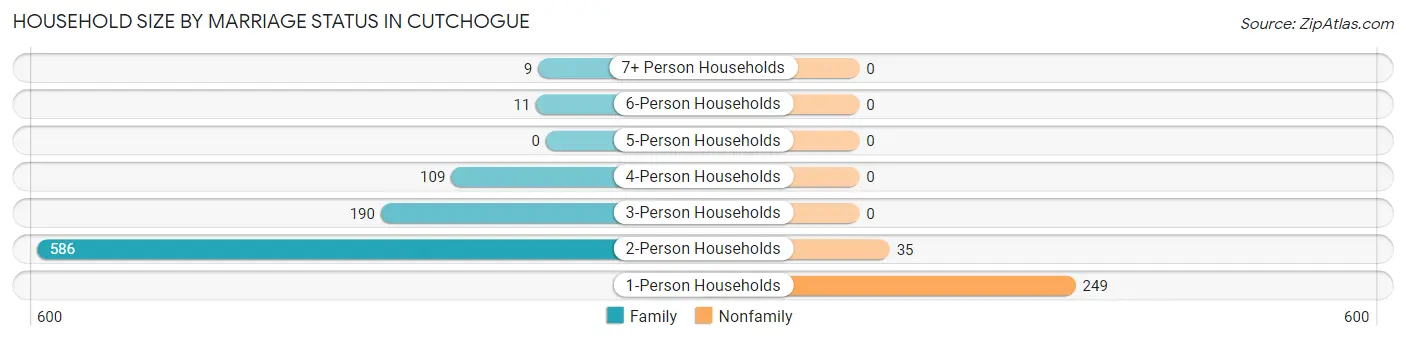
Household Size by Marriage Status in Cutchogue
Out of a total of 1,189 households in Cutchogue, 905 (76.1%) are family households, while 284 (23.9%) are nonfamily households. The most numerous type of family households are 2-person households, comprising 586, and the most common type of nonfamily households are 1-person households, comprising 249.
| Household Size | Family Households | Nonfamily Households |
| 1-Person Households | - | 249 (20.9%) |
| 2-Person Households | 586 (49.3%) | 35 (2.9%) |
| 3-Person Households | 190 (16.0%) | 0 (0.0%) |
| 4-Person Households | 109 (9.2%) | 0 (0.0%) |
| 5-Person Households | 0 (0.0%) | 0 (0.0%) |
| 6-Person Households | 11 (0.9%) | 0 (0.0%) |
| 7+ Person Households | 9 (0.8%) | 0 (0.0%) |
| Total | 905 (76.1%) | 284 (23.9%) |
Female Fertility in Cutchogue
Fertility by Age in Cutchogue
| Age Bracket | Women with Births | Births / 1,000 Women |
| 15 to 19 years | 0 (0.0%) | 0.0 |
| 20 to 34 years | 0 (0.0%) | 0.0 |
| 35 to 50 years | 0 (0.0%) | 0.0 |
| Total | 0 (0.0%) | 0.0 |
Fertility by Age by Marriage Status in Cutchogue
| Age Bracket | Married | Unmarried |
| 15 to 19 years | 0 (0.0%) | 0 (0.0%) |
| 20 to 34 years | 0 (0.0%) | 0 (0.0%) |
| 35 to 50 years | 0 (0.0%) | 0 (0.0%) |
| Total | 0 (0.0%) | 0 (0.0%) |
Fertility by Education in Cutchogue
| Educational Attainment | Women with Births | Births / 1,000 Women |
| Less than High School | 0 (0.0%) | 0.0 |
| High School Diploma | 0 (0.0%) | 0.0 |
| College or Associate's Degree | 0 (0.0%) | 0.0 |
| Bachelor's Degree | 0 (0.0%) | 0.0 |
| Graduate Degree | 0 (0.0%) | 0.0 |
| Total | 0 (0.0%) | 0.0 |
Fertility by Education by Marriage Status in Cutchogue
| Educational Attainment | Married | Unmarried |
| Less than High School | 0 (0.0%) | 0 (0.0%) |
| High School Diploma | 0 (0.0%) | 0 (0.0%) |
| College or Associate's Degree | 0 (0.0%) | 0 (0.0%) |
| Bachelor's Degree | 0 (0.0%) | 0 (0.0%) |
| Graduate Degree | 0 (0.0%) | 0 (0.0%) |
| Total | 0 (0.0%) | 0 (0.0%) |
Income in Cutchogue
Income Overview in Cutchogue
Per Capita Income in Cutchogue is $93,722, while median incomes of families and households are $138,299 and $124,485 respectively.
| Characteristic | Number | Measure |
| Per Capita Income | 2,792 | $93,722 |
| Median Family Income | 905 | $138,299 |
| Mean Family Income | 905 | $233,445 |
| Median Household Income | 1,189 | $124,485 |
| Mean Household Income | 1,189 | $216,665 |
| Income Deficit | 905 | $0 |
| Wage / Income Gap (%) | 2,792 | 36.23% |
| Wage / Income Gap ($) | 2,792 | 63.77¢ per $1 |
| Gini / Inequality Index | 2,792 | 0.58 |
Earnings by Sex in Cutchogue
Average Earnings in Cutchogue are $59,676, $73,929 for men and $47,143 for women, a difference of 36.2%.
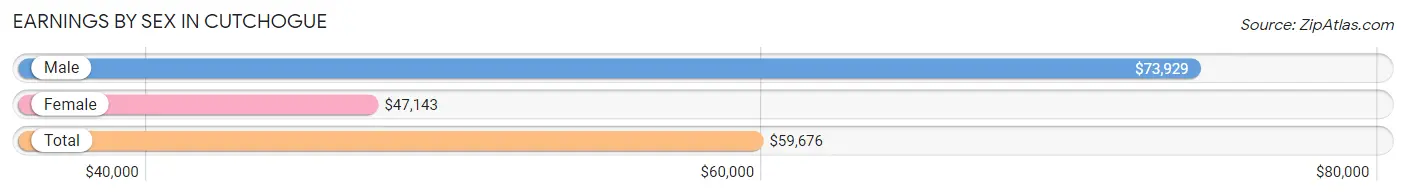
| Sex | Number | Average Earnings |
| Male | 790 (55.6%) | $73,929 |
| Female | 630 (44.4%) | $47,143 |
| Total | 1,420 (100.0%) | $59,676 |
Earnings by Sex by Income Bracket in Cutchogue
The most common earnings brackets in Cutchogue are $100,000+ for men (326 | 41.3%) and $100,000+ for women (165 | 26.2%).
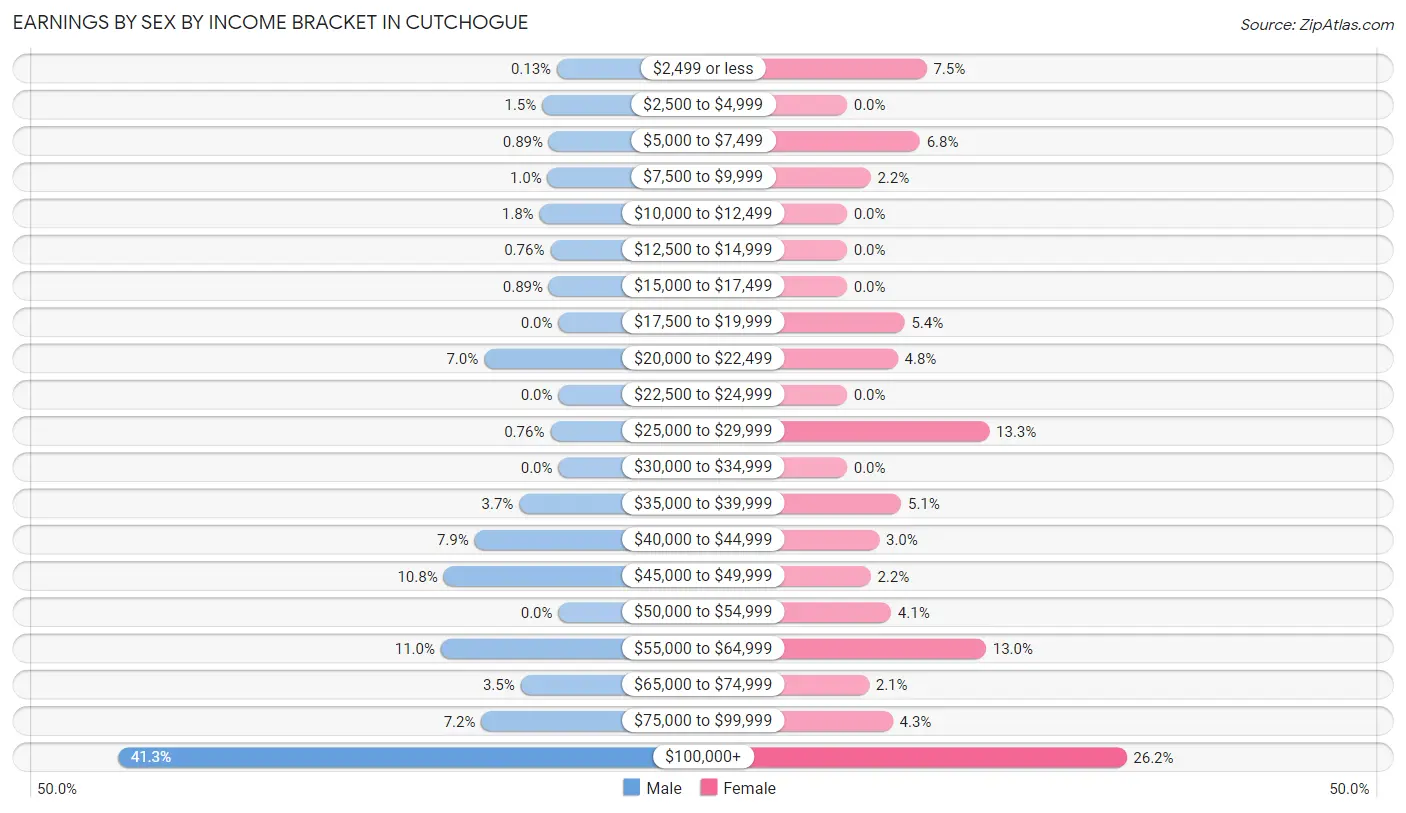
| Income | Male | Female |
| $2,499 or less | 1 (0.1%) | 47 (7.5%) |
| $2,500 to $4,999 | 12 (1.5%) | 0 (0.0%) |
| $5,000 to $7,499 | 7 (0.9%) | 43 (6.8%) |
| $7,500 to $9,999 | 8 (1.0%) | 14 (2.2%) |
| $10,000 to $12,499 | 14 (1.8%) | 0 (0.0%) |
| $12,500 to $14,999 | 6 (0.8%) | 0 (0.0%) |
| $15,000 to $17,499 | 7 (0.9%) | 0 (0.0%) |
| $17,500 to $19,999 | 0 (0.0%) | 34 (5.4%) |
| $20,000 to $22,499 | 55 (7.0%) | 30 (4.8%) |
| $22,500 to $24,999 | 0 (0.0%) | 0 (0.0%) |
| $25,000 to $29,999 | 6 (0.8%) | 84 (13.3%) |
| $30,000 to $34,999 | 0 (0.0%) | 0 (0.0%) |
| $35,000 to $39,999 | 29 (3.7%) | 32 (5.1%) |
| $40,000 to $44,999 | 62 (7.9%) | 19 (3.0%) |
| $45,000 to $49,999 | 85 (10.8%) | 14 (2.2%) |
| $50,000 to $54,999 | 0 (0.0%) | 26 (4.1%) |
| $55,000 to $64,999 | 87 (11.0%) | 82 (13.0%) |
| $65,000 to $74,999 | 28 (3.5%) | 13 (2.1%) |
| $75,000 to $99,999 | 57 (7.2%) | 27 (4.3%) |
| $100,000+ | 326 (41.3%) | 165 (26.2%) |
| Total | 790 (100.0%) | 630 (100.0%) |
Earnings by Sex by Educational Attainment in Cutchogue
Average earnings in Cutchogue are $82,188 for men and $47,143 for women, a difference of 42.6%. Men with an educational attainment of bachelor's degree enjoy the highest average annual earnings of $130,714, while those with less than high school education earn the least with $46,208. Women with an educational attainment of bachelor's degree earn the most with the average annual earnings of $114,500, while those with college or associate's degree education have the smallest earnings of $26,726.
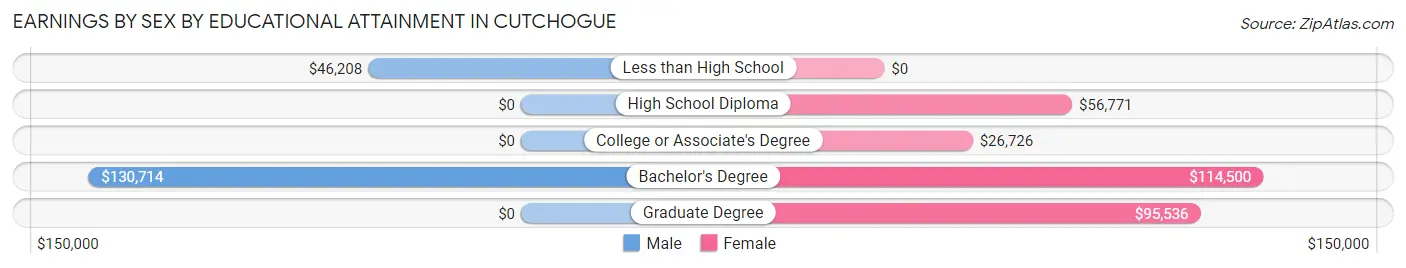
| Educational Attainment | Male Income | Female Income |
| Less than High School | $46,208 | $0 |
| High School Diploma | - | - |
| College or Associate's Degree | - | - |
| Bachelor's Degree | $130,714 | $114,500 |
| Graduate Degree | - | - |
| Total | $82,188 | $47,143 |
Family Income in Cutchogue
Family Income Brackets in Cutchogue
According to the Cutchogue family income data, there are 287 families falling into the $200,000+ income range, which is the most common income bracket and makes up 31.7% of all families.
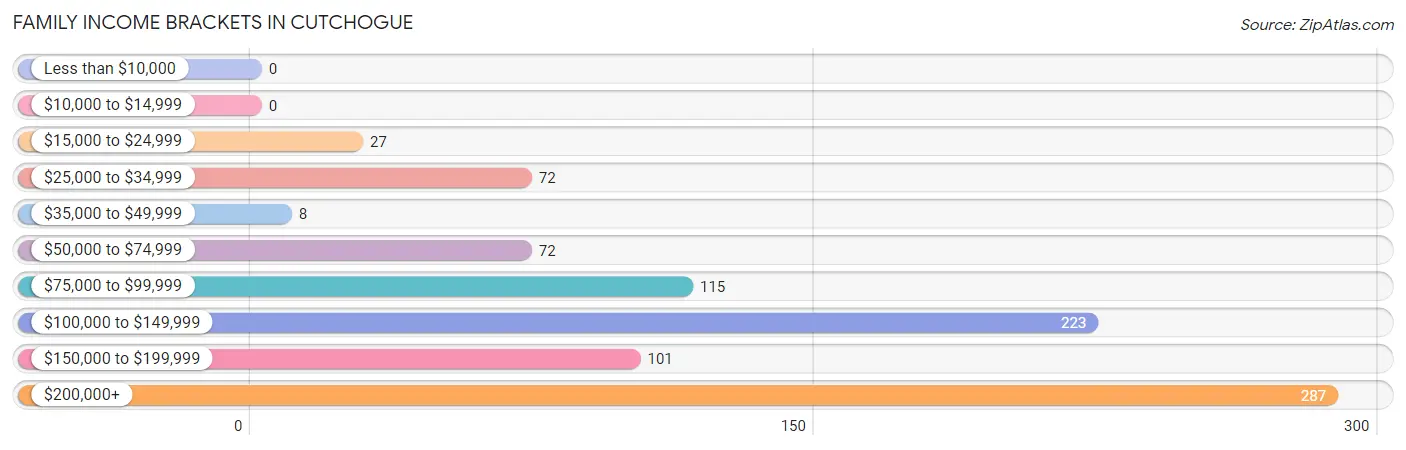
| Income Bracket | # Families | % Families |
| Less than $10,000 | 0 | 0.0% |
| $10,000 to $14,999 | 0 | 0.0% |
| $15,000 to $24,999 | 27 | 3.0% |
| $25,000 to $34,999 | 72 | 8.0% |
| $35,000 to $49,999 | 8 | 0.9% |
| $50,000 to $74,999 | 72 | 8.0% |
| $75,000 to $99,999 | 115 | 12.7% |
| $100,000 to $149,999 | 223 | 24.6% |
| $150,000 to $199,999 | 101 | 11.2% |
| $200,000+ | 287 | 31.7% |
Family Income by Famaliy Size in Cutchogue
4-person families (86 | 9.5%) account for the highest median family income in Cutchogue with $226,324 per family, while 2-person families (586 | 64.7%) have the highest median income of $69,058 per family member.
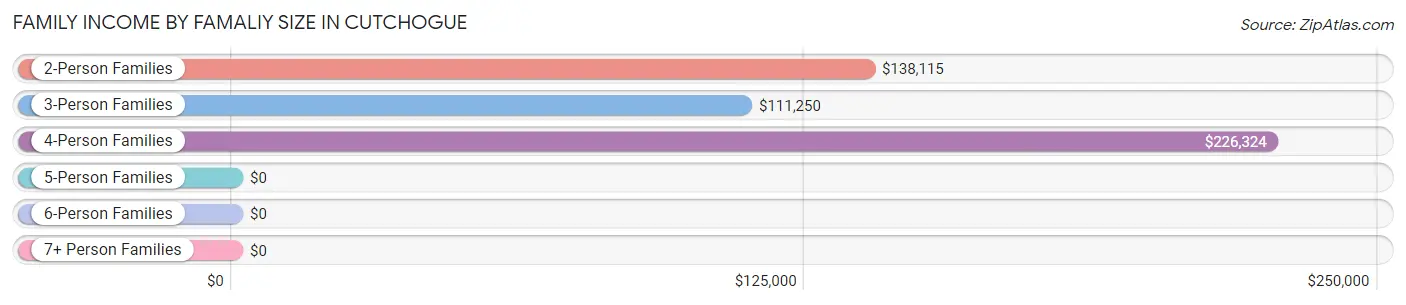
| Income Bracket | # Families | Median Income |
| 2-Person Families | 586 (64.7%) | $138,115 |
| 3-Person Families | 213 (23.5%) | $111,250 |
| 4-Person Families | 86 (9.5%) | $226,324 |
| 5-Person Families | 9 (1.0%) | $0 |
| 6-Person Families | 11 (1.2%) | $0 |
| 7+ Person Families | 0 (0.0%) | $0 |
| Total | 905 (100.0%) | $138,299 |
Family Income by Number of Earners in Cutchogue
The median family income in Cutchogue is $138,299, with families comprising 3+ earners (64) having the highest median family income of $245,568, while families with no earners (240) have the lowest median family income of $82,500, accounting for 7.1% and 26.5% of families, respectively.
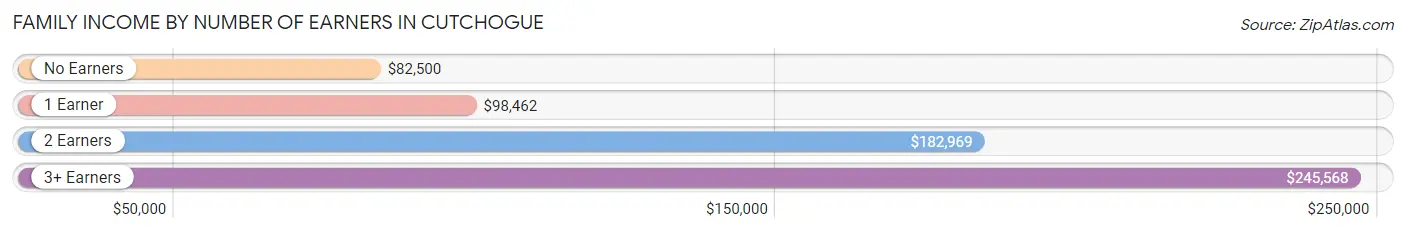
| Number of Earners | # Families | Median Income |
| No Earners | 240 (26.5%) | $82,500 |
| 1 Earner | 230 (25.4%) | $98,462 |
| 2 Earners | 371 (41.0%) | $182,969 |
| 3+ Earners | 64 (7.1%) | $245,568 |
| Total | 905 (100.0%) | $138,299 |
Household Income in Cutchogue
Household Income Brackets in Cutchogue
With 357 households falling in the category, the $200,000+ income range is the most frequent in Cutchogue, accounting for 30.0% of all households.
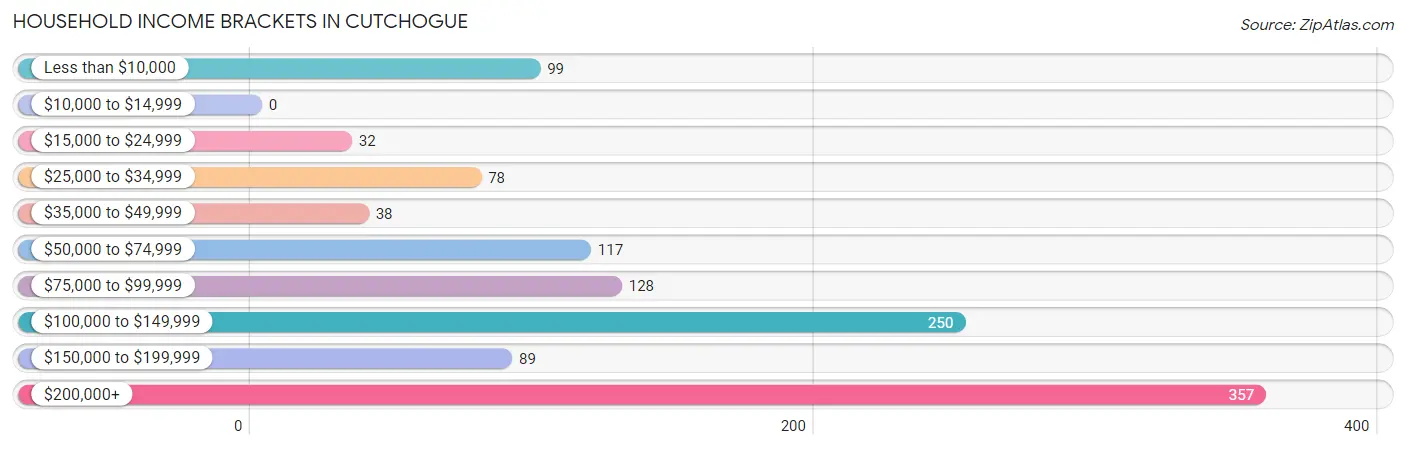
| Income Bracket | # Households | % Households |
| Less than $10,000 | 99 | 8.3% |
| $10,000 to $14,999 | 0 | 0.0% |
| $15,000 to $24,999 | 32 | 2.7% |
| $25,000 to $34,999 | 78 | 6.6% |
| $35,000 to $49,999 | 38 | 3.2% |
| $50,000 to $74,999 | 117 | 9.8% |
| $75,000 to $99,999 | 128 | 10.8% |
| $100,000 to $149,999 | 250 | 21.0% |
| $150,000 to $199,999 | 89 | 7.5% |
| $200,000+ | 357 | 30.0% |
Household Income by Householder Age in Cutchogue
The median household income in Cutchogue is $124,485, with the highest median household income of $139,282 found in the 45 to 64 years age bracket for the primary householder. A total of 409 households (34.4%) fall into this category.
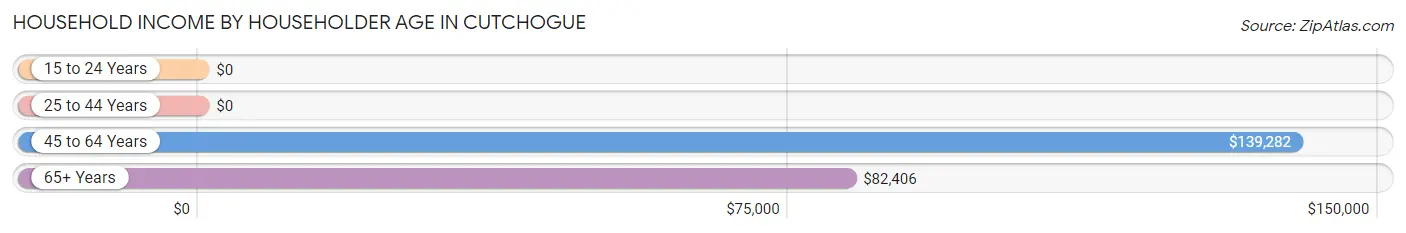
| Income Bracket | # Households | Median Income |
| 15 to 24 Years | 0 (0.0%) | $0 |
| 25 to 44 Years | 165 (13.9%) | $0 |
| 45 to 64 Years | 409 (34.4%) | $139,282 |
| 65+ Years | 615 (51.7%) | $82,406 |
| Total | 1,189 (100.0%) | $124,485 |
Poverty in Cutchogue
Income Below Poverty by Sex and Age in Cutchogue
With 8.3% poverty level for males and 3.0% for females among the residents of Cutchogue, 75 year old and over males and 45 to 54 year old females are the most vulnerable to poverty, with 80 males (36.0%) and 15 females (8.8%) in their respective age groups living below the poverty level.
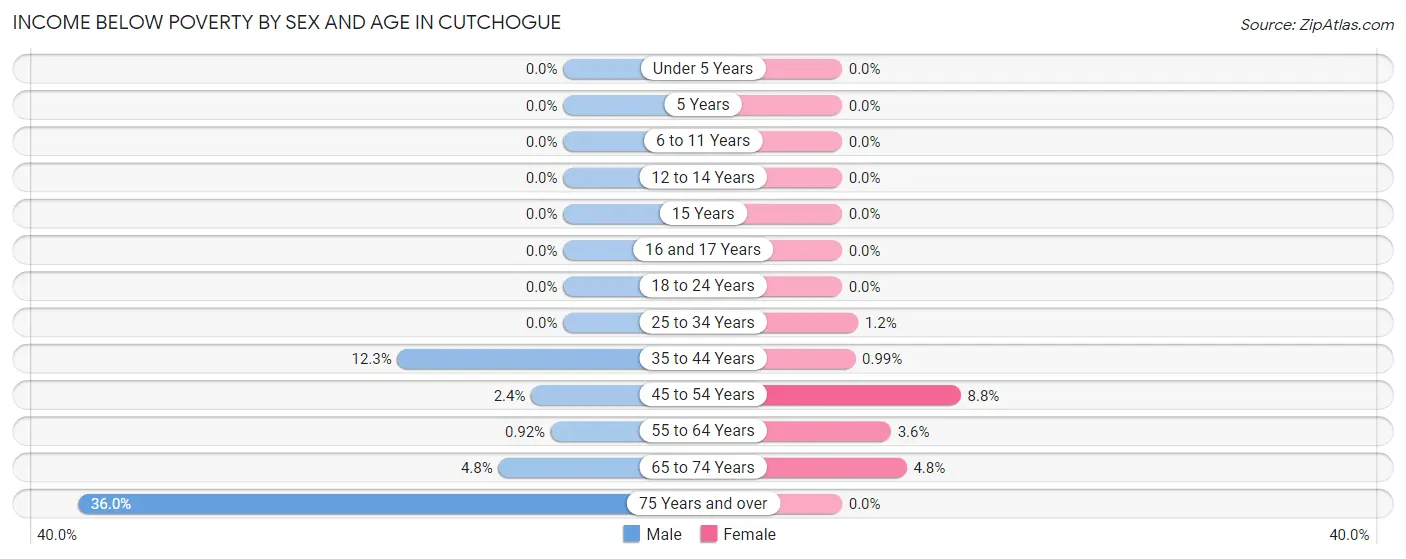
| Age Bracket | Male | Female |
| Under 5 Years | 0 (0.0%) | 0 (0.0%) |
| 5 Years | 0 (0.0%) | 0 (0.0%) |
| 6 to 11 Years | 0 (0.0%) | 0 (0.0%) |
| 12 to 14 Years | 0 (0.0%) | 0 (0.0%) |
| 15 Years | 0 (0.0%) | 0 (0.0%) |
| 16 and 17 Years | 0 (0.0%) | 0 (0.0%) |
| 18 to 24 Years | 0 (0.0%) | 0 (0.0%) |
| 25 to 34 Years | 0 (0.0%) | 1 (1.2%) |
| 35 to 44 Years | 16 (12.3%) | 2 (1.0%) |
| 45 to 54 Years | 3 (2.4%) | 15 (8.8%) |
| 55 to 64 Years | 2 (0.9%) | 9 (3.6%) |
| 65 to 74 Years | 18 (4.8%) | 13 (4.8%) |
| 75 Years and over | 80 (36.0%) | 0 (0.0%) |
| Total | 119 (8.3%) | 40 (3.0%) |
Income Above Poverty by Sex and Age in Cutchogue
According to the poverty statistics in Cutchogue, males aged 5 years and females aged under 5 years are the age groups that are most secure financially, with 100.0% of males and 100.0% of females in these age groups living above the poverty line.
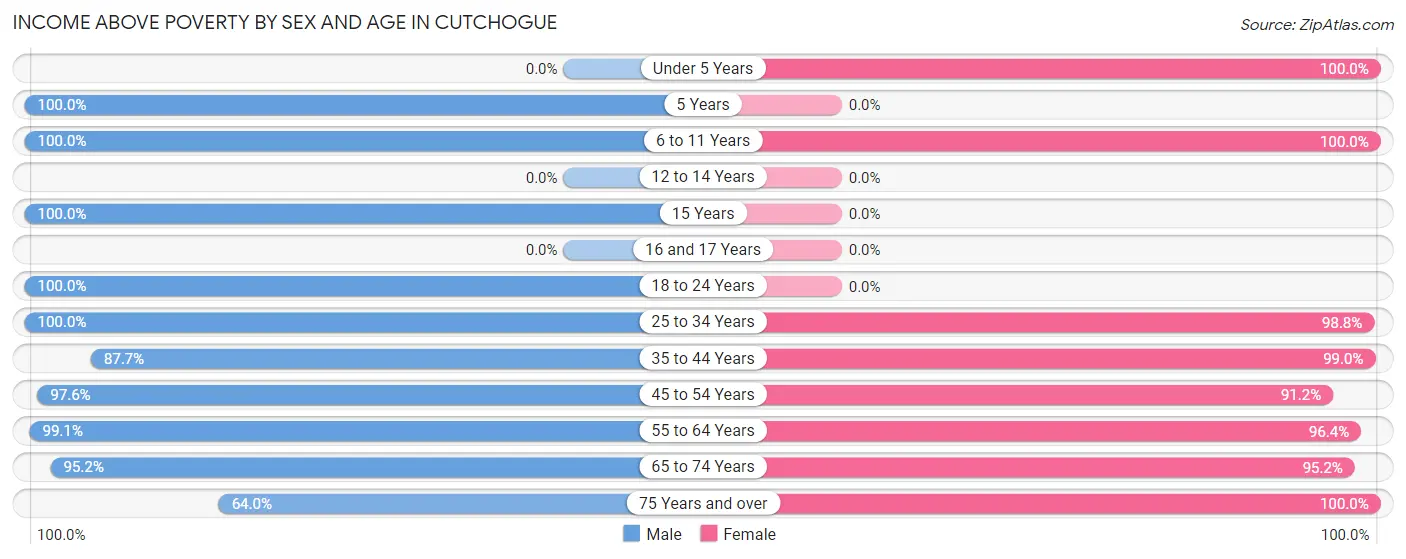
| Age Bracket | Male | Female |
| Under 5 Years | 0 (0.0%) | 43 (100.0%) |
| 5 Years | 20 (100.0%) | 0 (0.0%) |
| 6 to 11 Years | 119 (100.0%) | 107 (100.0%) |
| 12 to 14 Years | 0 (0.0%) | 0 (0.0%) |
| 15 Years | 17 (100.0%) | 0 (0.0%) |
| 16 and 17 Years | 0 (0.0%) | 0 (0.0%) |
| 18 to 24 Years | 59 (100.0%) | 0 (0.0%) |
| 25 to 34 Years | 153 (100.0%) | 82 (98.8%) |
| 35 to 44 Years | 114 (87.7%) | 200 (99.0%) |
| 45 to 54 Years | 123 (97.6%) | 155 (91.2%) |
| 55 to 64 Years | 216 (99.1%) | 239 (96.4%) |
| 65 to 74 Years | 356 (95.2%) | 258 (95.2%) |
| 75 Years and over | 142 (64.0%) | 186 (100.0%) |
| Total | 1,319 (91.7%) | 1,270 (97.0%) |
Income Below Poverty Among Married-Couple Families in Cutchogue
The poverty statistics for married-couple families in Cutchogue show that 1.6% or 13 of the total 795 families live below the poverty line. Families with no children have the highest poverty rate of 1.9%, comprising of 13 families. On the other hand, families with 1 or 2 children have the lowest poverty rate of 0.0%, which includes 0 families.
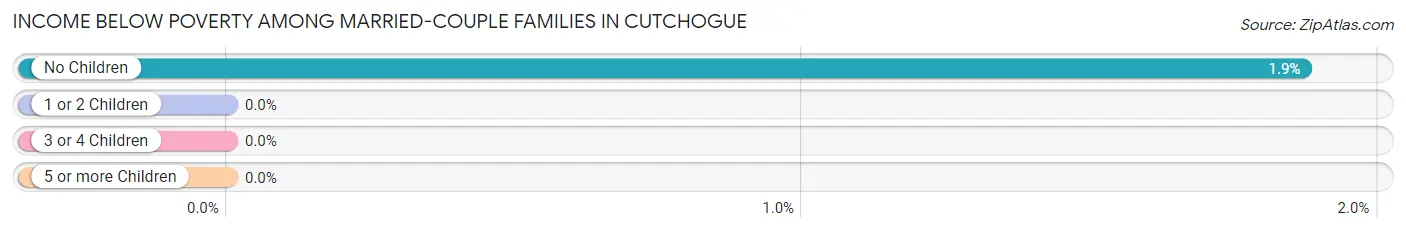
| Children | Above Poverty | Below Poverty |
| No Children | 683 (98.1%) | 13 (1.9%) |
| 1 or 2 Children | 99 (100.0%) | 0 (0.0%) |
| 3 or 4 Children | 0 (0.0%) | 0 (0.0%) |
| 5 or more Children | 0 (0.0%) | 0 (0.0%) |
| Total | 782 (98.4%) | 13 (1.6%) |
Income Below Poverty Among Single-Parent Households in Cutchogue
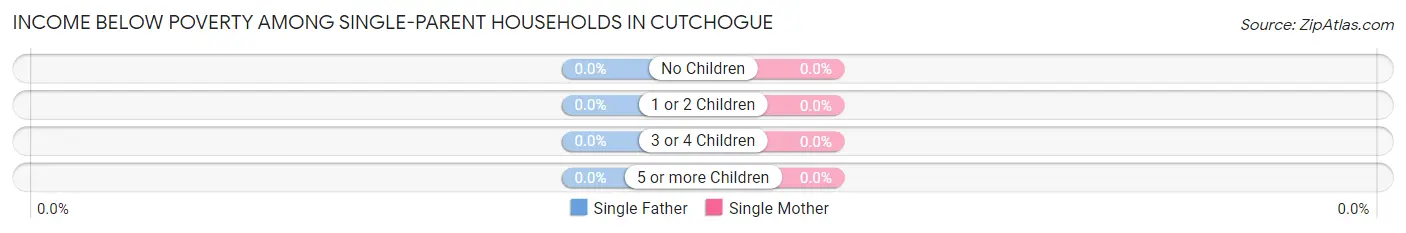
| Children | Single Father | Single Mother |
| No Children | 0 (0.0%) | 0 (0.0%) |
| 1 or 2 Children | 0 (0.0%) | 0 (0.0%) |
| 3 or 4 Children | 0 (0.0%) | 0 (0.0%) |
| 5 or more Children | 0 (0.0%) | 0 (0.0%) |
| Total | 0 (0.0%) | 0 (0.0%) |
Income Below Poverty Among Married-Couple vs Single-Parent Households in Cutchogue
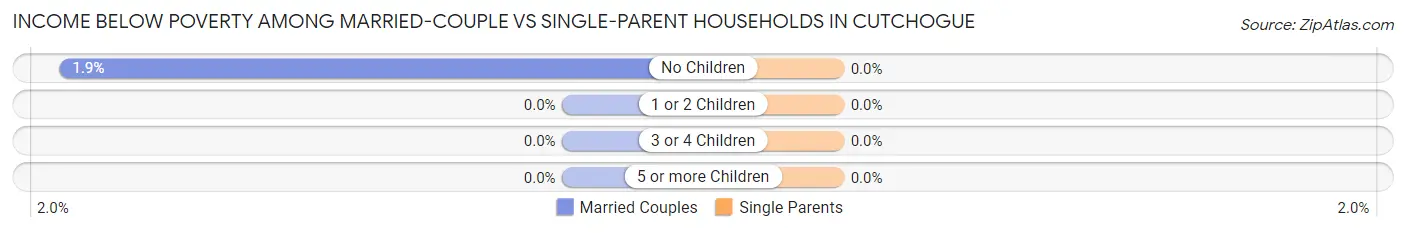
| Children | Married-Couple Families | Single-Parent Households |
| No Children | 13 (1.9%) | 0 (0.0%) |
| 1 or 2 Children | 0 (0.0%) | 0 (0.0%) |
| 3 or 4 Children | 0 (0.0%) | 0 (0.0%) |
| 5 or more Children | 0 (0.0%) | 0 (0.0%) |
| Total | 13 (1.6%) | 0 (0.0%) |
Employment Characteristics in Cutchogue
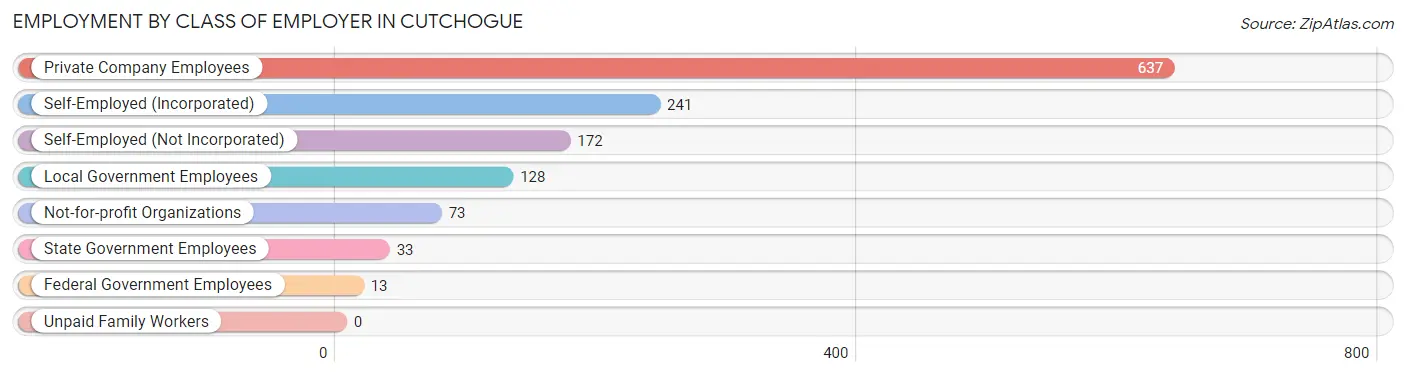
Employment by Class of Employer in Cutchogue
Among the 1,297 employed individuals in Cutchogue, private company employees (637 | 49.1%), self-employed (incorporated) (241 | 18.6%), and self-employed (not incorporated) (172 | 13.3%) make up the most common classes of employment.
| Employer Class | # Employees | % Employees |
| Private Company Employees | 637 | 49.1% |
| Self-Employed (Incorporated) | 241 | 18.6% |
| Self-Employed (Not Incorporated) | 172 | 13.3% |
| Not-for-profit Organizations | 73 | 5.6% |
| Local Government Employees | 128 | 9.9% |
| State Government Employees | 33 | 2.5% |
| Federal Government Employees | 13 | 1.0% |
| Unpaid Family Workers | 0 | 0.0% |
| Total | 1,297 | 100.0% |
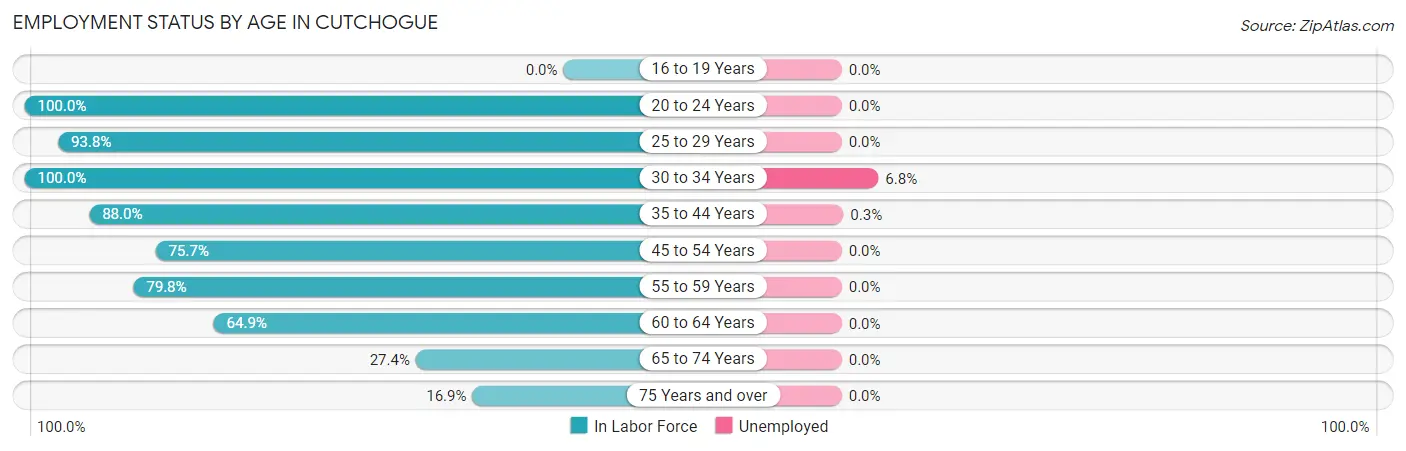
Employment Status by Age in Cutchogue
According to the labor force statistics for Cutchogue, out of the total population over 16 years of age (2,442), 56.4% or 1,377 individuals are in the labor force, with 1.2% or 17 of them unemployed. The age group with the highest labor force participation rate is 20 to 24 years, with 100.0% or 59 individuals in the labor force. Within the labor force, the 30 to 34 years age range has the highest percentage of unemployed individuals, with 6.8% or 15 of them being unemployed.
| Age Bracket | In Labor Force | Unemployed |
| 16 to 19 Years | 0 (0.0%) | 0 (0.0%) |
| 20 to 24 Years | 59 (100.0%) | 0 (0.0%) |
| 25 to 29 Years | 15 (93.8%) | 0 (0.0%) |
| 30 to 34 Years | 220 (100.0%) | 15 (6.8%) |
| 35 to 44 Years | 292 (88.0%) | 1 (0.3%) |
| 45 to 54 Years | 224 (75.7%) | 0 (0.0%) |
| 55 to 59 Years | 99 (79.8%) | 0 (0.0%) |
| 60 to 64 Years | 222 (64.9%) | 0 (0.0%) |
| 65 to 74 Years | 177 (27.4%) | 0 (0.0%) |
| 75 Years and over | 69 (16.9%) | 0 (0.0%) |
| Total | 1,377 (56.4%) | 17 (1.2%) |
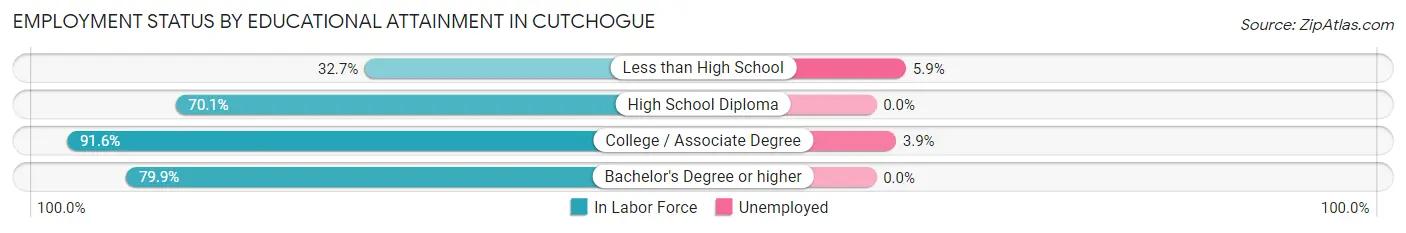
Employment Status by Educational Attainment in Cutchogue
According to labor force statistics for Cutchogue, 80.6% of individuals (1,072) out of the total population between 25 and 64 years of age (1,330) are in the labor force, with 1.5% or 16 of them being unemployed. The group with the highest labor force participation rate are those with the educational attainment of college / associate degree, with 91.6% or 383 individuals in the labor force. Within the labor force, individuals with less than high school education have the highest percentage of unemployment, with 5.9% or 1 of them being unemployed.
| Educational Attainment | In Labor Force | Unemployed |
| Less than High School | 17 (32.7%) | 3 (5.9%) |
| High School Diploma | 110 (70.1%) | 0 (0.0%) |
| College / Associate Degree | 383 (91.6%) | 16 (3.9%) |
| Bachelor's Degree or higher | 562 (79.9%) | 0 (0.0%) |
| Total | 1,072 (80.6%) | 20 (1.5%) |
Employment Occupations by Sex in Cutchogue
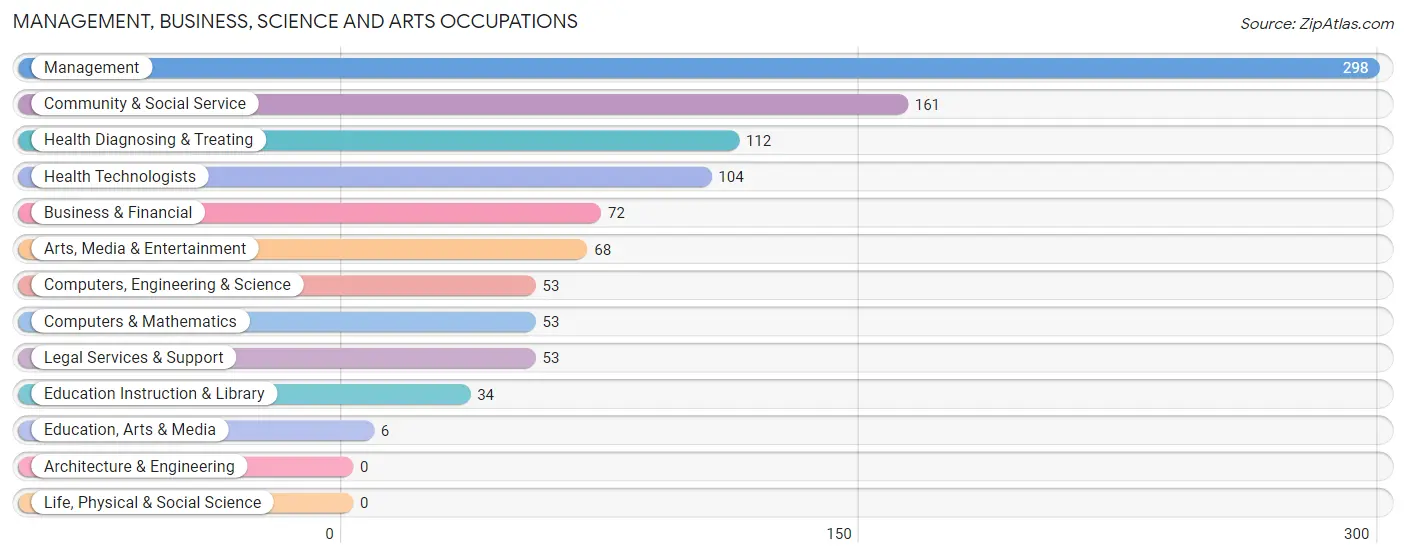
Management, Business, Science and Arts Occupations
The most common Management, Business, Science and Arts occupations in Cutchogue are Management (298 | 21.9%), Community & Social Service (161 | 11.8%), Health Diagnosing & Treating (112 | 8.2%), Health Technologists (104 | 7.6%), and Business & Financial (72 | 5.3%).
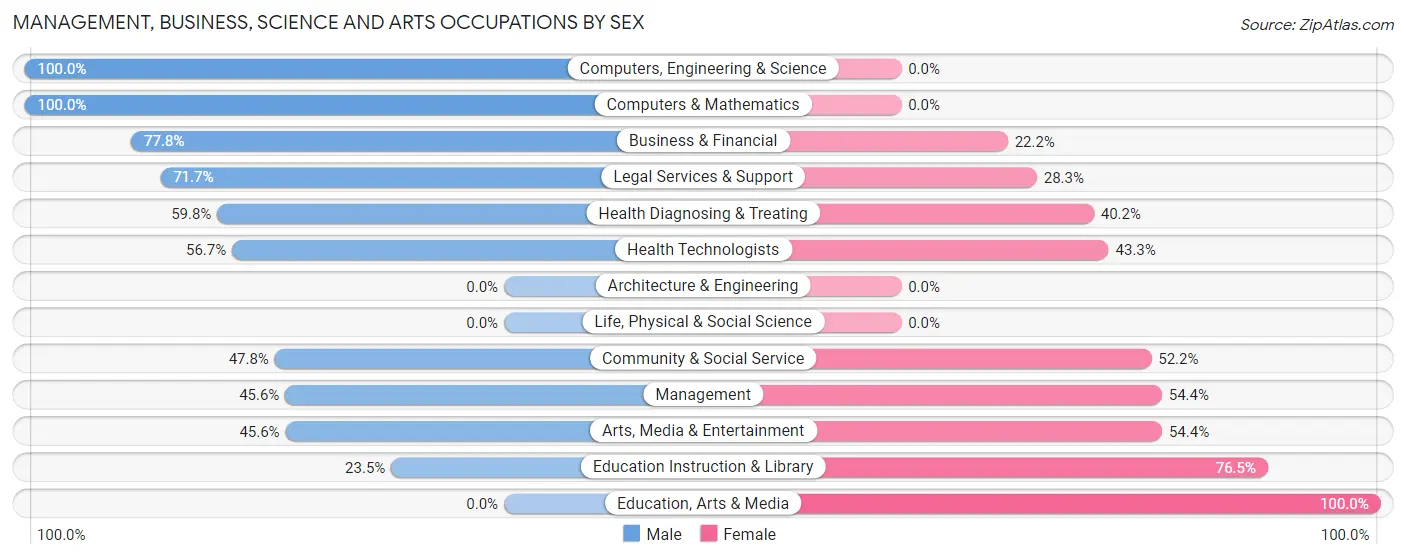
Management, Business, Science and Arts Occupations by Sex
Within the Management, Business, Science and Arts occupations in Cutchogue, the most male-oriented occupations are Computers, Engineering & Science (100.0%), Computers & Mathematics (100.0%), and Business & Financial (77.8%), while the most female-oriented occupations are Education, Arts & Media (100.0%), Education Instruction & Library (76.5%), and Arts, Media & Entertainment (54.4%).
| Occupation | Male | Female |
| Management | 136 (45.6%) | 162 (54.4%) |
| Business & Financial | 56 (77.8%) | 16 (22.2%) |
| Computers, Engineering & Science | 53 (100.0%) | 0 (0.0%) |
| Computers & Mathematics | 53 (100.0%) | 0 (0.0%) |
| Architecture & Engineering | 0 (0.0%) | 0 (0.0%) |
| Life, Physical & Social Science | 0 (0.0%) | 0 (0.0%) |
| Community & Social Service | 77 (47.8%) | 84 (52.2%) |
| Education, Arts & Media | 0 (0.0%) | 6 (100.0%) |
| Legal Services & Support | 38 (71.7%) | 15 (28.3%) |
| Education Instruction & Library | 8 (23.5%) | 26 (76.5%) |
| Arts, Media & Entertainment | 31 (45.6%) | 37 (54.4%) |
| Health Diagnosing & Treating | 67 (59.8%) | 45 (40.2%) |
| Health Technologists | 59 (56.7%) | 45 (43.3%) |
| Total (Category) | 389 (55.9%) | 307 (44.1%) |
| Total (Overall) | 766 (56.3%) | 595 (43.7%) |
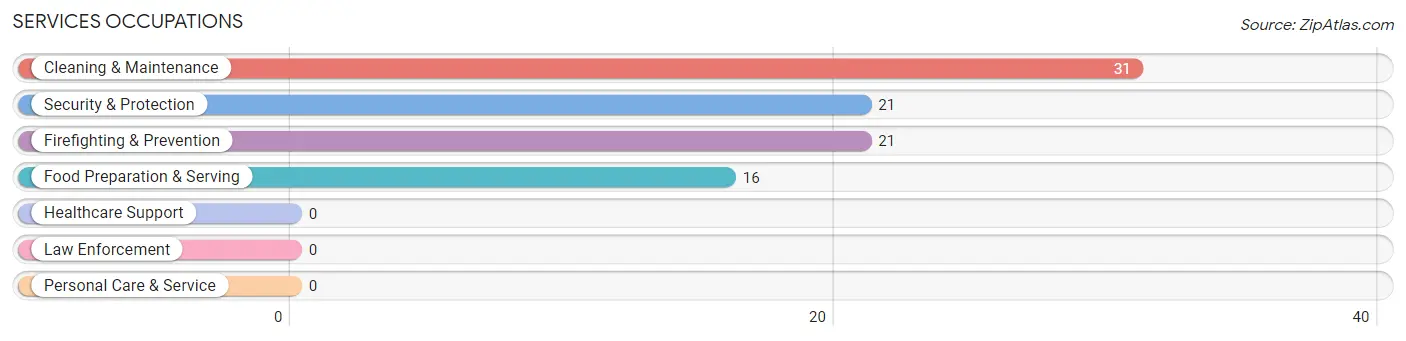
Services Occupations
The most common Services occupations in Cutchogue are Cleaning & Maintenance (31 | 2.3%), Security & Protection (21 | 1.5%), Firefighting & Prevention (21 | 1.5%), and Food Preparation & Serving (16 | 1.2%).
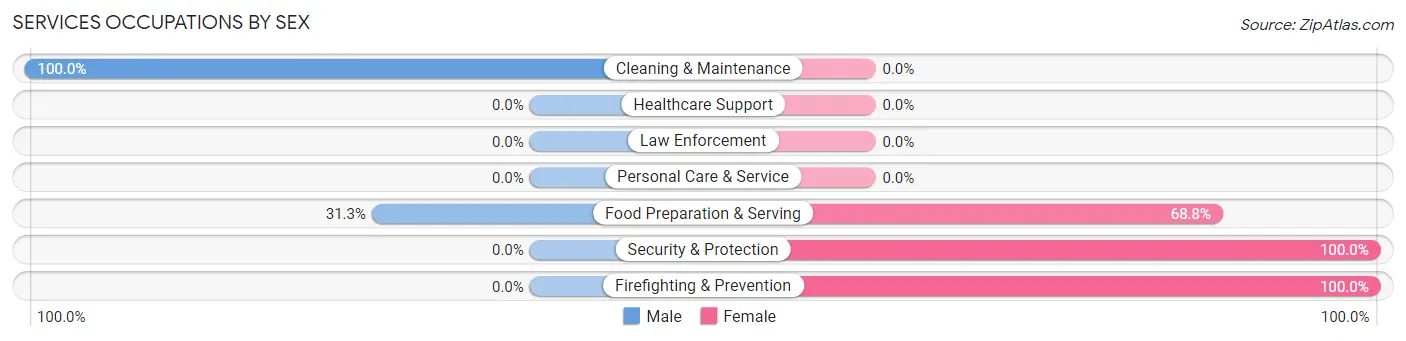
Services Occupations by Sex
Within the Services occupations in Cutchogue, the most male-oriented occupations are Cleaning & Maintenance (100.0%), and Food Preparation & Serving (31.2%), while the most female-oriented occupations are Security & Protection (100.0%), Firefighting & Prevention (100.0%), and Food Preparation & Serving (68.8%).
| Occupation | Male | Female |
| Healthcare Support | 0 (0.0%) | 0 (0.0%) |
| Security & Protection | 0 (0.0%) | 21 (100.0%) |
| Firefighting & Prevention | 0 (0.0%) | 21 (100.0%) |
| Law Enforcement | 0 (0.0%) | 0 (0.0%) |
| Food Preparation & Serving | 5 (31.2%) | 11 (68.8%) |
| Cleaning & Maintenance | 31 (100.0%) | 0 (0.0%) |
| Personal Care & Service | 0 (0.0%) | 0 (0.0%) |
| Total (Category) | 36 (52.9%) | 32 (47.1%) |
| Total (Overall) | 766 (56.3%) | 595 (43.7%) |
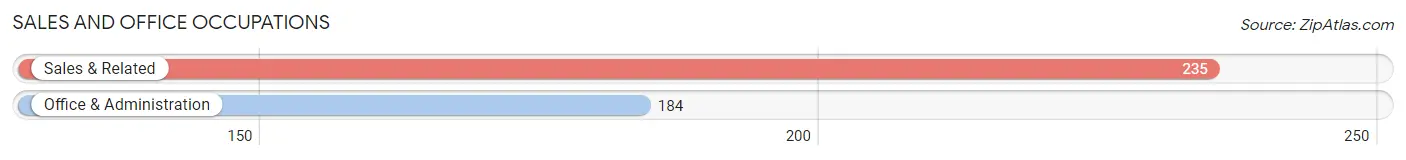
Sales and Office Occupations
The most common Sales and Office occupations in Cutchogue are Sales & Related (235 | 17.3%), and Office & Administration (184 | 13.5%).
Sales and Office Occupations by Sex
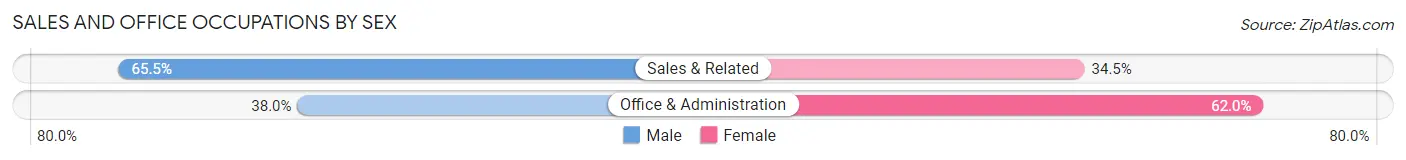
| Occupation | Male | Female |
| Sales & Related | 154 (65.5%) | 81 (34.5%) |
| Office & Administration | 70 (38.0%) | 114 (62.0%) |
| Total (Category) | 224 (53.5%) | 195 (46.5%) |
| Total (Overall) | 766 (56.3%) | 595 (43.7%) |
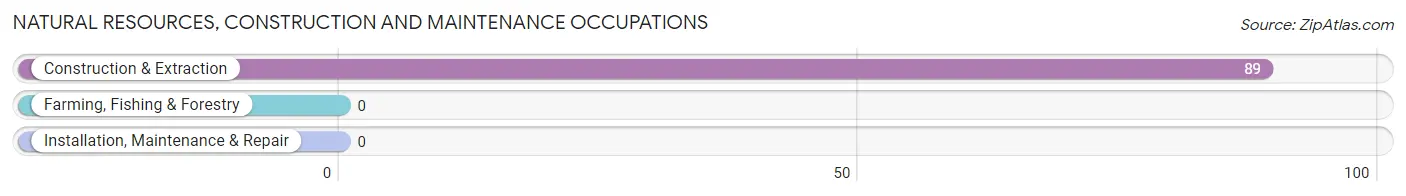
Natural Resources, Construction and Maintenance Occupations
The most common Natural Resources, Construction and Maintenance occupations in Cutchogue are , and Construction & Extraction (89 | 6.5%).
Natural Resources, Construction and Maintenance Occupations by Sex
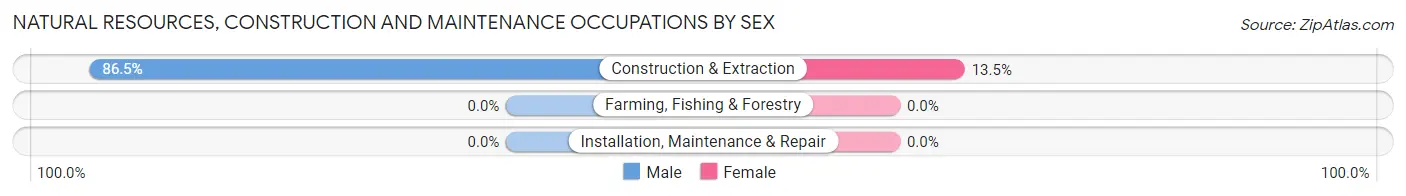
| Occupation | Male | Female |
| Farming, Fishing & Forestry | 0 (0.0%) | 0 (0.0%) |
| Construction & Extraction | 77 (86.5%) | 12 (13.5%) |
| Installation, Maintenance & Repair | 0 (0.0%) | 0 (0.0%) |
| Total (Category) | 77 (86.5%) | 12 (13.5%) |
| Total (Overall) | 766 (56.3%) | 595 (43.7%) |
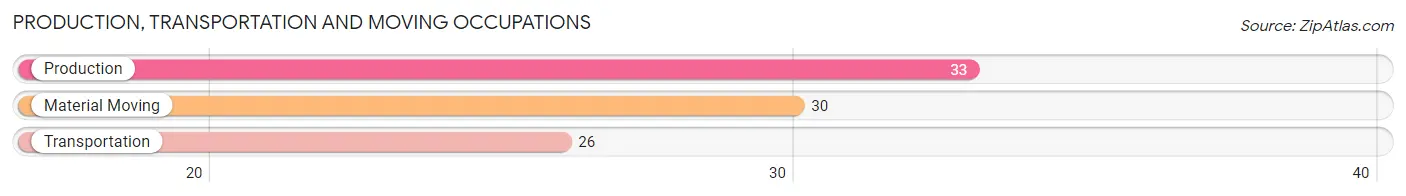
Production, Transportation and Moving Occupations
The most common Production, Transportation and Moving occupations in Cutchogue are Production (33 | 2.4%), Material Moving (30 | 2.2%), and Transportation (26 | 1.9%).
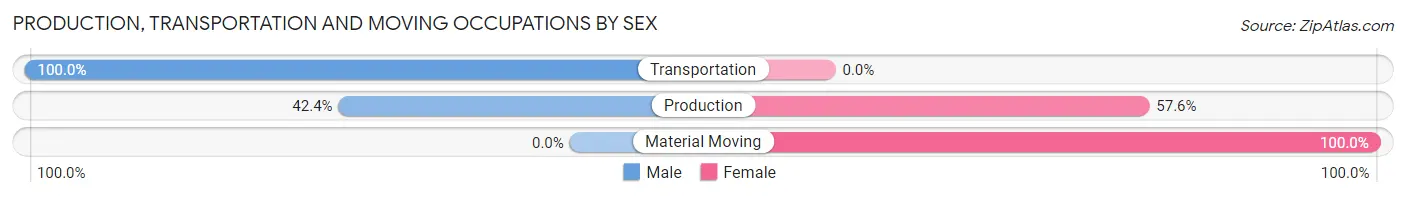
Production, Transportation and Moving Occupations by Sex
| Occupation | Male | Female |
| Production | 14 (42.4%) | 19 (57.6%) |
| Transportation | 26 (100.0%) | 0 (0.0%) |
| Material Moving | 0 (0.0%) | 30 (100.0%) |
| Total (Category) | 40 (44.9%) | 49 (55.1%) |
| Total (Overall) | 766 (56.3%) | 595 (43.7%) |
Employment Industries by Sex in Cutchogue
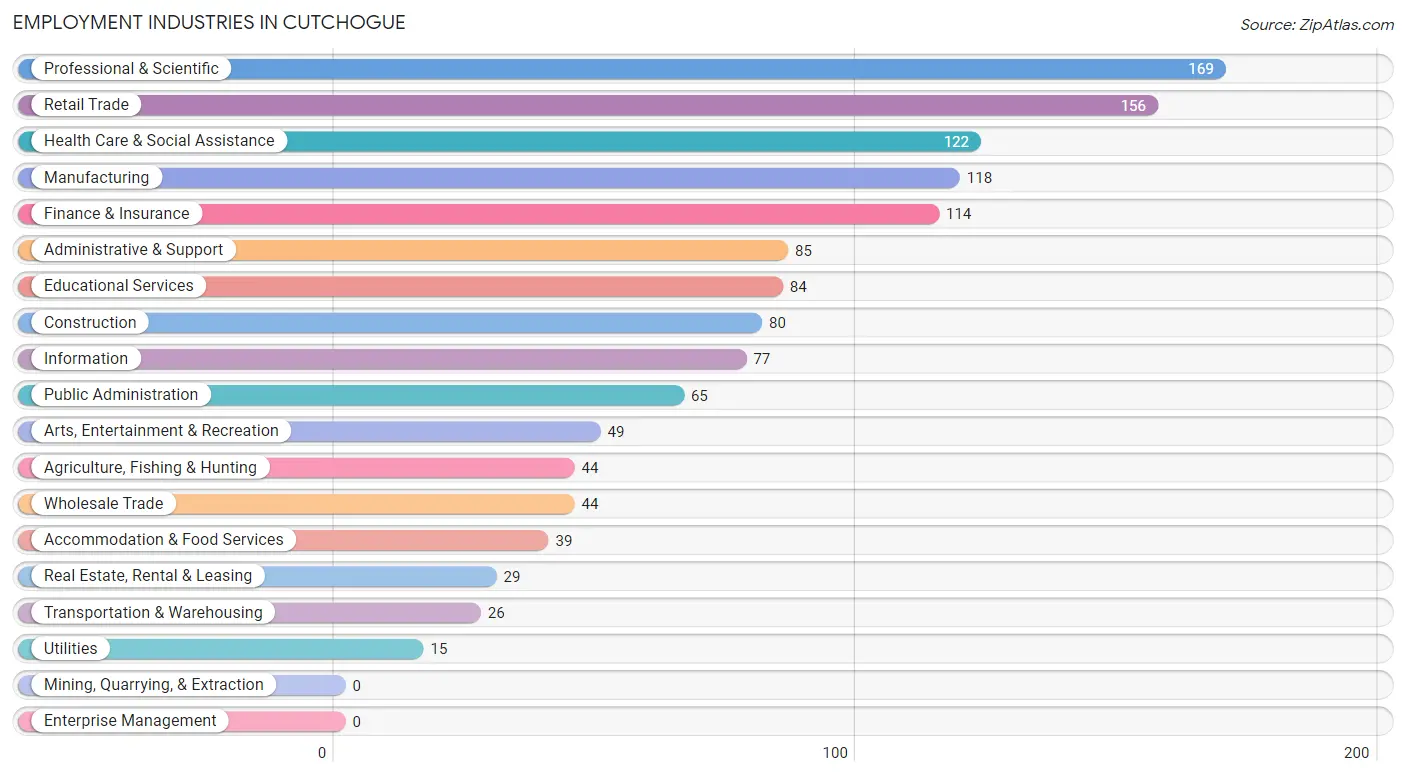
Employment Industries in Cutchogue
The major employment industries in Cutchogue include Professional & Scientific (169 | 12.4%), Retail Trade (156 | 11.5%), Health Care & Social Assistance (122 | 9.0%), Manufacturing (118 | 8.7%), and Finance & Insurance (114 | 8.4%).
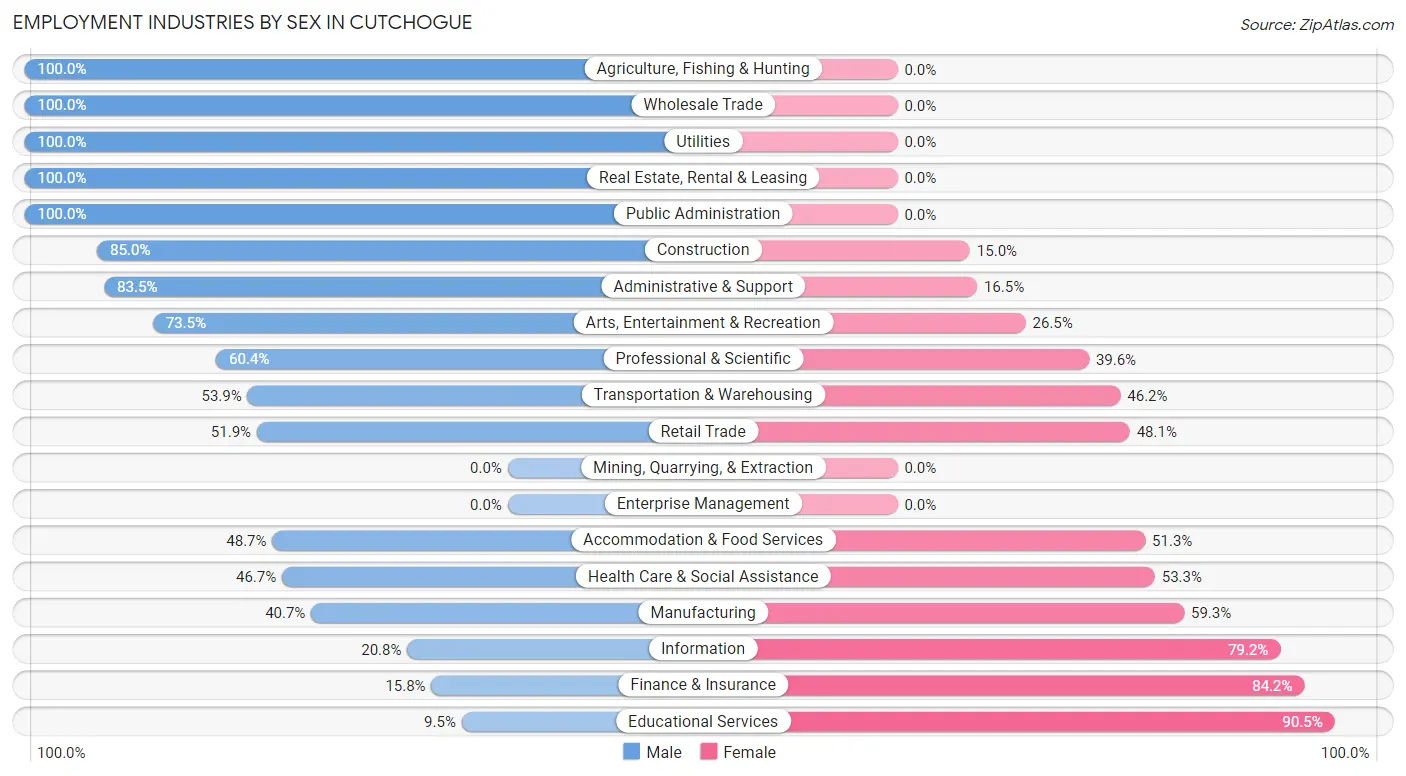
Employment Industries by Sex in Cutchogue
The Cutchogue industries that see more men than women are Agriculture, Fishing & Hunting (100.0%), Wholesale Trade (100.0%), and Utilities (100.0%), whereas the industries that tend to have a higher number of women are Educational Services (90.5%), Finance & Insurance (84.2%), and Information (79.2%).
| Industry | Male | Female |
| Agriculture, Fishing & Hunting | 44 (100.0%) | 0 (0.0%) |
| Mining, Quarrying, & Extraction | 0 (0.0%) | 0 (0.0%) |
| Construction | 68 (85.0%) | 12 (15.0%) |
| Manufacturing | 48 (40.7%) | 70 (59.3%) |
| Wholesale Trade | 44 (100.0%) | 0 (0.0%) |
| Retail Trade | 81 (51.9%) | 75 (48.1%) |
| Transportation & Warehousing | 14 (53.8%) | 12 (46.2%) |
| Utilities | 15 (100.0%) | 0 (0.0%) |
| Information | 16 (20.8%) | 61 (79.2%) |
| Finance & Insurance | 18 (15.8%) | 96 (84.2%) |
| Real Estate, Rental & Leasing | 29 (100.0%) | 0 (0.0%) |
| Professional & Scientific | 102 (60.4%) | 67 (39.6%) |
| Enterprise Management | 0 (0.0%) | 0 (0.0%) |
| Administrative & Support | 71 (83.5%) | 14 (16.5%) |
| Educational Services | 8 (9.5%) | 76 (90.5%) |
| Health Care & Social Assistance | 57 (46.7%) | 65 (53.3%) |
| Arts, Entertainment & Recreation | 36 (73.5%) | 13 (26.5%) |
| Accommodation & Food Services | 19 (48.7%) | 20 (51.3%) |
| Public Administration | 65 (100.0%) | 0 (0.0%) |
| Total | 766 (56.3%) | 595 (43.7%) |
Education in Cutchogue
School Enrollment in Cutchogue
The most common levels of schooling among the 408 students in Cutchogue are elementary school (135 | 33.1%), middle school (104 | 25.5%), and graduate / professional (62 | 15.2%).
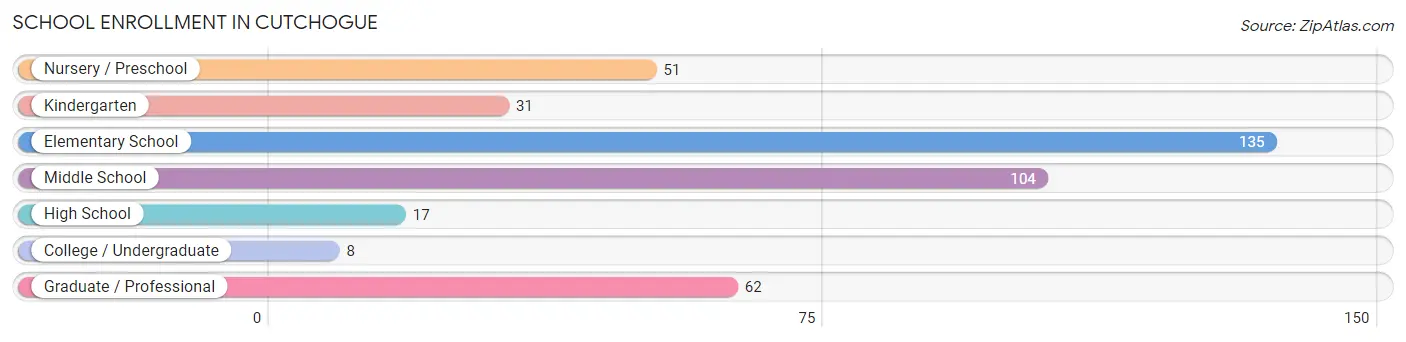
| School Level | # Students | % Students |
| Nursery / Preschool | 51 | 12.5% |
| Kindergarten | 31 | 7.6% |
| Elementary School | 135 | 33.1% |
| Middle School | 104 | 25.5% |
| High School | 17 | 4.2% |
| College / Undergraduate | 8 | 2.0% |
| Graduate / Professional | 62 | 15.2% |
| Total | 408 | 100.0% |
School Enrollment by Age by Funding Source in Cutchogue
Out of a total of 408 students who are enrolled in schools in Cutchogue, 101 (24.8%) attend a private institution, while the remaining 307 (75.2%) are enrolled in public schools. The age group of 35 years and over has the highest likelihood of being enrolled in private schools, with 35 (100.0% in the age bracket) enrolled. Conversely, the age group of 15 to 17 year olds has the lowest likelihood of being enrolled in a private school, with 17 (100.0% in the age bracket) attending a public institution.
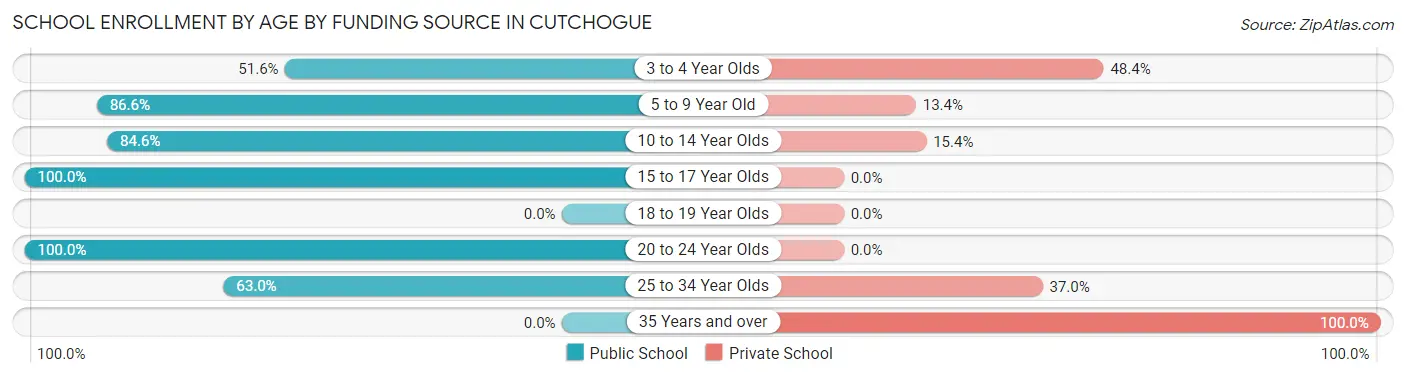
| Age Bracket | Public School | Private School |
| 3 to 4 Year Olds | 16 (51.6%) | 15 (48.4%) |
| 5 to 9 Year Old | 161 (86.6%) | 25 (13.4%) |
| 10 to 14 Year Olds | 88 (84.6%) | 16 (15.4%) |
| 15 to 17 Year Olds | 17 (100.0%) | 0 (0.0%) |
| 18 to 19 Year Olds | 0 (0.0%) | 0 (0.0%) |
| 20 to 24 Year Olds | 8 (100.0%) | 0 (0.0%) |
| 25 to 34 Year Olds | 17 (63.0%) | 10 (37.0%) |
| 35 Years and over | 0 (0.0%) | 35 (100.0%) |
| Total | 307 (75.2%) | 101 (24.8%) |
Educational Attainment by Field of Study in Cutchogue
Business (250 | 18.4%), literature & languages (173 | 12.8%), social sciences (141 | 10.4%), science & technology (128 | 9.4%), and education (105 | 7.7%) are the most common fields of study among 1,357 individuals in Cutchogue who have obtained a bachelor's degree or higher.
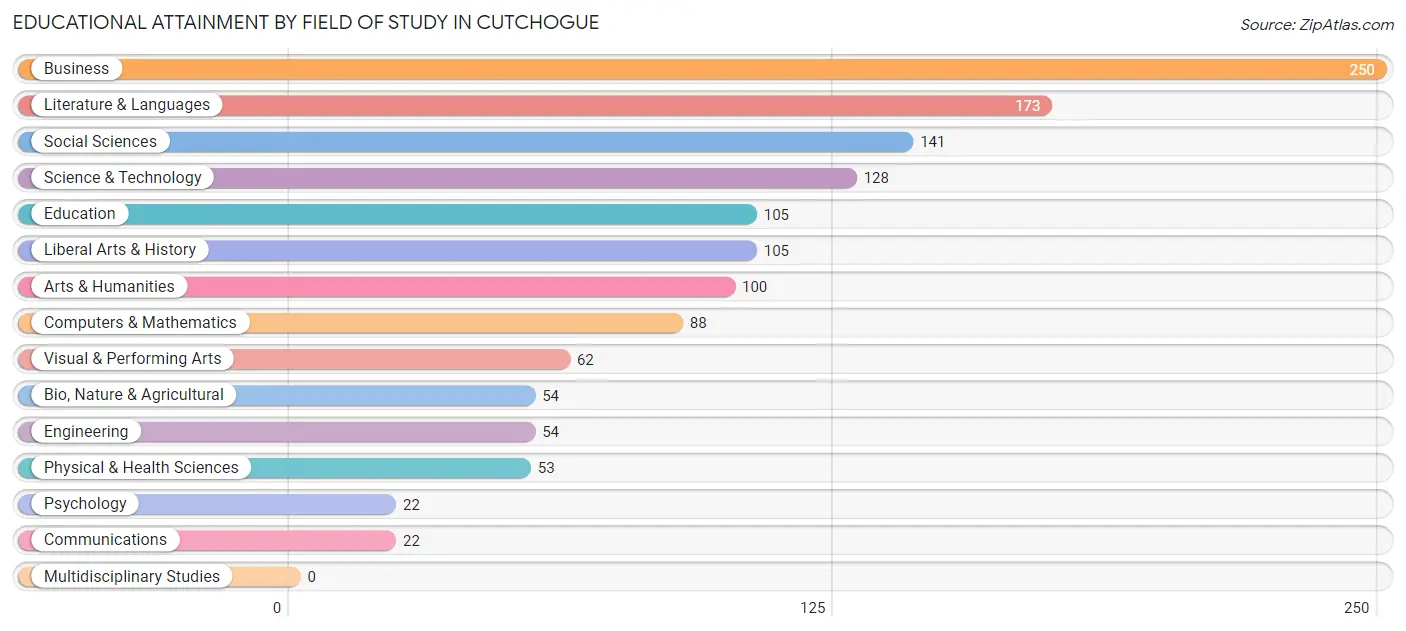
| Field of Study | # Graduates | % Graduates |
| Computers & Mathematics | 88 | 6.5% |
| Bio, Nature & Agricultural | 54 | 4.0% |
| Physical & Health Sciences | 53 | 3.9% |
| Psychology | 22 | 1.6% |
| Social Sciences | 141 | 10.4% |
| Engineering | 54 | 4.0% |
| Multidisciplinary Studies | 0 | 0.0% |
| Science & Technology | 128 | 9.4% |
| Business | 250 | 18.4% |
| Education | 105 | 7.7% |
| Literature & Languages | 173 | 12.8% |
| Liberal Arts & History | 105 | 7.7% |
| Visual & Performing Arts | 62 | 4.6% |
| Communications | 22 | 1.6% |
| Arts & Humanities | 100 | 7.4% |
| Total | 1,357 | 100.0% |
Transportation & Commute in Cutchogue
Vehicle Availability by Sex in Cutchogue
The most prevalent vehicle ownership categories in Cutchogue are males with 2 vehicles (270, accounting for 39.0%) and females with 2 vehicles (222, making up 46.3%).
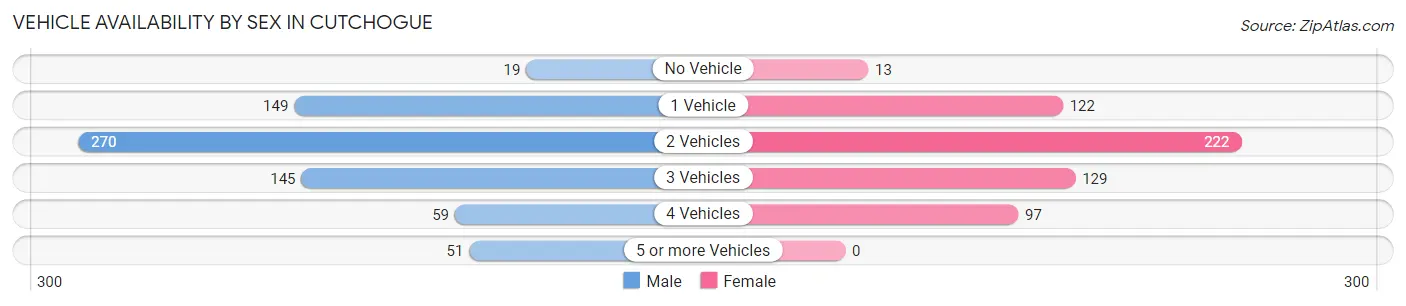
| Vehicles Available | Male | Female |
| No Vehicle | 19 (2.7%) | 13 (2.2%) |
| 1 Vehicle | 149 (21.5%) | 122 (20.9%) |
| 2 Vehicles | 270 (39.0%) | 222 (38.1%) |
| 3 Vehicles | 145 (20.9%) | 129 (22.1%) |
| 4 Vehicles | 59 (8.5%) | 97 (16.6%) |
| 5 or more Vehicles | 51 (7.4%) | 0 (0.0%) |
| Total | 693 (100.0%) | 583 (100.0%) |
Commute Time in Cutchogue
The most frequently occuring commute durations in Cutchogue are 5 to 9 minutes (208 commuters, 22.5%), 45 to 59 minutes (133 commuters, 14.4%), and 10 to 14 minutes (114 commuters, 12.3%).
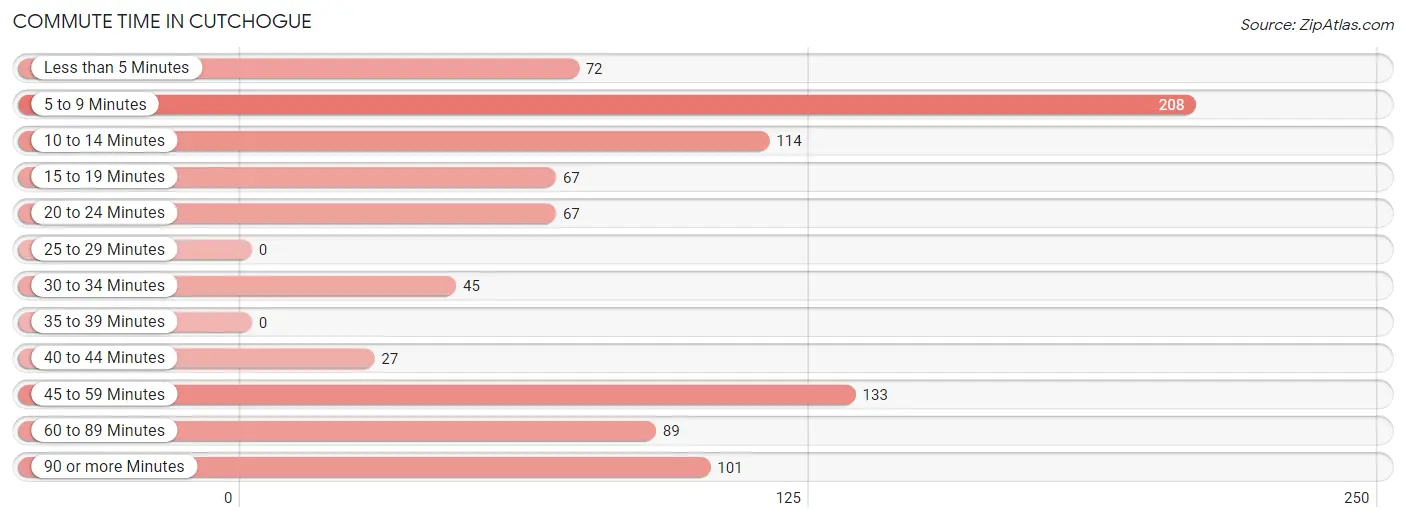
| Commute Time | # Commuters | % Commuters |
| Less than 5 Minutes | 72 | 7.8% |
| 5 to 9 Minutes | 208 | 22.5% |
| 10 to 14 Minutes | 114 | 12.3% |
| 15 to 19 Minutes | 67 | 7.3% |
| 20 to 24 Minutes | 67 | 7.3% |
| 25 to 29 Minutes | 0 | 0.0% |
| 30 to 34 Minutes | 45 | 4.9% |
| 35 to 39 Minutes | 0 | 0.0% |
| 40 to 44 Minutes | 27 | 2.9% |
| 45 to 59 Minutes | 133 | 14.4% |
| 60 to 89 Minutes | 89 | 9.6% |
| 90 or more Minutes | 101 | 10.9% |
Commute Time by Sex in Cutchogue
The most common commute times in Cutchogue are 5 to 9 minutes (101 commuters, 19.8%) for males and 5 to 9 minutes (107 commuters, 26.0%) for females.
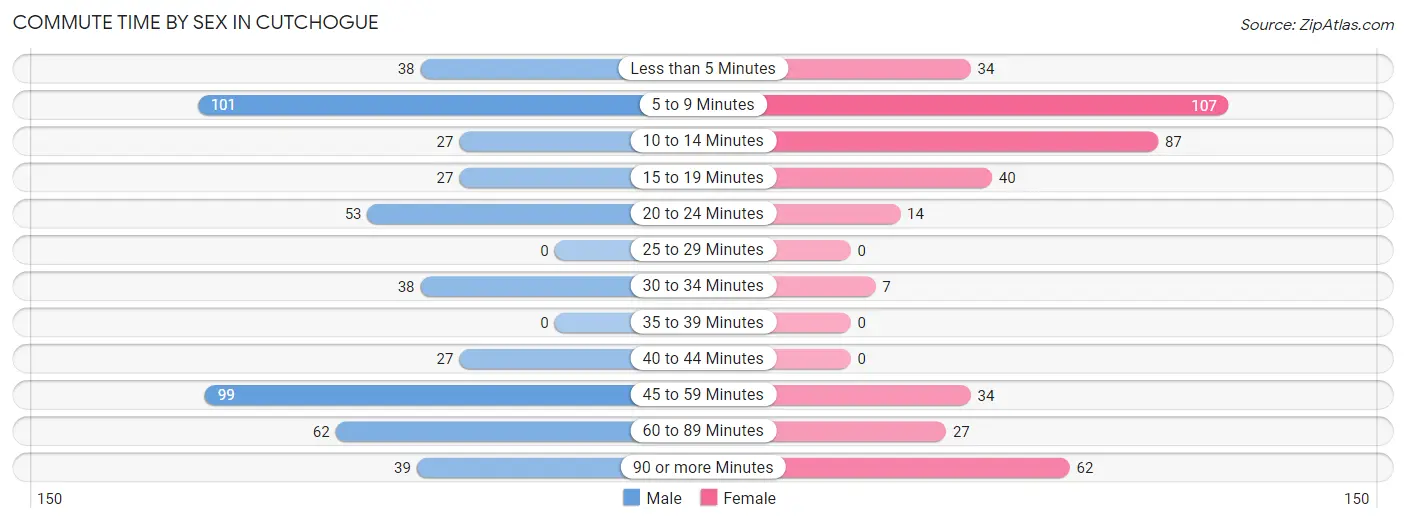
| Commute Time | Male | Female |
| Less than 5 Minutes | 38 (7.4%) | 34 (8.3%) |
| 5 to 9 Minutes | 101 (19.8%) | 107 (26.0%) |
| 10 to 14 Minutes | 27 (5.3%) | 87 (21.1%) |
| 15 to 19 Minutes | 27 (5.3%) | 40 (9.7%) |
| 20 to 24 Minutes | 53 (10.4%) | 14 (3.4%) |
| 25 to 29 Minutes | 0 (0.0%) | 0 (0.0%) |
| 30 to 34 Minutes | 38 (7.4%) | 7 (1.7%) |
| 35 to 39 Minutes | 0 (0.0%) | 0 (0.0%) |
| 40 to 44 Minutes | 27 (5.3%) | 0 (0.0%) |
| 45 to 59 Minutes | 99 (19.4%) | 34 (8.3%) |
| 60 to 89 Minutes | 62 (12.1%) | 27 (6.6%) |
| 90 or more Minutes | 39 (7.6%) | 62 (15.0%) |
Time of Departure to Work by Sex in Cutchogue
The most frequent times of departure to work in Cutchogue are 8:00 AM to 8:29 AM (85, 16.6%) for males and 8:00 AM to 8:29 AM (156, 37.9%) for females.
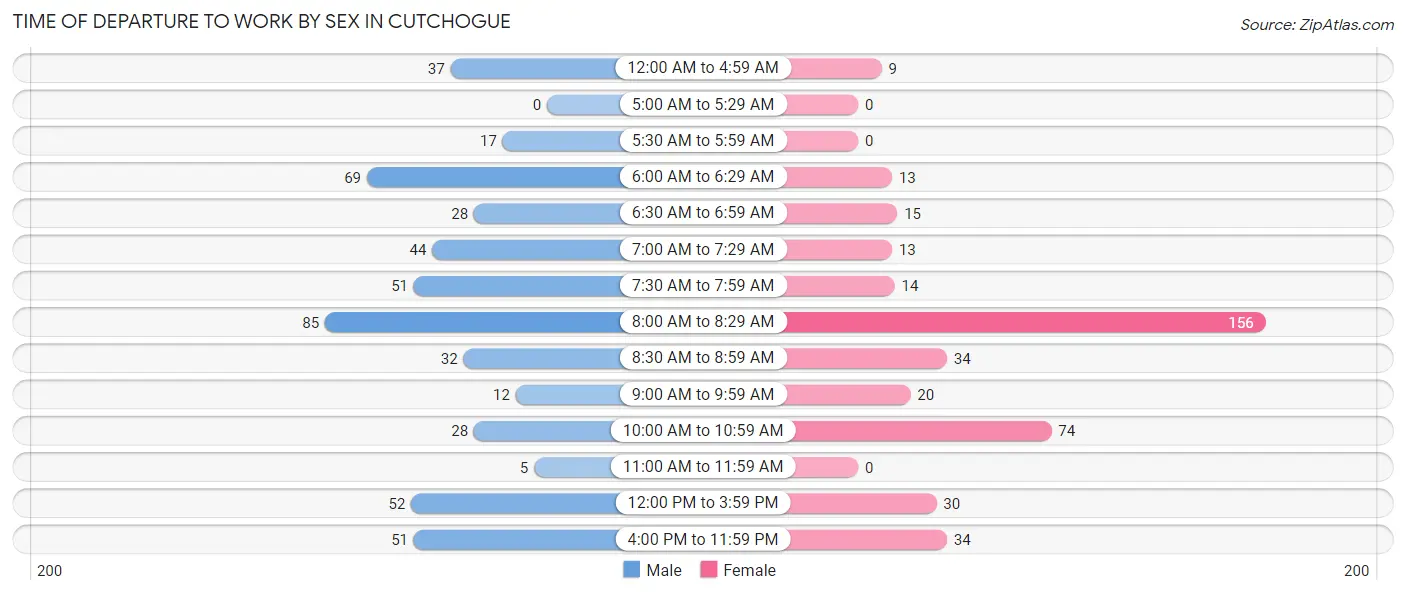
| Time of Departure | Male | Female |
| 12:00 AM to 4:59 AM | 37 (7.2%) | 9 (2.2%) |
| 5:00 AM to 5:29 AM | 0 (0.0%) | 0 (0.0%) |
| 5:30 AM to 5:59 AM | 17 (3.3%) | 0 (0.0%) |
| 6:00 AM to 6:29 AM | 69 (13.5%) | 13 (3.2%) |
| 6:30 AM to 6:59 AM | 28 (5.5%) | 15 (3.6%) |
| 7:00 AM to 7:29 AM | 44 (8.6%) | 13 (3.2%) |
| 7:30 AM to 7:59 AM | 51 (10.0%) | 14 (3.4%) |
| 8:00 AM to 8:29 AM | 85 (16.6%) | 156 (37.9%) |
| 8:30 AM to 8:59 AM | 32 (6.3%) | 34 (8.3%) |
| 9:00 AM to 9:59 AM | 12 (2.4%) | 20 (4.9%) |
| 10:00 AM to 10:59 AM | 28 (5.5%) | 74 (18.0%) |
| 11:00 AM to 11:59 AM | 5 (1.0%) | 0 (0.0%) |
| 12:00 PM to 3:59 PM | 52 (10.2%) | 30 (7.3%) |
| 4:00 PM to 11:59 PM | 51 (10.0%) | 34 (8.3%) |
| Total | 511 (100.0%) | 412 (100.0%) |
Housing Occupancy in Cutchogue
Occupancy by Ownership in Cutchogue
Of the total 1,189 dwellings in Cutchogue, owner-occupied units account for 1,066 (89.7%), while renter-occupied units make up 123 (10.3%).
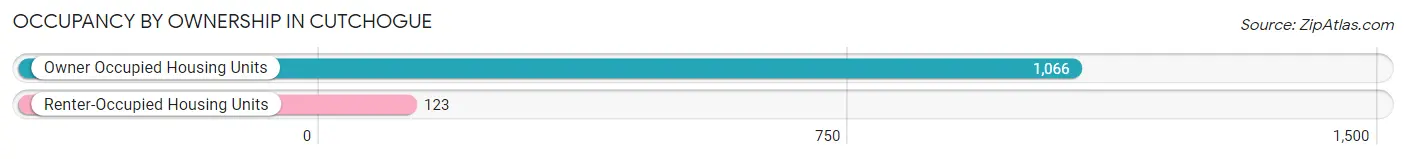
| Occupancy | # Housing Units | % Housing Units |
| Owner Occupied Housing Units | 1,066 | 89.7% |
| Renter-Occupied Housing Units | 123 | 10.3% |
| Total Occupied Housing Units | 1,189 | 100.0% |
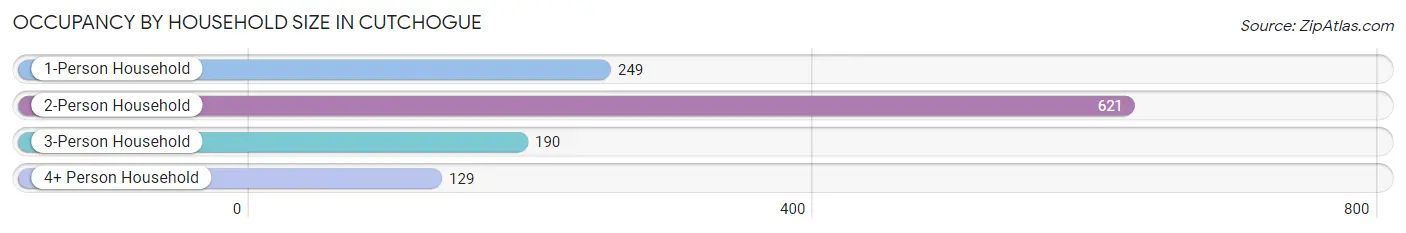
Occupancy by Household Size in Cutchogue
| Household Size | # Housing Units | % Housing Units |
| 1-Person Household | 249 | 20.9% |
| 2-Person Household | 621 | 52.2% |
| 3-Person Household | 190 | 16.0% |
| 4+ Person Household | 129 | 10.8% |
| Total Housing Units | 1,189 | 100.0% |
Occupancy by Ownership by Household Size in Cutchogue
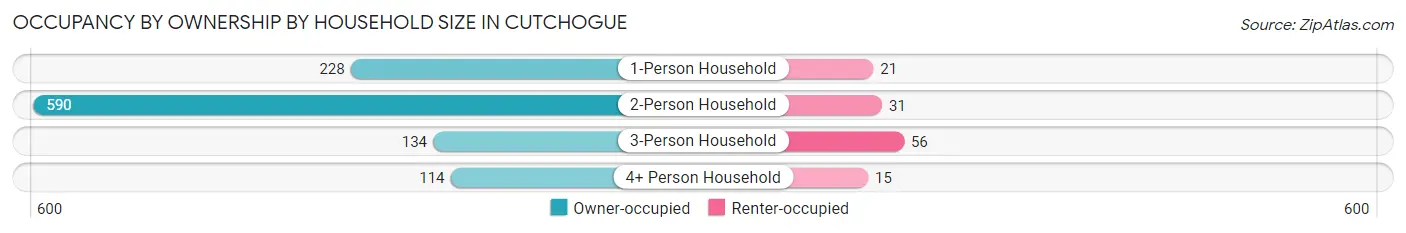
| Household Size | Owner-occupied | Renter-occupied |
| 1-Person Household | 228 (91.6%) | 21 (8.4%) |
| 2-Person Household | 590 (95.0%) | 31 (5.0%) |
| 3-Person Household | 134 (70.5%) | 56 (29.5%) |
| 4+ Person Household | 114 (88.4%) | 15 (11.6%) |
| Total Housing Units | 1,066 (89.7%) | 123 (10.3%) |
Occupancy by Educational Attainment in Cutchogue
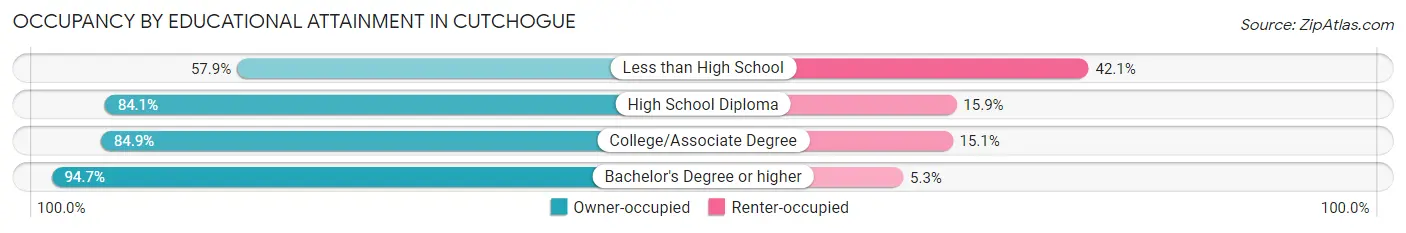
| Household Size | Owner-occupied | Renter-occupied |
| Less than High School | 22 (57.9%) | 16 (42.1%) |
| High School Diploma | 74 (84.1%) | 14 (15.9%) |
| College/Associate Degree | 314 (84.9%) | 56 (15.1%) |
| Bachelor's Degree or higher | 656 (94.7%) | 37 (5.3%) |
Occupancy by Age of Householder in Cutchogue
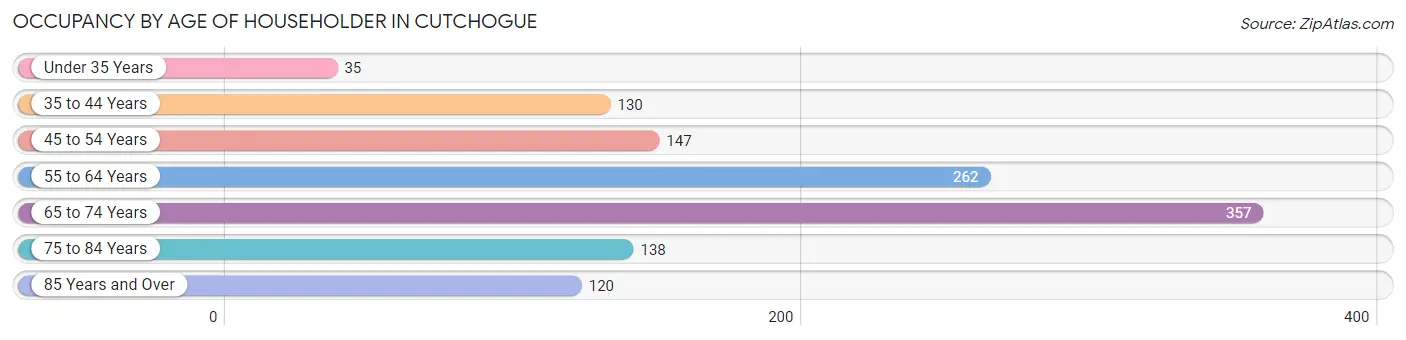
| Age Bracket | # Households | % Households |
| Under 35 Years | 35 | 2.9% |
| 35 to 44 Years | 130 | 10.9% |
| 45 to 54 Years | 147 | 12.4% |
| 55 to 64 Years | 262 | 22.0% |
| 65 to 74 Years | 357 | 30.0% |
| 75 to 84 Years | 138 | 11.6% |
| 85 Years and Over | 120 | 10.1% |
| Total | 1,189 | 100.0% |
Housing Finances in Cutchogue
Median Income by Occupancy in Cutchogue
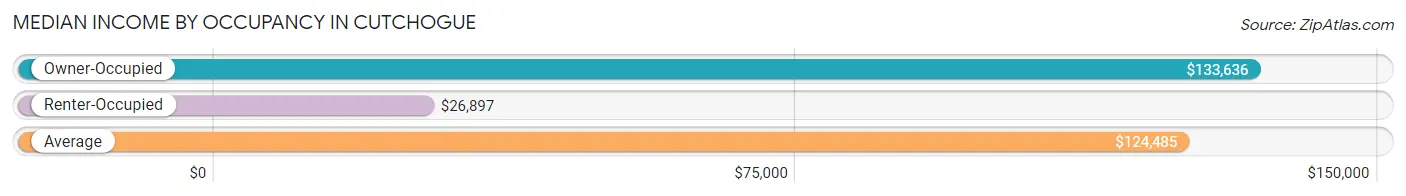
| Occupancy Type | # Households | Median Income |
| Owner-Occupied | 1,066 (89.7%) | $133,636 |
| Renter-Occupied | 123 (10.3%) | $26,897 |
| Average | 1,189 (100.0%) | $124,485 |
Occupancy by Householder Income Bracket in Cutchogue
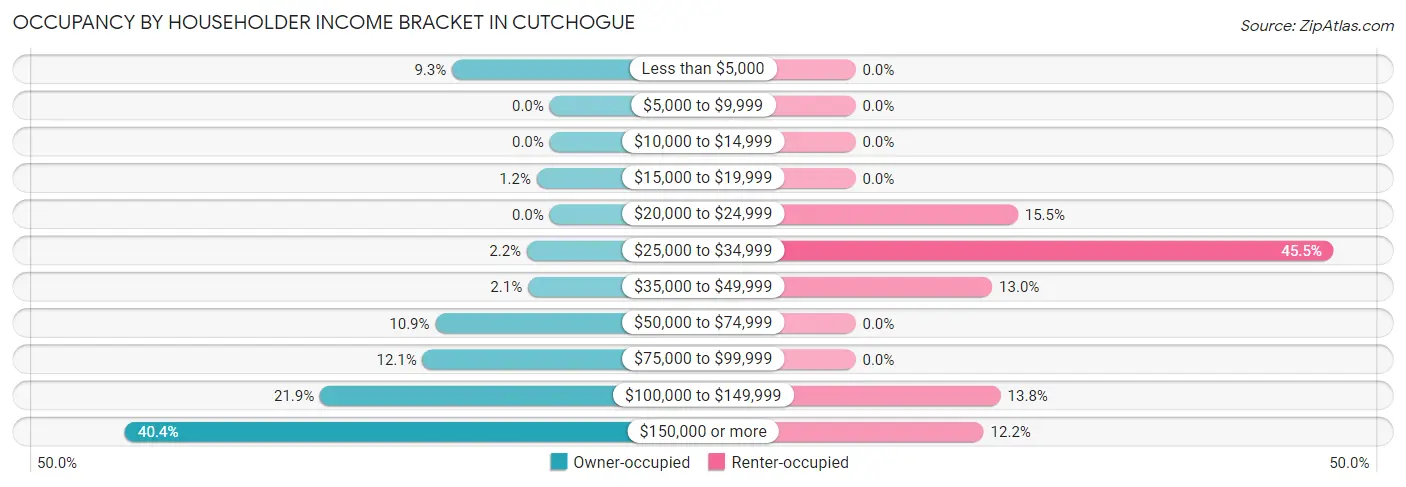
| Income Bracket | Owner-occupied | Renter-occupied |
| Less than $5,000 | 99 (9.3%) | 0 (0.0%) |
| $5,000 to $9,999 | 0 (0.0%) | 0 (0.0%) |
| $10,000 to $14,999 | 0 (0.0%) | 0 (0.0%) |
| $15,000 to $19,999 | 13 (1.2%) | 0 (0.0%) |
| $20,000 to $24,999 | 0 (0.0%) | 19 (15.4%) |
| $25,000 to $34,999 | 23 (2.2%) | 56 (45.5%) |
| $35,000 to $49,999 | 22 (2.1%) | 16 (13.0%) |
| $50,000 to $74,999 | 116 (10.9%) | 0 (0.0%) |
| $75,000 to $99,999 | 129 (12.1%) | 0 (0.0%) |
| $100,000 to $149,999 | 233 (21.9%) | 17 (13.8%) |
| $150,000 or more | 431 (40.4%) | 15 (12.2%) |
| Total | 1,066 (100.0%) | 123 (100.0%) |
Monthly Housing Cost Tiers in Cutchogue
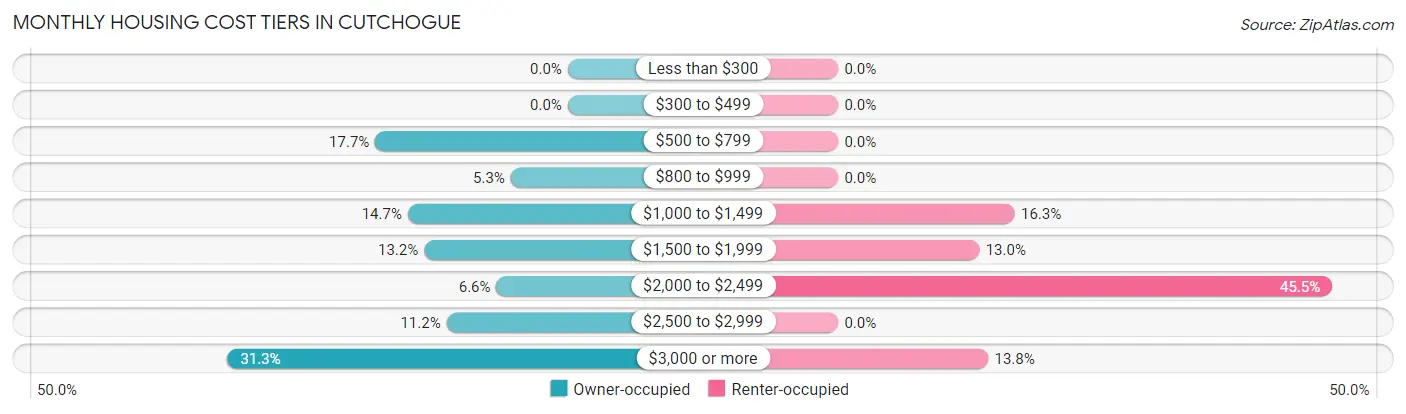
| Monthly Cost | Owner-occupied | Renter-occupied |
| Less than $300 | 0 (0.0%) | 0 (0.0%) |
| $300 to $499 | 0 (0.0%) | 0 (0.0%) |
| $500 to $799 | 189 (17.7%) | 0 (0.0%) |
| $800 to $999 | 56 (5.2%) | 0 (0.0%) |
| $1,000 to $1,499 | 157 (14.7%) | 20 (16.3%) |
| $1,500 to $1,999 | 141 (13.2%) | 16 (13.0%) |
| $2,000 to $2,499 | 70 (6.6%) | 56 (45.5%) |
| $2,500 to $2,999 | 119 (11.2%) | 0 (0.0%) |
| $3,000 or more | 334 (31.3%) | 17 (13.8%) |
| Total | 1,066 (100.0%) | 123 (100.0%) |
Physical Housing Characteristics in Cutchogue
Housing Structures in Cutchogue
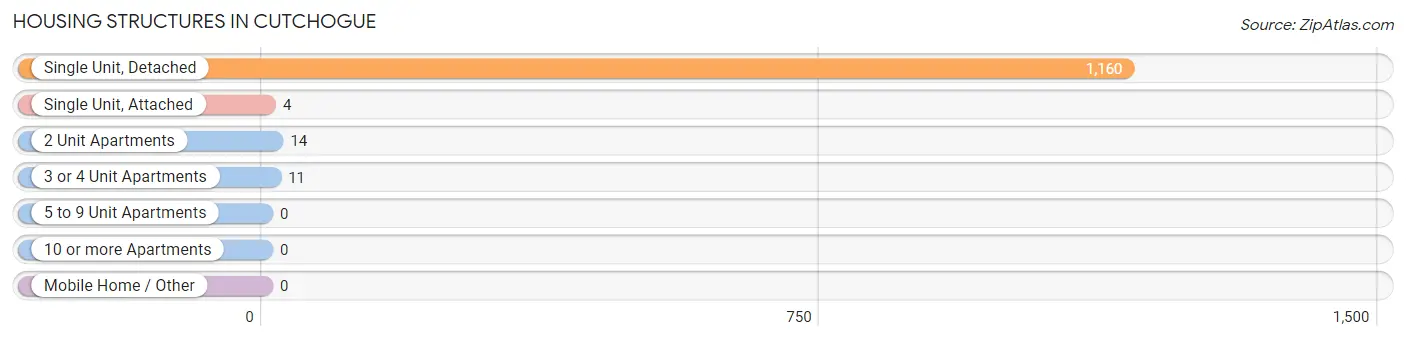
| Structure Type | # Housing Units | % Housing Units |
| Single Unit, Detached | 1,160 | 97.6% |
| Single Unit, Attached | 4 | 0.3% |
| 2 Unit Apartments | 14 | 1.2% |
| 3 or 4 Unit Apartments | 11 | 0.9% |
| 5 to 9 Unit Apartments | 0 | 0.0% |
| 10 or more Apartments | 0 | 0.0% |
| Mobile Home / Other | 0 | 0.0% |
| Total | 1,189 | 100.0% |
Housing Structures by Occupancy in Cutchogue
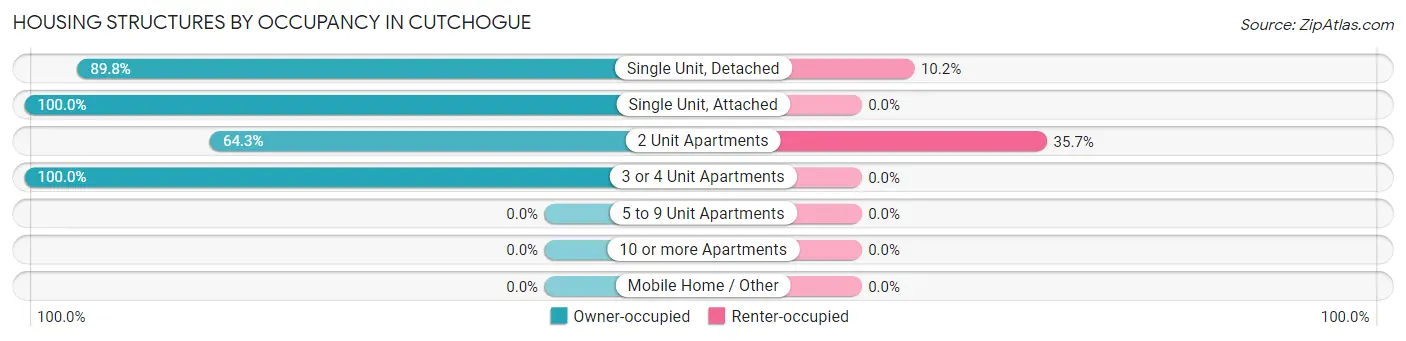
| Structure Type | Owner-occupied | Renter-occupied |
| Single Unit, Detached | 1,042 (89.8%) | 118 (10.2%) |
| Single Unit, Attached | 4 (100.0%) | 0 (0.0%) |
| 2 Unit Apartments | 9 (64.3%) | 5 (35.7%) |
| 3 or 4 Unit Apartments | 11 (100.0%) | 0 (0.0%) |
| 5 to 9 Unit Apartments | 0 (0.0%) | 0 (0.0%) |
| 10 or more Apartments | 0 (0.0%) | 0 (0.0%) |
| Mobile Home / Other | 0 (0.0%) | 0 (0.0%) |
| Total | 1,066 (89.7%) | 123 (10.3%) |
Housing Structures by Number of Rooms in Cutchogue
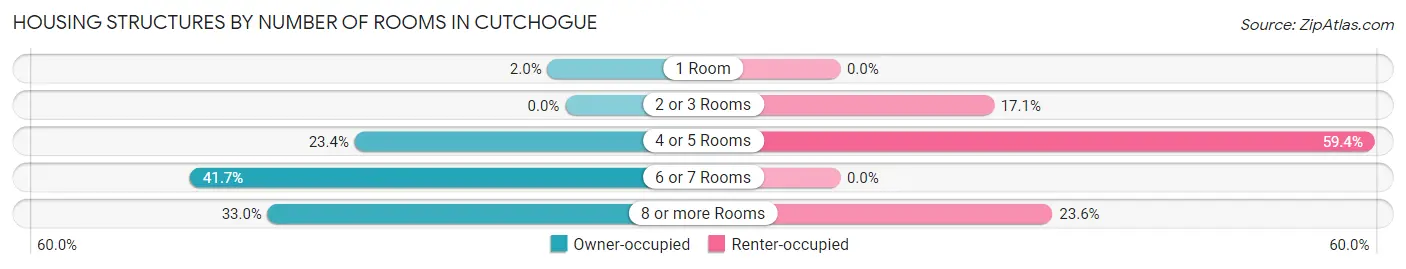
| Number of Rooms | Owner-occupied | Renter-occupied |
| 1 Room | 21 (2.0%) | 0 (0.0%) |
| 2 or 3 Rooms | 0 (0.0%) | 21 (17.1%) |
| 4 or 5 Rooms | 249 (23.4%) | 73 (59.4%) |
| 6 or 7 Rooms | 444 (41.6%) | 0 (0.0%) |
| 8 or more Rooms | 352 (33.0%) | 29 (23.6%) |
| Total | 1,066 (100.0%) | 123 (100.0%) |
Housing Structure by Heating Type in Cutchogue
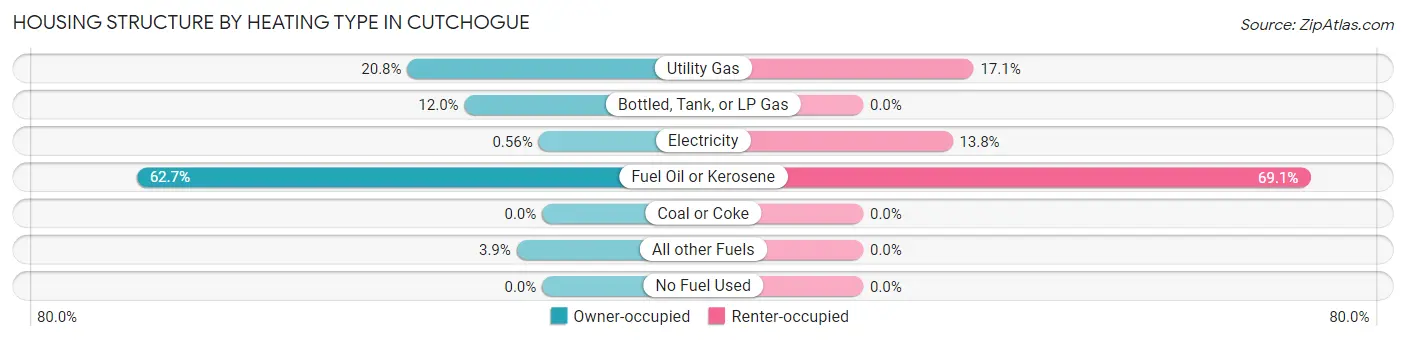
| Heating Type | Owner-occupied | Renter-occupied |
| Utility Gas | 222 (20.8%) | 21 (17.1%) |
| Bottled, Tank, or LP Gas | 128 (12.0%) | 0 (0.0%) |
| Electricity | 6 (0.6%) | 17 (13.8%) |
| Fuel Oil or Kerosene | 668 (62.7%) | 85 (69.1%) |
| Coal or Coke | 0 (0.0%) | 0 (0.0%) |
| All other Fuels | 42 (3.9%) | 0 (0.0%) |
| No Fuel Used | 0 (0.0%) | 0 (0.0%) |
| Total | 1,066 (100.0%) | 123 (100.0%) |
Household Vehicle Usage in Cutchogue
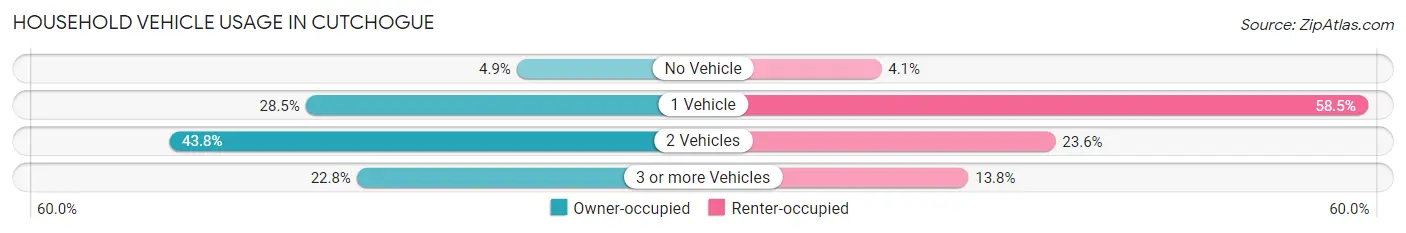
| Vehicles per Household | Owner-occupied | Renter-occupied |
| No Vehicle | 52 (4.9%) | 5 (4.1%) |
| 1 Vehicle | 304 (28.5%) | 72 (58.5%) |
| 2 Vehicles | 467 (43.8%) | 29 (23.6%) |
| 3 or more Vehicles | 243 (22.8%) | 17 (13.8%) |
| Total | 1,066 (100.0%) | 123 (100.0%) |
Real Estate & Mortgages in Cutchogue
Real Estate and Mortgage Overview in Cutchogue
| Characteristic | Without Mortgage | With Mortgage |
| Housing Units | 578 | 488 |
| Median Property Value | $760,400 | $921,400 |
| Median Household Income | $102,083 | $263 |
| Monthly Housing Costs | $1,300 | $303 |
| Real Estate Taxes | $9,519 | $32 |
Property Value by Mortgage Status in Cutchogue
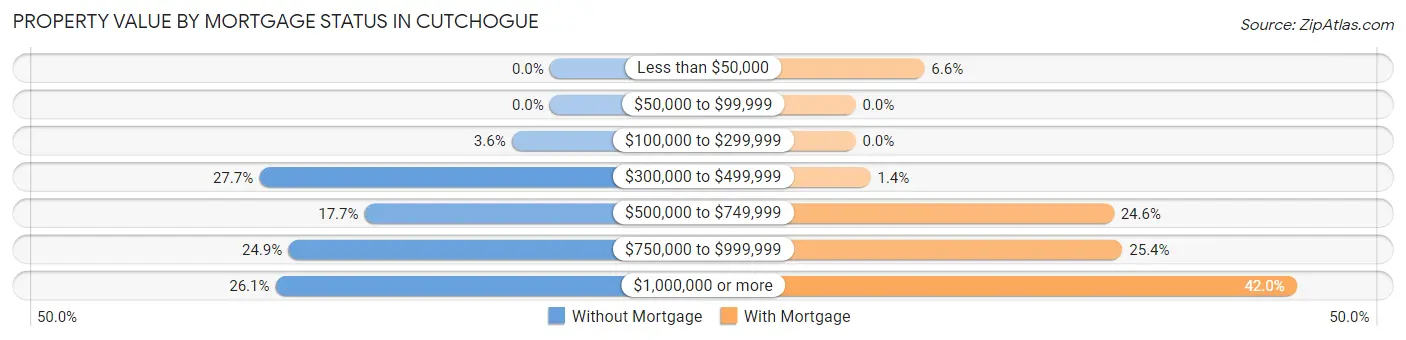
| Property Value | Without Mortgage | With Mortgage |
| Less than $50,000 | 0 (0.0%) | 32 (6.6%) |
| $50,000 to $99,999 | 0 (0.0%) | 0 (0.0%) |
| $100,000 to $299,999 | 21 (3.6%) | 0 (0.0%) |
| $300,000 to $499,999 | 160 (27.7%) | 7 (1.4%) |
| $500,000 to $749,999 | 102 (17.6%) | 120 (24.6%) |
| $750,000 to $999,999 | 144 (24.9%) | 124 (25.4%) |
| $1,000,000 or more | 151 (26.1%) | 205 (42.0%) |
| Total | 578 (100.0%) | 488 (100.0%) |
Household Income by Mortgage Status in Cutchogue
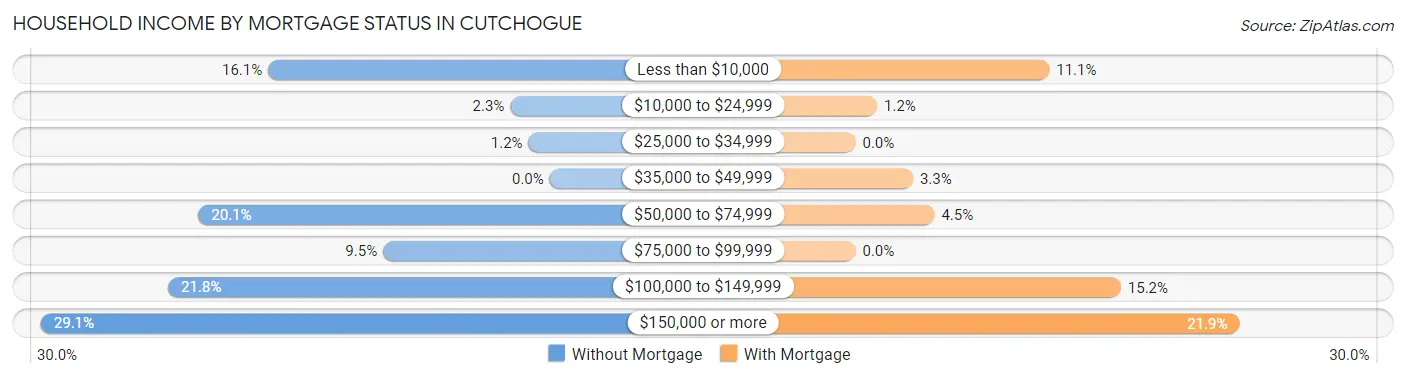
| Household Income | Without Mortgage | With Mortgage |
| Less than $10,000 | 93 (16.1%) | 54 (11.1%) |
| $10,000 to $24,999 | 13 (2.2%) | 6 (1.2%) |
| $25,000 to $34,999 | 7 (1.2%) | 0 (0.0%) |
| $35,000 to $49,999 | 0 (0.0%) | 16 (3.3%) |
| $50,000 to $74,999 | 116 (20.1%) | 22 (4.5%) |
| $75,000 to $99,999 | 55 (9.5%) | 0 (0.0%) |
| $100,000 to $149,999 | 126 (21.8%) | 74 (15.2%) |
| $150,000 or more | 168 (29.1%) | 107 (21.9%) |
| Total | 578 (100.0%) | 488 (100.0%) |
Property Value to Household Income Ratio in Cutchogue
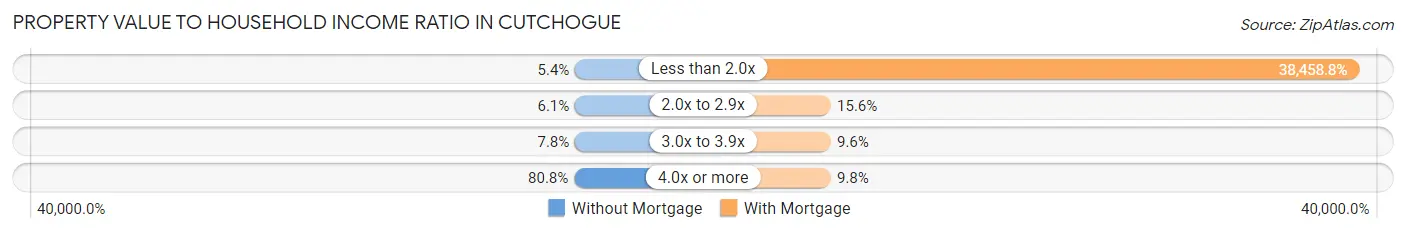
| Value-to-Income Ratio | Without Mortgage | With Mortgage |
| Less than 2.0x | 31 (5.4%) | 187,679 (38,458.8%) |
| 2.0x to 2.9x | 35 (6.1%) | 76 (15.6%) |
| 3.0x to 3.9x | 45 (7.8%) | 47 (9.6%) |
| 4.0x or more | 467 (80.8%) | 48 (9.8%) |
| Total | 578 (100.0%) | 488 (100.0%) |
Real Estate Taxes by Mortgage Status in Cutchogue
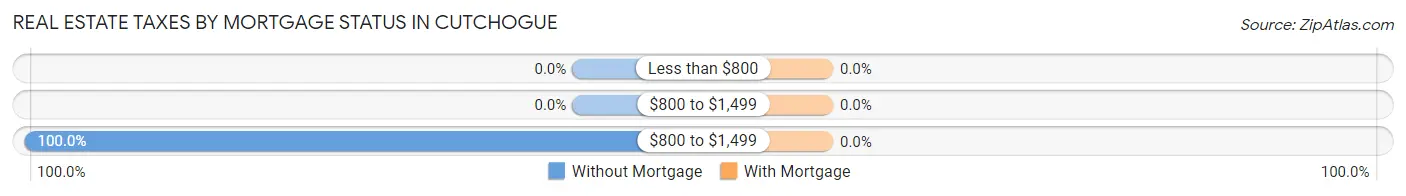
| Property Taxes | Without Mortgage | With Mortgage |
| Less than $800 | 0 (0.0%) | 0 (0.0%) |
| $800 to $1,499 | 0 (0.0%) | 0 (0.0%) |
| $800 to $1,499 | 578 (100.0%) | 0 (0.0%) |
| Total | 578 (100.0%) | 488 (100.0%) |
Health & Disability in Cutchogue
Health Insurance Coverage by Age in Cutchogue
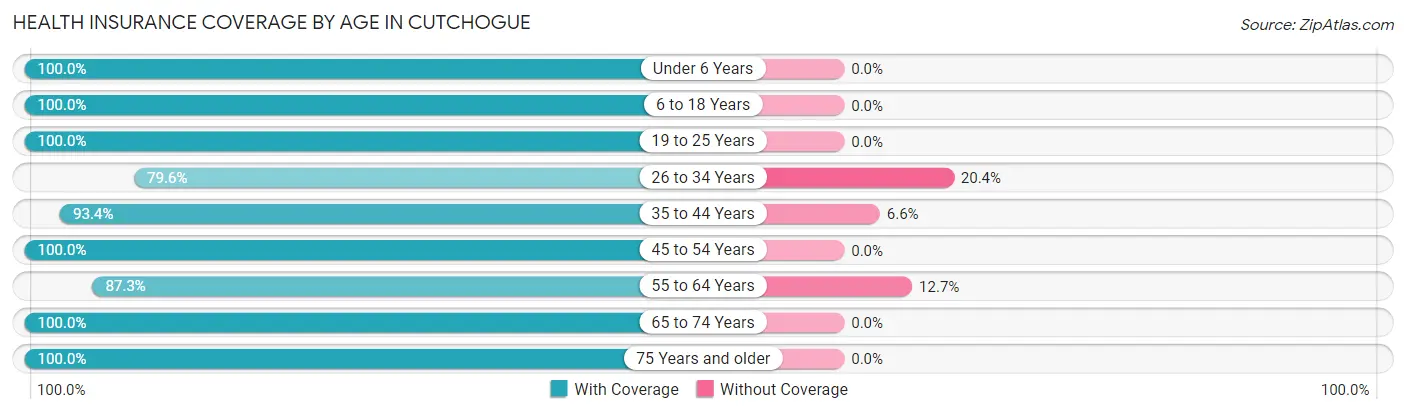
| Age Bracket | With Coverage | Without Coverage |
| Under 6 Years | 63 (100.0%) | 0 (0.0%) |
| 6 to 18 Years | 287 (100.0%) | 0 (0.0%) |
| 19 to 25 Years | 60 (100.0%) | 0 (0.0%) |
| 26 to 34 Years | 187 (79.6%) | 48 (20.4%) |
| 35 to 44 Years | 310 (93.4%) | 22 (6.6%) |
| 45 to 54 Years | 296 (100.0%) | 0 (0.0%) |
| 55 to 64 Years | 407 (87.3%) | 59 (12.7%) |
| 65 to 74 Years | 645 (100.0%) | 0 (0.0%) |
| 75 Years and older | 408 (100.0%) | 0 (0.0%) |
| Total | 2,663 (95.4%) | 129 (4.6%) |
Health Insurance Coverage by Citizenship Status in Cutchogue
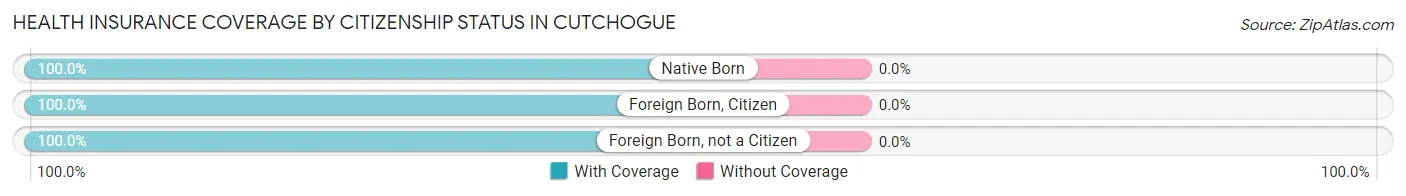
| Citizenship Status | With Coverage | Without Coverage |
| Native Born | 63 (100.0%) | 0 (0.0%) |
| Foreign Born, Citizen | 287 (100.0%) | 0 (0.0%) |
| Foreign Born, not a Citizen | 60 (100.0%) | 0 (0.0%) |
Health Insurance Coverage by Household Income in Cutchogue
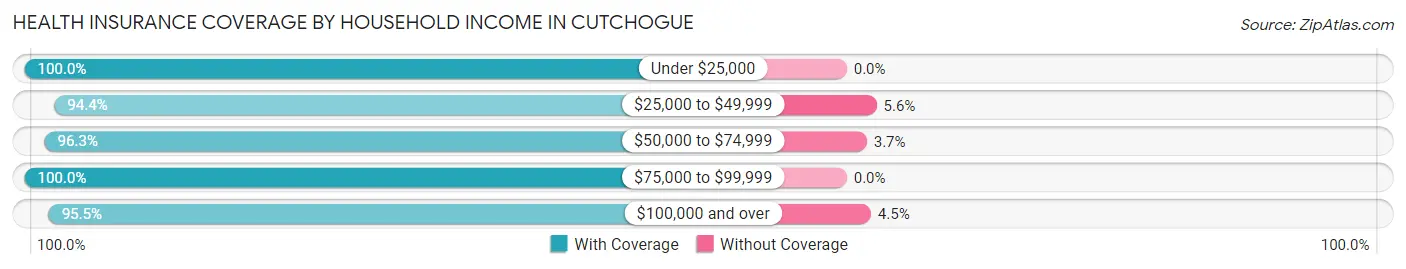
| Household Income | With Coverage | Without Coverage |
| Under $25,000 | 167 (100.0%) | 0 (0.0%) |
| $25,000 to $49,999 | 270 (94.4%) | 16 (5.6%) |
| $50,000 to $74,999 | 180 (96.3%) | 7 (3.7%) |
| $75,000 to $99,999 | 241 (100.0%) | 0 (0.0%) |
| $100,000 and over | 1,773 (95.5%) | 84 (4.5%) |
Public vs Private Health Insurance Coverage by Age in Cutchogue
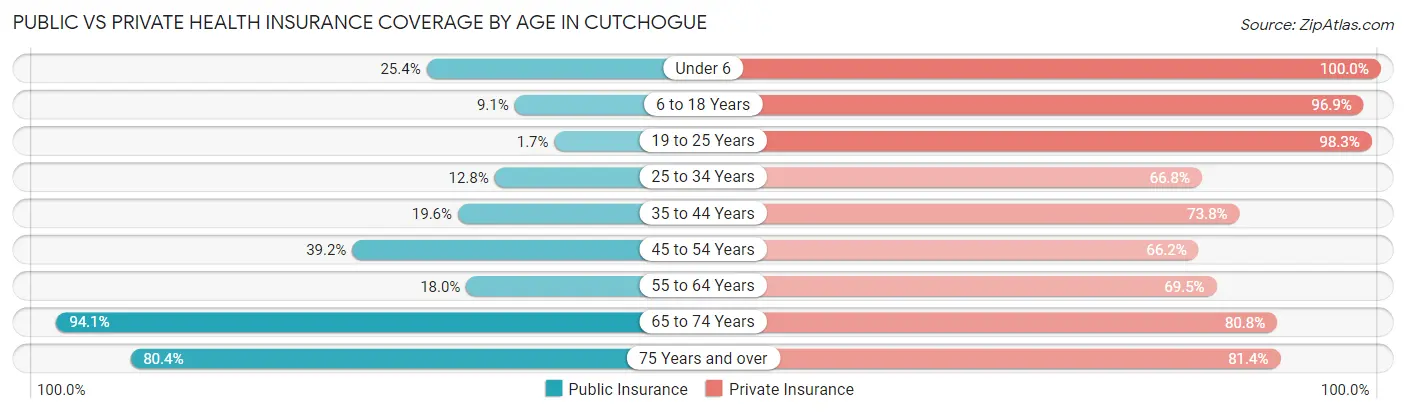
| Age Bracket | Public Insurance | Private Insurance |
| Under 6 | 16 (25.4%) | 63 (100.0%) |
| 6 to 18 Years | 26 (9.1%) | 278 (96.9%) |
| 19 to 25 Years | 1 (1.7%) | 59 (98.3%) |
| 25 to 34 Years | 30 (12.8%) | 157 (66.8%) |
| 35 to 44 Years | 65 (19.6%) | 245 (73.8%) |
| 45 to 54 Years | 116 (39.2%) | 196 (66.2%) |
| 55 to 64 Years | 84 (18.0%) | 324 (69.5%) |
| 65 to 74 Years | 607 (94.1%) | 521 (80.8%) |
| 75 Years and over | 328 (80.4%) | 332 (81.4%) |
| Total | 1,273 (45.6%) | 2,175 (77.9%) |
Disability Status by Sex by Age in Cutchogue
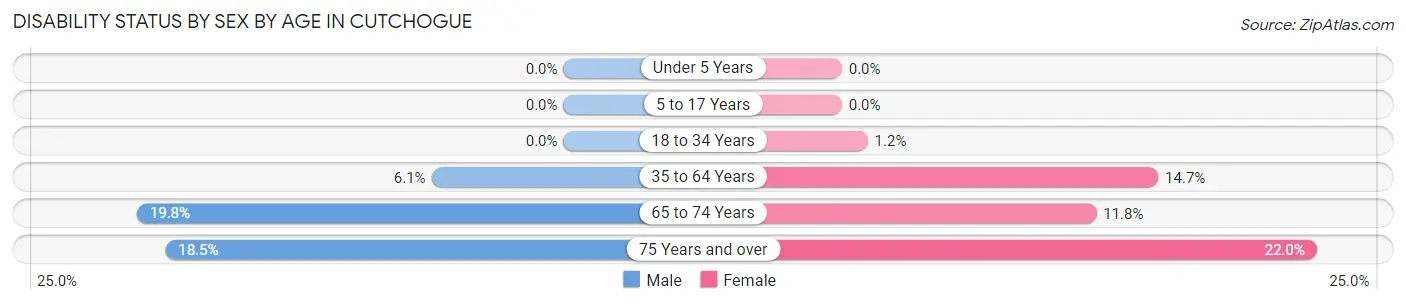
| Age Bracket | Male | Female |
| Under 5 Years | 0 (0.0%) | 0 (0.0%) |
| 5 to 17 Years | 0 (0.0%) | 0 (0.0%) |
| 18 to 34 Years | 0 (0.0%) | 1 (1.2%) |
| 35 to 64 Years | 29 (6.1%) | 91 (14.7%) |
| 65 to 74 Years | 74 (19.8%) | 32 (11.8%) |
| 75 Years and over | 41 (18.5%) | 41 (22.0%) |
Disability Class by Sex by Age in Cutchogue
Disability Class: Hearing Difficulty
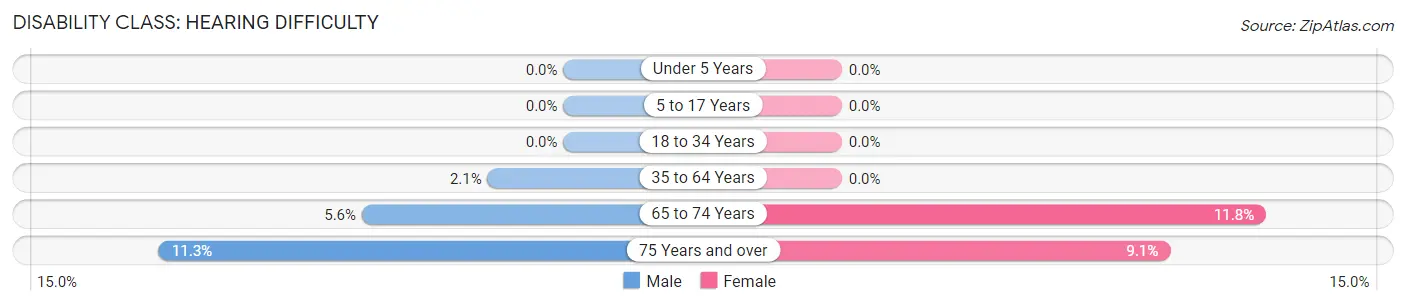
| Age Bracket | Male | Female |
| Under 5 Years | 0 (0.0%) | 0 (0.0%) |
| 5 to 17 Years | 0 (0.0%) | 0 (0.0%) |
| 18 to 34 Years | 0 (0.0%) | 0 (0.0%) |
| 35 to 64 Years | 10 (2.1%) | 0 (0.0%) |
| 65 to 74 Years | 21 (5.6%) | 32 (11.8%) |
| 75 Years and over | 25 (11.3%) | 17 (9.1%) |
Disability Class: Vision Difficulty
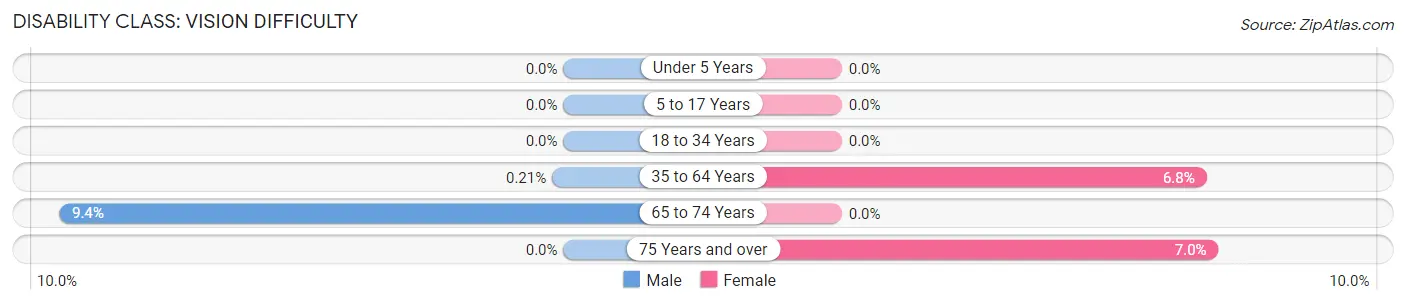
| Age Bracket | Male | Female |
| Under 5 Years | 0 (0.0%) | 0 (0.0%) |
| 5 to 17 Years | 0 (0.0%) | 0 (0.0%) |
| 18 to 34 Years | 0 (0.0%) | 0 (0.0%) |
| 35 to 64 Years | 1 (0.2%) | 42 (6.8%) |
| 65 to 74 Years | 35 (9.4%) | 0 (0.0%) |
| 75 Years and over | 0 (0.0%) | 13 (7.0%) |
Disability Class: Cognitive Difficulty
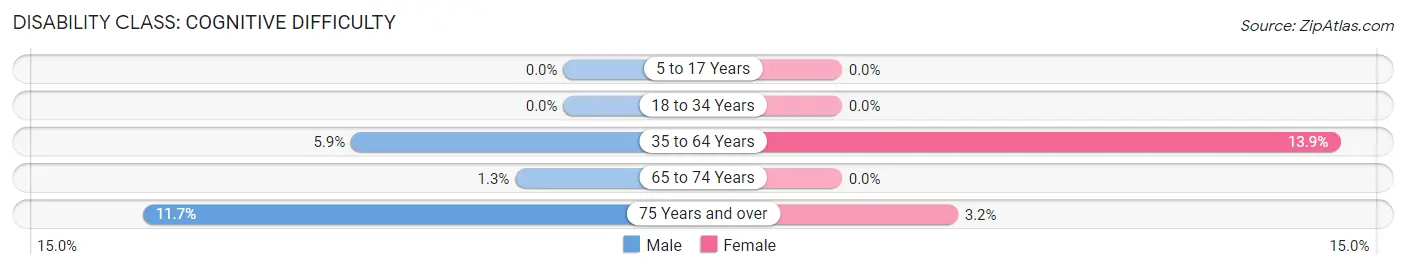
| Age Bracket | Male | Female |
| 5 to 17 Years | 0 (0.0%) | 0 (0.0%) |
| 18 to 34 Years | 0 (0.0%) | 0 (0.0%) |
| 35 to 64 Years | 28 (5.9%) | 86 (13.9%) |
| 65 to 74 Years | 5 (1.3%) | 0 (0.0%) |
| 75 Years and over | 26 (11.7%) | 6 (3.2%) |
Disability Class: Ambulatory Difficulty
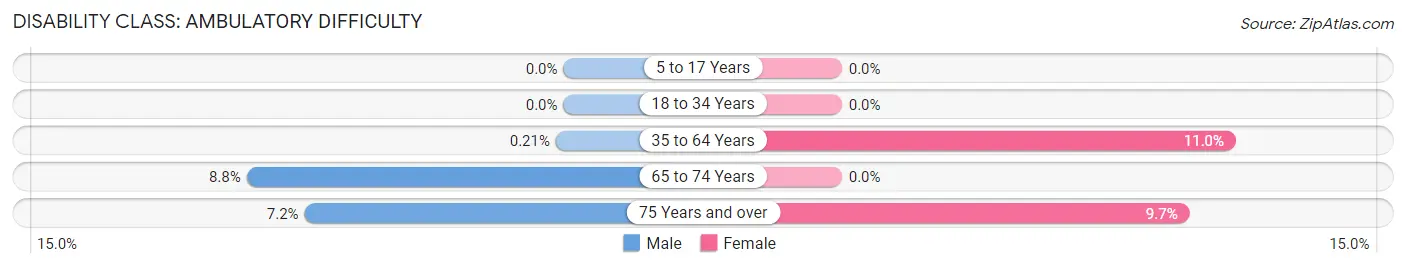
| Age Bracket | Male | Female |
| 5 to 17 Years | 0 (0.0%) | 0 (0.0%) |
| 18 to 34 Years | 0 (0.0%) | 0 (0.0%) |
| 35 to 64 Years | 1 (0.2%) | 68 (11.0%) |
| 65 to 74 Years | 33 (8.8%) | 0 (0.0%) |
| 75 Years and over | 16 (7.2%) | 18 (9.7%) |
Disability Class: Self-Care Difficulty
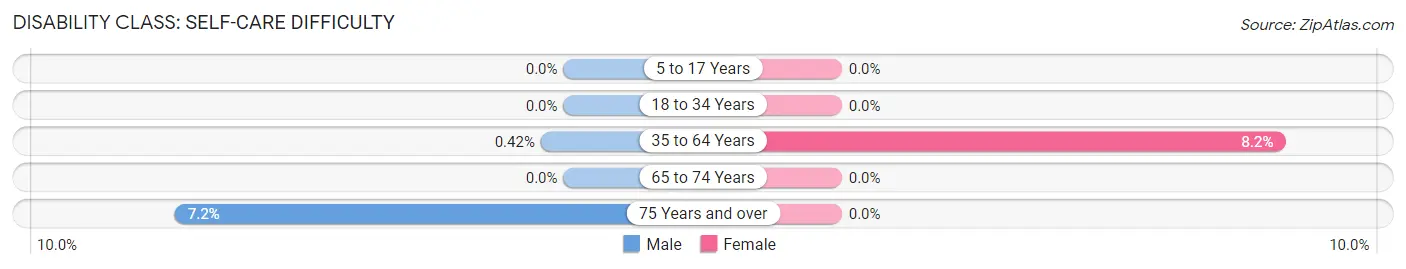
| Age Bracket | Male | Female |
| 5 to 17 Years | 0 (0.0%) | 0 (0.0%) |
| 18 to 34 Years | 0 (0.0%) | 0 (0.0%) |
| 35 to 64 Years | 2 (0.4%) | 51 (8.2%) |
| 65 to 74 Years | 0 (0.0%) | 0 (0.0%) |
| 75 Years and over | 16 (7.2%) | 0 (0.0%) |
Technology Access in Cutchogue
Computing Device Access in Cutchogue
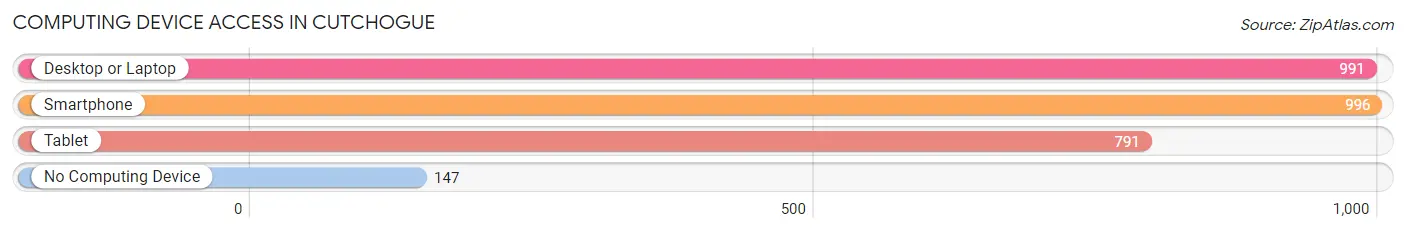
| Device Type | # Households | % Households |
| Desktop or Laptop | 991 | 83.4% |
| Smartphone | 996 | 83.8% |
| Tablet | 791 | 66.5% |
| No Computing Device | 147 | 12.4% |
| Total | 1,189 | 100.0% |
Internet Access in Cutchogue
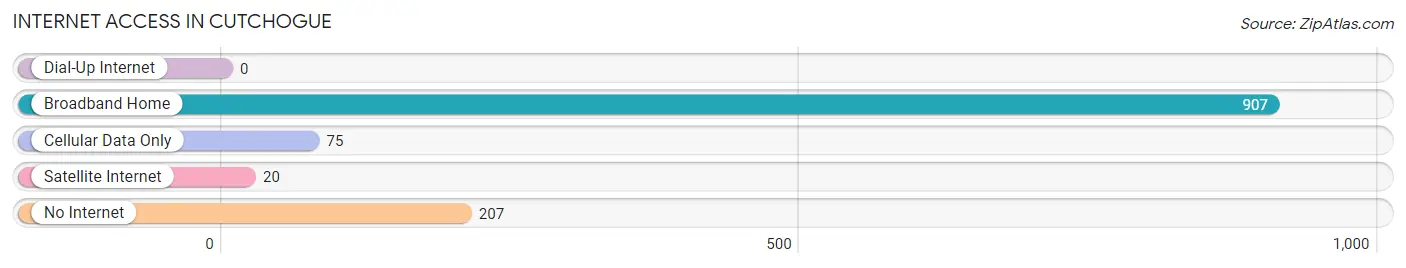
| Internet Type | # Households | % Households |
| Dial-Up Internet | 0 | 0.0% |
| Broadband Home | 907 | 76.3% |
| Cellular Data Only | 75 | 6.3% |
| Satellite Internet | 20 | 1.7% |
| No Internet | 207 | 17.4% |
| Total | 1,189 | 100.0% |
Cutchogue Summary
Cutchogue is a hamlet located in the Town of Southold in Suffolk County, New York, United States. It is located on the North Fork of Long Island, approximately 90 miles east of New York City. The hamlet is situated on the Great Peconic Bay and is bordered by the hamlets of New Suffolk to the west, Mattituck to the east, and Peconic to the south.
History
The area now known as Cutchogue was originally inhabited by the Algonquin-speaking Pequot Indians. The first European settlers arrived in the area in 1640, and the hamlet was officially established in 1649. The name Cutchogue is derived from the Algonquin word “Kutchaug,” which means “a place of shelter.”
In the late 17th century, the hamlet was a major center of whaling and shipbuilding. During the Revolutionary War, Cutchogue was the site of a major battle between British and American forces. The British were ultimately victorious, and the hamlet was burned to the ground.
In the 19th century, Cutchogue became a major center of the Long Island wine industry. The hamlet was home to several wineries, including the Hargrave Vineyard, which was established in 1973 and is still in operation today.
Geography
Cutchogue is located on the North Fork of Long Island, approximately 90 miles east of New York City. The hamlet is situated on the Great Peconic Bay and is bordered by the hamlets of New Suffolk to the west, Mattituck to the east, and Peconic to the south.
The hamlet has a total area of 4.2 square miles, of which 3.9 square miles is land and 0.3 square miles is water. The terrain is mostly flat, with some rolling hills. The highest point in the hamlet is approximately 100 feet above sea level.
Economy
The economy of Cutchogue is largely based on agriculture and tourism. The hamlet is home to several wineries, including the Hargrave Vineyard, which was established in 1973 and is still in operation today. The hamlet is also home to several farms, including the Cutchogue-New Suffolk Historical Council’s Farm and Education Center.
Tourism is also an important part of the local economy. The hamlet is home to several popular attractions, including the Cutchogue-New Suffolk Historical Council’s Farm and Education Center, the Cutchogue-New Suffolk Free Library, and the Cutchogue-New Suffolk Historical Society.
Demographics
As of the 2010 census, the population of Cutchogue was 2,369. The racial makeup of the hamlet was 94.3% White, 1.2% African American, 0.2% Native American, 1.2% Asian, 0.1% Pacific Islander, 1.2% from other races, and 1.9% from two or more races. Hispanic or Latino of any race were 4.2% of the population.
The median household income in Cutchogue was $76,944, and the median family income was $87,813. The per capita income for the hamlet was $35,945. About 4.2% of families and 5.7% of the population were below the poverty line, including 6.2% of those under age 18 and 4.2% of those age 65 or over.
Common Questions
What is the Total Population of Cutchogue?
Total Population of Cutchogue is 2,792.
What is the Total Male Population of Cutchogue?
Total Male Population of Cutchogue is 1,438.
What is the Total Female Population of Cutchogue?
Total Female Population of Cutchogue is 1,354.
What is the Ratio of Males per 100 Females in Cutchogue?
There are 106.20 Males per 100 Females in Cutchogue.
What is the Ratio of Females per 100 Males in Cutchogue?
There are 94.16 Females per 100 Males in Cutchogue.
What is the Median Population Age in Cutchogue?
Median Population Age in Cutchogue is 59.9 Years.
What is the Average Family Size in Cutchogue
Average Family Size in Cutchogue is 2.6 People.
What is the Average Household Size in Cutchogue
Average Household Size in Cutchogue is 2.3 People.
What is Per Capita Income in Cutchogue?
Per Capita income in Cutchogue is $93,722.
What is the Median Family Income in Cutchogue?
Median Family Income in Cutchogue is $138,299.
What is the Median Household income in Cutchogue?
Median Household Income in Cutchogue is $124,485.
What is Income or Wage Gap in Cutchogue?
Income or Wage Gap in Cutchogue is 36.2%.
Women in Cutchogue earn 63.8 cents for every dollar earned by a man.
What is Inequality or Gini Index in Cutchogue?
Inequality or Gini Index in Cutchogue is 0.58.
How Large is the Labor Force in Cutchogue?
There are 1,377 People in the Labor Forcein in Cutchogue.
What is the Percentage of People in the Labor Force in Cutchogue?
56.4% of People are in the Labor Force in Cutchogue.
What is the Unemployment Rate in Cutchogue?
Unemployment Rate in Cutchogue is 1.2%.