Montauk, NY
Montauk Map
Montauk Overview
4,322
TOTAL POPULATION
2,306
MALE POPULATION
2,016
FEMALE POPULATION
114.38
MALES / 100 FEMALES
87.42
FEMALES / 100 MALES
49.4
MEDIAN AGE
3.2
AVG FAMILY SIZE
2.7
AVG HOUSEHOLD SIZE
$83,843
PER CAPITA INCOME
$162,969
AVG FAMILY INCOME
$138,900
AVG HOUSEHOLD INCOME
36.4%
WAGE / INCOME GAP [ % ]
63.6¢/ $1
WAGE / INCOME GAP [ $ ]
0.52
INEQUALITY / GINI INDEX
2,237
LABOR FORCE [ PEOPLE ]
61.6%
PERCENT IN LABOR FORCE
5.5%
UNEMPLOYMENT RATE
Montauk Zip Codes
Montauk Area Codes
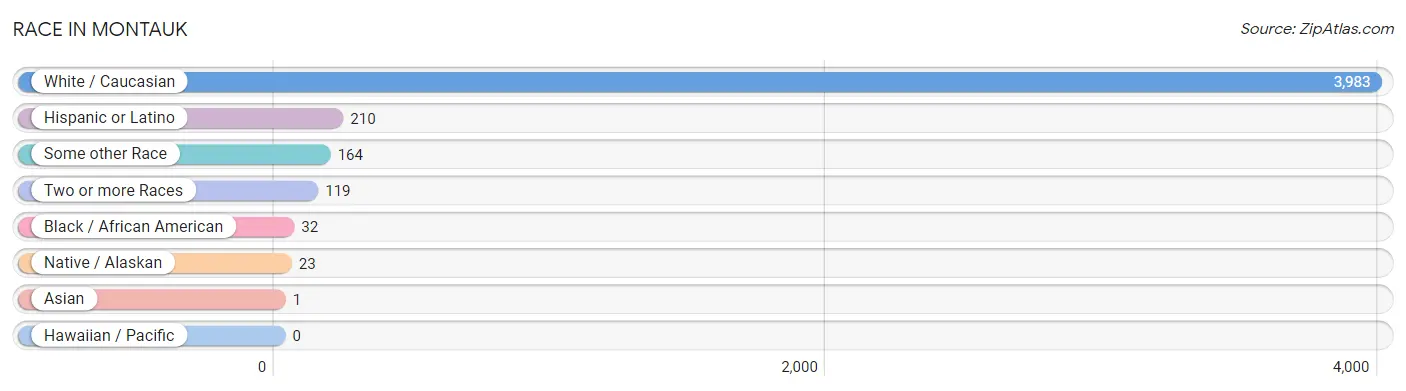
Race in Montauk
The most populous races in Montauk are White / Caucasian (3,983 | 92.2%), Hispanic or Latino (210 | 4.9%), and Some other Race (164 | 3.8%).
| Race | # Population | % Population |
| Asian | 1 | 0.0% |
| Black / African American | 32 | 0.7% |
| Hawaiian / Pacific | 0 | 0.0% |
| Hispanic or Latino | 210 | 4.9% |
| Native / Alaskan | 23 | 0.5% |
| White / Caucasian | 3,983 | 92.2% |
| Two or more Races | 119 | 2.8% |
| Some other Race | 164 | 3.8% |
| Total | 4,322 | 100.0% |
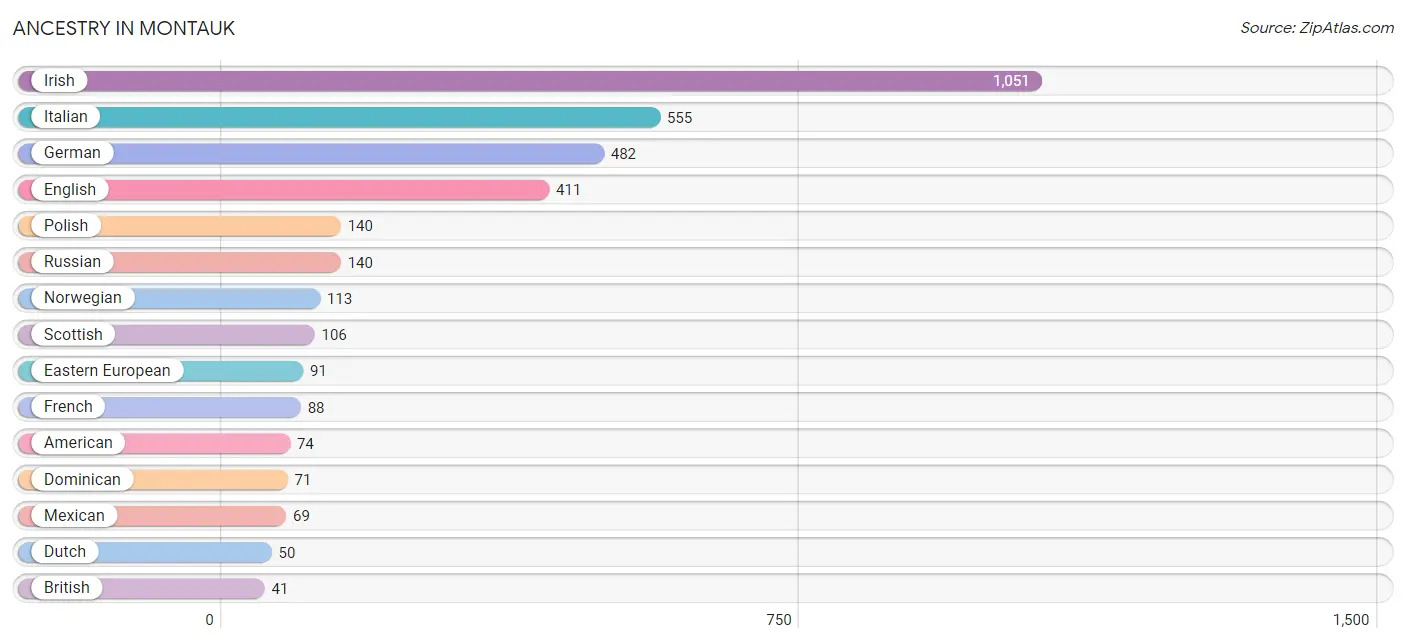
Ancestry in Montauk
The most populous ancestries reported in Montauk are Irish (1,051 | 24.3%), Italian (555 | 12.8%), German (482 | 11.2%), English (411 | 9.5%), and Polish (140 | 3.2%), together accounting for 61.1% of all Montauk residents.
| Ancestry | # Population | % Population |
| American | 74 | 1.7% |
| Bhutanese | 16 | 0.4% |
| Brazilian | 35 | 0.8% |
| British | 41 | 0.9% |
| Burmese | 2 | 0.1% |
| Celtic | 10 | 0.2% |
| Central American | 10 | 0.2% |
| Cherokee | 23 | 0.5% |
| Cuban | 13 | 0.3% |
| Czechoslovakian | 14 | 0.3% |
| Danish | 39 | 0.9% |
| Dominican | 71 | 1.6% |
| Dutch | 50 | 1.2% |
| Eastern European | 91 | 2.1% |
| English | 411 | 9.5% |
| European | 21 | 0.5% |
| Finnish | 12 | 0.3% |
| French | 88 | 2.0% |
| French Canadian | 2 | 0.1% |
| German | 482 | 11.2% |
| Greek | 27 | 0.6% |
| Guatemalan | 10 | 0.2% |
| Hungarian | 21 | 0.5% |
| Irish | 1,051 | 24.3% |
| Italian | 555 | 12.8% |
| Jamaican | 4 | 0.1% |
| Mexican | 69 | 1.6% |
| Native Hawaiian | 1 | 0.0% |
| Norwegian | 113 | 2.6% |
| Polish | 140 | 3.2% |
| Puerto Rican | 10 | 0.2% |
| Romanian | 13 | 0.3% |
| Russian | 140 | 3.2% |
| Scotch-Irish | 8 | 0.2% |
| Scottish | 106 | 2.5% |
| Slavic | 9 | 0.2% |
| Spanish | 1 | 0.0% |
| Swedish | 40 | 0.9% |
| Swiss | 10 | 0.2% |
| Welsh | 39 | 0.9% |
| West Indian | 12 | 0.3% | View All 41 Rows |
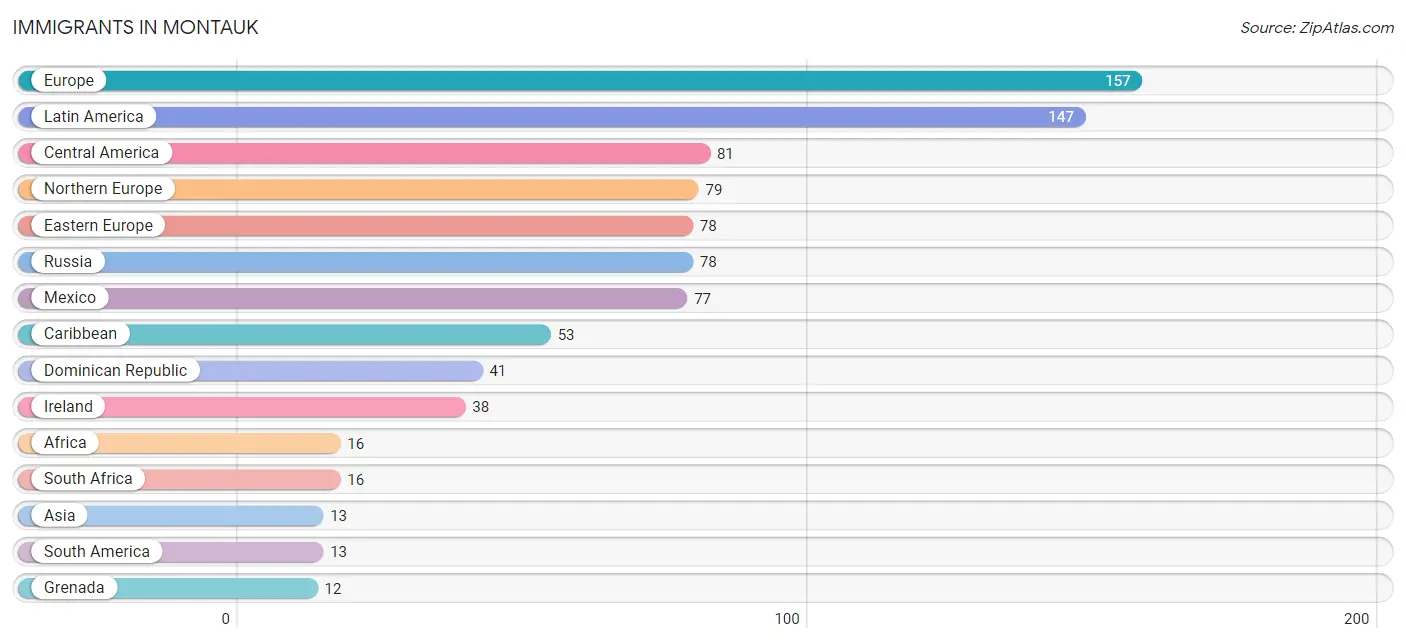
Immigrants in Montauk
The most numerous immigrant groups reported in Montauk came from Europe (157 | 3.6%), Latin America (147 | 3.4%), Central America (81 | 1.9%), Northern Europe (79 | 1.8%), and Eastern Europe (78 | 1.8%), together accounting for 12.5% of all Montauk residents.
| Immigration Origin | # Population | % Population |
| Africa | 16 | 0.4% |
| Asia | 13 | 0.3% |
| Caribbean | 53 | 1.2% |
| Central America | 81 | 1.9% |
| Dominican Republic | 41 | 0.9% |
| Eastern Europe | 78 | 1.8% |
| El Salvador | 4 | 0.1% |
| Europe | 157 | 3.6% |
| Grenada | 12 | 0.3% |
| Ireland | 38 | 0.9% |
| Latin America | 147 | 3.4% |
| Mexico | 77 | 1.8% |
| Northern Europe | 79 | 1.8% |
| Russia | 78 | 1.8% |
| South Africa | 16 | 0.4% |
| South America | 13 | 0.3% |
| South Eastern Asia | 8 | 0.2% |
| Thailand | 8 | 0.2% |
| Western Asia | 5 | 0.1% | View All 19 Rows |
Sex and Age in Montauk
Sex and Age in Montauk
The most populous age groups in Montauk are 30 to 34 Years (249 | 10.8%) for men and 55 to 59 Years (232 | 11.5%) for women.
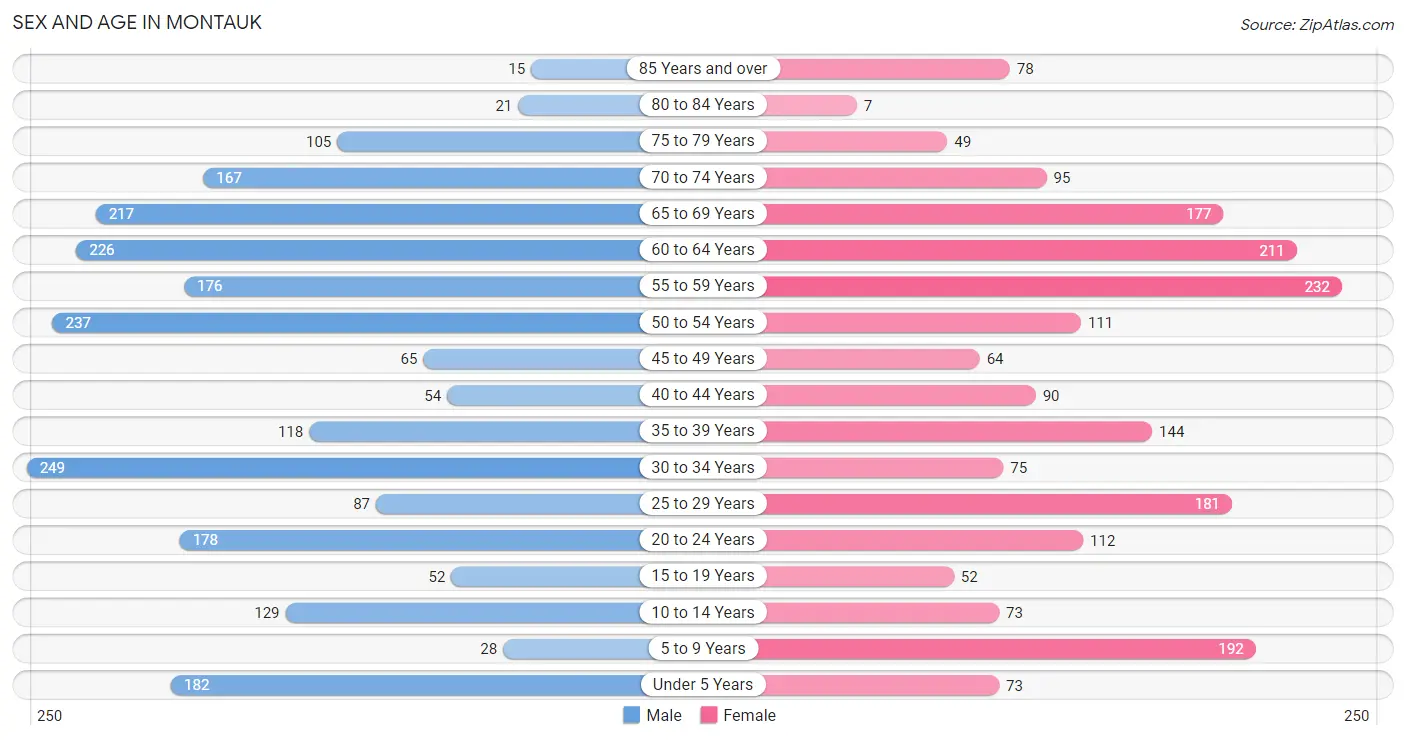
| Age Bracket | Male | Female |
| Under 5 Years | 182 (7.9%) | 73 (3.6%) |
| 5 to 9 Years | 28 (1.2%) | 192 (9.5%) |
| 10 to 14 Years | 129 (5.6%) | 73 (3.6%) |
| 15 to 19 Years | 52 (2.2%) | 52 (2.6%) |
| 20 to 24 Years | 178 (7.7%) | 112 (5.6%) |
| 25 to 29 Years | 87 (3.8%) | 181 (9.0%) |
| 30 to 34 Years | 249 (10.8%) | 75 (3.7%) |
| 35 to 39 Years | 118 (5.1%) | 144 (7.1%) |
| 40 to 44 Years | 54 (2.3%) | 90 (4.5%) |
| 45 to 49 Years | 65 (2.8%) | 64 (3.2%) |
| 50 to 54 Years | 237 (10.3%) | 111 (5.5%) |
| 55 to 59 Years | 176 (7.6%) | 232 (11.5%) |
| 60 to 64 Years | 226 (9.8%) | 211 (10.5%) |
| 65 to 69 Years | 217 (9.4%) | 177 (8.8%) |
| 70 to 74 Years | 167 (7.2%) | 95 (4.7%) |
| 75 to 79 Years | 105 (4.5%) | 49 (2.4%) |
| 80 to 84 Years | 21 (0.9%) | 7 (0.4%) |
| 85 Years and over | 15 (0.6%) | 78 (3.9%) |
| Total | 2,306 (100.0%) | 2,016 (100.0%) |
Families and Households in Montauk
Median Family Size in Montauk
The median family size in Montauk is 3.22 persons per family, with married-couple families (838 | 76.8%) accounting for the largest median family size of 3.44 persons per family. On the other hand, single female/mother families (99 | 9.1%) represent the smallest median family size with 2.26 persons per family.
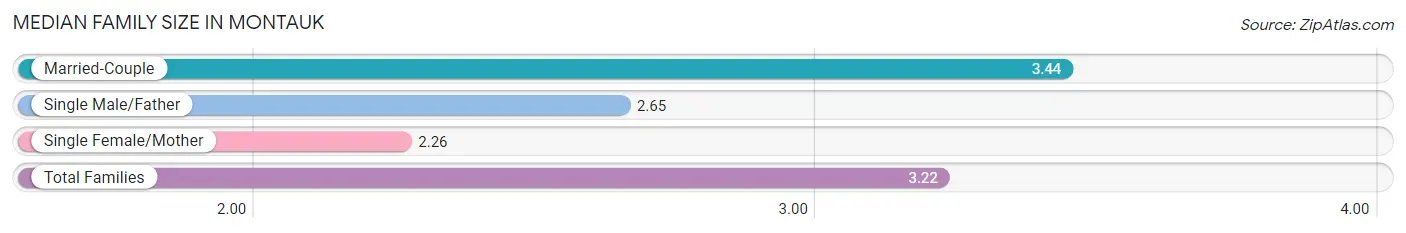
| Family Type | # Families | Family Size |
| Married-Couple | 838 (76.8%) | 3.44 |
| Single Male/Father | 154 (14.1%) | 2.65 |
| Single Female/Mother | 99 (9.1%) | 2.26 |
| Total Families | 1,091 (100.0%) | 3.22 |
Median Household Size in Montauk
The median household size in Montauk is 2.66 persons per household, with married-couple households (838 | 53.0%) accounting for the largest median household size of 3.47 persons per household. non-family households (489 | 30.9%) represent the smallest median household size with 1.18 persons per household.
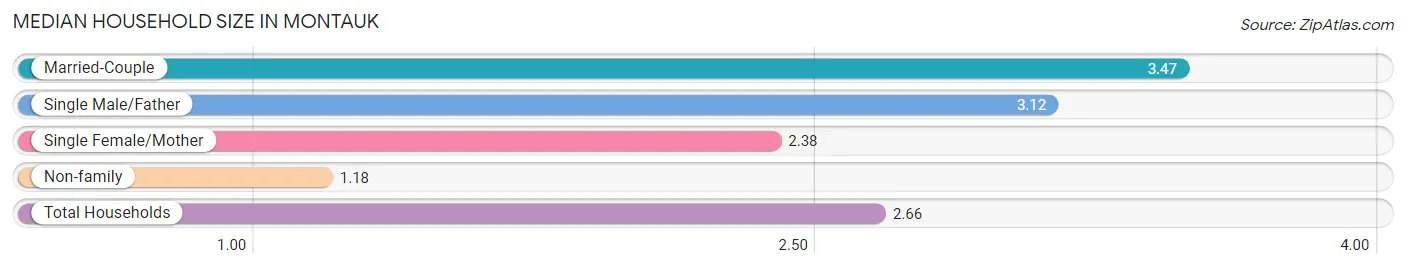
| Household Type | # Households | Household Size |
| Married-Couple | 838 (53.0%) | 3.47 |
| Single Male/Father | 154 (9.8%) | 3.12 |
| Single Female/Mother | 99 (6.3%) | 2.38 |
| Non-family | 489 (30.9%) | 1.18 |
| Total Households | 1,580 (100.0%) | 2.66 |
Household Size by Marriage Status in Montauk
Out of a total of 1,580 households in Montauk, 1,091 (69.1%) are family households, while 489 (30.9%) are nonfamily households. The most numerous type of family households are 2-person households, comprising 507, and the most common type of nonfamily households are 1-person households, comprising 408.
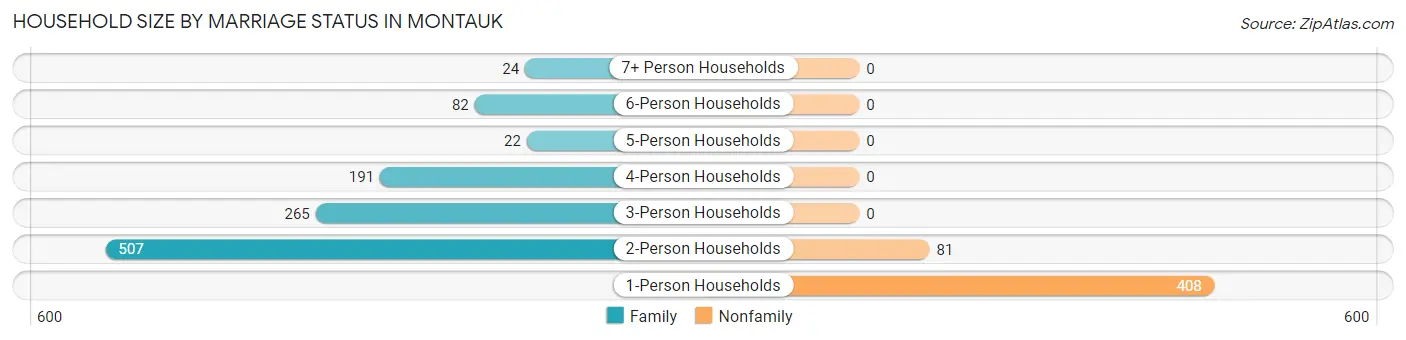
| Household Size | Family Households | Nonfamily Households |
| 1-Person Households | - | 408 (25.8%) |
| 2-Person Households | 507 (32.1%) | 81 (5.1%) |
| 3-Person Households | 265 (16.8%) | 0 (0.0%) |
| 4-Person Households | 191 (12.1%) | 0 (0.0%) |
| 5-Person Households | 22 (1.4%) | 0 (0.0%) |
| 6-Person Households | 82 (5.2%) | 0 (0.0%) |
| 7+ Person Households | 24 (1.5%) | 0 (0.0%) |
| Total | 1,091 (69.1%) | 489 (30.9%) |
Female Fertility in Montauk
Fertility by Age in Montauk
Average fertility rate in Montauk is 95.0 births per 1,000 women. Women in the age bracket of 35 to 50 years have the highest fertility rate with 119.0 births per 1,000 women. Women in the age bracket of 35 to 50 years acount for 53.6% of all women with births.
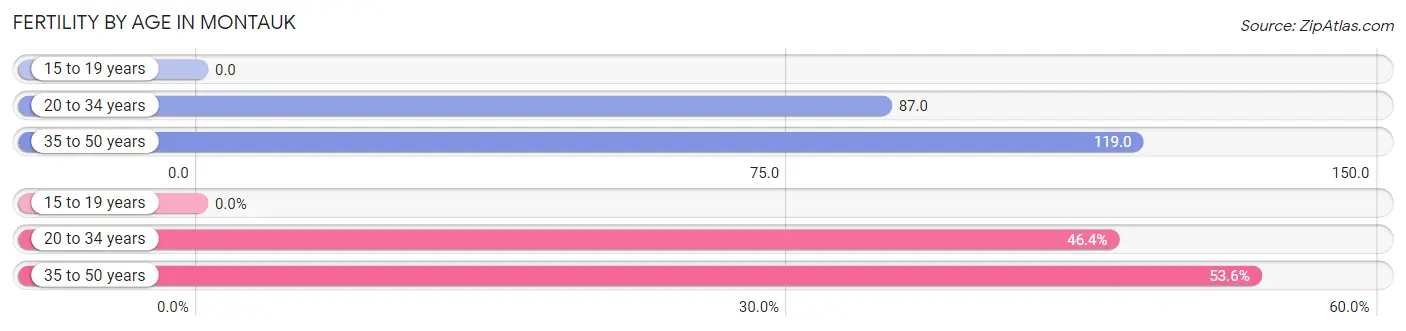
| Age Bracket | Women with Births | Births / 1,000 Women |
| 15 to 19 years | 0 (0.0%) | 0.0 |
| 20 to 34 years | 32 (46.4%) | 87.0 |
| 35 to 50 years | 37 (53.6%) | 119.0 |
| Total | 69 (100.0%) | 95.0 |
Fertility by Age by Marriage Status in Montauk
82.6% of women with births (69) in Montauk are married. The highest percentage of unmarried women with births falls into 20 to 34 years age bracket with 37.5% of them unmarried at the time of birth, while the lowest percentage of unmarried women with births belong to 35 to 50 years age bracket with 0.0% of them unmarried.
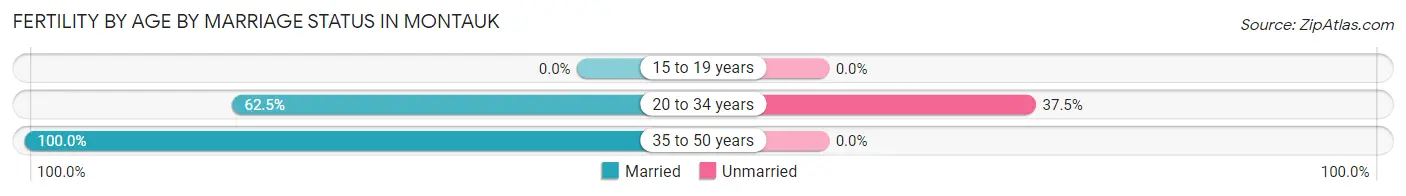
| Age Bracket | Married | Unmarried |
| 15 to 19 years | 0 (0.0%) | 0 (0.0%) |
| 20 to 34 years | 20 (62.5%) | 12 (37.5%) |
| 35 to 50 years | 37 (100.0%) | 0 (0.0%) |
| Total | 57 (82.6%) | 12 (17.4%) |
Fertility by Education in Montauk
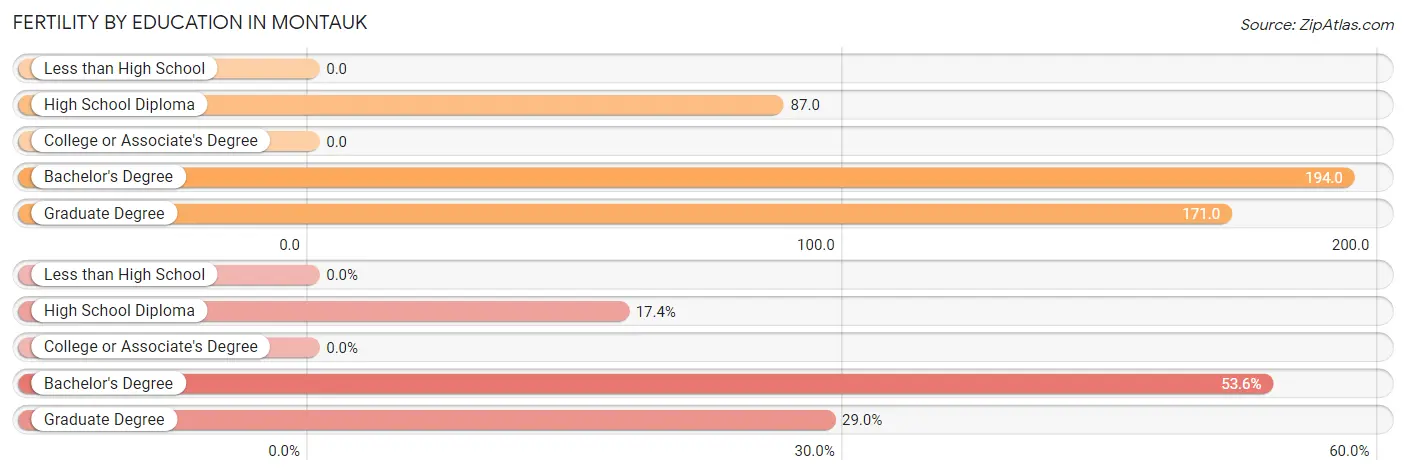
| Educational Attainment | Women with Births | Births / 1,000 Women |
| Less than High School | 0 (0.0%) | 0.0 |
| High School Diploma | 12 (17.4%) | 87.0 |
| College or Associate's Degree | 0 (0.0%) | 0.0 |
| Bachelor's Degree | 37 (53.6%) | 194.0 |
| Graduate Degree | 20 (29.0%) | 171.0 |
| Total | 69 (100.0%) | 95.0 |
Fertility by Education by Marriage Status in Montauk
17.4% of women with births in Montauk are unmarried. Women with the educational attainment of bachelor's degree are most likely to be married with 100.0% of them married at childbirth, while women with the educational attainment of high school diploma are least likely to be married with 100.0% of them unmarried at childbirth.
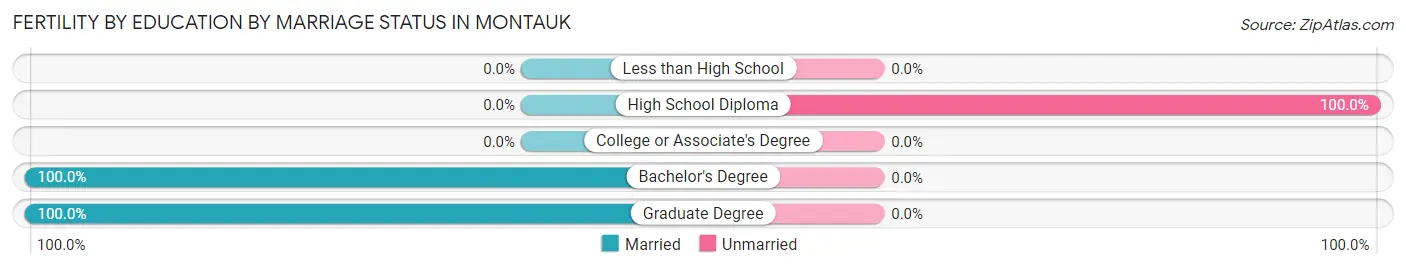
| Educational Attainment | Married | Unmarried |
| Less than High School | 0 (0.0%) | 0 (0.0%) |
| High School Diploma | 0 (0.0%) | 12 (100.0%) |
| College or Associate's Degree | 0 (0.0%) | 0 (0.0%) |
| Bachelor's Degree | 37 (100.0%) | 0 (0.0%) |
| Graduate Degree | 20 (100.0%) | 0 (0.0%) |
| Total | 57 (82.6%) | 12 (17.4%) |
Income in Montauk
Income Overview in Montauk
Per Capita Income in Montauk is $83,843, while median incomes of families and households are $162,969 and $138,900 respectively.
| Characteristic | Number | Measure |
| Per Capita Income | 4,322 | $83,843 |
| Median Family Income | 1,091 | $162,969 |
| Mean Family Income | 1,091 | $249,109 |
| Median Household Income | 1,580 | $138,900 |
| Mean Household Income | 1,580 | $225,834 |
| Income Deficit | 1,091 | $0 |
| Wage / Income Gap (%) | 4,322 | 36.43% |
| Wage / Income Gap ($) | 4,322 | 63.57¢ per $1 |
| Gini / Inequality Index | 4,322 | 0.52 |
Earnings by Sex in Montauk
Average Earnings in Montauk are $59,754, $70,234 for men and $44,647 for women, a difference of 36.4%.
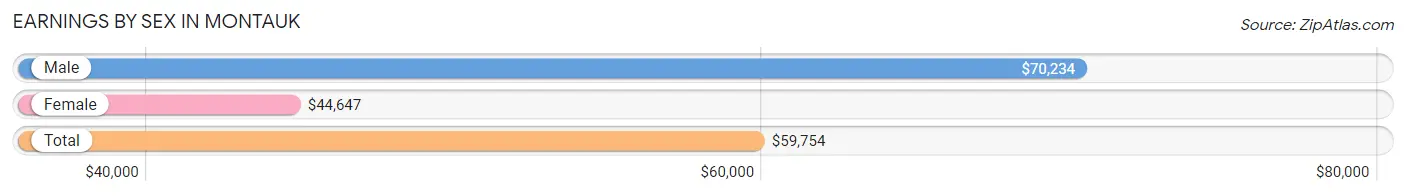
| Sex | Number | Average Earnings |
| Male | 1,308 (58.2%) | $70,234 |
| Female | 939 (41.8%) | $44,647 |
| Total | 2,247 (100.0%) | $59,754 |
Earnings by Sex by Income Bracket in Montauk
The most common earnings brackets in Montauk are $100,000+ for men (544 | 41.6%) and $100,000+ for women (243 | 25.9%).
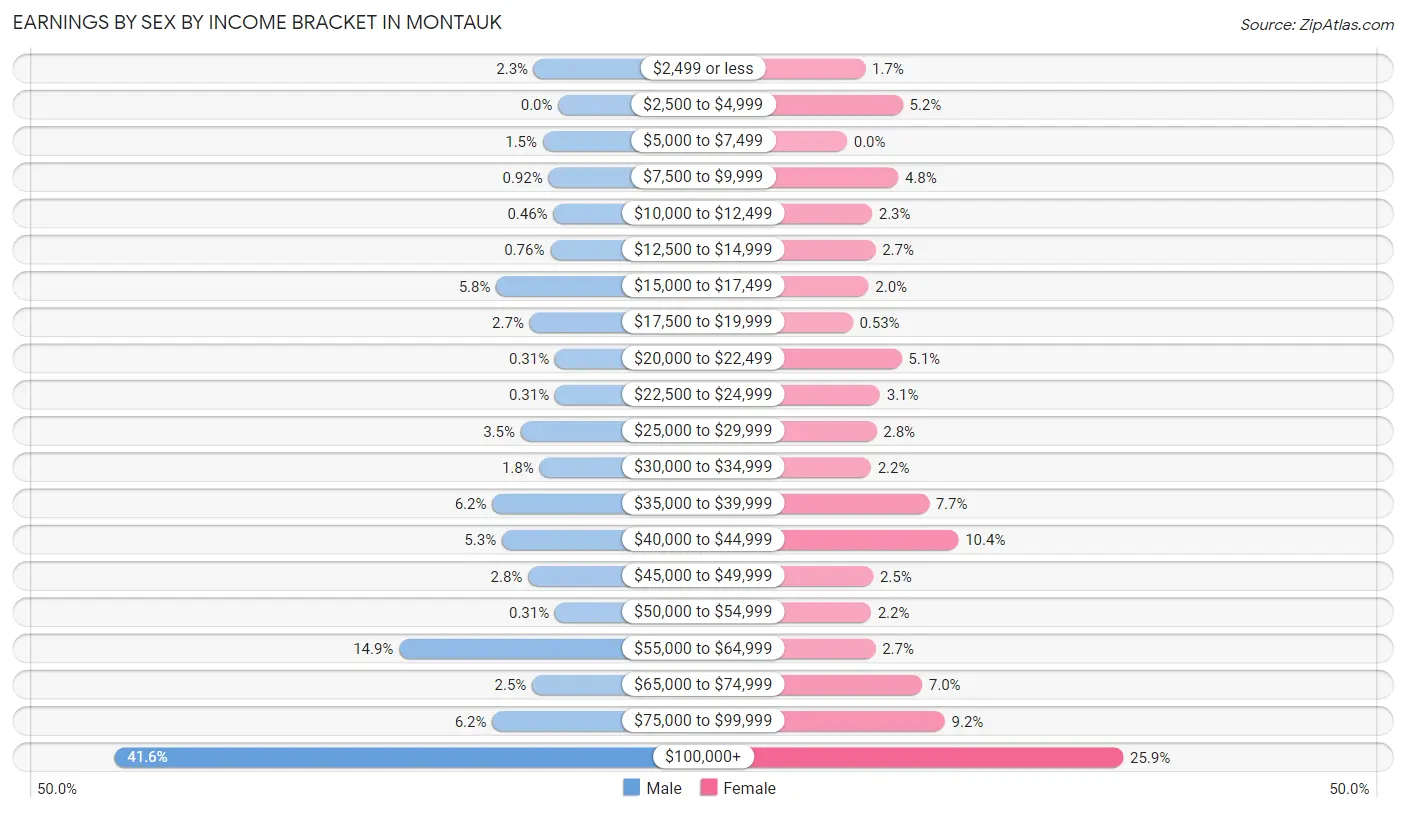
| Income | Male | Female |
| $2,499 or less | 30 (2.3%) | 16 (1.7%) |
| $2,500 to $4,999 | 0 (0.0%) | 49 (5.2%) |
| $5,000 to $7,499 | 19 (1.5%) | 0 (0.0%) |
| $7,500 to $9,999 | 12 (0.9%) | 45 (4.8%) |
| $10,000 to $12,499 | 6 (0.5%) | 22 (2.3%) |
| $12,500 to $14,999 | 10 (0.8%) | 25 (2.7%) |
| $15,000 to $17,499 | 76 (5.8%) | 19 (2.0%) |
| $17,500 to $19,999 | 35 (2.7%) | 5 (0.5%) |
| $20,000 to $22,499 | 4 (0.3%) | 48 (5.1%) |
| $22,500 to $24,999 | 4 (0.3%) | 29 (3.1%) |
| $25,000 to $29,999 | 46 (3.5%) | 26 (2.8%) |
| $30,000 to $34,999 | 23 (1.8%) | 21 (2.2%) |
| $35,000 to $39,999 | 81 (6.2%) | 72 (7.7%) |
| $40,000 to $44,999 | 69 (5.3%) | 98 (10.4%) |
| $45,000 to $49,999 | 37 (2.8%) | 23 (2.5%) |
| $50,000 to $54,999 | 4 (0.3%) | 21 (2.2%) |
| $55,000 to $64,999 | 195 (14.9%) | 25 (2.7%) |
| $65,000 to $74,999 | 32 (2.5%) | 66 (7.0%) |
| $75,000 to $99,999 | 81 (6.2%) | 86 (9.2%) |
| $100,000+ | 544 (41.6%) | 243 (25.9%) |
| Total | 1,308 (100.0%) | 939 (100.0%) |
Earnings by Sex by Educational Attainment in Montauk
Average earnings in Montauk are $92,273 for men and $57,788 for women, a difference of 37.4%. Men with an educational attainment of bachelor's degree enjoy the highest average annual earnings of $131,429, while those with less than high school education earn the least with $38,558. Women with an educational attainment of graduate degree earn the most with the average annual earnings of $133,519, while those with high school diploma education have the smallest earnings of $38,413.
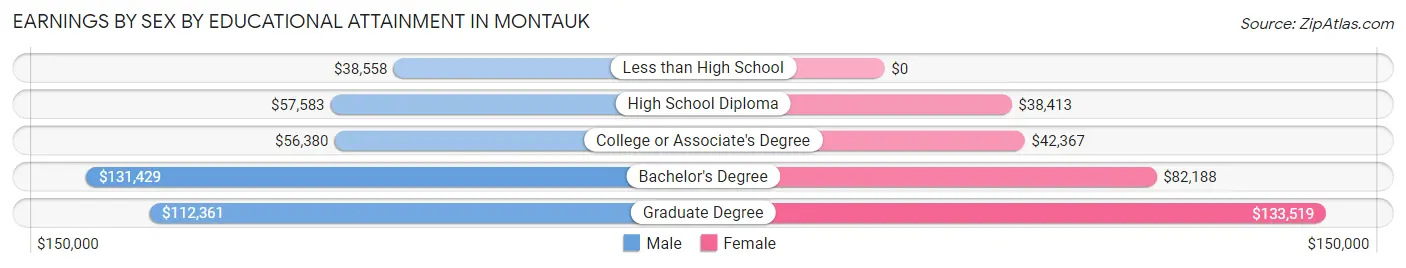
| Educational Attainment | Male Income | Female Income |
| Less than High School | $38,558 | $0 |
| High School Diploma | $57,583 | $38,413 |
| College or Associate's Degree | $56,380 | $42,367 |
| Bachelor's Degree | $131,429 | $82,188 |
| Graduate Degree | $112,361 | $133,519 |
| Total | $92,273 | $57,788 |
Family Income in Montauk
Family Income Brackets in Montauk
According to the Montauk family income data, there are 399 families falling into the $200,000+ income range, which is the most common income bracket and makes up 36.6% of all families.
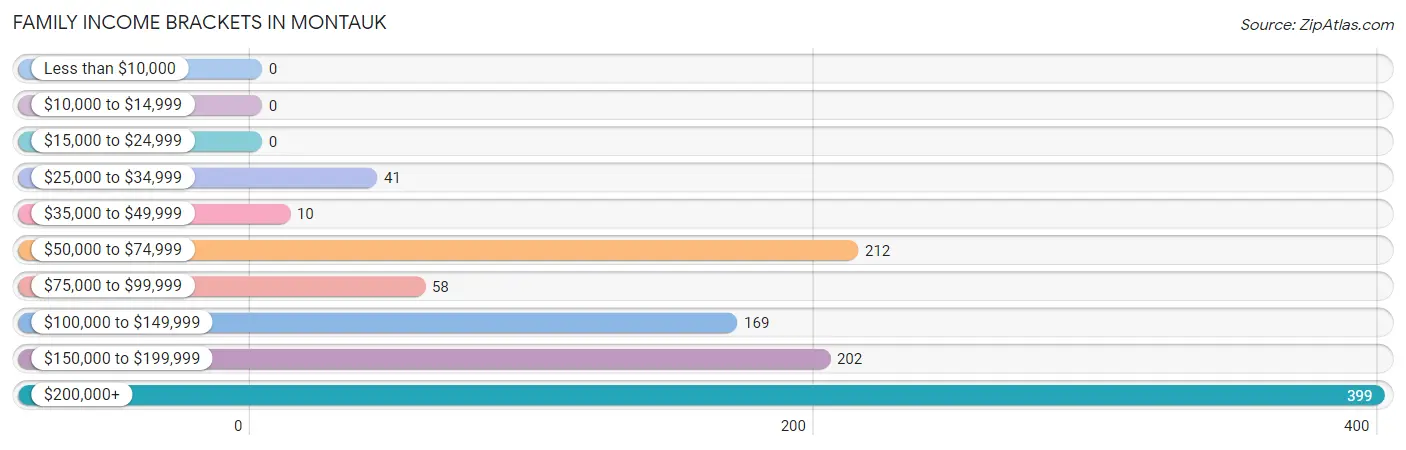
| Income Bracket | # Families | % Families |
| Less than $10,000 | 0 | 0.0% |
| $10,000 to $14,999 | 0 | 0.0% |
| $15,000 to $24,999 | 0 | 0.0% |
| $25,000 to $34,999 | 41 | 3.8% |
| $35,000 to $49,999 | 10 | 0.9% |
| $50,000 to $74,999 | 212 | 19.4% |
| $75,000 to $99,999 | 58 | 5.3% |
| $100,000 to $149,999 | 169 | 15.5% |
| $150,000 to $199,999 | 202 | 18.5% |
| $200,000+ | 399 | 36.6% |
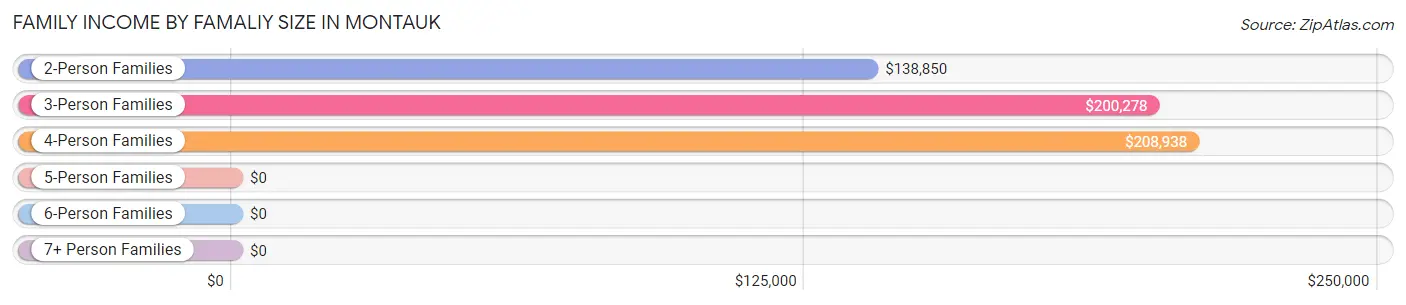
Family Income by Famaliy Size in Montauk
4-person families (125 | 11.5%) account for the highest median family income in Montauk with $208,938 per family, while 2-person families (521 | 47.7%) have the highest median income of $69,425 per family member.
| Income Bracket | # Families | Median Income |
| 2-Person Families | 521 (47.7%) | $138,850 |
| 3-Person Families | 326 (29.9%) | $200,278 |
| 4-Person Families | 125 (11.5%) | $208,938 |
| 5-Person Families | 13 (1.2%) | $0 |
| 6-Person Families | 82 (7.5%) | $0 |
| 7+ Person Families | 24 (2.2%) | $0 |
| Total | 1,091 (100.0%) | $162,969 |
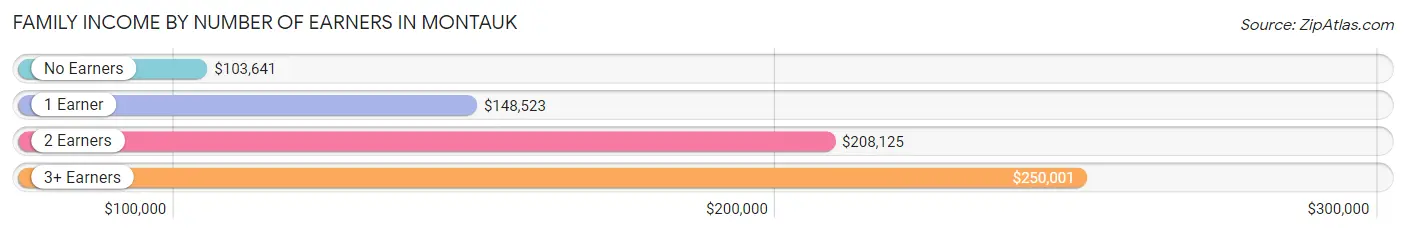
Family Income by Number of Earners in Montauk
The median family income in Montauk is $162,969, with families comprising 3+ earners (91) having the highest median family income of $250,001, while families with no earners (159) have the lowest median family income of $103,641, accounting for 8.3% and 14.6% of families, respectively.
| Number of Earners | # Families | Median Income |
| No Earners | 159 (14.6%) | $103,641 |
| 1 Earner | 493 (45.2%) | $148,523 |
| 2 Earners | 348 (31.9%) | $208,125 |
| 3+ Earners | 91 (8.3%) | $250,001 |
| Total | 1,091 (100.0%) | $162,969 |
Household Income in Montauk
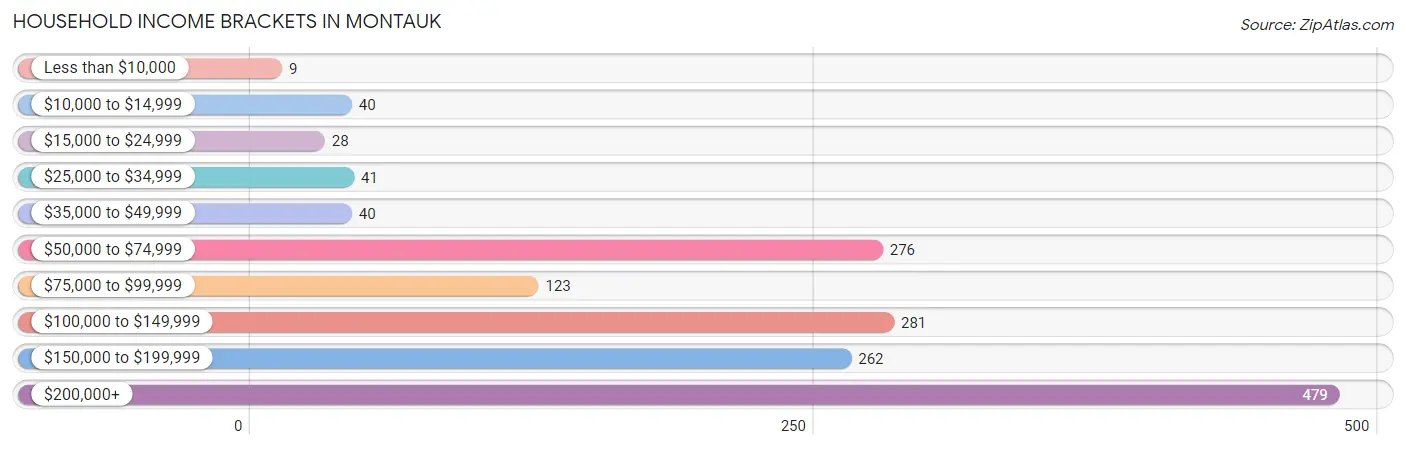
Household Income Brackets in Montauk
With 479 households falling in the category, the $200,000+ income range is the most frequent in Montauk, accounting for 30.3% of all households. In contrast, only 9 households (0.6%) fall into the less than $10,000 income bracket, making it the least populous group.
| Income Bracket | # Households | % Households |
| Less than $10,000 | 9 | 0.6% |
| $10,000 to $14,999 | 40 | 2.5% |
| $15,000 to $24,999 | 28 | 1.8% |
| $25,000 to $34,999 | 41 | 2.6% |
| $35,000 to $49,999 | 40 | 2.5% |
| $50,000 to $74,999 | 276 | 17.5% |
| $75,000 to $99,999 | 123 | 7.8% |
| $100,000 to $149,999 | 281 | 17.8% |
| $150,000 to $199,999 | 262 | 16.6% |
| $200,000+ | 479 | 30.3% |
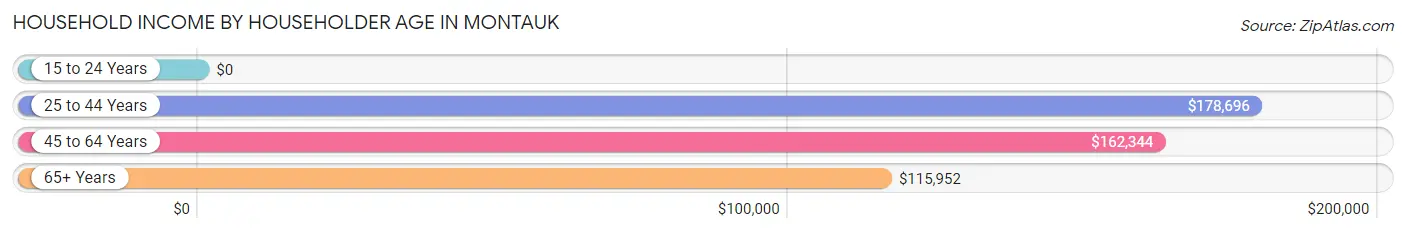
Household Income by Householder Age in Montauk
The median household income in Montauk is $138,900, with the highest median household income of $178,696 found in the 25 to 44 years age bracket for the primary householder. A total of 316 households (20.0%) fall into this category. Meanwhile, the 15 to 24 years age bracket for the primary householder has the lowest median household income of $0, with 80 households (5.1%) in this group.
| Income Bracket | # Households | Median Income |
| 15 to 24 Years | 80 (5.1%) | $0 |
| 25 to 44 Years | 316 (20.0%) | $178,696 |
| 45 to 64 Years | 610 (38.6%) | $162,344 |
| 65+ Years | 574 (36.3%) | $115,952 |
| Total | 1,580 (100.0%) | $138,900 |
Poverty in Montauk
Income Below Poverty by Sex and Age in Montauk
With 2.0% poverty level for males and 3.9% for females among the residents of Montauk, 18 to 24 year old males and 18 to 24 year old females are the most vulnerable to poverty, with 20 males (12.1%) and 20 females (13.3%) in their respective age groups living below the poverty level.
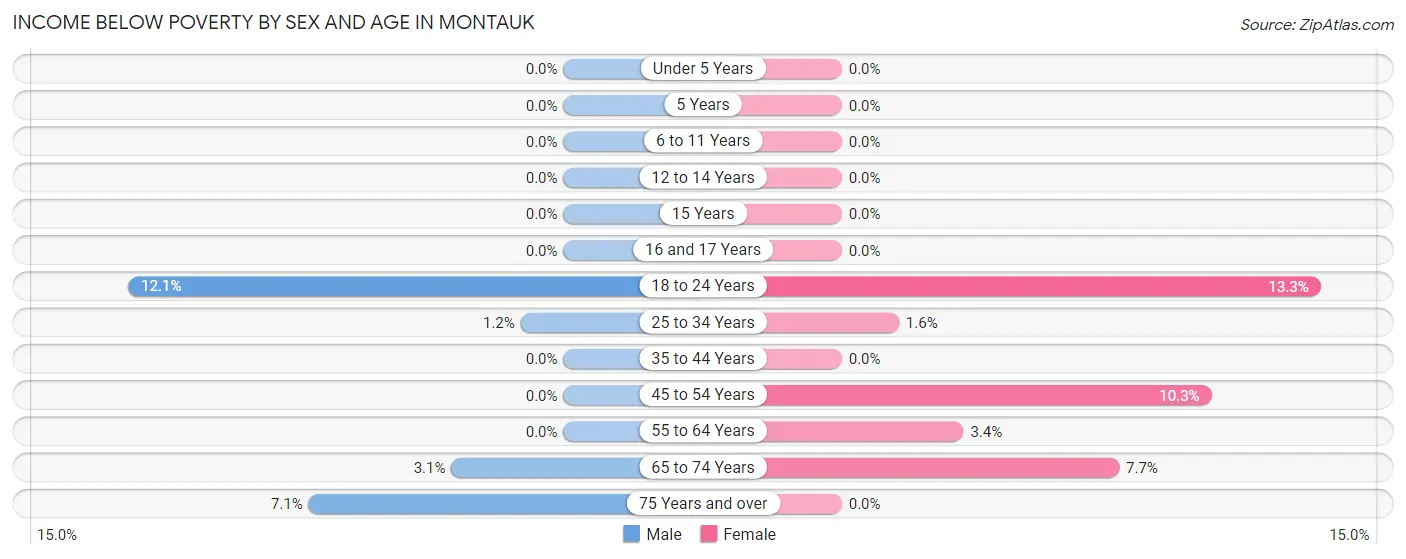
| Age Bracket | Male | Female |
| Under 5 Years | 0 (0.0%) | 0 (0.0%) |
| 5 Years | 0 (0.0%) | 0 (0.0%) |
| 6 to 11 Years | 0 (0.0%) | 0 (0.0%) |
| 12 to 14 Years | 0 (0.0%) | 0 (0.0%) |
| 15 Years | 0 (0.0%) | 0 (0.0%) |
| 16 and 17 Years | 0 (0.0%) | 0 (0.0%) |
| 18 to 24 Years | 20 (12.1%) | 20 (13.3%) |
| 25 to 34 Years | 4 (1.2%) | 4 (1.6%) |
| 35 to 44 Years | 0 (0.0%) | 0 (0.0%) |
| 45 to 54 Years | 0 (0.0%) | 18 (10.3%) |
| 55 to 64 Years | 0 (0.0%) | 15 (3.4%) |
| 65 to 74 Years | 12 (3.1%) | 21 (7.7%) |
| 75 Years and over | 10 (7.1%) | 0 (0.0%) |
| Total | 46 (2.0%) | 78 (3.9%) |
Income Above Poverty by Sex and Age in Montauk
According to the poverty statistics in Montauk, males aged under 5 years and females aged under 5 years are the age groups that are most secure financially, with 100.0% of males and 100.0% of females in these age groups living above the poverty line.
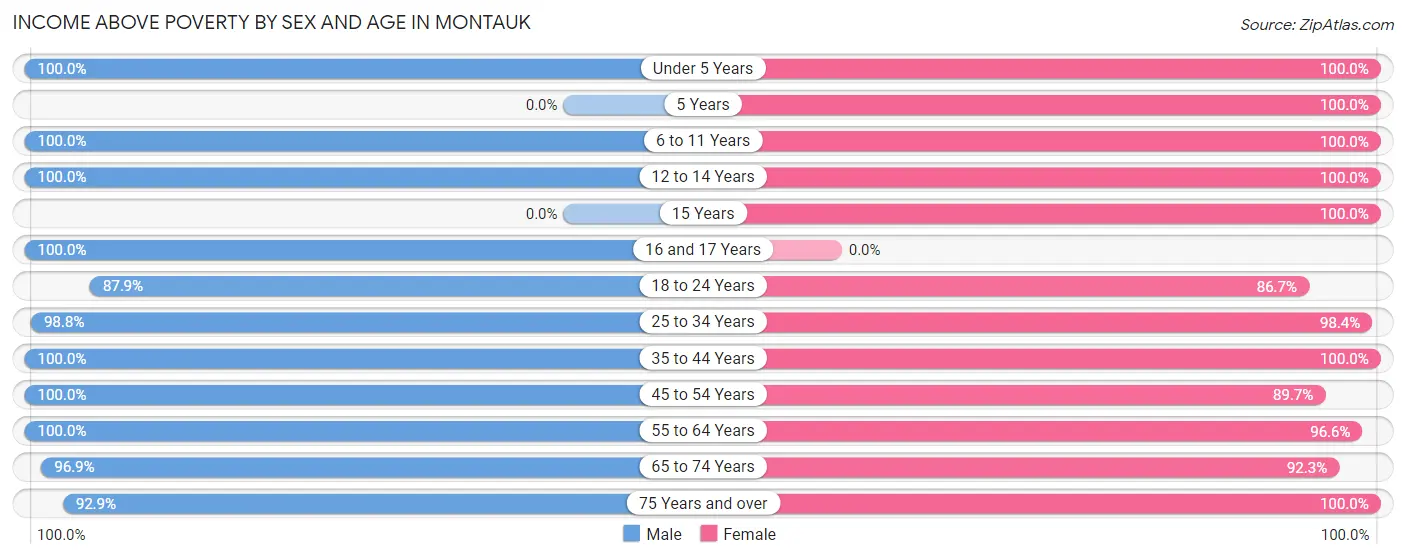
| Age Bracket | Male | Female |
| Under 5 Years | 153 (100.0%) | 73 (100.0%) |
| 5 Years | 0 (0.0%) | 30 (100.0%) |
| 6 to 11 Years | 132 (100.0%) | 162 (100.0%) |
| 12 to 14 Years | 25 (100.0%) | 73 (100.0%) |
| 15 Years | 0 (0.0%) | 14 (100.0%) |
| 16 and 17 Years | 50 (100.0%) | 0 (0.0%) |
| 18 to 24 Years | 145 (87.9%) | 130 (86.7%) |
| 25 to 34 Years | 332 (98.8%) | 247 (98.4%) |
| 35 to 44 Years | 172 (100.0%) | 234 (100.0%) |
| 45 to 54 Years | 302 (100.0%) | 157 (89.7%) |
| 55 to 64 Years | 402 (100.0%) | 428 (96.6%) |
| 65 to 74 Years | 372 (96.9%) | 251 (92.3%) |
| 75 Years and over | 131 (92.9%) | 134 (100.0%) |
| Total | 2,216 (98.0%) | 1,933 (96.1%) |
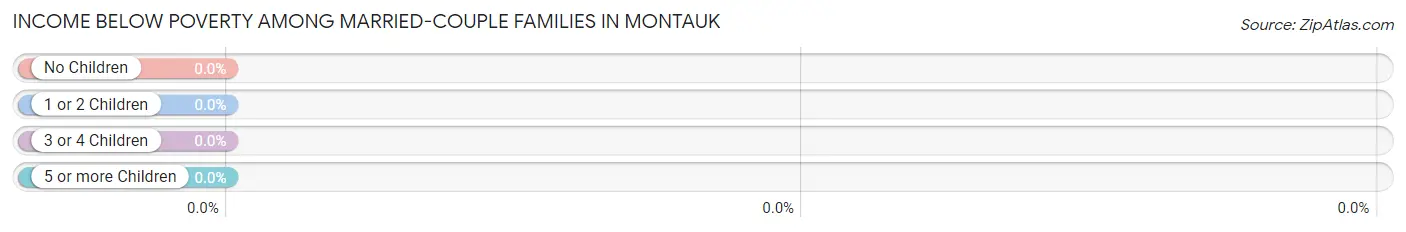
Income Below Poverty Among Married-Couple Families in Montauk
| Children | Above Poverty | Below Poverty |
| No Children | 599 (100.0%) | 0 (0.0%) |
| 1 or 2 Children | 185 (100.0%) | 0 (0.0%) |
| 3 or 4 Children | 54 (100.0%) | 0 (0.0%) |
| 5 or more Children | 0 (0.0%) | 0 (0.0%) |
| Total | 838 (100.0%) | 0 (0.0%) |
Income Below Poverty Among Single-Parent Households in Montauk
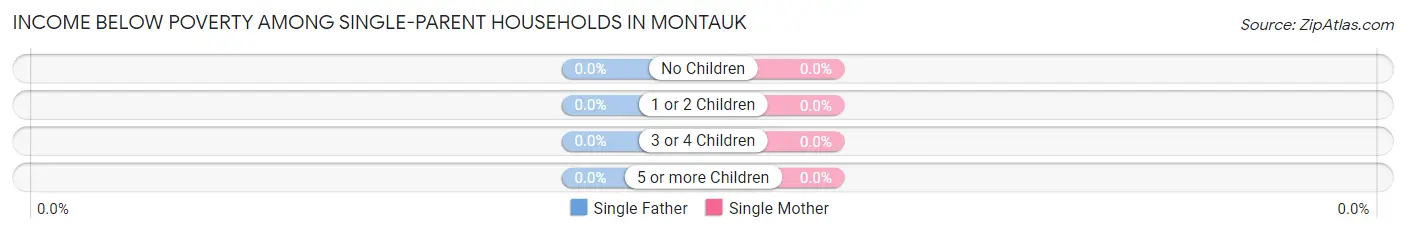
| Children | Single Father | Single Mother |
| No Children | 0 (0.0%) | 0 (0.0%) |
| 1 or 2 Children | 0 (0.0%) | 0 (0.0%) |
| 3 or 4 Children | 0 (0.0%) | 0 (0.0%) |
| 5 or more Children | 0 (0.0%) | 0 (0.0%) |
| Total | 0 (0.0%) | 0 (0.0%) |
Income Below Poverty Among Married-Couple vs Single-Parent Households in Montauk
| Children | Married-Couple Families | Single-Parent Households |
| No Children | 0 (0.0%) | 0 (0.0%) |
| 1 or 2 Children | 0 (0.0%) | 0 (0.0%) |
| 3 or 4 Children | 0 (0.0%) | 0 (0.0%) |
| 5 or more Children | 0 (0.0%) | 0 (0.0%) |
| Total | 0 (0.0%) | 0 (0.0%) |
Employment Characteristics in Montauk
Employment by Class of Employer in Montauk
Among the 2,065 employed individuals in Montauk, private company employees (969 | 46.9%), local government employees (369 | 17.9%), and self-employed (incorporated) (245 | 11.9%) make up the most common classes of employment.
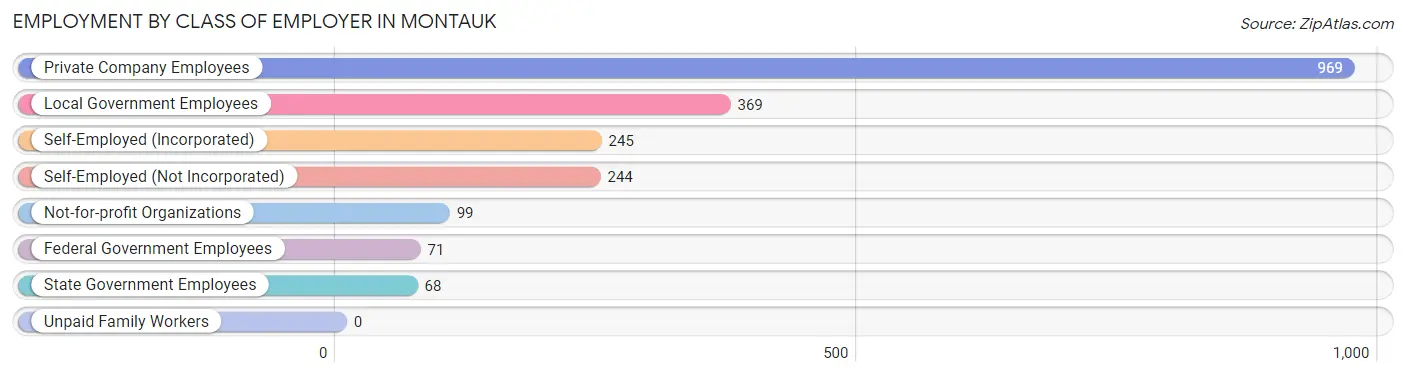
| Employer Class | # Employees | % Employees |
| Private Company Employees | 969 | 46.9% |
| Self-Employed (Incorporated) | 245 | 11.9% |
| Self-Employed (Not Incorporated) | 244 | 11.8% |
| Not-for-profit Organizations | 99 | 4.8% |
| Local Government Employees | 369 | 17.9% |
| State Government Employees | 68 | 3.3% |
| Federal Government Employees | 71 | 3.4% |
| Unpaid Family Workers | 0 | 0.0% |
| Total | 2,065 | 100.0% |
Employment Status by Age in Montauk
According to the labor force statistics for Montauk, out of the total population over 16 years of age (3,631), 61.6% or 2,237 individuals are in the labor force, with 5.5% or 123 of them unemployed. The age group with the highest labor force participation rate is 25 to 29 years, with 86.2% or 231 individuals in the labor force. Within the labor force, the 75 years and over age range has the highest percentage of unemployed individuals, with 46.2% or 12 of them being unemployed.
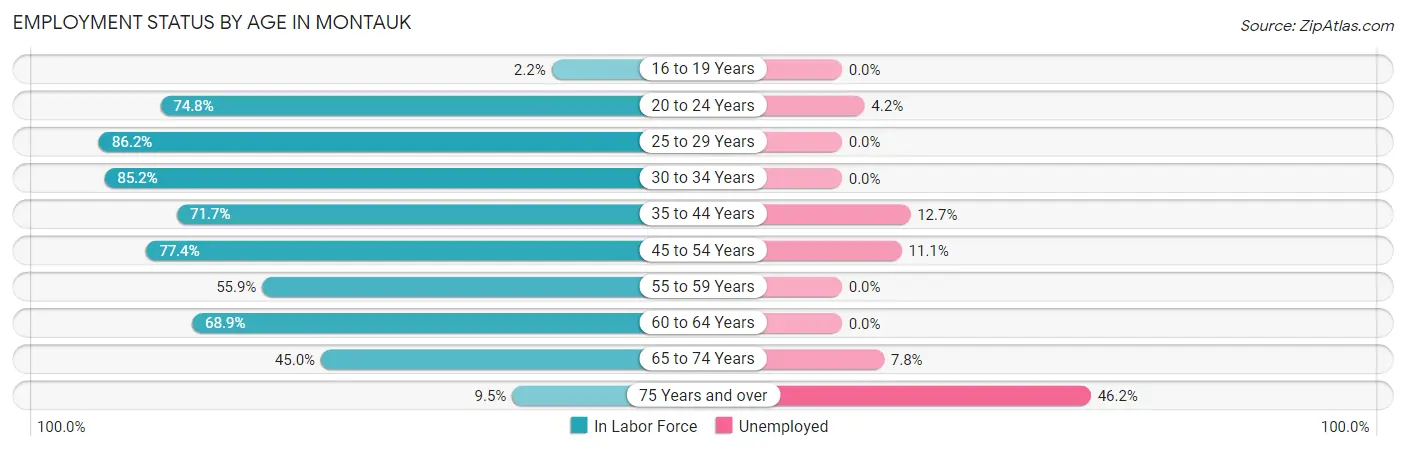
| Age Bracket | In Labor Force | Unemployed |
| 16 to 19 Years | 2 (2.2%) | 0 (0.0%) |
| 20 to 24 Years | 217 (74.8%) | 9 (4.2%) |
| 25 to 29 Years | 231 (86.2%) | 0 (0.0%) |
| 30 to 34 Years | 276 (85.2%) | 0 (0.0%) |
| 35 to 44 Years | 291 (71.7%) | 37 (12.7%) |
| 45 to 54 Years | 369 (77.4%) | 41 (11.1%) |
| 55 to 59 Years | 228 (55.9%) | 0 (0.0%) |
| 60 to 64 Years | 301 (68.9%) | 0 (0.0%) |
| 65 to 74 Years | 295 (45.0%) | 23 (7.8%) |
| 75 Years and over | 26 (9.5%) | 12 (46.2%) |
| Total | 2,237 (61.6%) | 123 (5.5%) |
Employment Status by Educational Attainment in Montauk
According to labor force statistics for Montauk, 73.1% of individuals (1,696) out of the total population between 25 and 64 years of age (2,320) are in the labor force, with 4.6% or 78 of them being unemployed. The group with the highest labor force participation rate are those with the educational attainment of high school diploma, with 92.0% or 496 individuals in the labor force. Within the labor force, individuals with high school diploma education have the highest percentage of unemployment, with 6.3% or 31 of them being unemployed.
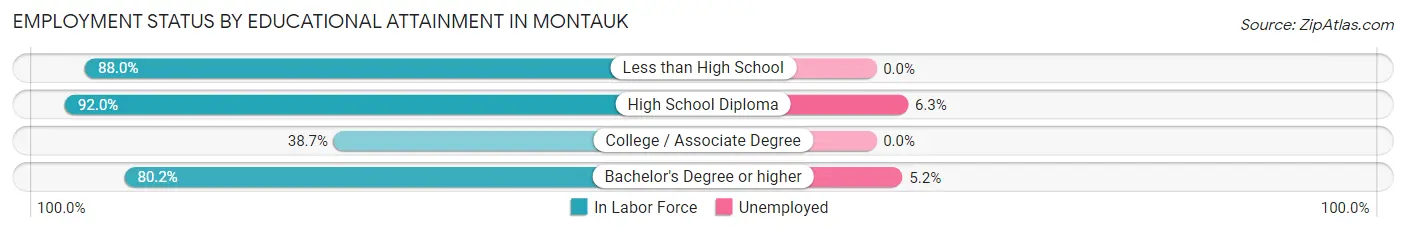
| Educational Attainment | In Labor Force | Unemployed |
| Less than High School | 73 (88.0%) | 0 (0.0%) |
| High School Diploma | 496 (92.0%) | 34 (6.3%) |
| College / Associate Degree | 218 (38.7%) | 0 (0.0%) |
| Bachelor's Degree or higher | 909 (80.2%) | 59 (5.2%) |
| Total | 1,696 (73.1%) | 107 (4.6%) |
Employment Occupations by Sex in Montauk
Management, Business, Science and Arts Occupations
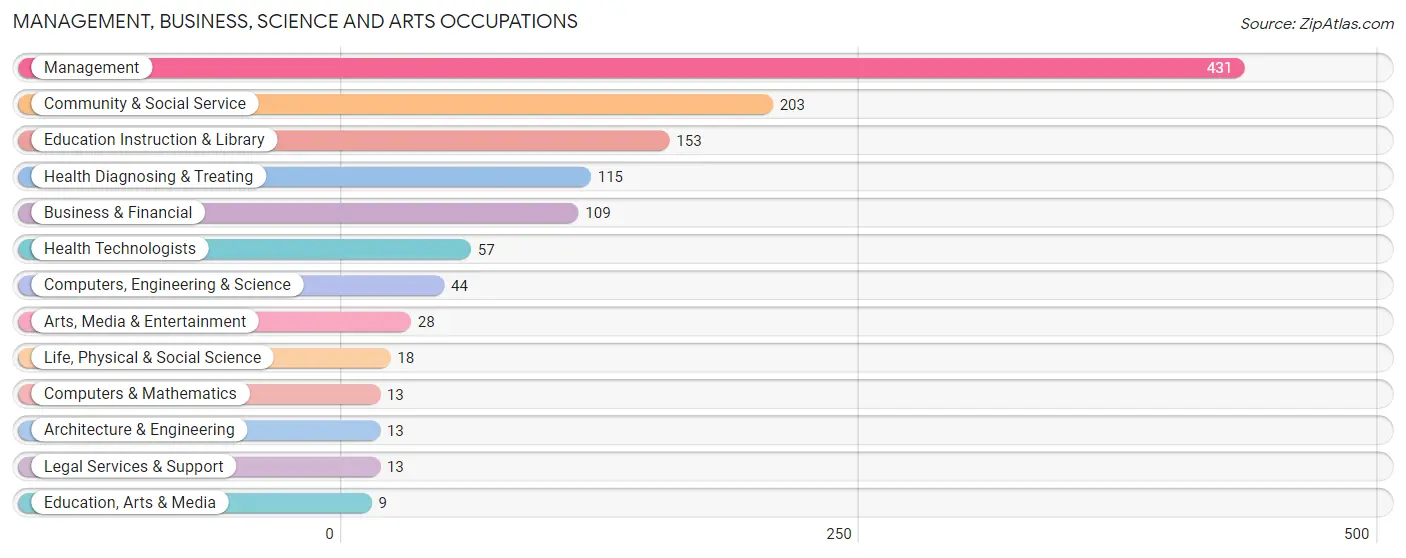
The most common Management, Business, Science and Arts occupations in Montauk are Management (431 | 20.4%), Community & Social Service (203 | 9.6%), Education Instruction & Library (153 | 7.3%), Health Diagnosing & Treating (115 | 5.5%), and Business & Financial (109 | 5.2%).
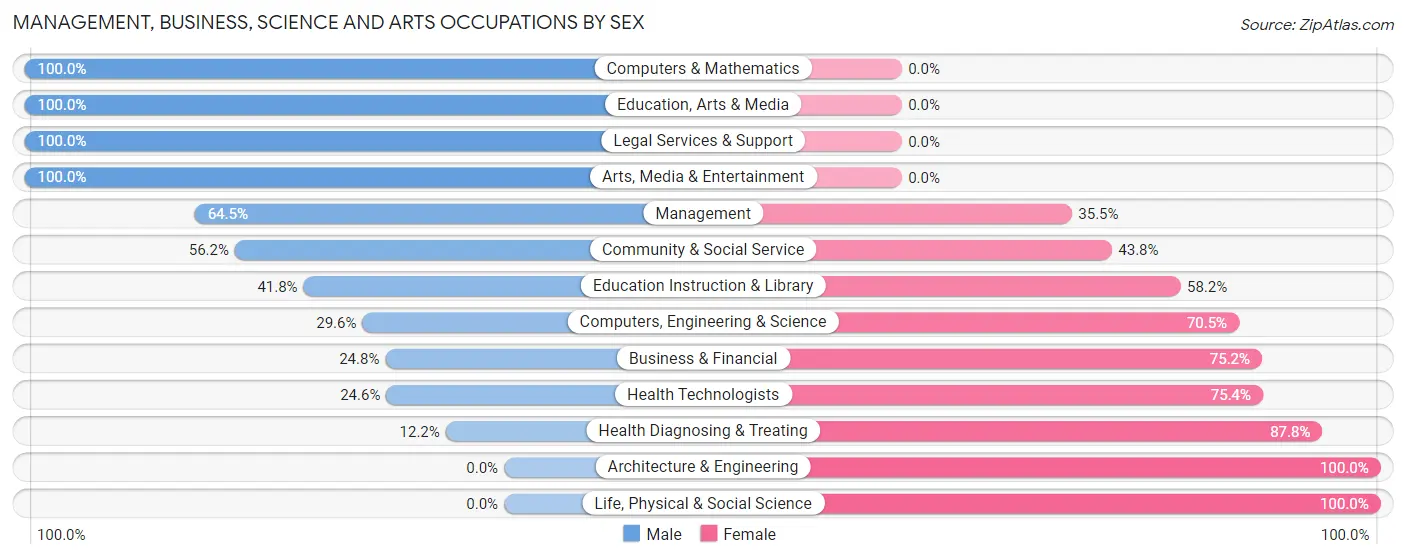
Management, Business, Science and Arts Occupations by Sex
Within the Management, Business, Science and Arts occupations in Montauk, the most male-oriented occupations are Computers & Mathematics (100.0%), Education, Arts & Media (100.0%), and Legal Services & Support (100.0%), while the most female-oriented occupations are Architecture & Engineering (100.0%), Life, Physical & Social Science (100.0%), and Health Diagnosing & Treating (87.8%).
| Occupation | Male | Female |
| Management | 278 (64.5%) | 153 (35.5%) |
| Business & Financial | 27 (24.8%) | 82 (75.2%) |
| Computers, Engineering & Science | 13 (29.5%) | 31 (70.5%) |
| Computers & Mathematics | 13 (100.0%) | 0 (0.0%) |
| Architecture & Engineering | 0 (0.0%) | 13 (100.0%) |
| Life, Physical & Social Science | 0 (0.0%) | 18 (100.0%) |
| Community & Social Service | 114 (56.2%) | 89 (43.8%) |
| Education, Arts & Media | 9 (100.0%) | 0 (0.0%) |
| Legal Services & Support | 13 (100.0%) | 0 (0.0%) |
| Education Instruction & Library | 64 (41.8%) | 89 (58.2%) |
| Arts, Media & Entertainment | 28 (100.0%) | 0 (0.0%) |
| Health Diagnosing & Treating | 14 (12.2%) | 101 (87.8%) |
| Health Technologists | 14 (24.6%) | 43 (75.4%) |
| Total (Category) | 446 (49.4%) | 456 (50.5%) |
| Total (Overall) | 1,301 (61.7%) | 807 (38.3%) |
Services Occupations
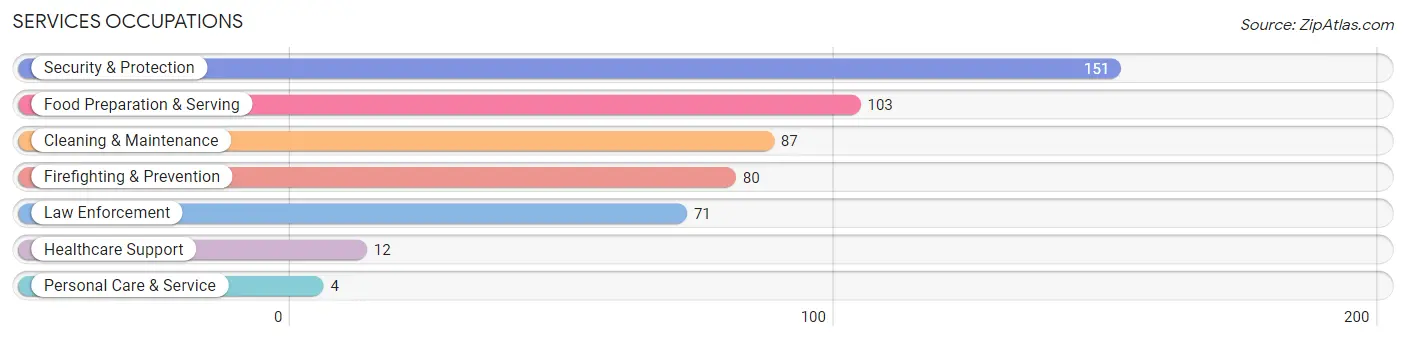
The most common Services occupations in Montauk are Security & Protection (151 | 7.2%), Food Preparation & Serving (103 | 4.9%), Cleaning & Maintenance (87 | 4.1%), Firefighting & Prevention (80 | 3.8%), and Law Enforcement (71 | 3.4%).
Services Occupations by Sex
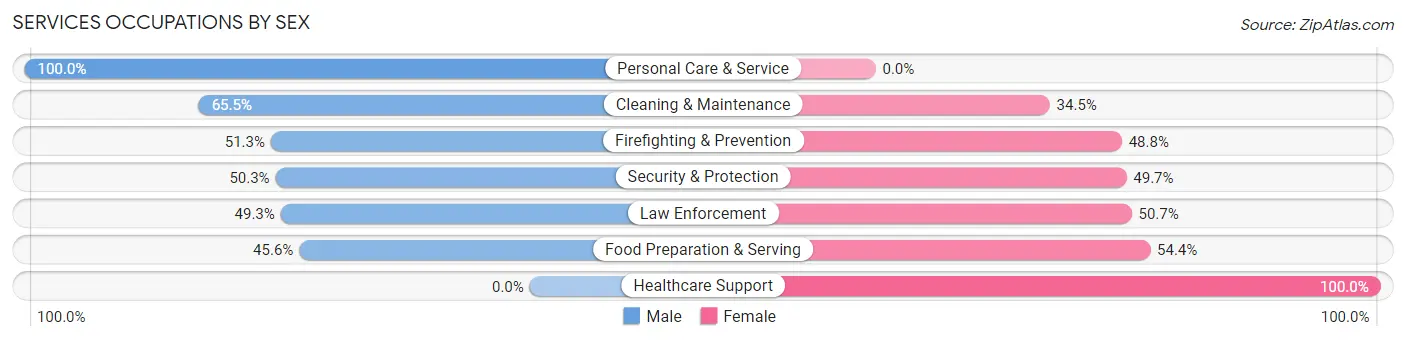
Within the Services occupations in Montauk, the most male-oriented occupations are Personal Care & Service (100.0%), Cleaning & Maintenance (65.5%), and Firefighting & Prevention (51.2%), while the most female-oriented occupations are Healthcare Support (100.0%), Food Preparation & Serving (54.4%), and Law Enforcement (50.7%).
| Occupation | Male | Female |
| Healthcare Support | 0 (0.0%) | 12 (100.0%) |
| Security & Protection | 76 (50.3%) | 75 (49.7%) |
| Firefighting & Prevention | 41 (51.2%) | 39 (48.7%) |
| Law Enforcement | 35 (49.3%) | 36 (50.7%) |
| Food Preparation & Serving | 47 (45.6%) | 56 (54.4%) |
| Cleaning & Maintenance | 57 (65.5%) | 30 (34.5%) |
| Personal Care & Service | 4 (100.0%) | 0 (0.0%) |
| Total (Category) | 184 (51.5%) | 173 (48.5%) |
| Total (Overall) | 1,301 (61.7%) | 807 (38.3%) |
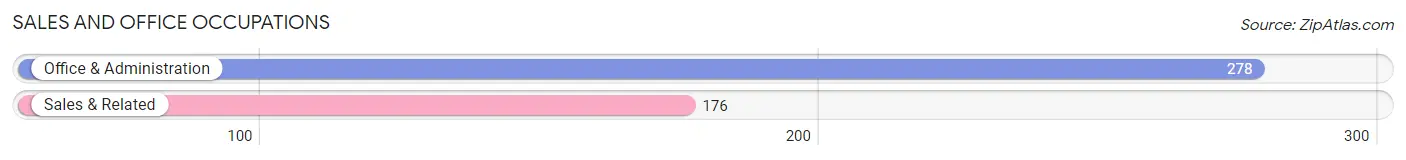
Sales and Office Occupations
The most common Sales and Office occupations in Montauk are Office & Administration (278 | 13.2%), and Sales & Related (176 | 8.4%).
Sales and Office Occupations by Sex
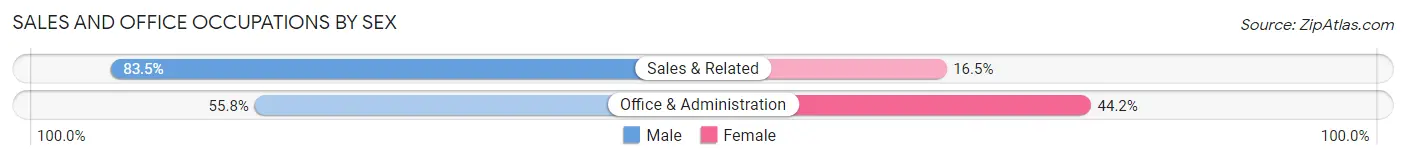
| Occupation | Male | Female |
| Sales & Related | 147 (83.5%) | 29 (16.5%) |
| Office & Administration | 155 (55.8%) | 123 (44.2%) |
| Total (Category) | 302 (66.5%) | 152 (33.5%) |
| Total (Overall) | 1,301 (61.7%) | 807 (38.3%) |
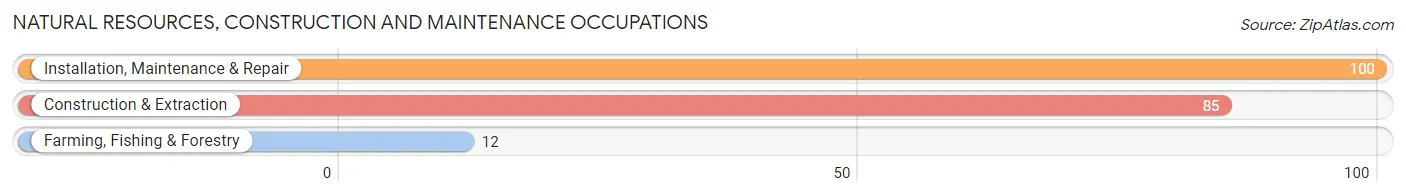
Natural Resources, Construction and Maintenance Occupations
The most common Natural Resources, Construction and Maintenance occupations in Montauk are Installation, Maintenance & Repair (100 | 4.7%), Construction & Extraction (85 | 4.0%), and Farming, Fishing & Forestry (12 | 0.6%).
Natural Resources, Construction and Maintenance Occupations by Sex
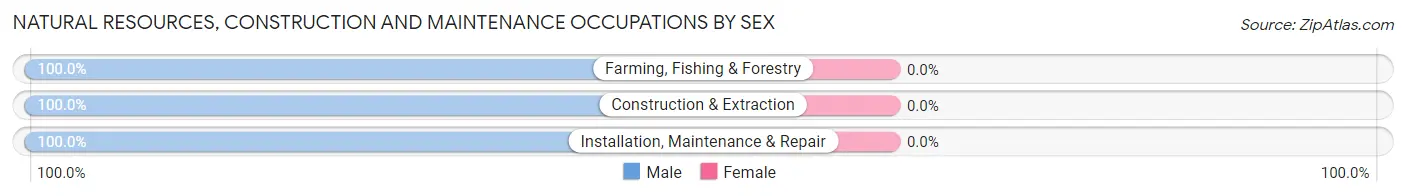
| Occupation | Male | Female |
| Farming, Fishing & Forestry | 12 (100.0%) | 0 (0.0%) |
| Construction & Extraction | 85 (100.0%) | 0 (0.0%) |
| Installation, Maintenance & Repair | 100 (100.0%) | 0 (0.0%) |
| Total (Category) | 197 (100.0%) | 0 (0.0%) |
| Total (Overall) | 1,301 (61.7%) | 807 (38.3%) |
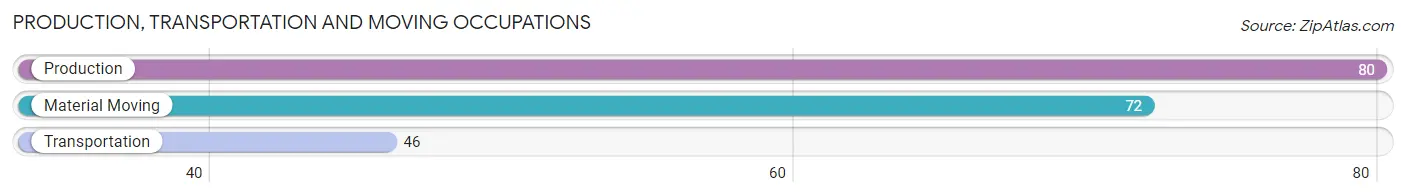
Production, Transportation and Moving Occupations
The most common Production, Transportation and Moving occupations in Montauk are Production (80 | 3.8%), Material Moving (72 | 3.4%), and Transportation (46 | 2.2%).
Production, Transportation and Moving Occupations by Sex
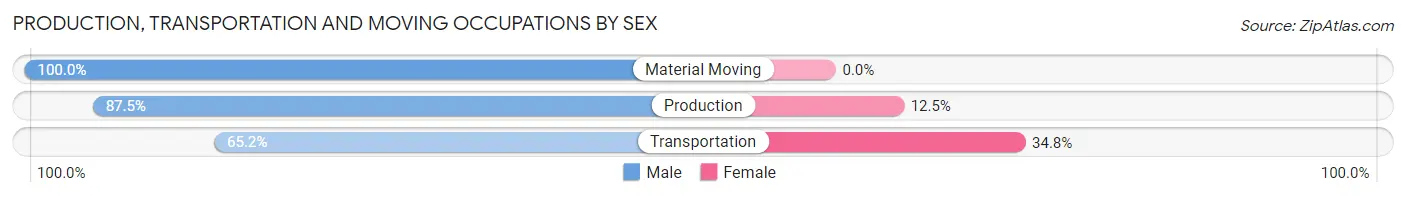
| Occupation | Male | Female |
| Production | 70 (87.5%) | 10 (12.5%) |
| Transportation | 30 (65.2%) | 16 (34.8%) |
| Material Moving | 72 (100.0%) | 0 (0.0%) |
| Total (Category) | 172 (86.9%) | 26 (13.1%) |
| Total (Overall) | 1,301 (61.7%) | 807 (38.3%) |
Employment Industries by Sex in Montauk
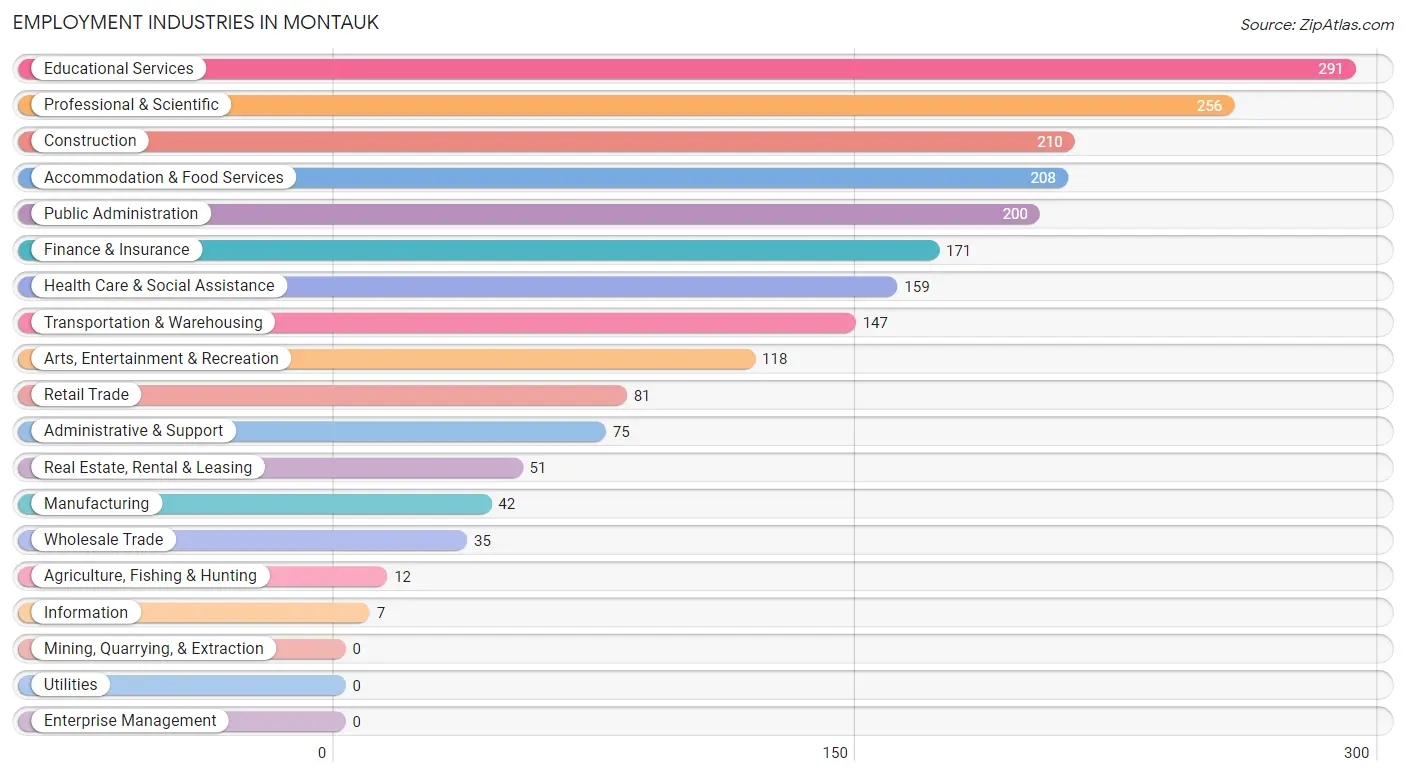
Employment Industries in Montauk
The major employment industries in Montauk include Educational Services (291 | 13.8%), Professional & Scientific (256 | 12.1%), Construction (210 | 10.0%), Accommodation & Food Services (208 | 9.9%), and Public Administration (200 | 9.5%).
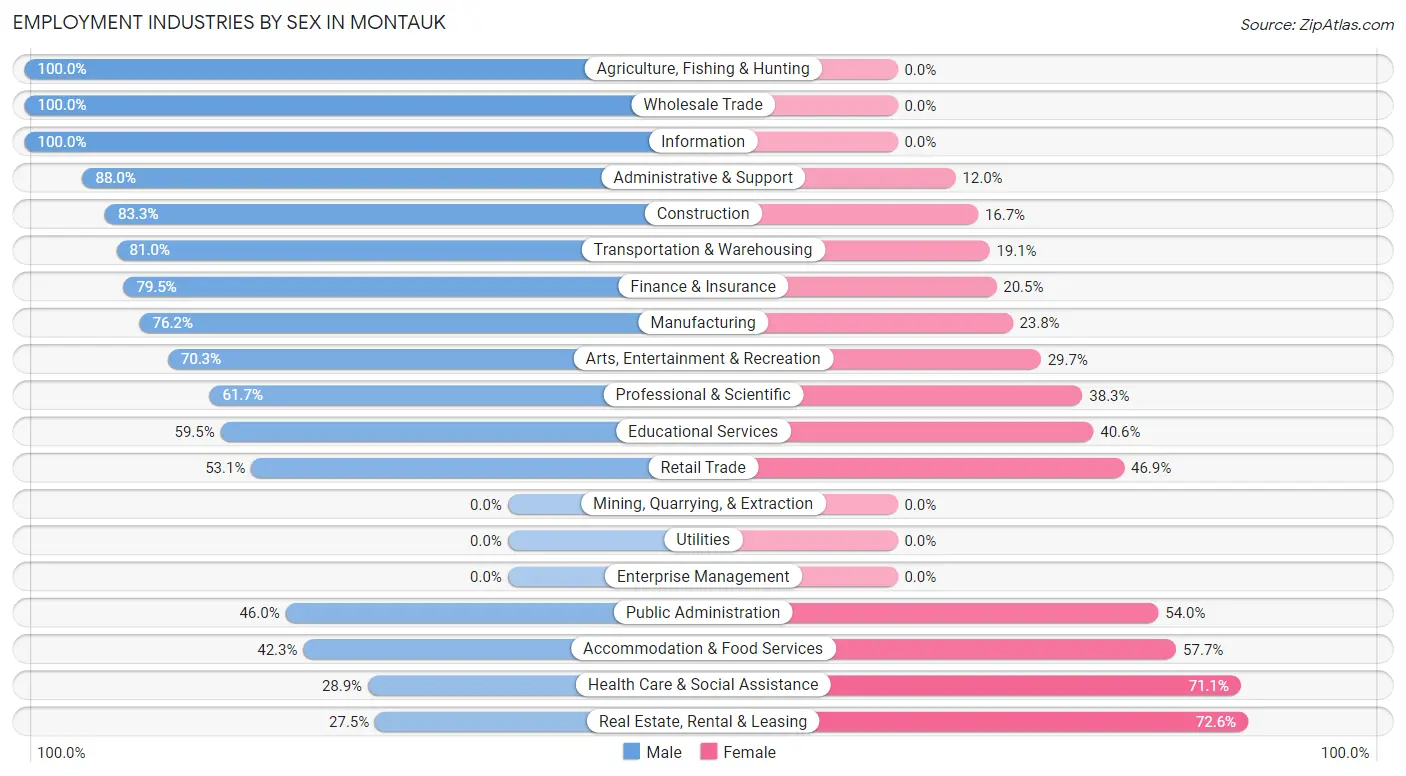
Employment Industries by Sex in Montauk
The Montauk industries that see more men than women are Agriculture, Fishing & Hunting (100.0%), Wholesale Trade (100.0%), and Information (100.0%), whereas the industries that tend to have a higher number of women are Real Estate, Rental & Leasing (72.6%), Health Care & Social Assistance (71.1%), and Accommodation & Food Services (57.7%).
| Industry | Male | Female |
| Agriculture, Fishing & Hunting | 12 (100.0%) | 0 (0.0%) |
| Mining, Quarrying, & Extraction | 0 (0.0%) | 0 (0.0%) |
| Construction | 175 (83.3%) | 35 (16.7%) |
| Manufacturing | 32 (76.2%) | 10 (23.8%) |
| Wholesale Trade | 35 (100.0%) | 0 (0.0%) |
| Retail Trade | 43 (53.1%) | 38 (46.9%) |
| Transportation & Warehousing | 119 (80.9%) | 28 (19.1%) |
| Utilities | 0 (0.0%) | 0 (0.0%) |
| Information | 7 (100.0%) | 0 (0.0%) |
| Finance & Insurance | 136 (79.5%) | 35 (20.5%) |
| Real Estate, Rental & Leasing | 14 (27.5%) | 37 (72.6%) |
| Professional & Scientific | 158 (61.7%) | 98 (38.3%) |
| Enterprise Management | 0 (0.0%) | 0 (0.0%) |
| Administrative & Support | 66 (88.0%) | 9 (12.0%) |
| Educational Services | 173 (59.5%) | 118 (40.6%) |
| Health Care & Social Assistance | 46 (28.9%) | 113 (71.1%) |
| Arts, Entertainment & Recreation | 83 (70.3%) | 35 (29.7%) |
| Accommodation & Food Services | 88 (42.3%) | 120 (57.7%) |
| Public Administration | 92 (46.0%) | 108 (54.0%) |
| Total | 1,301 (61.7%) | 807 (38.3%) |
Education in Montauk
School Enrollment in Montauk
The most common levels of schooling among the 579 students in Montauk are middle school (202 | 34.9%), kindergarten (120 | 20.7%), and elementary school (100 | 17.3%).
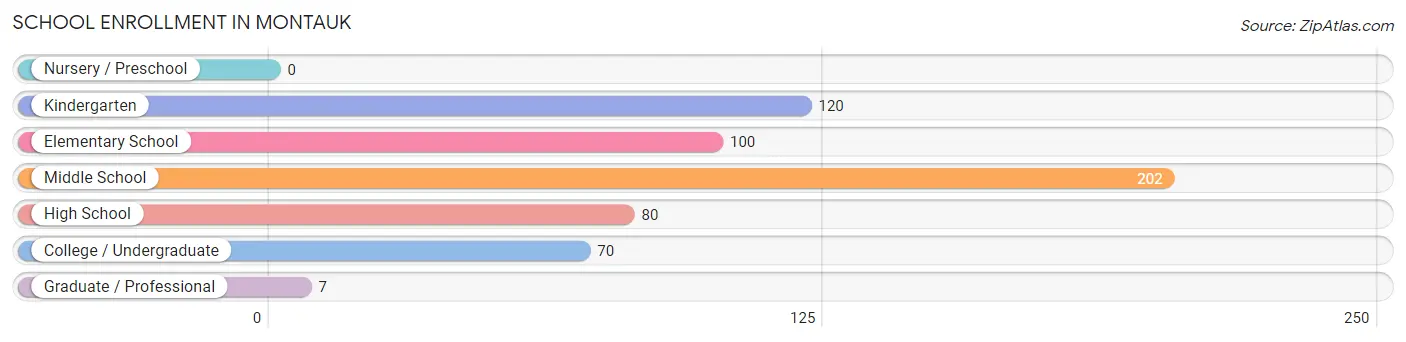
| School Level | # Students | % Students |
| Nursery / Preschool | 0 | 0.0% |
| Kindergarten | 120 | 20.7% |
| Elementary School | 100 | 17.3% |
| Middle School | 202 | 34.9% |
| High School | 80 | 13.8% |
| College / Undergraduate | 70 | 12.1% |
| Graduate / Professional | 7 | 1.2% |
| Total | 579 | 100.0% |
School Enrollment by Age by Funding Source in Montauk
Out of a total of 579 students who are enrolled in schools in Montauk, 125 (21.6%) attend a private institution, while the remaining 454 (78.4%) are enrolled in public schools. The age group of 20 to 24 year olds has the highest likelihood of being enrolled in private schools, with 55 (74.3% in the age bracket) enrolled. Conversely, the age group of 18 to 19 year olds has the lowest likelihood of being enrolled in a private school, with 1 (100.0% in the age bracket) attending a public institution.
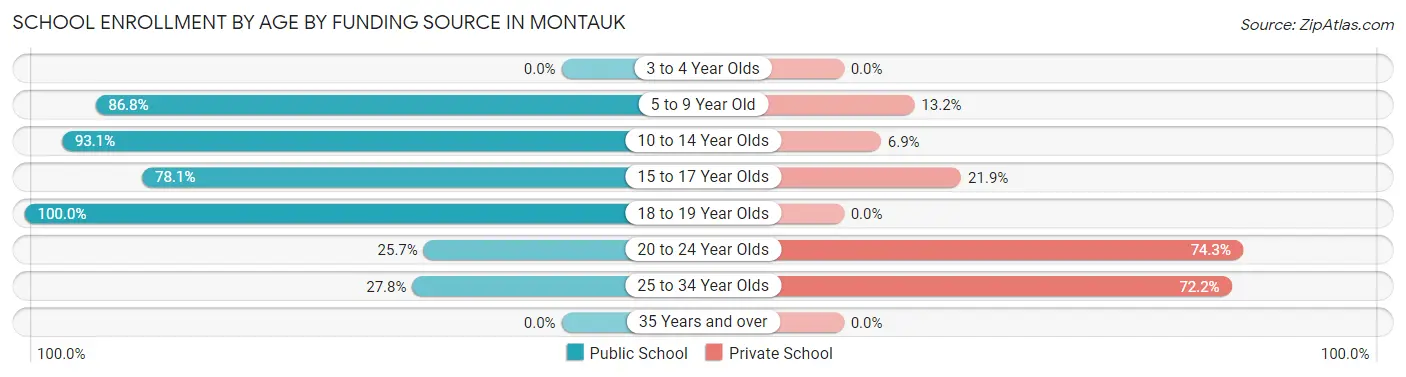
| Age Bracket | Public School | Private School |
| 3 to 4 Year Olds | 0 (0.0%) | 0 (0.0%) |
| 5 to 9 Year Old | 191 (86.8%) | 29 (13.2%) |
| 10 to 14 Year Olds | 188 (93.1%) | 14 (6.9%) |
| 15 to 17 Year Olds | 50 (78.1%) | 14 (21.9%) |
| 18 to 19 Year Olds | 1 (100.0%) | 0 (0.0%) |
| 20 to 24 Year Olds | 19 (25.7%) | 55 (74.3%) |
| 25 to 34 Year Olds | 5 (27.8%) | 13 (72.2%) |
| 35 Years and over | 0 (0.0%) | 0 (0.0%) |
| Total | 454 (78.4%) | 125 (21.6%) |
Educational Attainment by Field of Study in Montauk
Business (363 | 20.1%), education (263 | 14.5%), social sciences (194 | 10.7%), literature & languages (179 | 9.9%), and engineering (174 | 9.6%) are the most common fields of study among 1,809 individuals in Montauk who have obtained a bachelor's degree or higher.
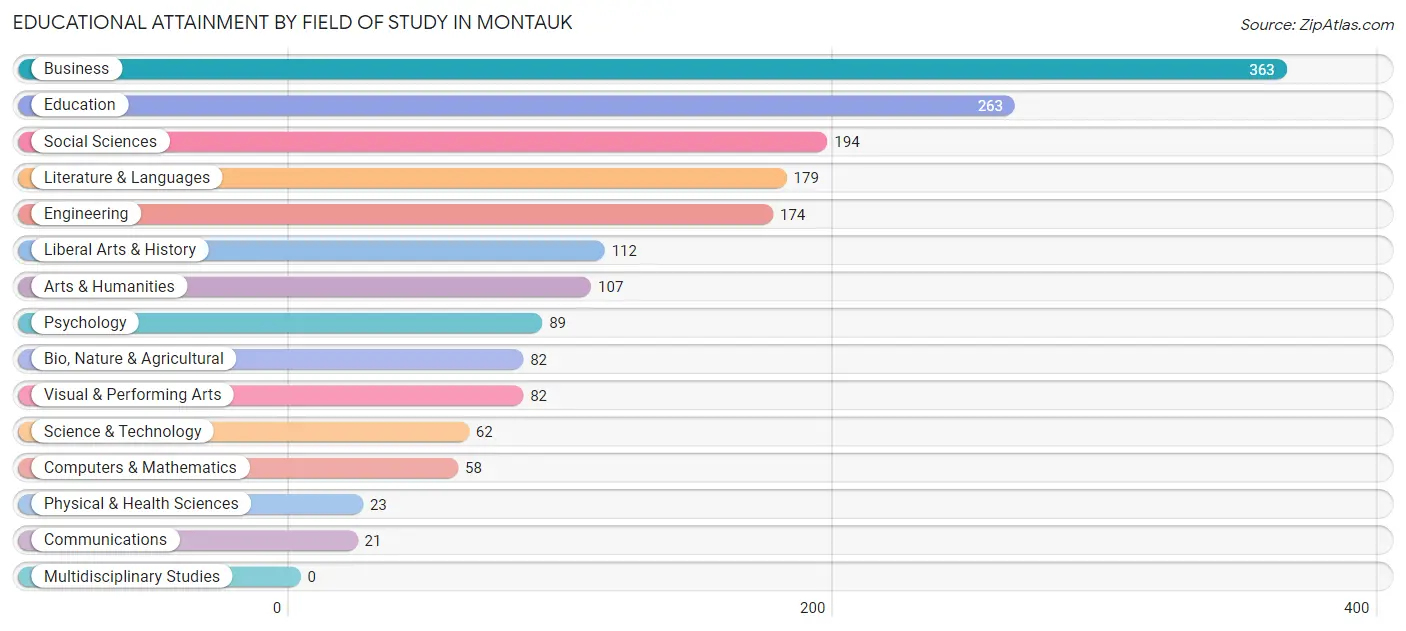
| Field of Study | # Graduates | % Graduates |
| Computers & Mathematics | 58 | 3.2% |
| Bio, Nature & Agricultural | 82 | 4.5% |
| Physical & Health Sciences | 23 | 1.3% |
| Psychology | 89 | 4.9% |
| Social Sciences | 194 | 10.7% |
| Engineering | 174 | 9.6% |
| Multidisciplinary Studies | 0 | 0.0% |
| Science & Technology | 62 | 3.4% |
| Business | 363 | 20.1% |
| Education | 263 | 14.5% |
| Literature & Languages | 179 | 9.9% |
| Liberal Arts & History | 112 | 6.2% |
| Visual & Performing Arts | 82 | 4.5% |
| Communications | 21 | 1.2% |
| Arts & Humanities | 107 | 5.9% |
| Total | 1,809 | 100.0% |
Transportation & Commute in Montauk
Vehicle Availability by Sex in Montauk
The most prevalent vehicle ownership categories in Montauk are males with 2 vehicles (426, accounting for 34.7%) and females with 2 vehicles (423, making up 58.0%).
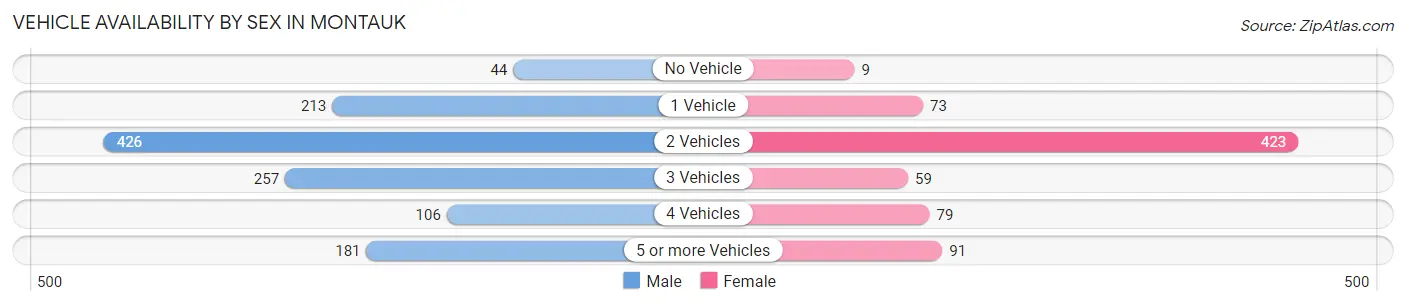
| Vehicles Available | Male | Female |
| No Vehicle | 44 (3.6%) | 9 (1.2%) |
| 1 Vehicle | 213 (17.4%) | 73 (10.0%) |
| 2 Vehicles | 426 (34.7%) | 423 (57.6%) |
| 3 Vehicles | 257 (20.9%) | 59 (8.0%) |
| 4 Vehicles | 106 (8.6%) | 79 (10.8%) |
| 5 or more Vehicles | 181 (14.7%) | 91 (12.4%) |
| Total | 1,227 (100.0%) | 734 (100.0%) |
Commute Time in Montauk
The most frequently occuring commute durations in Montauk are 5 to 9 minutes (359 commuters, 21.9%), 30 to 34 minutes (307 commuters, 18.7%), and 10 to 14 minutes (253 commuters, 15.4%).
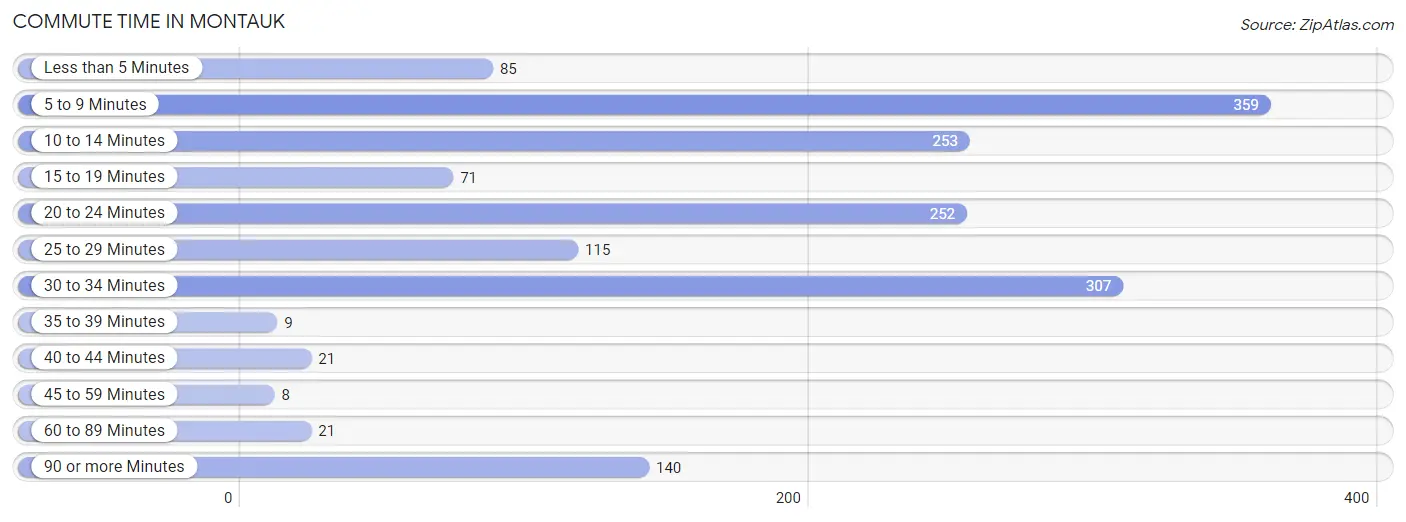
| Commute Time | # Commuters | % Commuters |
| Less than 5 Minutes | 85 | 5.2% |
| 5 to 9 Minutes | 359 | 21.9% |
| 10 to 14 Minutes | 253 | 15.4% |
| 15 to 19 Minutes | 71 | 4.3% |
| 20 to 24 Minutes | 252 | 15.4% |
| 25 to 29 Minutes | 115 | 7.0% |
| 30 to 34 Minutes | 307 | 18.7% |
| 35 to 39 Minutes | 9 | 0.5% |
| 40 to 44 Minutes | 21 | 1.3% |
| 45 to 59 Minutes | 8 | 0.5% |
| 60 to 89 Minutes | 21 | 1.3% |
| 90 or more Minutes | 140 | 8.5% |
Commute Time by Sex in Montauk
The most common commute times in Montauk are 20 to 24 minutes (245 commuters, 24.1%) for males and 5 to 9 minutes (238 commuters, 38.2%) for females.
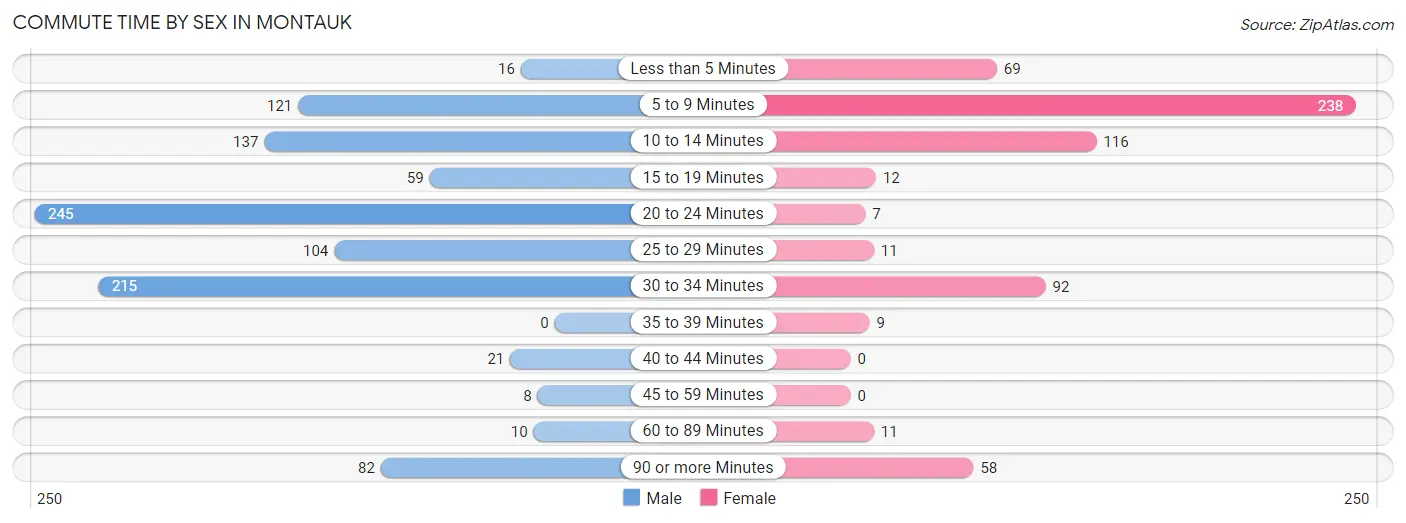
| Commute Time | Male | Female |
| Less than 5 Minutes | 16 (1.6%) | 69 (11.1%) |
| 5 to 9 Minutes | 121 (11.9%) | 238 (38.2%) |
| 10 to 14 Minutes | 137 (13.5%) | 116 (18.6%) |
| 15 to 19 Minutes | 59 (5.8%) | 12 (1.9%) |
| 20 to 24 Minutes | 245 (24.1%) | 7 (1.1%) |
| 25 to 29 Minutes | 104 (10.2%) | 11 (1.8%) |
| 30 to 34 Minutes | 215 (21.1%) | 92 (14.8%) |
| 35 to 39 Minutes | 0 (0.0%) | 9 (1.4%) |
| 40 to 44 Minutes | 21 (2.1%) | 0 (0.0%) |
| 45 to 59 Minutes | 8 (0.8%) | 0 (0.0%) |
| 60 to 89 Minutes | 10 (1.0%) | 11 (1.8%) |
| 90 or more Minutes | 82 (8.1%) | 58 (9.3%) |
Time of Departure to Work by Sex in Montauk
The most frequent times of departure to work in Montauk are 7:00 AM to 7:29 AM (195, 19.2%) for males and 7:30 AM to 7:59 AM (184, 29.5%) for females.
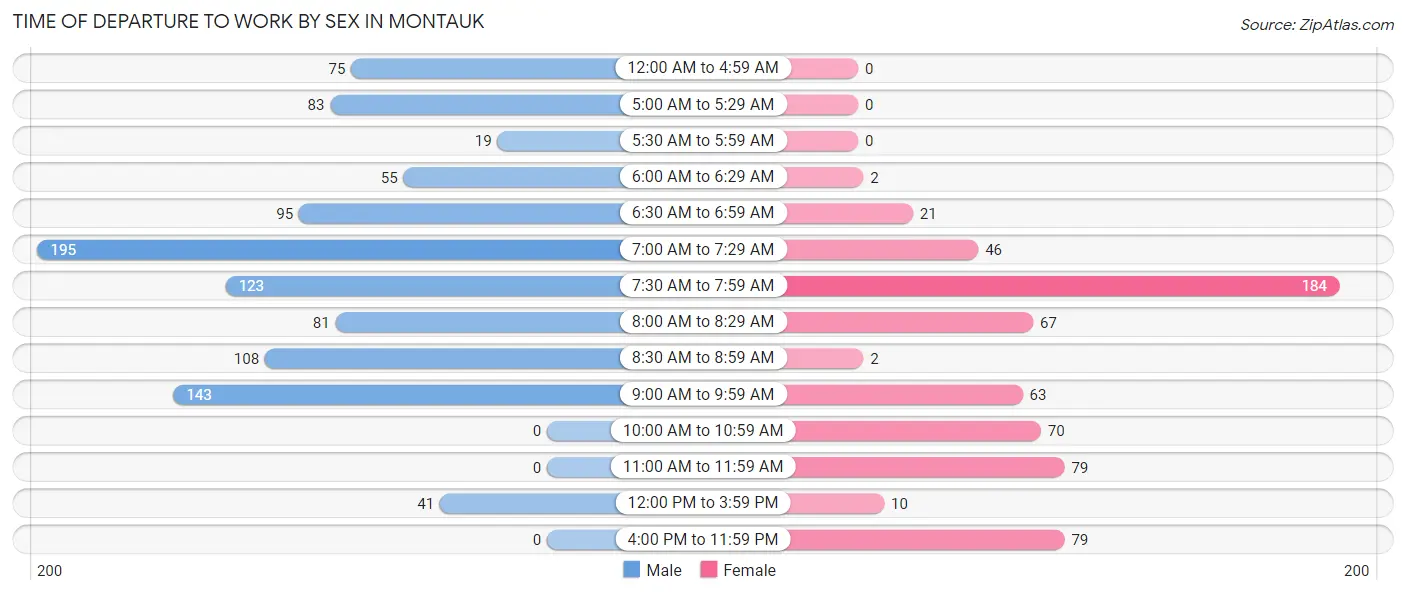
| Time of Departure | Male | Female |
| 12:00 AM to 4:59 AM | 75 (7.4%) | 0 (0.0%) |
| 5:00 AM to 5:29 AM | 83 (8.2%) | 0 (0.0%) |
| 5:30 AM to 5:59 AM | 19 (1.9%) | 0 (0.0%) |
| 6:00 AM to 6:29 AM | 55 (5.4%) | 2 (0.3%) |
| 6:30 AM to 6:59 AM | 95 (9.3%) | 21 (3.4%) |
| 7:00 AM to 7:29 AM | 195 (19.2%) | 46 (7.4%) |
| 7:30 AM to 7:59 AM | 123 (12.1%) | 184 (29.5%) |
| 8:00 AM to 8:29 AM | 81 (8.0%) | 67 (10.7%) |
| 8:30 AM to 8:59 AM | 108 (10.6%) | 2 (0.3%) |
| 9:00 AM to 9:59 AM | 143 (14.1%) | 63 (10.1%) |
| 10:00 AM to 10:59 AM | 0 (0.0%) | 70 (11.2%) |
| 11:00 AM to 11:59 AM | 0 (0.0%) | 79 (12.7%) |
| 12:00 PM to 3:59 PM | 41 (4.0%) | 10 (1.6%) |
| 4:00 PM to 11:59 PM | 0 (0.0%) | 79 (12.7%) |
| Total | 1,018 (100.0%) | 623 (100.0%) |
Housing Occupancy in Montauk
Occupancy by Ownership in Montauk
Of the total 1,580 dwellings in Montauk, owner-occupied units account for 1,328 (84.1%), while renter-occupied units make up 252 (16.0%).
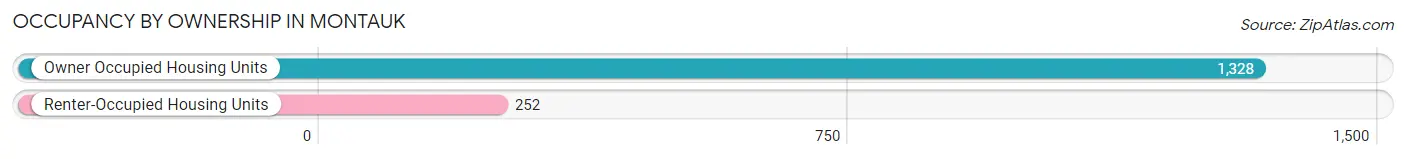
| Occupancy | # Housing Units | % Housing Units |
| Owner Occupied Housing Units | 1,328 | 84.1% |
| Renter-Occupied Housing Units | 252 | 16.0% |
| Total Occupied Housing Units | 1,580 | 100.0% |
Occupancy by Household Size in Montauk
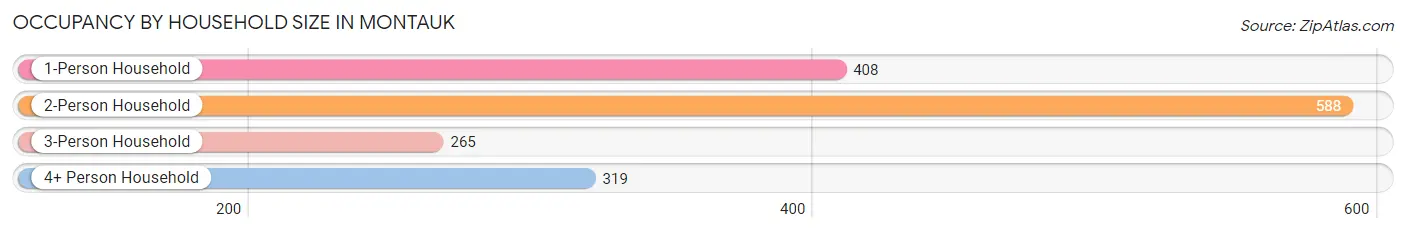
| Household Size | # Housing Units | % Housing Units |
| 1-Person Household | 408 | 25.8% |
| 2-Person Household | 588 | 37.2% |
| 3-Person Household | 265 | 16.8% |
| 4+ Person Household | 319 | 20.2% |
| Total Housing Units | 1,580 | 100.0% |
Occupancy by Ownership by Household Size in Montauk
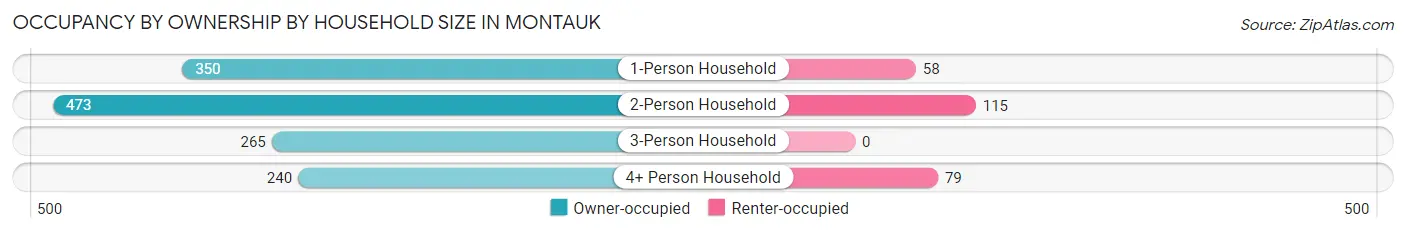
| Household Size | Owner-occupied | Renter-occupied |
| 1-Person Household | 350 (85.8%) | 58 (14.2%) |
| 2-Person Household | 473 (80.4%) | 115 (19.6%) |
| 3-Person Household | 265 (100.0%) | 0 (0.0%) |
| 4+ Person Household | 240 (75.2%) | 79 (24.8%) |
| Total Housing Units | 1,328 (84.1%) | 252 (16.0%) |
Occupancy by Educational Attainment in Montauk
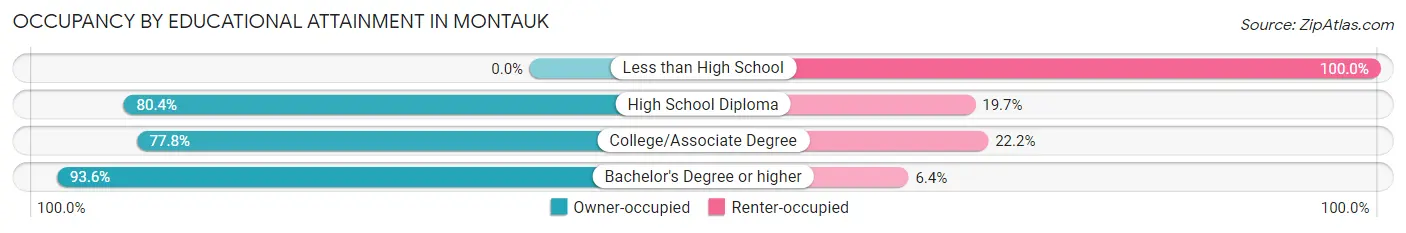
| Household Size | Owner-occupied | Renter-occupied |
| Less than High School | 0 (0.0%) | 52 (100.0%) |
| High School Diploma | 274 (80.3%) | 67 (19.7%) |
| College/Associate Degree | 280 (77.8%) | 80 (22.2%) |
| Bachelor's Degree or higher | 774 (93.6%) | 53 (6.4%) |
Occupancy by Age of Householder in Montauk
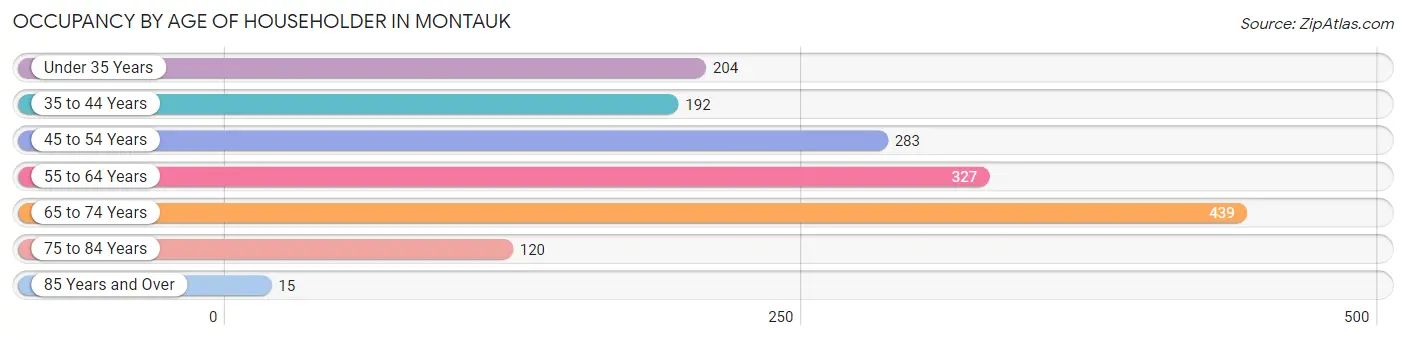
| Age Bracket | # Households | % Households |
| Under 35 Years | 204 | 12.9% |
| 35 to 44 Years | 192 | 12.1% |
| 45 to 54 Years | 283 | 17.9% |
| 55 to 64 Years | 327 | 20.7% |
| 65 to 74 Years | 439 | 27.8% |
| 75 to 84 Years | 120 | 7.6% |
| 85 Years and Over | 15 | 0.9% |
| Total | 1,580 | 100.0% |
Housing Finances in Montauk
Median Income by Occupancy in Montauk
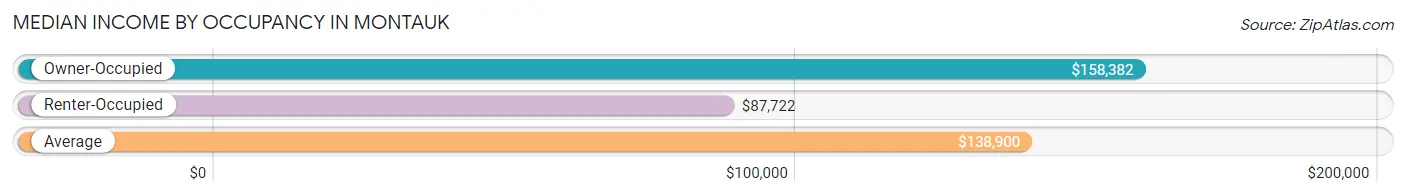
| Occupancy Type | # Households | Median Income |
| Owner-Occupied | 1,328 (84.1%) | $158,382 |
| Renter-Occupied | 252 (16.0%) | $87,722 |
| Average | 1,580 (100.0%) | $138,900 |
Occupancy by Householder Income Bracket in Montauk
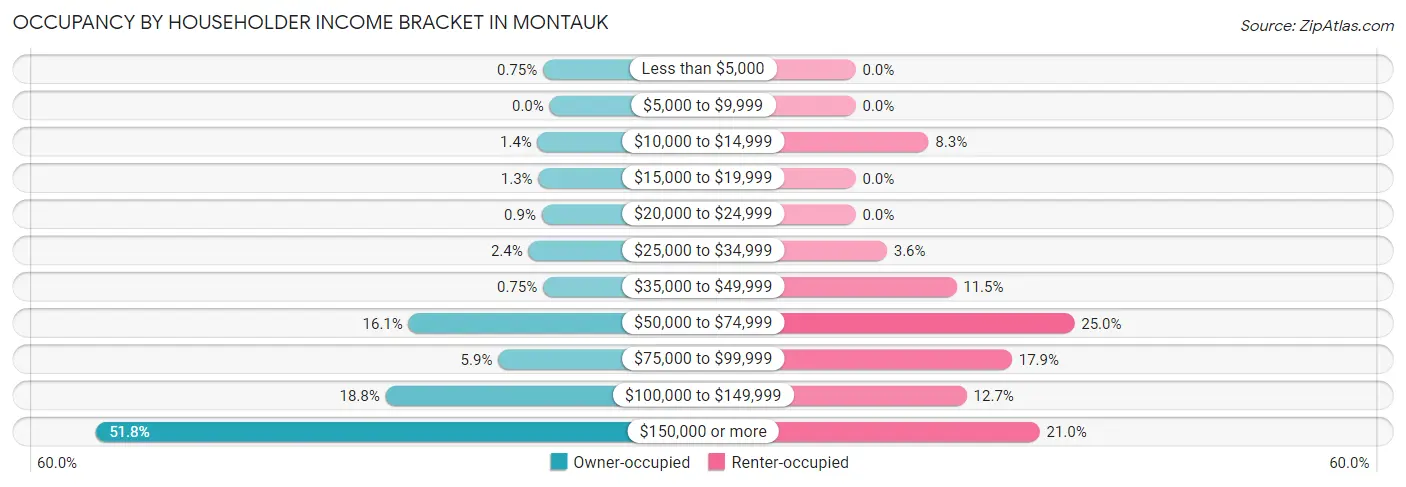
| Income Bracket | Owner-occupied | Renter-occupied |
| Less than $5,000 | 10 (0.7%) | 0 (0.0%) |
| $5,000 to $9,999 | 0 (0.0%) | 0 (0.0%) |
| $10,000 to $14,999 | 18 (1.4%) | 21 (8.3%) |
| $15,000 to $19,999 | 17 (1.3%) | 0 (0.0%) |
| $20,000 to $24,999 | 12 (0.9%) | 0 (0.0%) |
| $25,000 to $34,999 | 32 (2.4%) | 9 (3.6%) |
| $35,000 to $49,999 | 10 (0.7%) | 29 (11.5%) |
| $50,000 to $74,999 | 214 (16.1%) | 63 (25.0%) |
| $75,000 to $99,999 | 78 (5.9%) | 45 (17.9%) |
| $100,000 to $149,999 | 249 (18.8%) | 32 (12.7%) |
| $150,000 or more | 688 (51.8%) | 53 (21.0%) |
| Total | 1,328 (100.0%) | 252 (100.0%) |
Monthly Housing Cost Tiers in Montauk
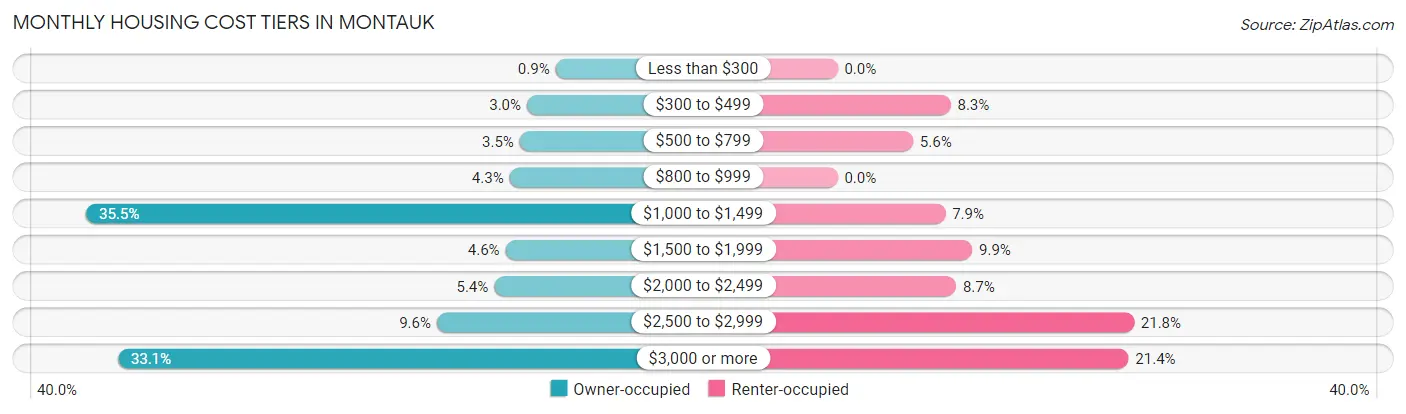
| Monthly Cost | Owner-occupied | Renter-occupied |
| Less than $300 | 12 (0.9%) | 0 (0.0%) |
| $300 to $499 | 40 (3.0%) | 21 (8.3%) |
| $500 to $799 | 47 (3.5%) | 14 (5.6%) |
| $800 to $999 | 57 (4.3%) | 0 (0.0%) |
| $1,000 to $1,499 | 471 (35.5%) | 20 (7.9%) |
| $1,500 to $1,999 | 61 (4.6%) | 25 (9.9%) |
| $2,000 to $2,499 | 72 (5.4%) | 22 (8.7%) |
| $2,500 to $2,999 | 128 (9.6%) | 55 (21.8%) |
| $3,000 or more | 440 (33.1%) | 54 (21.4%) |
| Total | 1,328 (100.0%) | 252 (100.0%) |
Physical Housing Characteristics in Montauk
Housing Structures in Montauk
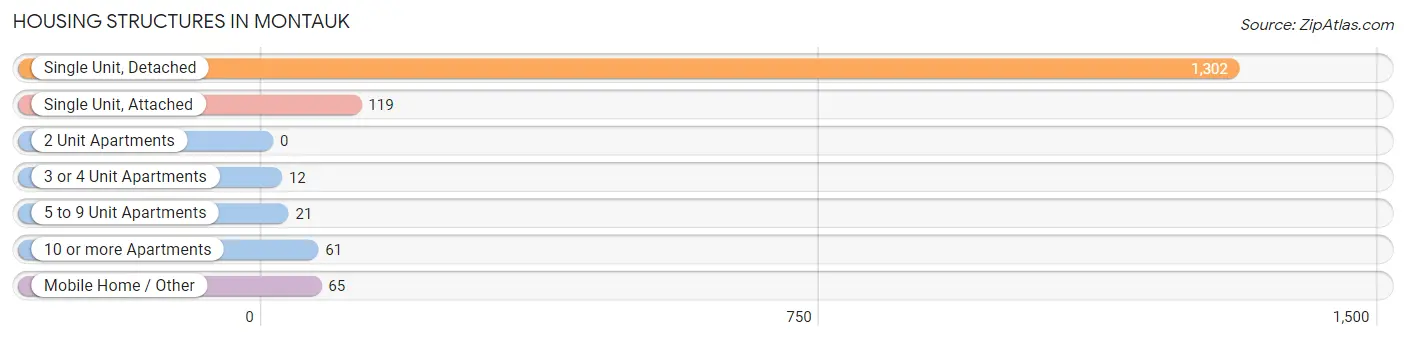
| Structure Type | # Housing Units | % Housing Units |
| Single Unit, Detached | 1,302 | 82.4% |
| Single Unit, Attached | 119 | 7.5% |
| 2 Unit Apartments | 0 | 0.0% |
| 3 or 4 Unit Apartments | 12 | 0.8% |
| 5 to 9 Unit Apartments | 21 | 1.3% |
| 10 or more Apartments | 61 | 3.9% |
| Mobile Home / Other | 65 | 4.1% |
| Total | 1,580 | 100.0% |
Housing Structures by Occupancy in Montauk
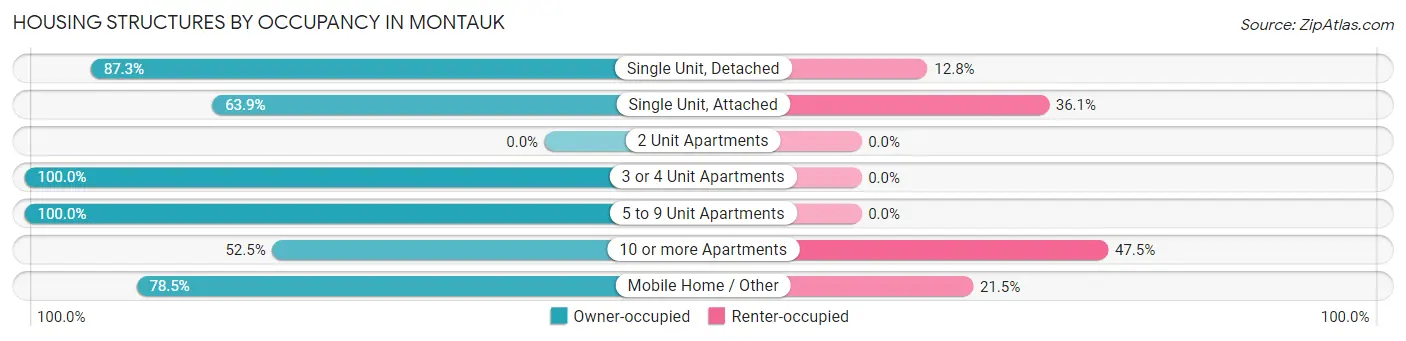
| Structure Type | Owner-occupied | Renter-occupied |
| Single Unit, Detached | 1,136 (87.3%) | 166 (12.8%) |
| Single Unit, Attached | 76 (63.9%) | 43 (36.1%) |
| 2 Unit Apartments | 0 (0.0%) | 0 (0.0%) |
| 3 or 4 Unit Apartments | 12 (100.0%) | 0 (0.0%) |
| 5 to 9 Unit Apartments | 21 (100.0%) | 0 (0.0%) |
| 10 or more Apartments | 32 (52.5%) | 29 (47.5%) |
| Mobile Home / Other | 51 (78.5%) | 14 (21.5%) |
| Total | 1,328 (84.1%) | 252 (16.0%) |
Housing Structures by Number of Rooms in Montauk
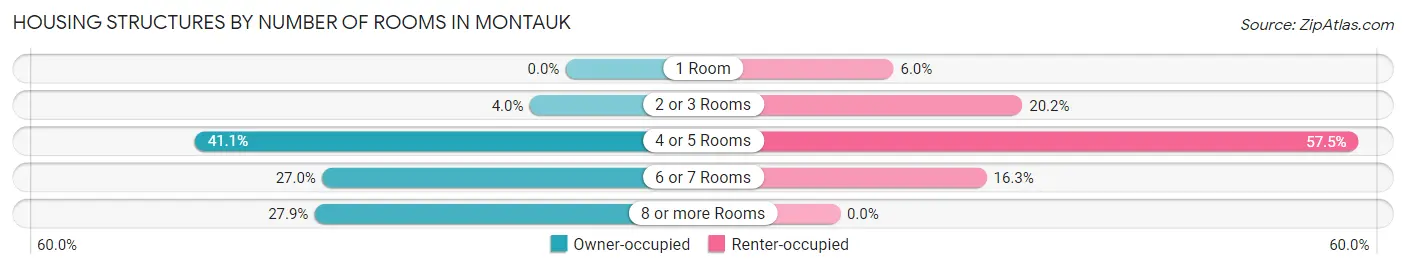
| Number of Rooms | Owner-occupied | Renter-occupied |
| 1 Room | 0 (0.0%) | 15 (5.9%) |
| 2 or 3 Rooms | 53 (4.0%) | 51 (20.2%) |
| 4 or 5 Rooms | 546 (41.1%) | 145 (57.5%) |
| 6 or 7 Rooms | 359 (27.0%) | 41 (16.3%) |
| 8 or more Rooms | 370 (27.9%) | 0 (0.0%) |
| Total | 1,328 (100.0%) | 252 (100.0%) |
Housing Structure by Heating Type in Montauk
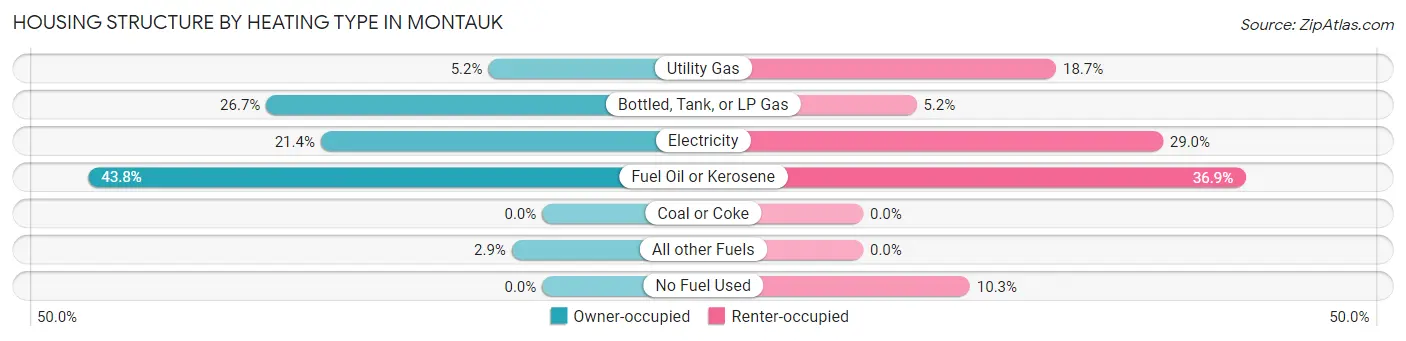
| Heating Type | Owner-occupied | Renter-occupied |
| Utility Gas | 69 (5.2%) | 47 (18.6%) |
| Bottled, Tank, or LP Gas | 354 (26.7%) | 13 (5.2%) |
| Electricity | 284 (21.4%) | 73 (29.0%) |
| Fuel Oil or Kerosene | 582 (43.8%) | 93 (36.9%) |
| Coal or Coke | 0 (0.0%) | 0 (0.0%) |
| All other Fuels | 39 (2.9%) | 0 (0.0%) |
| No Fuel Used | 0 (0.0%) | 26 (10.3%) |
| Total | 1,328 (100.0%) | 252 (100.0%) |
Household Vehicle Usage in Montauk
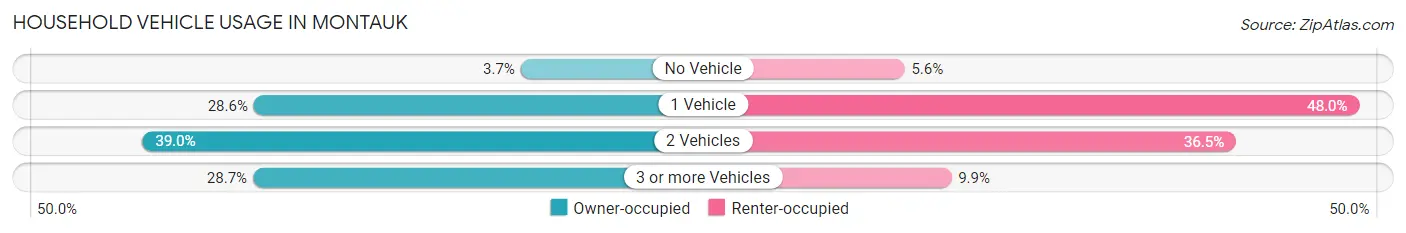
| Vehicles per Household | Owner-occupied | Renter-occupied |
| No Vehicle | 49 (3.7%) | 14 (5.6%) |
| 1 Vehicle | 380 (28.6%) | 121 (48.0%) |
| 2 Vehicles | 518 (39.0%) | 92 (36.5%) |
| 3 or more Vehicles | 381 (28.7%) | 25 (9.9%) |
| Total | 1,328 (100.0%) | 252 (100.0%) |
Real Estate & Mortgages in Montauk
Real Estate and Mortgage Overview in Montauk
| Characteristic | Without Mortgage | With Mortgage |
| Housing Units | 722 | 606 |
| Median Property Value | $996,400 | $1,118,400 |
| Median Household Income | $114,216 | $419 |
| Monthly Housing Costs | $1,161 | $426 |
| Real Estate Taxes | $6,546 | $0 |
Property Value by Mortgage Status in Montauk
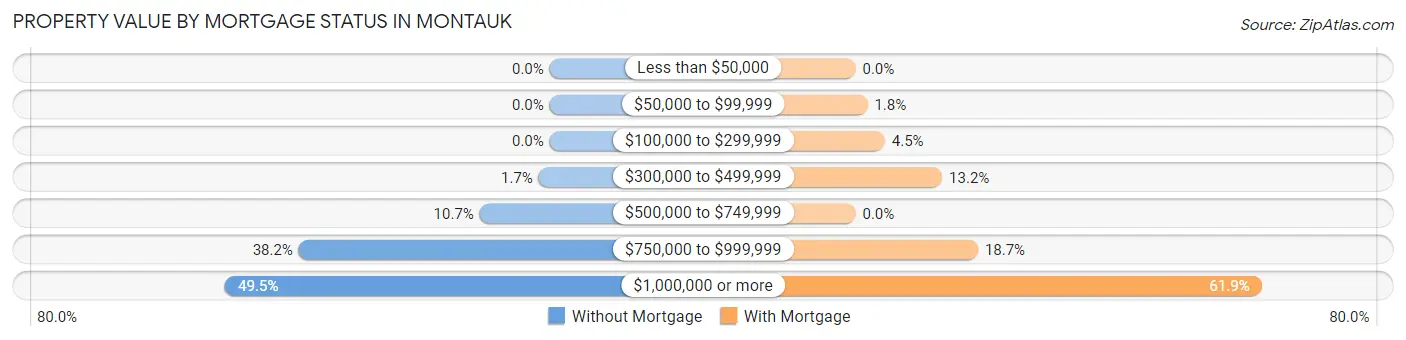
| Property Value | Without Mortgage | With Mortgage |
| Less than $50,000 | 0 (0.0%) | 0 (0.0%) |
| $50,000 to $99,999 | 0 (0.0%) | 11 (1.8%) |
| $100,000 to $299,999 | 0 (0.0%) | 27 (4.5%) |
| $300,000 to $499,999 | 12 (1.7%) | 80 (13.2%) |
| $500,000 to $749,999 | 77 (10.7%) | 0 (0.0%) |
| $750,000 to $999,999 | 276 (38.2%) | 113 (18.6%) |
| $1,000,000 or more | 357 (49.4%) | 375 (61.9%) |
| Total | 722 (100.0%) | 606 (100.0%) |
Household Income by Mortgage Status in Montauk
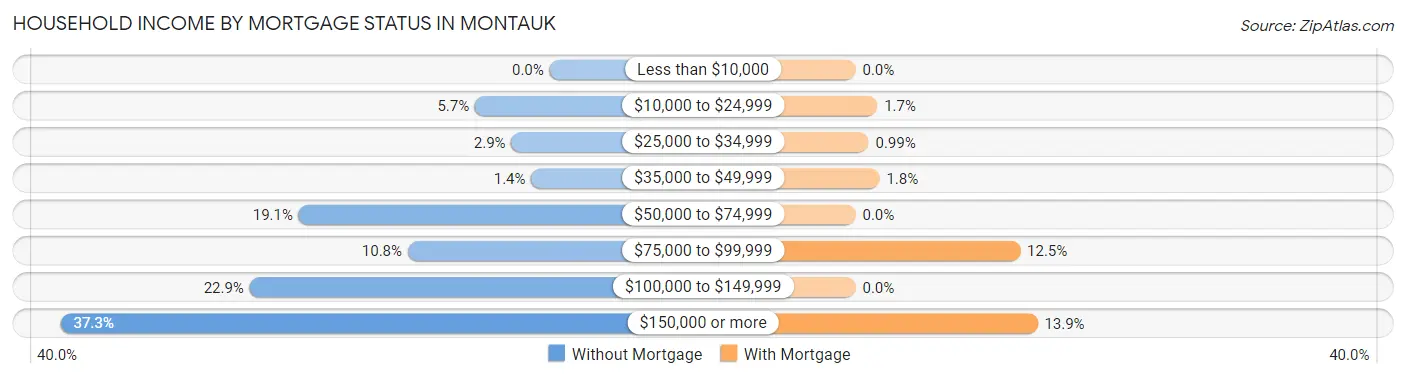
| Household Income | Without Mortgage | With Mortgage |
| Less than $10,000 | 0 (0.0%) | 0 (0.0%) |
| $10,000 to $24,999 | 41 (5.7%) | 10 (1.7%) |
| $25,000 to $34,999 | 21 (2.9%) | 6 (1.0%) |
| $35,000 to $49,999 | 10 (1.4%) | 11 (1.8%) |
| $50,000 to $74,999 | 138 (19.1%) | 0 (0.0%) |
| $75,000 to $99,999 | 78 (10.8%) | 76 (12.5%) |
| $100,000 to $149,999 | 165 (22.9%) | 0 (0.0%) |
| $150,000 or more | 269 (37.3%) | 84 (13.9%) |
| Total | 722 (100.0%) | 606 (100.0%) |
Property Value to Household Income Ratio in Montauk
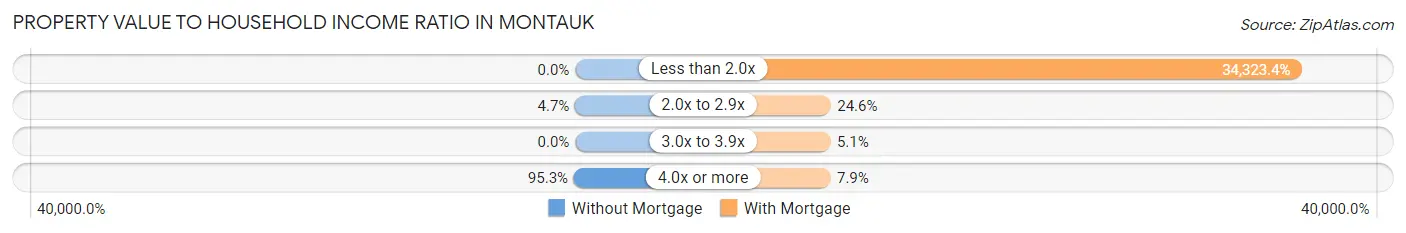
| Value-to-Income Ratio | Without Mortgage | With Mortgage |
| Less than 2.0x | 0 (0.0%) | 208,000 (34,323.4%) |
| 2.0x to 2.9x | 34 (4.7%) | 149 (24.6%) |
| 3.0x to 3.9x | 0 (0.0%) | 31 (5.1%) |
| 4.0x or more | 688 (95.3%) | 48 (7.9%) |
| Total | 722 (100.0%) | 606 (100.0%) |
Real Estate Taxes by Mortgage Status in Montauk
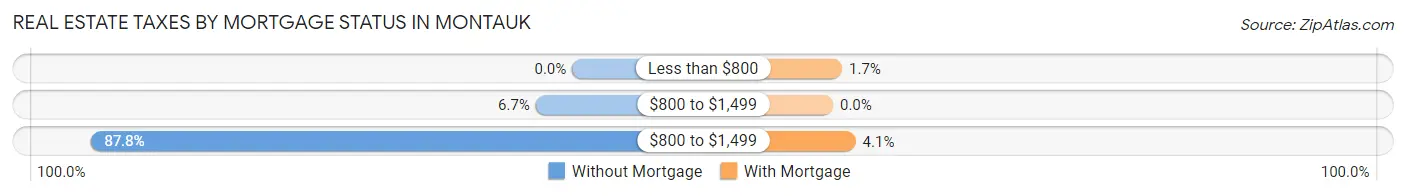
| Property Taxes | Without Mortgage | With Mortgage |
| Less than $800 | 0 (0.0%) | 10 (1.7%) |
| $800 to $1,499 | 48 (6.7%) | 0 (0.0%) |
| $800 to $1,499 | 634 (87.8%) | 25 (4.1%) |
| Total | 722 (100.0%) | 606 (100.0%) |
Health & Disability in Montauk
Health Insurance Coverage by Age in Montauk
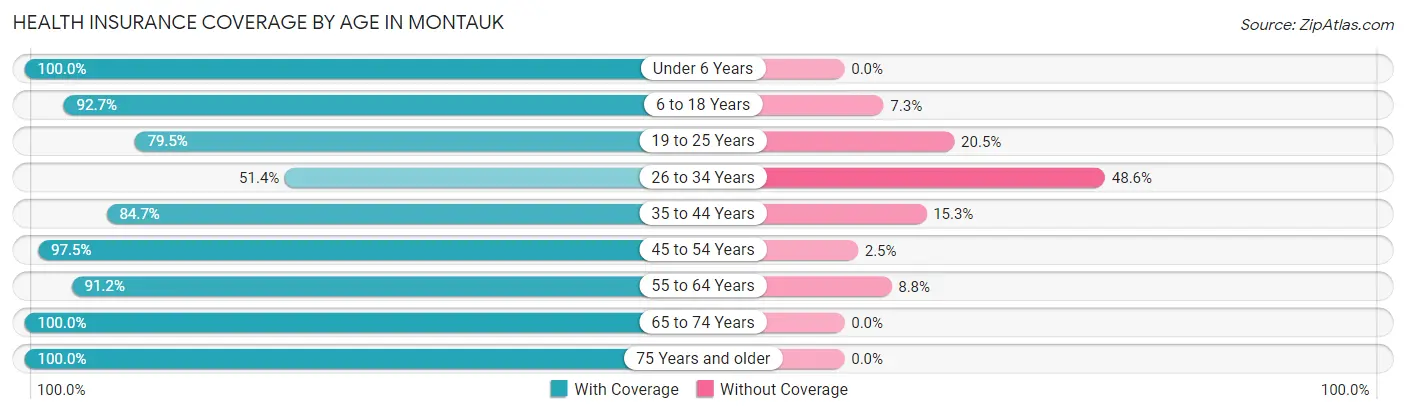
| Age Bracket | With Coverage | Without Coverage |
| Under 6 Years | 285 (100.0%) | 0 (0.0%) |
| 6 to 18 Years | 458 (92.7%) | 36 (7.3%) |
| 19 to 25 Years | 295 (79.5%) | 76 (20.5%) |
| 26 to 34 Years | 256 (51.4%) | 242 (48.6%) |
| 35 to 44 Years | 344 (84.7%) | 62 (15.3%) |
| 45 to 54 Years | 465 (97.5%) | 12 (2.5%) |
| 55 to 64 Years | 771 (91.2%) | 74 (8.8%) |
| 65 to 74 Years | 656 (100.0%) | 0 (0.0%) |
| 75 Years and older | 275 (100.0%) | 0 (0.0%) |
| Total | 3,805 (88.3%) | 502 (11.7%) |
Health Insurance Coverage by Citizenship Status in Montauk
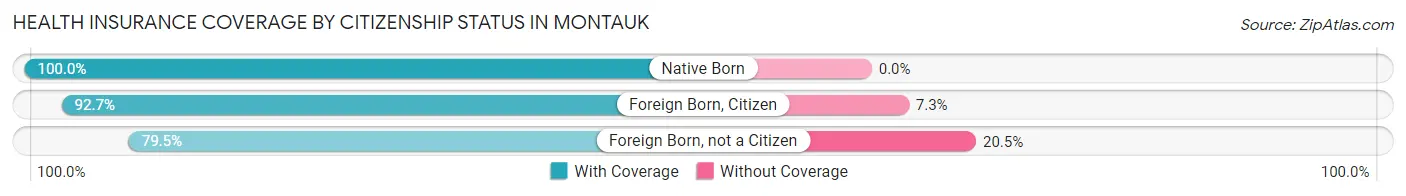
| Citizenship Status | With Coverage | Without Coverage |
| Native Born | 285 (100.0%) | 0 (0.0%) |
| Foreign Born, Citizen | 458 (92.7%) | 36 (7.3%) |
| Foreign Born, not a Citizen | 295 (79.5%) | 76 (20.5%) |
Health Insurance Coverage by Household Income in Montauk
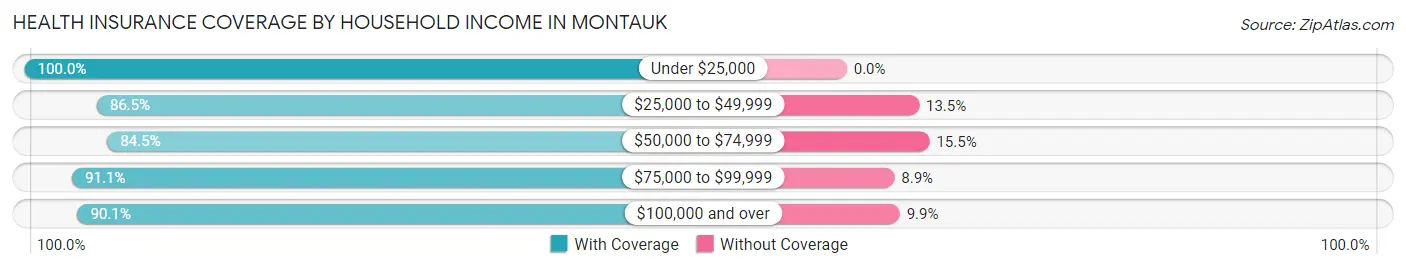
| Household Income | With Coverage | Without Coverage |
| Under $25,000 | 78 (100.0%) | 0 (0.0%) |
| $25,000 to $49,999 | 115 (86.5%) | 18 (13.5%) |
| $50,000 to $74,999 | 660 (84.5%) | 121 (15.5%) |
| $75,000 to $99,999 | 235 (91.1%) | 23 (8.9%) |
| $100,000 and over | 2,656 (90.1%) | 292 (9.9%) |
Public vs Private Health Insurance Coverage by Age in Montauk
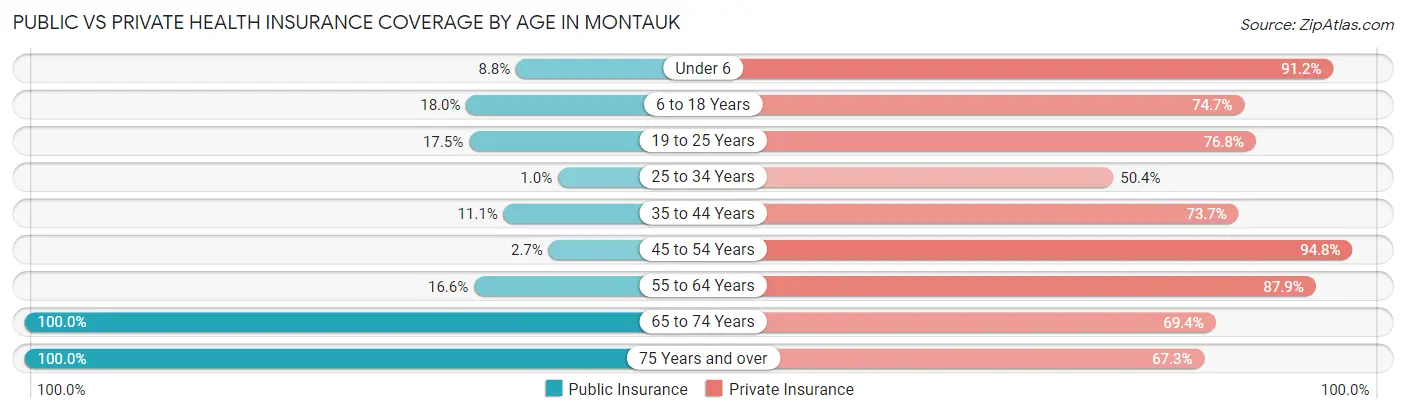
| Age Bracket | Public Insurance | Private Insurance |
| Under 6 | 25 (8.8%) | 260 (91.2%) |
| 6 to 18 Years | 89 (18.0%) | 369 (74.7%) |
| 19 to 25 Years | 65 (17.5%) | 285 (76.8%) |
| 25 to 34 Years | 5 (1.0%) | 251 (50.4%) |
| 35 to 44 Years | 45 (11.1%) | 299 (73.7%) |
| 45 to 54 Years | 13 (2.7%) | 452 (94.8%) |
| 55 to 64 Years | 140 (16.6%) | 743 (87.9%) |
| 65 to 74 Years | 656 (100.0%) | 455 (69.4%) |
| 75 Years and over | 275 (100.0%) | 185 (67.3%) |
| Total | 1,313 (30.5%) | 3,299 (76.6%) |
Disability Status by Sex by Age in Montauk
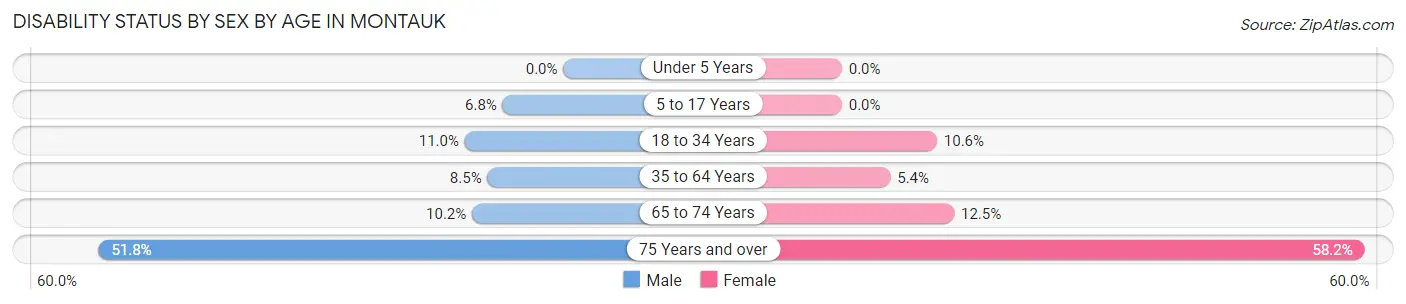
| Age Bracket | Male | Female |
| Under 5 Years | 0 (0.0%) | 0 (0.0%) |
| 5 to 17 Years | 14 (6.8%) | 0 (0.0%) |
| 18 to 34 Years | 55 (11.0%) | 43 (10.6%) |
| 35 to 64 Years | 74 (8.5%) | 46 (5.4%) |
| 65 to 74 Years | 39 (10.2%) | 34 (12.5%) |
| 75 Years and over | 73 (51.8%) | 78 (58.2%) |
Disability Class by Sex by Age in Montauk
Disability Class: Hearing Difficulty
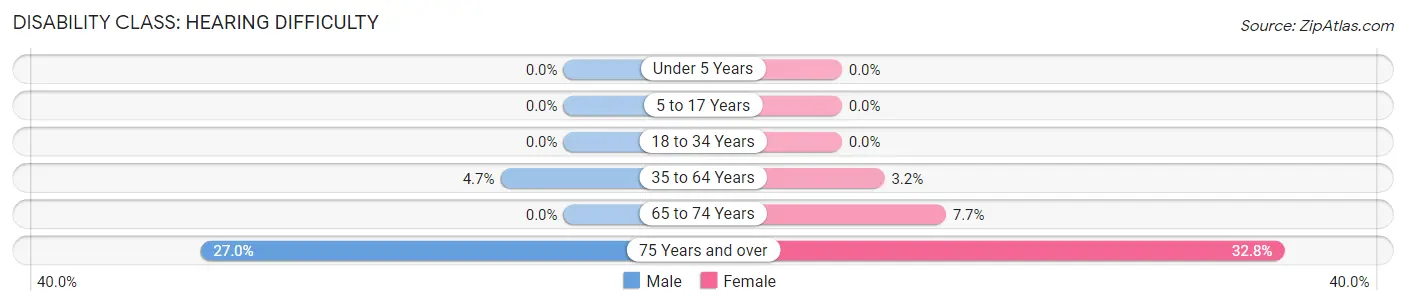
| Age Bracket | Male | Female |
| Under 5 Years | 0 (0.0%) | 0 (0.0%) |
| 5 to 17 Years | 0 (0.0%) | 0 (0.0%) |
| 18 to 34 Years | 0 (0.0%) | 0 (0.0%) |
| 35 to 64 Years | 41 (4.7%) | 27 (3.2%) |
| 65 to 74 Years | 0 (0.0%) | 21 (7.7%) |
| 75 Years and over | 38 (27.0%) | 44 (32.8%) |
Disability Class: Vision Difficulty
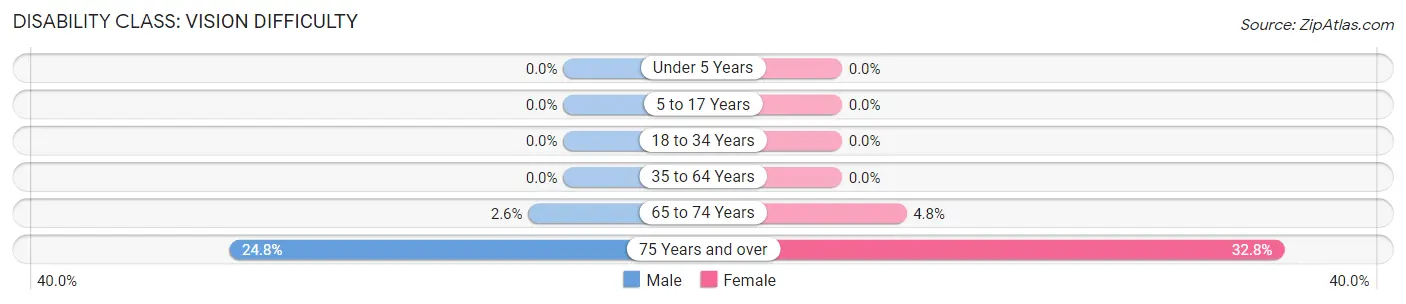
| Age Bracket | Male | Female |
| Under 5 Years | 0 (0.0%) | 0 (0.0%) |
| 5 to 17 Years | 0 (0.0%) | 0 (0.0%) |
| 18 to 34 Years | 0 (0.0%) | 0 (0.0%) |
| 35 to 64 Years | 0 (0.0%) | 0 (0.0%) |
| 65 to 74 Years | 10 (2.6%) | 13 (4.8%) |
| 75 Years and over | 35 (24.8%) | 44 (32.8%) |
Disability Class: Cognitive Difficulty
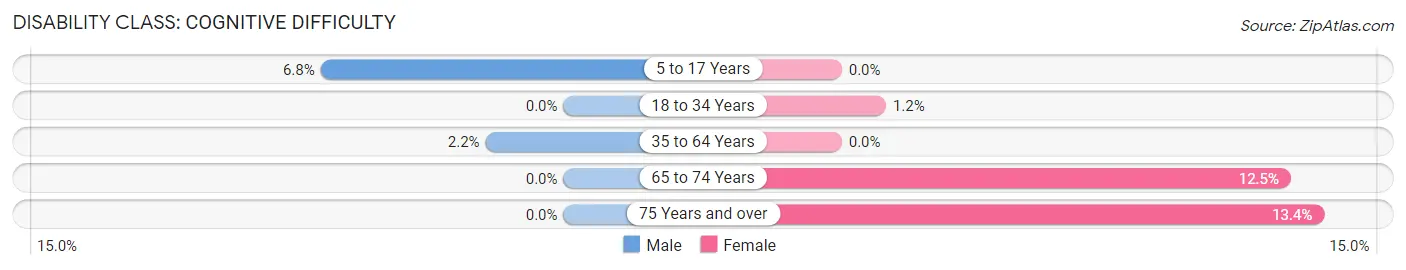
| Age Bracket | Male | Female |
| 5 to 17 Years | 14 (6.8%) | 0 (0.0%) |
| 18 to 34 Years | 0 (0.0%) | 5 (1.2%) |
| 35 to 64 Years | 19 (2.2%) | 0 (0.0%) |
| 65 to 74 Years | 0 (0.0%) | 34 (12.5%) |
| 75 Years and over | 0 (0.0%) | 18 (13.4%) |
Disability Class: Ambulatory Difficulty
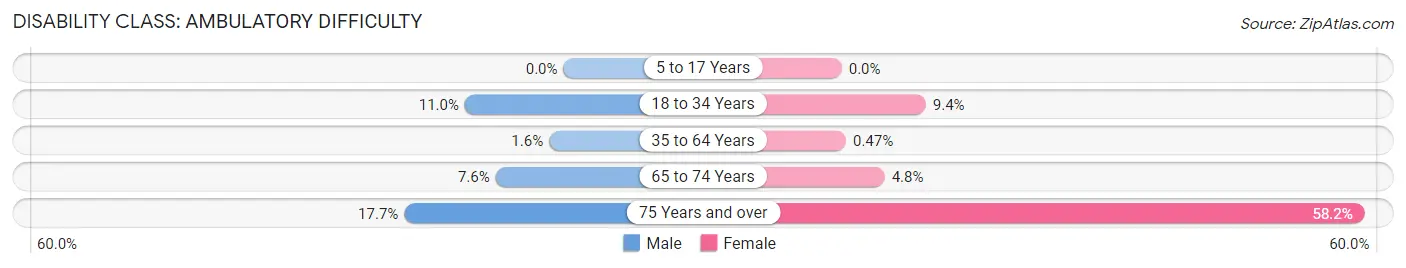
| Age Bracket | Male | Female |
| 5 to 17 Years | 0 (0.0%) | 0 (0.0%) |
| 18 to 34 Years | 55 (11.0%) | 38 (9.4%) |
| 35 to 64 Years | 14 (1.6%) | 4 (0.5%) |
| 65 to 74 Years | 29 (7.5%) | 13 (4.8%) |
| 75 Years and over | 25 (17.7%) | 78 (58.2%) |
Disability Class: Self-Care Difficulty
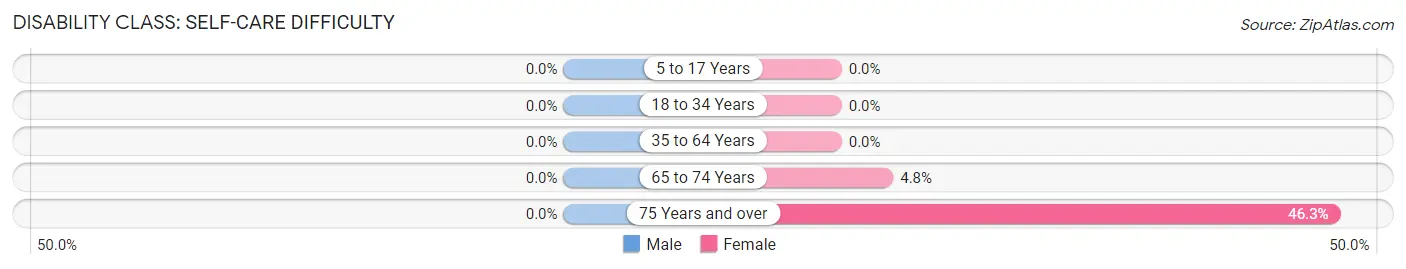
| Age Bracket | Male | Female |
| 5 to 17 Years | 0 (0.0%) | 0 (0.0%) |
| 18 to 34 Years | 0 (0.0%) | 0 (0.0%) |
| 35 to 64 Years | 0 (0.0%) | 0 (0.0%) |
| 65 to 74 Years | 0 (0.0%) | 13 (4.8%) |
| 75 Years and over | 0 (0.0%) | 62 (46.3%) |
Technology Access in Montauk
Computing Device Access in Montauk
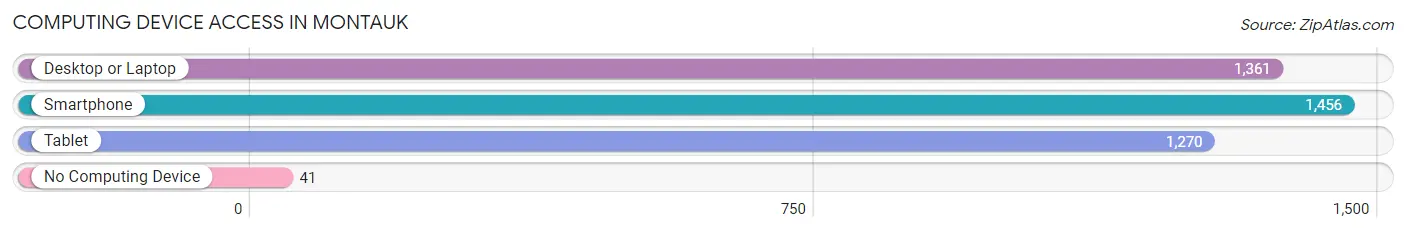
| Device Type | # Households | % Households |
| Desktop or Laptop | 1,361 | 86.1% |
| Smartphone | 1,456 | 92.1% |
| Tablet | 1,270 | 80.4% |
| No Computing Device | 41 | 2.6% |
| Total | 1,580 | 100.0% |
Internet Access in Montauk
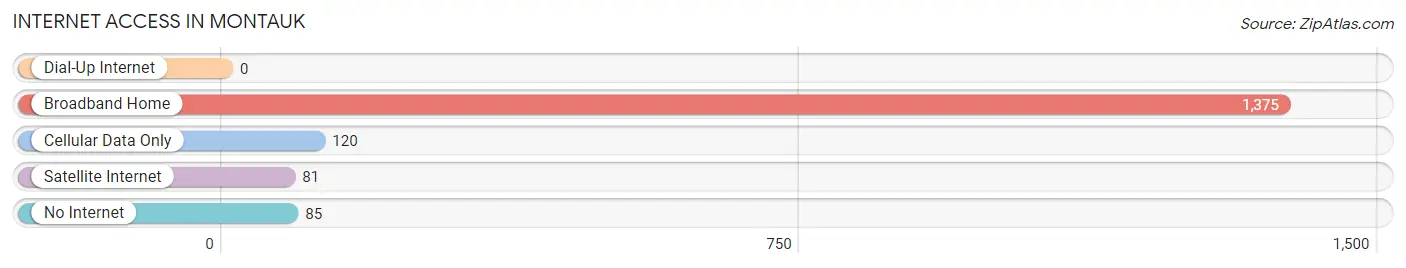
| Internet Type | # Households | % Households |
| Dial-Up Internet | 0 | 0.0% |
| Broadband Home | 1,375 | 87.0% |
| Cellular Data Only | 120 | 7.6% |
| Satellite Internet | 81 | 5.1% |
| No Internet | 85 | 5.4% |
| Total | 1,580 | 100.0% |
Montauk Summary
Montauk, NY is a small hamlet located on the easternmost tip of Long Island, New York. It is a popular tourist destination, known for its beautiful beaches, fishing, and surfing. The area has a rich history, with Native American tribes inhabiting the area for centuries before the arrival of European settlers. The town has a unique geography, with its location on the Atlantic Ocean and its proximity to the Hamptons. The economy of Montauk is largely based on tourism, with many businesses catering to visitors. The demographics of the town are diverse, with a mix of year-round residents and seasonal visitors.
History
The area now known as Montauk has been inhabited by Native American tribes for centuries. The Montaukett tribe, a branch of the Algonquin people, were the first to settle in the area. They lived in the area for hundreds of years, fishing and hunting in the area. The Montaukett were eventually forced off their land by European settlers in the late 1600s.
The first European settlers arrived in Montauk in 1640, led by Lion Gardiner. The settlement was initially called "Gardiner's Island," but was later changed to "Montauk" after the Montaukett tribe. The town was officially incorporated in 1686.
In the late 1700s, Montauk became a popular whaling port. The town was also home to a large fishing industry, with many of the town's residents working as fishermen. In the late 1800s, the town began to attract tourists, and the first hotel was built in 1879.
Geography
Montauk is located on the easternmost tip of Long Island, New York. It is bordered by the Atlantic Ocean to the south and Block Island Sound to the north. The town is located approximately 120 miles east of New York City.
The town has a total area of 11.3 square miles, with 8.3 square miles of land and 3.0 square miles of water. The town is home to several beaches, including Ditch Plains Beach, Montauk Point Beach, and Hither Hills Beach.
Economy
The economy of Montauk is largely based on tourism. The town is a popular destination for beachgoers, surfers, and fishermen. There are many businesses in the town that cater to visitors, including hotels, restaurants, and shops.
The town is also home to a number of commercial fishing operations. The town's harbor is home to a large fleet of fishing boats, and the town is a major supplier of seafood to the New York City area.
Demographics
As of the 2010 census, the population of Montauk was 3,326. The population is largely white (90.2%), with a small percentage of African Americans (2.2%) and Hispanics (3.2%). The median household income is $63,750, and the median home value is $845,000.
The town is home to a mix of year-round residents and seasonal visitors. During the summer months, the population of the town increases significantly as tourists flock to the area.
Conclusion
Montauk, NY is a small hamlet located on the easternmost tip of Long Island, New York. It has a rich history, with Native American tribes inhabiting the area for centuries before the arrival of European settlers. The town has a unique geography, with its location on the Atlantic Ocean and its proximity to the Hamptons. The economy of Montauk is largely based on tourism, with many businesses catering to visitors. The demographics of the town are diverse, with a mix of year-round residents and seasonal visitors.
Common Questions
What is the Total Population of Montauk?
Total Population of Montauk is 4,322.
What is the Total Male Population of Montauk?
Total Male Population of Montauk is 2,306.
What is the Total Female Population of Montauk?
Total Female Population of Montauk is 2,016.
What is the Ratio of Males per 100 Females in Montauk?
There are 114.38 Males per 100 Females in Montauk.
What is the Ratio of Females per 100 Males in Montauk?
There are 87.42 Females per 100 Males in Montauk.
What is the Median Population Age in Montauk?
Median Population Age in Montauk is 49.4 Years.
What is the Average Family Size in Montauk
Average Family Size in Montauk is 3.2 People.
What is the Average Household Size in Montauk
Average Household Size in Montauk is 2.7 People.
What is Per Capita Income in Montauk?
Per Capita income in Montauk is $83,843.
What is the Median Family Income in Montauk?
Median Family Income in Montauk is $162,969.
What is the Median Household income in Montauk?
Median Household Income in Montauk is $138,900.
What is Income or Wage Gap in Montauk?
Income or Wage Gap in Montauk is 36.4%.
Women in Montauk earn 63.6 cents for every dollar earned by a man.
What is Inequality or Gini Index in Montauk?
Inequality or Gini Index in Montauk is 0.52.
How Large is the Labor Force in Montauk?
There are 2,237 People in the Labor Forcein in Montauk.
What is the Percentage of People in the Labor Force in Montauk?
61.6% of People are in the Labor Force in Montauk.
What is the Unemployment Rate in Montauk?
Unemployment Rate in Montauk is 5.5%.