Washington Heights, NY
Washington Heights Map
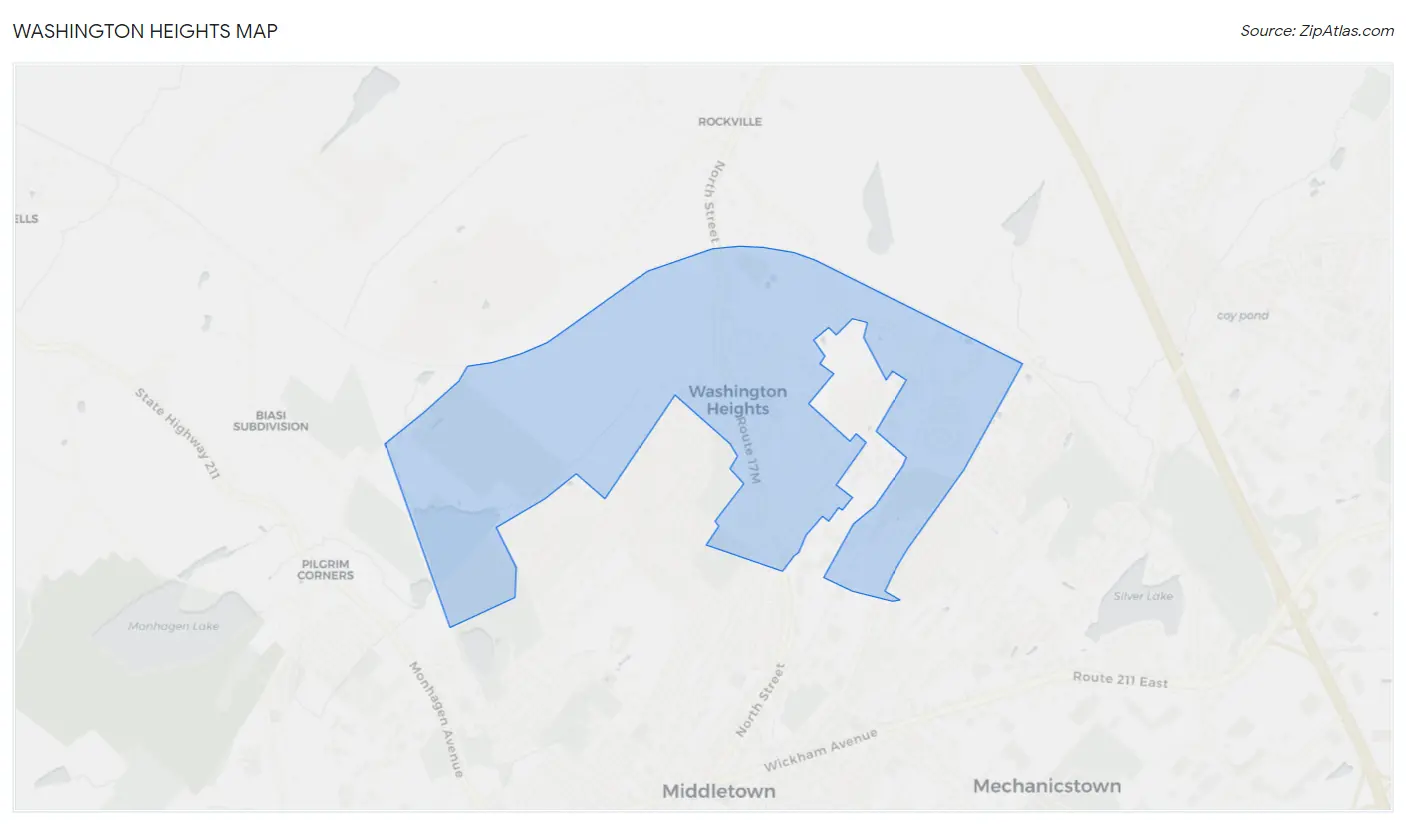
Washington Heights Overview
1,572
TOTAL POPULATION
856
MALE POPULATION
716
FEMALE POPULATION
119.55
MALES / 100 FEMALES
83.64
FEMALES / 100 MALES
39.7
MEDIAN AGE
3.1
AVG FAMILY SIZE
2.6
AVG HOUSEHOLD SIZE
$43,155
PER CAPITA INCOME
$67,188
AVG HOUSEHOLD INCOME
28.0%
WAGE / INCOME GAP [ % ]
72.0¢/ $1
WAGE / INCOME GAP [ $ ]
0.49
INEQUALITY / GINI INDEX
761
LABOR FORCE [ PEOPLE ]
66.6%
PERCENT IN LABOR FORCE
8.9%
UNEMPLOYMENT RATE
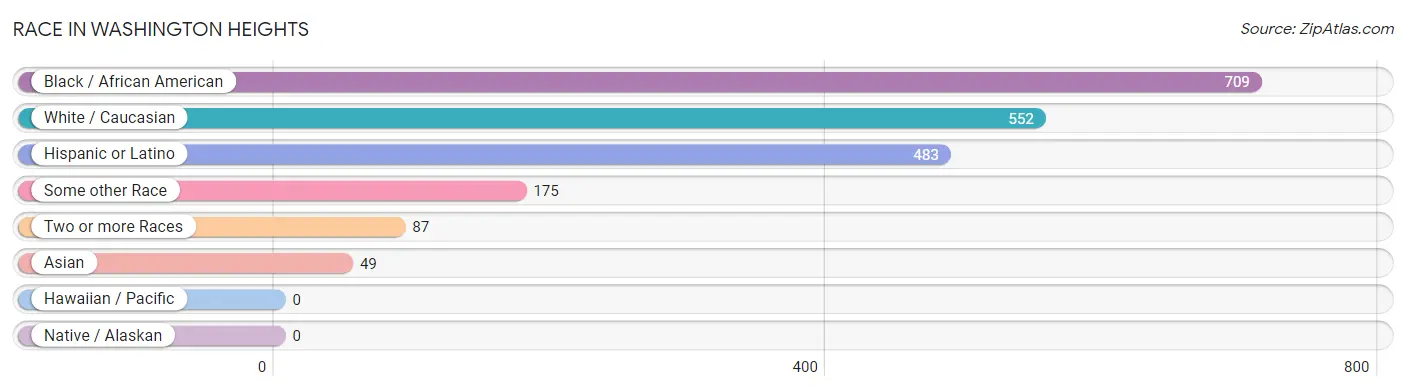
Race in Washington Heights
The most populous races in Washington Heights are Black / African American (709 | 45.1%), White / Caucasian (552 | 35.1%), and Hispanic or Latino (483 | 30.7%).
| Race | # Population | % Population |
| Asian | 49 | 3.1% |
| Black / African American | 709 | 45.1% |
| Hawaiian / Pacific | 0 | 0.0% |
| Hispanic or Latino | 483 | 30.7% |
| Native / Alaskan | 0 | 0.0% |
| White / Caucasian | 552 | 35.1% |
| Two or more Races | 87 | 5.5% |
| Some other Race | 175 | 11.1% |
| Total | 1,572 | 100.0% |
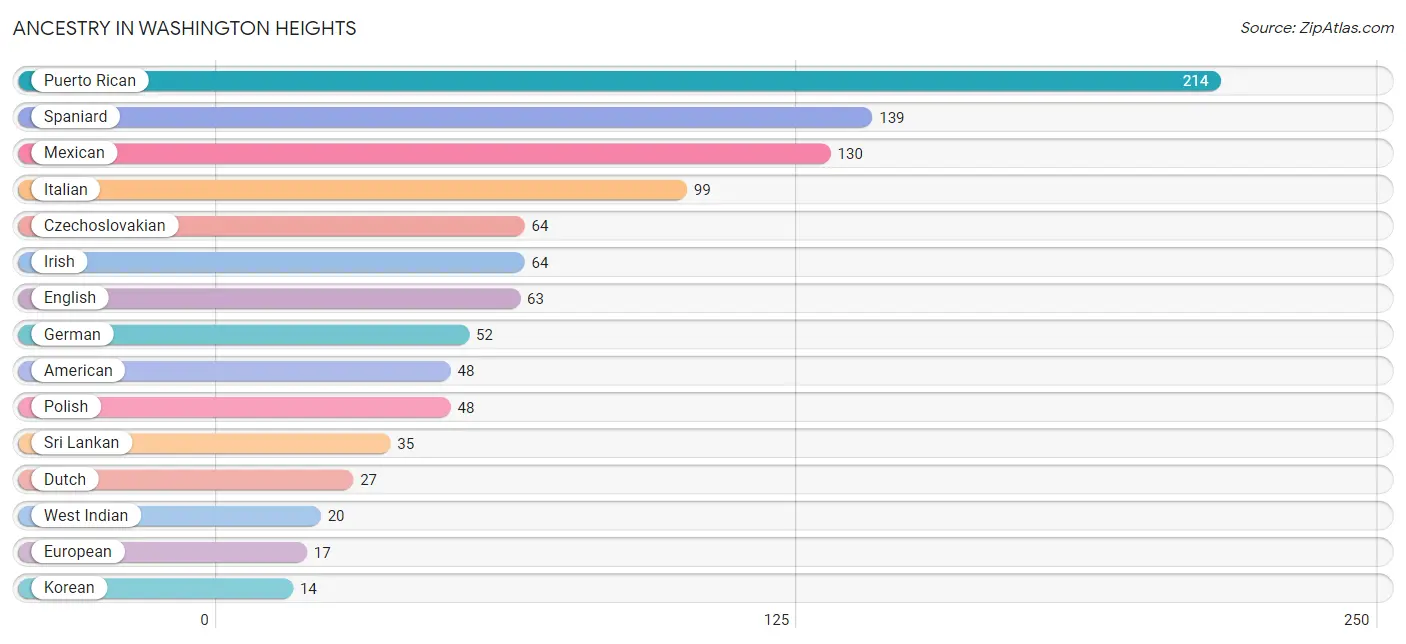
Ancestry in Washington Heights
The most populous ancestries reported in Washington Heights are Puerto Rican (214 | 13.6%), Spaniard (139 | 8.8%), Mexican (130 | 8.3%), Italian (99 | 6.3%), and Czechoslovakian (64 | 4.1%), together accounting for 41.1% of all Washington Heights residents.
| Ancestry | # Population | % Population |
| American | 48 | 3.0% |
| Czechoslovakian | 64 | 4.1% |
| Dutch | 27 | 1.7% |
| English | 63 | 4.0% |
| European | 17 | 1.1% |
| German | 52 | 3.3% |
| Irish | 64 | 4.1% |
| Italian | 99 | 6.3% |
| Korean | 14 | 0.9% |
| Mexican | 130 | 8.3% |
| Polish | 48 | 3.0% |
| Puerto Rican | 214 | 13.6% |
| Spaniard | 139 | 8.8% |
| Sri Lankan | 35 | 2.2% |
| West Indian | 20 | 1.3% | View All 15 Rows |
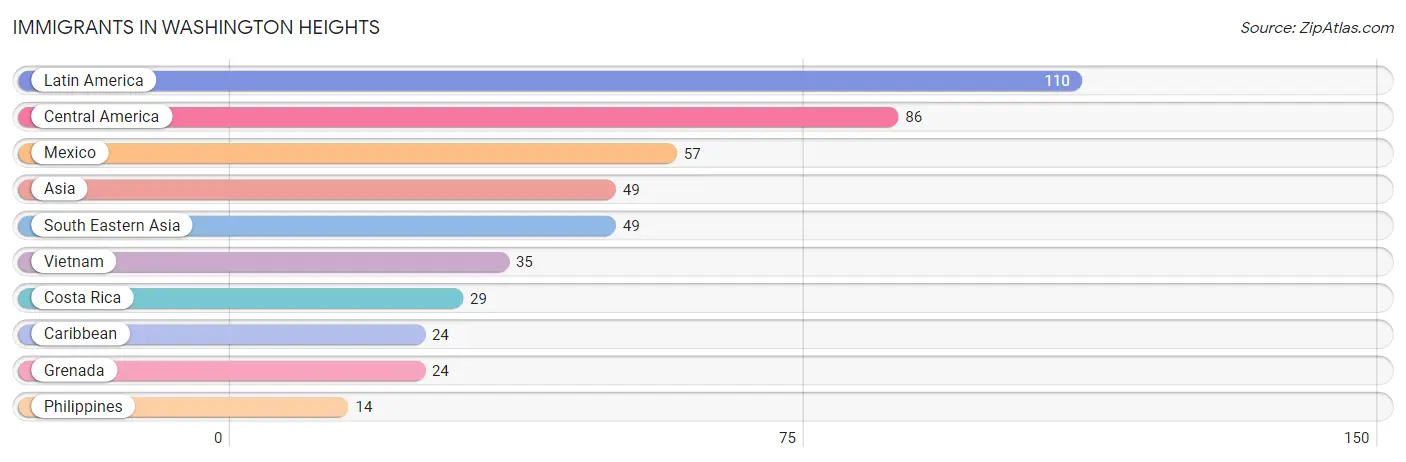
Immigrants in Washington Heights
The most numerous immigrant groups reported in Washington Heights came from Latin America (110 | 7.0%), Central America (86 | 5.5%), Mexico (57 | 3.6%), Asia (49 | 3.1%), and South Eastern Asia (49 | 3.1%), together accounting for 22.3% of all Washington Heights residents.
| Immigration Origin | # Population | % Population |
| Asia | 49 | 3.1% |
| Caribbean | 24 | 1.5% |
| Central America | 86 | 5.5% |
| Costa Rica | 29 | 1.8% |
| Grenada | 24 | 1.5% |
| Latin America | 110 | 7.0% |
| Mexico | 57 | 3.6% |
| Philippines | 14 | 0.9% |
| South Eastern Asia | 49 | 3.1% |
| Vietnam | 35 | 2.2% | View All 10 Rows |
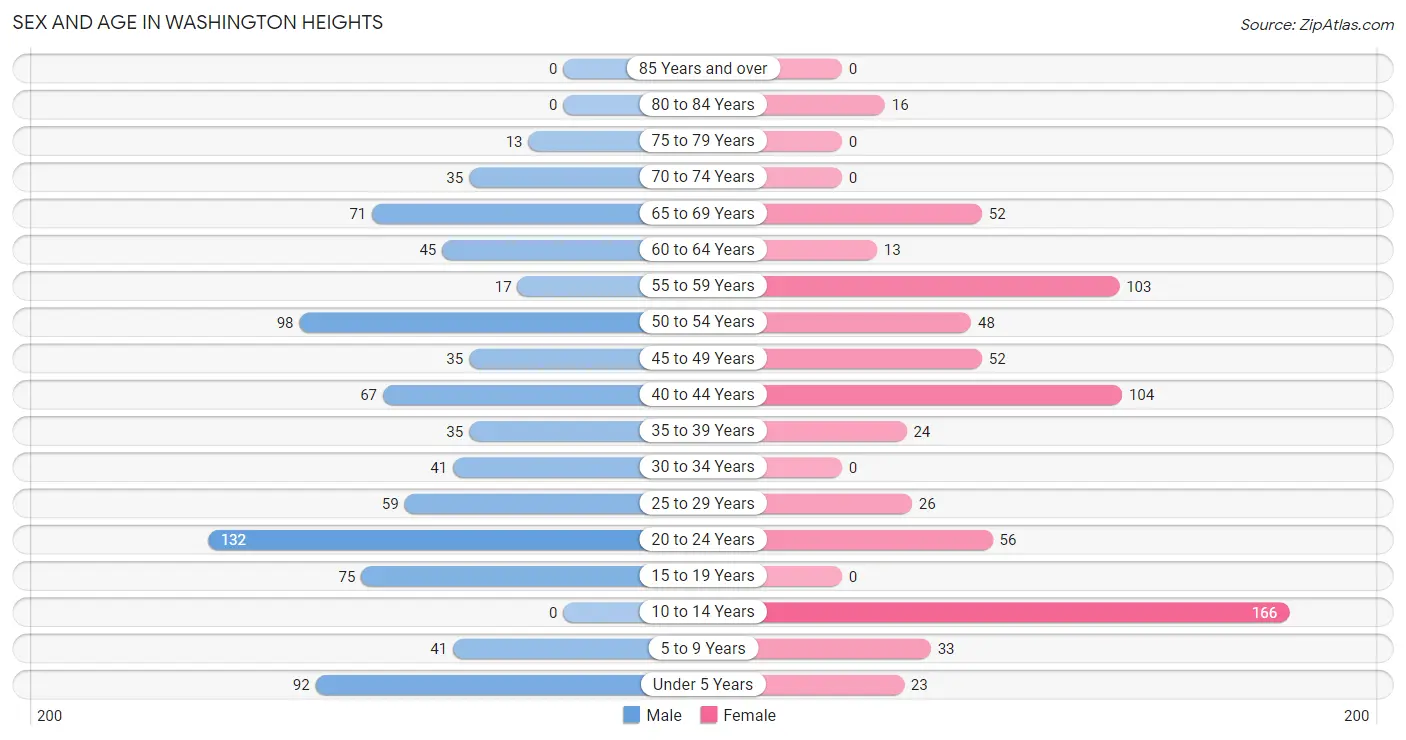
Sex and Age in Washington Heights
Sex and Age in Washington Heights
The most populous age groups in Washington Heights are 20 to 24 Years (132 | 15.4%) for men and 10 to 14 Years (166 | 23.2%) for women.
| Age Bracket | Male | Female |
| Under 5 Years | 92 (10.7%) | 23 (3.2%) |
| 5 to 9 Years | 41 (4.8%) | 33 (4.6%) |
| 10 to 14 Years | 0 (0.0%) | 166 (23.2%) |
| 15 to 19 Years | 75 (8.8%) | 0 (0.0%) |
| 20 to 24 Years | 132 (15.4%) | 56 (7.8%) |
| 25 to 29 Years | 59 (6.9%) | 26 (3.6%) |
| 30 to 34 Years | 41 (4.8%) | 0 (0.0%) |
| 35 to 39 Years | 35 (4.1%) | 24 (3.4%) |
| 40 to 44 Years | 67 (7.8%) | 104 (14.5%) |
| 45 to 49 Years | 35 (4.1%) | 52 (7.3%) |
| 50 to 54 Years | 98 (11.5%) | 48 (6.7%) |
| 55 to 59 Years | 17 (2.0%) | 103 (14.4%) |
| 60 to 64 Years | 45 (5.3%) | 13 (1.8%) |
| 65 to 69 Years | 71 (8.3%) | 52 (7.3%) |
| 70 to 74 Years | 35 (4.1%) | 0 (0.0%) |
| 75 to 79 Years | 13 (1.5%) | 0 (0.0%) |
| 80 to 84 Years | 0 (0.0%) | 16 (2.2%) |
| 85 Years and over | 0 (0.0%) | 0 (0.0%) |
| Total | 856 (100.0%) | 716 (100.0%) |
Families and Households in Washington Heights
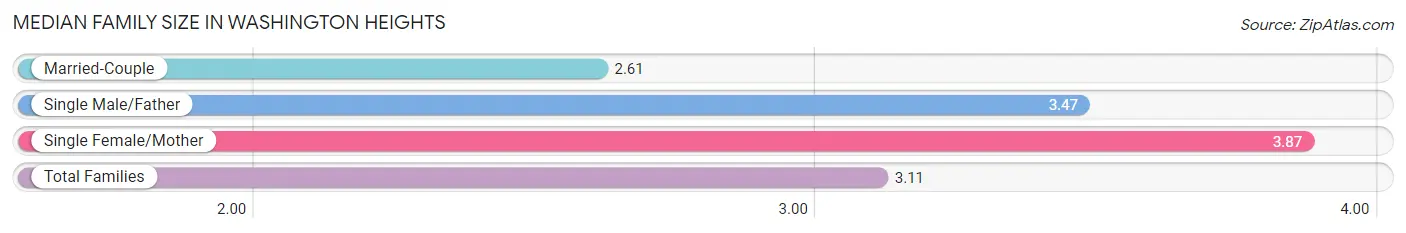
Median Family Size in Washington Heights
The median family size in Washington Heights is 3.11 persons per family, with single female/mother families (121 | 30.6%) accounting for the largest median family size of 3.87 persons per family. On the other hand, married-couple families (220 | 55.6%) represent the smallest median family size with 2.61 persons per family.
| Family Type | # Families | Family Size |
| Married-Couple | 220 (55.6%) | 2.61 |
| Single Male/Father | 55 (13.9%) | 3.47 |
| Single Female/Mother | 121 (30.6%) | 3.87 |
| Total Families | 396 (100.0%) | 3.11 |
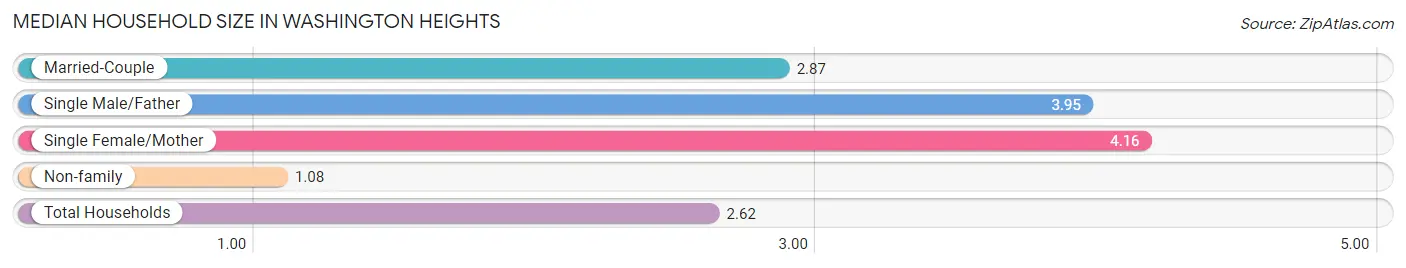
Median Household Size in Washington Heights
The median household size in Washington Heights is 2.62 persons per household, with single female/mother households (121 | 20.2%) accounting for the largest median household size of 4.16 persons per household. non-family households (203 | 33.9%) represent the smallest median household size with 1.08 persons per household.
| Household Type | # Households | Household Size |
| Married-Couple | 220 (36.7%) | 2.87 |
| Single Male/Father | 55 (9.2%) | 3.95 |
| Single Female/Mother | 121 (20.2%) | 4.16 |
| Non-family | 203 (33.9%) | 1.08 |
| Total Households | 599 (100.0%) | 2.62 |
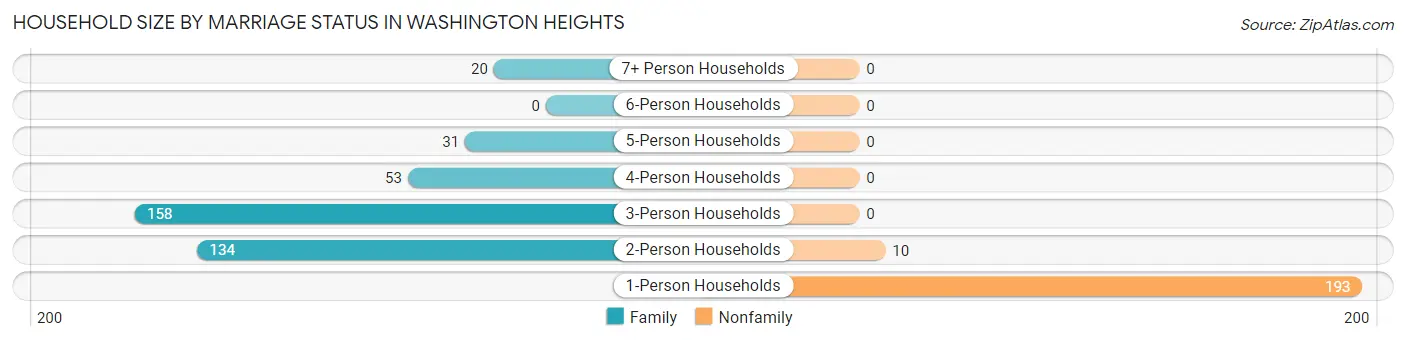
Household Size by Marriage Status in Washington Heights
Out of a total of 599 households in Washington Heights, 396 (66.1%) are family households, while 203 (33.9%) are nonfamily households. The most numerous type of family households are 3-person households, comprising 158, and the most common type of nonfamily households are 1-person households, comprising 193.
| Household Size | Family Households | Nonfamily Households |
| 1-Person Households | - | 193 (32.2%) |
| 2-Person Households | 134 (22.4%) | 10 (1.7%) |
| 3-Person Households | 158 (26.4%) | 0 (0.0%) |
| 4-Person Households | 53 (8.8%) | 0 (0.0%) |
| 5-Person Households | 31 (5.2%) | 0 (0.0%) |
| 6-Person Households | 0 (0.0%) | 0 (0.0%) |
| 7+ Person Households | 20 (3.3%) | 0 (0.0%) |
| Total | 396 (66.1%) | 203 (33.9%) |
Female Fertility in Washington Heights
Fertility by Age in Washington Heights
| Age Bracket | Women with Births | Births / 1,000 Women |
| 15 to 19 years | 0 (0.0%) | 0.0 |
| 20 to 34 years | 0 (0.0%) | 0.0 |
| 35 to 50 years | 0 (0.0%) | 0.0 |
| Total | 0 (0.0%) | 0.0 |
Fertility by Age by Marriage Status in Washington Heights
| Age Bracket | Married | Unmarried |
| 15 to 19 years | 0 (0.0%) | 0 (0.0%) |
| 20 to 34 years | 0 (0.0%) | 0 (0.0%) |
| 35 to 50 years | 0 (0.0%) | 0 (0.0%) |
| Total | 0 (0.0%) | 0 (0.0%) |
Fertility by Education in Washington Heights
| Educational Attainment | Women with Births | Births / 1,000 Women |
| Less than High School | 0 (0.0%) | 0.0 |
| High School Diploma | 0 (0.0%) | 0.0 |
| College or Associate's Degree | 0 (0.0%) | 0.0 |
| Bachelor's Degree | 0 (0.0%) | 0.0 |
| Graduate Degree | 0 (0.0%) | 0.0 |
| Total | 0 (0.0%) | 0.0 |
Fertility by Education by Marriage Status in Washington Heights
| Educational Attainment | Married | Unmarried |
| Less than High School | 0 (0.0%) | 0 (0.0%) |
| High School Diploma | 0 (0.0%) | 0 (0.0%) |
| College or Associate's Degree | 0 (0.0%) | 0 (0.0%) |
| Bachelor's Degree | 0 (0.0%) | 0 (0.0%) |
| Graduate Degree | 0 (0.0%) | 0 (0.0%) |
| Total | 0 (0.0%) | 0 (0.0%) |
Income in Washington Heights
Income Overview in Washington Heights
| Characteristic | Number | Measure |
| Per Capita Income | 1,572 | $43,155 |
| Median Family Income | 396 | $0 |
| Mean Family Income | 396 | $129,727 |
| Median Household Income | 599 | $67,188 |
| Mean Household Income | 599 | $108,968 |
| Income Deficit | 396 | $0 |
| Wage / Income Gap (%) | 1,572 | 27.98% |
| Wage / Income Gap ($) | 1,572 | 72.02¢ per $1 |
| Gini / Inequality Index | 1,572 | 0.49 |
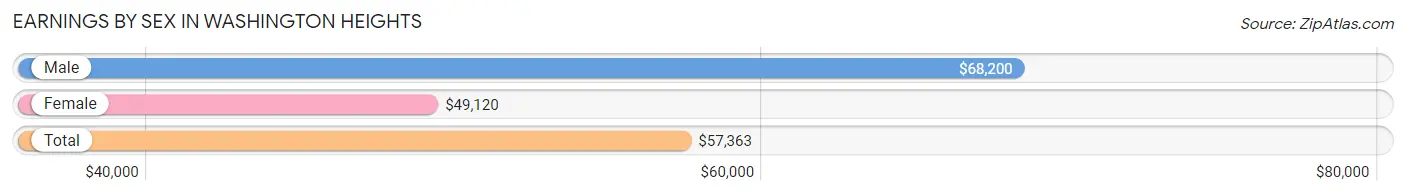
Earnings by Sex in Washington Heights
Average Earnings in Washington Heights are $57,363, $68,200 for men and $49,120 for women, a difference of 28.0%.
| Sex | Number | Average Earnings |
| Male | 366 (48.1%) | $68,200 |
| Female | 395 (51.9%) | $49,120 |
| Total | 761 (100.0%) | $57,363 |
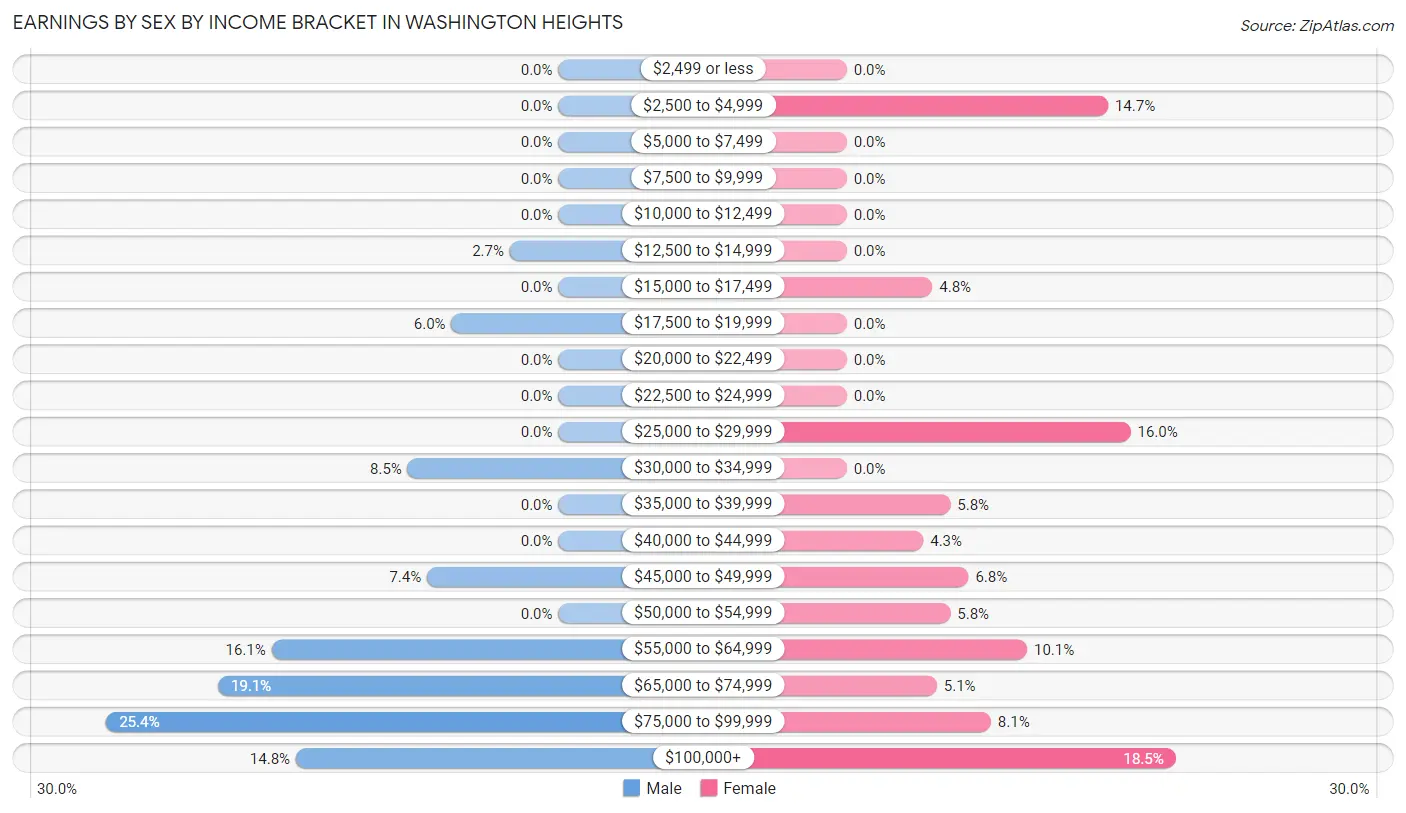
Earnings by Sex by Income Bracket in Washington Heights
The most common earnings brackets in Washington Heights are $75,000 to $99,999 for men (93 | 25.4%) and $100,000+ for women (73 | 18.5%).
| Income | Male | Female |
| $2,499 or less | 0 (0.0%) | 0 (0.0%) |
| $2,500 to $4,999 | 0 (0.0%) | 58 (14.7%) |
| $5,000 to $7,499 | 0 (0.0%) | 0 (0.0%) |
| $7,500 to $9,999 | 0 (0.0%) | 0 (0.0%) |
| $10,000 to $12,499 | 0 (0.0%) | 0 (0.0%) |
| $12,500 to $14,999 | 10 (2.7%) | 0 (0.0%) |
| $15,000 to $17,499 | 0 (0.0%) | 19 (4.8%) |
| $17,500 to $19,999 | 22 (6.0%) | 0 (0.0%) |
| $20,000 to $22,499 | 0 (0.0%) | 0 (0.0%) |
| $22,500 to $24,999 | 0 (0.0%) | 0 (0.0%) |
| $25,000 to $29,999 | 0 (0.0%) | 63 (16.0%) |
| $30,000 to $34,999 | 31 (8.5%) | 0 (0.0%) |
| $35,000 to $39,999 | 0 (0.0%) | 23 (5.8%) |
| $40,000 to $44,999 | 0 (0.0%) | 17 (4.3%) |
| $45,000 to $49,999 | 27 (7.4%) | 27 (6.8%) |
| $50,000 to $54,999 | 0 (0.0%) | 23 (5.8%) |
| $55,000 to $64,999 | 59 (16.1%) | 40 (10.1%) |
| $65,000 to $74,999 | 70 (19.1%) | 20 (5.1%) |
| $75,000 to $99,999 | 93 (25.4%) | 32 (8.1%) |
| $100,000+ | 54 (14.7%) | 73 (18.5%) |
| Total | 366 (100.0%) | 395 (100.0%) |
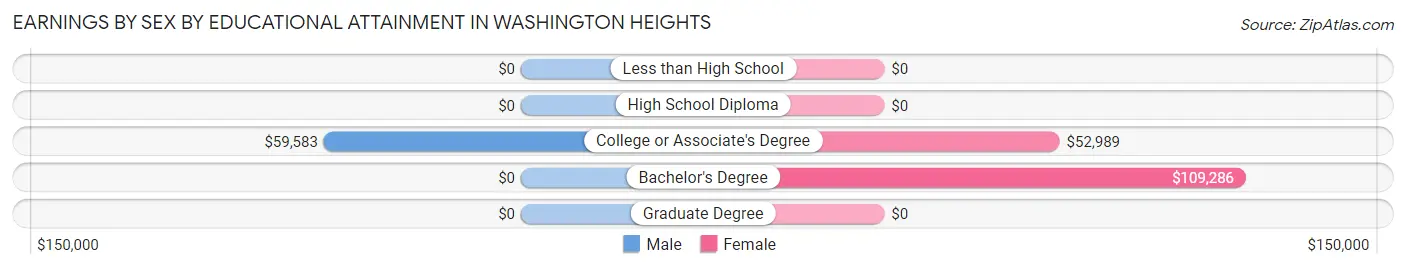
Earnings by Sex by Educational Attainment in Washington Heights
Average earnings in Washington Heights are $69,000 for men and $54,511 for women, a difference of 21.0%. Men with an educational attainment of college or associate's degree enjoy the highest average annual earnings of $59,583, while those with college or associate's degree education earn the least with $59,583. Women with an educational attainment of bachelor's degree earn the most with the average annual earnings of $109,286, while those with college or associate's degree education have the smallest earnings of $52,989.
| Educational Attainment | Male Income | Female Income |
| Less than High School | - | - |
| High School Diploma | - | - |
| College or Associate's Degree | $59,583 | $52,989 |
| Bachelor's Degree | - | - |
| Graduate Degree | - | - |
| Total | $69,000 | $54,511 |
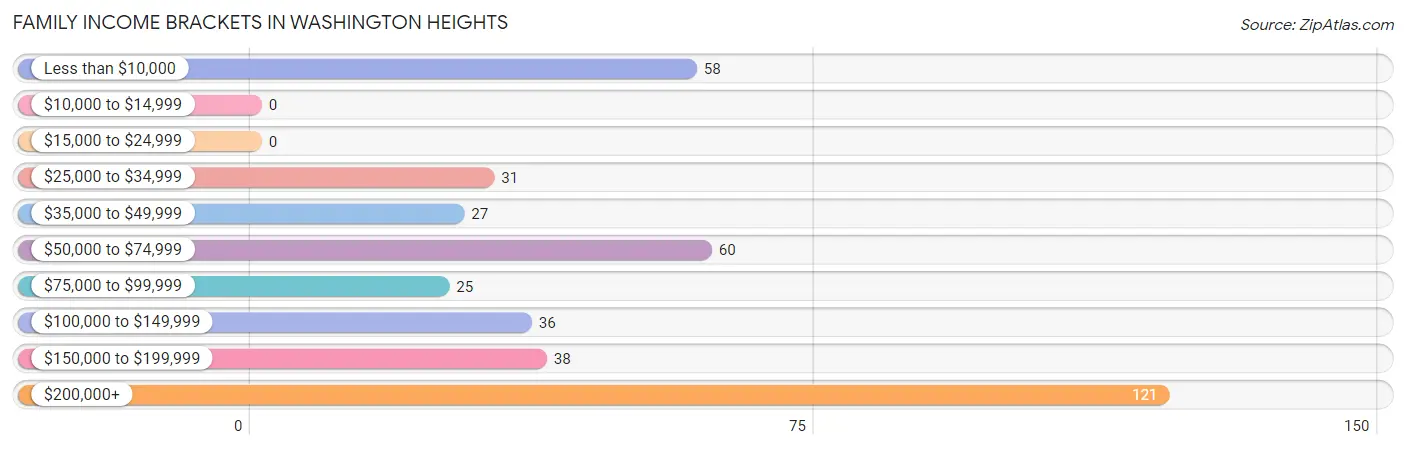
Family Income in Washington Heights
Family Income Brackets in Washington Heights
According to the Washington Heights family income data, there are 121 families falling into the $200,000+ income range, which is the most common income bracket and makes up 30.6% of all families.
| Income Bracket | # Families | % Families |
| Less than $10,000 | 58 | 14.6% |
| $10,000 to $14,999 | 0 | 0.0% |
| $15,000 to $24,999 | 0 | 0.0% |
| $25,000 to $34,999 | 31 | 7.8% |
| $35,000 to $49,999 | 27 | 6.8% |
| $50,000 to $74,999 | 60 | 15.2% |
| $75,000 to $99,999 | 25 | 6.3% |
| $100,000 to $149,999 | 36 | 9.1% |
| $150,000 to $199,999 | 38 | 9.6% |
| $200,000+ | 121 | 30.6% |
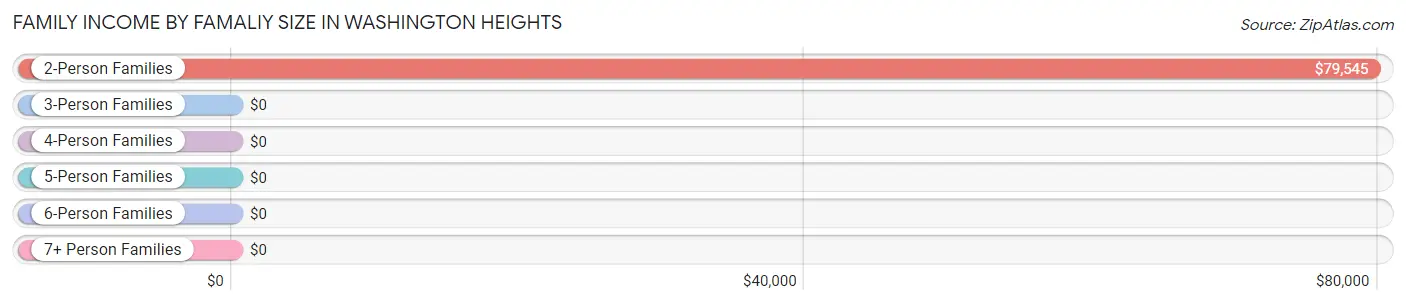
Family Income by Famaliy Size in Washington Heights
2-person families (134 | 33.8%) account for the highest median family income in Washington Heights with $79,545 per family, while 2-person families (134 | 33.8%) have the highest median income of $39,772 per family member.
| Income Bracket | # Families | Median Income |
| 2-Person Families | 134 (33.8%) | $79,545 |
| 3-Person Families | 187 (47.2%) | $0 |
| 4-Person Families | 55 (13.9%) | $0 |
| 5-Person Families | 0 (0.0%) | $0 |
| 6-Person Families | 20 (5.1%) | $0 |
| 7+ Person Families | 0 (0.0%) | $0 |
| Total | 396 (100.0%) | $0 |
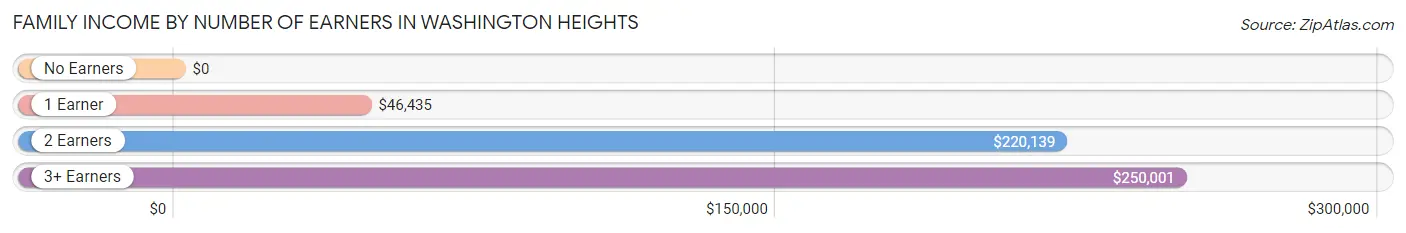
Family Income by Number of Earners in Washington Heights
| Number of Earners | # Families | Median Income |
| No Earners | 18 (4.5%) | $0 |
| 1 Earner | 209 (52.8%) | $46,435 |
| 2 Earners | 99 (25.0%) | $220,139 |
| 3+ Earners | 70 (17.7%) | $250,001 |
| Total | 396 (100.0%) | $0 |
Household Income in Washington Heights
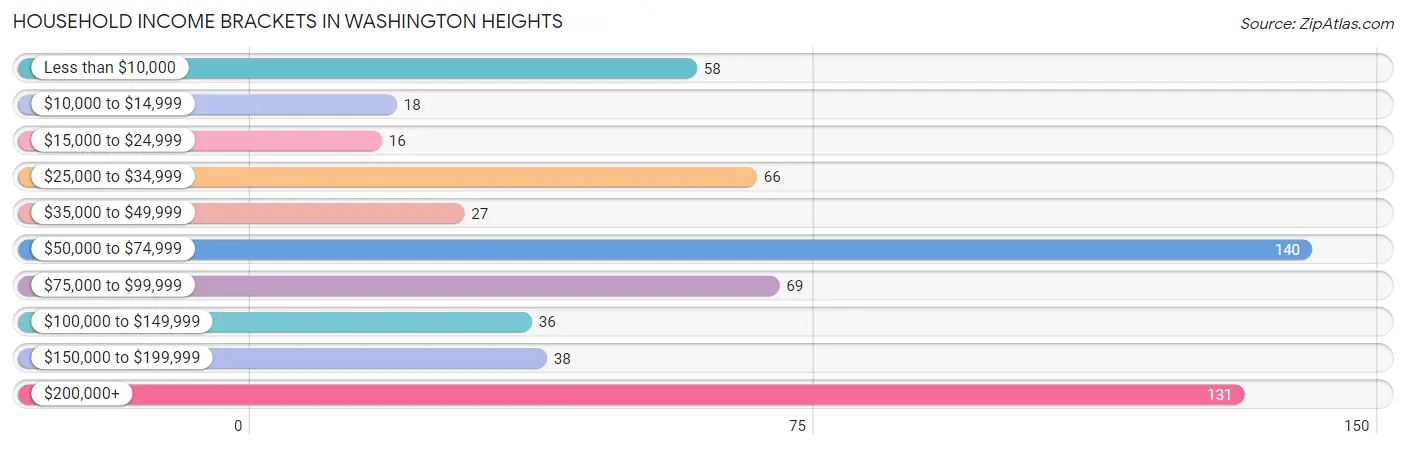
Household Income Brackets in Washington Heights
With 140 households falling in the category, the $50,000 to $74,999 income range is the most frequent in Washington Heights, accounting for 23.4% of all households. In contrast, only 16 households (2.7%) fall into the $15,000 to $24,999 income bracket, making it the least populous group.
| Income Bracket | # Households | % Households |
| Less than $10,000 | 58 | 9.7% |
| $10,000 to $14,999 | 18 | 3.0% |
| $15,000 to $24,999 | 16 | 2.7% |
| $25,000 to $34,999 | 66 | 11.0% |
| $35,000 to $49,999 | 27 | 4.5% |
| $50,000 to $74,999 | 140 | 23.4% |
| $75,000 to $99,999 | 69 | 11.5% |
| $100,000 to $149,999 | 36 | 6.0% |
| $150,000 to $199,999 | 38 | 6.3% |
| $200,000+ | 131 | 21.9% |
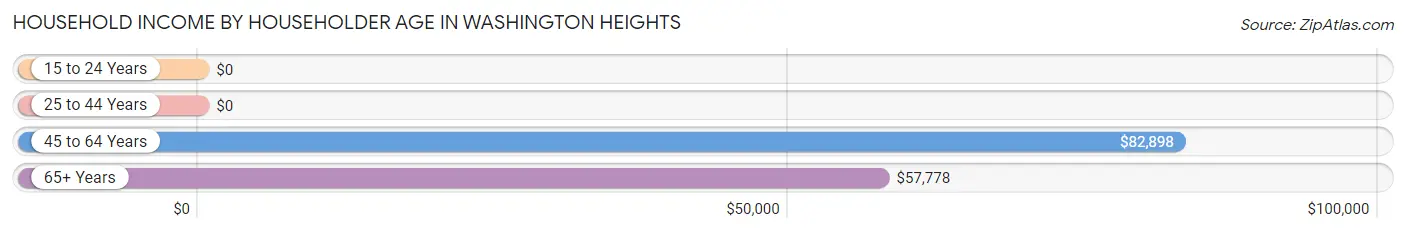
Household Income by Householder Age in Washington Heights
The median household income in Washington Heights is $67,188, with the highest median household income of $82,898 found in the 45 to 64 years age bracket for the primary householder. A total of 276 households (46.1%) fall into this category.
| Income Bracket | # Households | Median Income |
| 15 to 24 Years | 0 (0.0%) | $0 |
| 25 to 44 Years | 191 (31.9%) | $0 |
| 45 to 64 Years | 276 (46.1%) | $82,898 |
| 65+ Years | 132 (22.0%) | $57,778 |
| Total | 599 (100.0%) | $67,188 |
Poverty in Washington Heights
Income Below Poverty by Sex and Age in Washington Heights
With 25.1% poverty level for males and 15.1% for females among the residents of Washington Heights, 15 year old males and 25 to 34 year old females are the most vulnerable to poverty, with 75 males (100.0%) and 26 females (100.0%) in their respective age groups living below the poverty level.
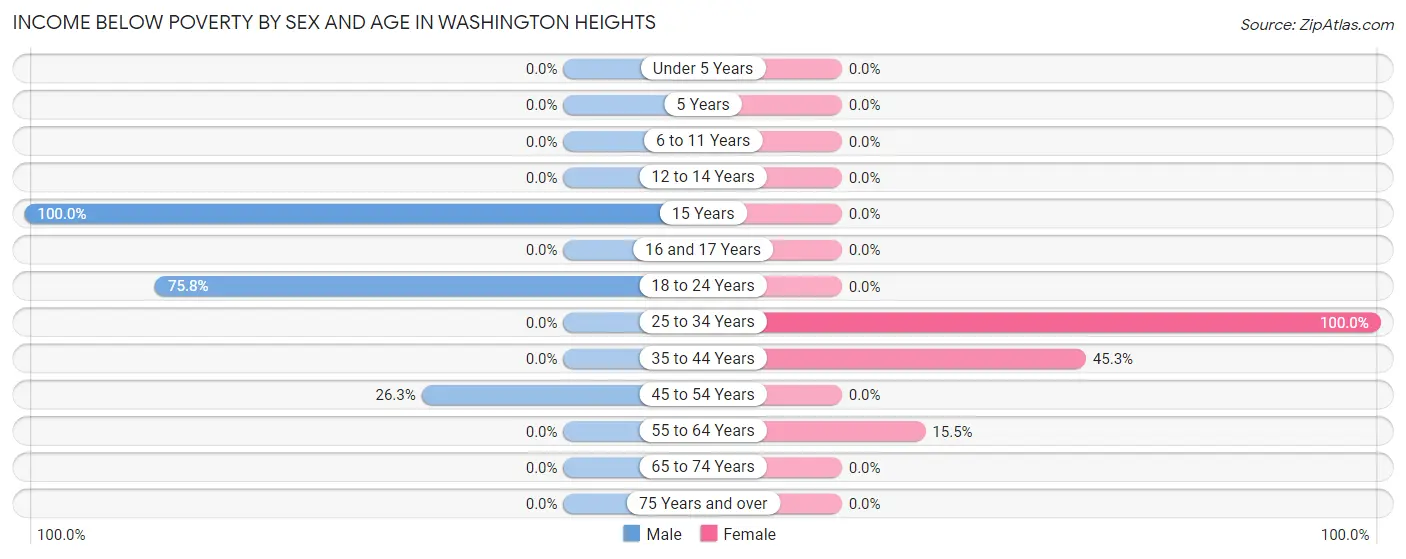
| Age Bracket | Male | Female |
| Under 5 Years | 0 (0.0%) | 0 (0.0%) |
| 5 Years | 0 (0.0%) | 0 (0.0%) |
| 6 to 11 Years | 0 (0.0%) | 0 (0.0%) |
| 12 to 14 Years | 0 (0.0%) | 0 (0.0%) |
| 15 Years | 75 (100.0%) | 0 (0.0%) |
| 16 and 17 Years | 0 (0.0%) | 0 (0.0%) |
| 18 to 24 Years | 100 (75.8%) | 0 (0.0%) |
| 25 to 34 Years | 0 (0.0%) | 26 (100.0%) |
| 35 to 44 Years | 0 (0.0%) | 58 (45.3%) |
| 45 to 54 Years | 35 (26.3%) | 0 (0.0%) |
| 55 to 64 Years | 0 (0.0%) | 18 (15.5%) |
| 65 to 74 Years | 0 (0.0%) | 0 (0.0%) |
| 75 Years and over | 0 (0.0%) | 0 (0.0%) |
| Total | 210 (25.1%) | 102 (15.1%) |
Income Above Poverty by Sex and Age in Washington Heights
According to the poverty statistics in Washington Heights, males aged under 5 years and females aged 6 to 11 years are the age groups that are most secure financially, with 100.0% of males and 100.0% of females in these age groups living above the poverty line.
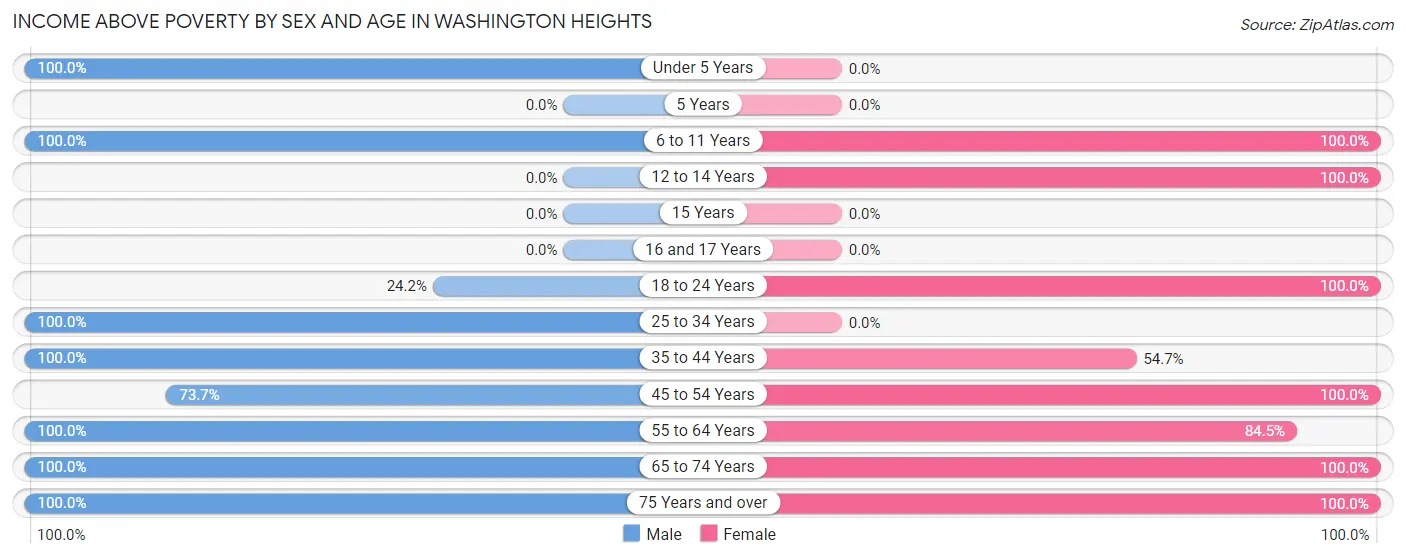
| Age Bracket | Male | Female |
| Under 5 Years | 74 (100.0%) | 0 (0.0%) |
| 5 Years | 0 (0.0%) | 0 (0.0%) |
| 6 to 11 Years | 41 (100.0%) | 126 (100.0%) |
| 12 to 14 Years | 0 (0.0%) | 56 (100.0%) |
| 15 Years | 0 (0.0%) | 0 (0.0%) |
| 16 and 17 Years | 0 (0.0%) | 0 (0.0%) |
| 18 to 24 Years | 32 (24.2%) | 56 (100.0%) |
| 25 to 34 Years | 100 (100.0%) | 0 (0.0%) |
| 35 to 44 Years | 102 (100.0%) | 70 (54.7%) |
| 45 to 54 Years | 98 (73.7%) | 100 (100.0%) |
| 55 to 64 Years | 62 (100.0%) | 98 (84.5%) |
| 65 to 74 Years | 106 (100.0%) | 52 (100.0%) |
| 75 Years and over | 13 (100.0%) | 16 (100.0%) |
| Total | 628 (74.9%) | 574 (84.9%) |
Income Below Poverty Among Married-Couple Families in Washington Heights
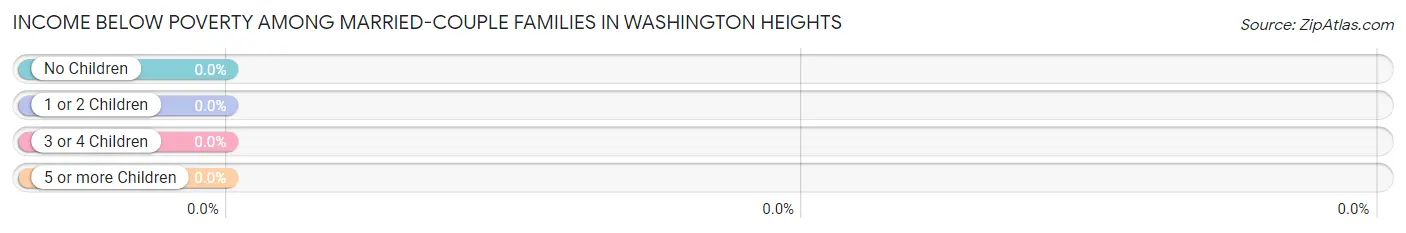
| Children | Above Poverty | Below Poverty |
| No Children | 177 (100.0%) | 0 (0.0%) |
| 1 or 2 Children | 43 (100.0%) | 0 (0.0%) |
| 3 or 4 Children | 0 (0.0%) | 0 (0.0%) |
| 5 or more Children | 0 (0.0%) | 0 (0.0%) |
| Total | 220 (100.0%) | 0 (0.0%) |
Income Below Poverty Among Single-Parent Households in Washington Heights
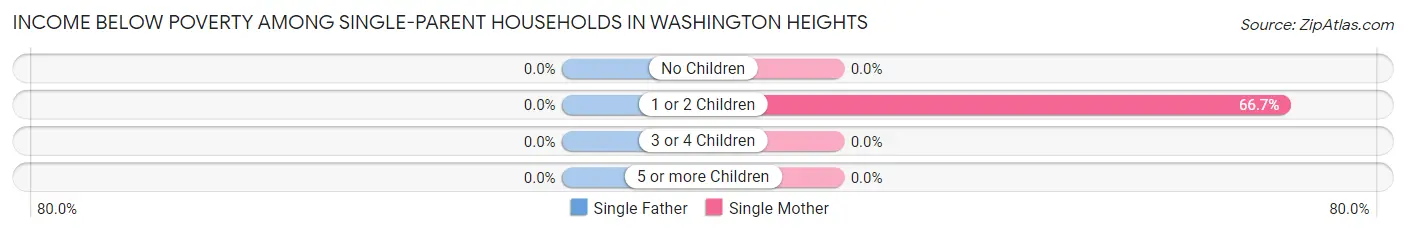
| Children | Single Father | Single Mother |
| No Children | 0 (0.0%) | 0 (0.0%) |
| 1 or 2 Children | 0 (0.0%) | 58 (66.7%) |
| 3 or 4 Children | 0 (0.0%) | 0 (0.0%) |
| 5 or more Children | 0 (0.0%) | 0 (0.0%) |
| Total | 0 (0.0%) | 58 (47.9%) |
Income Below Poverty Among Married-Couple vs Single-Parent Households in Washington Heights
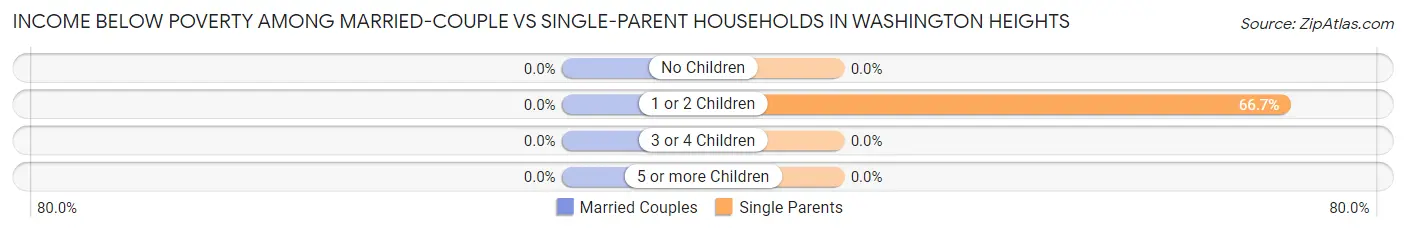
| Children | Married-Couple Families | Single-Parent Households |
| No Children | 0 (0.0%) | 0 (0.0%) |
| 1 or 2 Children | 0 (0.0%) | 58 (66.7%) |
| 3 or 4 Children | 0 (0.0%) | 0 (0.0%) |
| 5 or more Children | 0 (0.0%) | 0 (0.0%) |
| Total | 0 (0.0%) | 58 (33.0%) |
Employment Characteristics in Washington Heights
Employment by Class of Employer in Washington Heights
Among the 693 employed individuals in Washington Heights, private company employees (364 | 52.5%), local government employees (156 | 22.5%), and not-for-profit organizations (90 | 13.0%) make up the most common classes of employment.
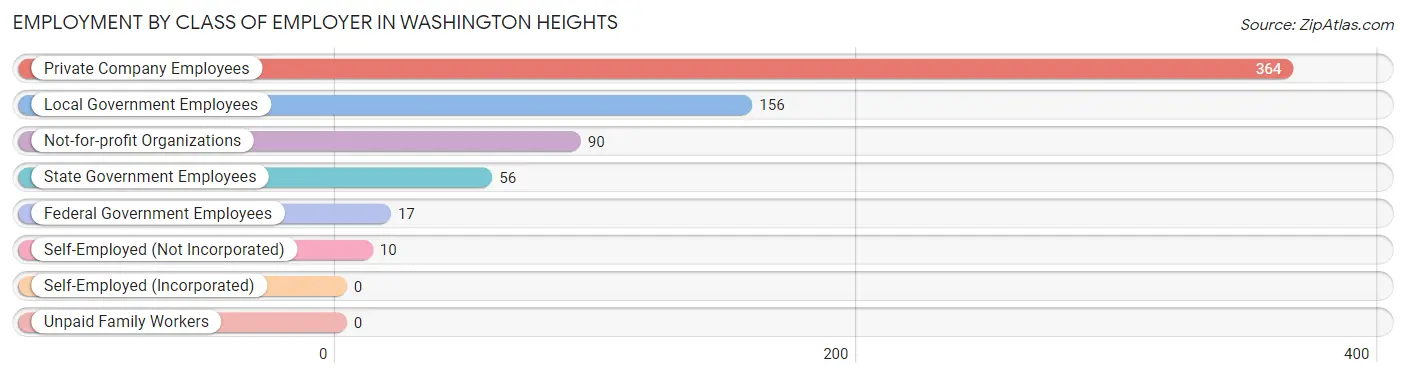
| Employer Class | # Employees | % Employees |
| Private Company Employees | 364 | 52.5% |
| Self-Employed (Incorporated) | 0 | 0.0% |
| Self-Employed (Not Incorporated) | 10 | 1.4% |
| Not-for-profit Organizations | 90 | 13.0% |
| Local Government Employees | 156 | 22.5% |
| State Government Employees | 56 | 8.1% |
| Federal Government Employees | 17 | 2.5% |
| Unpaid Family Workers | 0 | 0.0% |
| Total | 693 | 100.0% |
Employment Status by Age in Washington Heights
According to the labor force statistics for Washington Heights, out of the total population over 16 years of age (1,142), 66.6% or 761 individuals are in the labor force, with 8.9% or 68 of them unemployed. The age group with the highest labor force participation rate is 30 to 34 years, with 100.0% or 41 individuals in the labor force. Within the labor force, the 35 to 44 years age range has the highest percentage of unemployed individuals, with 25.2% or 58 of them being unemployed.
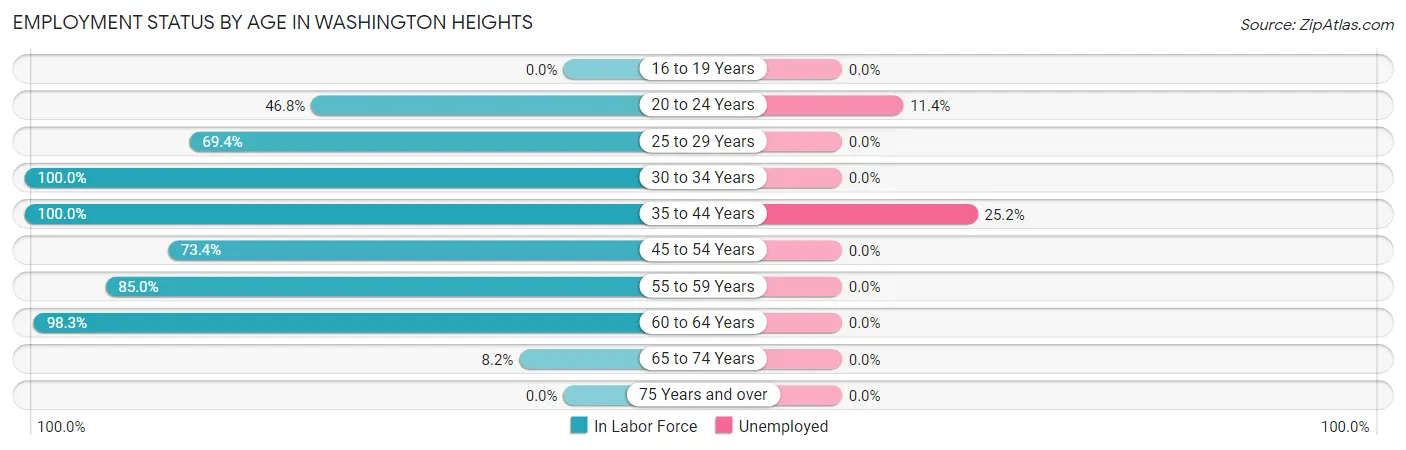
| Age Bracket | In Labor Force | Unemployed |
| 16 to 19 Years | 0 (0.0%) | 0 (0.0%) |
| 20 to 24 Years | 88 (46.8%) | 10 (11.4%) |
| 25 to 29 Years | 59 (69.4%) | 0 (0.0%) |
| 30 to 34 Years | 41 (100.0%) | 0 (0.0%) |
| 35 to 44 Years | 230 (100.0%) | 58 (25.2%) |
| 45 to 54 Years | 171 (73.4%) | 0 (0.0%) |
| 55 to 59 Years | 102 (85.0%) | 0 (0.0%) |
| 60 to 64 Years | 57 (98.3%) | 0 (0.0%) |
| 65 to 74 Years | 13 (8.2%) | 0 (0.0%) |
| 75 Years and over | 0 (0.0%) | 0 (0.0%) |
| Total | 761 (66.6%) | 68 (8.9%) |
Employment Status by Educational Attainment in Washington Heights
According to labor force statistics for Washington Heights, 86.0% of individuals (660) out of the total population between 25 and 64 years of age (767) are in the labor force, with 8.8% or 58 of them being unemployed. The group with the highest labor force participation rate are those with the educational attainment of bachelor's degree or higher, with 100.0% or 103 individuals in the labor force. Within the labor force, individuals with high school diploma education have the highest percentage of unemployment, with 25.9% or 58 of them being unemployed.
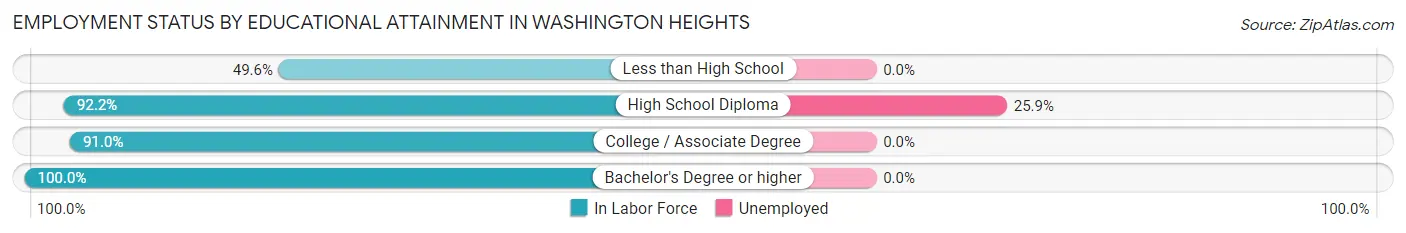
| Educational Attainment | In Labor Force | Unemployed |
| Less than High School | 60 (49.6%) | 0 (0.0%) |
| High School Diploma | 224 (92.2%) | 63 (25.9%) |
| College / Associate Degree | 273 (91.0%) | 0 (0.0%) |
| Bachelor's Degree or higher | 103 (100.0%) | 0 (0.0%) |
| Total | 660 (86.0%) | 67 (8.8%) |
Employment Occupations by Sex in Washington Heights
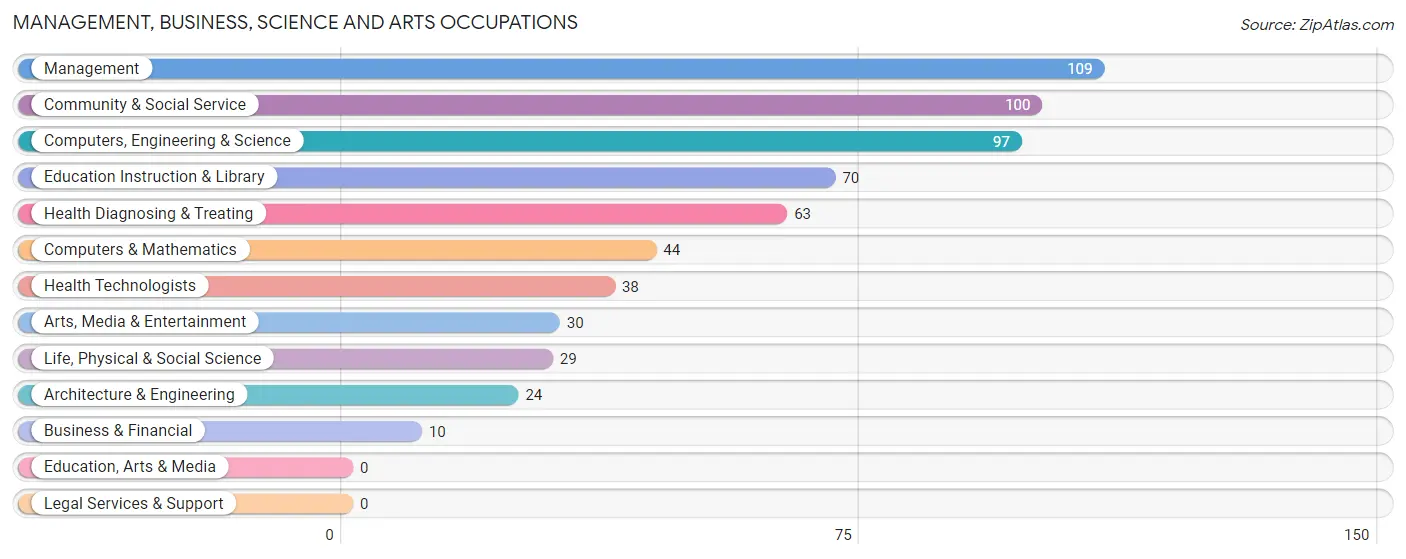
Management, Business, Science and Arts Occupations
The most common Management, Business, Science and Arts occupations in Washington Heights are Management (109 | 15.7%), Community & Social Service (100 | 14.4%), Computers, Engineering & Science (97 | 14.0%), Education Instruction & Library (70 | 10.1%), and Health Diagnosing & Treating (63 | 9.1%).
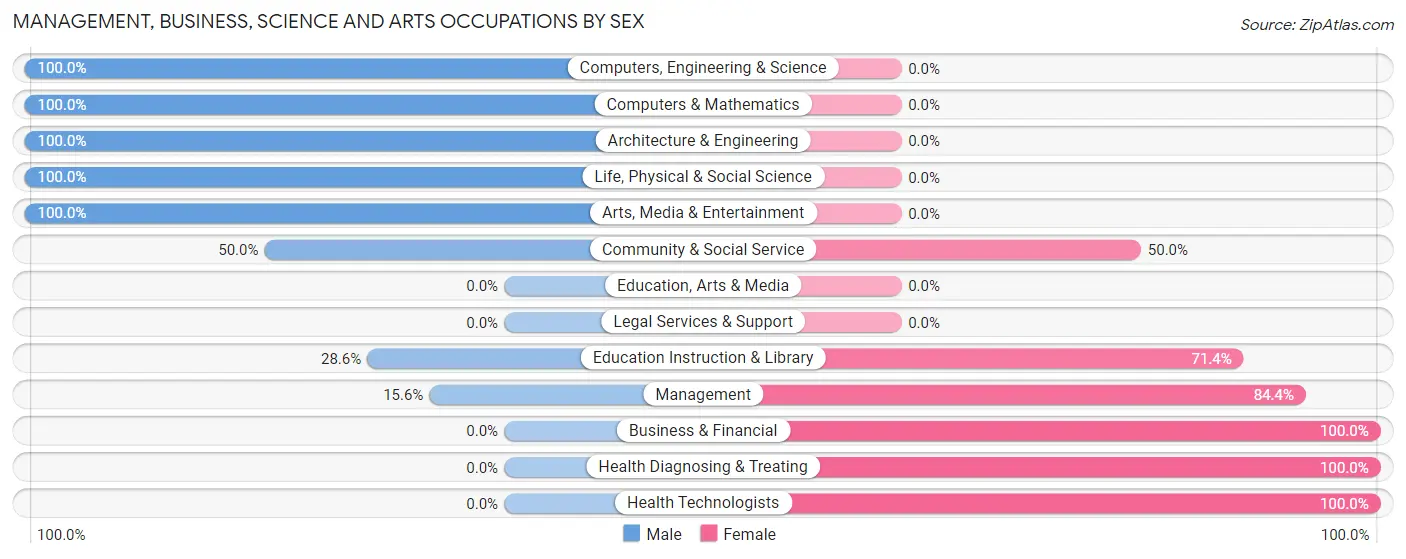
Management, Business, Science and Arts Occupations by Sex
Within the Management, Business, Science and Arts occupations in Washington Heights, the most male-oriented occupations are Computers, Engineering & Science (100.0%), Computers & Mathematics (100.0%), and Architecture & Engineering (100.0%), while the most female-oriented occupations are Business & Financial (100.0%), Health Diagnosing & Treating (100.0%), and Health Technologists (100.0%).
| Occupation | Male | Female |
| Management | 17 (15.6%) | 92 (84.4%) |
| Business & Financial | 0 (0.0%) | 10 (100.0%) |
| Computers, Engineering & Science | 97 (100.0%) | 0 (0.0%) |
| Computers & Mathematics | 44 (100.0%) | 0 (0.0%) |
| Architecture & Engineering | 24 (100.0%) | 0 (0.0%) |
| Life, Physical & Social Science | 29 (100.0%) | 0 (0.0%) |
| Community & Social Service | 50 (50.0%) | 50 (50.0%) |
| Education, Arts & Media | 0 (0.0%) | 0 (0.0%) |
| Legal Services & Support | 0 (0.0%) | 0 (0.0%) |
| Education Instruction & Library | 20 (28.6%) | 50 (71.4%) |
| Arts, Media & Entertainment | 30 (100.0%) | 0 (0.0%) |
| Health Diagnosing & Treating | 0 (0.0%) | 63 (100.0%) |
| Health Technologists | 0 (0.0%) | 38 (100.0%) |
| Total (Category) | 164 (43.3%) | 215 (56.7%) |
| Total (Overall) | 356 (51.4%) | 337 (48.6%) |
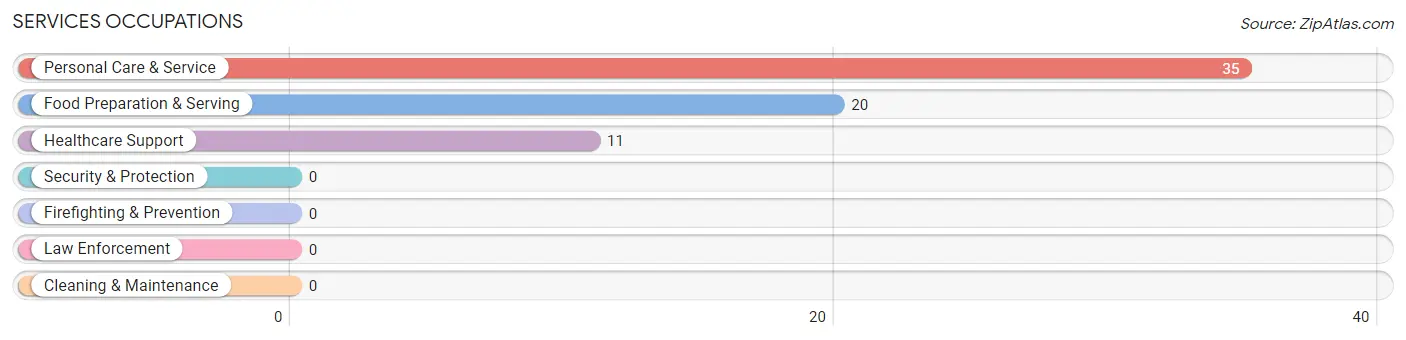
Services Occupations
The most common Services occupations in Washington Heights are Personal Care & Service (35 | 5.1%), Food Preparation & Serving (20 | 2.9%), and Healthcare Support (11 | 1.6%).
Services Occupations by Sex
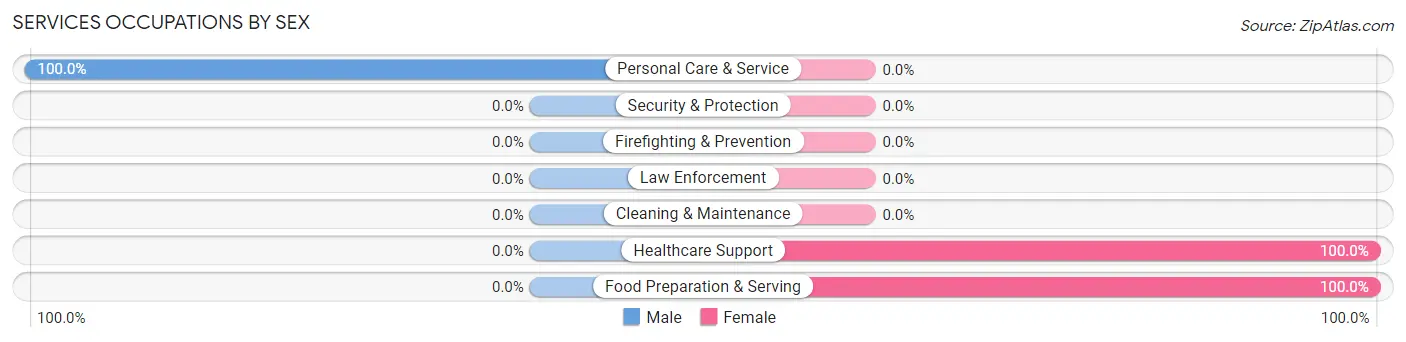
| Occupation | Male | Female |
| Healthcare Support | 0 (0.0%) | 11 (100.0%) |
| Security & Protection | 0 (0.0%) | 0 (0.0%) |
| Firefighting & Prevention | 0 (0.0%) | 0 (0.0%) |
| Law Enforcement | 0 (0.0%) | 0 (0.0%) |
| Food Preparation & Serving | 0 (0.0%) | 20 (100.0%) |
| Cleaning & Maintenance | 0 (0.0%) | 0 (0.0%) |
| Personal Care & Service | 35 (100.0%) | 0 (0.0%) |
| Total (Category) | 35 (53.0%) | 31 (47.0%) |
| Total (Overall) | 356 (51.4%) | 337 (48.6%) |
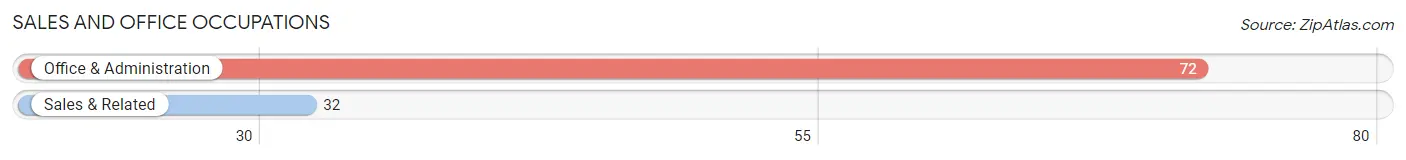
Sales and Office Occupations
The most common Sales and Office occupations in Washington Heights are Office & Administration (72 | 10.4%), and Sales & Related (32 | 4.6%).
Sales and Office Occupations by Sex
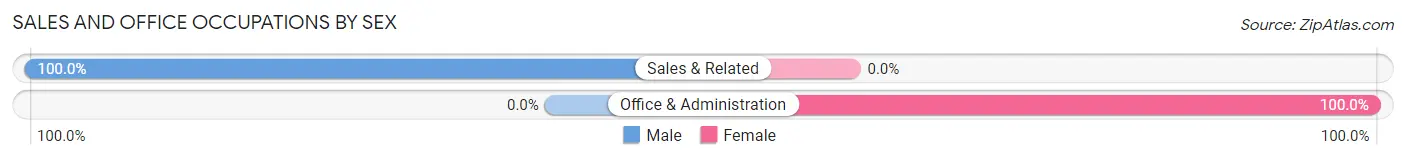
| Occupation | Male | Female |
| Sales & Related | 32 (100.0%) | 0 (0.0%) |
| Office & Administration | 0 (0.0%) | 72 (100.0%) |
| Total (Category) | 32 (30.8%) | 72 (69.2%) |
| Total (Overall) | 356 (51.4%) | 337 (48.6%) |
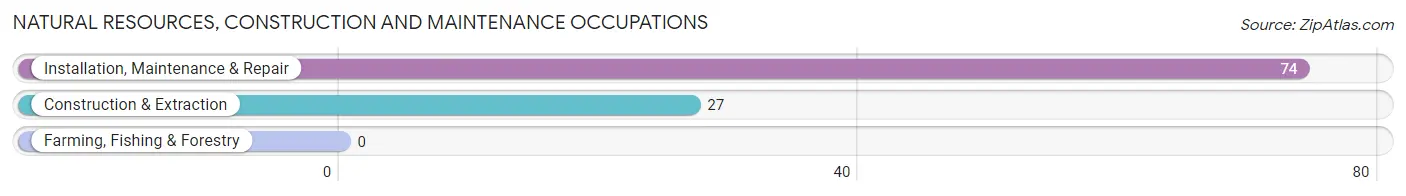
Natural Resources, Construction and Maintenance Occupations
The most common Natural Resources, Construction and Maintenance occupations in Washington Heights are Installation, Maintenance & Repair (74 | 10.7%), and Construction & Extraction (27 | 3.9%).
Natural Resources, Construction and Maintenance Occupations by Sex
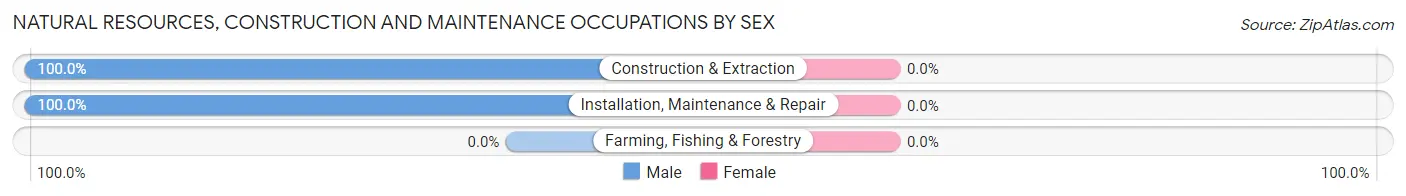
| Occupation | Male | Female |
| Farming, Fishing & Forestry | 0 (0.0%) | 0 (0.0%) |
| Construction & Extraction | 27 (100.0%) | 0 (0.0%) |
| Installation, Maintenance & Repair | 74 (100.0%) | 0 (0.0%) |
| Total (Category) | 101 (100.0%) | 0 (0.0%) |
| Total (Overall) | 356 (51.4%) | 337 (48.6%) |
Production, Transportation and Moving Occupations
The most common Production, Transportation and Moving occupations in Washington Heights are Transportation (24 | 3.5%), and Material Moving (19 | 2.7%).
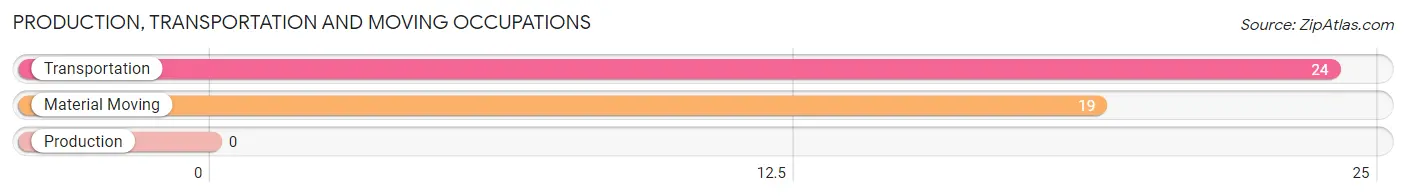
Production, Transportation and Moving Occupations by Sex

| Occupation | Male | Female |
| Production | 0 (0.0%) | 0 (0.0%) |
| Transportation | 24 (100.0%) | 0 (0.0%) |
| Material Moving | 0 (0.0%) | 19 (100.0%) |
| Total (Category) | 24 (55.8%) | 19 (44.2%) |
| Total (Overall) | 356 (51.4%) | 337 (48.6%) |
Employment Industries by Sex in Washington Heights
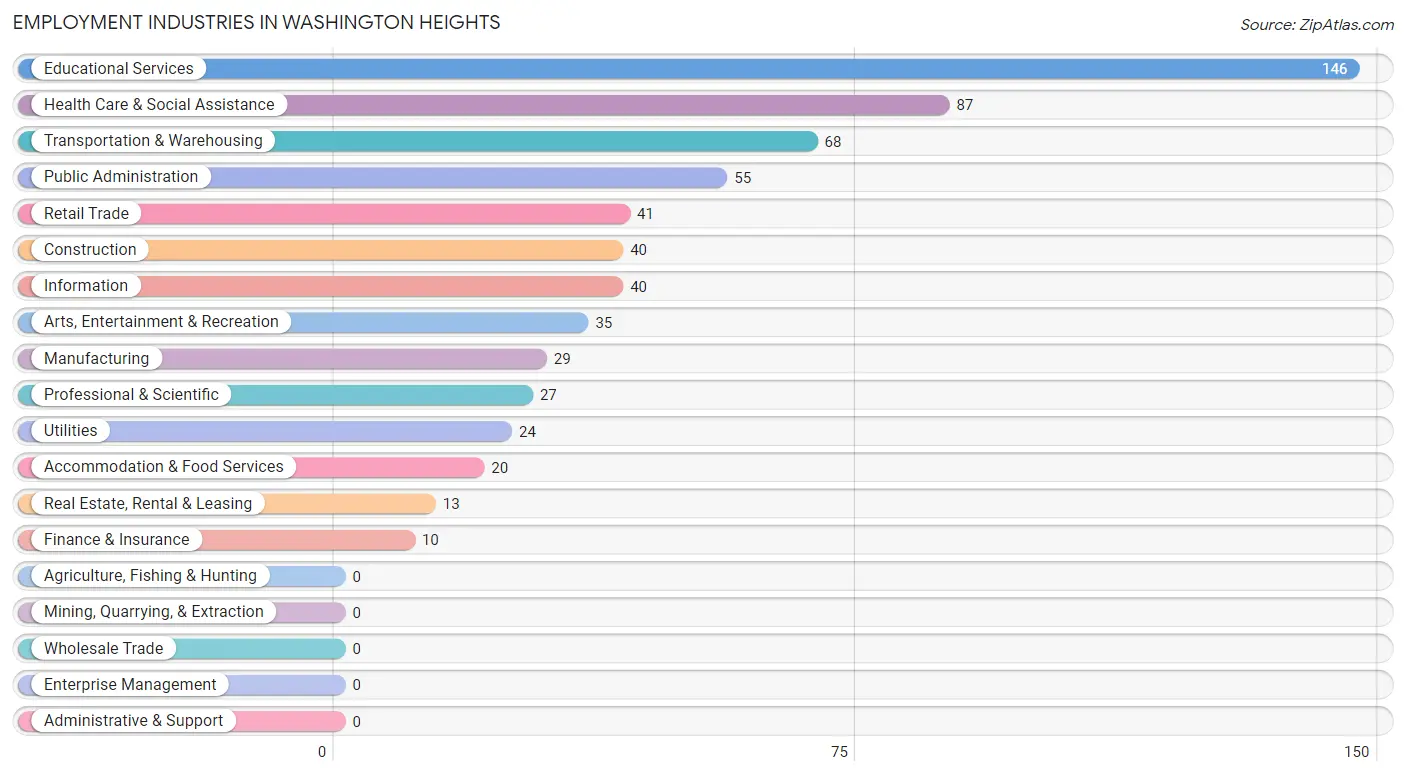
Employment Industries in Washington Heights
The major employment industries in Washington Heights include Educational Services (146 | 21.1%), Health Care & Social Assistance (87 | 12.6%), Transportation & Warehousing (68 | 9.8%), Public Administration (55 | 7.9%), and Retail Trade (41 | 5.9%).
Employment Industries by Sex in Washington Heights
The Washington Heights industries that see more men than women are Manufacturing (100.0%), Transportation & Warehousing (100.0%), and Utilities (100.0%), whereas the industries that tend to have a higher number of women are Finance & Insurance (100.0%), Real Estate, Rental & Leasing (100.0%), and Professional & Scientific (100.0%).
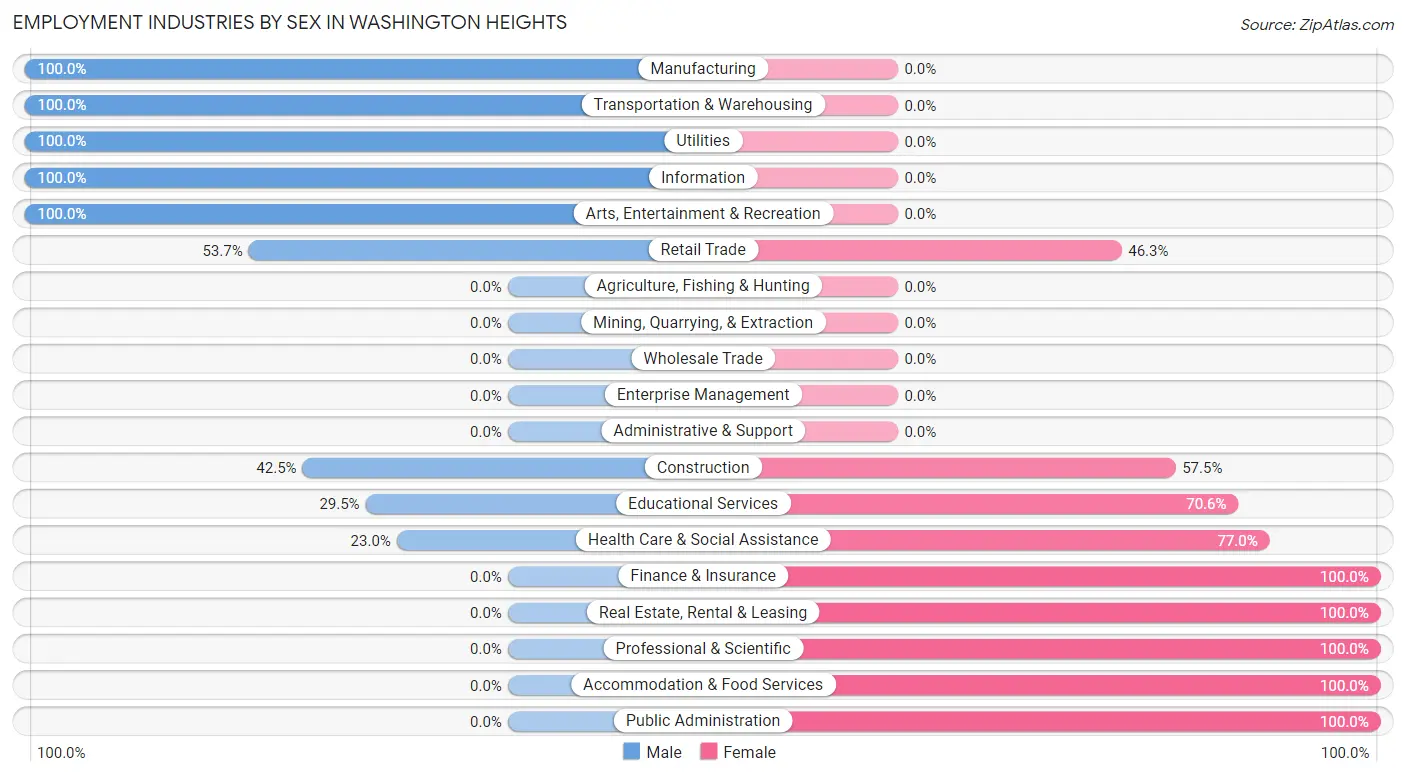
| Industry | Male | Female |
| Agriculture, Fishing & Hunting | 0 (0.0%) | 0 (0.0%) |
| Mining, Quarrying, & Extraction | 0 (0.0%) | 0 (0.0%) |
| Construction | 17 (42.5%) | 23 (57.5%) |
| Manufacturing | 29 (100.0%) | 0 (0.0%) |
| Wholesale Trade | 0 (0.0%) | 0 (0.0%) |
| Retail Trade | 22 (53.7%) | 19 (46.3%) |
| Transportation & Warehousing | 68 (100.0%) | 0 (0.0%) |
| Utilities | 24 (100.0%) | 0 (0.0%) |
| Information | 40 (100.0%) | 0 (0.0%) |
| Finance & Insurance | 0 (0.0%) | 10 (100.0%) |
| Real Estate, Rental & Leasing | 0 (0.0%) | 13 (100.0%) |
| Professional & Scientific | 0 (0.0%) | 27 (100.0%) |
| Enterprise Management | 0 (0.0%) | 0 (0.0%) |
| Administrative & Support | 0 (0.0%) | 0 (0.0%) |
| Educational Services | 43 (29.4%) | 103 (70.6%) |
| Health Care & Social Assistance | 20 (23.0%) | 67 (77.0%) |
| Arts, Entertainment & Recreation | 35 (100.0%) | 0 (0.0%) |
| Accommodation & Food Services | 0 (0.0%) | 20 (100.0%) |
| Public Administration | 0 (0.0%) | 55 (100.0%) |
| Total | 356 (51.4%) | 337 (48.6%) |
Education in Washington Heights
School Enrollment in Washington Heights
The most common levels of schooling among the 430 students in Washington Heights are middle school (145 | 33.7%), high school (96 | 22.3%), and college / undergraduate (66 | 15.3%).
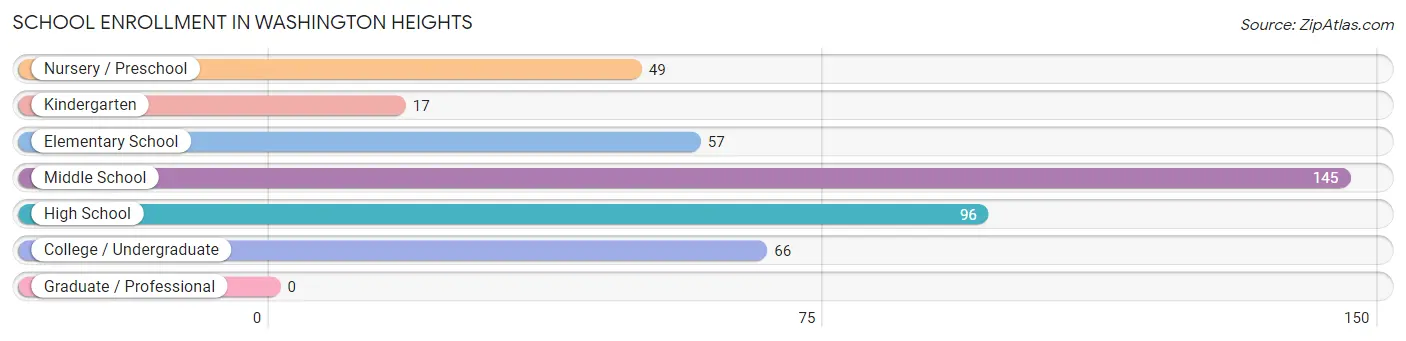
| School Level | # Students | % Students |
| Nursery / Preschool | 49 | 11.4% |
| Kindergarten | 17 | 4.0% |
| Elementary School | 57 | 13.3% |
| Middle School | 145 | 33.7% |
| High School | 96 | 22.3% |
| College / Undergraduate | 66 | 15.3% |
| Graduate / Professional | 0 | 0.0% |
| Total | 430 | 100.0% |
School Enrollment by Age by Funding Source in Washington Heights
Out of a total of 430 students who are enrolled in schools in Washington Heights, 60 (14.0%) attend a private institution, while the remaining 370 (86.0%) are enrolled in public schools. The age group of 35 years and over has the highest likelihood of being enrolled in private schools, with 44 (100.0% in the age bracket) enrolled. Conversely, the age group of 3 to 4 year olds has the lowest likelihood of being enrolled in a private school, with 49 (100.0% in the age bracket) attending a public institution.
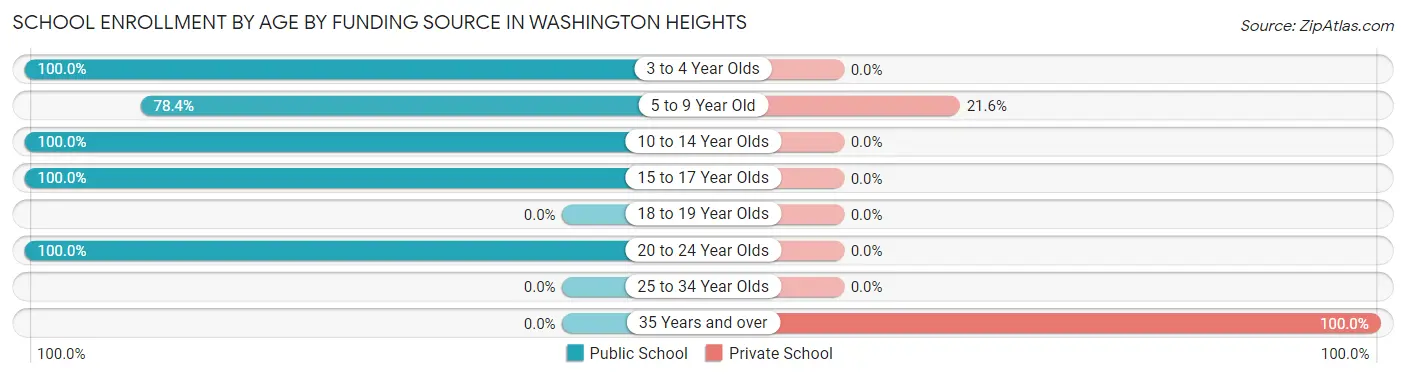
| Age Bracket | Public School | Private School |
| 3 to 4 Year Olds | 49 (100.0%) | 0 (0.0%) |
| 5 to 9 Year Old | 58 (78.4%) | 16 (21.6%) |
| 10 to 14 Year Olds | 166 (100.0%) | 0 (0.0%) |
| 15 to 17 Year Olds | 75 (100.0%) | 0 (0.0%) |
| 18 to 19 Year Olds | 0 (0.0%) | 0 (0.0%) |
| 20 to 24 Year Olds | 22 (100.0%) | 0 (0.0%) |
| 25 to 34 Year Olds | 0 (0.0%) | 0 (0.0%) |
| 35 Years and over | 0 (0.0%) | 44 (100.0%) |
| Total | 370 (86.0%) | 60 (14.0%) |
Educational Attainment by Field of Study in Washington Heights
Business (54 | 35.8%), education (21 | 13.9%), literature & languages (18 | 11.9%), engineering (17 | 11.3%), and science & technology (14 | 9.3%) are the most common fields of study among 151 individuals in Washington Heights who have obtained a bachelor's degree or higher.
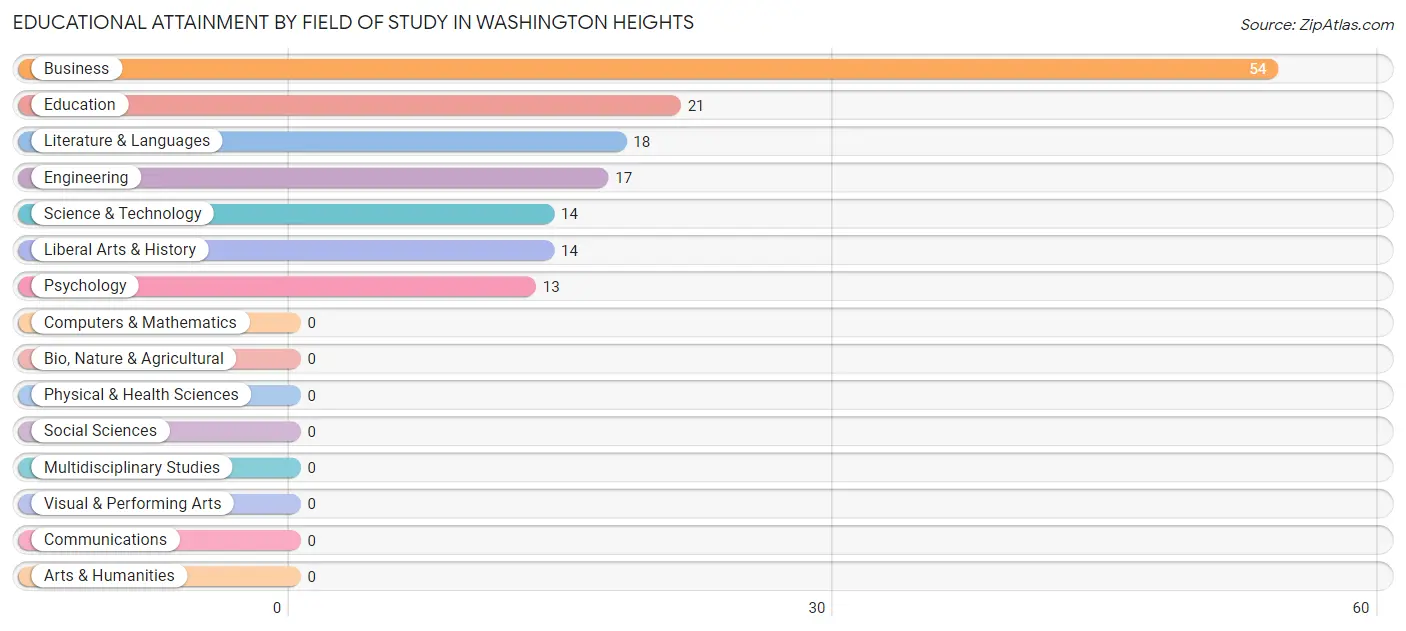
| Field of Study | # Graduates | % Graduates |
| Computers & Mathematics | 0 | 0.0% |
| Bio, Nature & Agricultural | 0 | 0.0% |
| Physical & Health Sciences | 0 | 0.0% |
| Psychology | 13 | 8.6% |
| Social Sciences | 0 | 0.0% |
| Engineering | 17 | 11.3% |
| Multidisciplinary Studies | 0 | 0.0% |
| Science & Technology | 14 | 9.3% |
| Business | 54 | 35.8% |
| Education | 21 | 13.9% |
| Literature & Languages | 18 | 11.9% |
| Liberal Arts & History | 14 | 9.3% |
| Visual & Performing Arts | 0 | 0.0% |
| Communications | 0 | 0.0% |
| Arts & Humanities | 0 | 0.0% |
| Total | 151 | 100.0% |
Transportation & Commute in Washington Heights
Vehicle Availability by Sex in Washington Heights
The most prevalent vehicle ownership categories in Washington Heights are males with 2 vehicles (199, accounting for 55.9%) and females with 2 vehicles (125, making up 59.1%).
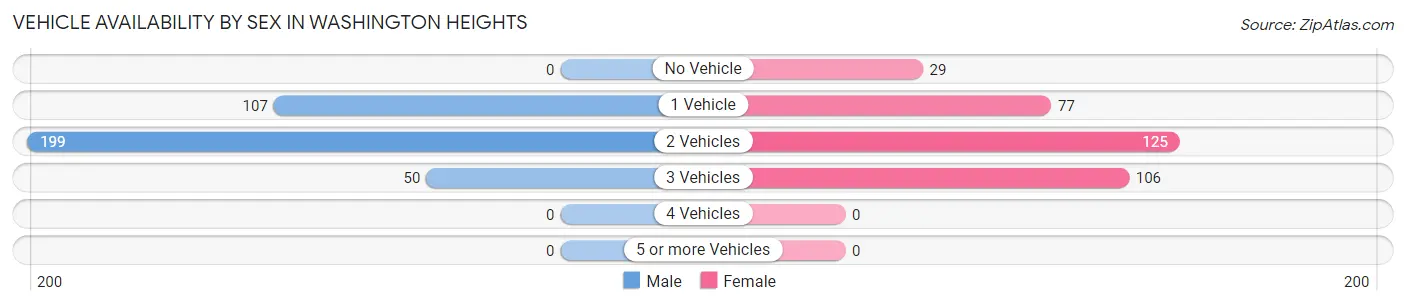
| Vehicles Available | Male | Female |
| No Vehicle | 0 (0.0%) | 29 (8.6%) |
| 1 Vehicle | 107 (30.1%) | 77 (22.9%) |
| 2 Vehicles | 199 (55.9%) | 125 (37.1%) |
| 3 Vehicles | 50 (14.0%) | 106 (31.5%) |
| 4 Vehicles | 0 (0.0%) | 0 (0.0%) |
| 5 or more Vehicles | 0 (0.0%) | 0 (0.0%) |
| Total | 356 (100.0%) | 337 (100.0%) |
Commute Time in Washington Heights
The most frequently occuring commute durations in Washington Heights are 90 or more minutes (204 commuters, 30.4%), 20 to 24 minutes (97 commuters, 14.5%), and 30 to 34 minutes (84 commuters, 12.5%).
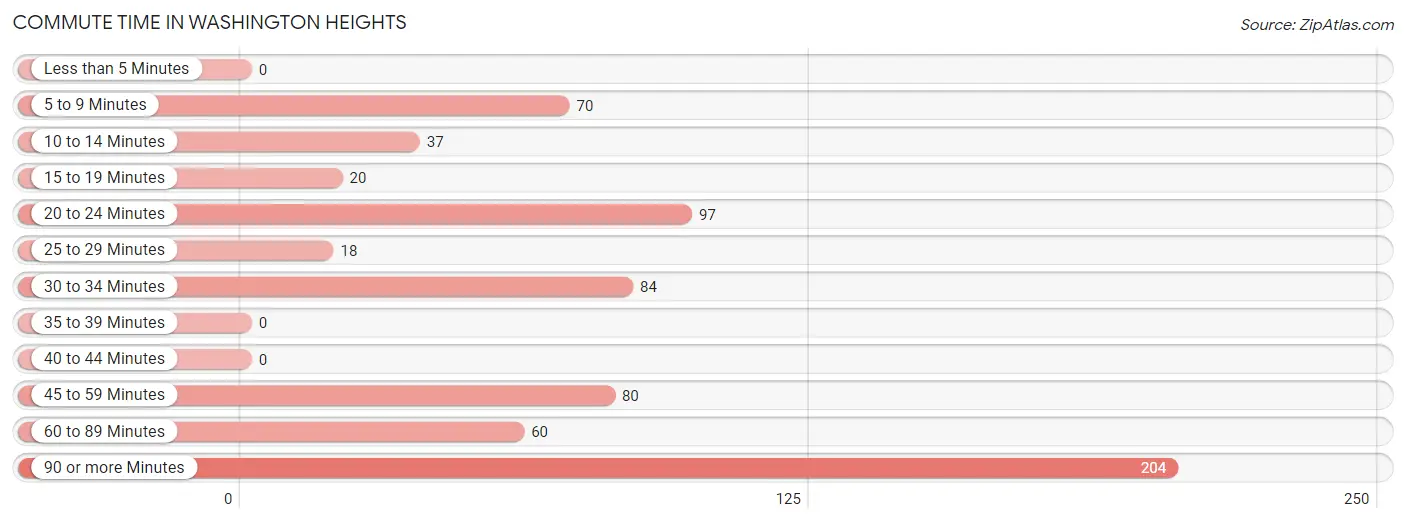
| Commute Time | # Commuters | % Commuters |
| Less than 5 Minutes | 0 | 0.0% |
| 5 to 9 Minutes | 70 | 10.4% |
| 10 to 14 Minutes | 37 | 5.5% |
| 15 to 19 Minutes | 20 | 3.0% |
| 20 to 24 Minutes | 97 | 14.5% |
| 25 to 29 Minutes | 18 | 2.7% |
| 30 to 34 Minutes | 84 | 12.5% |
| 35 to 39 Minutes | 0 | 0.0% |
| 40 to 44 Minutes | 0 | 0.0% |
| 45 to 59 Minutes | 80 | 11.9% |
| 60 to 89 Minutes | 60 | 9.0% |
| 90 or more Minutes | 204 | 30.4% |
Commute Time by Sex in Washington Heights
The most common commute times in Washington Heights are 90 or more minutes (95 commuters, 27.5%) for males and 90 or more minutes (109 commuters, 33.6%) for females.
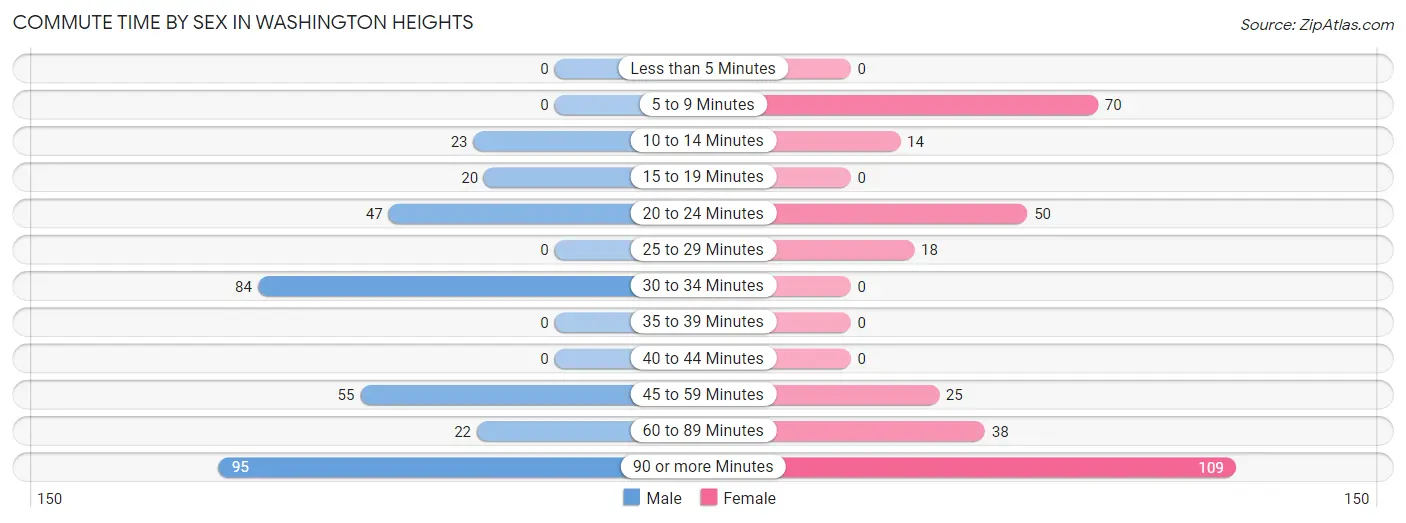
| Commute Time | Male | Female |
| Less than 5 Minutes | 0 (0.0%) | 0 (0.0%) |
| 5 to 9 Minutes | 0 (0.0%) | 70 (21.6%) |
| 10 to 14 Minutes | 23 (6.7%) | 14 (4.3%) |
| 15 to 19 Minutes | 20 (5.8%) | 0 (0.0%) |
| 20 to 24 Minutes | 47 (13.6%) | 50 (15.4%) |
| 25 to 29 Minutes | 0 (0.0%) | 18 (5.6%) |
| 30 to 34 Minutes | 84 (24.3%) | 0 (0.0%) |
| 35 to 39 Minutes | 0 (0.0%) | 0 (0.0%) |
| 40 to 44 Minutes | 0 (0.0%) | 0 (0.0%) |
| 45 to 59 Minutes | 55 (15.9%) | 25 (7.7%) |
| 60 to 89 Minutes | 22 (6.4%) | 38 (11.7%) |
| 90 or more Minutes | 95 (27.5%) | 109 (33.6%) |
Time of Departure to Work by Sex in Washington Heights
The most frequent times of departure to work in Washington Heights are 6:00 AM to 6:29 AM (88, 25.4%) for males and 7:00 AM to 7:29 AM (84, 25.9%) for females.
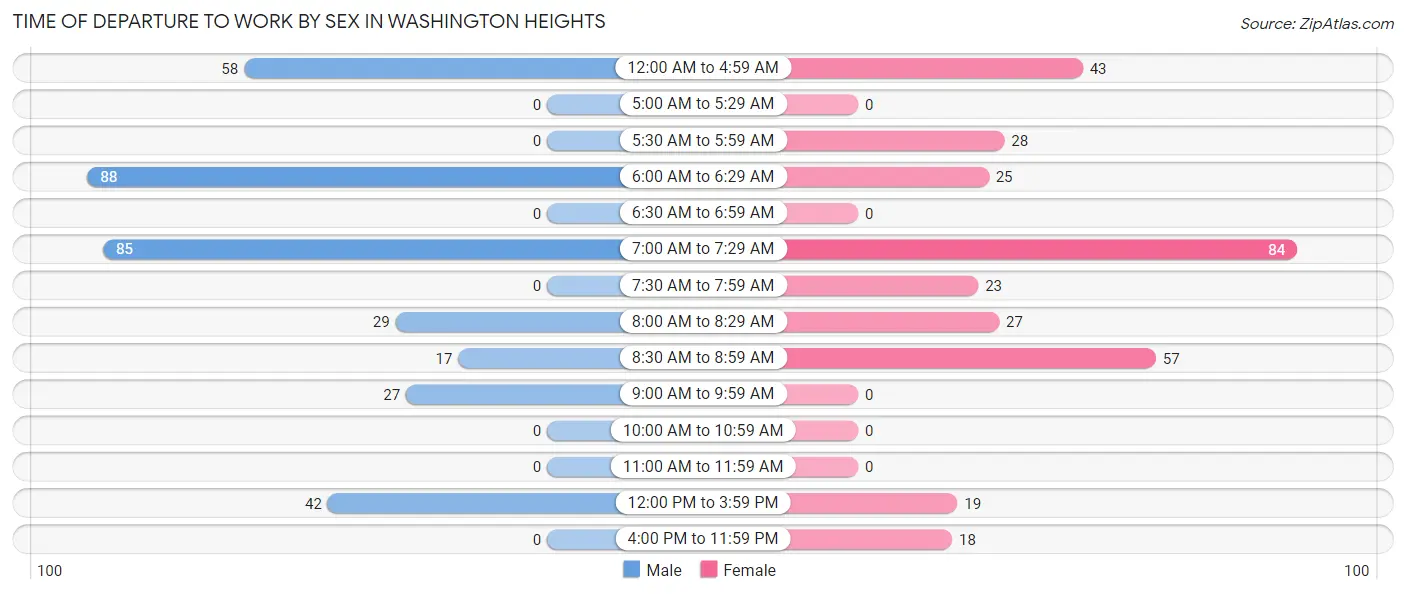
| Time of Departure | Male | Female |
| 12:00 AM to 4:59 AM | 58 (16.8%) | 43 (13.3%) |
| 5:00 AM to 5:29 AM | 0 (0.0%) | 0 (0.0%) |
| 5:30 AM to 5:59 AM | 0 (0.0%) | 28 (8.6%) |
| 6:00 AM to 6:29 AM | 88 (25.4%) | 25 (7.7%) |
| 6:30 AM to 6:59 AM | 0 (0.0%) | 0 (0.0%) |
| 7:00 AM to 7:29 AM | 85 (24.6%) | 84 (25.9%) |
| 7:30 AM to 7:59 AM | 0 (0.0%) | 23 (7.1%) |
| 8:00 AM to 8:29 AM | 29 (8.4%) | 27 (8.3%) |
| 8:30 AM to 8:59 AM | 17 (4.9%) | 57 (17.6%) |
| 9:00 AM to 9:59 AM | 27 (7.8%) | 0 (0.0%) |
| 10:00 AM to 10:59 AM | 0 (0.0%) | 0 (0.0%) |
| 11:00 AM to 11:59 AM | 0 (0.0%) | 0 (0.0%) |
| 12:00 PM to 3:59 PM | 42 (12.1%) | 19 (5.9%) |
| 4:00 PM to 11:59 PM | 0 (0.0%) | 18 (5.6%) |
| Total | 346 (100.0%) | 324 (100.0%) |
Housing Occupancy in Washington Heights
Occupancy by Ownership in Washington Heights
Of the total 599 dwellings in Washington Heights, owner-occupied units account for 522 (87.2%), while renter-occupied units make up 77 (12.9%).
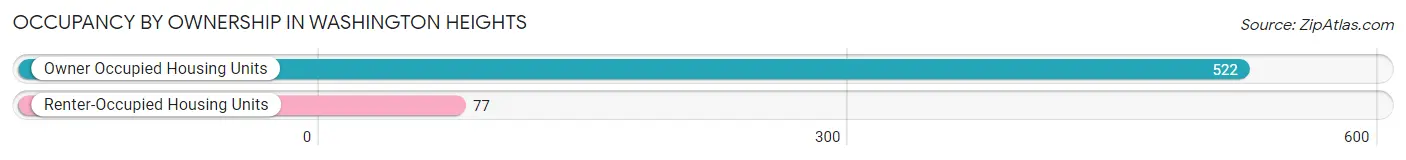
| Occupancy | # Housing Units | % Housing Units |
| Owner Occupied Housing Units | 522 | 87.2% |
| Renter-Occupied Housing Units | 77 | 12.9% |
| Total Occupied Housing Units | 599 | 100.0% |
Occupancy by Household Size in Washington Heights
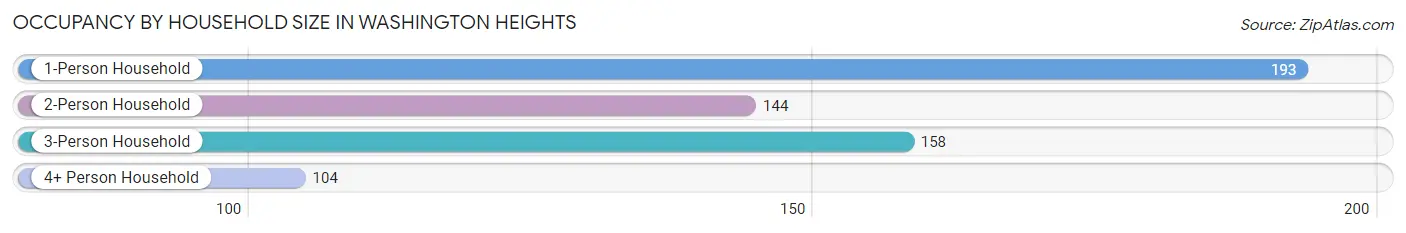
| Household Size | # Housing Units | % Housing Units |
| 1-Person Household | 193 | 32.2% |
| 2-Person Household | 144 | 24.0% |
| 3-Person Household | 158 | 26.4% |
| 4+ Person Household | 104 | 17.4% |
| Total Housing Units | 599 | 100.0% |
Occupancy by Ownership by Household Size in Washington Heights
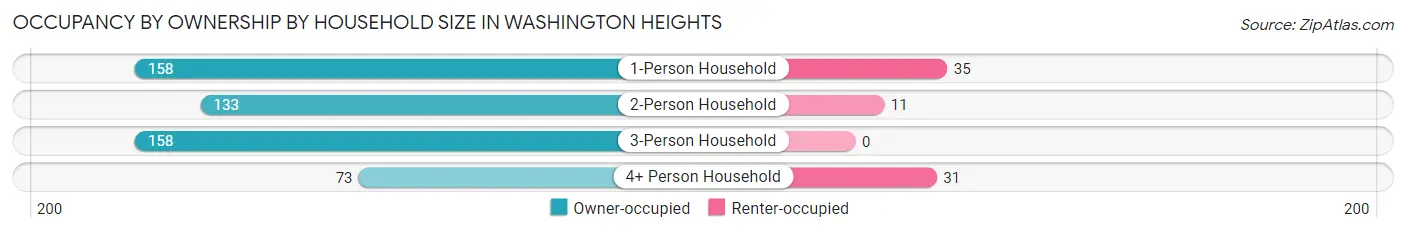
| Household Size | Owner-occupied | Renter-occupied |
| 1-Person Household | 158 (81.9%) | 35 (18.1%) |
| 2-Person Household | 133 (92.4%) | 11 (7.6%) |
| 3-Person Household | 158 (100.0%) | 0 (0.0%) |
| 4+ Person Household | 73 (70.2%) | 31 (29.8%) |
| Total Housing Units | 522 (87.2%) | 77 (12.9%) |
Occupancy by Educational Attainment in Washington Heights
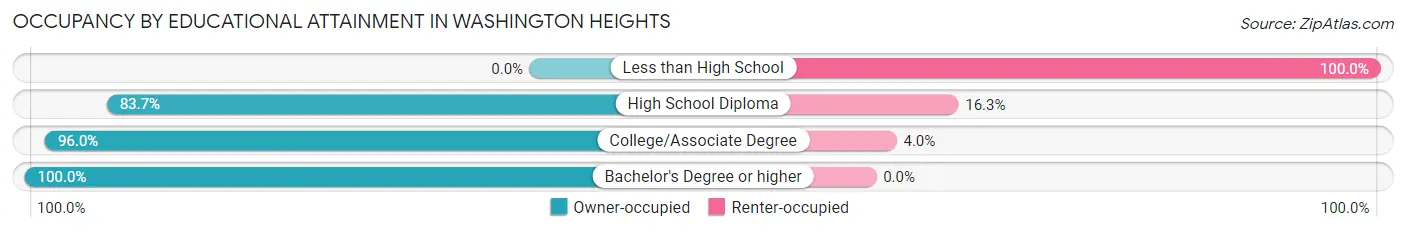
| Household Size | Owner-occupied | Renter-occupied |
| Less than High School | 0 (0.0%) | 31 (100.0%) |
| High School Diploma | 180 (83.7%) | 35 (16.3%) |
| College/Associate Degree | 261 (96.0%) | 11 (4.0%) |
| Bachelor's Degree or higher | 81 (100.0%) | 0 (0.0%) |
Occupancy by Age of Householder in Washington Heights
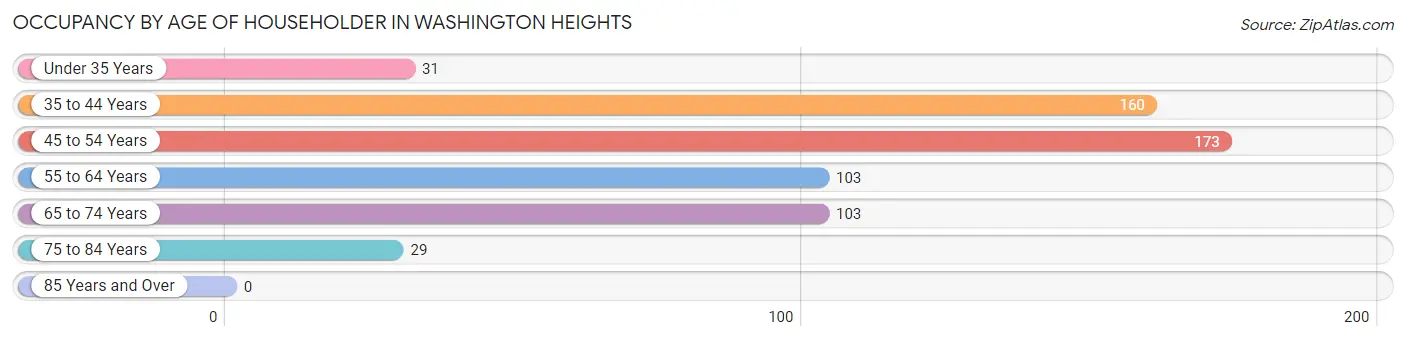
| Age Bracket | # Households | % Households |
| Under 35 Years | 31 | 5.2% |
| 35 to 44 Years | 160 | 26.7% |
| 45 to 54 Years | 173 | 28.9% |
| 55 to 64 Years | 103 | 17.2% |
| 65 to 74 Years | 103 | 17.2% |
| 75 to 84 Years | 29 | 4.8% |
| 85 Years and Over | 0 | 0.0% |
| Total | 599 | 100.0% |
Housing Finances in Washington Heights
Median Income by Occupancy in Washington Heights
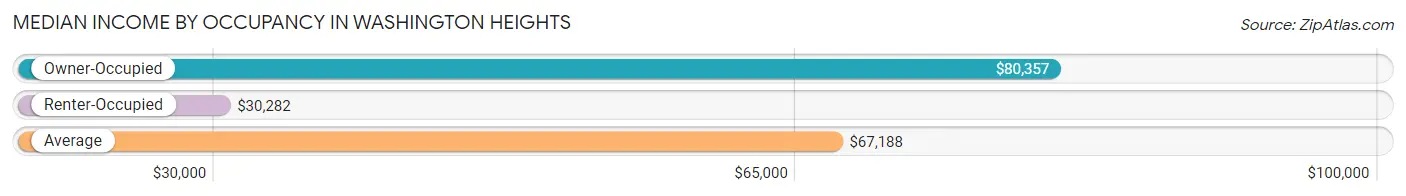
| Occupancy Type | # Households | Median Income |
| Owner-Occupied | 522 (87.2%) | $80,357 |
| Renter-Occupied | 77 (12.9%) | $30,282 |
| Average | 599 (100.0%) | $67,188 |
Occupancy by Householder Income Bracket in Washington Heights
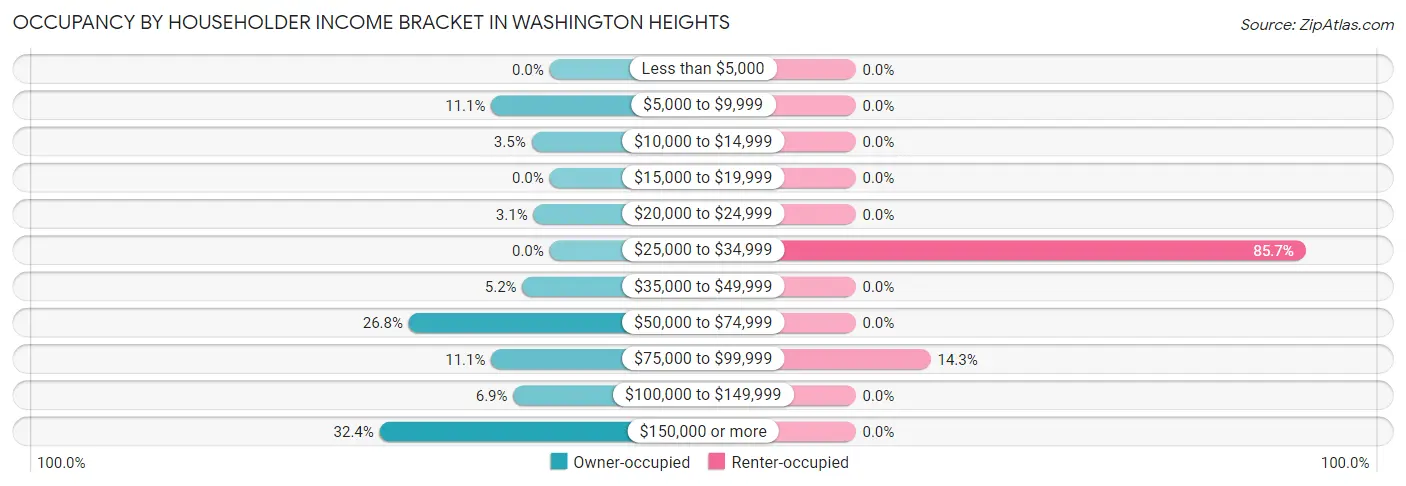
| Income Bracket | Owner-occupied | Renter-occupied |
| Less than $5,000 | 0 (0.0%) | 0 (0.0%) |
| $5,000 to $9,999 | 58 (11.1%) | 0 (0.0%) |
| $10,000 to $14,999 | 18 (3.5%) | 0 (0.0%) |
| $15,000 to $19,999 | 0 (0.0%) | 0 (0.0%) |
| $20,000 to $24,999 | 16 (3.1%) | 0 (0.0%) |
| $25,000 to $34,999 | 0 (0.0%) | 66 (85.7%) |
| $35,000 to $49,999 | 27 (5.2%) | 0 (0.0%) |
| $50,000 to $74,999 | 140 (26.8%) | 0 (0.0%) |
| $75,000 to $99,999 | 58 (11.1%) | 11 (14.3%) |
| $100,000 to $149,999 | 36 (6.9%) | 0 (0.0%) |
| $150,000 or more | 169 (32.4%) | 0 (0.0%) |
| Total | 522 (100.0%) | 77 (100.0%) |
Monthly Housing Cost Tiers in Washington Heights
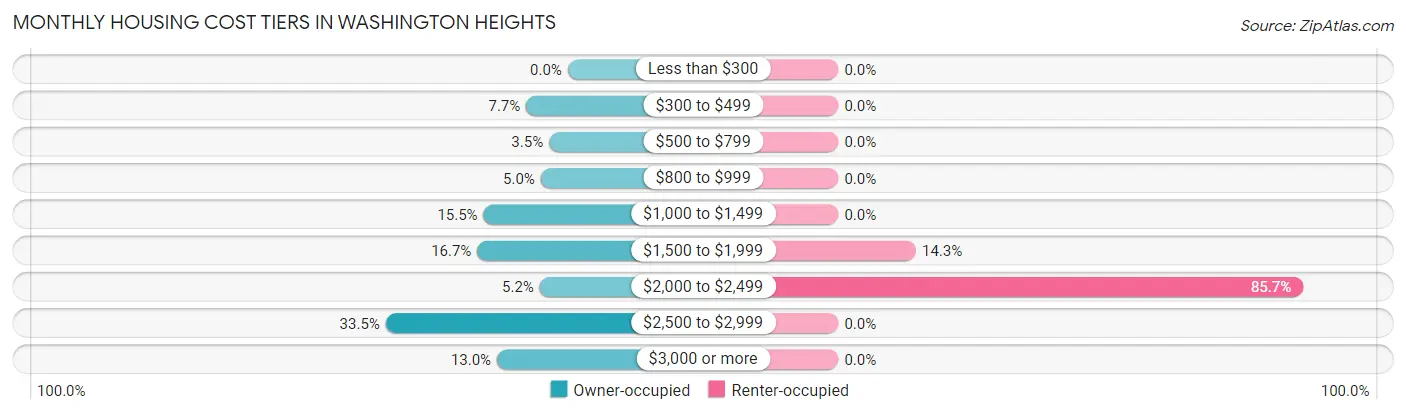
| Monthly Cost | Owner-occupied | Renter-occupied |
| Less than $300 | 0 (0.0%) | 0 (0.0%) |
| $300 to $499 | 40 (7.7%) | 0 (0.0%) |
| $500 to $799 | 18 (3.5%) | 0 (0.0%) |
| $800 to $999 | 26 (5.0%) | 0 (0.0%) |
| $1,000 to $1,499 | 81 (15.5%) | 0 (0.0%) |
| $1,500 to $1,999 | 87 (16.7%) | 11 (14.3%) |
| $2,000 to $2,499 | 27 (5.2%) | 66 (85.7%) |
| $2,500 to $2,999 | 175 (33.5%) | 0 (0.0%) |
| $3,000 or more | 68 (13.0%) | 0 (0.0%) |
| Total | 522 (100.0%) | 77 (100.0%) |
Physical Housing Characteristics in Washington Heights
Housing Structures in Washington Heights
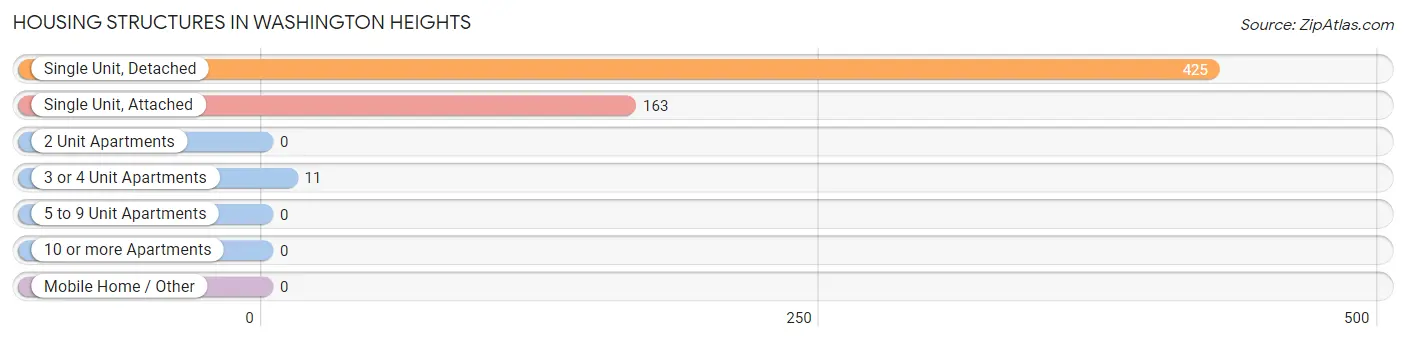
| Structure Type | # Housing Units | % Housing Units |
| Single Unit, Detached | 425 | 71.0% |
| Single Unit, Attached | 163 | 27.2% |
| 2 Unit Apartments | 0 | 0.0% |
| 3 or 4 Unit Apartments | 11 | 1.8% |
| 5 to 9 Unit Apartments | 0 | 0.0% |
| 10 or more Apartments | 0 | 0.0% |
| Mobile Home / Other | 0 | 0.0% |
| Total | 599 | 100.0% |
Housing Structures by Occupancy in Washington Heights
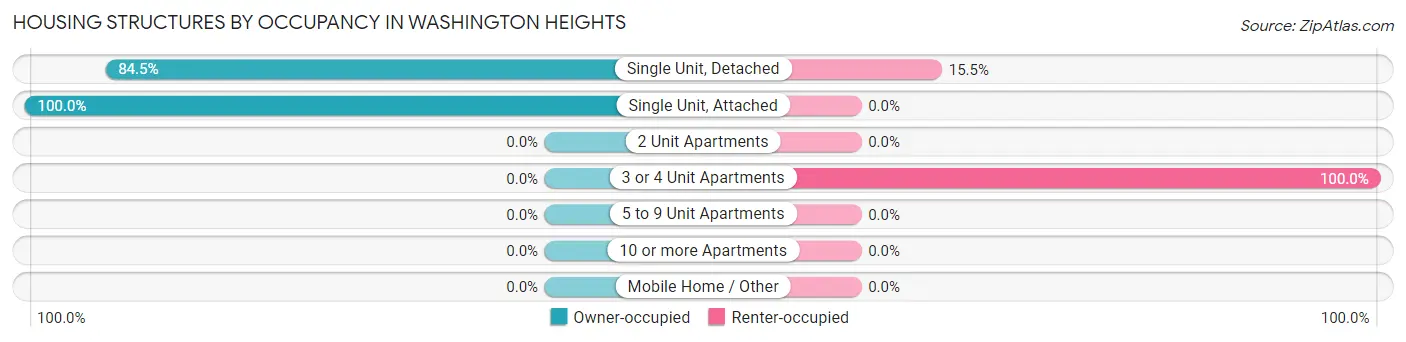
| Structure Type | Owner-occupied | Renter-occupied |
| Single Unit, Detached | 359 (84.5%) | 66 (15.5%) |
| Single Unit, Attached | 163 (100.0%) | 0 (0.0%) |
| 2 Unit Apartments | 0 (0.0%) | 0 (0.0%) |
| 3 or 4 Unit Apartments | 0 (0.0%) | 11 (100.0%) |
| 5 to 9 Unit Apartments | 0 (0.0%) | 0 (0.0%) |
| 10 or more Apartments | 0 (0.0%) | 0 (0.0%) |
| Mobile Home / Other | 0 (0.0%) | 0 (0.0%) |
| Total | 522 (87.2%) | 77 (12.9%) |
Housing Structures by Number of Rooms in Washington Heights
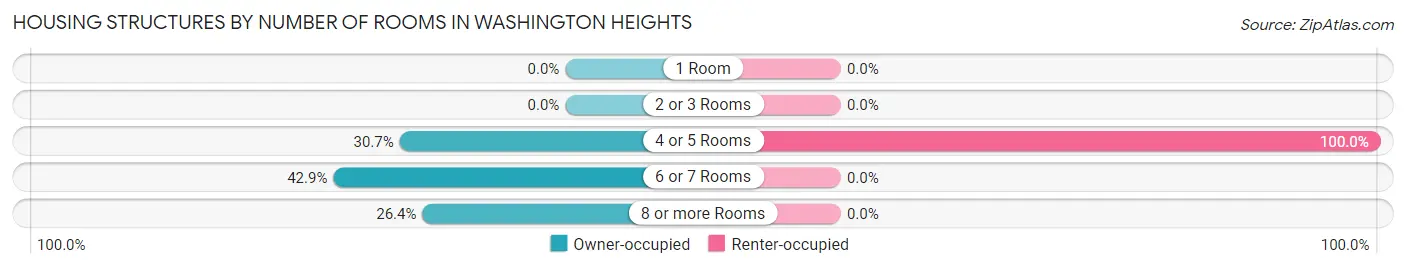
| Number of Rooms | Owner-occupied | Renter-occupied |
| 1 Room | 0 (0.0%) | 0 (0.0%) |
| 2 or 3 Rooms | 0 (0.0%) | 0 (0.0%) |
| 4 or 5 Rooms | 160 (30.6%) | 77 (100.0%) |
| 6 or 7 Rooms | 224 (42.9%) | 0 (0.0%) |
| 8 or more Rooms | 138 (26.4%) | 0 (0.0%) |
| Total | 522 (100.0%) | 77 (100.0%) |
Housing Structure by Heating Type in Washington Heights
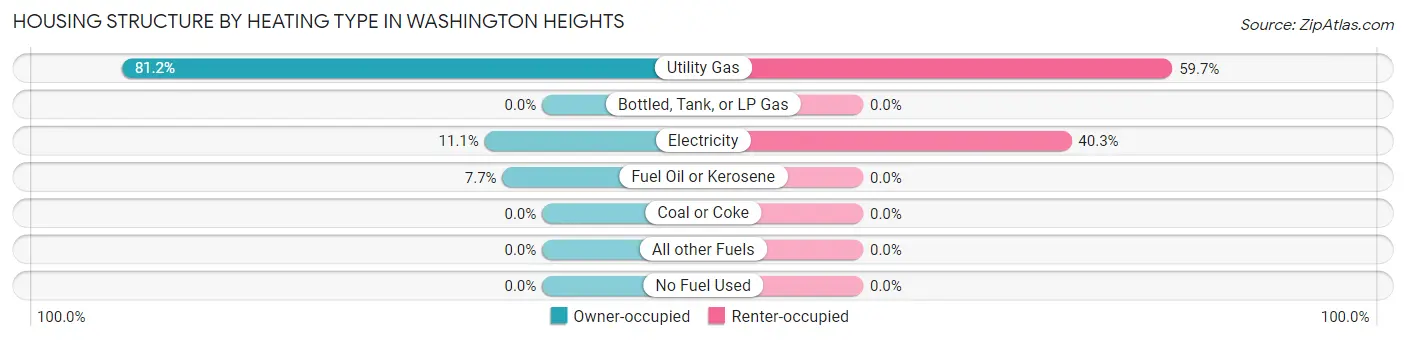
| Heating Type | Owner-occupied | Renter-occupied |
| Utility Gas | 424 (81.2%) | 46 (59.7%) |
| Bottled, Tank, or LP Gas | 0 (0.0%) | 0 (0.0%) |
| Electricity | 58 (11.1%) | 31 (40.3%) |
| Fuel Oil or Kerosene | 40 (7.7%) | 0 (0.0%) |
| Coal or Coke | 0 (0.0%) | 0 (0.0%) |
| All other Fuels | 0 (0.0%) | 0 (0.0%) |
| No Fuel Used | 0 (0.0%) | 0 (0.0%) |
| Total | 522 (100.0%) | 77 (100.0%) |
Household Vehicle Usage in Washington Heights
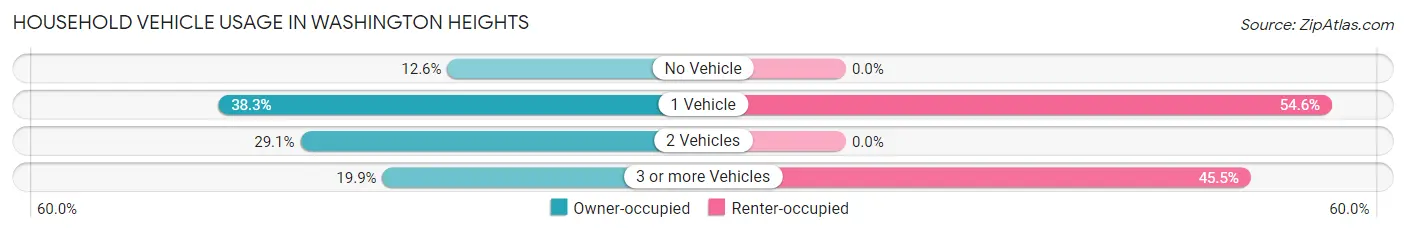
| Vehicles per Household | Owner-occupied | Renter-occupied |
| No Vehicle | 66 (12.6%) | 0 (0.0%) |
| 1 Vehicle | 200 (38.3%) | 42 (54.5%) |
| 2 Vehicles | 152 (29.1%) | 0 (0.0%) |
| 3 or more Vehicles | 104 (19.9%) | 35 (45.5%) |
| Total | 522 (100.0%) | 77 (100.0%) |
Real Estate & Mortgages in Washington Heights
Real Estate and Mortgage Overview in Washington Heights
| Characteristic | Without Mortgage | With Mortgage |
| Housing Units | 122 | 400 |
| Median Property Value | $322,600 | $315,300 |
| Median Household Income | - | - |
| Monthly Housing Costs | $812 | $68 |
| Real Estate Taxes | $3,258 | $24 |
Property Value by Mortgage Status in Washington Heights
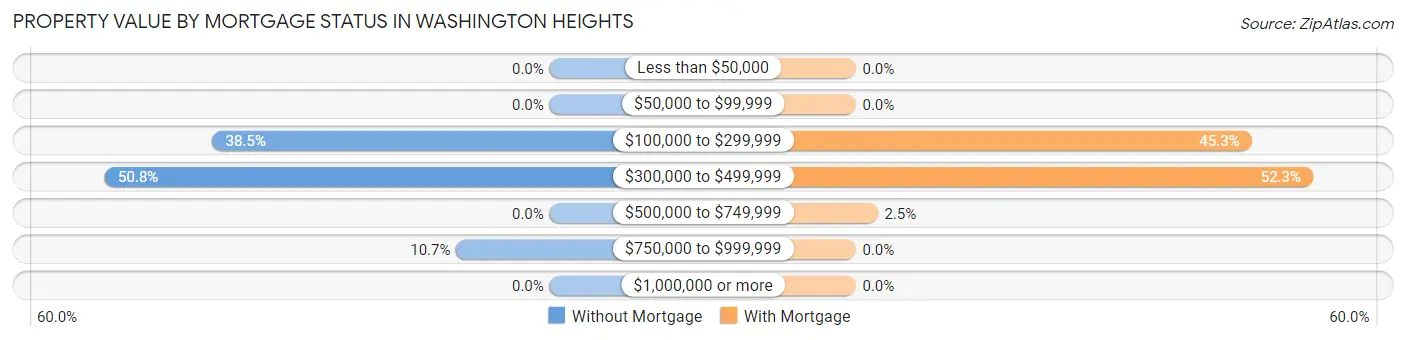
| Property Value | Without Mortgage | With Mortgage |
| Less than $50,000 | 0 (0.0%) | 0 (0.0%) |
| $50,000 to $99,999 | 0 (0.0%) | 0 (0.0%) |
| $100,000 to $299,999 | 47 (38.5%) | 181 (45.3%) |
| $300,000 to $499,999 | 62 (50.8%) | 209 (52.2%) |
| $500,000 to $749,999 | 0 (0.0%) | 10 (2.5%) |
| $750,000 to $999,999 | 13 (10.7%) | 0 (0.0%) |
| $1,000,000 or more | 0 (0.0%) | 0 (0.0%) |
| Total | 122 (100.0%) | 400 (100.0%) |
Household Income by Mortgage Status in Washington Heights
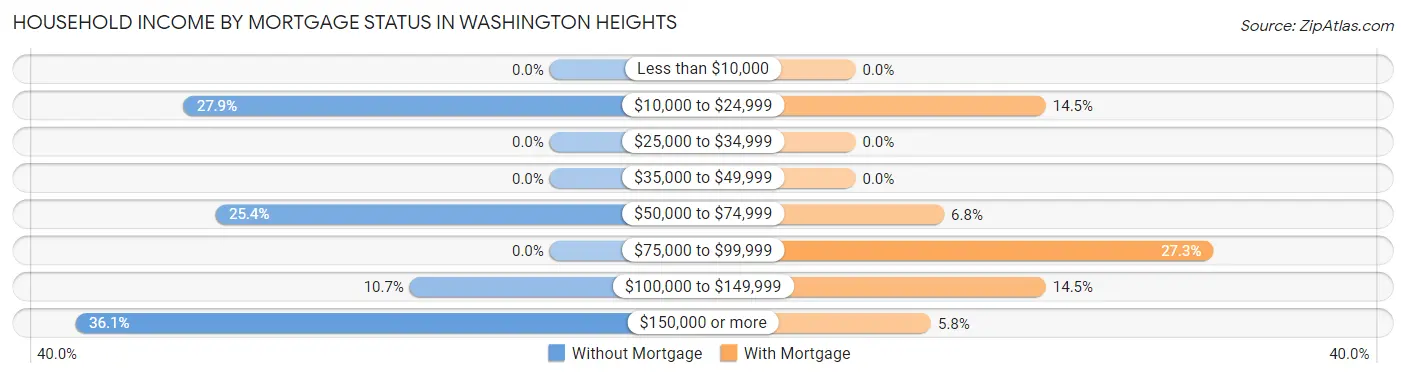
| Household Income | Without Mortgage | With Mortgage |
| Less than $10,000 | 0 (0.0%) | 0 (0.0%) |
| $10,000 to $24,999 | 34 (27.9%) | 58 (14.5%) |
| $25,000 to $34,999 | 0 (0.0%) | 0 (0.0%) |
| $35,000 to $49,999 | 0 (0.0%) | 0 (0.0%) |
| $50,000 to $74,999 | 31 (25.4%) | 27 (6.8%) |
| $75,000 to $99,999 | 0 (0.0%) | 109 (27.3%) |
| $100,000 to $149,999 | 13 (10.7%) | 58 (14.5%) |
| $150,000 or more | 44 (36.1%) | 23 (5.8%) |
| Total | 122 (100.0%) | 400 (100.0%) |
Property Value to Household Income Ratio in Washington Heights
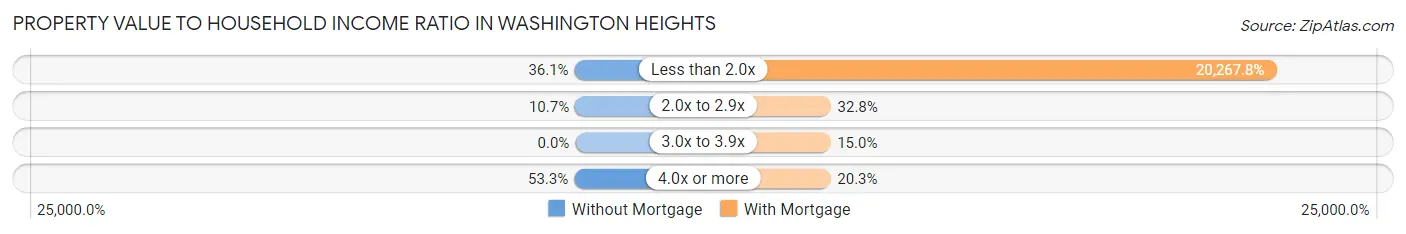
| Value-to-Income Ratio | Without Mortgage | With Mortgage |
| Less than 2.0x | 44 (36.1%) | 81,071 (20,267.8%) |
| 2.0x to 2.9x | 13 (10.7%) | 131 (32.8%) |
| 3.0x to 3.9x | 0 (0.0%) | 60 (15.0%) |
| 4.0x or more | 65 (53.3%) | 81 (20.3%) |
| Total | 122 (100.0%) | 400 (100.0%) |
Real Estate Taxes by Mortgage Status in Washington Heights
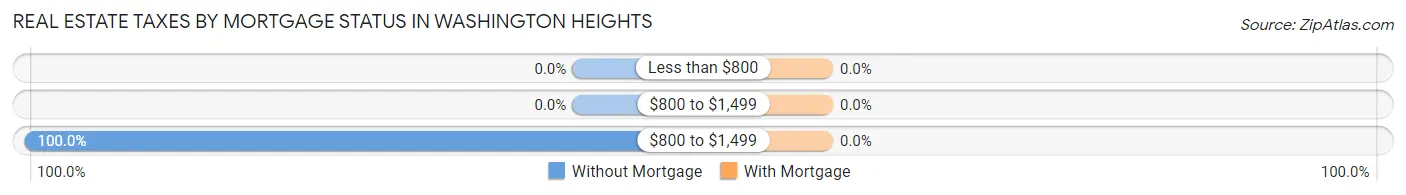
| Property Taxes | Without Mortgage | With Mortgage |
| Less than $800 | 0 (0.0%) | 0 (0.0%) |
| $800 to $1,499 | 0 (0.0%) | 0 (0.0%) |
| $800 to $1,499 | 122 (100.0%) | 0 (0.0%) |
| Total | 122 (100.0%) | 400 (100.0%) |
Health & Disability in Washington Heights
Health Insurance Coverage by Age in Washington Heights
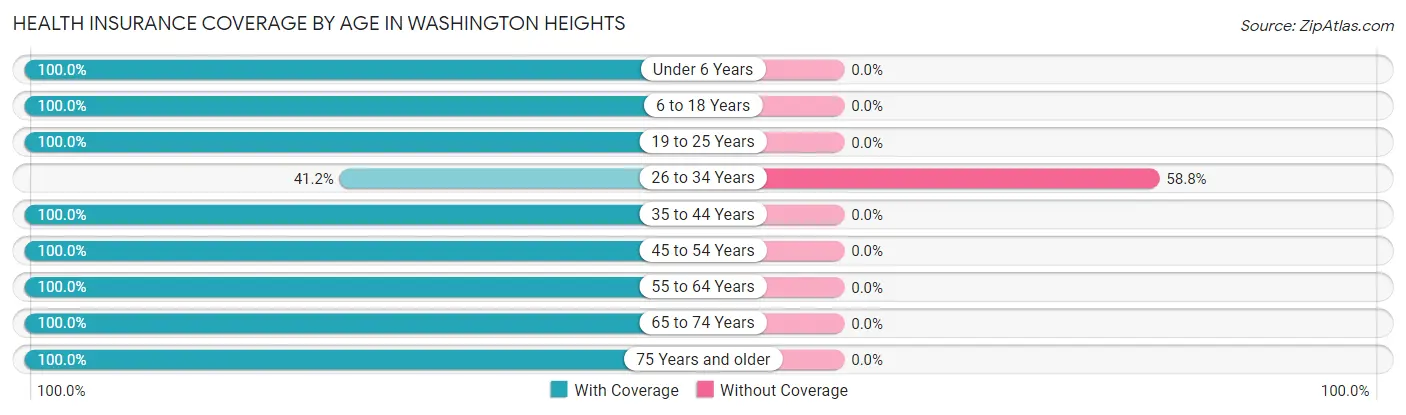
| Age Bracket | With Coverage | Without Coverage |
| Under 6 Years | 115 (100.0%) | 0 (0.0%) |
| 6 to 18 Years | 315 (100.0%) | 0 (0.0%) |
| 19 to 25 Years | 217 (100.0%) | 0 (0.0%) |
| 26 to 34 Years | 40 (41.2%) | 57 (58.8%) |
| 35 to 44 Years | 230 (100.0%) | 0 (0.0%) |
| 45 to 54 Years | 233 (100.0%) | 0 (0.0%) |
| 55 to 64 Years | 178 (100.0%) | 0 (0.0%) |
| 65 to 74 Years | 158 (100.0%) | 0 (0.0%) |
| 75 Years and older | 29 (100.0%) | 0 (0.0%) |
| Total | 1,515 (96.4%) | 57 (3.6%) |
Health Insurance Coverage by Citizenship Status in Washington Heights
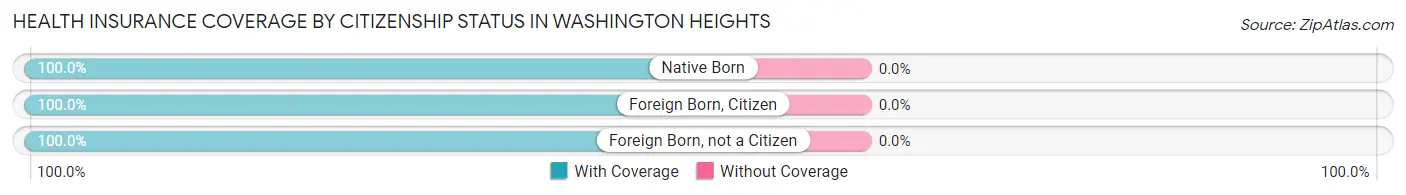
| Citizenship Status | With Coverage | Without Coverage |
| Native Born | 115 (100.0%) | 0 (0.0%) |
| Foreign Born, Citizen | 315 (100.0%) | 0 (0.0%) |
| Foreign Born, not a Citizen | 217 (100.0%) | 0 (0.0%) |
Health Insurance Coverage by Household Income in Washington Heights
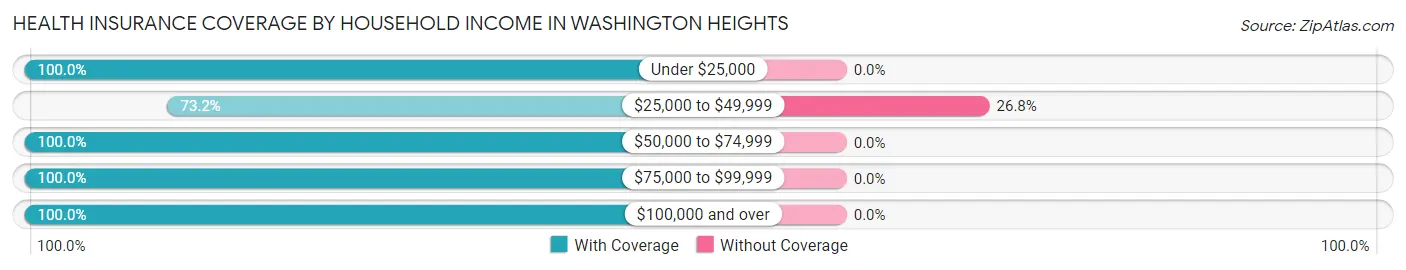
| Household Income | With Coverage | Without Coverage |
| Under $25,000 | 267 (100.0%) | 0 (0.0%) |
| $25,000 to $49,999 | 156 (73.2%) | 57 (26.8%) |
| $50,000 to $74,999 | 318 (100.0%) | 0 (0.0%) |
| $75,000 to $99,999 | 80 (100.0%) | 0 (0.0%) |
| $100,000 and over | 694 (100.0%) | 0 (0.0%) |
Public vs Private Health Insurance Coverage by Age in Washington Heights
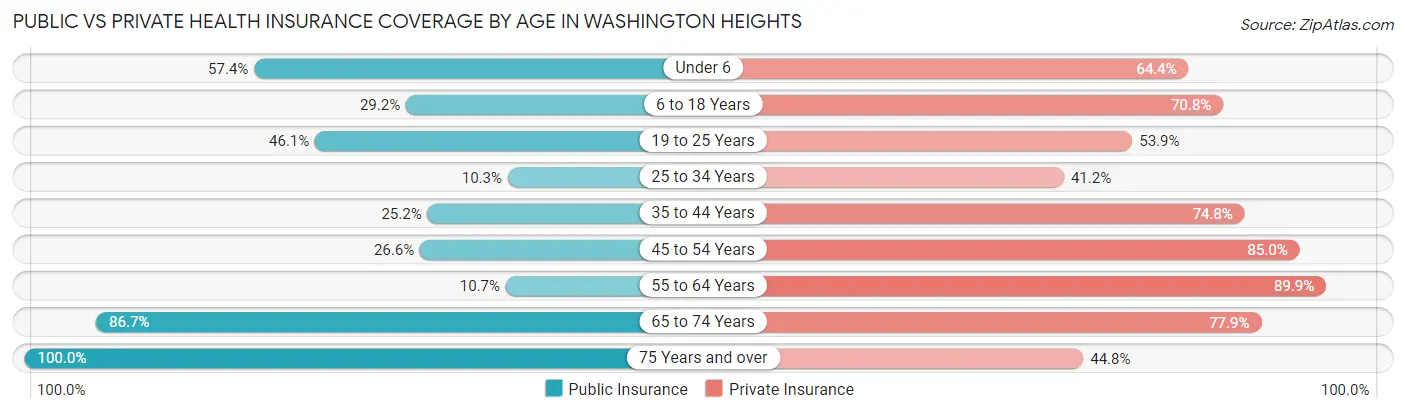
| Age Bracket | Public Insurance | Private Insurance |
| Under 6 | 66 (57.4%) | 74 (64.3%) |
| 6 to 18 Years | 92 (29.2%) | 223 (70.8%) |
| 19 to 25 Years | 100 (46.1%) | 117 (53.9%) |
| 25 to 34 Years | 10 (10.3%) | 40 (41.2%) |
| 35 to 44 Years | 58 (25.2%) | 172 (74.8%) |
| 45 to 54 Years | 62 (26.6%) | 198 (85.0%) |
| 55 to 64 Years | 19 (10.7%) | 160 (89.9%) |
| 65 to 74 Years | 137 (86.7%) | 123 (77.8%) |
| 75 Years and over | 29 (100.0%) | 13 (44.8%) |
| Total | 573 (36.4%) | 1,120 (71.3%) |
Disability Status by Sex by Age in Washington Heights
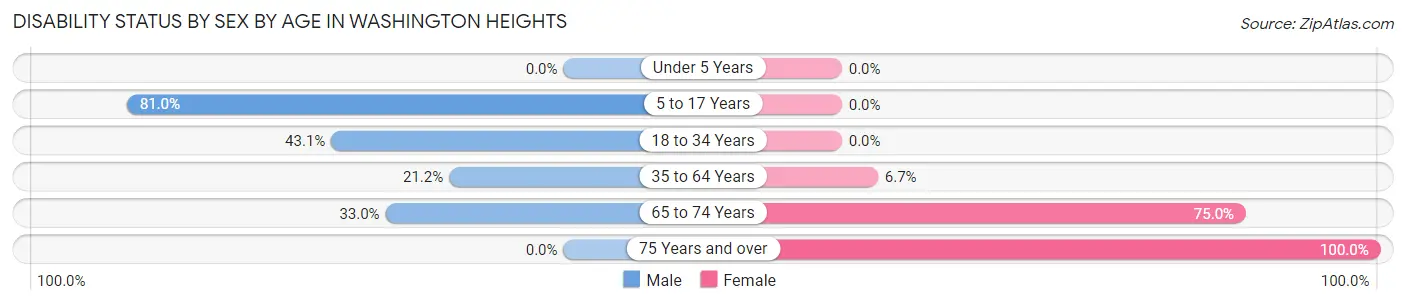
| Age Bracket | Male | Female |
| Under 5 Years | 0 (0.0%) | 0 (0.0%) |
| 5 to 17 Years | 94 (81.0%) | 0 (0.0%) |
| 18 to 34 Years | 100 (43.1%) | 0 (0.0%) |
| 35 to 64 Years | 63 (21.2%) | 23 (6.7%) |
| 65 to 74 Years | 35 (33.0%) | 39 (75.0%) |
| 75 Years and over | 0 (0.0%) | 16 (100.0%) |
Disability Class by Sex by Age in Washington Heights
Disability Class: Hearing Difficulty
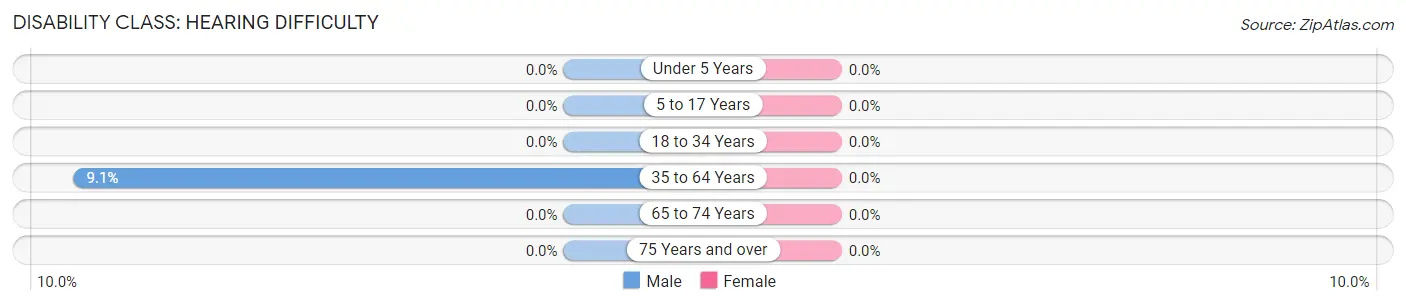
| Age Bracket | Male | Female |
| Under 5 Years | 0 (0.0%) | 0 (0.0%) |
| 5 to 17 Years | 0 (0.0%) | 0 (0.0%) |
| 18 to 34 Years | 0 (0.0%) | 0 (0.0%) |
| 35 to 64 Years | 27 (9.1%) | 0 (0.0%) |
| 65 to 74 Years | 0 (0.0%) | 0 (0.0%) |
| 75 Years and over | 0 (0.0%) | 0 (0.0%) |
Disability Class: Vision Difficulty
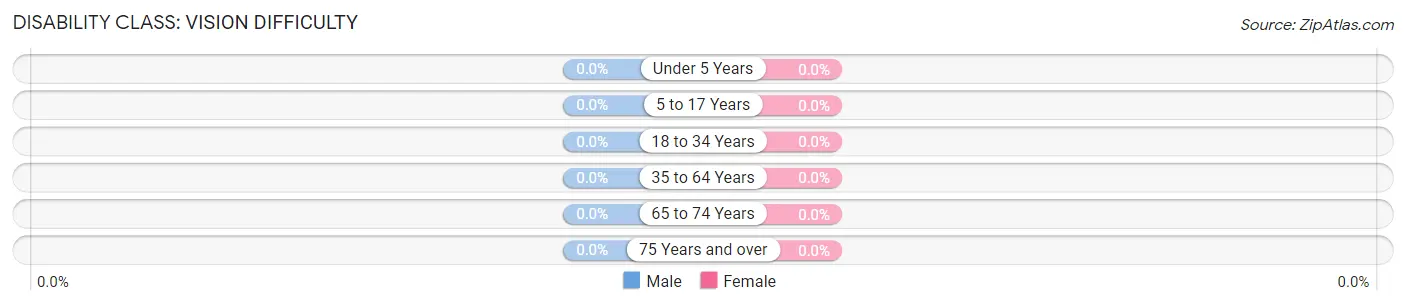
| Age Bracket | Male | Female |
| Under 5 Years | 0 (0.0%) | 0 (0.0%) |
| 5 to 17 Years | 0 (0.0%) | 0 (0.0%) |
| 18 to 34 Years | 0 (0.0%) | 0 (0.0%) |
| 35 to 64 Years | 0 (0.0%) | 0 (0.0%) |
| 65 to 74 Years | 0 (0.0%) | 0 (0.0%) |
| 75 Years and over | 0 (0.0%) | 0 (0.0%) |
Disability Class: Cognitive Difficulty
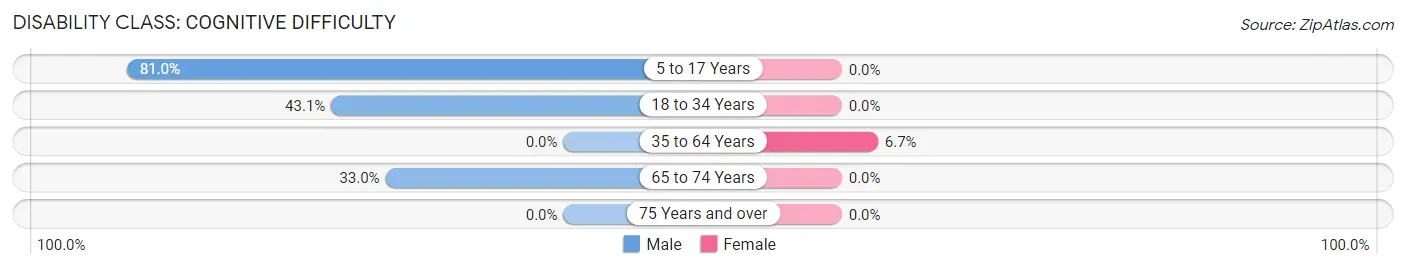
| Age Bracket | Male | Female |
| 5 to 17 Years | 94 (81.0%) | 0 (0.0%) |
| 18 to 34 Years | 100 (43.1%) | 0 (0.0%) |
| 35 to 64 Years | 0 (0.0%) | 23 (6.7%) |
| 65 to 74 Years | 35 (33.0%) | 0 (0.0%) |
| 75 Years and over | 0 (0.0%) | 0 (0.0%) |
Disability Class: Ambulatory Difficulty
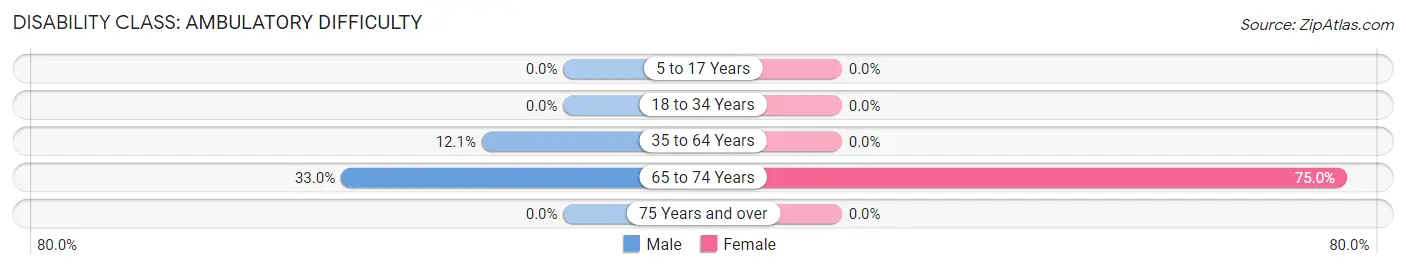
| Age Bracket | Male | Female |
| 5 to 17 Years | 0 (0.0%) | 0 (0.0%) |
| 18 to 34 Years | 0 (0.0%) | 0 (0.0%) |
| 35 to 64 Years | 36 (12.1%) | 0 (0.0%) |
| 65 to 74 Years | 35 (33.0%) | 39 (75.0%) |
| 75 Years and over | 0 (0.0%) | 0 (0.0%) |
Disability Class: Self-Care Difficulty
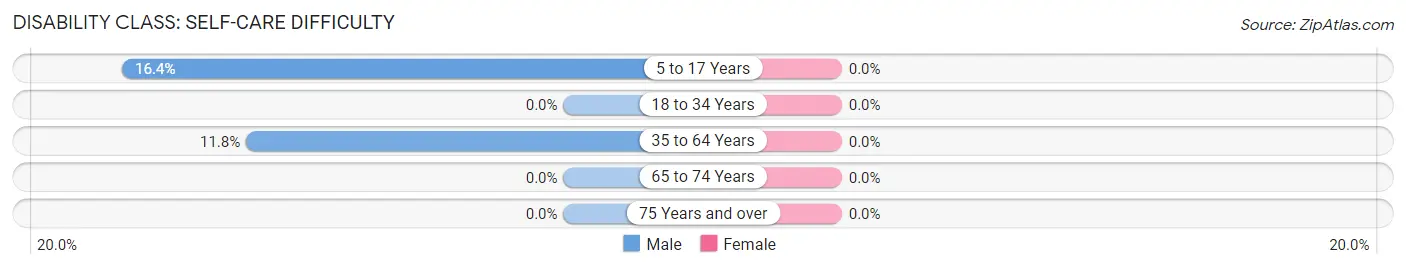
| Age Bracket | Male | Female |
| 5 to 17 Years | 19 (16.4%) | 0 (0.0%) |
| 18 to 34 Years | 0 (0.0%) | 0 (0.0%) |
| 35 to 64 Years | 35 (11.8%) | 0 (0.0%) |
| 65 to 74 Years | 0 (0.0%) | 0 (0.0%) |
| 75 Years and over | 0 (0.0%) | 0 (0.0%) |
Technology Access in Washington Heights
Computing Device Access in Washington Heights
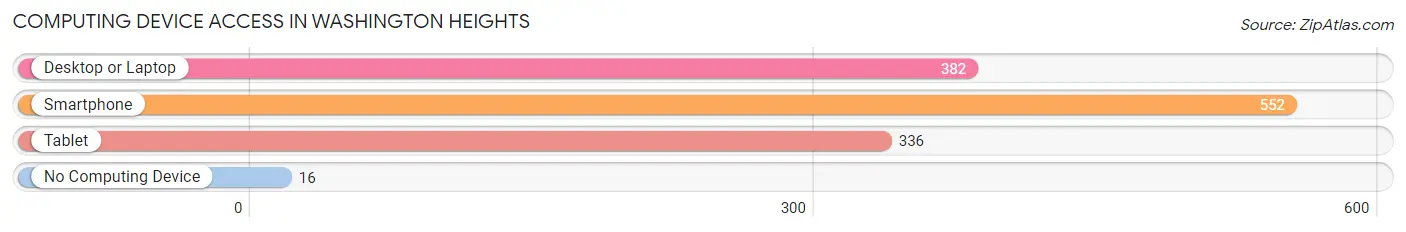
| Device Type | # Households | % Households |
| Desktop or Laptop | 382 | 63.8% |
| Smartphone | 552 | 92.1% |
| Tablet | 336 | 56.1% |
| No Computing Device | 16 | 2.7% |
| Total | 599 | 100.0% |
Internet Access in Washington Heights
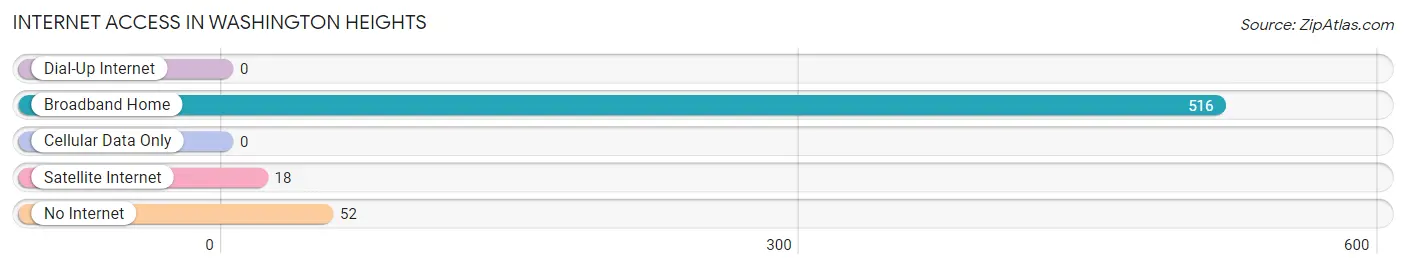
| Internet Type | # Households | % Households |
| Dial-Up Internet | 0 | 0.0% |
| Broadband Home | 516 | 86.1% |
| Cellular Data Only | 0 | 0.0% |
| Satellite Internet | 18 | 3.0% |
| No Internet | 52 | 8.7% |
| Total | 599 | 100.0% |
Washington Heights Summary
History
Washington Heights is a neighborhood in the northern part of Manhattan, New York City. It is bounded by 155th Street to the north, the Hudson River to the west, Harlem River to the east, and Dyckman Street to the south. The area has a long and rich history, beginning with its original inhabitants, the Lenape Native Americans. The Lenape were a peaceful people who lived in the area for centuries before the arrival of Europeans.
The first Europeans to settle in the area were the Dutch, who established a trading post in 1626. The Dutch named the area Nieuw Haarlem, after the city of Haarlem in the Netherlands. The area was later taken over by the British, who renamed it Washington Heights in honor of George Washington, the first President of the United States.
The area was largely rural until the late 19th century, when it began to be developed as a residential neighborhood. The construction of the George Washington Bridge in 1931 further spurred development, and by the 1950s, Washington Heights had become a thriving middle-class neighborhood.
Geography
Washington Heights is located in the northern part of Manhattan, New York City. It is bounded by 155th Street to the north, the Hudson River to the west, Harlem River to the east, and Dyckman Street to the south. The area is hilly, with the highest point being Bennett Park, which is 265 feet above sea level.
The neighborhood is home to several parks, including Fort Washington Park, Highbridge Park, and Fort Tryon Park. The area is also home to several historic sites, such as the Morris-Jumel Mansion, the Dyckman House, and the Cloisters.
Economy
Washington Heights is a largely residential neighborhood, with a diverse economy. The area is home to a variety of businesses, including restaurants, bars, retail stores, and professional services. The area is also home to several medical centers, including Columbia University Medical Center and New York-Presbyterian Hospital.
The area is also home to several educational institutions, including Columbia University, Barnard College, and Yeshiva University. The area is also home to several cultural institutions, including the Hispanic Society of America and the United Palace Theater.
Demographics
Washington Heights is a diverse neighborhood, with a population of approximately 150,000 people. The area is home to a large Hispanic population, with approximately 70% of the population identifying as Hispanic or Latino. The area is also home to a large African American population, with approximately 20% of the population identifying as African American.
The area is also home to a large immigrant population, with approximately 40% of the population being foreign-born. The area is home to a variety of ethnicities, including Dominican, Puerto Rican, Mexican, and Central American.
Conclusion
Washington Heights is a vibrant and diverse neighborhood in the northern part of Manhattan, New York City. The area has a long and rich history, beginning with its original inhabitants, the Lenape Native Americans. The area has a diverse economy, with a variety of businesses, medical centers, educational institutions, and cultural institutions. The area is also home to a large and diverse population, with a majority of the population identifying as Hispanic or Latino.
Common Questions
What is the Total Population of Washington Heights?
Total Population of Washington Heights is 1,572.
What is the Total Male Population of Washington Heights?
Total Male Population of Washington Heights is 856.
What is the Total Female Population of Washington Heights?
Total Female Population of Washington Heights is 716.
What is the Ratio of Males per 100 Females in Washington Heights?
There are 119.55 Males per 100 Females in Washington Heights.
What is the Ratio of Females per 100 Males in Washington Heights?
There are 83.64 Females per 100 Males in Washington Heights.
What is the Median Population Age in Washington Heights?
Median Population Age in Washington Heights is 39.7 Years.
What is the Average Family Size in Washington Heights
Average Family Size in Washington Heights is 3.1 People.
What is the Average Household Size in Washington Heights
Average Household Size in Washington Heights is 2.6 People.
What is Per Capita Income in Washington Heights?
Per Capita income in Washington Heights is $43,155.
What is the Median Household income in Washington Heights?
Median Household Income in Washington Heights is $67,188.
What is Income or Wage Gap in Washington Heights?
Income or Wage Gap in Washington Heights is 28.0%.
Women in Washington Heights earn 72.0 cents for every dollar earned by a man.
What is Inequality or Gini Index in Washington Heights?
Inequality or Gini Index in Washington Heights is 0.49.
How Large is the Labor Force in Washington Heights?
There are 761 People in the Labor Forcein in Washington Heights.
What is the Percentage of People in the Labor Force in Washington Heights?
66.6% of People are in the Labor Force in Washington Heights.
What is the Unemployment Rate in Washington Heights?
Unemployment Rate in Washington Heights is 8.9%.