Fleischmanns, NY
Fleischmanns Map
Fleischmanns Overview
260
TOTAL POPULATION
139
MALE POPULATION
121
FEMALE POPULATION
114.88
MALES / 100 FEMALES
87.05
FEMALES / 100 MALES
49.5
MEDIAN AGE
2.9
AVG FAMILY SIZE
2.4
AVG HOUSEHOLD SIZE
$36,398
PER CAPITA INCOME
$91,607
AVG FAMILY INCOME
$60,417
AVG HOUSEHOLD INCOME
0.36
INEQUALITY / GINI INDEX
156
LABOR FORCE [ PEOPLE ]
67.2%
PERCENT IN LABOR FORCE
3.8%
UNEMPLOYMENT RATE
Fleischmanns Zip Codes
Fleischmanns Area Codes
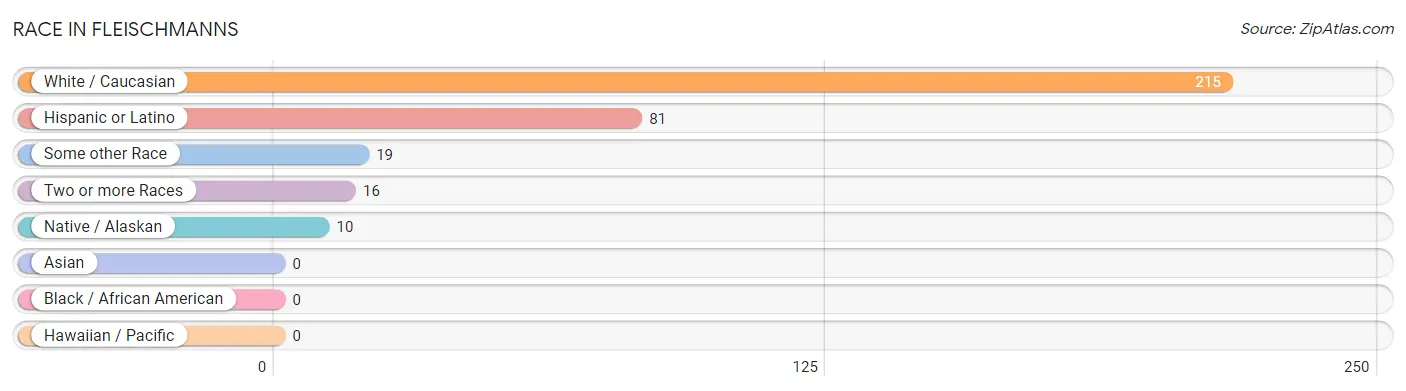
Race in Fleischmanns
The most populous races in Fleischmanns are White / Caucasian (215 | 82.7%), Hispanic or Latino (81 | 31.1%), and Some other Race (19 | 7.3%).
| Race | # Population | % Population |
| Asian | 0 | 0.0% |
| Black / African American | 0 | 0.0% |
| Hawaiian / Pacific | 0 | 0.0% |
| Hispanic or Latino | 81 | 31.1% |
| Native / Alaskan | 10 | 3.8% |
| White / Caucasian | 215 | 82.7% |
| Two or more Races | 16 | 6.1% |
| Some other Race | 19 | 7.3% |
| Total | 260 | 100.0% |
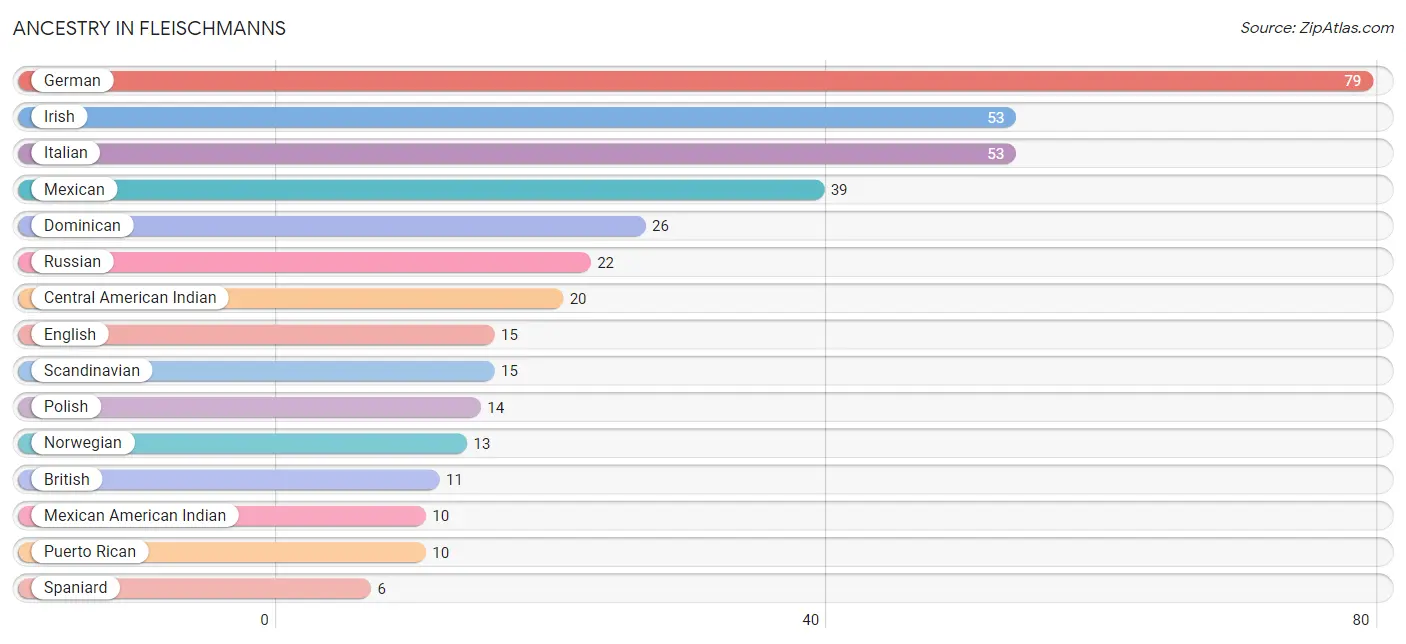
Ancestry in Fleischmanns
The most populous ancestries reported in Fleischmanns are German (79 | 30.4%), Irish (53 | 20.4%), Italian (53 | 20.4%), Mexican (39 | 15.0%), and Dominican (26 | 10.0%), together accounting for 96.1% of all Fleischmanns residents.
| Ancestry | # Population | % Population |
| British | 11 | 4.2% |
| Central American Indian | 20 | 7.7% |
| Czech | 3 | 1.1% |
| Dominican | 26 | 10.0% |
| Dutch | 4 | 1.5% |
| English | 15 | 5.8% |
| German | 79 | 30.4% |
| Irish | 53 | 20.4% |
| Italian | 53 | 20.4% |
| Lithuanian | 4 | 1.5% |
| Mexican | 39 | 15.0% |
| Mexican American Indian | 10 | 3.8% |
| Northern European | 5 | 1.9% |
| Norwegian | 13 | 5.0% |
| Polish | 14 | 5.4% |
| Puerto Rican | 10 | 3.8% |
| Russian | 22 | 8.5% |
| Scandinavian | 15 | 5.8% |
| Spaniard | 6 | 2.3% |
| Swedish | 5 | 1.9% | View All 20 Rows |
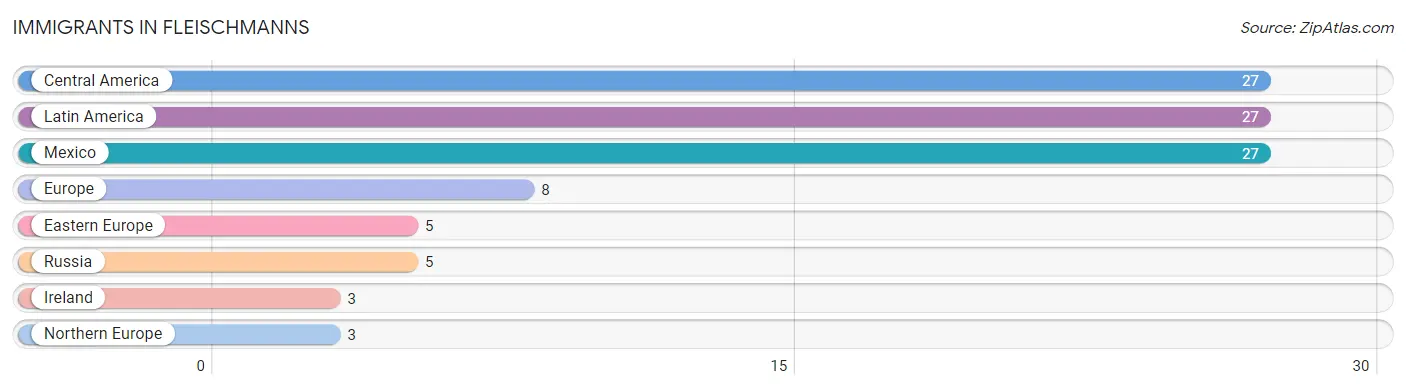
Immigrants in Fleischmanns
The most numerous immigrant groups reported in Fleischmanns came from Central America (27 | 10.4%), Latin America (27 | 10.4%), Mexico (27 | 10.4%), Europe (8 | 3.1%), and Eastern Europe (5 | 1.9%), together accounting for 36.1% of all Fleischmanns residents.
| Immigration Origin | # Population | % Population |
| Central America | 27 | 10.4% |
| Eastern Europe | 5 | 1.9% |
| Europe | 8 | 3.1% |
| Ireland | 3 | 1.1% |
| Latin America | 27 | 10.4% |
| Mexico | 27 | 10.4% |
| Northern Europe | 3 | 1.1% |
| Russia | 5 | 1.9% | View All 8 Rows |
Sex and Age in Fleischmanns
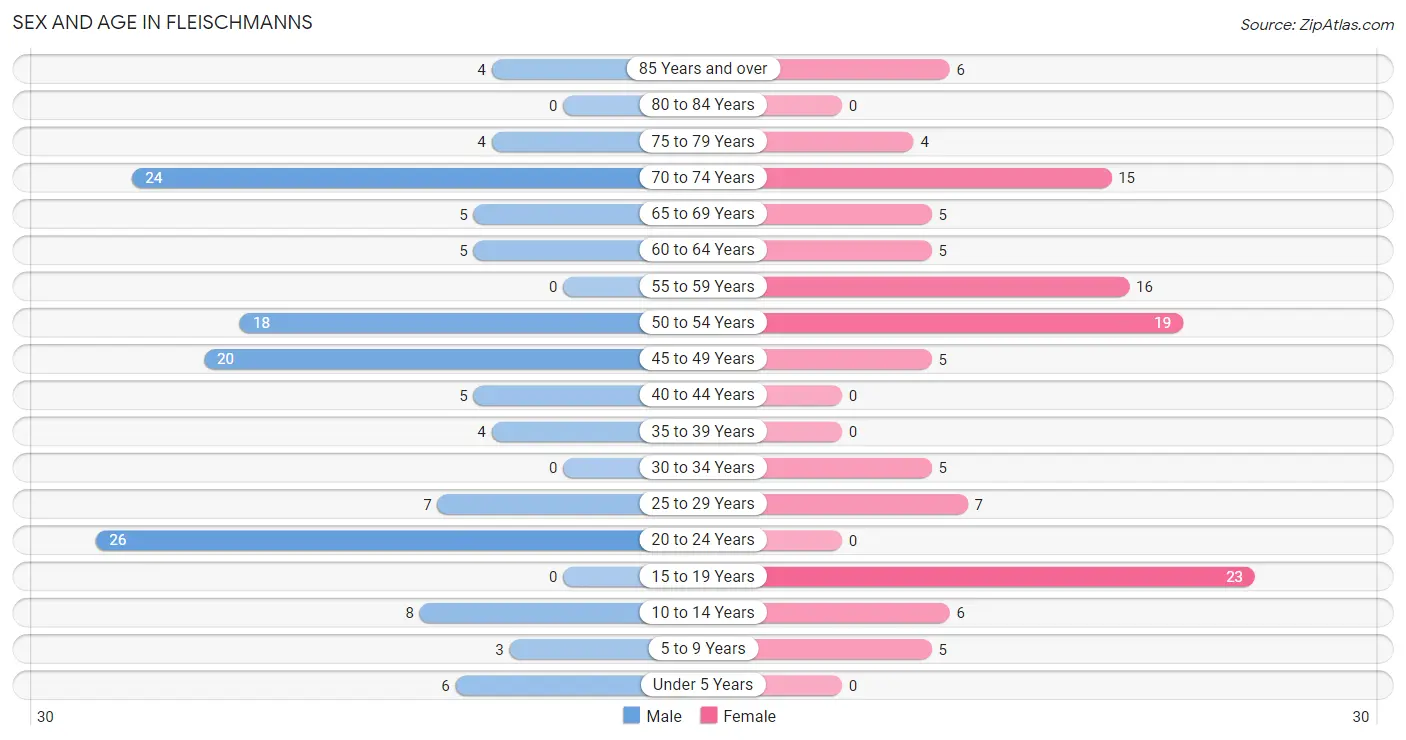
Sex and Age in Fleischmanns
The most populous age groups in Fleischmanns are 20 to 24 Years (26 | 18.7%) for men and 15 to 19 Years (23 | 19.0%) for women.
| Age Bracket | Male | Female |
| Under 5 Years | 6 (4.3%) | 0 (0.0%) |
| 5 to 9 Years | 3 (2.2%) | 5 (4.1%) |
| 10 to 14 Years | 8 (5.8%) | 6 (5.0%) |
| 15 to 19 Years | 0 (0.0%) | 23 (19.0%) |
| 20 to 24 Years | 26 (18.7%) | 0 (0.0%) |
| 25 to 29 Years | 7 (5.0%) | 7 (5.8%) |
| 30 to 34 Years | 0 (0.0%) | 5 (4.1%) |
| 35 to 39 Years | 4 (2.9%) | 0 (0.0%) |
| 40 to 44 Years | 5 (3.6%) | 0 (0.0%) |
| 45 to 49 Years | 20 (14.4%) | 5 (4.1%) |
| 50 to 54 Years | 18 (13.0%) | 19 (15.7%) |
| 55 to 59 Years | 0 (0.0%) | 16 (13.2%) |
| 60 to 64 Years | 5 (3.6%) | 5 (4.1%) |
| 65 to 69 Years | 5 (3.6%) | 5 (4.1%) |
| 70 to 74 Years | 24 (17.3%) | 15 (12.4%) |
| 75 to 79 Years | 4 (2.9%) | 4 (3.3%) |
| 80 to 84 Years | 0 (0.0%) | 0 (0.0%) |
| 85 Years and over | 4 (2.9%) | 6 (5.0%) |
| Total | 139 (100.0%) | 121 (100.0%) |
Families and Households in Fleischmanns
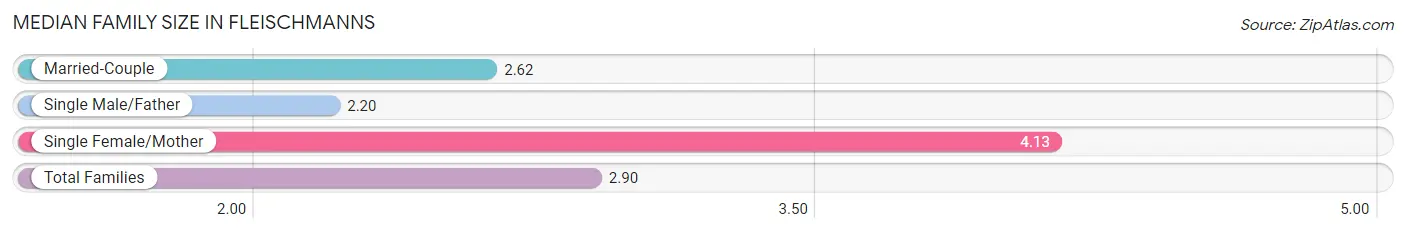
Median Family Size in Fleischmanns
The median family size in Fleischmanns is 2.90 persons per family, with single female/mother families (15 | 22.4%) accounting for the largest median family size of 4.13 persons per family. On the other hand, single male/father families (10 | 14.9%) represent the smallest median family size with 2.20 persons per family.
| Family Type | # Families | Family Size |
| Married-Couple | 42 (62.7%) | 2.62 |
| Single Male/Father | 10 (14.9%) | 2.20 |
| Single Female/Mother | 15 (22.4%) | 4.13 |
| Total Families | 67 (100.0%) | 2.90 |
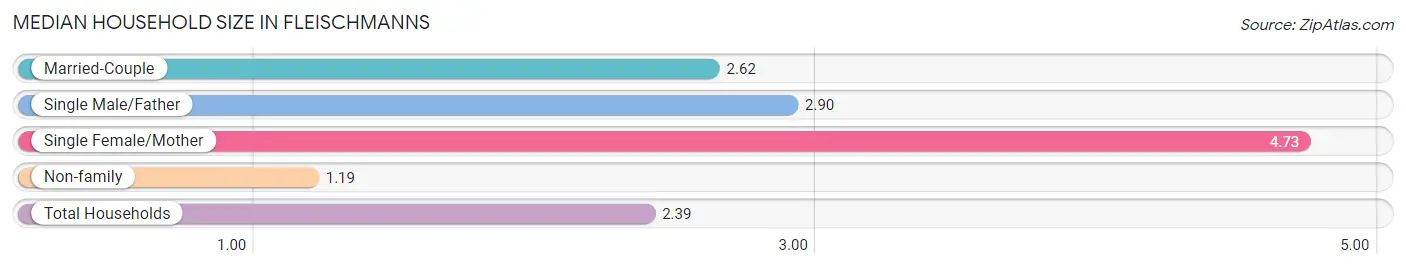
Median Household Size in Fleischmanns
The median household size in Fleischmanns is 2.39 persons per household, with single female/mother households (15 | 13.8%) accounting for the largest median household size of 4.73 persons per household. non-family households (42 | 38.5%) represent the smallest median household size with 1.19 persons per household.
| Household Type | # Households | Household Size |
| Married-Couple | 42 (38.5%) | 2.62 |
| Single Male/Father | 10 (9.2%) | 2.90 |
| Single Female/Mother | 15 (13.8%) | 4.73 |
| Non-family | 42 (38.5%) | 1.19 |
| Total Households | 109 (100.0%) | 2.39 |
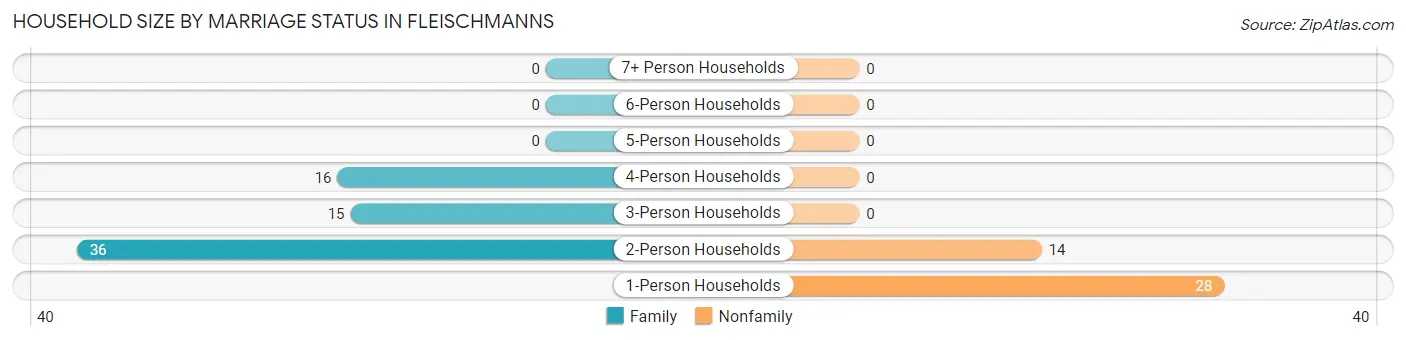
Household Size by Marriage Status in Fleischmanns
Out of a total of 109 households in Fleischmanns, 67 (61.5%) are family households, while 42 (38.5%) are nonfamily households. The most numerous type of family households are 2-person households, comprising 36, and the most common type of nonfamily households are 1-person households, comprising 28.
| Household Size | Family Households | Nonfamily Households |
| 1-Person Households | - | 28 (25.7%) |
| 2-Person Households | 36 (33.0%) | 14 (12.8%) |
| 3-Person Households | 15 (13.8%) | 0 (0.0%) |
| 4-Person Households | 16 (14.7%) | 0 (0.0%) |
| 5-Person Households | 0 (0.0%) | 0 (0.0%) |
| 6-Person Households | 0 (0.0%) | 0 (0.0%) |
| 7+ Person Households | 0 (0.0%) | 0 (0.0%) |
| Total | 67 (61.5%) | 42 (38.5%) |
Female Fertility in Fleischmanns
Fertility by Age in Fleischmanns
| Age Bracket | Women with Births | Births / 1,000 Women |
| 15 to 19 years | 0 (0.0%) | 0.0 |
| 20 to 34 years | 0 (0.0%) | 0.0 |
| 35 to 50 years | 0 (0.0%) | 0.0 |
| Total | 0 (0.0%) | 0.0 |
Fertility by Age by Marriage Status in Fleischmanns
| Age Bracket | Married | Unmarried |
| 15 to 19 years | 0 (0.0%) | 0 (0.0%) |
| 20 to 34 years | 0 (0.0%) | 0 (0.0%) |
| 35 to 50 years | 0 (0.0%) | 0 (0.0%) |
| Total | 0 (0.0%) | 0 (0.0%) |
Fertility by Education in Fleischmanns
| Educational Attainment | Women with Births | Births / 1,000 Women |
| Less than High School | 0 (0.0%) | 0.0 |
| High School Diploma | 0 (0.0%) | 0.0 |
| College or Associate's Degree | 0 (0.0%) | 0.0 |
| Bachelor's Degree | 0 (0.0%) | 0.0 |
| Graduate Degree | 0 (0.0%) | 0.0 |
| Total | 0 (0.0%) | 0.0 |
Fertility by Education by Marriage Status in Fleischmanns
| Educational Attainment | Married | Unmarried |
| Less than High School | 0 (0.0%) | 0 (0.0%) |
| High School Diploma | 0 (0.0%) | 0 (0.0%) |
| College or Associate's Degree | 0 (0.0%) | 0 (0.0%) |
| Bachelor's Degree | 0 (0.0%) | 0 (0.0%) |
| Graduate Degree | 0 (0.0%) | 0 (0.0%) |
| Total | 0 (0.0%) | 0 (0.0%) |
Income in Fleischmanns
Income Overview in Fleischmanns
Per Capita Income in Fleischmanns is $36,398, while median incomes of families and households are $91,607 and $60,417 respectively.
| Characteristic | Number | Measure |
| Per Capita Income | 260 | $36,398 |
| Median Family Income | 67 | $91,607 |
| Mean Family Income | 67 | $100,185 |
| Median Household Income | 109 | $60,417 |
| Mean Household Income | 109 | $84,450 |
| Income Deficit | 67 | $0 |
| Wage / Income Gap (%) | 260 | 0.00% |
| Wage / Income Gap ($) | 260 | 100.00¢ per $1 |
| Gini / Inequality Index | 260 | 0.36 |
Earnings by Sex in Fleischmanns
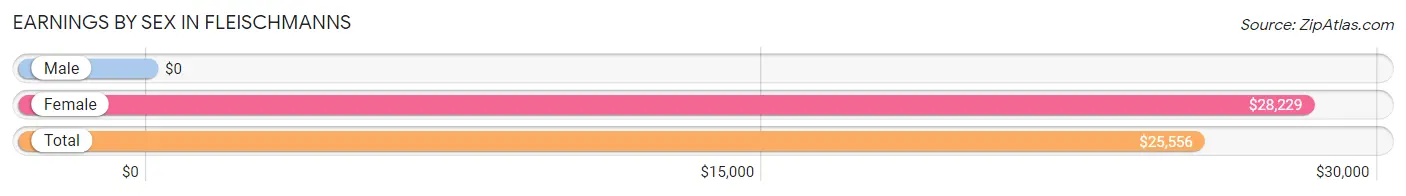
| Sex | Number | Average Earnings |
| Male | 89 (53.0%) | $0 |
| Female | 79 (47.0%) | $28,229 |
| Total | 168 (100.0%) | $25,556 |
Earnings by Sex by Income Bracket in Fleischmanns
The most common earnings brackets in Fleischmanns are $12,500 to $14,999 for men (26 | 29.2%) and $15,000 to $17,499 for women (16 | 20.3%).
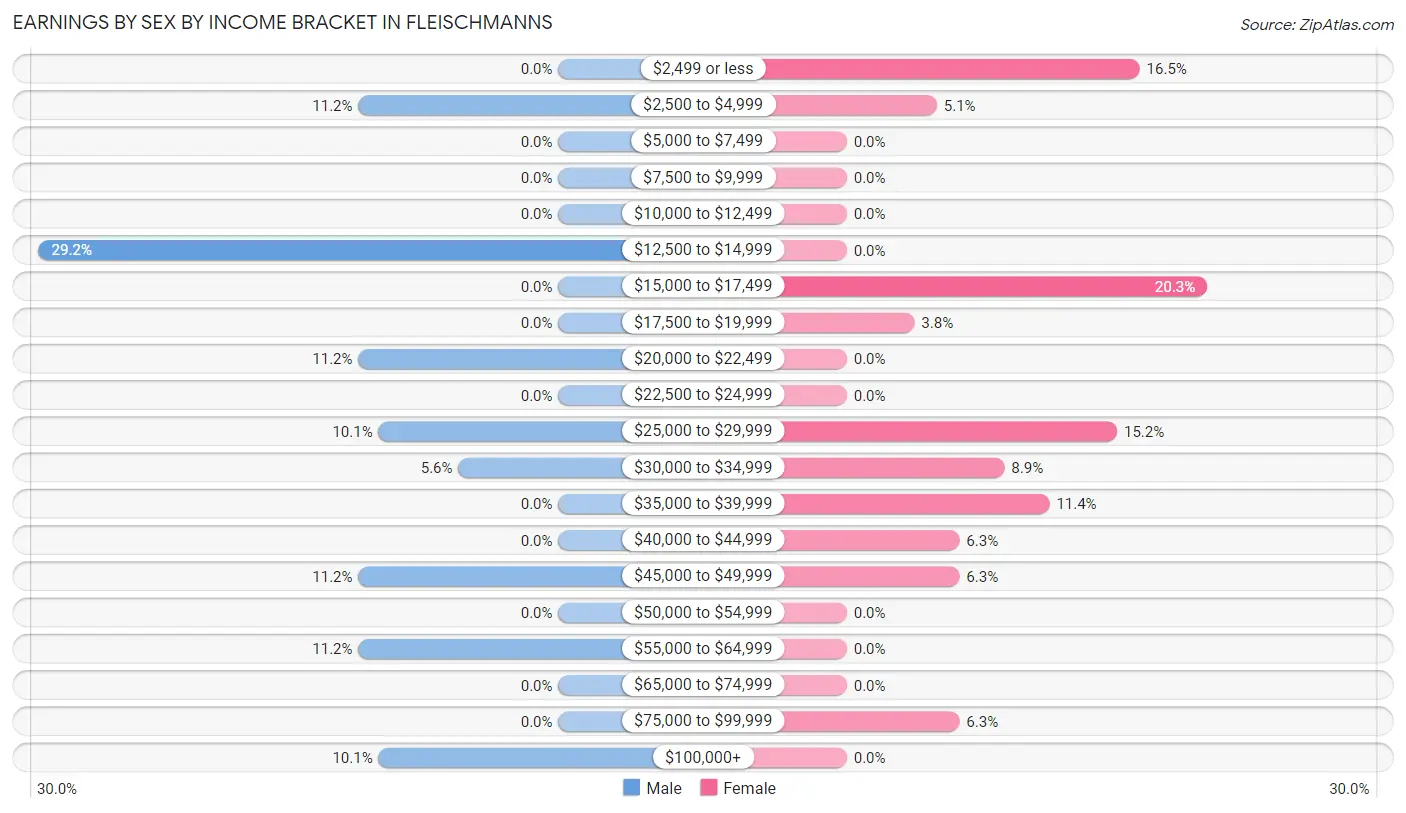
| Income | Male | Female |
| $2,499 or less | 0 (0.0%) | 13 (16.5%) |
| $2,500 to $4,999 | 10 (11.2%) | 4 (5.1%) |
| $5,000 to $7,499 | 0 (0.0%) | 0 (0.0%) |
| $7,500 to $9,999 | 0 (0.0%) | 0 (0.0%) |
| $10,000 to $12,499 | 0 (0.0%) | 0 (0.0%) |
| $12,500 to $14,999 | 26 (29.2%) | 0 (0.0%) |
| $15,000 to $17,499 | 0 (0.0%) | 16 (20.3%) |
| $17,500 to $19,999 | 0 (0.0%) | 3 (3.8%) |
| $20,000 to $22,499 | 10 (11.2%) | 0 (0.0%) |
| $22,500 to $24,999 | 0 (0.0%) | 0 (0.0%) |
| $25,000 to $29,999 | 9 (10.1%) | 12 (15.2%) |
| $30,000 to $34,999 | 5 (5.6%) | 7 (8.9%) |
| $35,000 to $39,999 | 0 (0.0%) | 9 (11.4%) |
| $40,000 to $44,999 | 0 (0.0%) | 5 (6.3%) |
| $45,000 to $49,999 | 10 (11.2%) | 5 (6.3%) |
| $50,000 to $54,999 | 0 (0.0%) | 0 (0.0%) |
| $55,000 to $64,999 | 10 (11.2%) | 0 (0.0%) |
| $65,000 to $74,999 | 0 (0.0%) | 0 (0.0%) |
| $75,000 to $99,999 | 0 (0.0%) | 5 (6.3%) |
| $100,000+ | 9 (10.1%) | 0 (0.0%) |
| Total | 89 (100.0%) | 79 (100.0%) |
Earnings by Sex by Educational Attainment in Fleischmanns
Average earnings in Fleischmanns are $33,750 for men and $33,036 for women, a difference of 2.1%. Men with an educational attainment of bachelor's degree enjoy the highest average annual earnings of $26,944, while those with bachelor's degree education earn the least with $26,944. Women with an educational attainment of graduate degree earn the most with the average annual earnings of $39,167, while those with high school diploma education have the smallest earnings of $16,563.
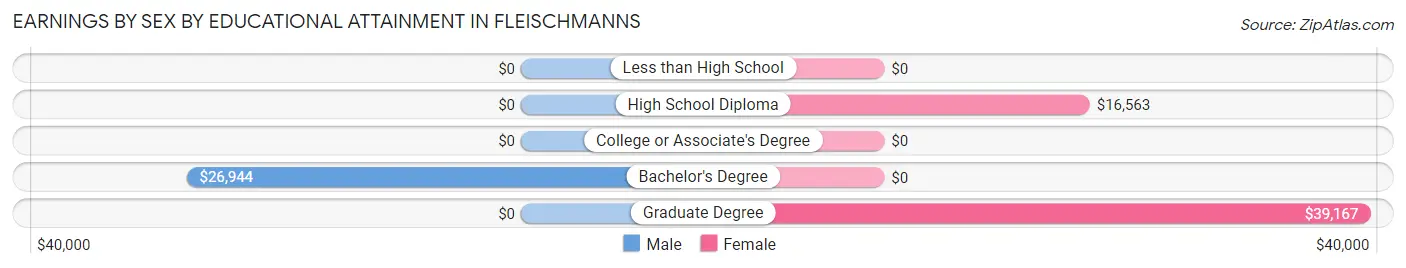
| Educational Attainment | Male Income | Female Income |
| Less than High School | - | - |
| High School Diploma | - | - |
| College or Associate's Degree | - | - |
| Bachelor's Degree | $26,944 | $0 |
| Graduate Degree | - | - |
| Total | $33,750 | $33,036 |
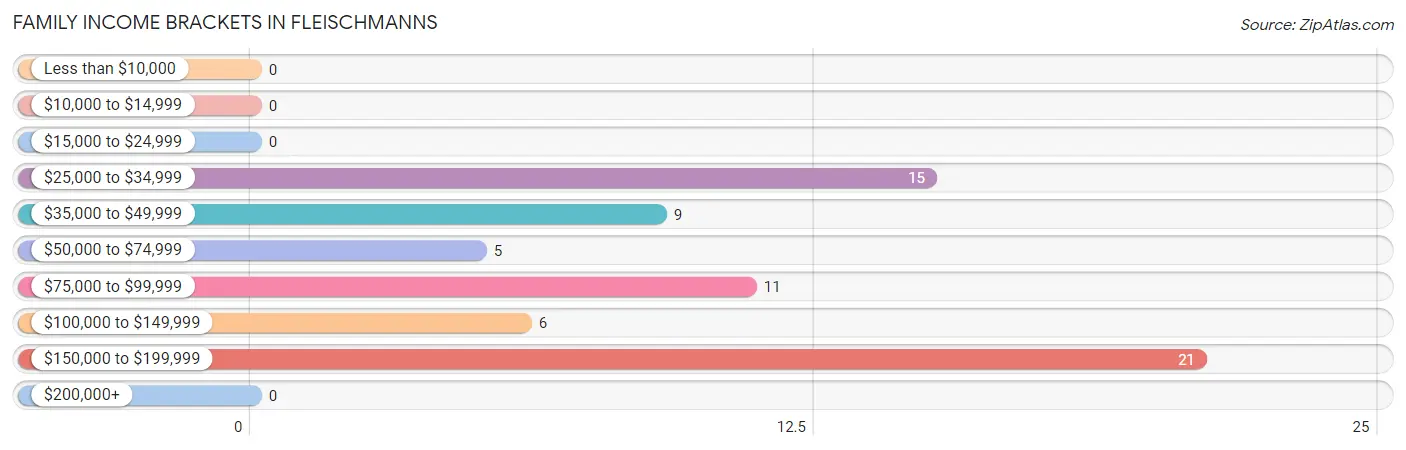
Family Income in Fleischmanns
Family Income Brackets in Fleischmanns
According to the Fleischmanns family income data, there are 21 families falling into the $150,000 to $199,999 income range, which is the most common income bracket and makes up 31.3% of all families.
| Income Bracket | # Families | % Families |
| Less than $10,000 | 0 | 0.0% |
| $10,000 to $14,999 | 0 | 0.0% |
| $15,000 to $24,999 | 0 | 0.0% |
| $25,000 to $34,999 | 15 | 22.4% |
| $35,000 to $49,999 | 9 | 13.4% |
| $50,000 to $74,999 | 5 | 7.5% |
| $75,000 to $99,999 | 11 | 16.4% |
| $100,000 to $149,999 | 6 | 9.0% |
| $150,000 to $199,999 | 21 | 31.3% |
| $200,000+ | 0 | 0.0% |
Family Income by Famaliy Size in Fleischmanns
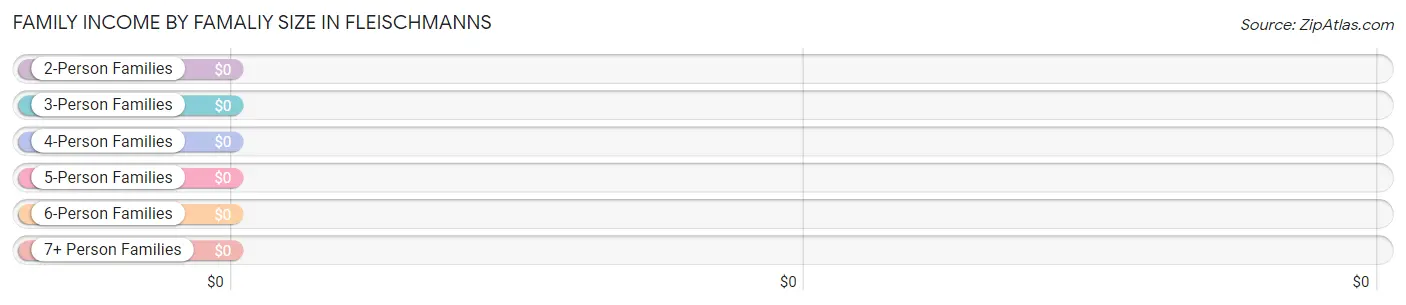
| Income Bracket | # Families | Median Income |
| 2-Person Families | 46 (68.7%) | $0 |
| 3-Person Families | 10 (14.9%) | $0 |
| 4-Person Families | 11 (16.4%) | $0 |
| 5-Person Families | 0 (0.0%) | $0 |
| 6-Person Families | 0 (0.0%) | $0 |
| 7+ Person Families | 0 (0.0%) | $0 |
| Total | 67 (100.0%) | $91,607 |
Family Income by Number of Earners in Fleischmanns
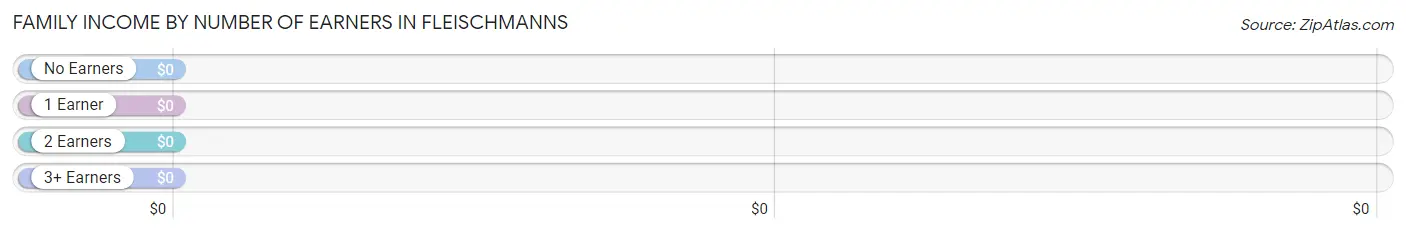
| Number of Earners | # Families | Median Income |
| No Earners | 16 (23.9%) | $0 |
| 1 Earner | 9 (13.4%) | $0 |
| 2 Earners | 35 (52.2%) | $0 |
| 3+ Earners | 7 (10.4%) | $0 |
| Total | 67 (100.0%) | $91,607 |
Household Income in Fleischmanns
Household Income Brackets in Fleischmanns
With 34 households falling in the category, the $50,000 to $74,999 income range is the most frequent in Fleischmanns, accounting for 31.2% of all households.
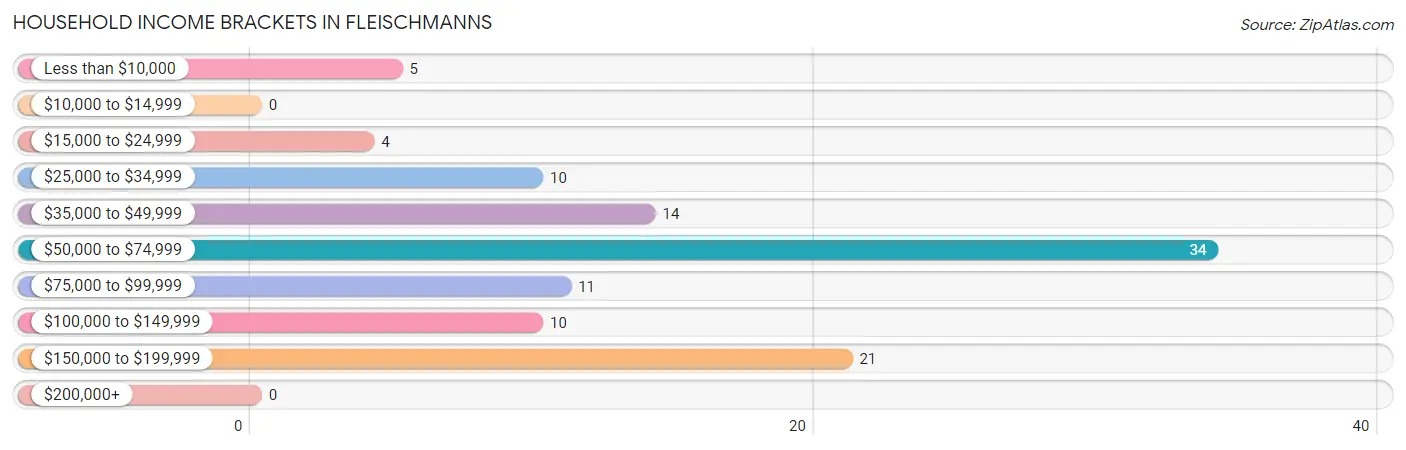
| Income Bracket | # Households | % Households |
| Less than $10,000 | 5 | 4.6% |
| $10,000 to $14,999 | 0 | 0.0% |
| $15,000 to $24,999 | 4 | 3.7% |
| $25,000 to $34,999 | 10 | 9.2% |
| $35,000 to $49,999 | 14 | 12.8% |
| $50,000 to $74,999 | 34 | 31.2% |
| $75,000 to $99,999 | 11 | 10.1% |
| $100,000 to $149,999 | 10 | 9.2% |
| $150,000 to $199,999 | 21 | 19.3% |
| $200,000+ | 0 | 0.0% |
Household Income by Householder Age in Fleischmanns
The median household income in Fleischmanns is $60,417, with the highest median household income of $54,250 found in the 45 to 64 years age bracket for the primary householder. A total of 62 households (56.9%) fall into this category.
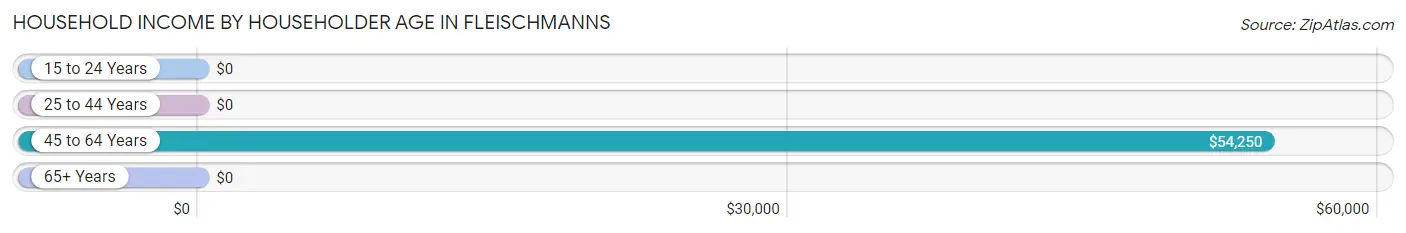
| Income Bracket | # Households | Median Income |
| 15 to 24 Years | 0 (0.0%) | $0 |
| 25 to 44 Years | 11 (10.1%) | $0 |
| 45 to 64 Years | 62 (56.9%) | $54,250 |
| 65+ Years | 36 (33.0%) | $0 |
| Total | 109 (100.0%) | $60,417 |
Poverty in Fleischmanns
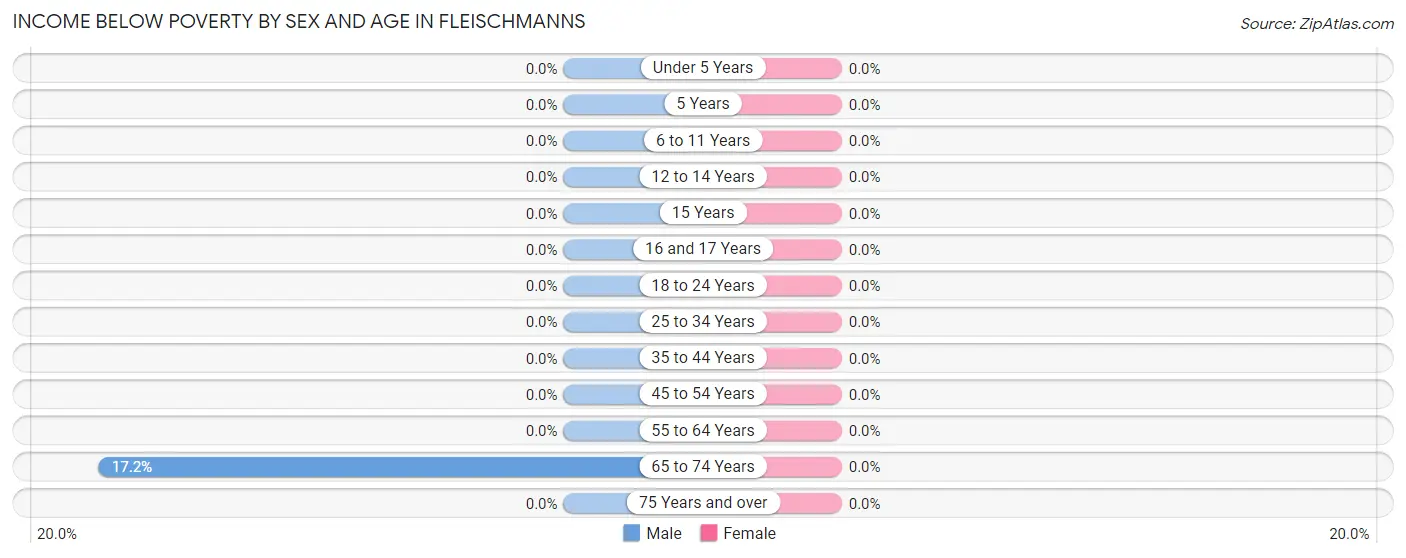
Income Below Poverty by Sex and Age in Fleischmanns
| Age Bracket | Male | Female |
| Under 5 Years | 0 (0.0%) | 0 (0.0%) |
| 5 Years | 0 (0.0%) | 0 (0.0%) |
| 6 to 11 Years | 0 (0.0%) | 0 (0.0%) |
| 12 to 14 Years | 0 (0.0%) | 0 (0.0%) |
| 15 Years | 0 (0.0%) | 0 (0.0%) |
| 16 and 17 Years | 0 (0.0%) | 0 (0.0%) |
| 18 to 24 Years | 0 (0.0%) | 0 (0.0%) |
| 25 to 34 Years | 0 (0.0%) | 0 (0.0%) |
| 35 to 44 Years | 0 (0.0%) | 0 (0.0%) |
| 45 to 54 Years | 0 (0.0%) | 0 (0.0%) |
| 55 to 64 Years | 0 (0.0%) | 0 (0.0%) |
| 65 to 74 Years | 5 (17.2%) | 0 (0.0%) |
| 75 Years and over | 0 (0.0%) | 0 (0.0%) |
| Total | 5 (3.6%) | 0 (0.0%) |
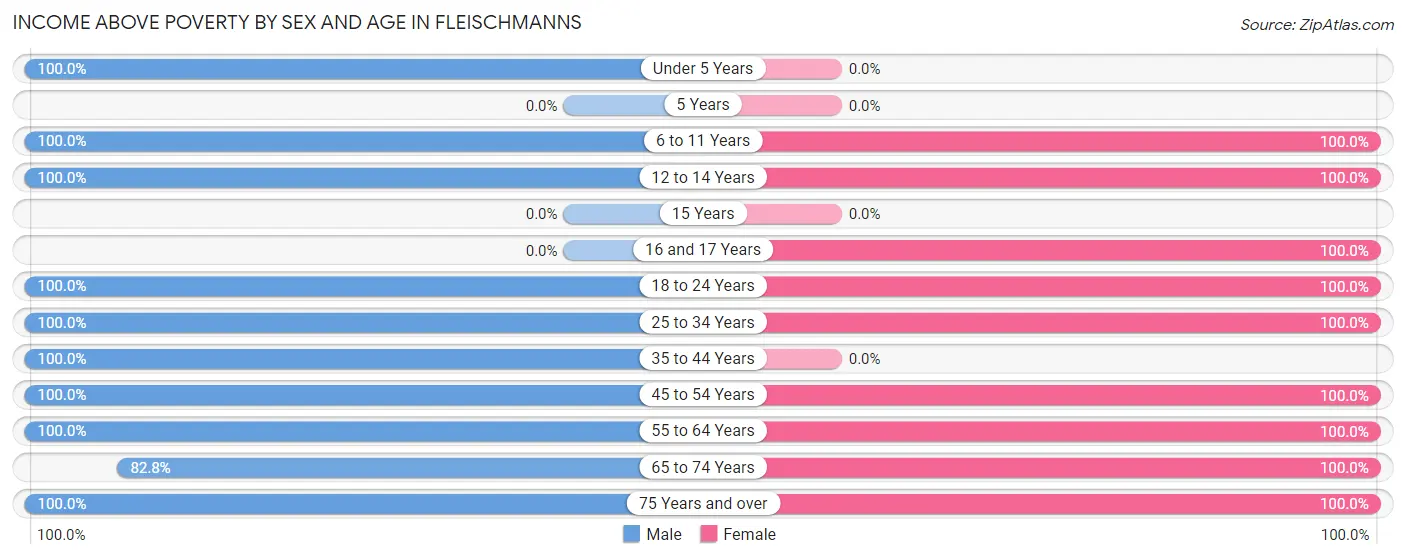
Income Above Poverty by Sex and Age in Fleischmanns
According to the poverty statistics in Fleischmanns, males aged under 5 years and females aged 6 to 11 years are the age groups that are most secure financially, with 100.0% of males and 100.0% of females in these age groups living above the poverty line.
| Age Bracket | Male | Female |
| Under 5 Years | 6 (100.0%) | 0 (0.0%) |
| 5 Years | 0 (0.0%) | 0 (0.0%) |
| 6 to 11 Years | 7 (100.0%) | 5 (100.0%) |
| 12 to 14 Years | 4 (100.0%) | 6 (100.0%) |
| 15 Years | 0 (0.0%) | 0 (0.0%) |
| 16 and 17 Years | 0 (0.0%) | 5 (100.0%) |
| 18 to 24 Years | 26 (100.0%) | 18 (100.0%) |
| 25 to 34 Years | 7 (100.0%) | 12 (100.0%) |
| 35 to 44 Years | 9 (100.0%) | 0 (0.0%) |
| 45 to 54 Years | 38 (100.0%) | 24 (100.0%) |
| 55 to 64 Years | 5 (100.0%) | 21 (100.0%) |
| 65 to 74 Years | 24 (82.8%) | 20 (100.0%) |
| 75 Years and over | 8 (100.0%) | 10 (100.0%) |
| Total | 134 (96.4%) | 121 (100.0%) |
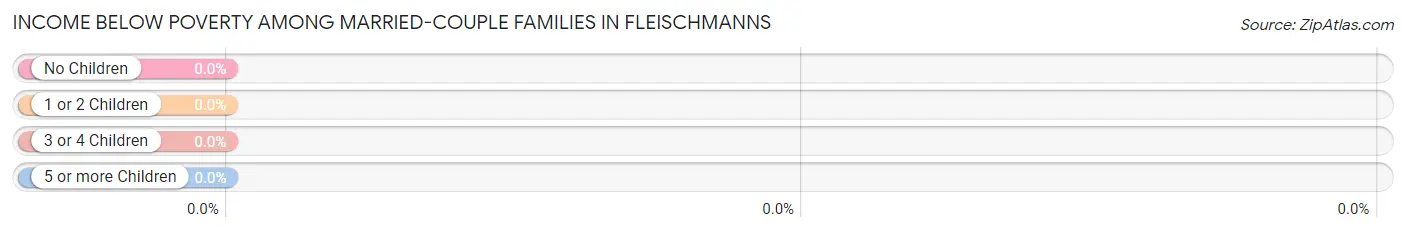
Income Below Poverty Among Married-Couple Families in Fleischmanns
| Children | Above Poverty | Below Poverty |
| No Children | 34 (100.0%) | 0 (0.0%) |
| 1 or 2 Children | 8 (100.0%) | 0 (0.0%) |
| 3 or 4 Children | 0 (0.0%) | 0 (0.0%) |
| 5 or more Children | 0 (0.0%) | 0 (0.0%) |
| Total | 42 (100.0%) | 0 (0.0%) |
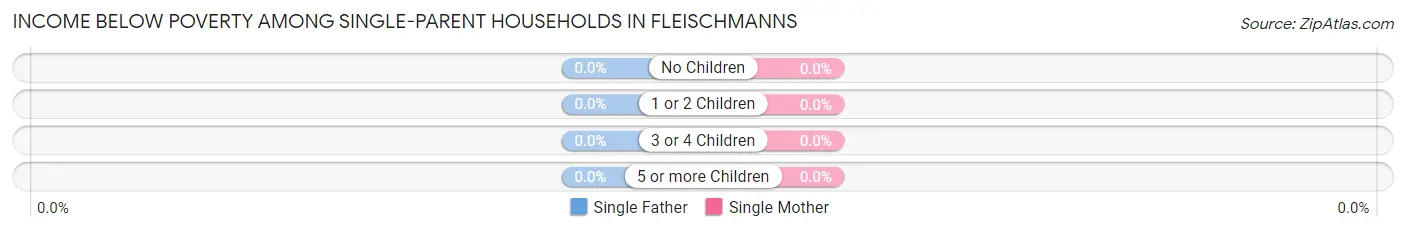
Income Below Poverty Among Single-Parent Households in Fleischmanns
| Children | Single Father | Single Mother |
| No Children | 0 (0.0%) | 0 (0.0%) |
| 1 or 2 Children | 0 (0.0%) | 0 (0.0%) |
| 3 or 4 Children | 0 (0.0%) | 0 (0.0%) |
| 5 or more Children | 0 (0.0%) | 0 (0.0%) |
| Total | 0 (0.0%) | 0 (0.0%) |
Income Below Poverty Among Married-Couple vs Single-Parent Households in Fleischmanns
| Children | Married-Couple Families | Single-Parent Households |
| No Children | 0 (0.0%) | 0 (0.0%) |
| 1 or 2 Children | 0 (0.0%) | 0 (0.0%) |
| 3 or 4 Children | 0 (0.0%) | 0 (0.0%) |
| 5 or more Children | 0 (0.0%) | 0 (0.0%) |
| Total | 0 (0.0%) | 0 (0.0%) |
Employment Characteristics in Fleischmanns
Employment by Class of Employer in Fleischmanns
Among the 150 employed individuals in Fleischmanns, private company employees (114 | 76.0%), local government employees (17 | 11.3%), and self-employed (not incorporated) (14 | 9.3%) make up the most common classes of employment.
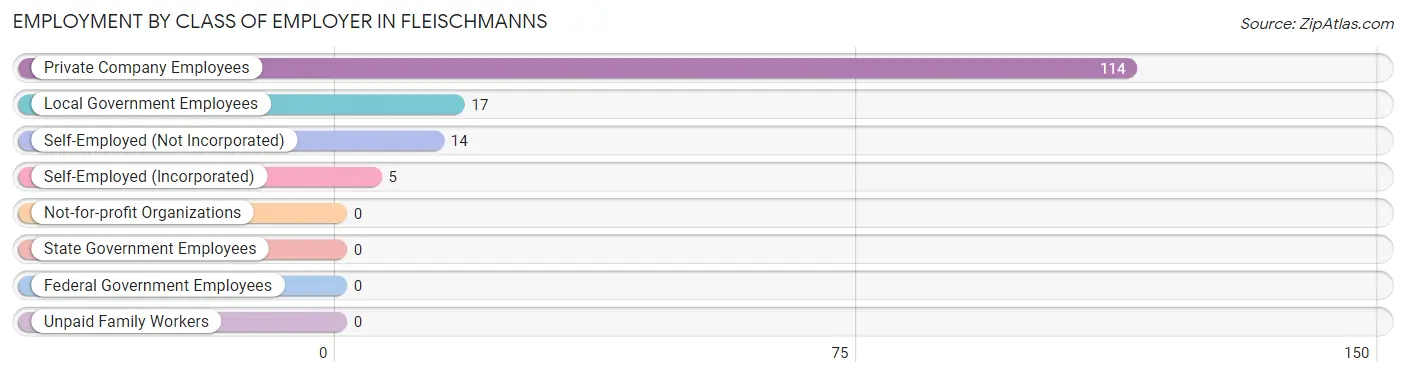
| Employer Class | # Employees | % Employees |
| Private Company Employees | 114 | 76.0% |
| Self-Employed (Incorporated) | 5 | 3.3% |
| Self-Employed (Not Incorporated) | 14 | 9.3% |
| Not-for-profit Organizations | 0 | 0.0% |
| Local Government Employees | 17 | 11.3% |
| State Government Employees | 0 | 0.0% |
| Federal Government Employees | 0 | 0.0% |
| Unpaid Family Workers | 0 | 0.0% |
| Total | 150 | 100.0% |
Employment Status by Age in Fleischmanns
According to the labor force statistics for Fleischmanns, out of the total population over 16 years of age (232), 67.2% or 156 individuals are in the labor force, with 3.8% or 6 of them unemployed. The age group with the highest labor force participation rate is 20 to 24 years, with 100.0% or 26 individuals in the labor force. Within the labor force, the 55 to 59 years age range has the highest percentage of unemployed individuals, with 37.5% or 6 of them being unemployed.
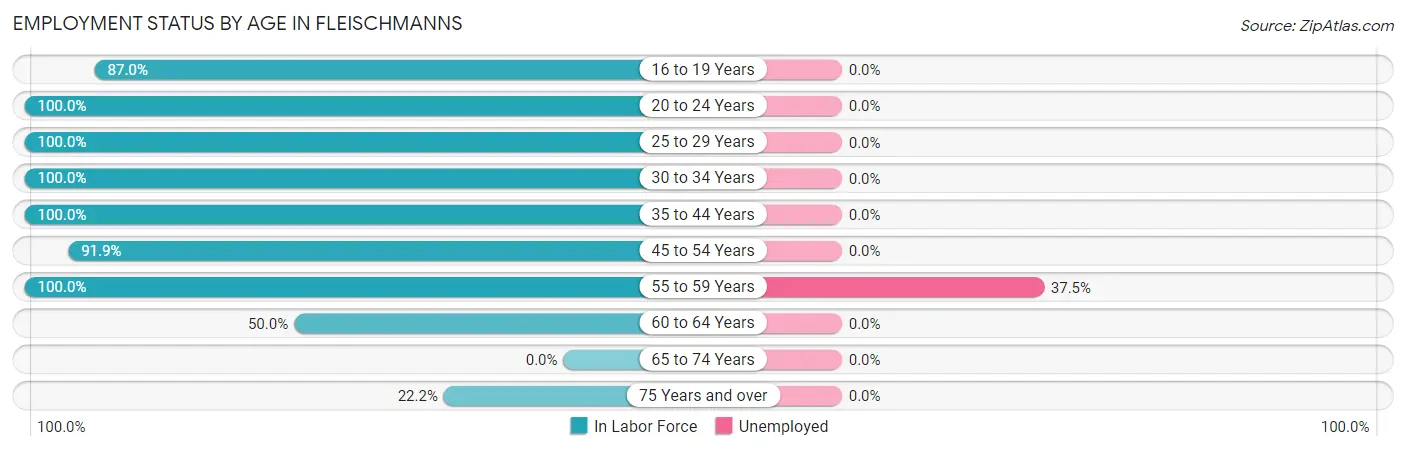
| Age Bracket | In Labor Force | Unemployed |
| 16 to 19 Years | 20 (87.0%) | 0 (0.0%) |
| 20 to 24 Years | 26 (100.0%) | 0 (0.0%) |
| 25 to 29 Years | 14 (100.0%) | 0 (0.0%) |
| 30 to 34 Years | 5 (100.0%) | 0 (0.0%) |
| 35 to 44 Years | 9 (100.0%) | 0 (0.0%) |
| 45 to 54 Years | 57 (91.9%) | 0 (0.0%) |
| 55 to 59 Years | 16 (100.0%) | 6 (37.5%) |
| 60 to 64 Years | 5 (50.0%) | 0 (0.0%) |
| 65 to 74 Years | 0 (0.0%) | 0 (0.0%) |
| 75 Years and over | 4 (22.2%) | 0 (0.0%) |
| Total | 156 (67.2%) | 6 (3.8%) |
Employment Status by Educational Attainment in Fleischmanns
According to labor force statistics for Fleischmanns, 91.4% of individuals (106) out of the total population between 25 and 64 years of age (116) are in the labor force, with 5.7% or 6 of them being unemployed. The group with the highest labor force participation rate are those with the educational attainment of less than high school, with 100.0% or 20 individuals in the labor force. Within the labor force, individuals with bachelor's degree or higher education have the highest percentage of unemployment, with 13.6% or 6 of them being unemployed.
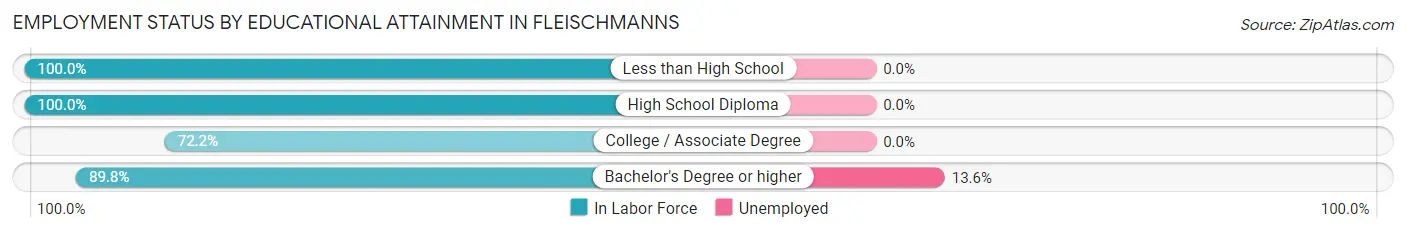
| Educational Attainment | In Labor Force | Unemployed |
| Less than High School | 20 (100.0%) | 0 (0.0%) |
| High School Diploma | 29 (100.0%) | 0 (0.0%) |
| College / Associate Degree | 13 (72.2%) | 0 (0.0%) |
| Bachelor's Degree or higher | 44 (89.8%) | 7 (13.6%) |
| Total | 106 (91.4%) | 7 (5.7%) |
Employment Occupations by Sex in Fleischmanns
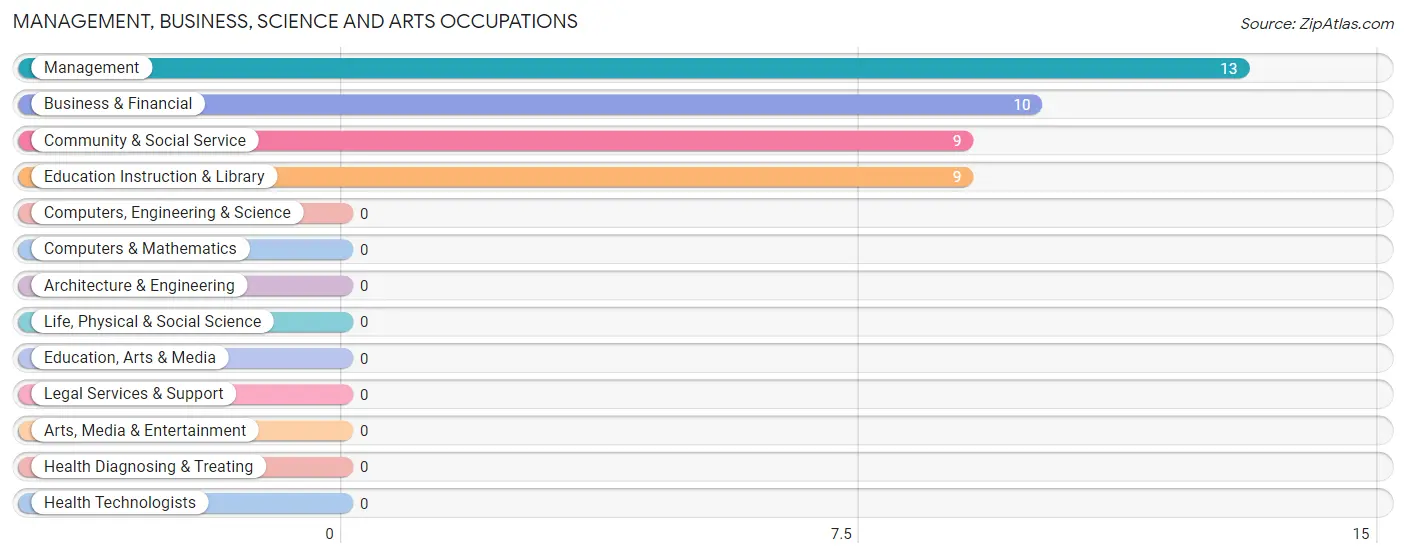
Management, Business, Science and Arts Occupations
The most common Management, Business, Science and Arts occupations in Fleischmanns are Management (13 | 8.7%), Business & Financial (10 | 6.7%), Community & Social Service (9 | 6.0%), and Education Instruction & Library (9 | 6.0%).
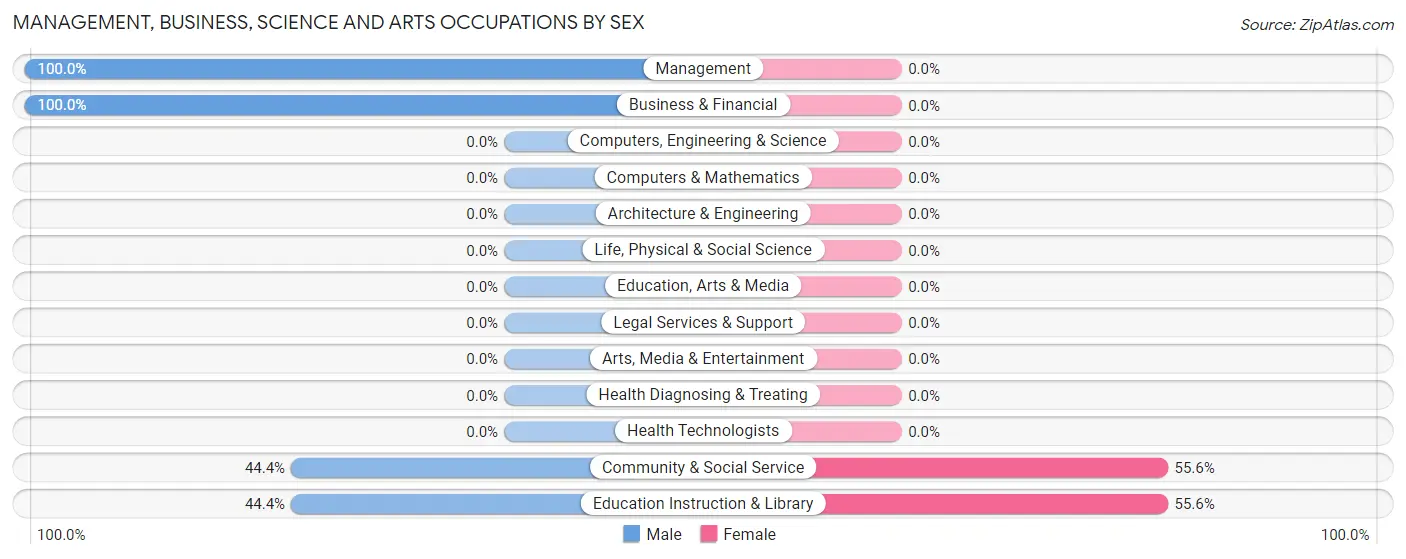
Management, Business, Science and Arts Occupations by Sex
Within the Management, Business, Science and Arts occupations in Fleischmanns, the most male-oriented occupations are Management (100.0%), Business & Financial (100.0%), and Community & Social Service (44.4%), while the most female-oriented occupations are Community & Social Service (55.6%), and Education Instruction & Library (55.6%).
| Occupation | Male | Female |
| Management | 13 (100.0%) | 0 (0.0%) |
| Business & Financial | 10 (100.0%) | 0 (0.0%) |
| Computers, Engineering & Science | 0 (0.0%) | 0 (0.0%) |
| Computers & Mathematics | 0 (0.0%) | 0 (0.0%) |
| Architecture & Engineering | 0 (0.0%) | 0 (0.0%) |
| Life, Physical & Social Science | 0 (0.0%) | 0 (0.0%) |
| Community & Social Service | 4 (44.4%) | 5 (55.6%) |
| Education, Arts & Media | 0 (0.0%) | 0 (0.0%) |
| Legal Services & Support | 0 (0.0%) | 0 (0.0%) |
| Education Instruction & Library | 4 (44.4%) | 5 (55.6%) |
| Arts, Media & Entertainment | 0 (0.0%) | 0 (0.0%) |
| Health Diagnosing & Treating | 0 (0.0%) | 0 (0.0%) |
| Health Technologists | 0 (0.0%) | 0 (0.0%) |
| Total (Category) | 27 (84.4%) | 5 (15.6%) |
| Total (Overall) | 89 (59.3%) | 61 (40.7%) |
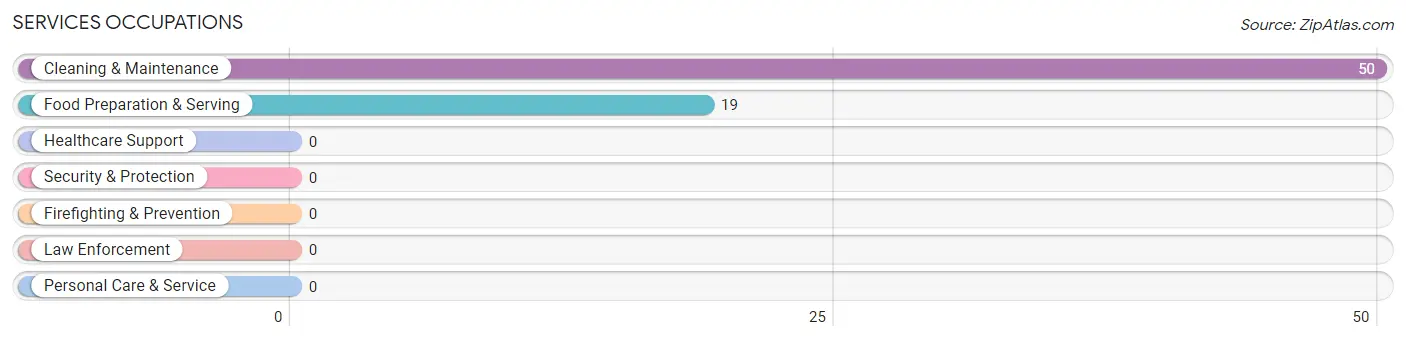
Services Occupations
The most common Services occupations in Fleischmanns are Cleaning & Maintenance (50 | 33.3%), and Food Preparation & Serving (19 | 12.7%).
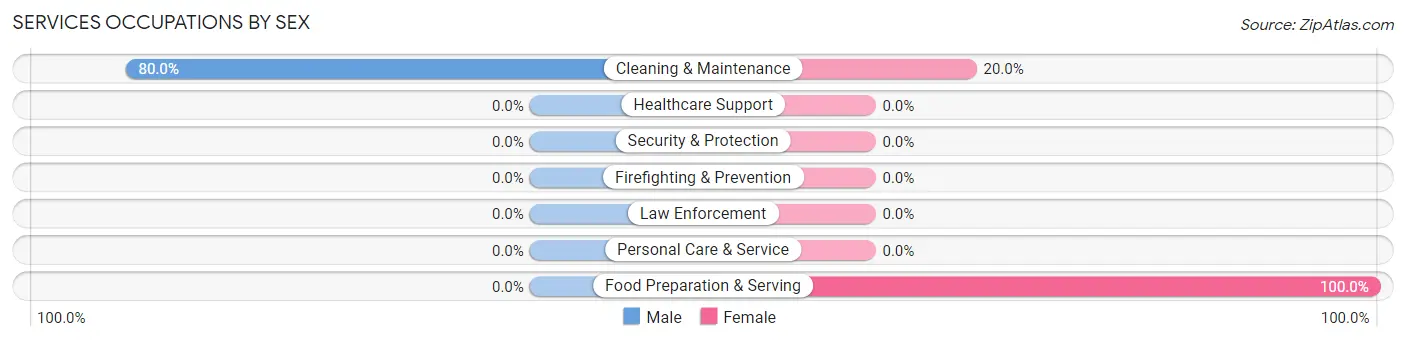
Services Occupations by Sex
| Occupation | Male | Female |
| Healthcare Support | 0 (0.0%) | 0 (0.0%) |
| Security & Protection | 0 (0.0%) | 0 (0.0%) |
| Firefighting & Prevention | 0 (0.0%) | 0 (0.0%) |
| Law Enforcement | 0 (0.0%) | 0 (0.0%) |
| Food Preparation & Serving | 0 (0.0%) | 19 (100.0%) |
| Cleaning & Maintenance | 40 (80.0%) | 10 (20.0%) |
| Personal Care & Service | 0 (0.0%) | 0 (0.0%) |
| Total (Category) | 40 (58.0%) | 29 (42.0%) |
| Total (Overall) | 89 (59.3%) | 61 (40.7%) |
Sales and Office Occupations
The most common Sales and Office occupations in Fleischmanns are Sales & Related (12 | 8.0%), and Office & Administration (11 | 7.3%).
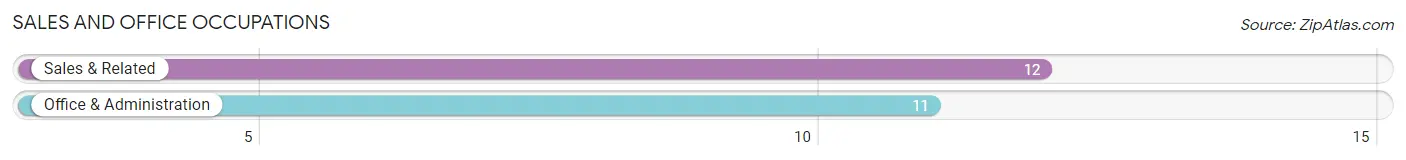
Sales and Office Occupations by Sex
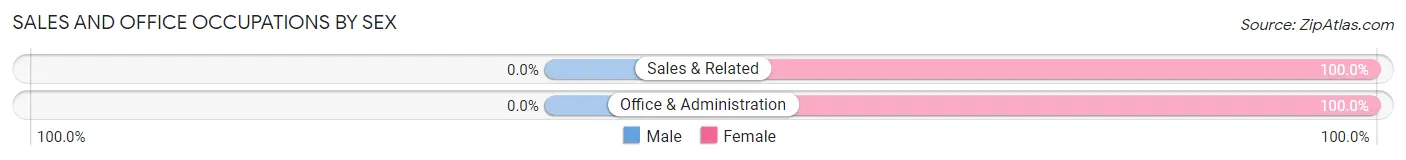
| Occupation | Male | Female |
| Sales & Related | 0 (0.0%) | 12 (100.0%) |
| Office & Administration | 0 (0.0%) | 11 (100.0%) |
| Total (Category) | 0 (0.0%) | 23 (100.0%) |
| Total (Overall) | 89 (59.3%) | 61 (40.7%) |
Natural Resources, Construction and Maintenance Occupations
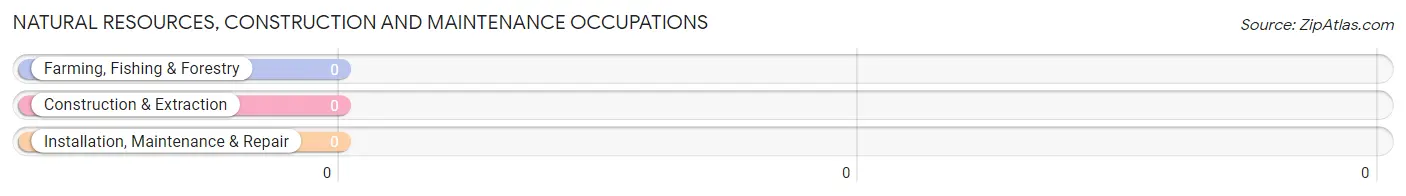
Natural Resources, Construction and Maintenance Occupations by Sex
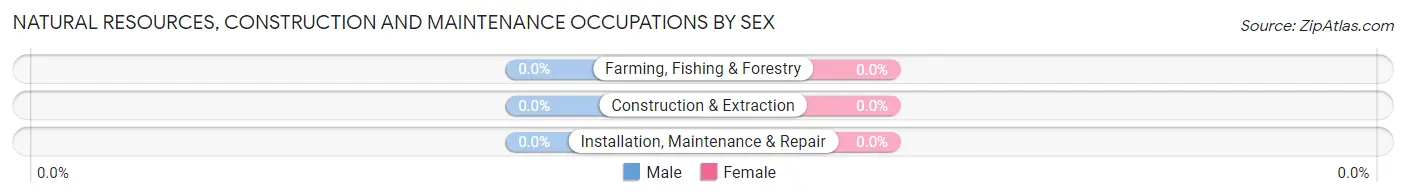
| Occupation | Male | Female |
| Farming, Fishing & Forestry | 0 (0.0%) | 0 (0.0%) |
| Construction & Extraction | 0 (0.0%) | 0 (0.0%) |
| Installation, Maintenance & Repair | 0 (0.0%) | 0 (0.0%) |
| Total (Category) | 0 (0.0%) | 0 (0.0%) |
| Total (Overall) | 89 (59.3%) | 61 (40.7%) |
Production, Transportation and Moving Occupations
The most common Production, Transportation and Moving occupations in Fleischmanns are , and Production (26 | 17.3%).
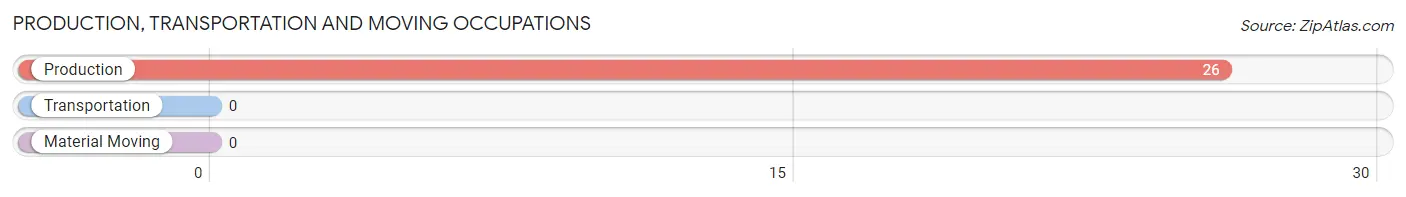
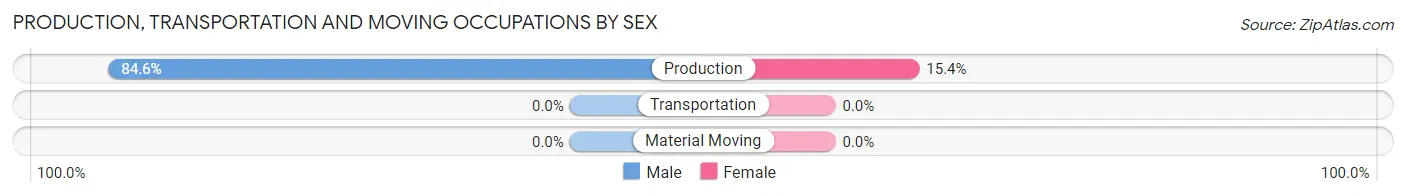
Production, Transportation and Moving Occupations by Sex
| Occupation | Male | Female |
| Production | 22 (84.6%) | 4 (15.4%) |
| Transportation | 0 (0.0%) | 0 (0.0%) |
| Material Moving | 0 (0.0%) | 0 (0.0%) |
| Total (Category) | 22 (84.6%) | 4 (15.4%) |
| Total (Overall) | 89 (59.3%) | 61 (40.7%) |
Employment Industries by Sex in Fleischmanns
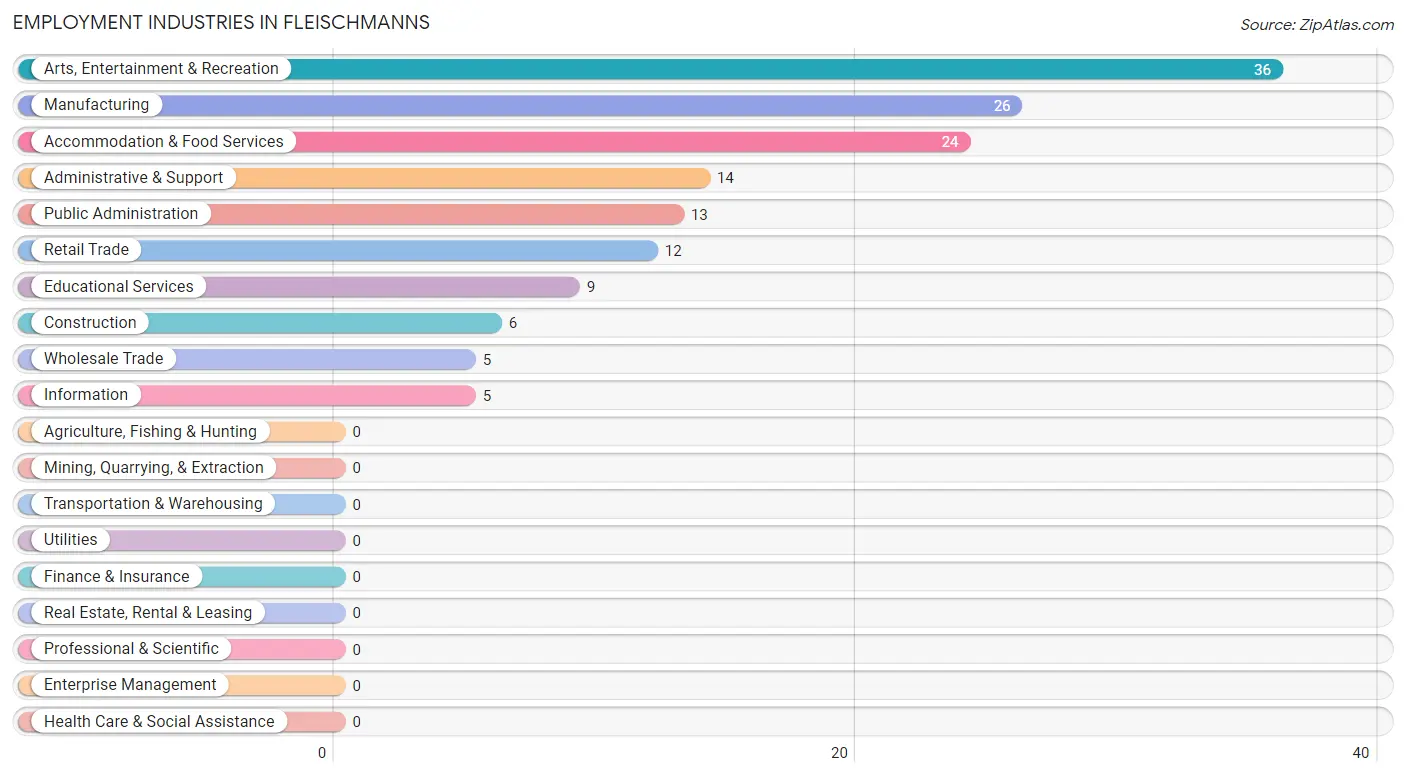
Employment Industries in Fleischmanns
The major employment industries in Fleischmanns include Arts, Entertainment & Recreation (36 | 24.0%), Manufacturing (26 | 17.3%), Accommodation & Food Services (24 | 16.0%), Administrative & Support (14 | 9.3%), and Public Administration (13 | 8.7%).
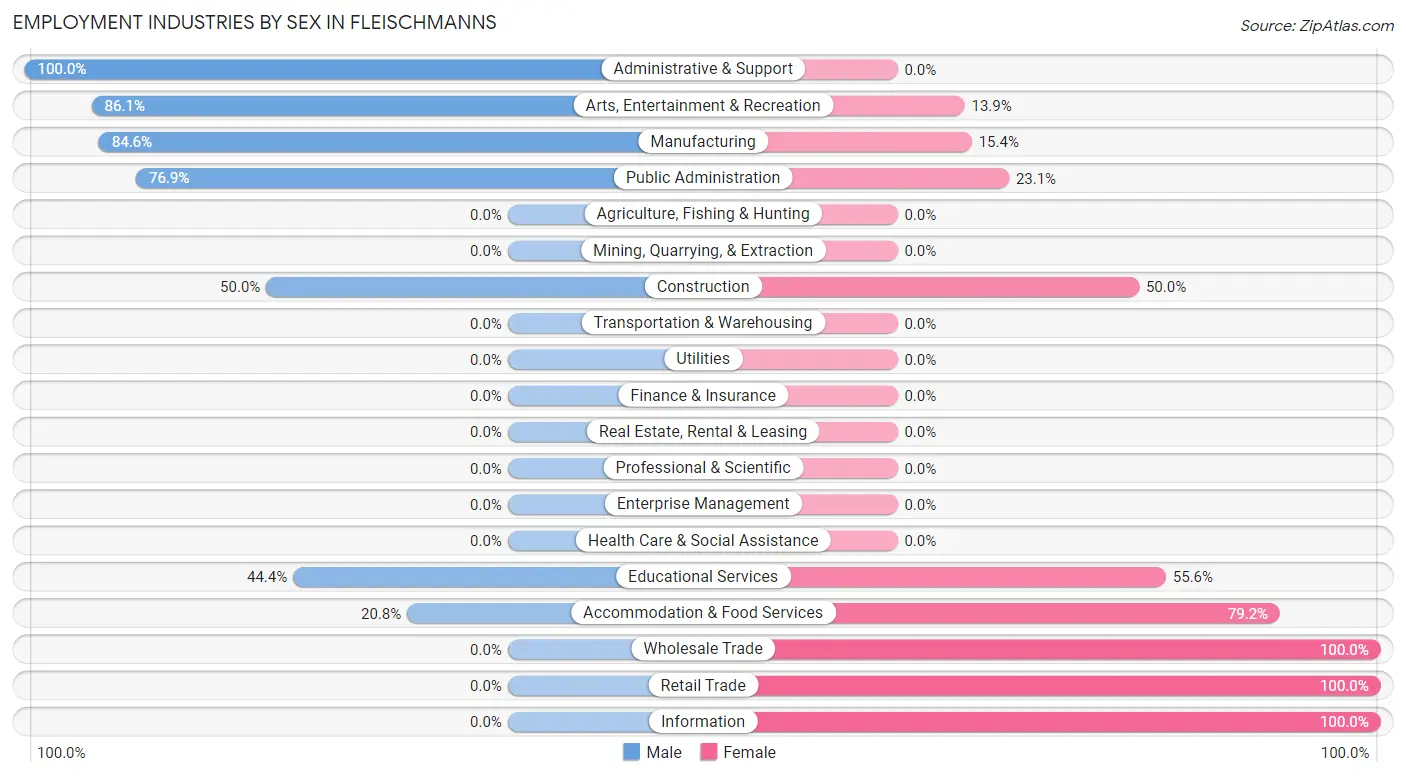
Employment Industries by Sex in Fleischmanns
The Fleischmanns industries that see more men than women are Administrative & Support (100.0%), Arts, Entertainment & Recreation (86.1%), and Manufacturing (84.6%), whereas the industries that tend to have a higher number of women are Wholesale Trade (100.0%), Retail Trade (100.0%), and Information (100.0%).
| Industry | Male | Female |
| Agriculture, Fishing & Hunting | 0 (0.0%) | 0 (0.0%) |
| Mining, Quarrying, & Extraction | 0 (0.0%) | 0 (0.0%) |
| Construction | 3 (50.0%) | 3 (50.0%) |
| Manufacturing | 22 (84.6%) | 4 (15.4%) |
| Wholesale Trade | 0 (0.0%) | 5 (100.0%) |
| Retail Trade | 0 (0.0%) | 12 (100.0%) |
| Transportation & Warehousing | 0 (0.0%) | 0 (0.0%) |
| Utilities | 0 (0.0%) | 0 (0.0%) |
| Information | 0 (0.0%) | 5 (100.0%) |
| Finance & Insurance | 0 (0.0%) | 0 (0.0%) |
| Real Estate, Rental & Leasing | 0 (0.0%) | 0 (0.0%) |
| Professional & Scientific | 0 (0.0%) | 0 (0.0%) |
| Enterprise Management | 0 (0.0%) | 0 (0.0%) |
| Administrative & Support | 14 (100.0%) | 0 (0.0%) |
| Educational Services | 4 (44.4%) | 5 (55.6%) |
| Health Care & Social Assistance | 0 (0.0%) | 0 (0.0%) |
| Arts, Entertainment & Recreation | 31 (86.1%) | 5 (13.9%) |
| Accommodation & Food Services | 5 (20.8%) | 19 (79.2%) |
| Public Administration | 10 (76.9%) | 3 (23.1%) |
| Total | 89 (59.3%) | 61 (40.7%) |
Education in Fleischmanns
School Enrollment in Fleischmanns
The most common levels of schooling among the 30 students in Fleischmanns are middle school (14 | 46.7%), elementary school (5 | 16.7%), and high school (5 | 16.7%).
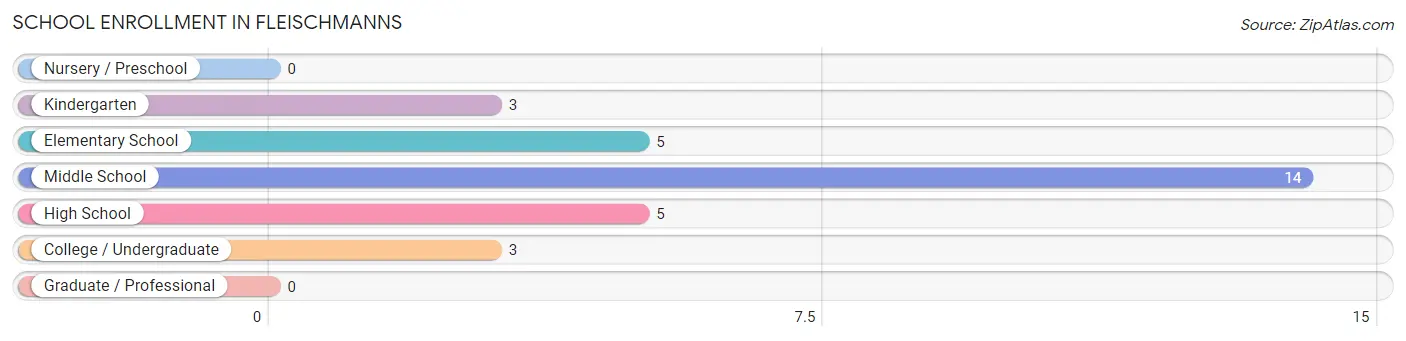
| School Level | # Students | % Students |
| Nursery / Preschool | 0 | 0.0% |
| Kindergarten | 3 | 10.0% |
| Elementary School | 5 | 16.7% |
| Middle School | 14 | 46.7% |
| High School | 5 | 16.7% |
| College / Undergraduate | 3 | 10.0% |
| Graduate / Professional | 0 | 0.0% |
| Total | 30 | 100.0% |
School Enrollment by Age by Funding Source in Fleischmanns
Out of a total of 30 students who are enrolled in schools in Fleischmanns, 9 (30.0%) attend a private institution, while the remaining 21 (70.0%) are enrolled in public schools. The age group of 5 to 9 year old has the highest likelihood of being enrolled in private schools, with 5 (62.5% in the age bracket) enrolled. Conversely, the age group of 15 to 17 year olds has the lowest likelihood of being enrolled in a private school, with 5 (100.0% in the age bracket) attending a public institution.
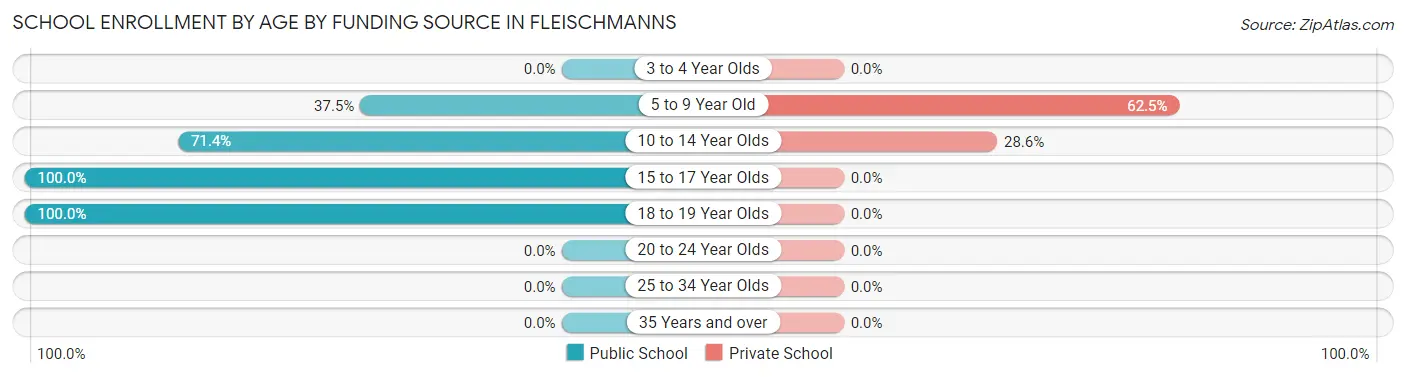
| Age Bracket | Public School | Private School |
| 3 to 4 Year Olds | 0 (0.0%) | 0 (0.0%) |
| 5 to 9 Year Old | 3 (37.5%) | 5 (62.5%) |
| 10 to 14 Year Olds | 10 (71.4%) | 4 (28.6%) |
| 15 to 17 Year Olds | 5 (100.0%) | 0 (0.0%) |
| 18 to 19 Year Olds | 3 (100.0%) | 0 (0.0%) |
| 20 to 24 Year Olds | 0 (0.0%) | 0 (0.0%) |
| 25 to 34 Year Olds | 0 (0.0%) | 0 (0.0%) |
| 35 Years and over | 0 (0.0%) | 0 (0.0%) |
| Total | 21 (70.0%) | 9 (30.0%) |
Educational Attainment by Field of Study in Fleischmanns
Visual & performing arts (29 | 27.1%), literature & languages (19 | 17.8%), social sciences (11 | 10.3%), education (11 | 10.3%), and physical & health sciences (10 | 9.3%) are the most common fields of study among 107 individuals in Fleischmanns who have obtained a bachelor's degree or higher.
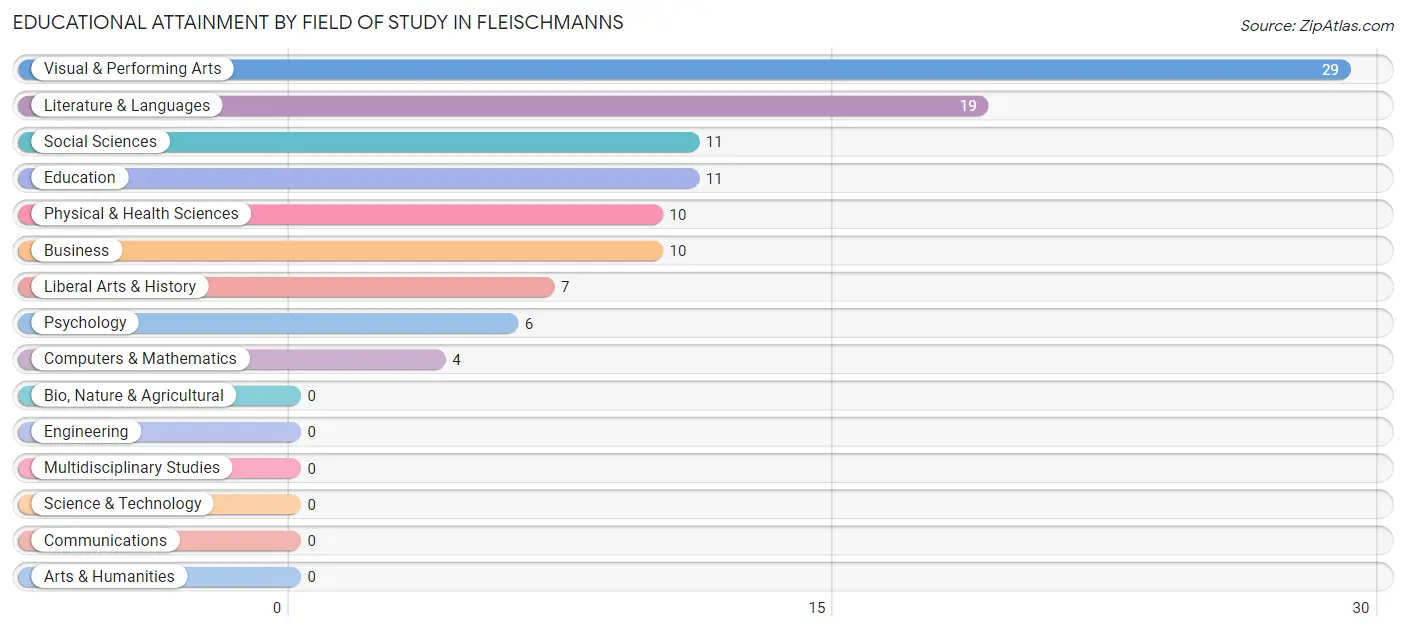
| Field of Study | # Graduates | % Graduates |
| Computers & Mathematics | 4 | 3.7% |
| Bio, Nature & Agricultural | 0 | 0.0% |
| Physical & Health Sciences | 10 | 9.3% |
| Psychology | 6 | 5.6% |
| Social Sciences | 11 | 10.3% |
| Engineering | 0 | 0.0% |
| Multidisciplinary Studies | 0 | 0.0% |
| Science & Technology | 0 | 0.0% |
| Business | 10 | 9.3% |
| Education | 11 | 10.3% |
| Literature & Languages | 19 | 17.8% |
| Liberal Arts & History | 7 | 6.5% |
| Visual & Performing Arts | 29 | 27.1% |
| Communications | 0 | 0.0% |
| Arts & Humanities | 0 | 0.0% |
| Total | 107 | 100.0% |
Transportation & Commute in Fleischmanns
Vehicle Availability by Sex in Fleischmanns
The most prevalent vehicle ownership categories in Fleischmanns are males with 1 vehicle (30, accounting for 33.7%) and females with 1 vehicle (10, making up 49.2%).
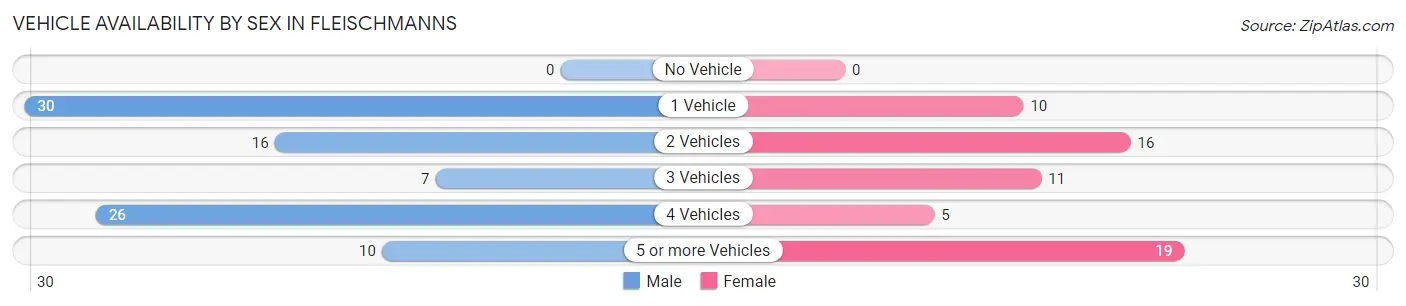
| Vehicles Available | Male | Female |
| No Vehicle | 0 (0.0%) | 0 (0.0%) |
| 1 Vehicle | 30 (33.7%) | 10 (16.4%) |
| 2 Vehicles | 16 (18.0%) | 16 (26.2%) |
| 3 Vehicles | 7 (7.9%) | 11 (18.0%) |
| 4 Vehicles | 26 (29.2%) | 5 (8.2%) |
| 5 or more Vehicles | 10 (11.2%) | 19 (31.1%) |
| Total | 89 (100.0%) | 61 (100.0%) |
Commute Time in Fleischmanns
The most frequently occuring commute durations in Fleischmanns are 5 to 9 minutes (48 commuters, 35.8%), 15 to 19 minutes (23 commuters, 17.2%), and 10 to 14 minutes (22 commuters, 16.4%).
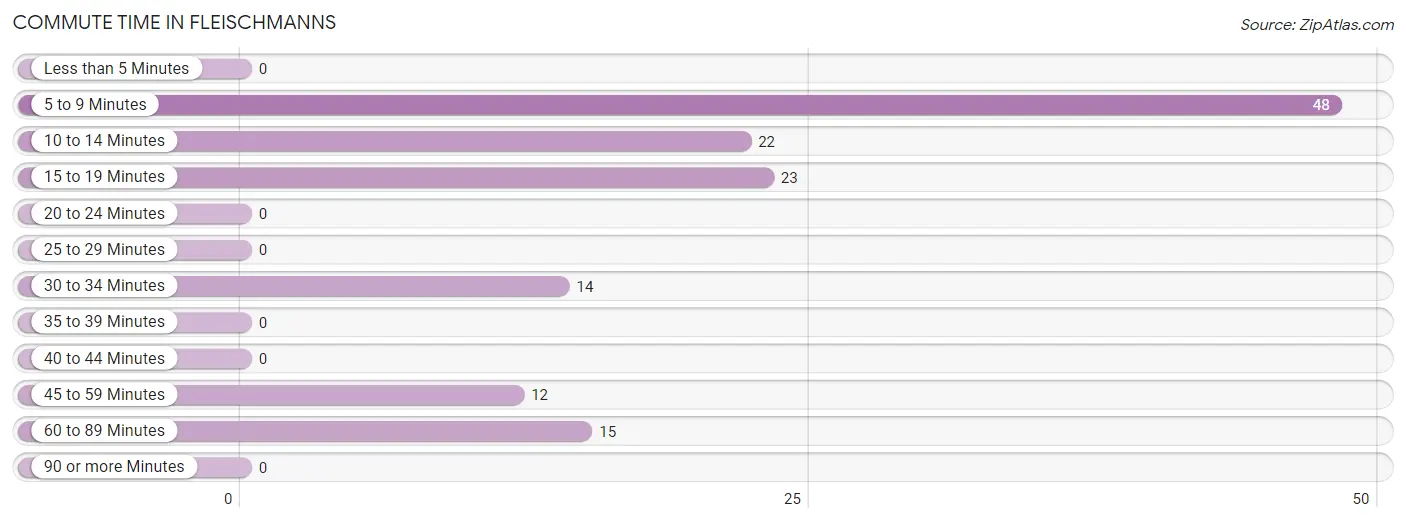
| Commute Time | # Commuters | % Commuters |
| Less than 5 Minutes | 0 | 0.0% |
| 5 to 9 Minutes | 48 | 35.8% |
| 10 to 14 Minutes | 22 | 16.4% |
| 15 to 19 Minutes | 23 | 17.2% |
| 20 to 24 Minutes | 0 | 0.0% |
| 25 to 29 Minutes | 0 | 0.0% |
| 30 to 34 Minutes | 14 | 10.4% |
| 35 to 39 Minutes | 0 | 0.0% |
| 40 to 44 Minutes | 0 | 0.0% |
| 45 to 59 Minutes | 12 | 9.0% |
| 60 to 89 Minutes | 15 | 11.2% |
| 90 or more Minutes | 0 | 0.0% |
Commute Time by Sex in Fleischmanns
The most common commute times in Fleischmanns are 5 to 9 minutes (31 commuters, 40.8%) for males and 15 to 19 minutes (23 commuters, 39.7%) for females.
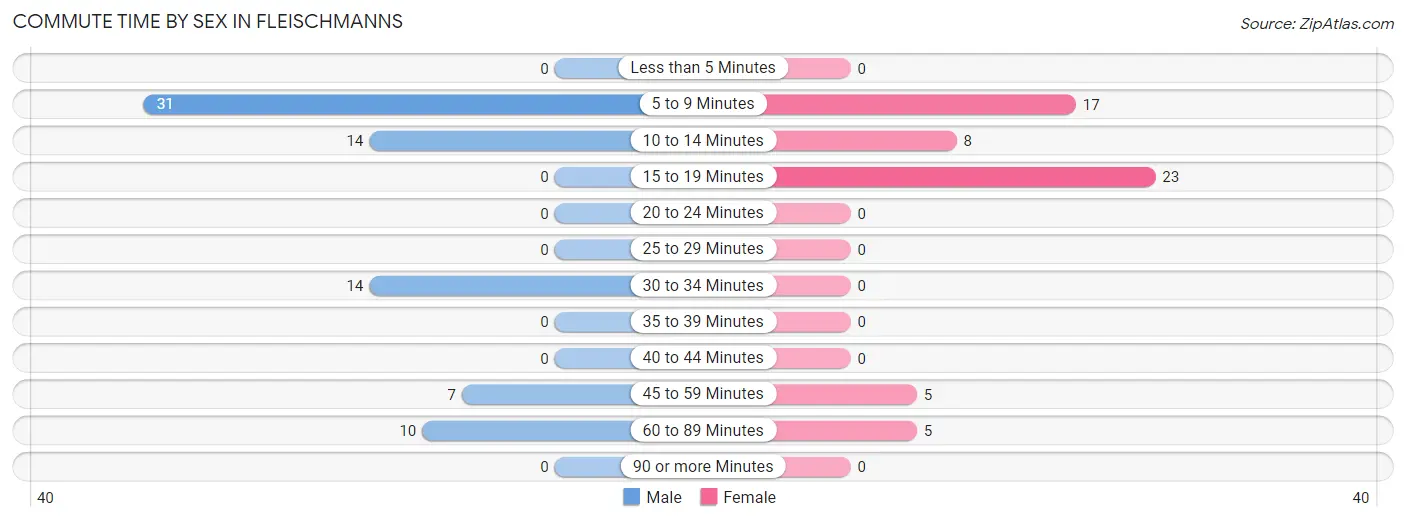
| Commute Time | Male | Female |
| Less than 5 Minutes | 0 (0.0%) | 0 (0.0%) |
| 5 to 9 Minutes | 31 (40.8%) | 17 (29.3%) |
| 10 to 14 Minutes | 14 (18.4%) | 8 (13.8%) |
| 15 to 19 Minutes | 0 (0.0%) | 23 (39.7%) |
| 20 to 24 Minutes | 0 (0.0%) | 0 (0.0%) |
| 25 to 29 Minutes | 0 (0.0%) | 0 (0.0%) |
| 30 to 34 Minutes | 14 (18.4%) | 0 (0.0%) |
| 35 to 39 Minutes | 0 (0.0%) | 0 (0.0%) |
| 40 to 44 Minutes | 0 (0.0%) | 0 (0.0%) |
| 45 to 59 Minutes | 7 (9.2%) | 5 (8.6%) |
| 60 to 89 Minutes | 10 (13.2%) | 5 (8.6%) |
| 90 or more Minutes | 0 (0.0%) | 0 (0.0%) |
Time of Departure to Work by Sex in Fleischmanns
The most frequent times of departure to work in Fleischmanns are 6:30 AM to 6:59 AM (26, 34.2%) for males and 7:00 AM to 7:29 AM (17, 29.3%) for females.
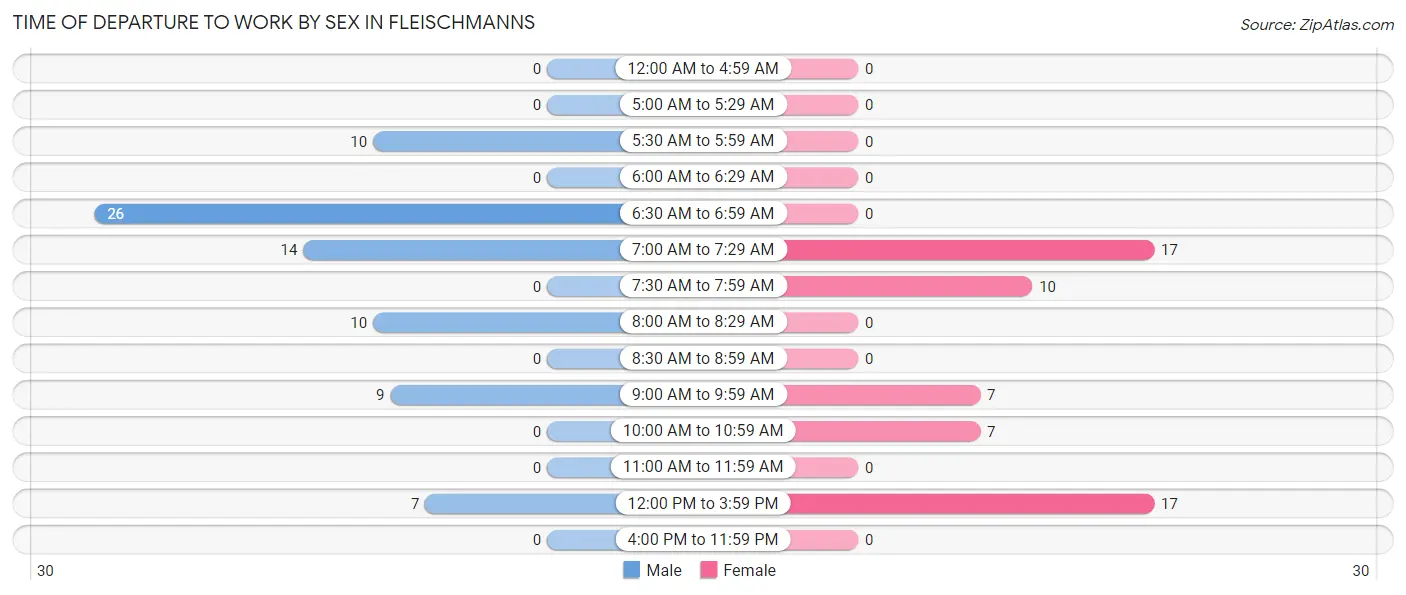
| Time of Departure | Male | Female |
| 12:00 AM to 4:59 AM | 0 (0.0%) | 0 (0.0%) |
| 5:00 AM to 5:29 AM | 0 (0.0%) | 0 (0.0%) |
| 5:30 AM to 5:59 AM | 10 (13.2%) | 0 (0.0%) |
| 6:00 AM to 6:29 AM | 0 (0.0%) | 0 (0.0%) |
| 6:30 AM to 6:59 AM | 26 (34.2%) | 0 (0.0%) |
| 7:00 AM to 7:29 AM | 14 (18.4%) | 17 (29.3%) |
| 7:30 AM to 7:59 AM | 0 (0.0%) | 10 (17.2%) |
| 8:00 AM to 8:29 AM | 10 (13.2%) | 0 (0.0%) |
| 8:30 AM to 8:59 AM | 0 (0.0%) | 0 (0.0%) |
| 9:00 AM to 9:59 AM | 9 (11.8%) | 7 (12.1%) |
| 10:00 AM to 10:59 AM | 0 (0.0%) | 7 (12.1%) |
| 11:00 AM to 11:59 AM | 0 (0.0%) | 0 (0.0%) |
| 12:00 PM to 3:59 PM | 7 (9.2%) | 17 (29.3%) |
| 4:00 PM to 11:59 PM | 0 (0.0%) | 0 (0.0%) |
| Total | 76 (100.0%) | 58 (100.0%) |
Housing Occupancy in Fleischmanns
Occupancy by Ownership in Fleischmanns
Of the total 109 dwellings in Fleischmanns, owner-occupied units account for 73 (67.0%), while renter-occupied units make up 36 (33.0%).
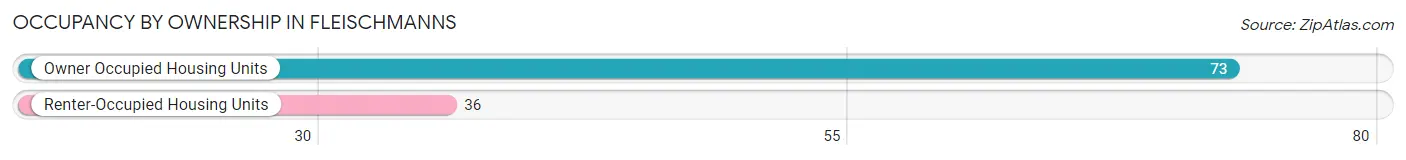
| Occupancy | # Housing Units | % Housing Units |
| Owner Occupied Housing Units | 73 | 67.0% |
| Renter-Occupied Housing Units | 36 | 33.0% |
| Total Occupied Housing Units | 109 | 100.0% |
Occupancy by Household Size in Fleischmanns
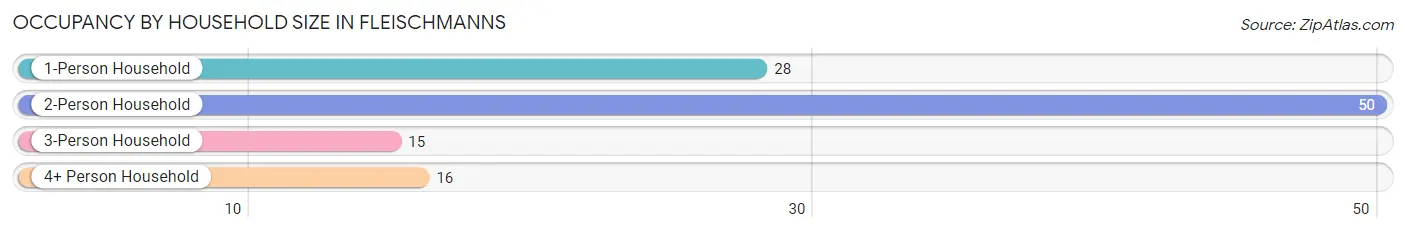
| Household Size | # Housing Units | % Housing Units |
| 1-Person Household | 28 | 25.7% |
| 2-Person Household | 50 | 45.9% |
| 3-Person Household | 15 | 13.8% |
| 4+ Person Household | 16 | 14.7% |
| Total Housing Units | 109 | 100.0% |
Occupancy by Ownership by Household Size in Fleischmanns
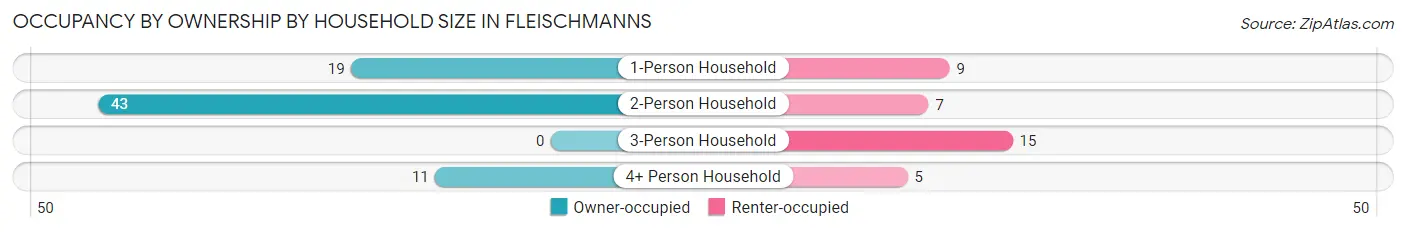
| Household Size | Owner-occupied | Renter-occupied |
| 1-Person Household | 19 (67.9%) | 9 (32.1%) |
| 2-Person Household | 43 (86.0%) | 7 (14.0%) |
| 3-Person Household | 0 (0.0%) | 15 (100.0%) |
| 4+ Person Household | 11 (68.8%) | 5 (31.2%) |
| Total Housing Units | 73 (67.0%) | 36 (33.0%) |
Occupancy by Educational Attainment in Fleischmanns
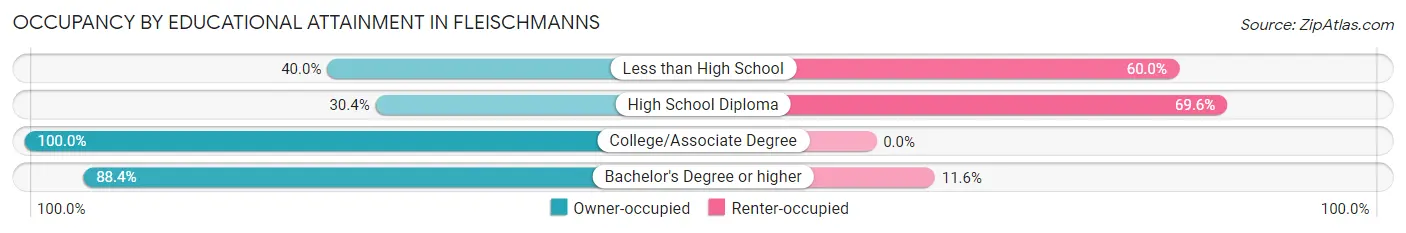
| Household Size | Owner-occupied | Renter-occupied |
| Less than High School | 10 (40.0%) | 15 (60.0%) |
| High School Diploma | 7 (30.4%) | 16 (69.6%) |
| College/Associate Degree | 18 (100.0%) | 0 (0.0%) |
| Bachelor's Degree or higher | 38 (88.4%) | 5 (11.6%) |
Occupancy by Age of Householder in Fleischmanns
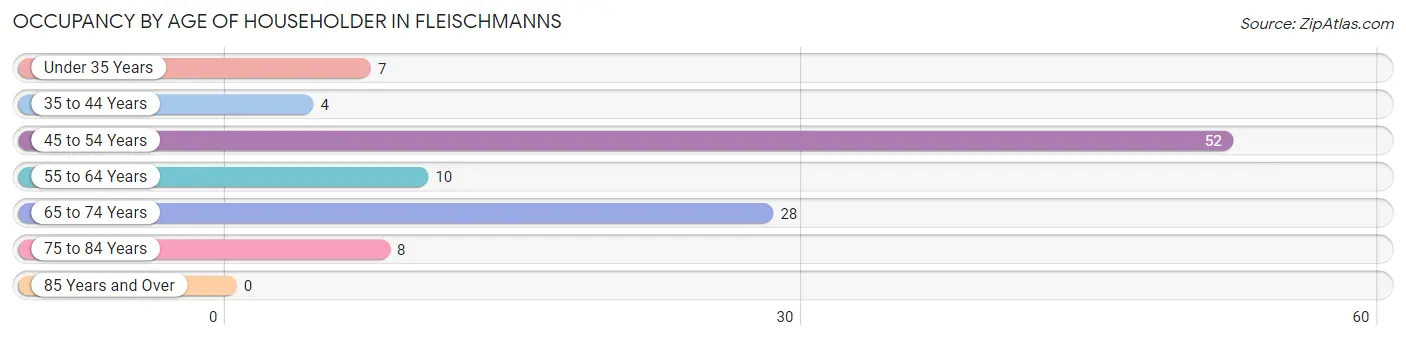
| Age Bracket | # Households | % Households |
| Under 35 Years | 7 | 6.4% |
| 35 to 44 Years | 4 | 3.7% |
| 45 to 54 Years | 52 | 47.7% |
| 55 to 64 Years | 10 | 9.2% |
| 65 to 74 Years | 28 | 25.7% |
| 75 to 84 Years | 8 | 7.3% |
| 85 Years and Over | 0 | 0.0% |
| Total | 109 | 100.0% |
Housing Finances in Fleischmanns
Median Income by Occupancy in Fleischmanns
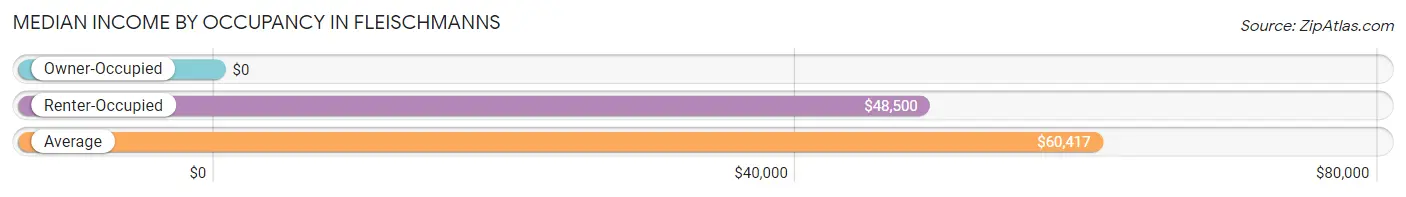
| Occupancy Type | # Households | Median Income |
| Owner-Occupied | 73 (67.0%) | $0 |
| Renter-Occupied | 36 (33.0%) | $48,500 |
| Average | 109 (100.0%) | $60,417 |
Occupancy by Householder Income Bracket in Fleischmanns
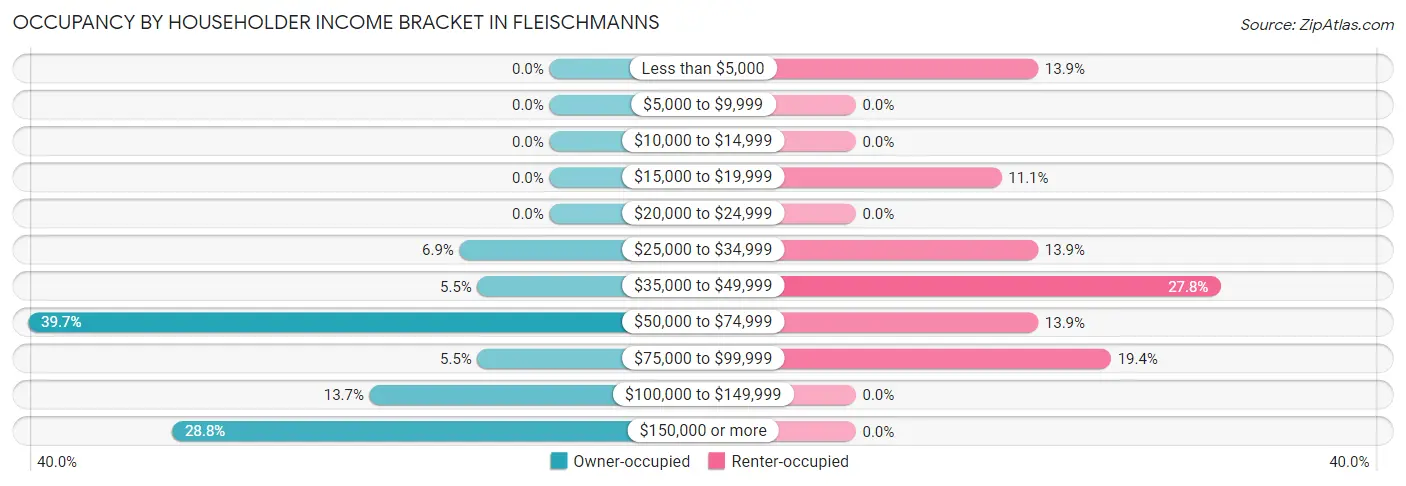
| Income Bracket | Owner-occupied | Renter-occupied |
| Less than $5,000 | 0 (0.0%) | 5 (13.9%) |
| $5,000 to $9,999 | 0 (0.0%) | 0 (0.0%) |
| $10,000 to $14,999 | 0 (0.0%) | 0 (0.0%) |
| $15,000 to $19,999 | 0 (0.0%) | 4 (11.1%) |
| $20,000 to $24,999 | 0 (0.0%) | 0 (0.0%) |
| $25,000 to $34,999 | 5 (6.9%) | 5 (13.9%) |
| $35,000 to $49,999 | 4 (5.5%) | 10 (27.8%) |
| $50,000 to $74,999 | 29 (39.7%) | 5 (13.9%) |
| $75,000 to $99,999 | 4 (5.5%) | 7 (19.4%) |
| $100,000 to $149,999 | 10 (13.7%) | 0 (0.0%) |
| $150,000 or more | 21 (28.8%) | 0 (0.0%) |
| Total | 73 (100.0%) | 36 (100.0%) |
Monthly Housing Cost Tiers in Fleischmanns
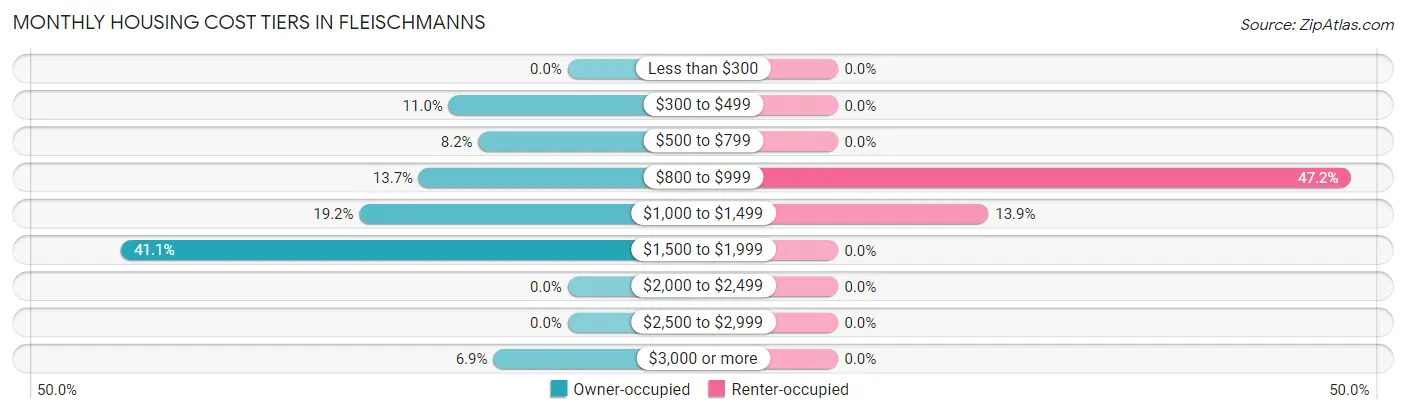
| Monthly Cost | Owner-occupied | Renter-occupied |
| Less than $300 | 0 (0.0%) | 0 (0.0%) |
| $300 to $499 | 8 (11.0%) | 0 (0.0%) |
| $500 to $799 | 6 (8.2%) | 0 (0.0%) |
| $800 to $999 | 10 (13.7%) | 17 (47.2%) |
| $1,000 to $1,499 | 14 (19.2%) | 5 (13.9%) |
| $1,500 to $1,999 | 30 (41.1%) | 0 (0.0%) |
| $2,000 to $2,499 | 0 (0.0%) | 0 (0.0%) |
| $2,500 to $2,999 | 0 (0.0%) | 0 (0.0%) |
| $3,000 or more | 5 (6.9%) | 0 (0.0%) |
| Total | 73 (100.0%) | 36 (100.0%) |
Physical Housing Characteristics in Fleischmanns
Housing Structures in Fleischmanns
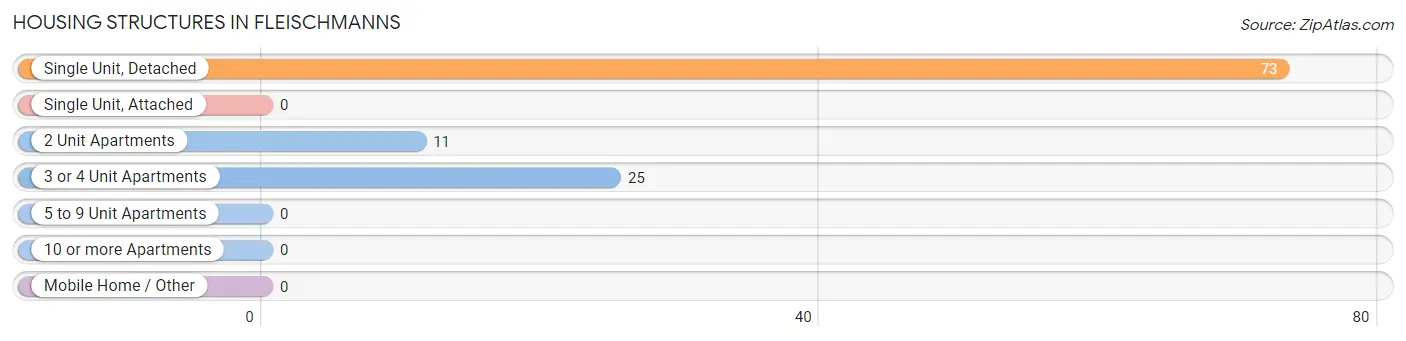
| Structure Type | # Housing Units | % Housing Units |
| Single Unit, Detached | 73 | 67.0% |
| Single Unit, Attached | 0 | 0.0% |
| 2 Unit Apartments | 11 | 10.1% |
| 3 or 4 Unit Apartments | 25 | 22.9% |
| 5 to 9 Unit Apartments | 0 | 0.0% |
| 10 or more Apartments | 0 | 0.0% |
| Mobile Home / Other | 0 | 0.0% |
| Total | 109 | 100.0% |
Housing Structures by Occupancy in Fleischmanns
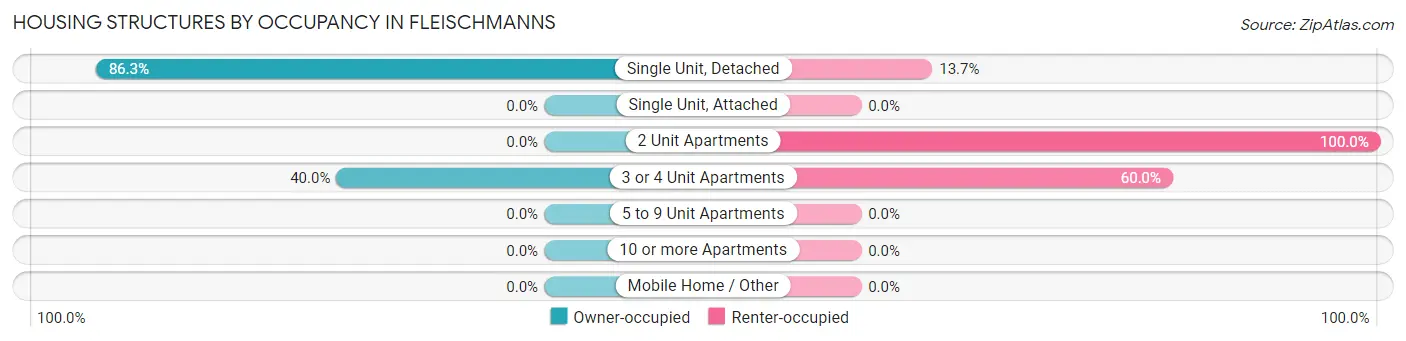
| Structure Type | Owner-occupied | Renter-occupied |
| Single Unit, Detached | 63 (86.3%) | 10 (13.7%) |
| Single Unit, Attached | 0 (0.0%) | 0 (0.0%) |
| 2 Unit Apartments | 0 (0.0%) | 11 (100.0%) |
| 3 or 4 Unit Apartments | 10 (40.0%) | 15 (60.0%) |
| 5 to 9 Unit Apartments | 0 (0.0%) | 0 (0.0%) |
| 10 or more Apartments | 0 (0.0%) | 0 (0.0%) |
| Mobile Home / Other | 0 (0.0%) | 0 (0.0%) |
| Total | 73 (67.0%) | 36 (33.0%) |
Housing Structures by Number of Rooms in Fleischmanns
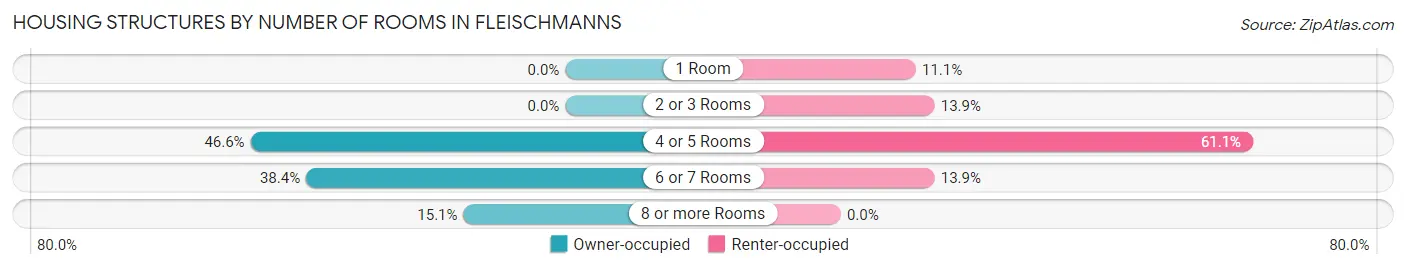
| Number of Rooms | Owner-occupied | Renter-occupied |
| 1 Room | 0 (0.0%) | 4 (11.1%) |
| 2 or 3 Rooms | 0 (0.0%) | 5 (13.9%) |
| 4 or 5 Rooms | 34 (46.6%) | 22 (61.1%) |
| 6 or 7 Rooms | 28 (38.4%) | 5 (13.9%) |
| 8 or more Rooms | 11 (15.1%) | 0 (0.0%) |
| Total | 73 (100.0%) | 36 (100.0%) |
Housing Structure by Heating Type in Fleischmanns
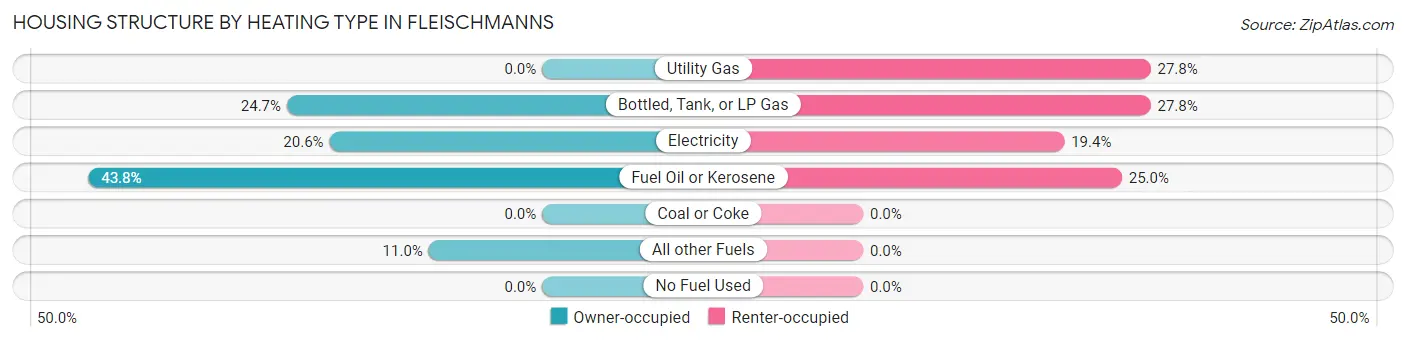
| Heating Type | Owner-occupied | Renter-occupied |
| Utility Gas | 0 (0.0%) | 10 (27.8%) |
| Bottled, Tank, or LP Gas | 18 (24.7%) | 10 (27.8%) |
| Electricity | 15 (20.5%) | 7 (19.4%) |
| Fuel Oil or Kerosene | 32 (43.8%) | 9 (25.0%) |
| Coal or Coke | 0 (0.0%) | 0 (0.0%) |
| All other Fuels | 8 (11.0%) | 0 (0.0%) |
| No Fuel Used | 0 (0.0%) | 0 (0.0%) |
| Total | 73 (100.0%) | 36 (100.0%) |
Household Vehicle Usage in Fleischmanns
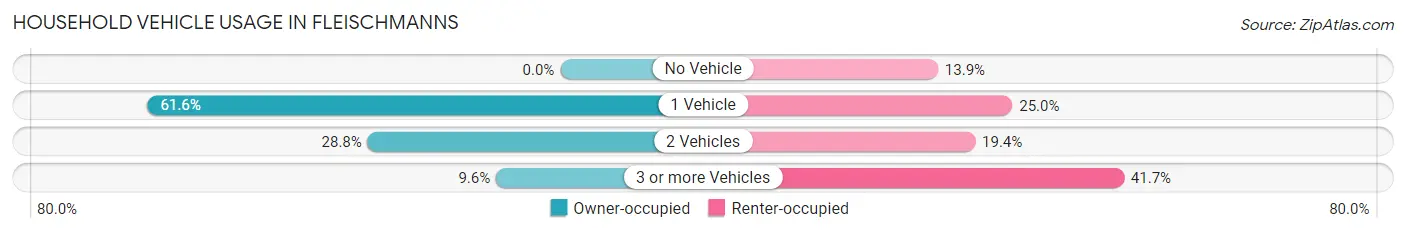
| Vehicles per Household | Owner-occupied | Renter-occupied |
| No Vehicle | 0 (0.0%) | 5 (13.9%) |
| 1 Vehicle | 45 (61.6%) | 9 (25.0%) |
| 2 Vehicles | 21 (28.8%) | 7 (19.4%) |
| 3 or more Vehicles | 7 (9.6%) | 15 (41.7%) |
| Total | 73 (100.0%) | 36 (100.0%) |
Real Estate & Mortgages in Fleischmanns
Real Estate and Mortgage Overview in Fleischmanns
| Characteristic | Without Mortgage | With Mortgage |
| Housing Units | 34 | 39 |
| Median Property Value | $235,000 | $256,600 |
| Median Household Income | - | - |
| Monthly Housing Costs | $970 | $0 |
| Real Estate Taxes | $5,750 | $0 |
Property Value by Mortgage Status in Fleischmanns
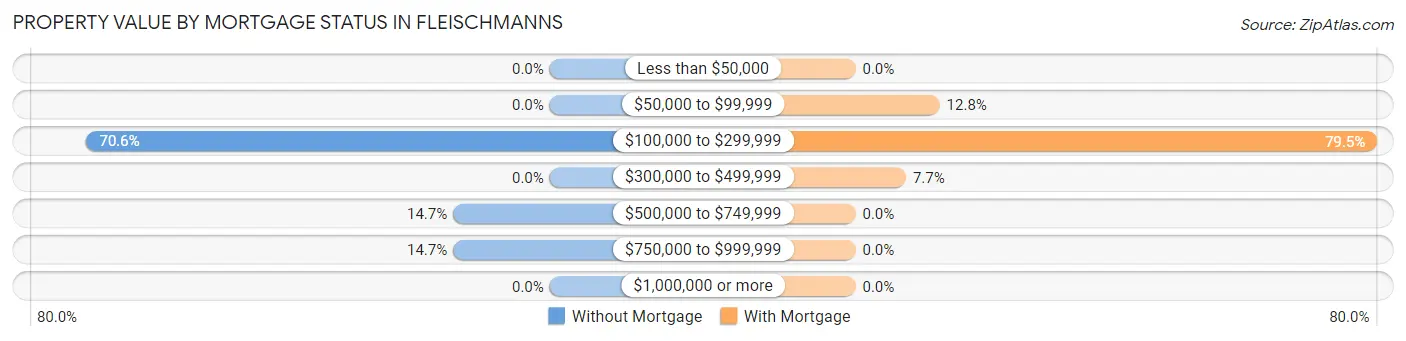
| Property Value | Without Mortgage | With Mortgage |
| Less than $50,000 | 0 (0.0%) | 0 (0.0%) |
| $50,000 to $99,999 | 0 (0.0%) | 5 (12.8%) |
| $100,000 to $299,999 | 24 (70.6%) | 31 (79.5%) |
| $300,000 to $499,999 | 0 (0.0%) | 3 (7.7%) |
| $500,000 to $749,999 | 5 (14.7%) | 0 (0.0%) |
| $750,000 to $999,999 | 5 (14.7%) | 0 (0.0%) |
| $1,000,000 or more | 0 (0.0%) | 0 (0.0%) |
| Total | 34 (100.0%) | 39 (100.0%) |
Household Income by Mortgage Status in Fleischmanns
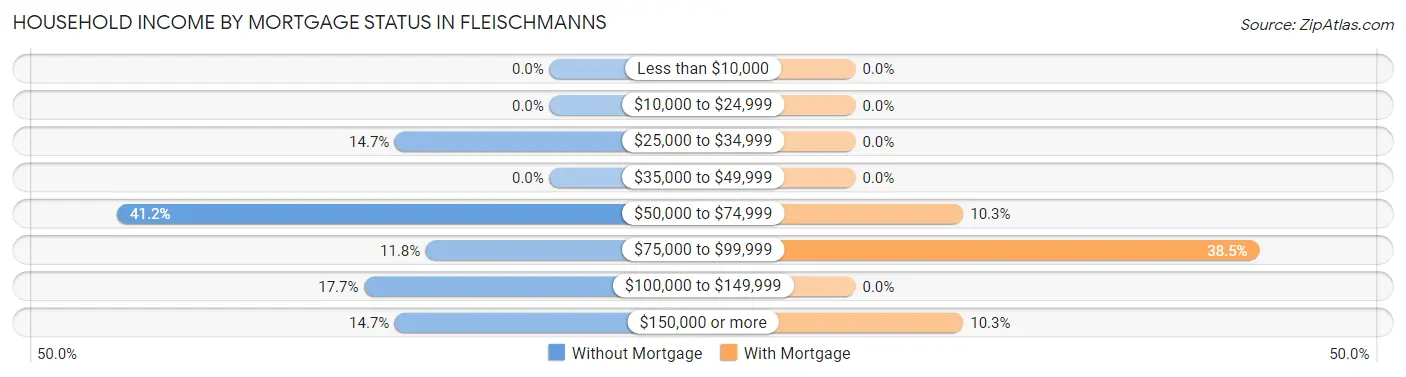
| Household Income | Without Mortgage | With Mortgage |
| Less than $10,000 | 0 (0.0%) | 0 (0.0%) |
| $10,000 to $24,999 | 0 (0.0%) | 0 (0.0%) |
| $25,000 to $34,999 | 5 (14.7%) | 0 (0.0%) |
| $35,000 to $49,999 | 0 (0.0%) | 0 (0.0%) |
| $50,000 to $74,999 | 14 (41.2%) | 4 (10.3%) |
| $75,000 to $99,999 | 4 (11.8%) | 15 (38.5%) |
| $100,000 to $149,999 | 6 (17.6%) | 0 (0.0%) |
| $150,000 or more | 5 (14.7%) | 4 (10.3%) |
| Total | 34 (100.0%) | 39 (100.0%) |
Property Value to Household Income Ratio in Fleischmanns
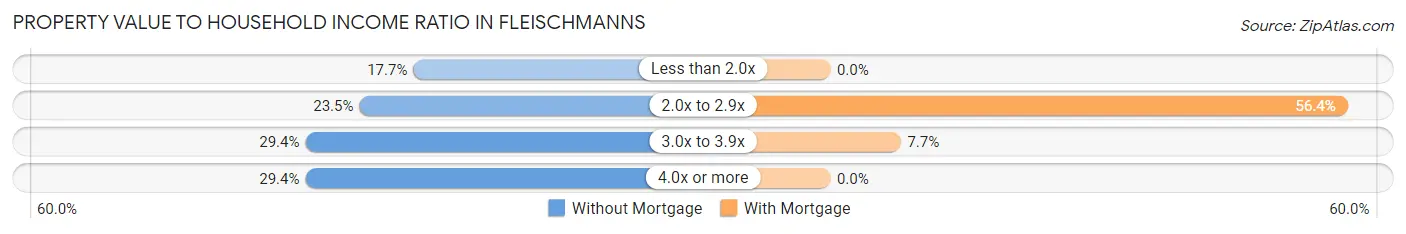
| Value-to-Income Ratio | Without Mortgage | With Mortgage |
| Less than 2.0x | 6 (17.6%) | 0 (0.0%) |
| 2.0x to 2.9x | 8 (23.5%) | 22 (56.4%) |
| 3.0x to 3.9x | 10 (29.4%) | 3 (7.7%) |
| 4.0x or more | 10 (29.4%) | 0 (0.0%) |
| Total | 34 (100.0%) | 39 (100.0%) |
Real Estate Taxes by Mortgage Status in Fleischmanns

| Property Taxes | Without Mortgage | With Mortgage |
| Less than $800 | 0 (0.0%) | 0 (0.0%) |
| $800 to $1,499 | 4 (11.8%) | 4 (10.3%) |
| $800 to $1,499 | 30 (88.2%) | 0 (0.0%) |
| Total | 34 (100.0%) | 39 (100.0%) |
Health & Disability in Fleischmanns
Health Insurance Coverage by Age in Fleischmanns
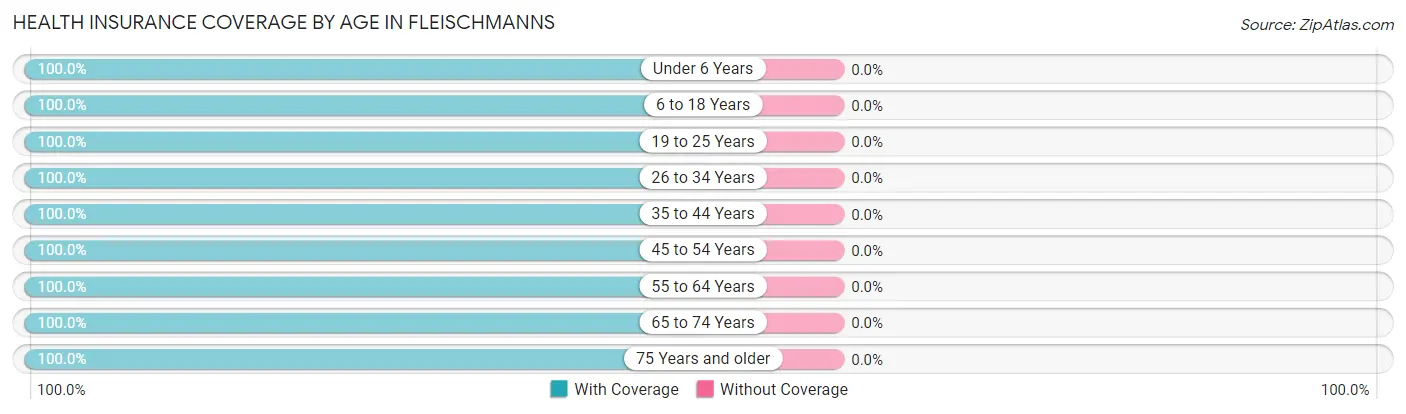
| Age Bracket | With Coverage | Without Coverage |
| Under 6 Years | 6 (100.0%) | 0 (0.0%) |
| 6 to 18 Years | 42 (100.0%) | 0 (0.0%) |
| 19 to 25 Years | 36 (100.0%) | 0 (0.0%) |
| 26 to 34 Years | 12 (100.0%) | 0 (0.0%) |
| 35 to 44 Years | 9 (100.0%) | 0 (0.0%) |
| 45 to 54 Years | 62 (100.0%) | 0 (0.0%) |
| 55 to 64 Years | 26 (100.0%) | 0 (0.0%) |
| 65 to 74 Years | 49 (100.0%) | 0 (0.0%) |
| 75 Years and older | 18 (100.0%) | 0 (0.0%) |
| Total | 260 (100.0%) | 0 (0.0%) |
Health Insurance Coverage by Citizenship Status in Fleischmanns
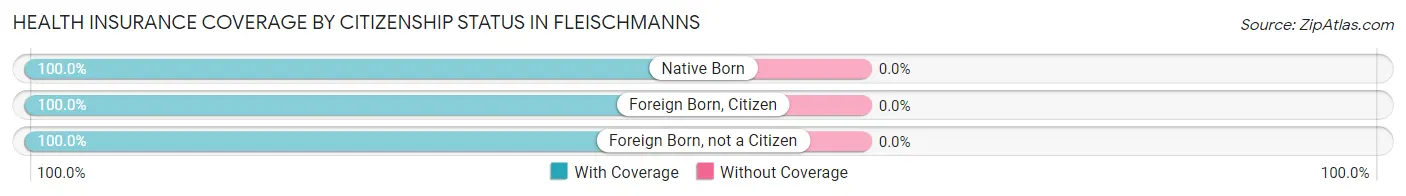
| Citizenship Status | With Coverage | Without Coverage |
| Native Born | 6 (100.0%) | 0 (0.0%) |
| Foreign Born, Citizen | 42 (100.0%) | 0 (0.0%) |
| Foreign Born, not a Citizen | 36 (100.0%) | 0 (0.0%) |
Health Insurance Coverage by Household Income in Fleischmanns
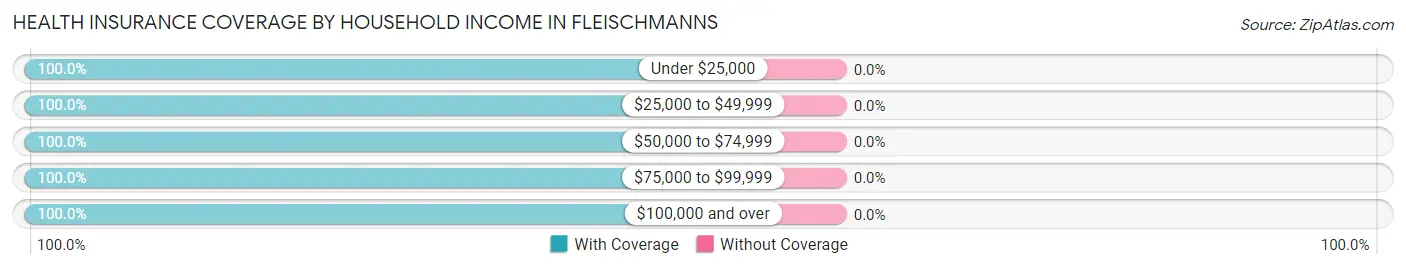
| Household Income | With Coverage | Without Coverage |
| Under $25,000 | 9 (100.0%) | 0 (0.0%) |
| $25,000 to $49,999 | 66 (100.0%) | 0 (0.0%) |
| $50,000 to $74,999 | 85 (100.0%) | 0 (0.0%) |
| $75,000 to $99,999 | 22 (100.0%) | 0 (0.0%) |
| $100,000 and over | 78 (100.0%) | 0 (0.0%) |
Public vs Private Health Insurance Coverage by Age in Fleischmanns
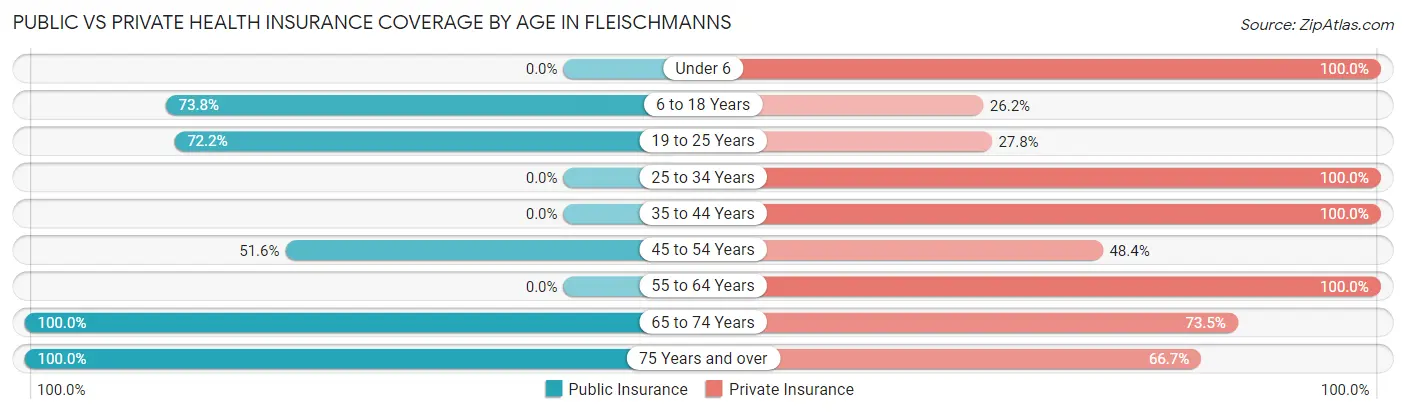
| Age Bracket | Public Insurance | Private Insurance |
| Under 6 | 0 (0.0%) | 6 (100.0%) |
| 6 to 18 Years | 31 (73.8%) | 11 (26.2%) |
| 19 to 25 Years | 26 (72.2%) | 10 (27.8%) |
| 25 to 34 Years | 0 (0.0%) | 12 (100.0%) |
| 35 to 44 Years | 0 (0.0%) | 9 (100.0%) |
| 45 to 54 Years | 32 (51.6%) | 30 (48.4%) |
| 55 to 64 Years | 0 (0.0%) | 26 (100.0%) |
| 65 to 74 Years | 49 (100.0%) | 36 (73.5%) |
| 75 Years and over | 18 (100.0%) | 12 (66.7%) |
| Total | 156 (60.0%) | 152 (58.5%) |
Disability Status by Sex by Age in Fleischmanns
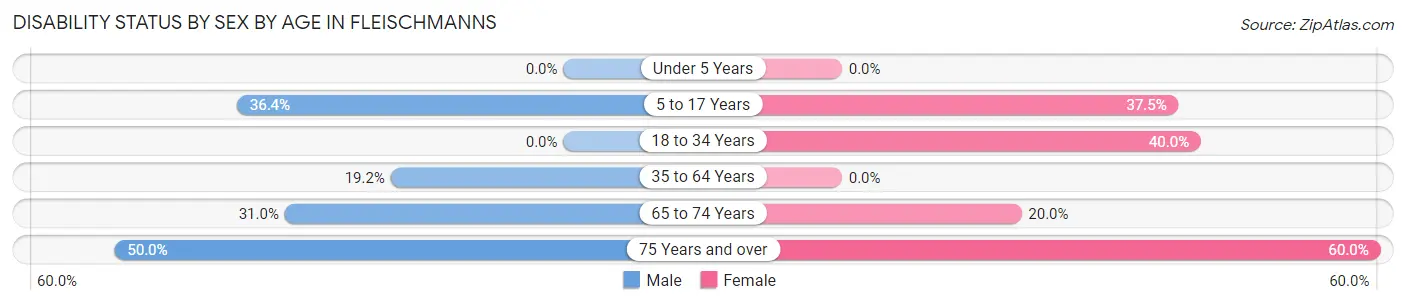
| Age Bracket | Male | Female |
| Under 5 Years | 0 (0.0%) | 0 (0.0%) |
| 5 to 17 Years | 4 (36.4%) | 6 (37.5%) |
| 18 to 34 Years | 0 (0.0%) | 12 (40.0%) |
| 35 to 64 Years | 10 (19.2%) | 0 (0.0%) |
| 65 to 74 Years | 9 (31.0%) | 4 (20.0%) |
| 75 Years and over | 4 (50.0%) | 6 (60.0%) |
Disability Class by Sex by Age in Fleischmanns
Disability Class: Hearing Difficulty
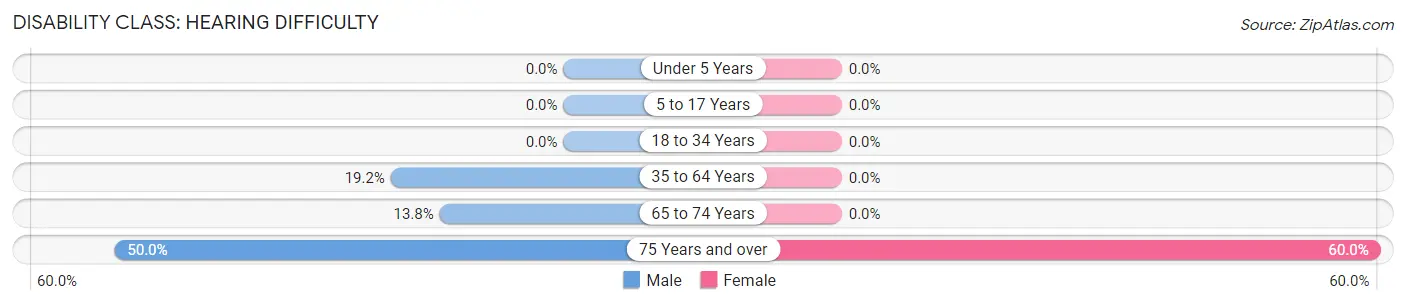
| Age Bracket | Male | Female |
| Under 5 Years | 0 (0.0%) | 0 (0.0%) |
| 5 to 17 Years | 0 (0.0%) | 0 (0.0%) |
| 18 to 34 Years | 0 (0.0%) | 0 (0.0%) |
| 35 to 64 Years | 10 (19.2%) | 0 (0.0%) |
| 65 to 74 Years | 4 (13.8%) | 0 (0.0%) |
| 75 Years and over | 4 (50.0%) | 6 (60.0%) |
Disability Class: Vision Difficulty
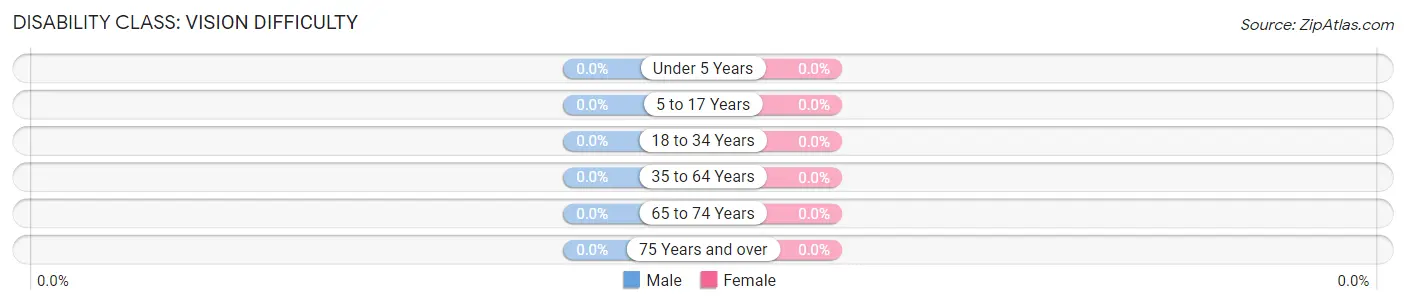
| Age Bracket | Male | Female |
| Under 5 Years | 0 (0.0%) | 0 (0.0%) |
| 5 to 17 Years | 0 (0.0%) | 0 (0.0%) |
| 18 to 34 Years | 0 (0.0%) | 0 (0.0%) |
| 35 to 64 Years | 0 (0.0%) | 0 (0.0%) |
| 65 to 74 Years | 0 (0.0%) | 0 (0.0%) |
| 75 Years and over | 0 (0.0%) | 0 (0.0%) |
Disability Class: Cognitive Difficulty
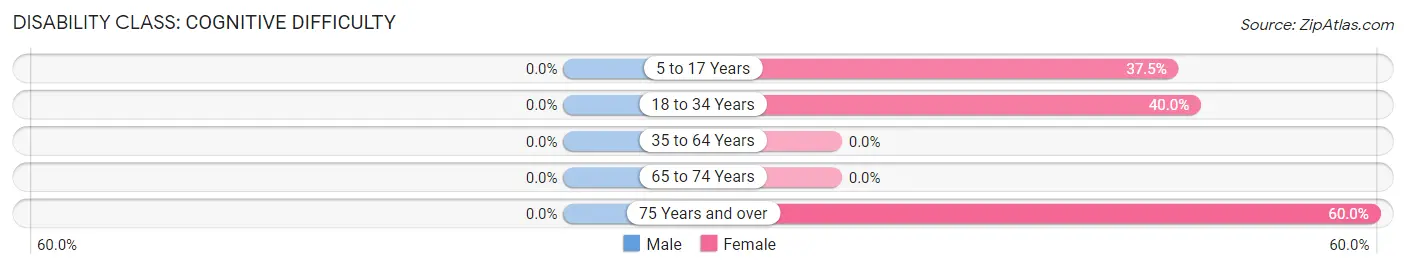
| Age Bracket | Male | Female |
| 5 to 17 Years | 0 (0.0%) | 6 (37.5%) |
| 18 to 34 Years | 0 (0.0%) | 12 (40.0%) |
| 35 to 64 Years | 0 (0.0%) | 0 (0.0%) |
| 65 to 74 Years | 0 (0.0%) | 0 (0.0%) |
| 75 Years and over | 0 (0.0%) | 6 (60.0%) |
Disability Class: Ambulatory Difficulty
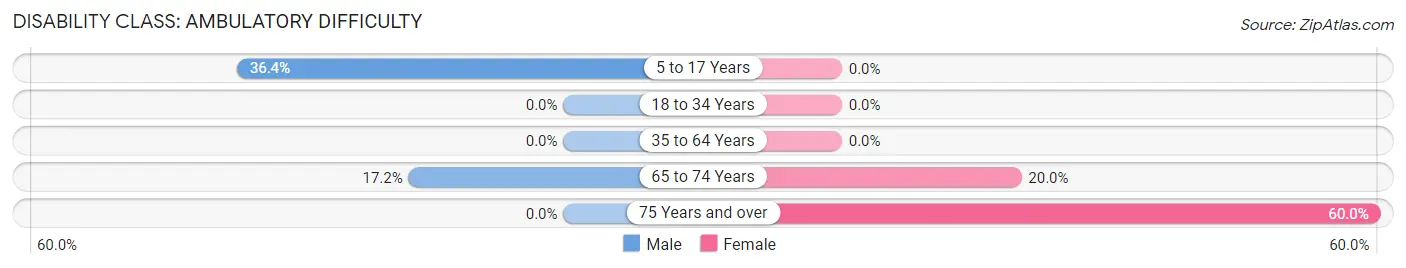
| Age Bracket | Male | Female |
| 5 to 17 Years | 4 (36.4%) | 0 (0.0%) |
| 18 to 34 Years | 0 (0.0%) | 0 (0.0%) |
| 35 to 64 Years | 0 (0.0%) | 0 (0.0%) |
| 65 to 74 Years | 5 (17.2%) | 4 (20.0%) |
| 75 Years and over | 0 (0.0%) | 6 (60.0%) |
Disability Class: Self-Care Difficulty
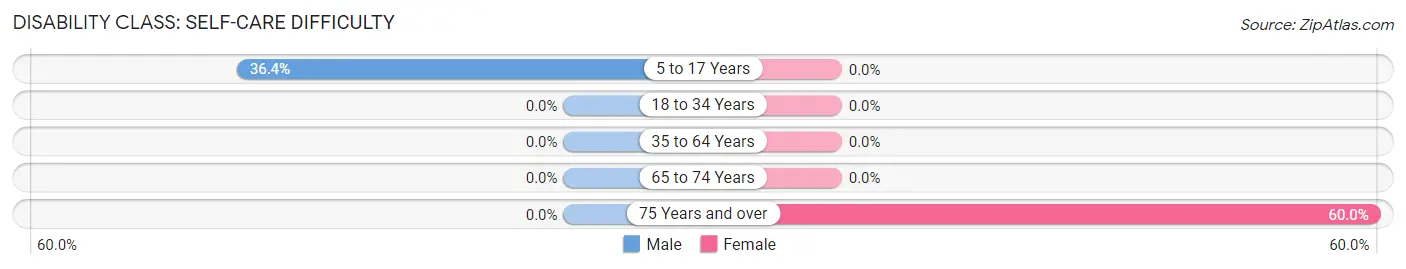
| Age Bracket | Male | Female |
| 5 to 17 Years | 4 (36.4%) | 0 (0.0%) |
| 18 to 34 Years | 0 (0.0%) | 0 (0.0%) |
| 35 to 64 Years | 0 (0.0%) | 0 (0.0%) |
| 65 to 74 Years | 0 (0.0%) | 0 (0.0%) |
| 75 Years and over | 0 (0.0%) | 6 (60.0%) |
Technology Access in Fleischmanns
Computing Device Access in Fleischmanns
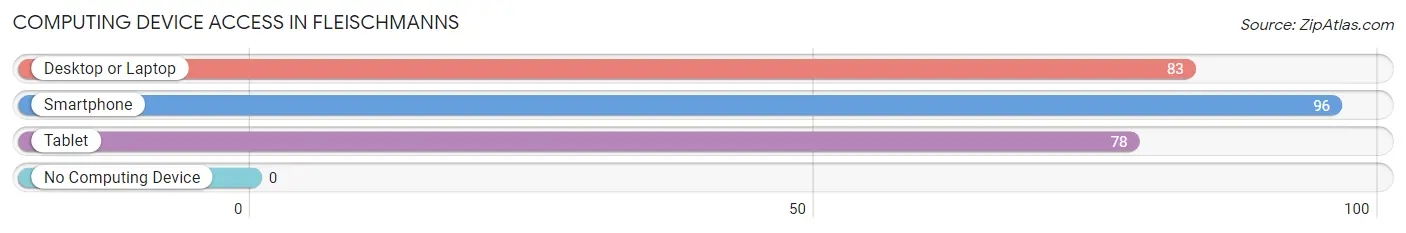
| Device Type | # Households | % Households |
| Desktop or Laptop | 83 | 76.1% |
| Smartphone | 96 | 88.1% |
| Tablet | 78 | 71.6% |
| No Computing Device | 0 | 0.0% |
| Total | 109 | 100.0% |
Internet Access in Fleischmanns
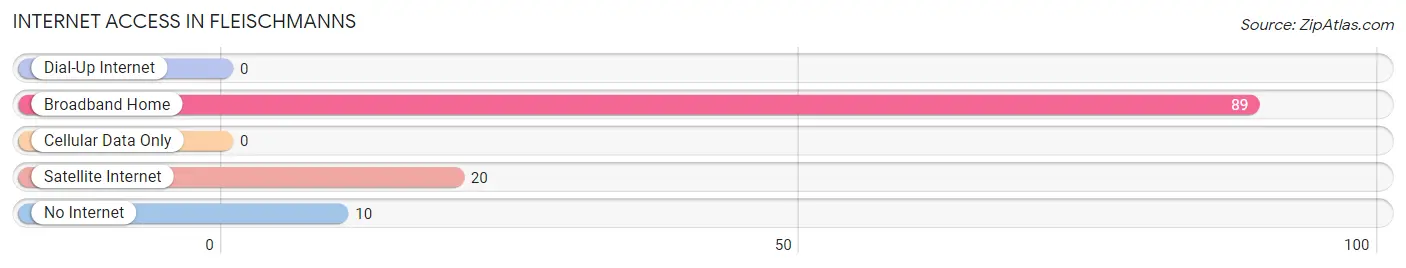
| Internet Type | # Households | % Households |
| Dial-Up Internet | 0 | 0.0% |
| Broadband Home | 89 | 81.7% |
| Cellular Data Only | 0 | 0.0% |
| Satellite Internet | 20 | 18.3% |
| No Internet | 10 | 9.2% |
| Total | 109 | 100.0% |
Fleischmanns Summary
Fleischmanns, NY is a small village located in the Catskill Mountains of Delaware County, New York. It is situated in the western part of the county, near the border of Ulster County. The village is located on the banks of the East Branch of the Delaware River, and is surrounded by the towns of Middletown, Andes, and Margaretville. The population of Fleischmanns was 590 at the 2010 census.
History
The area that is now Fleischmanns was originally inhabited by the Lenape Native Americans. The first European settlers arrived in the area in the late 1700s, and the village was officially founded in 1881. The village was named after the Fleischmann family, who were German immigrants who had settled in the area in the early 1800s.
The village was originally a logging and farming community, and the first sawmill was built in 1881. The village was also home to a number of small businesses, including a hotel, a general store, and a post office. In the early 1900s, the village began to attract tourists, and several hotels and boarding houses were built to accommodate them.
Geography
Fleischmanns is located in the western part of Delaware County, near the border of Ulster County. The village is situated on the banks of the East Branch of the Delaware River, and is surrounded by the towns of Middletown, Andes, and Margaretville. The village is located in the Catskill Mountains, and is surrounded by forests and rolling hills.
The village has a total area of 0.6 square miles, all of which is land. The village is located at an elevation of 1,400 feet above sea level.
Economy
The economy of Fleischmanns is largely based on tourism. The village is home to several hotels and bed and breakfasts, as well as a number of restaurants and shops. The village is also home to a number of small businesses, including a general store, a post office, and a hardware store.
The village is also home to a number of artists and craftspeople, who sell their work at local galleries and shops. The village is also home to a number of farms, which produce a variety of fruits and vegetables.
Demographics
As of the 2010 census, the population of Fleischmanns was 590. The racial makeup of the village was 97.2% White, 0.2% African American, 0.2% Native American, 0.2% Asian, 0.2% from other races, and 1.9% from two or more races. Hispanic or Latino of any race were 1.7% of the population.
The median household income in Fleischmanns was $41,250, and the median family income was $50,000. The per capita income for the village was $20,945. About 10.2% of families and 14.2% of the population were below the poverty line, including 18.2% of those under age 18 and 8.3% of those age 65 or over.
Common Questions
What is the Total Population of Fleischmanns?
Total Population of Fleischmanns is 260.
What is the Total Male Population of Fleischmanns?
Total Male Population of Fleischmanns is 139.
What is the Total Female Population of Fleischmanns?
Total Female Population of Fleischmanns is 121.
What is the Ratio of Males per 100 Females in Fleischmanns?
There are 114.88 Males per 100 Females in Fleischmanns.
What is the Ratio of Females per 100 Males in Fleischmanns?
There are 87.05 Females per 100 Males in Fleischmanns.
What is the Median Population Age in Fleischmanns?
Median Population Age in Fleischmanns is 49.5 Years.
What is the Average Family Size in Fleischmanns
Average Family Size in Fleischmanns is 2.9 People.
What is the Average Household Size in Fleischmanns
Average Household Size in Fleischmanns is 2.4 People.
What is Per Capita Income in Fleischmanns?
Per Capita income in Fleischmanns is $36,398.
What is the Median Family Income in Fleischmanns?
Median Family Income in Fleischmanns is $91,607.
What is the Median Household income in Fleischmanns?
Median Household Income in Fleischmanns is $60,417.
What is Inequality or Gini Index in Fleischmanns?
Inequality or Gini Index in Fleischmanns is 0.36.
How Large is the Labor Force in Fleischmanns?
There are 156 People in the Labor Forcein in Fleischmanns.
What is the Percentage of People in the Labor Force in Fleischmanns?
67.2% of People are in the Labor Force in Fleischmanns.
What is the Unemployment Rate in Fleischmanns?
Unemployment Rate in Fleischmanns is 3.8%.