Jeffersonville, NY
Jeffersonville Map
Jeffersonville Overview
434
TOTAL POPULATION
195
MALE POPULATION
239
FEMALE POPULATION
81.59
MALES / 100 FEMALES
122.56
FEMALES / 100 MALES
39.3
MEDIAN AGE
3.0
AVG FAMILY SIZE
2.4
AVG HOUSEHOLD SIZE
$30,453
PER CAPITA INCOME
$126,667
AVG FAMILY INCOME
$55,000
AVG HOUSEHOLD INCOME
0.46
INEQUALITY / GINI INDEX
239
LABOR FORCE [ PEOPLE ]
63.2%
PERCENT IN LABOR FORCE
0.8%
UNEMPLOYMENT RATE
Jeffersonville Zip Codes
Jeffersonville Area Codes
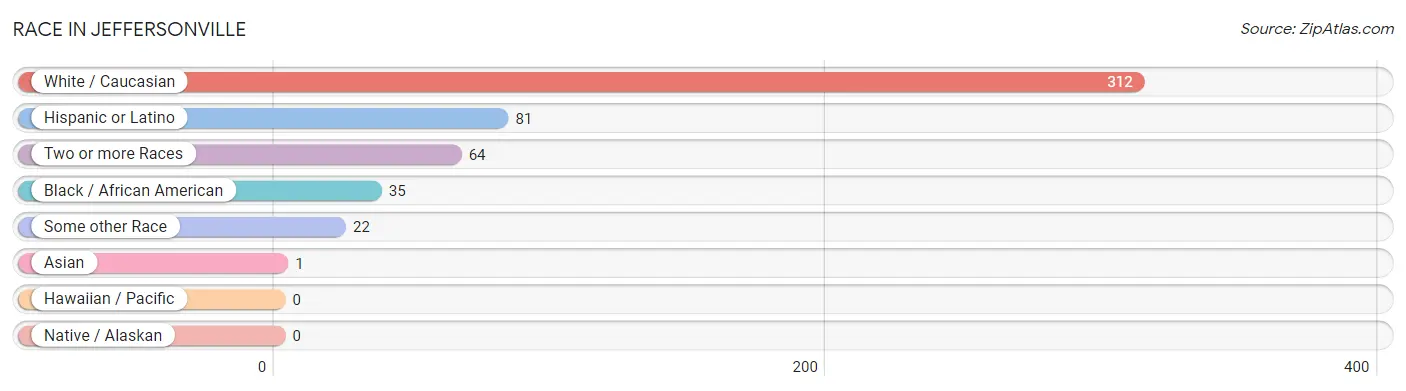
Race in Jeffersonville
The most populous races in Jeffersonville are White / Caucasian (312 | 71.9%), Hispanic or Latino (81 | 18.7%), and Two or more Races (64 | 14.7%).
| Race | # Population | % Population |
| Asian | 1 | 0.2% |
| Black / African American | 35 | 8.1% |
| Hawaiian / Pacific | 0 | 0.0% |
| Hispanic or Latino | 81 | 18.7% |
| Native / Alaskan | 0 | 0.0% |
| White / Caucasian | 312 | 71.9% |
| Two or more Races | 64 | 14.7% |
| Some other Race | 22 | 5.1% |
| Total | 434 | 100.0% |
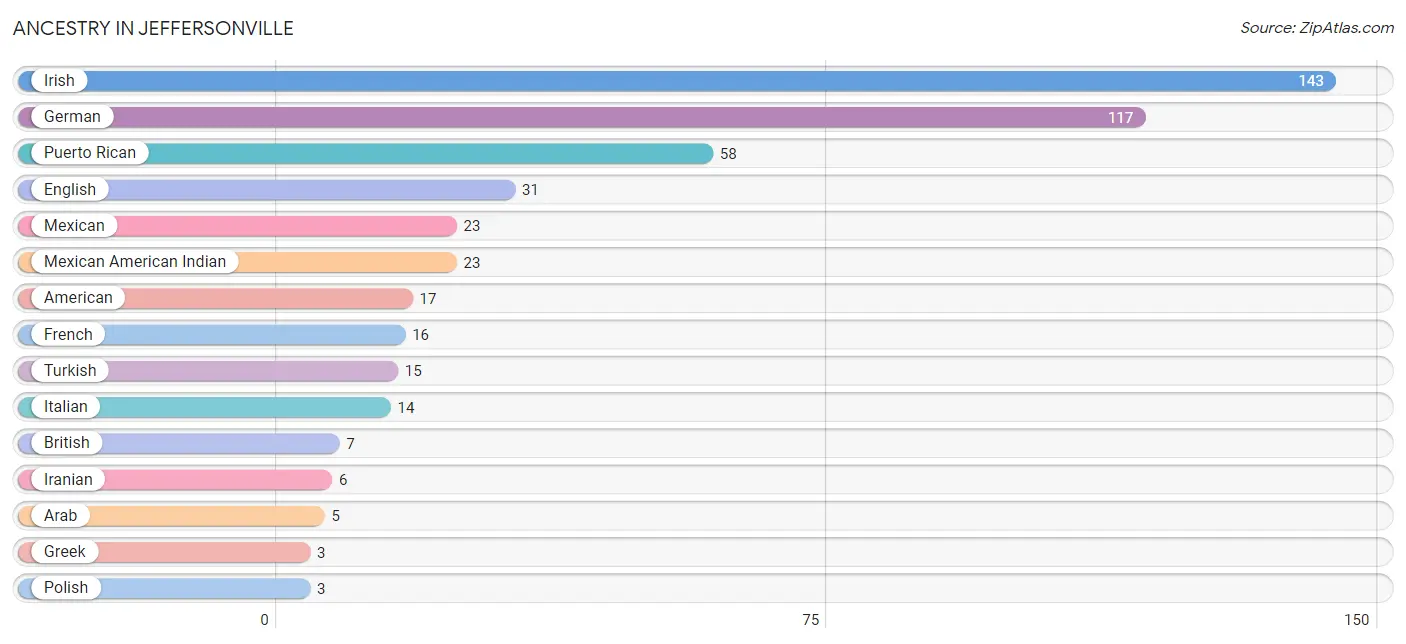
Ancestry in Jeffersonville
The most populous ancestries reported in Jeffersonville are Irish (143 | 33.0%), German (117 | 27.0%), Puerto Rican (58 | 13.4%), English (31 | 7.1%), and Mexican (23 | 5.3%), together accounting for 85.7% of all Jeffersonville residents.
| Ancestry | # Population | % Population |
| American | 17 | 3.9% |
| Arab | 5 | 1.1% |
| British | 7 | 1.6% |
| English | 31 | 7.1% |
| French | 16 | 3.7% |
| German | 117 | 27.0% |
| Greek | 3 | 0.7% |
| Indian (Asian) | 1 | 0.2% |
| Iranian | 6 | 1.4% |
| Irish | 143 | 33.0% |
| Italian | 14 | 3.2% |
| Mexican | 23 | 5.3% |
| Mexican American Indian | 23 | 5.3% |
| Polish | 3 | 0.7% |
| Puerto Rican | 58 | 13.4% |
| Turkish | 15 | 3.5% | View All 16 Rows |
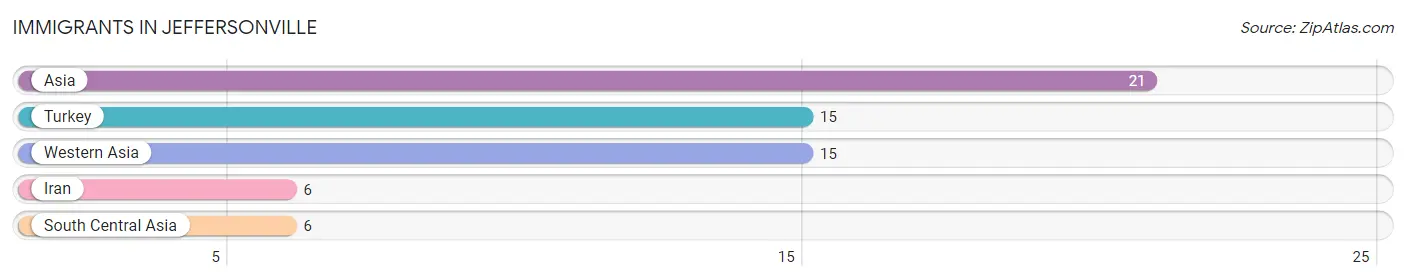
Immigrants in Jeffersonville
The most numerous immigrant groups reported in Jeffersonville came from Asia (21 | 4.8%), Turkey (15 | 3.5%), Western Asia (15 | 3.5%), Iran (6 | 1.4%), and South Central Asia (6 | 1.4%), together accounting for 14.5% of all Jeffersonville residents.
| Immigration Origin | # Population | % Population |
| Asia | 21 | 4.8% |
| Iran | 6 | 1.4% |
| South Central Asia | 6 | 1.4% |
| Turkey | 15 | 3.5% |
| Western Asia | 15 | 3.5% | View All 5 Rows |
Sex and Age in Jeffersonville
Sex and Age in Jeffersonville
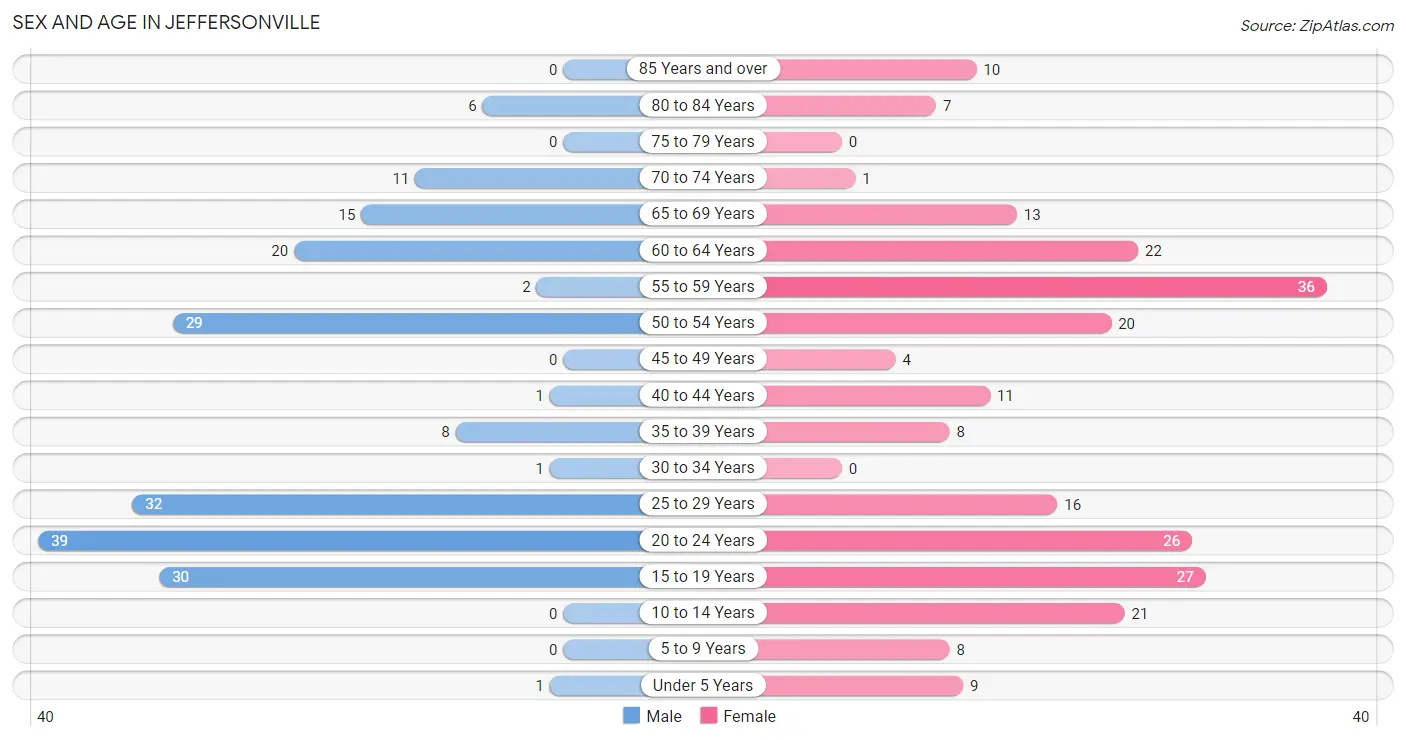
The most populous age groups in Jeffersonville are 20 to 24 Years (39 | 20.0%) for men and 55 to 59 Years (36 | 15.1%) for women.
| Age Bracket | Male | Female |
| Under 5 Years | 1 (0.5%) | 9 (3.8%) |
| 5 to 9 Years | 0 (0.0%) | 8 (3.4%) |
| 10 to 14 Years | 0 (0.0%) | 21 (8.8%) |
| 15 to 19 Years | 30 (15.4%) | 27 (11.3%) |
| 20 to 24 Years | 39 (20.0%) | 26 (10.9%) |
| 25 to 29 Years | 32 (16.4%) | 16 (6.7%) |
| 30 to 34 Years | 1 (0.5%) | 0 (0.0%) |
| 35 to 39 Years | 8 (4.1%) | 8 (3.4%) |
| 40 to 44 Years | 1 (0.5%) | 11 (4.6%) |
| 45 to 49 Years | 0 (0.0%) | 4 (1.7%) |
| 50 to 54 Years | 29 (14.9%) | 20 (8.4%) |
| 55 to 59 Years | 2 (1.0%) | 36 (15.1%) |
| 60 to 64 Years | 20 (10.3%) | 22 (9.2%) |
| 65 to 69 Years | 15 (7.7%) | 13 (5.4%) |
| 70 to 74 Years | 11 (5.6%) | 1 (0.4%) |
| 75 to 79 Years | 0 (0.0%) | 0 (0.0%) |
| 80 to 84 Years | 6 (3.1%) | 7 (2.9%) |
| 85 Years and over | 0 (0.0%) | 10 (4.2%) |
| Total | 195 (100.0%) | 239 (100.0%) |
Families and Households in Jeffersonville
Median Family Size in Jeffersonville
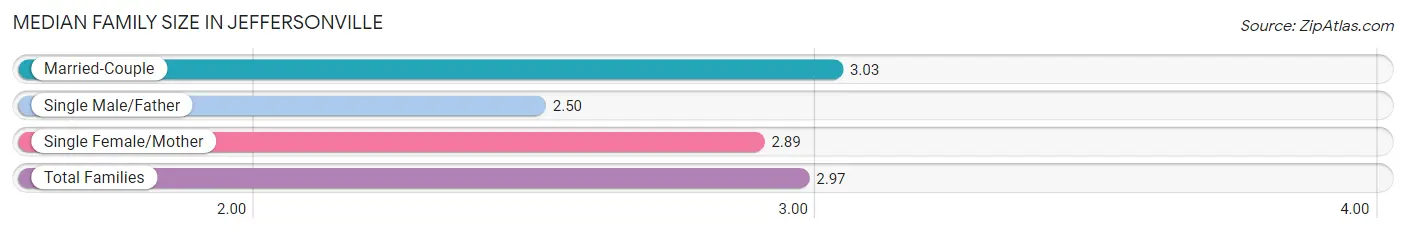
The median family size in Jeffersonville is 2.97 persons per family, with married-couple families (72 | 69.2%) accounting for the largest median family size of 3.03 persons per family. On the other hand, single male/father families (4 | 3.8%) represent the smallest median family size with 2.50 persons per family.
| Family Type | # Families | Family Size |
| Married-Couple | 72 (69.2%) | 3.03 |
| Single Male/Father | 4 (3.8%) | 2.50 |
| Single Female/Mother | 28 (26.9%) | 2.89 |
| Total Families | 104 (100.0%) | 2.97 |
Median Household Size in Jeffersonville
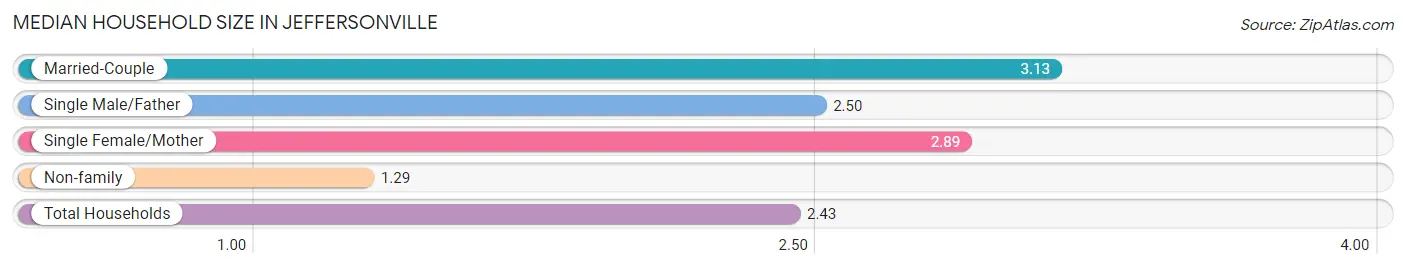
The median household size in Jeffersonville is 2.43 persons per household, with married-couple households (72 | 45.0%) accounting for the largest median household size of 3.13 persons per household. non-family households (56 | 35.0%) represent the smallest median household size with 1.29 persons per household.
| Household Type | # Households | Household Size |
| Married-Couple | 72 (45.0%) | 3.13 |
| Single Male/Father | 4 (2.5%) | 2.50 |
| Single Female/Mother | 28 (17.5%) | 2.89 |
| Non-family | 56 (35.0%) | 1.29 |
| Total Households | 160 (100.0%) | 2.43 |
Household Size by Marriage Status in Jeffersonville
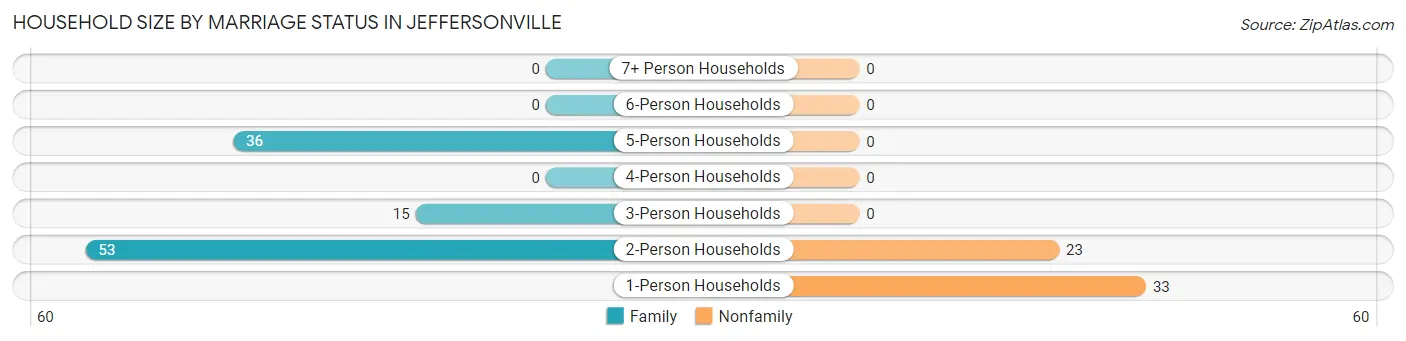
Out of a total of 160 households in Jeffersonville, 104 (65.0%) are family households, while 56 (35.0%) are nonfamily households. The most numerous type of family households are 2-person households, comprising 53, and the most common type of nonfamily households are 1-person households, comprising 33.
| Household Size | Family Households | Nonfamily Households |
| 1-Person Households | - | 33 (20.6%) |
| 2-Person Households | 53 (33.1%) | 23 (14.4%) |
| 3-Person Households | 15 (9.4%) | 0 (0.0%) |
| 4-Person Households | 0 (0.0%) | 0 (0.0%) |
| 5-Person Households | 36 (22.5%) | 0 (0.0%) |
| 6-Person Households | 0 (0.0%) | 0 (0.0%) |
| 7+ Person Households | 0 (0.0%) | 0 (0.0%) |
| Total | 104 (65.0%) | 56 (35.0%) |
Female Fertility in Jeffersonville
Fertility by Age in Jeffersonville
| Age Bracket | Women with Births | Births / 1,000 Women |
| 15 to 19 years | 0 (0.0%) | 0.0 |
| 20 to 34 years | 0 (0.0%) | 0.0 |
| 35 to 50 years | 0 (0.0%) | 0.0 |
| Total | 0 (0.0%) | 0.0 |
Fertility by Age by Marriage Status in Jeffersonville
| Age Bracket | Married | Unmarried |
| 15 to 19 years | 0 (0.0%) | 0 (0.0%) |
| 20 to 34 years | 0 (0.0%) | 0 (0.0%) |
| 35 to 50 years | 0 (0.0%) | 0 (0.0%) |
| Total | 0 (0.0%) | 0 (0.0%) |
Fertility by Education in Jeffersonville
| Educational Attainment | Women with Births | Births / 1,000 Women |
| Less than High School | 0 (0.0%) | 0.0 |
| High School Diploma | 0 (0.0%) | 0.0 |
| College or Associate's Degree | 0 (0.0%) | 0.0 |
| Bachelor's Degree | 0 (0.0%) | 0.0 |
| Graduate Degree | 0 (0.0%) | 0.0 |
| Total | 0 (0.0%) | 0.0 |
Fertility by Education by Marriage Status in Jeffersonville
| Educational Attainment | Married | Unmarried |
| Less than High School | 0 (0.0%) | 0 (0.0%) |
| High School Diploma | 0 (0.0%) | 0 (0.0%) |
| College or Associate's Degree | 0 (0.0%) | 0 (0.0%) |
| Bachelor's Degree | 0 (0.0%) | 0 (0.0%) |
| Graduate Degree | 0 (0.0%) | 0 (0.0%) |
| Total | 0 (0.0%) | 0 (0.0%) |
Income in Jeffersonville
Income Overview in Jeffersonville
Per Capita Income in Jeffersonville is $30,453, while median incomes of families and households are $126,667 and $55,000 respectively.
| Characteristic | Number | Measure |
| Per Capita Income | 434 | $30,453 |
| Median Family Income | 104 | $126,667 |
| Mean Family Income | 104 | $109,196 |
| Median Household Income | 160 | $55,000 |
| Mean Household Income | 160 | $82,236 |
| Income Deficit | 104 | $0 |
| Wage / Income Gap (%) | 434 | 0.00% |
| Wage / Income Gap ($) | 434 | 100.00¢ per $1 |
| Gini / Inequality Index | 434 | 0.46 |
Earnings by Sex in Jeffersonville
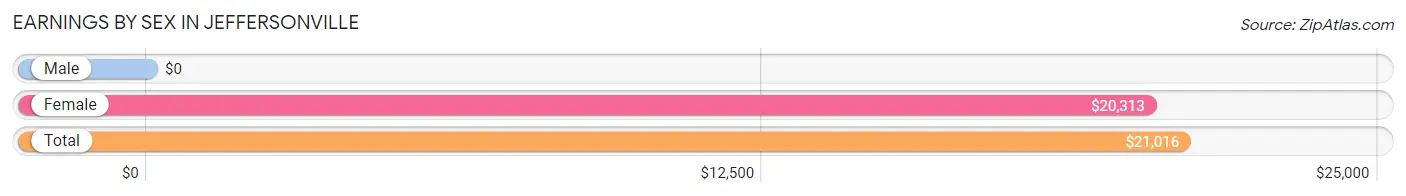
| Sex | Number | Average Earnings |
| Male | 135 (52.1%) | $0 |
| Female | 124 (47.9%) | $20,313 |
| Total | 259 (100.0%) | $21,016 |
Earnings by Sex by Income Bracket in Jeffersonville
The most common earnings brackets in Jeffersonville are $10,000 to $12,499 for men (40 | 29.6%) and $7,500 to $9,999 for women (16 | 12.9%).
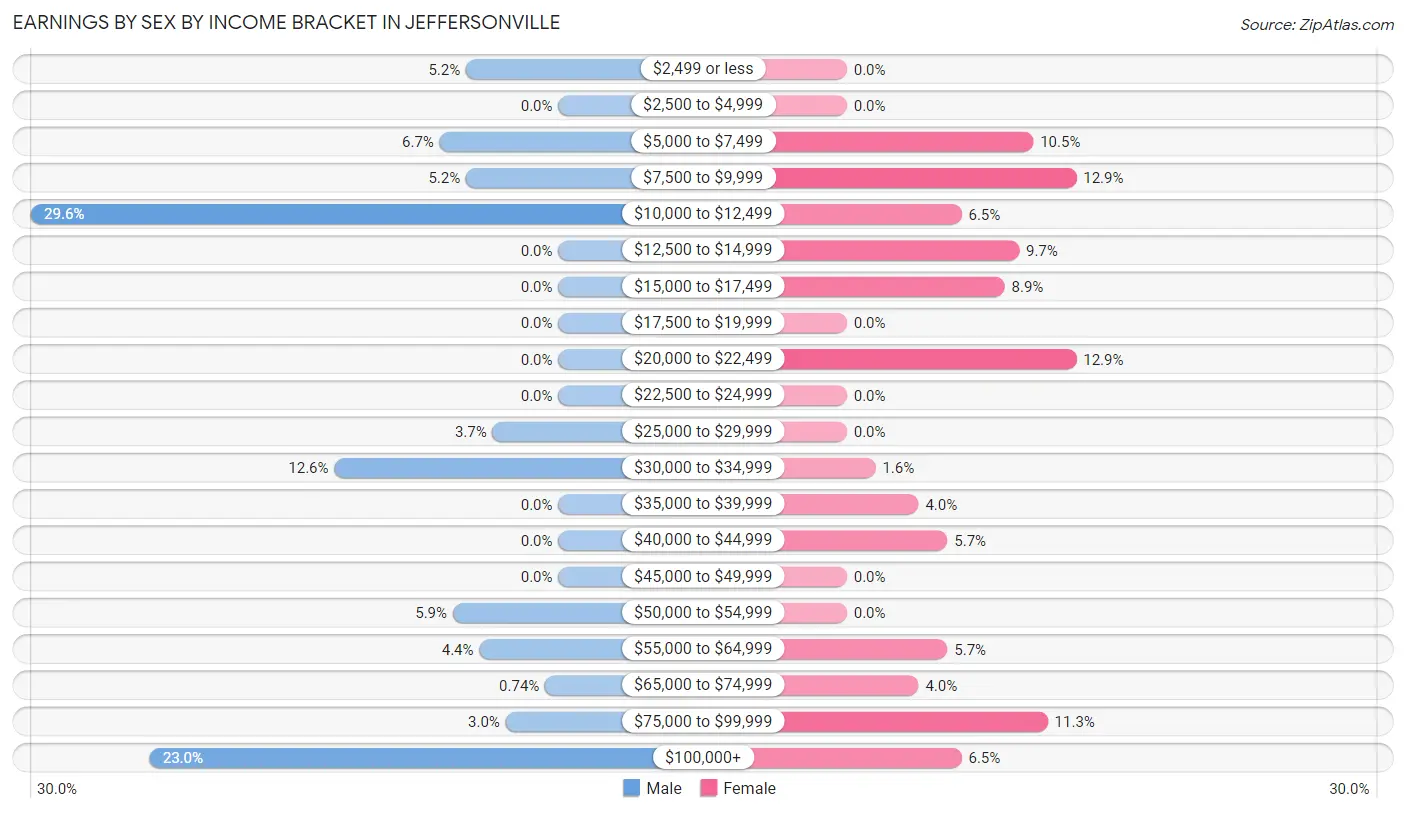
| Income | Male | Female |
| $2,499 or less | 7 (5.2%) | 0 (0.0%) |
| $2,500 to $4,999 | 0 (0.0%) | 0 (0.0%) |
| $5,000 to $7,499 | 9 (6.7%) | 13 (10.5%) |
| $7,500 to $9,999 | 7 (5.2%) | 16 (12.9%) |
| $10,000 to $12,499 | 40 (29.6%) | 8 (6.5%) |
| $12,500 to $14,999 | 0 (0.0%) | 12 (9.7%) |
| $15,000 to $17,499 | 0 (0.0%) | 11 (8.9%) |
| $17,500 to $19,999 | 0 (0.0%) | 0 (0.0%) |
| $20,000 to $22,499 | 0 (0.0%) | 16 (12.9%) |
| $22,500 to $24,999 | 0 (0.0%) | 0 (0.0%) |
| $25,000 to $29,999 | 5 (3.7%) | 0 (0.0%) |
| $30,000 to $34,999 | 17 (12.6%) | 2 (1.6%) |
| $35,000 to $39,999 | 0 (0.0%) | 5 (4.0%) |
| $40,000 to $44,999 | 0 (0.0%) | 7 (5.7%) |
| $45,000 to $49,999 | 0 (0.0%) | 0 (0.0%) |
| $50,000 to $54,999 | 8 (5.9%) | 0 (0.0%) |
| $55,000 to $64,999 | 6 (4.4%) | 7 (5.7%) |
| $65,000 to $74,999 | 1 (0.7%) | 5 (4.0%) |
| $75,000 to $99,999 | 4 (3.0%) | 14 (11.3%) |
| $100,000+ | 31 (23.0%) | 8 (6.5%) |
| Total | 135 (100.0%) | 124 (100.0%) |
Earnings by Sex by Educational Attainment in Jeffersonville
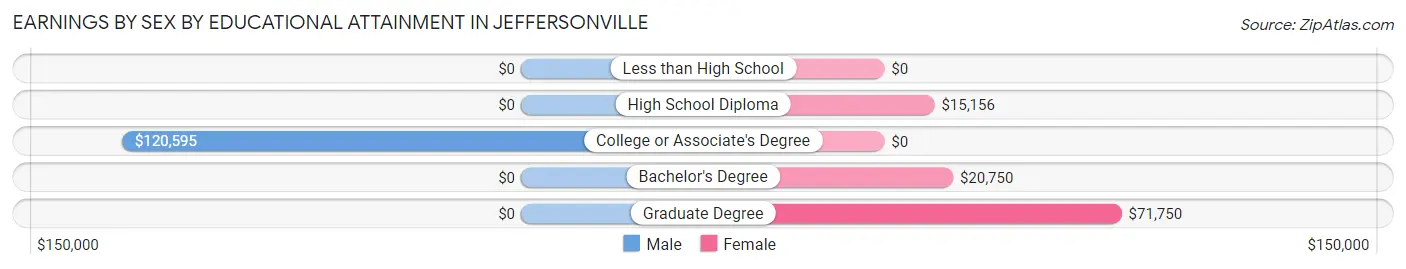
| Educational Attainment | Male Income | Female Income |
| Less than High School | - | - |
| High School Diploma | - | - |
| College or Associate's Degree | $120,595 | $0 |
| Bachelor's Degree | - | - |
| Graduate Degree | - | - |
| Total | - | - |
Family Income in Jeffersonville
Family Income Brackets in Jeffersonville
According to the Jeffersonville family income data, there are 37 families falling into the $100,000 to $149,999 income range, which is the most common income bracket and makes up 35.6% of all families.
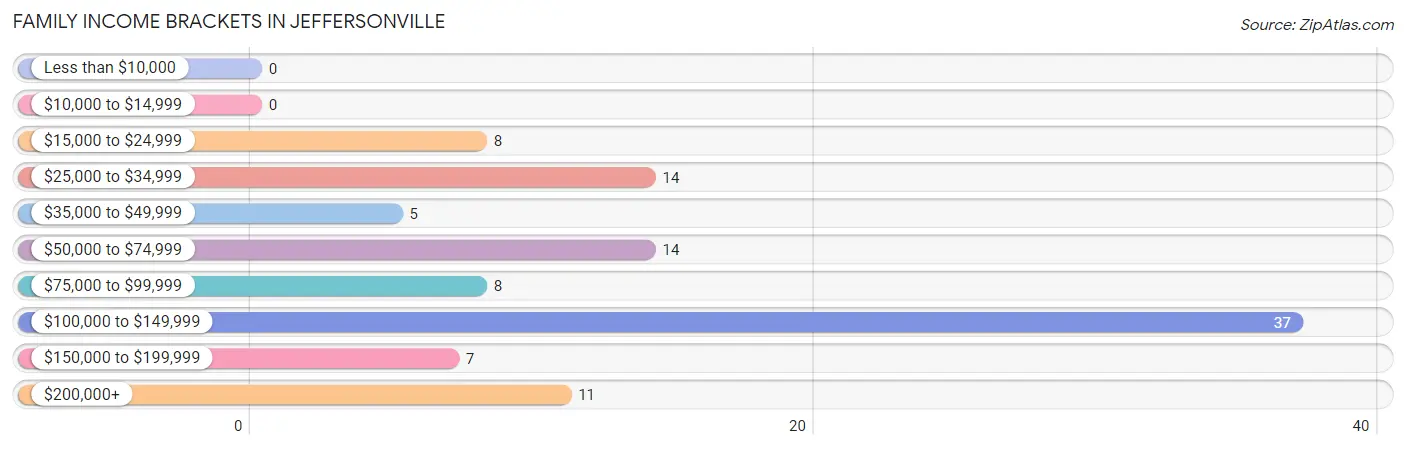
| Income Bracket | # Families | % Families |
| Less than $10,000 | 0 | 0.0% |
| $10,000 to $14,999 | 0 | 0.0% |
| $15,000 to $24,999 | 8 | 7.7% |
| $25,000 to $34,999 | 14 | 13.5% |
| $35,000 to $49,999 | 5 | 4.8% |
| $50,000 to $74,999 | 14 | 13.5% |
| $75,000 to $99,999 | 8 | 7.7% |
| $100,000 to $149,999 | 37 | 35.6% |
| $150,000 to $199,999 | 7 | 6.7% |
| $200,000+ | 11 | 10.6% |
Family Income by Famaliy Size in Jeffersonville
5-person families (36 | 34.6%) account for the highest median family income in Jeffersonville with $145,357 per family, while 5-person families (36 | 34.6%) have the highest median income of $29,071 per family member.
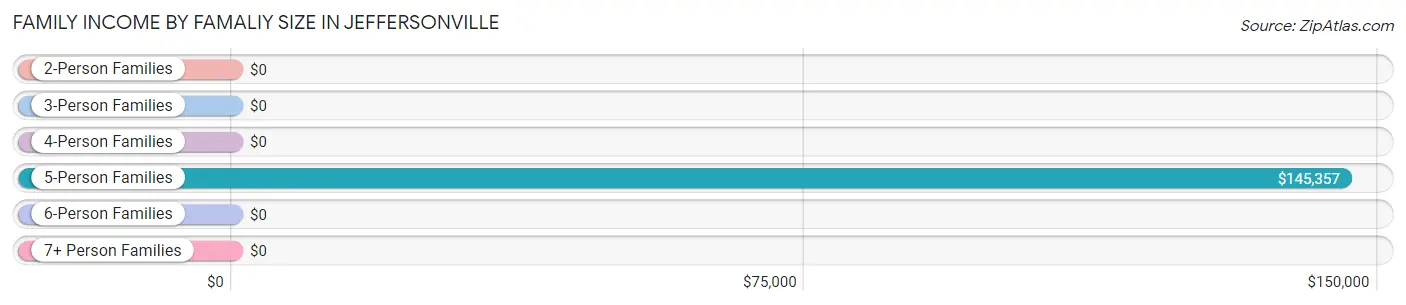
| Income Bracket | # Families | Median Income |
| 2-Person Families | 58 (55.8%) | $0 |
| 3-Person Families | 10 (9.6%) | $0 |
| 4-Person Families | 0 (0.0%) | $0 |
| 5-Person Families | 36 (34.6%) | $145,357 |
| 6-Person Families | 0 (0.0%) | $0 |
| 7+ Person Families | 0 (0.0%) | $0 |
| Total | 104 (100.0%) | $126,667 |
Family Income by Number of Earners in Jeffersonville
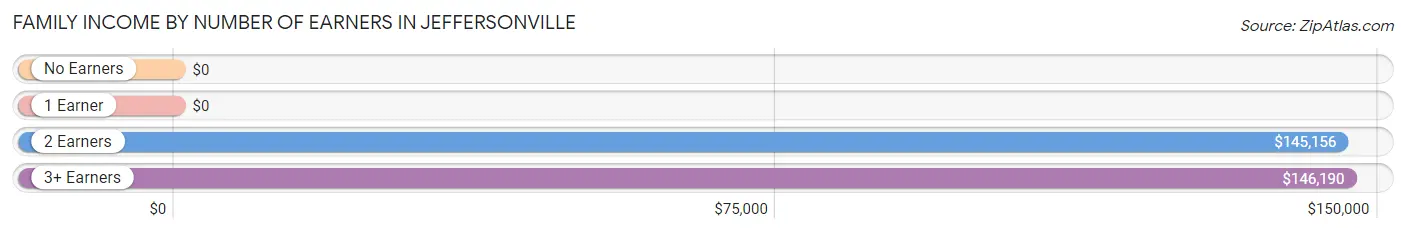
| Number of Earners | # Families | Median Income |
| No Earners | 2 (1.9%) | $0 |
| 1 Earner | 29 (27.9%) | $0 |
| 2 Earners | 41 (39.4%) | $145,156 |
| 3+ Earners | 32 (30.8%) | $146,190 |
| Total | 104 (100.0%) | $126,667 |
Household Income in Jeffersonville
Household Income Brackets in Jeffersonville
With 45 households falling in the category, the $15,000 to $24,999 income range is the most frequent in Jeffersonville, accounting for 28.1% of all households.
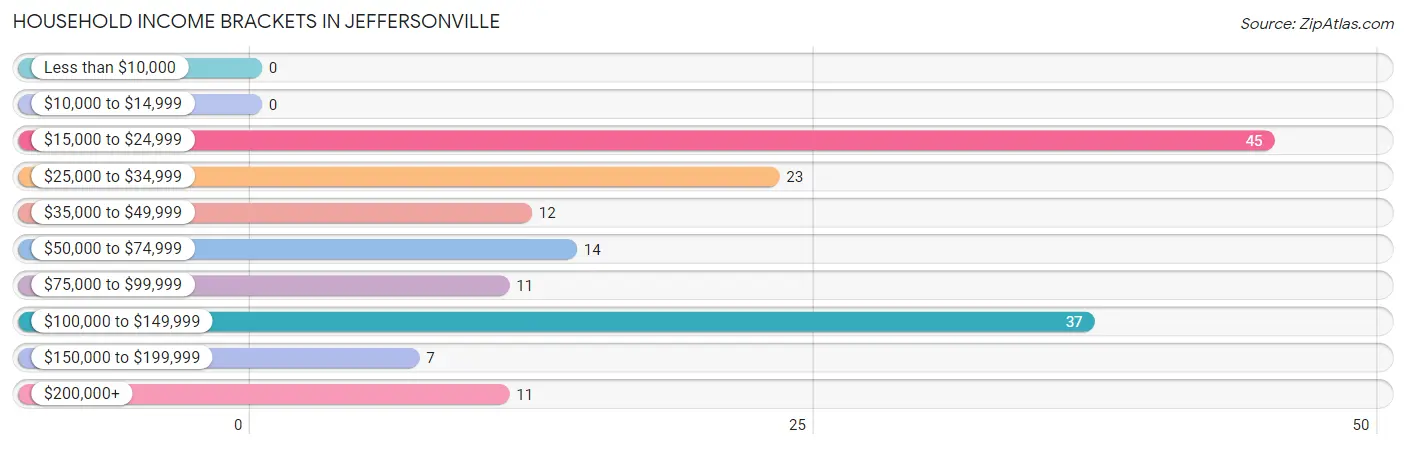
| Income Bracket | # Households | % Households |
| Less than $10,000 | 0 | 0.0% |
| $10,000 to $14,999 | 0 | 0.0% |
| $15,000 to $24,999 | 45 | 28.1% |
| $25,000 to $34,999 | 23 | 14.4% |
| $35,000 to $49,999 | 12 | 7.5% |
| $50,000 to $74,999 | 14 | 8.8% |
| $75,000 to $99,999 | 11 | 6.9% |
| $100,000 to $149,999 | 37 | 23.1% |
| $150,000 to $199,999 | 7 | 4.4% |
| $200,000+ | 11 | 6.9% |
Household Income by Householder Age in Jeffersonville
The median household income in Jeffersonville is $55,000, with the highest median household income of $129,583 found in the 45 to 64 years age bracket for the primary householder. A total of 83 households (51.9%) fall into this category. Meanwhile, the 15 to 24 years age bracket for the primary householder has the lowest median household income of $0, with 23 households (14.4%) in this group.
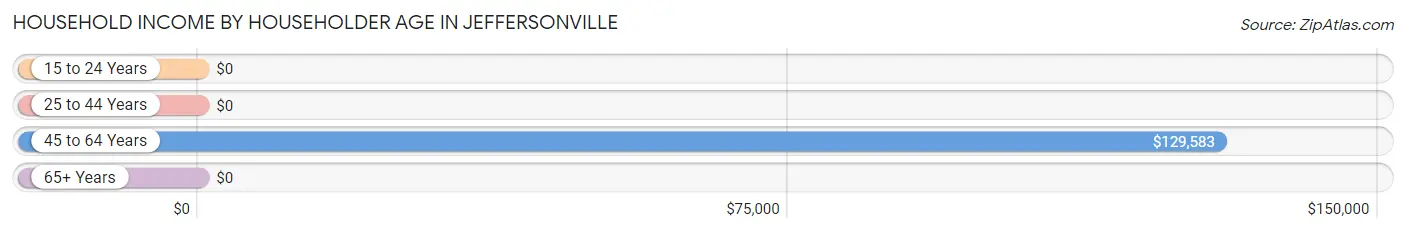
| Income Bracket | # Households | Median Income |
| 15 to 24 Years | 23 (14.4%) | $0 |
| 25 to 44 Years | 19 (11.9%) | $0 |
| 45 to 64 Years | 83 (51.9%) | $129,583 |
| 65+ Years | 35 (21.9%) | $0 |
| Total | 160 (100.0%) | $55,000 |
Poverty in Jeffersonville
Income Below Poverty by Sex and Age in Jeffersonville
With 35.9% poverty level for males and 21.5% for females among the residents of Jeffersonville, 25 to 34 year old males and 18 to 24 year old females are the most vulnerable to poverty, with 24 males (72.7%) and 26 females (72.2%) in their respective age groups living below the poverty level.
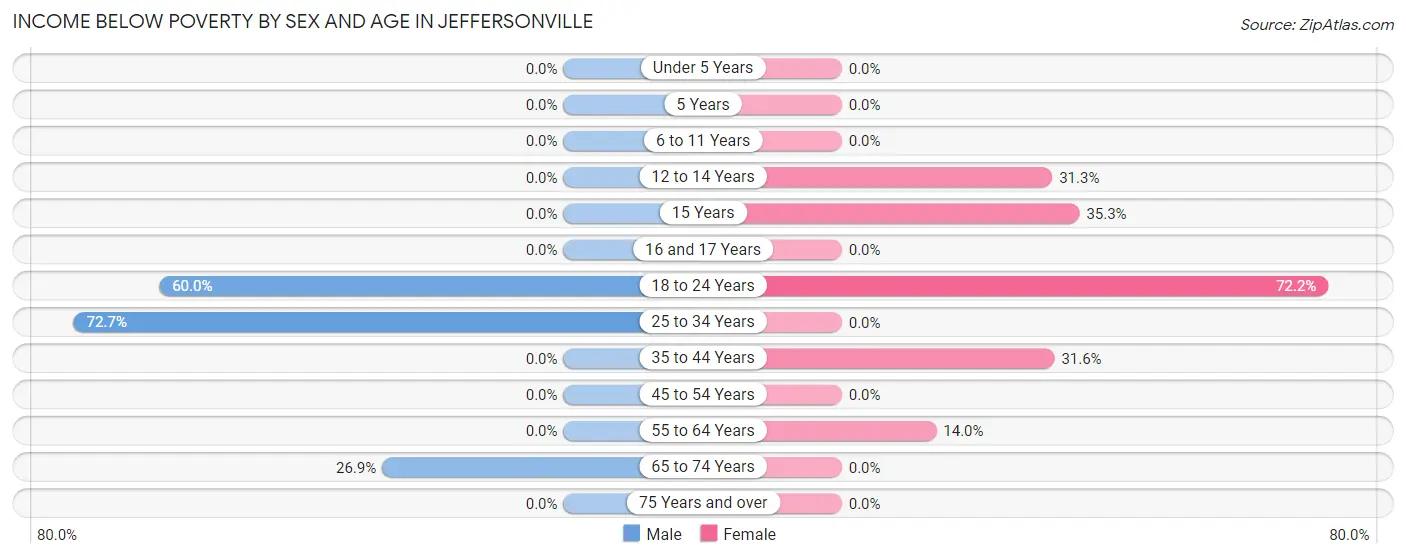
| Age Bracket | Male | Female |
| Under 5 Years | 0 (0.0%) | 0 (0.0%) |
| 5 Years | 0 (0.0%) | 0 (0.0%) |
| 6 to 11 Years | 0 (0.0%) | 0 (0.0%) |
| 12 to 14 Years | 0 (0.0%) | 5 (31.2%) |
| 15 Years | 0 (0.0%) | 6 (35.3%) |
| 16 and 17 Years | 0 (0.0%) | 0 (0.0%) |
| 18 to 24 Years | 39 (60.0%) | 26 (72.2%) |
| 25 to 34 Years | 24 (72.7%) | 0 (0.0%) |
| 35 to 44 Years | 0 (0.0%) | 6 (31.6%) |
| 45 to 54 Years | 0 (0.0%) | 0 (0.0%) |
| 55 to 64 Years | 0 (0.0%) | 8 (14.0%) |
| 65 to 74 Years | 7 (26.9%) | 0 (0.0%) |
| 75 Years and over | 0 (0.0%) | 0 (0.0%) |
| Total | 70 (35.9%) | 51 (21.5%) |
Income Above Poverty by Sex and Age in Jeffersonville
According to the poverty statistics in Jeffersonville, males aged under 5 years and females aged under 5 years are the age groups that are most secure financially, with 100.0% of males and 100.0% of females in these age groups living above the poverty line.
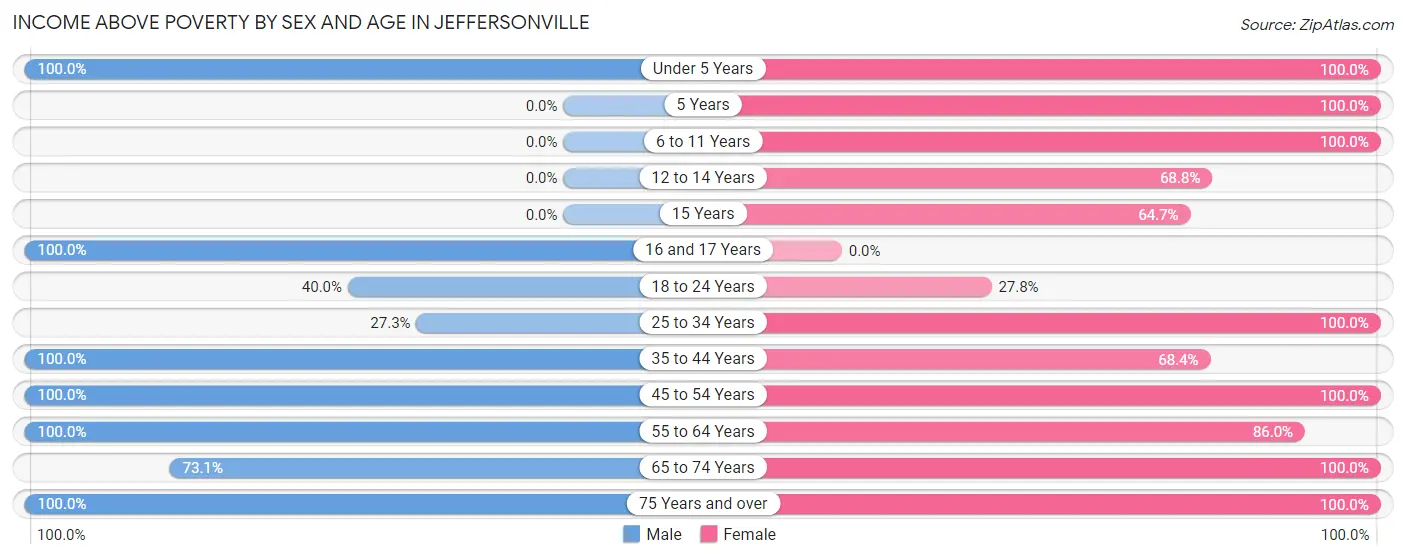
| Age Bracket | Male | Female |
| Under 5 Years | 1 (100.0%) | 9 (100.0%) |
| 5 Years | 0 (0.0%) | 1 (100.0%) |
| 6 to 11 Years | 0 (0.0%) | 12 (100.0%) |
| 12 to 14 Years | 0 (0.0%) | 11 (68.8%) |
| 15 Years | 0 (0.0%) | 11 (64.7%) |
| 16 and 17 Years | 4 (100.0%) | 0 (0.0%) |
| 18 to 24 Years | 26 (40.0%) | 10 (27.8%) |
| 25 to 34 Years | 9 (27.3%) | 16 (100.0%) |
| 35 to 44 Years | 9 (100.0%) | 13 (68.4%) |
| 45 to 54 Years | 29 (100.0%) | 24 (100.0%) |
| 55 to 64 Years | 22 (100.0%) | 49 (86.0%) |
| 65 to 74 Years | 19 (73.1%) | 13 (100.0%) |
| 75 Years and over | 6 (100.0%) | 17 (100.0%) |
| Total | 125 (64.1%) | 186 (78.5%) |
Income Below Poverty Among Married-Couple Families in Jeffersonville
The poverty statistics for married-couple families in Jeffersonville show that 11.1% or 8 of the total 72 families live below the poverty line. Families with no children have the highest poverty rate of 19.1%, comprising of 8 families. On the other hand, families with 1 or 2 children have the lowest poverty rate of 0.0%, which includes 0 families.
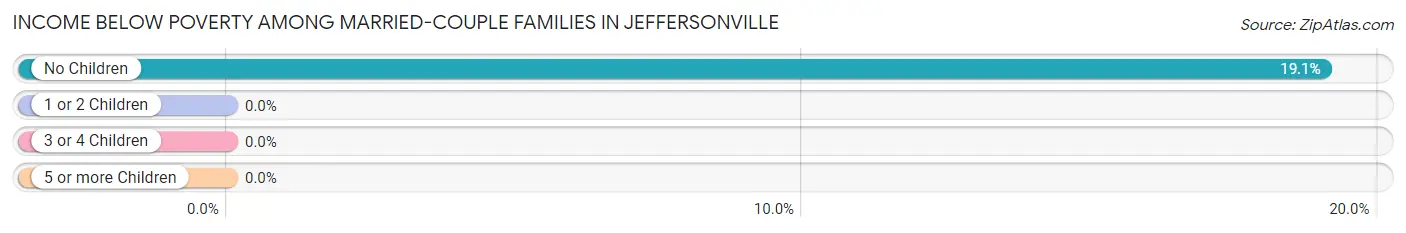
| Children | Above Poverty | Below Poverty |
| No Children | 34 (80.9%) | 8 (19.1%) |
| 1 or 2 Children | 28 (100.0%) | 0 (0.0%) |
| 3 or 4 Children | 2 (100.0%) | 0 (0.0%) |
| 5 or more Children | 0 (0.0%) | 0 (0.0%) |
| Total | 64 (88.9%) | 8 (11.1%) |
Income Below Poverty Among Single-Parent Households in Jeffersonville
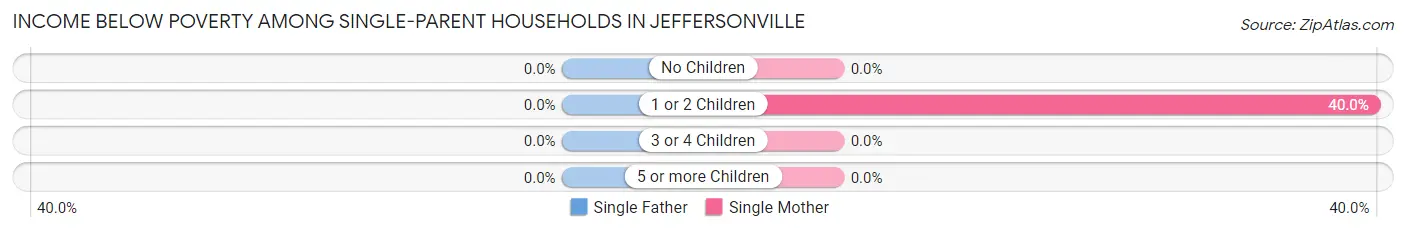
| Children | Single Father | Single Mother |
| No Children | 0 (0.0%) | 0 (0.0%) |
| 1 or 2 Children | 0 (0.0%) | 6 (40.0%) |
| 3 or 4 Children | 0 (0.0%) | 0 (0.0%) |
| 5 or more Children | 0 (0.0%) | 0 (0.0%) |
| Total | 0 (0.0%) | 6 (21.4%) |
Income Below Poverty Among Married-Couple vs Single-Parent Households in Jeffersonville
The poverty data for Jeffersonville shows that 8 of the married-couple family households (11.1%) and 6 of the single-parent households (18.8%) are living below the poverty level. Within the married-couple family households, those with no children have the highest poverty rate, with 8 households (19.1%) falling below the poverty line. Among the single-parent households, those with 1 or 2 children have the highest poverty rate, with 6 household (40.0%) living below poverty.
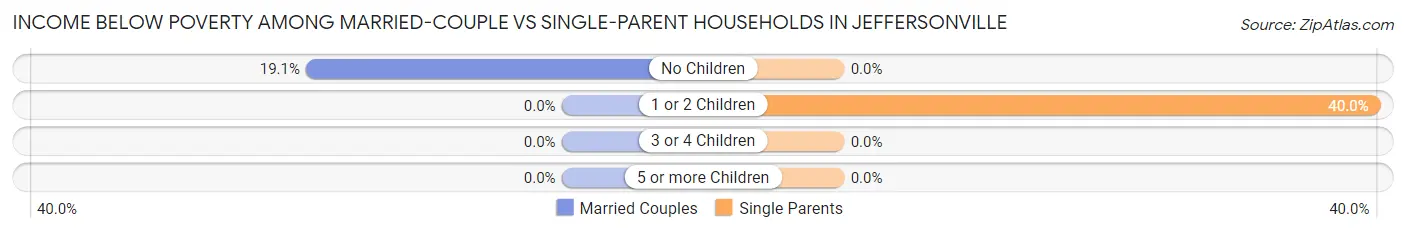
| Children | Married-Couple Families | Single-Parent Households |
| No Children | 8 (19.1%) | 0 (0.0%) |
| 1 or 2 Children | 0 (0.0%) | 6 (40.0%) |
| 3 or 4 Children | 0 (0.0%) | 0 (0.0%) |
| 5 or more Children | 0 (0.0%) | 0 (0.0%) |
| Total | 8 (11.1%) | 6 (18.8%) |
Employment Characteristics in Jeffersonville
Employment by Class of Employer in Jeffersonville
Among the 230 employed individuals in Jeffersonville, private company employees (138 | 60.0%), not-for-profit organizations (54 | 23.5%), and state government employees (28 | 12.2%) make up the most common classes of employment.
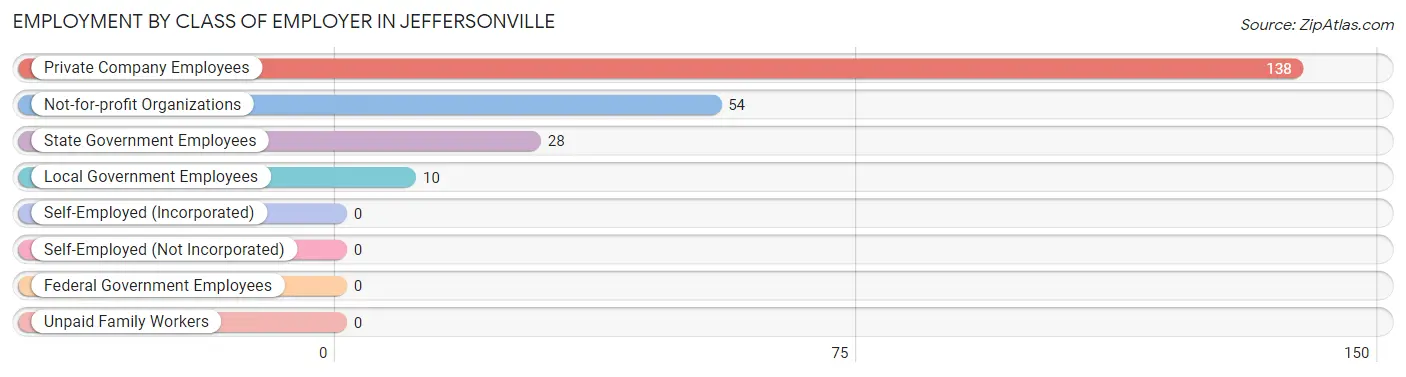
| Employer Class | # Employees | % Employees |
| Private Company Employees | 138 | 60.0% |
| Self-Employed (Incorporated) | 0 | 0.0% |
| Self-Employed (Not Incorporated) | 0 | 0.0% |
| Not-for-profit Organizations | 54 | 23.5% |
| Local Government Employees | 10 | 4.3% |
| State Government Employees | 28 | 12.2% |
| Federal Government Employees | 0 | 0.0% |
| Unpaid Family Workers | 0 | 0.0% |
| Total | 230 | 100.0% |
Employment Status by Age in Jeffersonville
According to the labor force statistics for Jeffersonville, out of the total population over 16 years of age (378), 63.2% or 239 individuals are in the labor force, with 0.8% or 2 of them unemployed. The age group with the highest labor force participation rate is 45 to 54 years, with 100.0% or 53 individuals in the labor force. Within the labor force, the 16 to 19 years age range has the highest percentage of unemployed individuals, with 7.7% or 2 of them being unemployed.
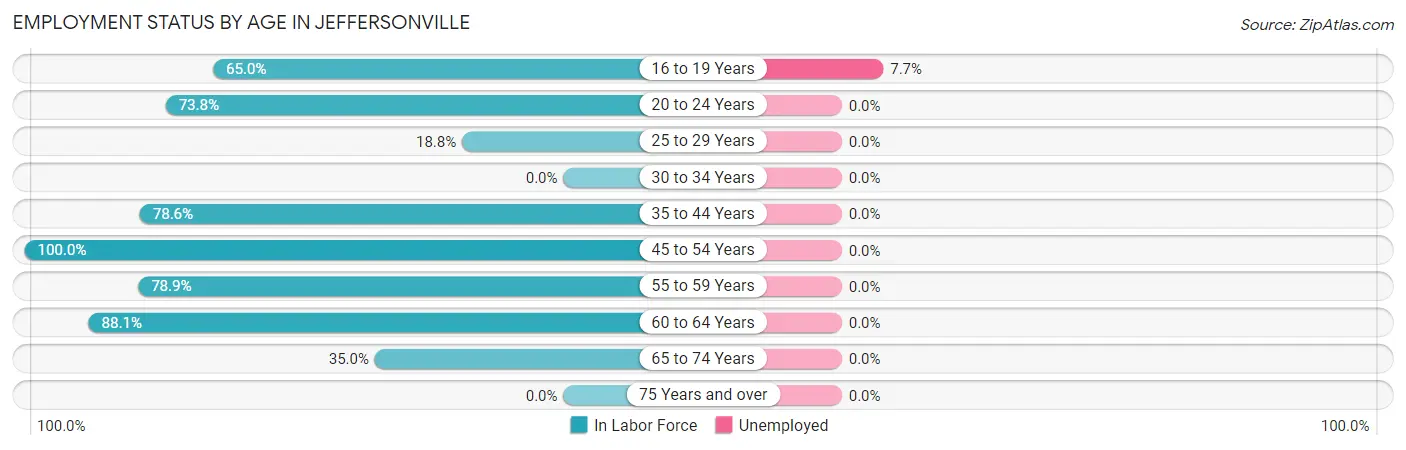
| Age Bracket | In Labor Force | Unemployed |
| 16 to 19 Years | 26 (65.0%) | 2 (7.7%) |
| 20 to 24 Years | 48 (73.8%) | 0 (0.0%) |
| 25 to 29 Years | 9 (18.8%) | 0 (0.0%) |
| 30 to 34 Years | 0 (0.0%) | 0 (0.0%) |
| 35 to 44 Years | 22 (78.6%) | 0 (0.0%) |
| 45 to 54 Years | 53 (100.0%) | 0 (0.0%) |
| 55 to 59 Years | 30 (78.9%) | 0 (0.0%) |
| 60 to 64 Years | 37 (88.1%) | 0 (0.0%) |
| 65 to 74 Years | 14 (35.0%) | 0 (0.0%) |
| 75 Years and over | 0 (0.0%) | 0 (0.0%) |
| Total | 239 (63.2%) | 2 (0.8%) |
Employment Status by Educational Attainment in Jeffersonville
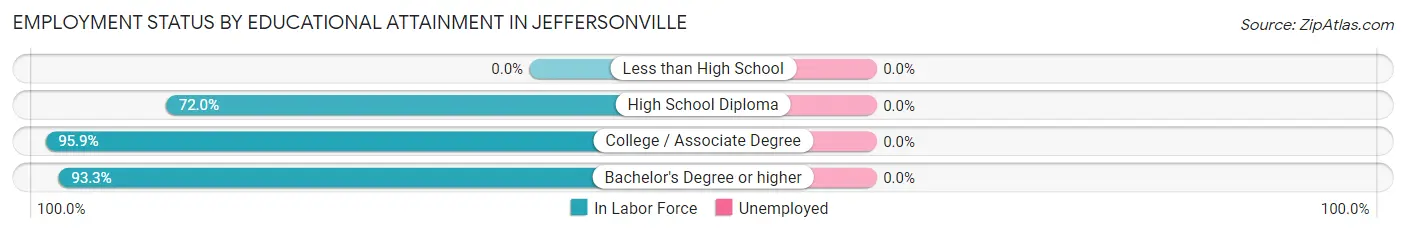
| Educational Attainment | In Labor Force | Unemployed |
| Less than High School | 0 (0.0%) | 0 (0.0%) |
| High School Diploma | 67 (72.0%) | 0 (0.0%) |
| College / Associate Degree | 70 (95.9%) | 0 (0.0%) |
| Bachelor's Degree or higher | 14 (93.3%) | 0 (0.0%) |
| Total | 151 (71.9%) | 0 (0.0%) |
Employment Occupations by Sex in Jeffersonville
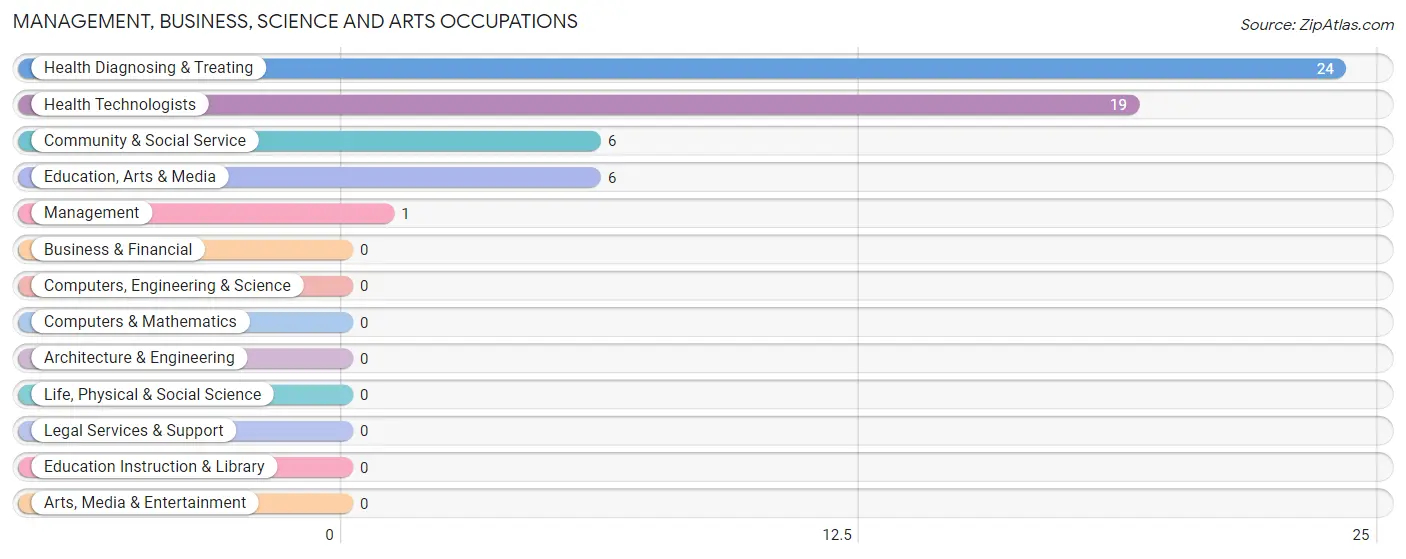
Management, Business, Science and Arts Occupations
The most common Management, Business, Science and Arts occupations in Jeffersonville are Health Diagnosing & Treating (24 | 10.1%), Health Technologists (19 | 8.0%), Community & Social Service (6 | 2.5%), Education, Arts & Media (6 | 2.5%), and Management (1 | 0.4%).
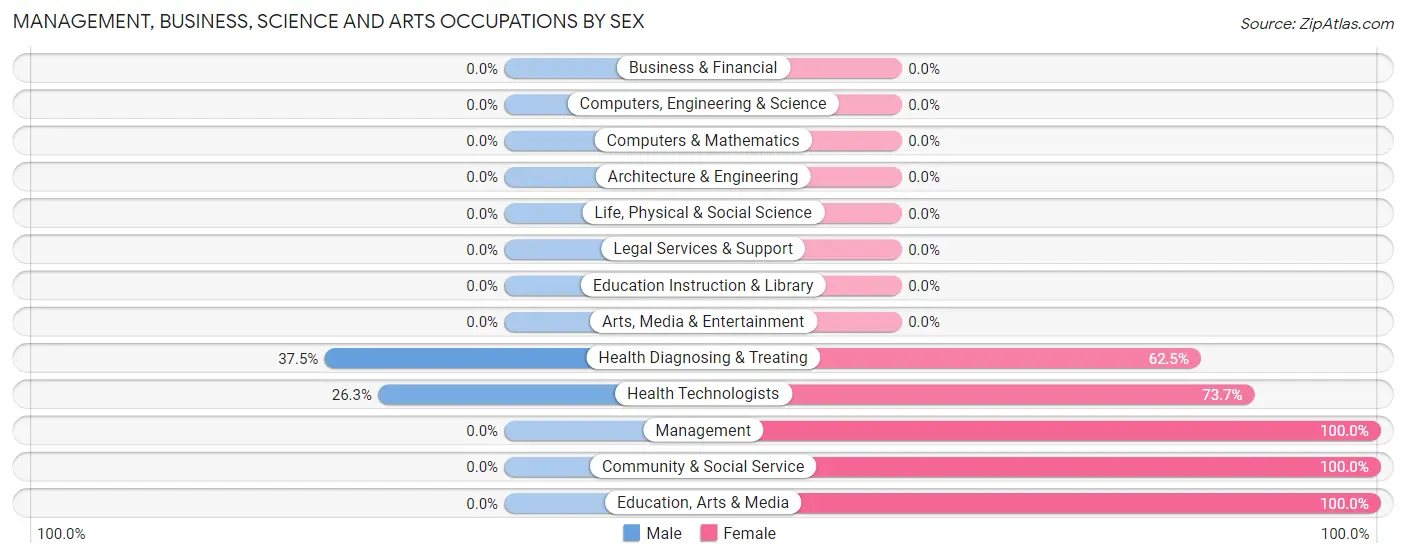
Management, Business, Science and Arts Occupations by Sex
Within the Management, Business, Science and Arts occupations in Jeffersonville, the most male-oriented occupations are Health Diagnosing & Treating (37.5%), and Health Technologists (26.3%), while the most female-oriented occupations are Management (100.0%), Community & Social Service (100.0%), and Education, Arts & Media (100.0%).
| Occupation | Male | Female |
| Management | 0 (0.0%) | 1 (100.0%) |
| Business & Financial | 0 (0.0%) | 0 (0.0%) |
| Computers, Engineering & Science | 0 (0.0%) | 0 (0.0%) |
| Computers & Mathematics | 0 (0.0%) | 0 (0.0%) |
| Architecture & Engineering | 0 (0.0%) | 0 (0.0%) |
| Life, Physical & Social Science | 0 (0.0%) | 0 (0.0%) |
| Community & Social Service | 0 (0.0%) | 6 (100.0%) |
| Education, Arts & Media | 0 (0.0%) | 6 (100.0%) |
| Legal Services & Support | 0 (0.0%) | 0 (0.0%) |
| Education Instruction & Library | 0 (0.0%) | 0 (0.0%) |
| Arts, Media & Entertainment | 0 (0.0%) | 0 (0.0%) |
| Health Diagnosing & Treating | 9 (37.5%) | 15 (62.5%) |
| Health Technologists | 5 (26.3%) | 14 (73.7%) |
| Total (Category) | 9 (29.0%) | 22 (71.0%) |
| Total (Overall) | 126 (53.2%) | 111 (46.8%) |
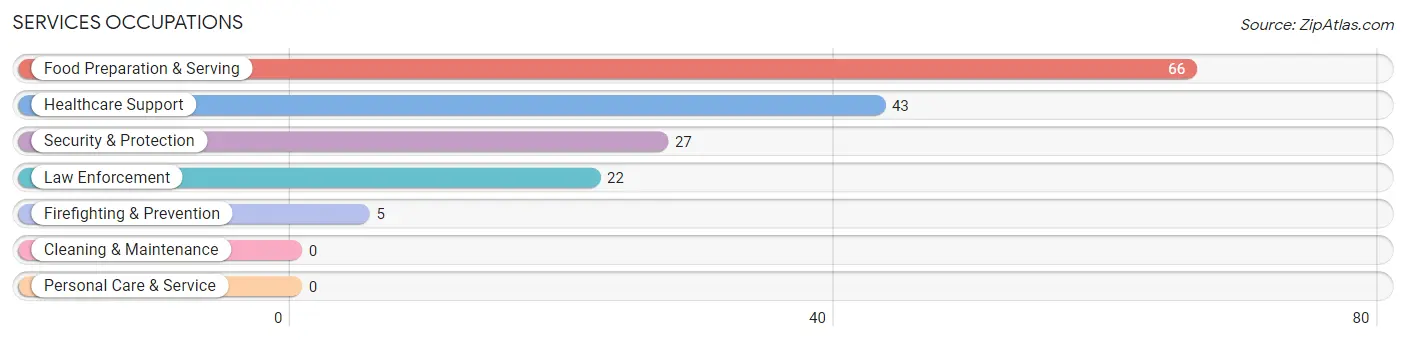
Services Occupations
The most common Services occupations in Jeffersonville are Food Preparation & Serving (66 | 27.9%), Healthcare Support (43 | 18.1%), Security & Protection (27 | 11.4%), Law Enforcement (22 | 9.3%), and Firefighting & Prevention (5 | 2.1%).
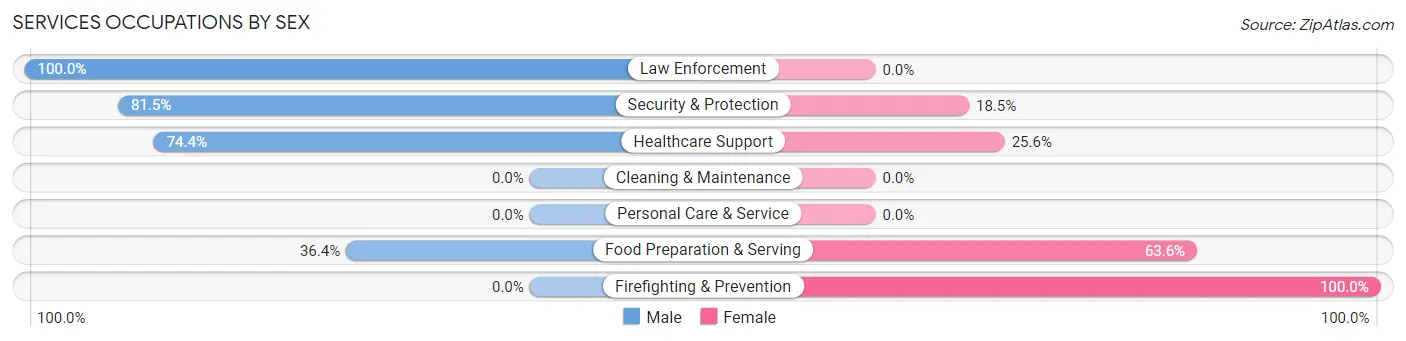
Services Occupations by Sex
Within the Services occupations in Jeffersonville, the most male-oriented occupations are Law Enforcement (100.0%), Security & Protection (81.5%), and Healthcare Support (74.4%), while the most female-oriented occupations are Firefighting & Prevention (100.0%), Food Preparation & Serving (63.6%), and Healthcare Support (25.6%).
| Occupation | Male | Female |
| Healthcare Support | 32 (74.4%) | 11 (25.6%) |
| Security & Protection | 22 (81.5%) | 5 (18.5%) |
| Firefighting & Prevention | 0 (0.0%) | 5 (100.0%) |
| Law Enforcement | 22 (100.0%) | 0 (0.0%) |
| Food Preparation & Serving | 24 (36.4%) | 42 (63.6%) |
| Cleaning & Maintenance | 0 (0.0%) | 0 (0.0%) |
| Personal Care & Service | 0 (0.0%) | 0 (0.0%) |
| Total (Category) | 78 (57.4%) | 58 (42.6%) |
| Total (Overall) | 126 (53.2%) | 111 (46.8%) |
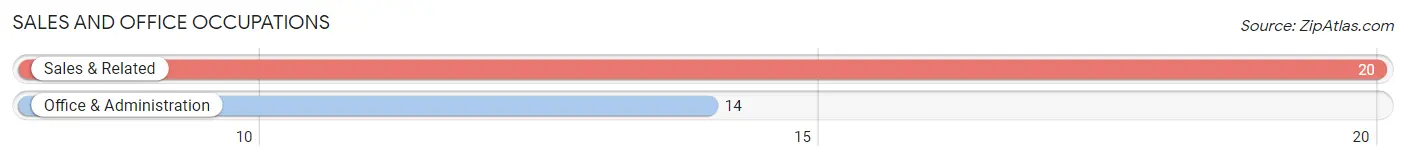
Sales and Office Occupations
The most common Sales and Office occupations in Jeffersonville are Sales & Related (20 | 8.4%), and Office & Administration (14 | 5.9%).
Sales and Office Occupations by Sex
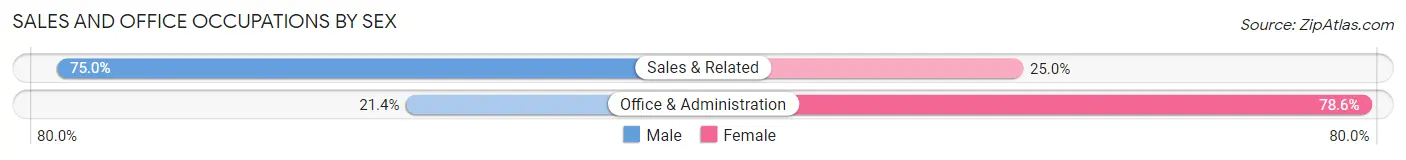
| Occupation | Male | Female |
| Sales & Related | 15 (75.0%) | 5 (25.0%) |
| Office & Administration | 3 (21.4%) | 11 (78.6%) |
| Total (Category) | 18 (52.9%) | 16 (47.1%) |
| Total (Overall) | 126 (53.2%) | 111 (46.8%) |
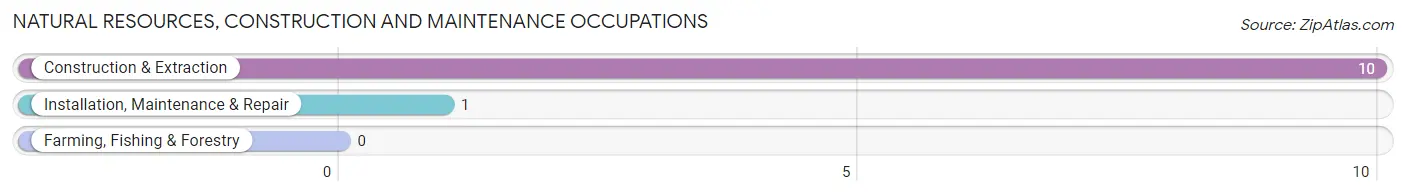
Natural Resources, Construction and Maintenance Occupations
The most common Natural Resources, Construction and Maintenance occupations in Jeffersonville are Construction & Extraction (10 | 4.2%), and Installation, Maintenance & Repair (1 | 0.4%).
Natural Resources, Construction and Maintenance Occupations by Sex
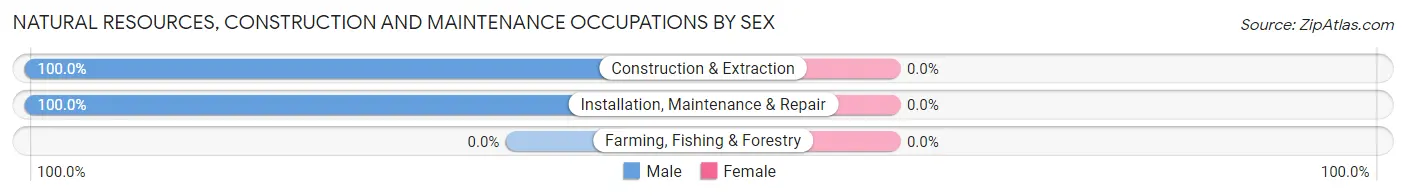
| Occupation | Male | Female |
| Farming, Fishing & Forestry | 0 (0.0%) | 0 (0.0%) |
| Construction & Extraction | 10 (100.0%) | 0 (0.0%) |
| Installation, Maintenance & Repair | 1 (100.0%) | 0 (0.0%) |
| Total (Category) | 11 (100.0%) | 0 (0.0%) |
| Total (Overall) | 126 (53.2%) | 111 (46.8%) |
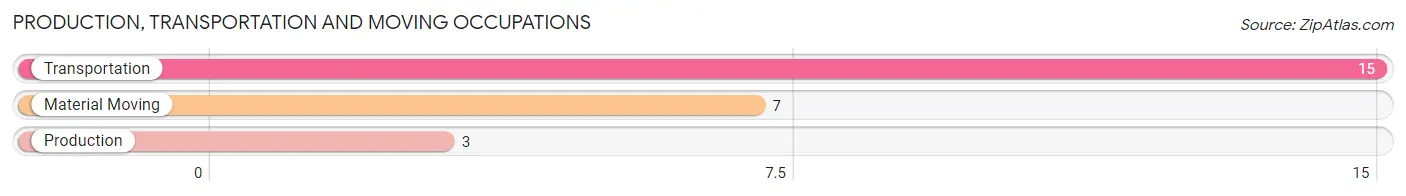
Production, Transportation and Moving Occupations
The most common Production, Transportation and Moving occupations in Jeffersonville are Transportation (15 | 6.3%), Material Moving (7 | 2.9%), and Production (3 | 1.3%).
Production, Transportation and Moving Occupations by Sex
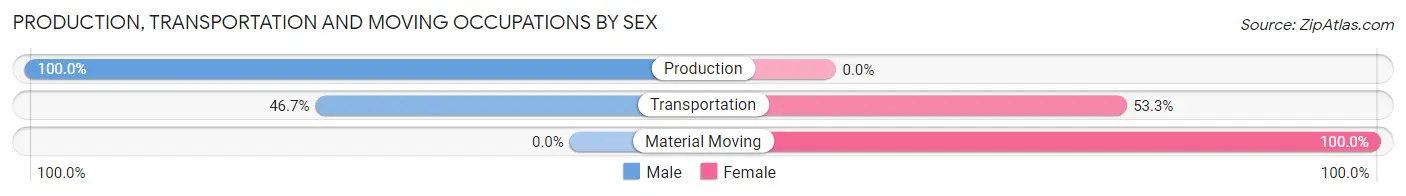
| Occupation | Male | Female |
| Production | 3 (100.0%) | 0 (0.0%) |
| Transportation | 7 (46.7%) | 8 (53.3%) |
| Material Moving | 0 (0.0%) | 7 (100.0%) |
| Total (Category) | 10 (40.0%) | 15 (60.0%) |
| Total (Overall) | 126 (53.2%) | 111 (46.8%) |
Employment Industries by Sex in Jeffersonville
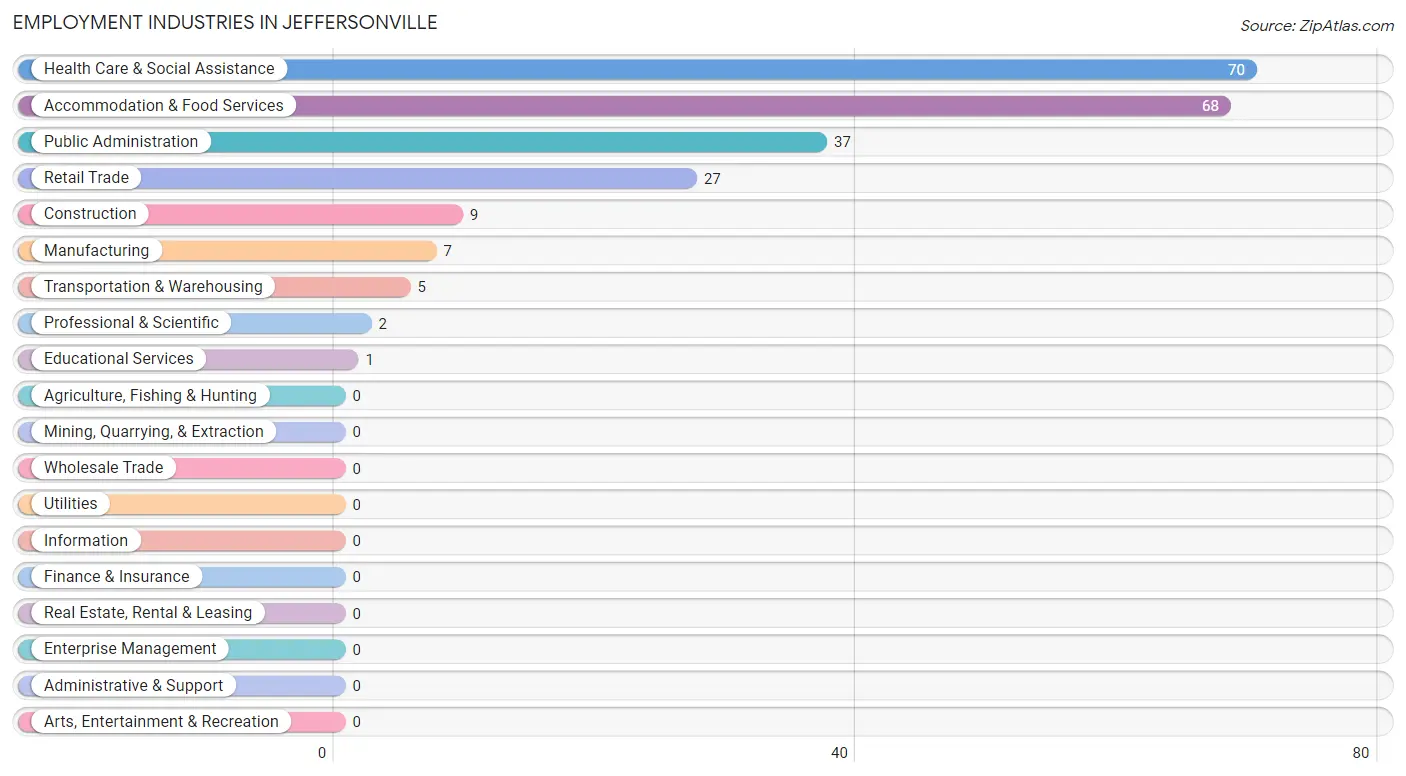
Employment Industries in Jeffersonville
The major employment industries in Jeffersonville include Health Care & Social Assistance (70 | 29.5%), Accommodation & Food Services (68 | 28.7%), Public Administration (37 | 15.6%), Retail Trade (27 | 11.4%), and Construction (9 | 3.8%).
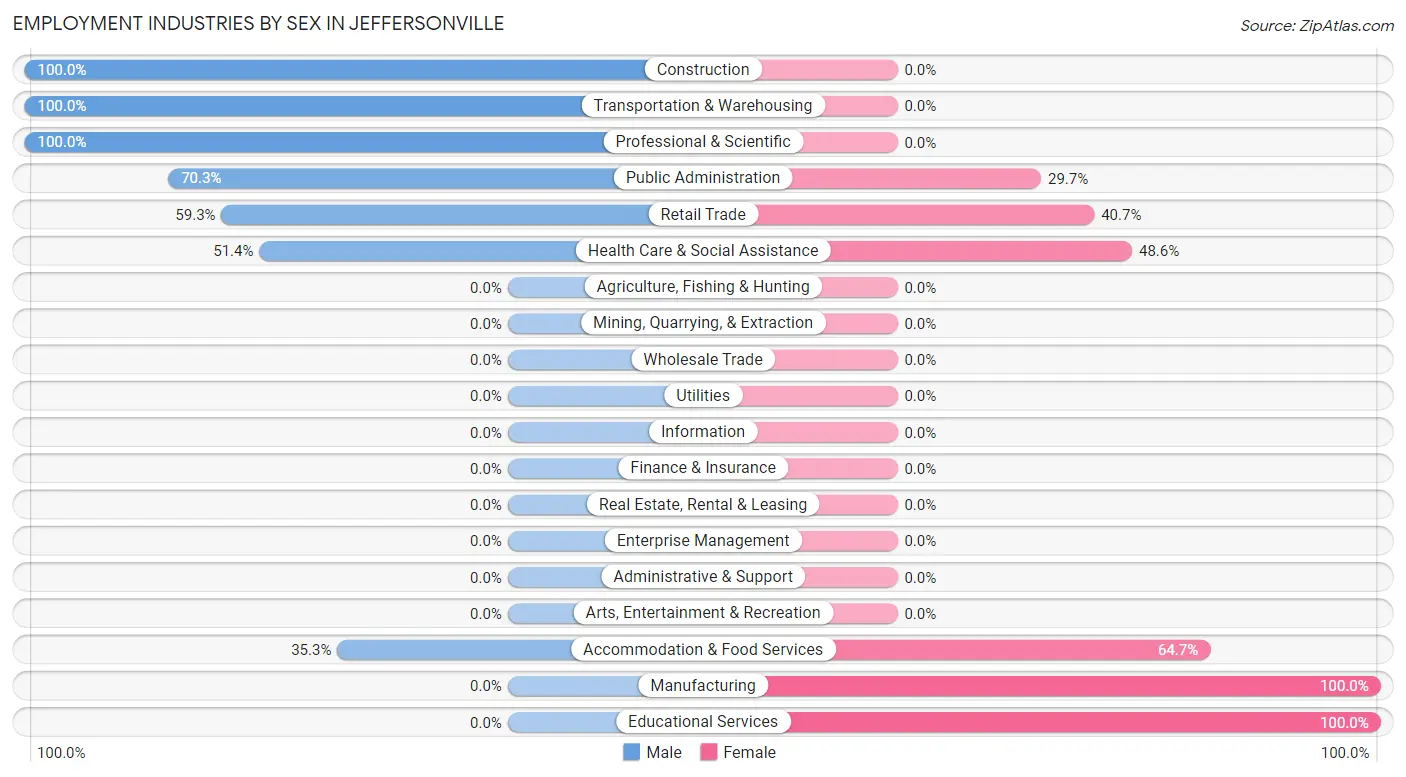
Employment Industries by Sex in Jeffersonville
The Jeffersonville industries that see more men than women are Construction (100.0%), Transportation & Warehousing (100.0%), and Professional & Scientific (100.0%), whereas the industries that tend to have a higher number of women are Manufacturing (100.0%), Educational Services (100.0%), and Accommodation & Food Services (64.7%).
| Industry | Male | Female |
| Agriculture, Fishing & Hunting | 0 (0.0%) | 0 (0.0%) |
| Mining, Quarrying, & Extraction | 0 (0.0%) | 0 (0.0%) |
| Construction | 9 (100.0%) | 0 (0.0%) |
| Manufacturing | 0 (0.0%) | 7 (100.0%) |
| Wholesale Trade | 0 (0.0%) | 0 (0.0%) |
| Retail Trade | 16 (59.3%) | 11 (40.7%) |
| Transportation & Warehousing | 5 (100.0%) | 0 (0.0%) |
| Utilities | 0 (0.0%) | 0 (0.0%) |
| Information | 0 (0.0%) | 0 (0.0%) |
| Finance & Insurance | 0 (0.0%) | 0 (0.0%) |
| Real Estate, Rental & Leasing | 0 (0.0%) | 0 (0.0%) |
| Professional & Scientific | 2 (100.0%) | 0 (0.0%) |
| Enterprise Management | 0 (0.0%) | 0 (0.0%) |
| Administrative & Support | 0 (0.0%) | 0 (0.0%) |
| Educational Services | 0 (0.0%) | 1 (100.0%) |
| Health Care & Social Assistance | 36 (51.4%) | 34 (48.6%) |
| Arts, Entertainment & Recreation | 0 (0.0%) | 0 (0.0%) |
| Accommodation & Food Services | 24 (35.3%) | 44 (64.7%) |
| Public Administration | 26 (70.3%) | 11 (29.7%) |
| Total | 126 (53.2%) | 111 (46.8%) |
Education in Jeffersonville
School Enrollment in Jeffersonville
The most common levels of schooling among the 105 students in Jeffersonville are high school (53 | 50.5%), college / undergraduate (19 | 18.1%), and middle school (16 | 15.2%).
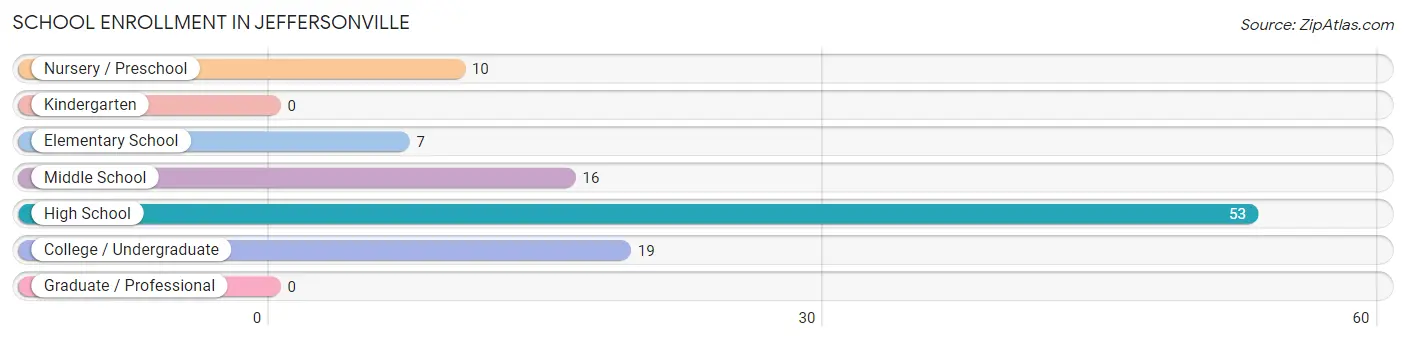
| School Level | # Students | % Students |
| Nursery / Preschool | 10 | 9.5% |
| Kindergarten | 0 | 0.0% |
| Elementary School | 7 | 6.7% |
| Middle School | 16 | 15.2% |
| High School | 53 | 50.5% |
| College / Undergraduate | 19 | 18.1% |
| Graduate / Professional | 0 | 0.0% |
| Total | 105 | 100.0% |
School Enrollment by Age by Funding Source in Jeffersonville
Out of a total of 105 students who are enrolled in schools in Jeffersonville, 21 (20.0%) attend a private institution, while the remaining 84 (80.0%) are enrolled in public schools. The age group of 18 to 19 year olds has the highest likelihood of being enrolled in private schools, with 10 (37.0% in the age bracket) enrolled. Conversely, the age group of 3 to 4 year olds has the lowest likelihood of being enrolled in a private school, with 9 (100.0% in the age bracket) attending a public institution.
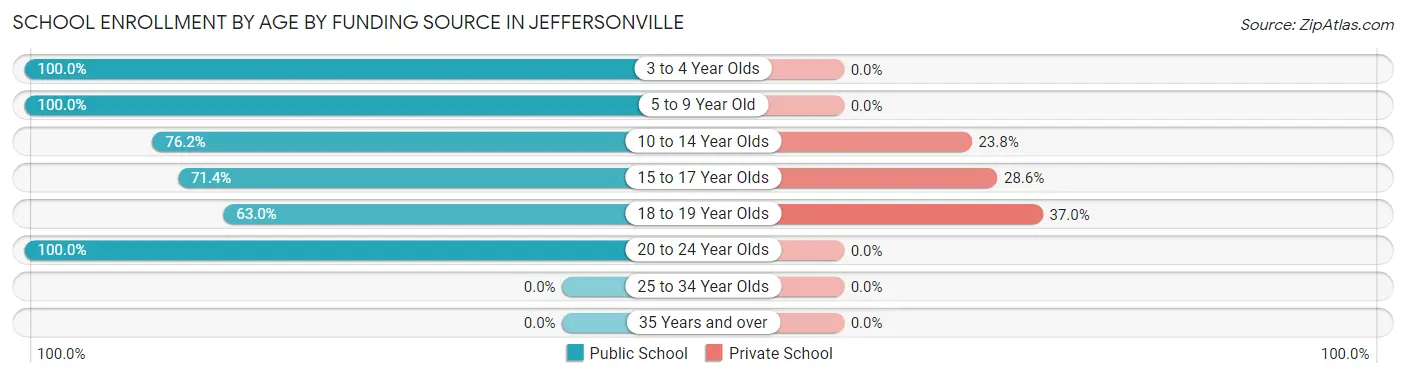
| Age Bracket | Public School | Private School |
| 3 to 4 Year Olds | 9 (100.0%) | 0 (0.0%) |
| 5 to 9 Year Old | 8 (100.0%) | 0 (0.0%) |
| 10 to 14 Year Olds | 16 (76.2%) | 5 (23.8%) |
| 15 to 17 Year Olds | 15 (71.4%) | 6 (28.6%) |
| 18 to 19 Year Olds | 17 (63.0%) | 10 (37.0%) |
| 20 to 24 Year Olds | 19 (100.0%) | 0 (0.0%) |
| 25 to 34 Year Olds | 0 (0.0%) | 0 (0.0%) |
| 35 Years and over | 0 (0.0%) | 0 (0.0%) |
| Total | 84 (80.0%) | 21 (20.0%) |
Educational Attainment by Field of Study in Jeffersonville
Social sciences (6 | 19.4%), science & technology (5 | 16.1%), business (5 | 16.1%), education (5 | 16.1%), and bio, nature & agricultural (4 | 12.9%) are the most common fields of study among 31 individuals in Jeffersonville who have obtained a bachelor's degree or higher.
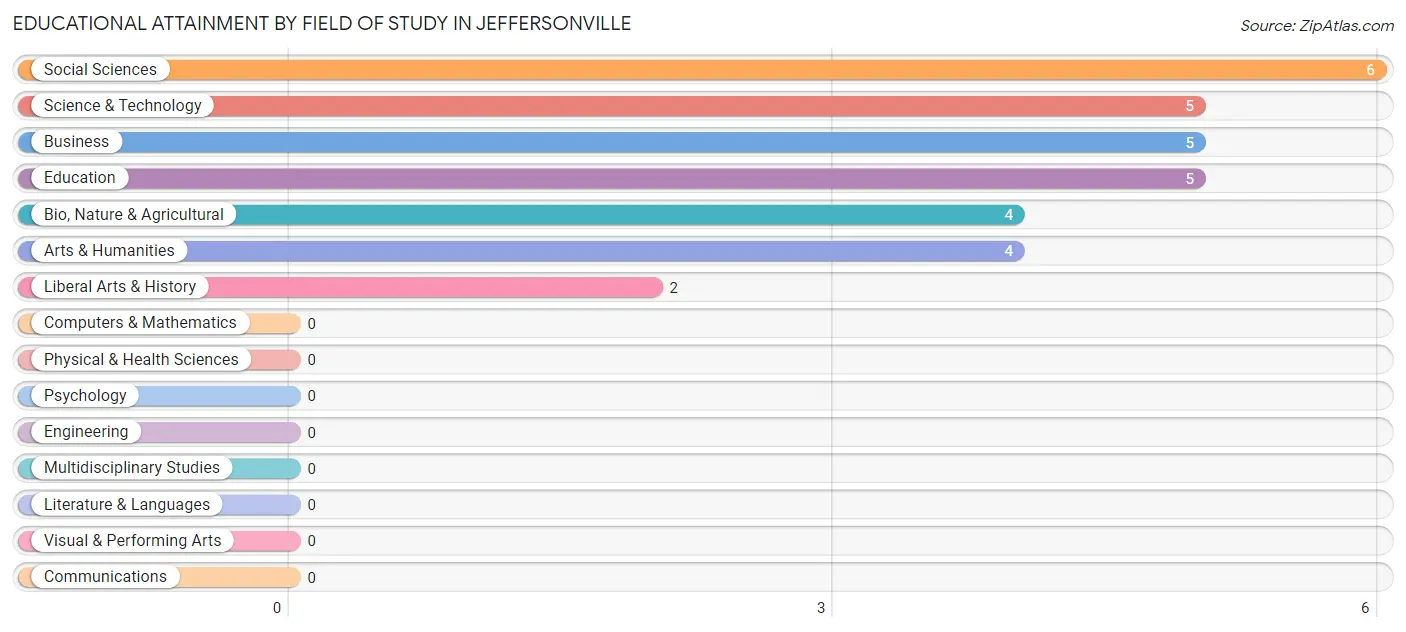
| Field of Study | # Graduates | % Graduates |
| Computers & Mathematics | 0 | 0.0% |
| Bio, Nature & Agricultural | 4 | 12.9% |
| Physical & Health Sciences | 0 | 0.0% |
| Psychology | 0 | 0.0% |
| Social Sciences | 6 | 19.4% |
| Engineering | 0 | 0.0% |
| Multidisciplinary Studies | 0 | 0.0% |
| Science & Technology | 5 | 16.1% |
| Business | 5 | 16.1% |
| Education | 5 | 16.1% |
| Literature & Languages | 0 | 0.0% |
| Liberal Arts & History | 2 | 6.5% |
| Visual & Performing Arts | 0 | 0.0% |
| Communications | 0 | 0.0% |
| Arts & Humanities | 4 | 12.9% |
| Total | 31 | 100.0% |
Transportation & Commute in Jeffersonville
Vehicle Availability by Sex in Jeffersonville
The most prevalent vehicle ownership categories in Jeffersonville are males with 2 vehicles (41, accounting for 32.5%) and females with 2 vehicles (23, making up 39.8%).
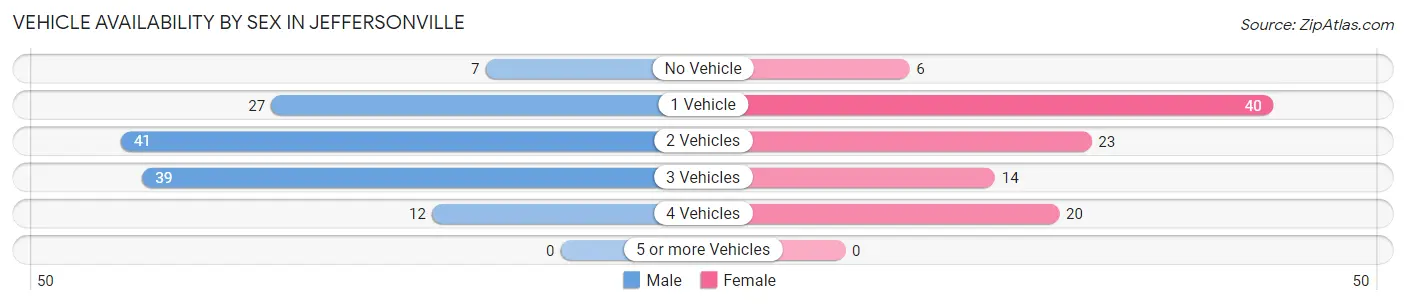
| Vehicles Available | Male | Female |
| No Vehicle | 7 (5.6%) | 6 (5.8%) |
| 1 Vehicle | 27 (21.4%) | 40 (38.8%) |
| 2 Vehicles | 41 (32.5%) | 23 (22.3%) |
| 3 Vehicles | 39 (30.9%) | 14 (13.6%) |
| 4 Vehicles | 12 (9.5%) | 20 (19.4%) |
| 5 or more Vehicles | 0 (0.0%) | 0 (0.0%) |
| Total | 126 (100.0%) | 103 (100.0%) |
Commute Time in Jeffersonville
The most frequently occuring commute durations in Jeffersonville are 5 to 9 minutes (39 commuters, 17.0%), 10 to 14 minutes (39 commuters, 17.0%), and 40 to 44 minutes (34 commuters, 14.8%).
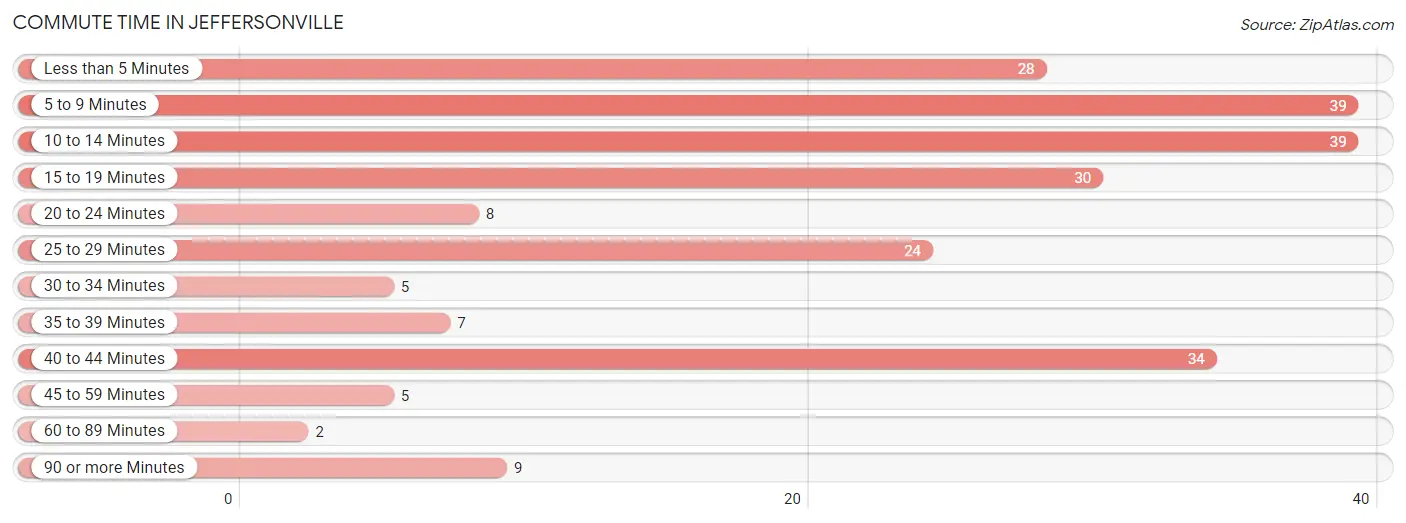
| Commute Time | # Commuters | % Commuters |
| Less than 5 Minutes | 28 | 12.2% |
| 5 to 9 Minutes | 39 | 17.0% |
| 10 to 14 Minutes | 39 | 17.0% |
| 15 to 19 Minutes | 30 | 13.0% |
| 20 to 24 Minutes | 8 | 3.5% |
| 25 to 29 Minutes | 24 | 10.4% |
| 30 to 34 Minutes | 5 | 2.2% |
| 35 to 39 Minutes | 7 | 3.0% |
| 40 to 44 Minutes | 34 | 14.8% |
| 45 to 59 Minutes | 5 | 2.2% |
| 60 to 89 Minutes | 2 | 0.9% |
| 90 or more Minutes | 9 | 3.9% |
Commute Time by Sex in Jeffersonville
The most common commute times in Jeffersonville are 40 to 44 minutes (29 commuters, 23.0%) for males and 10 to 14 minutes (30 commuters, 28.8%) for females.
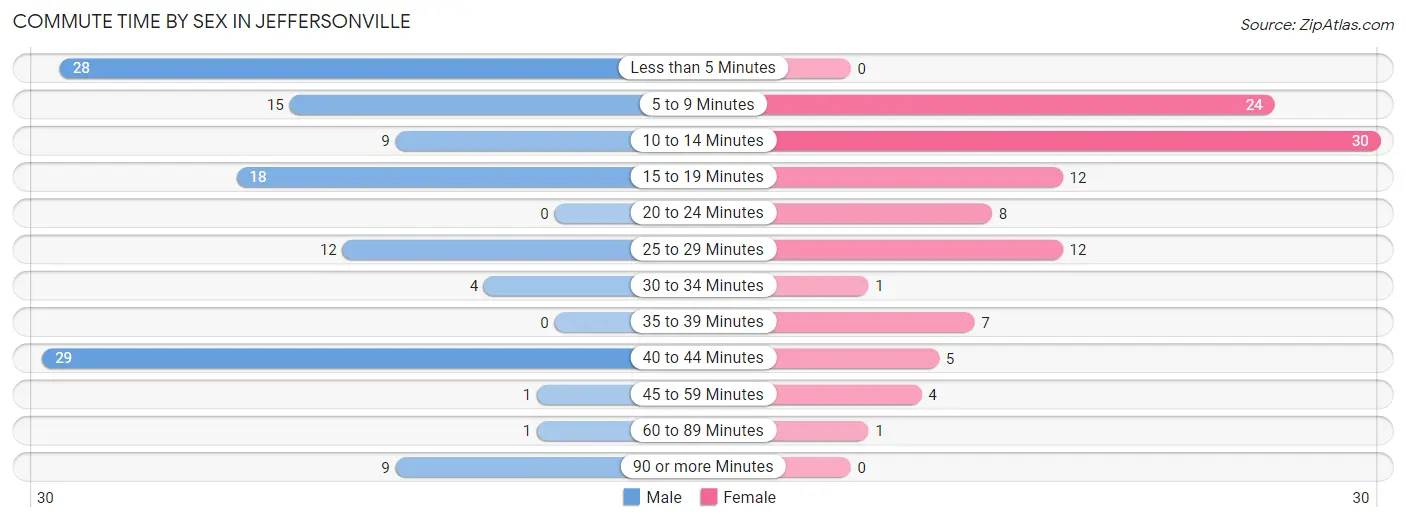
| Commute Time | Male | Female |
| Less than 5 Minutes | 28 (22.2%) | 0 (0.0%) |
| 5 to 9 Minutes | 15 (11.9%) | 24 (23.1%) |
| 10 to 14 Minutes | 9 (7.1%) | 30 (28.8%) |
| 15 to 19 Minutes | 18 (14.3%) | 12 (11.5%) |
| 20 to 24 Minutes | 0 (0.0%) | 8 (7.7%) |
| 25 to 29 Minutes | 12 (9.5%) | 12 (11.5%) |
| 30 to 34 Minutes | 4 (3.2%) | 1 (1.0%) |
| 35 to 39 Minutes | 0 (0.0%) | 7 (6.7%) |
| 40 to 44 Minutes | 29 (23.0%) | 5 (4.8%) |
| 45 to 59 Minutes | 1 (0.8%) | 4 (3.8%) |
| 60 to 89 Minutes | 1 (0.8%) | 1 (1.0%) |
| 90 or more Minutes | 9 (7.1%) | 0 (0.0%) |
Time of Departure to Work by Sex in Jeffersonville
The most frequent times of departure to work in Jeffersonville are 5:30 AM to 5:59 AM (50, 39.7%) for males and 12:00 PM to 3:59 PM (33, 31.7%) for females.
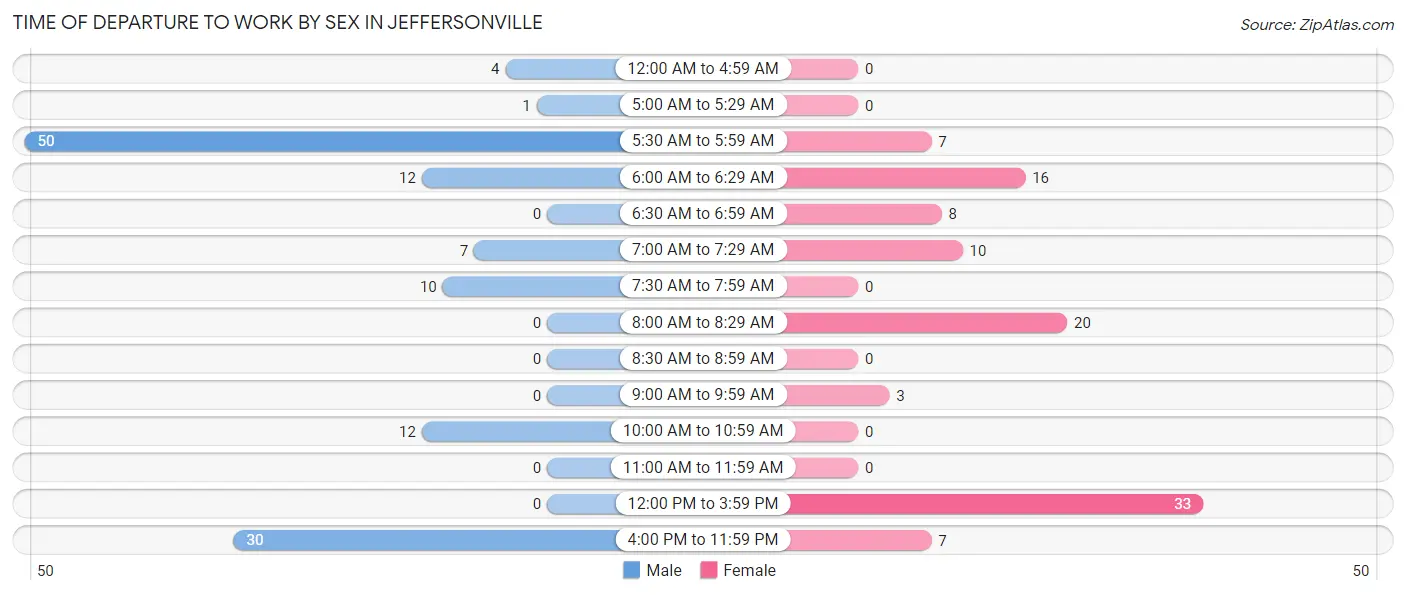
| Time of Departure | Male | Female |
| 12:00 AM to 4:59 AM | 4 (3.2%) | 0 (0.0%) |
| 5:00 AM to 5:29 AM | 1 (0.8%) | 0 (0.0%) |
| 5:30 AM to 5:59 AM | 50 (39.7%) | 7 (6.7%) |
| 6:00 AM to 6:29 AM | 12 (9.5%) | 16 (15.4%) |
| 6:30 AM to 6:59 AM | 0 (0.0%) | 8 (7.7%) |
| 7:00 AM to 7:29 AM | 7 (5.6%) | 10 (9.6%) |
| 7:30 AM to 7:59 AM | 10 (7.9%) | 0 (0.0%) |
| 8:00 AM to 8:29 AM | 0 (0.0%) | 20 (19.2%) |
| 8:30 AM to 8:59 AM | 0 (0.0%) | 0 (0.0%) |
| 9:00 AM to 9:59 AM | 0 (0.0%) | 3 (2.9%) |
| 10:00 AM to 10:59 AM | 12 (9.5%) | 0 (0.0%) |
| 11:00 AM to 11:59 AM | 0 (0.0%) | 0 (0.0%) |
| 12:00 PM to 3:59 PM | 0 (0.0%) | 33 (31.7%) |
| 4:00 PM to 11:59 PM | 30 (23.8%) | 7 (6.7%) |
| Total | 126 (100.0%) | 104 (100.0%) |
Housing Occupancy in Jeffersonville
Occupancy by Ownership in Jeffersonville
Of the total 160 dwellings in Jeffersonville, owner-occupied units account for 99 (61.9%), while renter-occupied units make up 61 (38.1%).
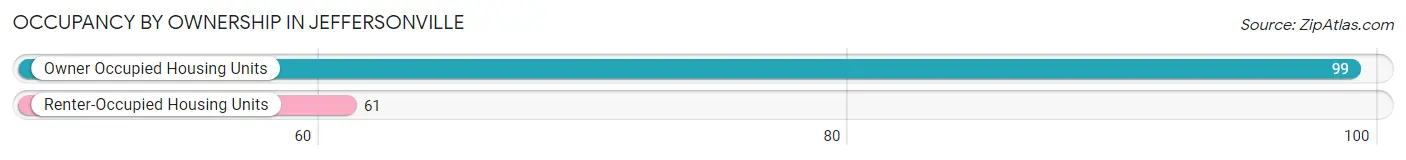
| Occupancy | # Housing Units | % Housing Units |
| Owner Occupied Housing Units | 99 | 61.9% |
| Renter-Occupied Housing Units | 61 | 38.1% |
| Total Occupied Housing Units | 160 | 100.0% |
Occupancy by Household Size in Jeffersonville
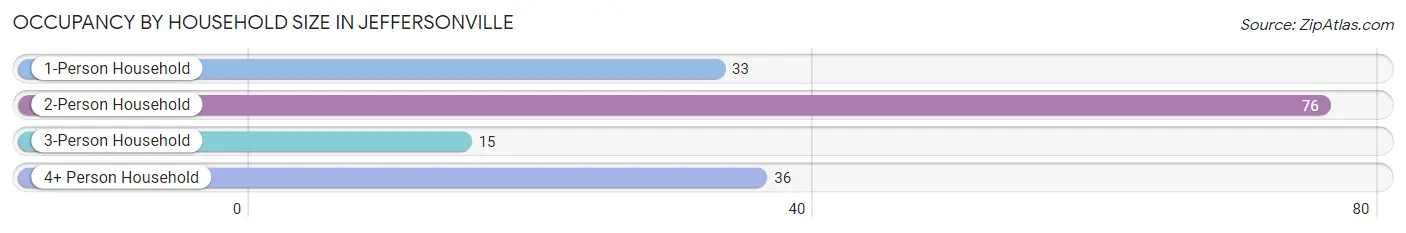
| Household Size | # Housing Units | % Housing Units |
| 1-Person Household | 33 | 20.6% |
| 2-Person Household | 76 | 47.5% |
| 3-Person Household | 15 | 9.4% |
| 4+ Person Household | 36 | 22.5% |
| Total Housing Units | 160 | 100.0% |
Occupancy by Ownership by Household Size in Jeffersonville
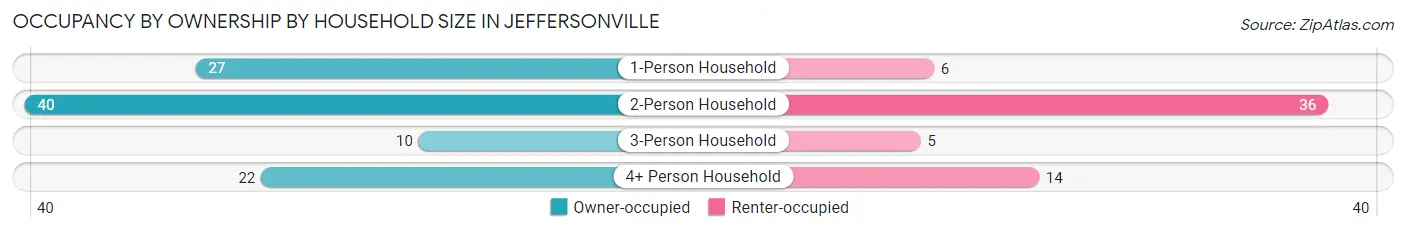
| Household Size | Owner-occupied | Renter-occupied |
| 1-Person Household | 27 (81.8%) | 6 (18.2%) |
| 2-Person Household | 40 (52.6%) | 36 (47.4%) |
| 3-Person Household | 10 (66.7%) | 5 (33.3%) |
| 4+ Person Household | 22 (61.1%) | 14 (38.9%) |
| Total Housing Units | 99 (61.9%) | 61 (38.1%) |
Occupancy by Educational Attainment in Jeffersonville
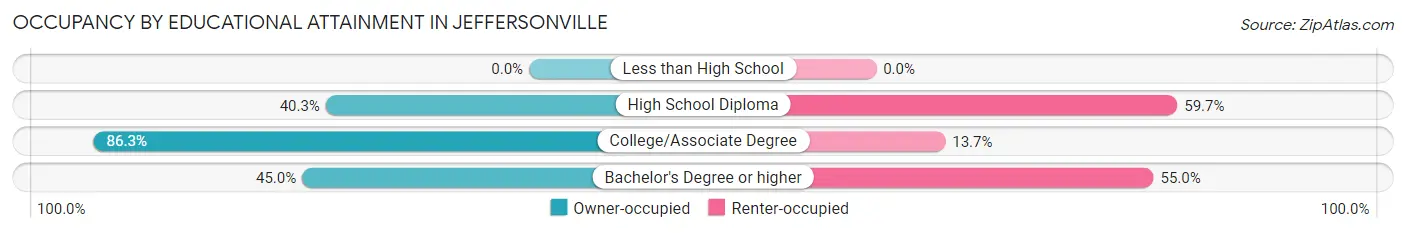
| Household Size | Owner-occupied | Renter-occupied |
| Less than High School | 0 (0.0%) | 0 (0.0%) |
| High School Diploma | 27 (40.3%) | 40 (59.7%) |
| College/Associate Degree | 63 (86.3%) | 10 (13.7%) |
| Bachelor's Degree or higher | 9 (45.0%) | 11 (55.0%) |
Occupancy by Age of Householder in Jeffersonville
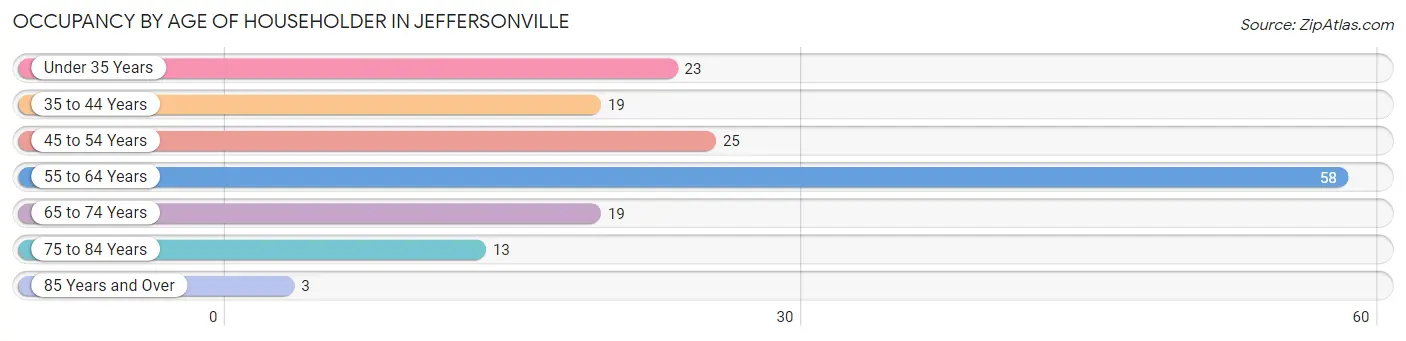
| Age Bracket | # Households | % Households |
| Under 35 Years | 23 | 14.4% |
| 35 to 44 Years | 19 | 11.9% |
| 45 to 54 Years | 25 | 15.6% |
| 55 to 64 Years | 58 | 36.2% |
| 65 to 74 Years | 19 | 11.9% |
| 75 to 84 Years | 13 | 8.1% |
| 85 Years and Over | 3 | 1.9% |
| Total | 160 | 100.0% |
Housing Finances in Jeffersonville
Median Income by Occupancy in Jeffersonville
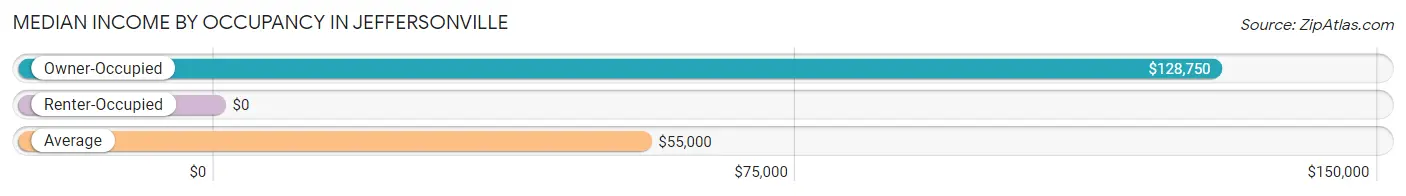
| Occupancy Type | # Households | Median Income |
| Owner-Occupied | 99 (61.9%) | $128,750 |
| Renter-Occupied | 61 (38.1%) | $0 |
| Average | 160 (100.0%) | $55,000 |
Occupancy by Householder Income Bracket in Jeffersonville
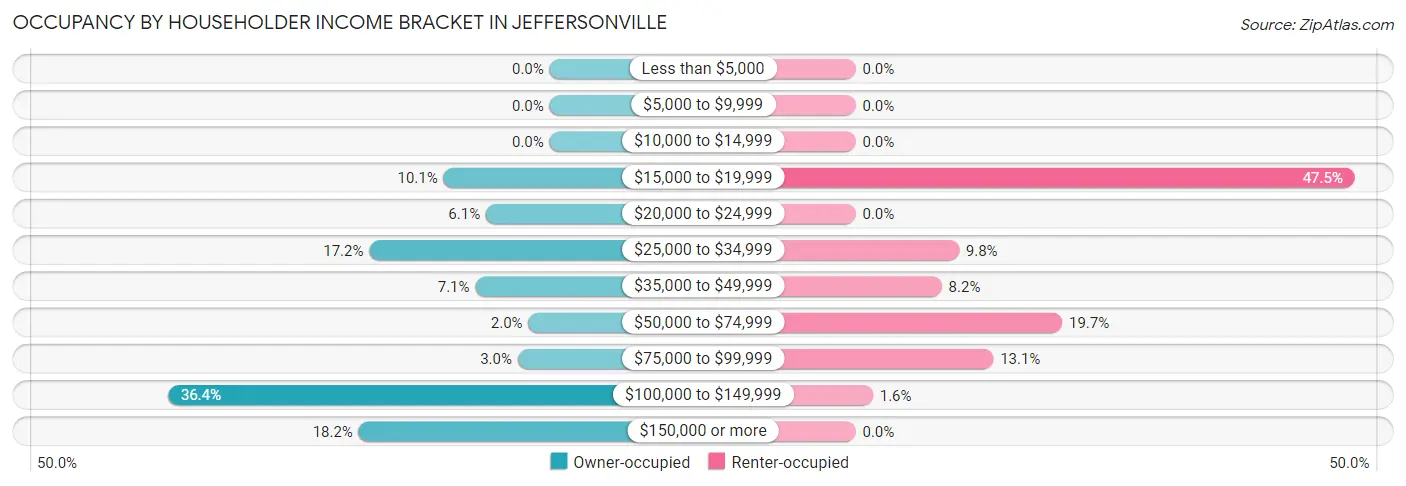
| Income Bracket | Owner-occupied | Renter-occupied |
| Less than $5,000 | 0 (0.0%) | 0 (0.0%) |
| $5,000 to $9,999 | 0 (0.0%) | 0 (0.0%) |
| $10,000 to $14,999 | 0 (0.0%) | 0 (0.0%) |
| $15,000 to $19,999 | 10 (10.1%) | 29 (47.5%) |
| $20,000 to $24,999 | 6 (6.1%) | 0 (0.0%) |
| $25,000 to $34,999 | 17 (17.2%) | 6 (9.8%) |
| $35,000 to $49,999 | 7 (7.1%) | 5 (8.2%) |
| $50,000 to $74,999 | 2 (2.0%) | 12 (19.7%) |
| $75,000 to $99,999 | 3 (3.0%) | 8 (13.1%) |
| $100,000 to $149,999 | 36 (36.4%) | 1 (1.6%) |
| $150,000 or more | 18 (18.2%) | 0 (0.0%) |
| Total | 99 (100.0%) | 61 (100.0%) |
Monthly Housing Cost Tiers in Jeffersonville
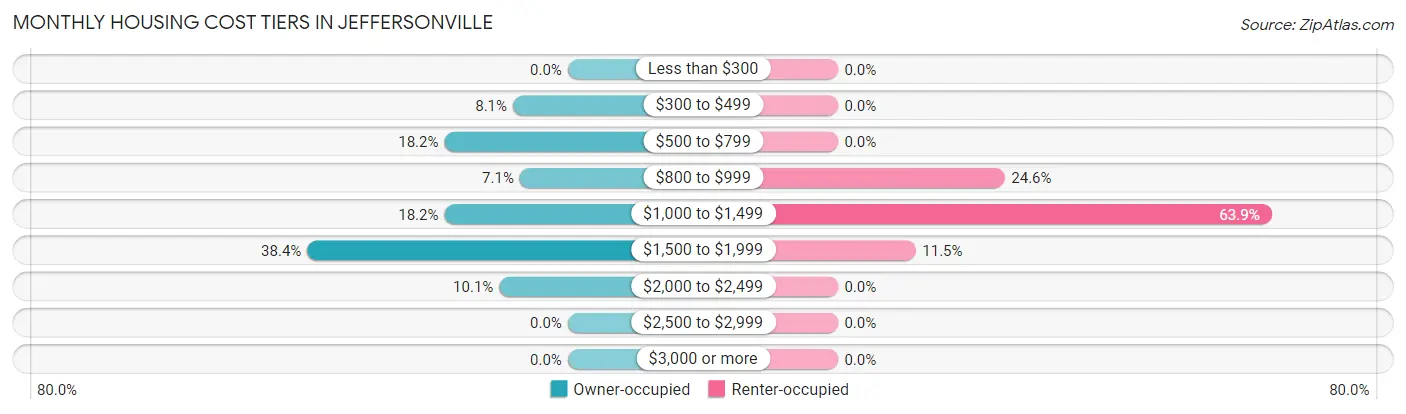
| Monthly Cost | Owner-occupied | Renter-occupied |
| Less than $300 | 0 (0.0%) | 0 (0.0%) |
| $300 to $499 | 8 (8.1%) | 0 (0.0%) |
| $500 to $799 | 18 (18.2%) | 0 (0.0%) |
| $800 to $999 | 7 (7.1%) | 15 (24.6%) |
| $1,000 to $1,499 | 18 (18.2%) | 39 (63.9%) |
| $1,500 to $1,999 | 38 (38.4%) | 7 (11.5%) |
| $2,000 to $2,499 | 10 (10.1%) | 0 (0.0%) |
| $2,500 to $2,999 | 0 (0.0%) | 0 (0.0%) |
| $3,000 or more | 0 (0.0%) | 0 (0.0%) |
| Total | 99 (100.0%) | 61 (100.0%) |
Physical Housing Characteristics in Jeffersonville
Housing Structures in Jeffersonville
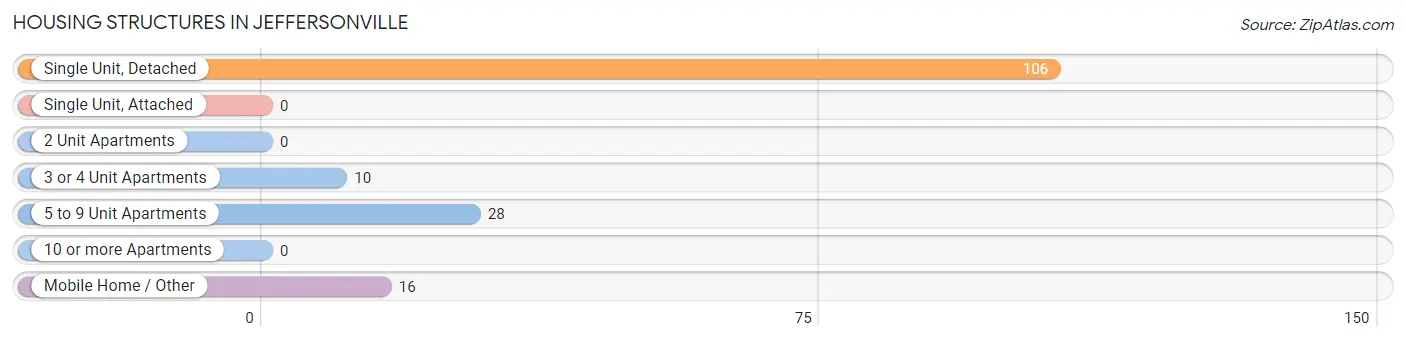
| Structure Type | # Housing Units | % Housing Units |
| Single Unit, Detached | 106 | 66.2% |
| Single Unit, Attached | 0 | 0.0% |
| 2 Unit Apartments | 0 | 0.0% |
| 3 or 4 Unit Apartments | 10 | 6.2% |
| 5 to 9 Unit Apartments | 28 | 17.5% |
| 10 or more Apartments | 0 | 0.0% |
| Mobile Home / Other | 16 | 10.0% |
| Total | 160 | 100.0% |
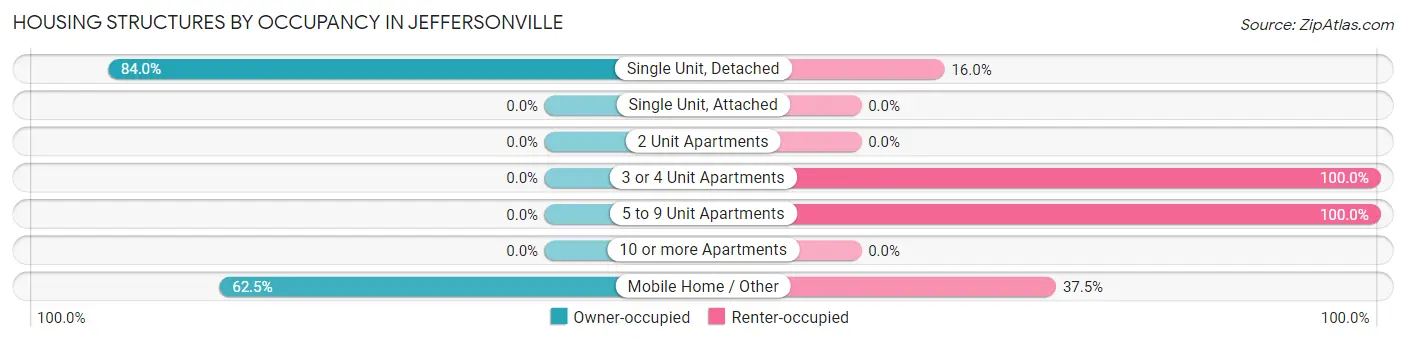
Housing Structures by Occupancy in Jeffersonville
| Structure Type | Owner-occupied | Renter-occupied |
| Single Unit, Detached | 89 (84.0%) | 17 (16.0%) |
| Single Unit, Attached | 0 (0.0%) | 0 (0.0%) |
| 2 Unit Apartments | 0 (0.0%) | 0 (0.0%) |
| 3 or 4 Unit Apartments | 0 (0.0%) | 10 (100.0%) |
| 5 to 9 Unit Apartments | 0 (0.0%) | 28 (100.0%) |
| 10 or more Apartments | 0 (0.0%) | 0 (0.0%) |
| Mobile Home / Other | 10 (62.5%) | 6 (37.5%) |
| Total | 99 (61.9%) | 61 (38.1%) |
Housing Structures by Number of Rooms in Jeffersonville
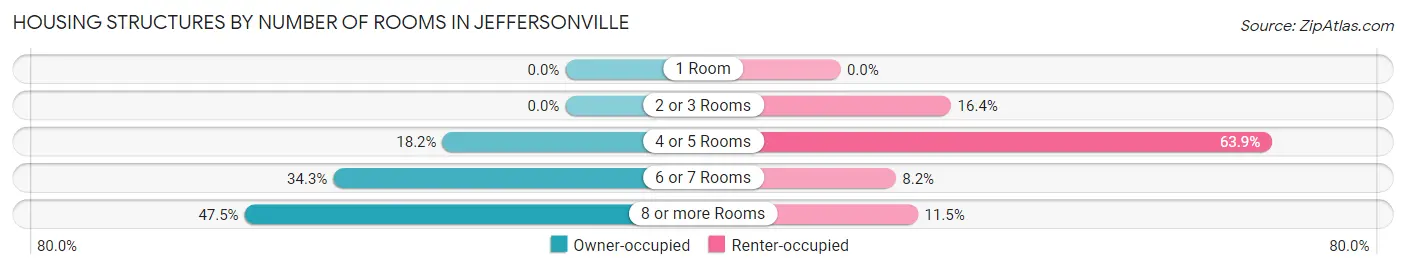
| Number of Rooms | Owner-occupied | Renter-occupied |
| 1 Room | 0 (0.0%) | 0 (0.0%) |
| 2 or 3 Rooms | 0 (0.0%) | 10 (16.4%) |
| 4 or 5 Rooms | 18 (18.2%) | 39 (63.9%) |
| 6 or 7 Rooms | 34 (34.3%) | 5 (8.2%) |
| 8 or more Rooms | 47 (47.5%) | 7 (11.5%) |
| Total | 99 (100.0%) | 61 (100.0%) |
Housing Structure by Heating Type in Jeffersonville
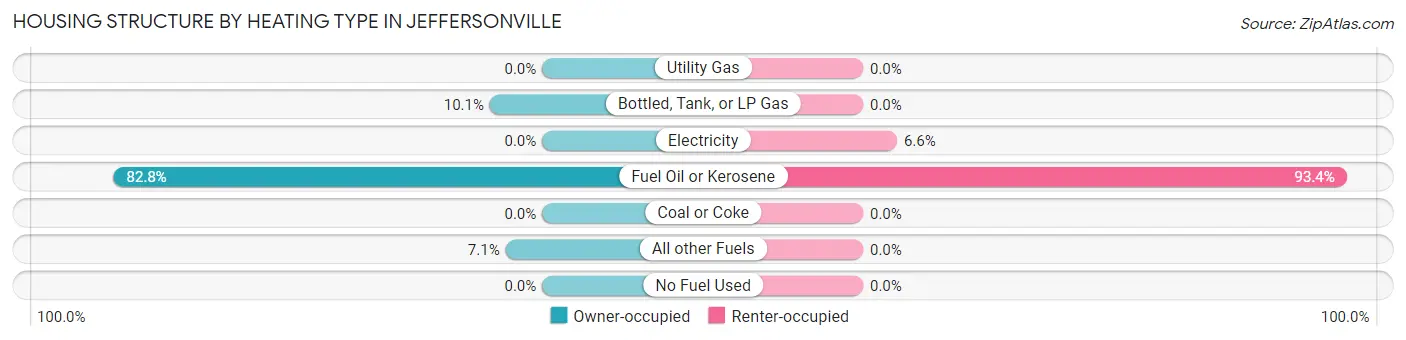
| Heating Type | Owner-occupied | Renter-occupied |
| Utility Gas | 0 (0.0%) | 0 (0.0%) |
| Bottled, Tank, or LP Gas | 10 (10.1%) | 0 (0.0%) |
| Electricity | 0 (0.0%) | 4 (6.6%) |
| Fuel Oil or Kerosene | 82 (82.8%) | 57 (93.4%) |
| Coal or Coke | 0 (0.0%) | 0 (0.0%) |
| All other Fuels | 7 (7.1%) | 0 (0.0%) |
| No Fuel Used | 0 (0.0%) | 0 (0.0%) |
| Total | 99 (100.0%) | 61 (100.0%) |
Household Vehicle Usage in Jeffersonville
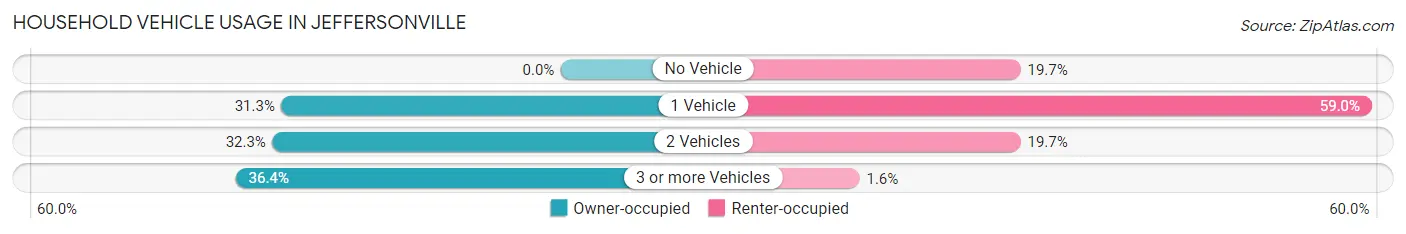
| Vehicles per Household | Owner-occupied | Renter-occupied |
| No Vehicle | 0 (0.0%) | 12 (19.7%) |
| 1 Vehicle | 31 (31.3%) | 36 (59.0%) |
| 2 Vehicles | 32 (32.3%) | 12 (19.7%) |
| 3 or more Vehicles | 36 (36.4%) | 1 (1.6%) |
| Total | 99 (100.0%) | 61 (100.0%) |
Real Estate & Mortgages in Jeffersonville
Real Estate and Mortgage Overview in Jeffersonville
| Characteristic | Without Mortgage | With Mortgage |
| Housing Units | 39 | 60 |
| Median Property Value | $209,400 | $205,900 |
| Median Household Income | $26,250 | $18 |
| Monthly Housing Costs | $735 | $0 |
| Real Estate Taxes | - | - |
Property Value by Mortgage Status in Jeffersonville
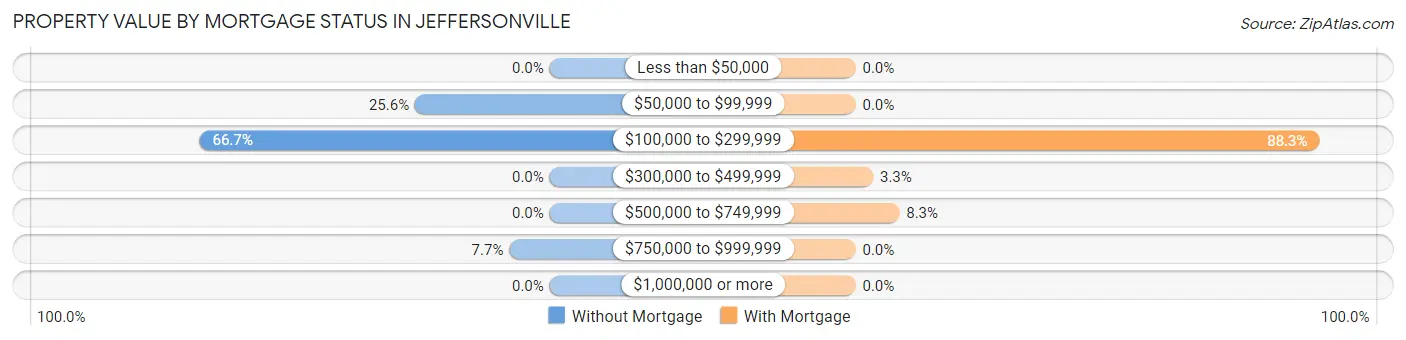
| Property Value | Without Mortgage | With Mortgage |
| Less than $50,000 | 0 (0.0%) | 0 (0.0%) |
| $50,000 to $99,999 | 10 (25.6%) | 0 (0.0%) |
| $100,000 to $299,999 | 26 (66.7%) | 53 (88.3%) |
| $300,000 to $499,999 | 0 (0.0%) | 2 (3.3%) |
| $500,000 to $749,999 | 0 (0.0%) | 5 (8.3%) |
| $750,000 to $999,999 | 3 (7.7%) | 0 (0.0%) |
| $1,000,000 or more | 0 (0.0%) | 0 (0.0%) |
| Total | 39 (100.0%) | 60 (100.0%) |
Household Income by Mortgage Status in Jeffersonville
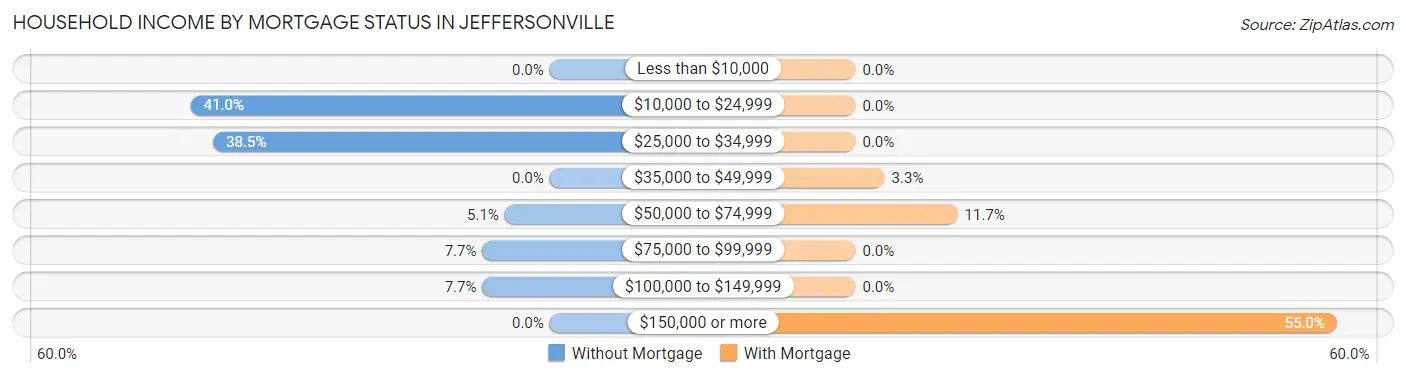
| Household Income | Without Mortgage | With Mortgage |
| Less than $10,000 | 0 (0.0%) | 0 (0.0%) |
| $10,000 to $24,999 | 16 (41.0%) | 0 (0.0%) |
| $25,000 to $34,999 | 15 (38.5%) | 0 (0.0%) |
| $35,000 to $49,999 | 0 (0.0%) | 2 (3.3%) |
| $50,000 to $74,999 | 2 (5.1%) | 7 (11.7%) |
| $75,000 to $99,999 | 3 (7.7%) | 0 (0.0%) |
| $100,000 to $149,999 | 3 (7.7%) | 0 (0.0%) |
| $150,000 or more | 0 (0.0%) | 33 (55.0%) |
| Total | 39 (100.0%) | 60 (100.0%) |
Property Value to Household Income Ratio in Jeffersonville
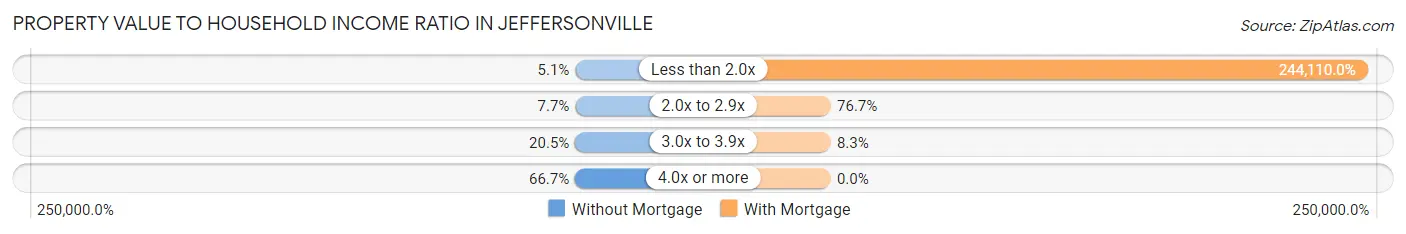
| Value-to-Income Ratio | Without Mortgage | With Mortgage |
| Less than 2.0x | 2 (5.1%) | 146,466 (244,110.0%) |
| 2.0x to 2.9x | 3 (7.7%) | 46 (76.7%) |
| 3.0x to 3.9x | 8 (20.5%) | 5 (8.3%) |
| 4.0x or more | 26 (66.7%) | 0 (0.0%) |
| Total | 39 (100.0%) | 60 (100.0%) |
Real Estate Taxes by Mortgage Status in Jeffersonville
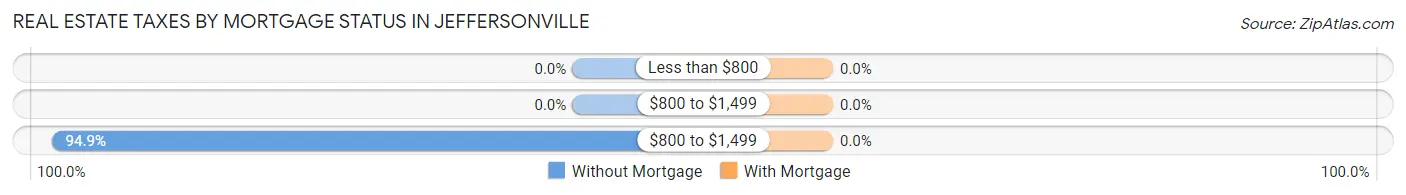
| Property Taxes | Without Mortgage | With Mortgage |
| Less than $800 | 0 (0.0%) | 0 (0.0%) |
| $800 to $1,499 | 0 (0.0%) | 0 (0.0%) |
| $800 to $1,499 | 37 (94.9%) | 0 (0.0%) |
| Total | 39 (100.0%) | 60 (100.0%) |
Health & Disability in Jeffersonville
Health Insurance Coverage by Age in Jeffersonville
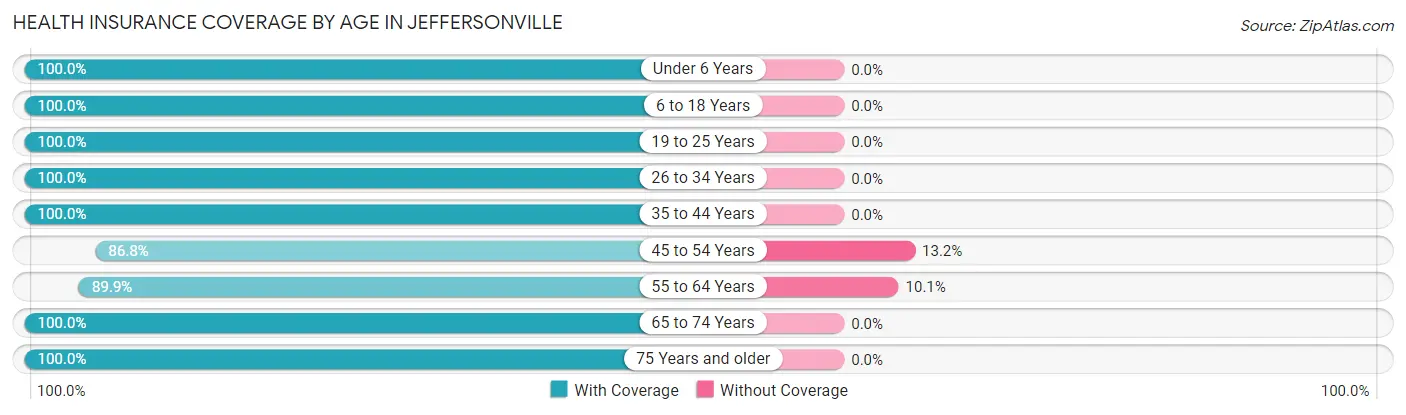
| Age Bracket | With Coverage | Without Coverage |
| Under 6 Years | 11 (100.0%) | 0 (0.0%) |
| 6 to 18 Years | 68 (100.0%) | 0 (0.0%) |
| 19 to 25 Years | 98 (100.0%) | 0 (0.0%) |
| 26 to 34 Years | 33 (100.0%) | 0 (0.0%) |
| 35 to 44 Years | 28 (100.0%) | 0 (0.0%) |
| 45 to 54 Years | 46 (86.8%) | 7 (13.2%) |
| 55 to 64 Years | 71 (89.9%) | 8 (10.1%) |
| 65 to 74 Years | 39 (100.0%) | 0 (0.0%) |
| 75 Years and older | 23 (100.0%) | 0 (0.0%) |
| Total | 417 (96.5%) | 15 (3.5%) |
Health Insurance Coverage by Citizenship Status in Jeffersonville
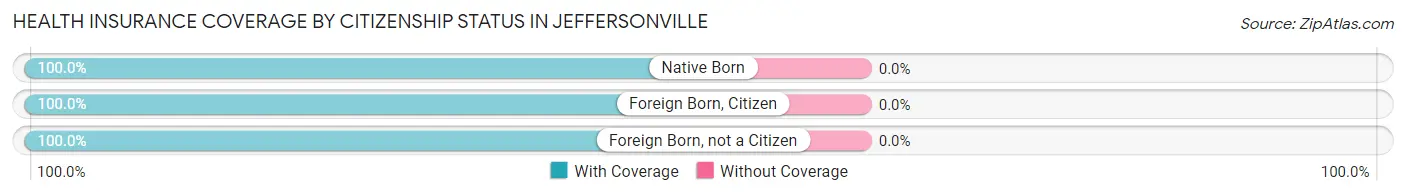
| Citizenship Status | With Coverage | Without Coverage |
| Native Born | 11 (100.0%) | 0 (0.0%) |
| Foreign Born, Citizen | 68 (100.0%) | 0 (0.0%) |
| Foreign Born, not a Citizen | 98 (100.0%) | 0 (0.0%) |
Health Insurance Coverage by Household Income in Jeffersonville
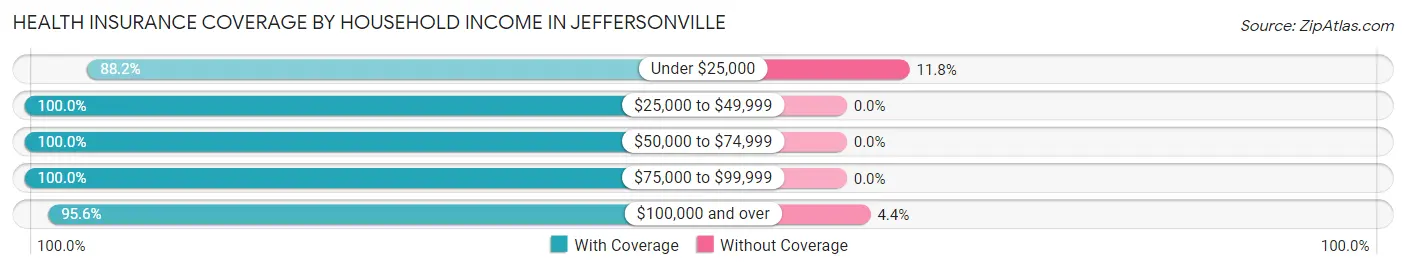
| Household Income | With Coverage | Without Coverage |
| Under $25,000 | 60 (88.2%) | 8 (11.8%) |
| $25,000 to $49,999 | 76 (100.0%) | 0 (0.0%) |
| $50,000 to $74,999 | 65 (100.0%) | 0 (0.0%) |
| $75,000 to $99,999 | 21 (100.0%) | 0 (0.0%) |
| $100,000 and over | 151 (95.6%) | 7 (4.4%) |
Public vs Private Health Insurance Coverage by Age in Jeffersonville
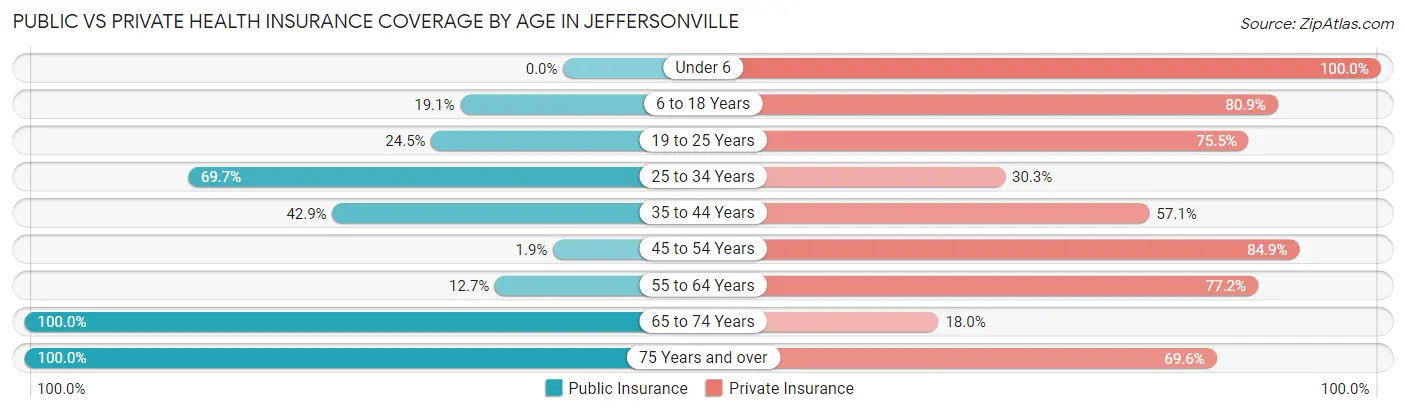
| Age Bracket | Public Insurance | Private Insurance |
| Under 6 | 0 (0.0%) | 11 (100.0%) |
| 6 to 18 Years | 13 (19.1%) | 55 (80.9%) |
| 19 to 25 Years | 24 (24.5%) | 74 (75.5%) |
| 25 to 34 Years | 23 (69.7%) | 10 (30.3%) |
| 35 to 44 Years | 12 (42.9%) | 16 (57.1%) |
| 45 to 54 Years | 1 (1.9%) | 45 (84.9%) |
| 55 to 64 Years | 10 (12.7%) | 61 (77.2%) |
| 65 to 74 Years | 39 (100.0%) | 7 (17.9%) |
| 75 Years and over | 23 (100.0%) | 16 (69.6%) |
| Total | 145 (33.6%) | 295 (68.3%) |
Disability Status by Sex by Age in Jeffersonville
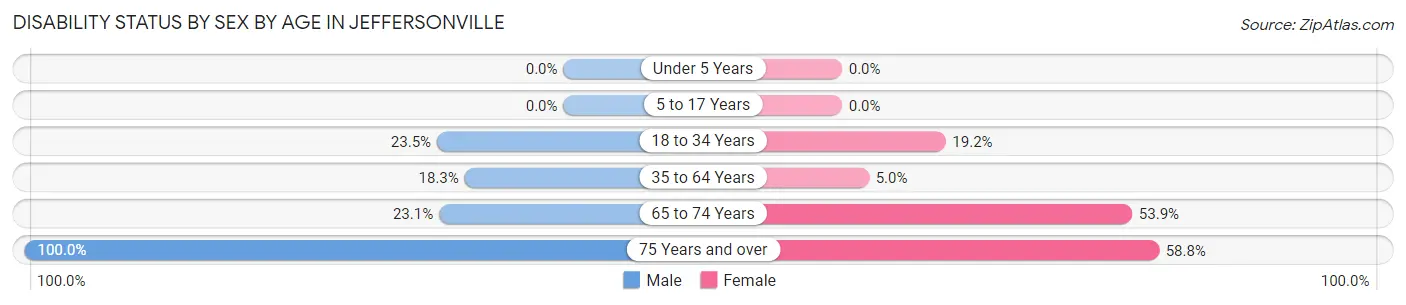
| Age Bracket | Male | Female |
| Under 5 Years | 0 (0.0%) | 0 (0.0%) |
| 5 to 17 Years | 0 (0.0%) | 0 (0.0%) |
| 18 to 34 Years | 23 (23.5%) | 10 (19.2%) |
| 35 to 64 Years | 11 (18.3%) | 5 (5.0%) |
| 65 to 74 Years | 6 (23.1%) | 7 (53.8%) |
| 75 Years and over | 6 (100.0%) | 10 (58.8%) |
Disability Class by Sex by Age in Jeffersonville
Disability Class: Hearing Difficulty
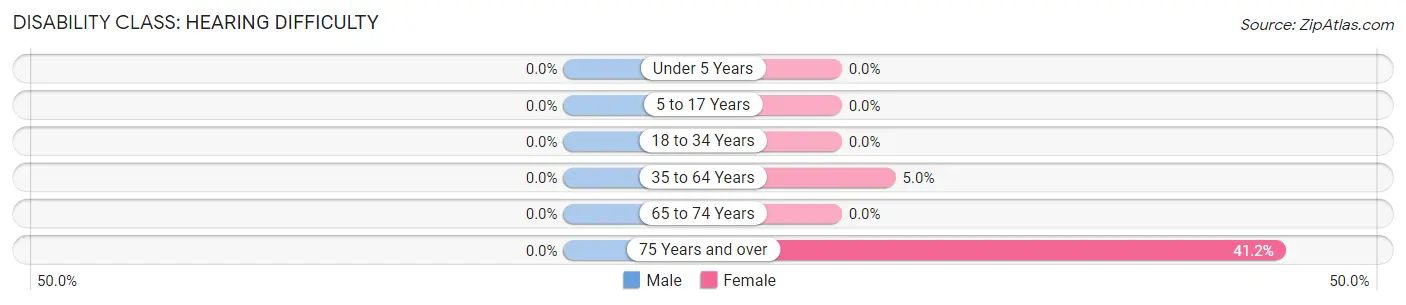
| Age Bracket | Male | Female |
| Under 5 Years | 0 (0.0%) | 0 (0.0%) |
| 5 to 17 Years | 0 (0.0%) | 0 (0.0%) |
| 18 to 34 Years | 0 (0.0%) | 0 (0.0%) |
| 35 to 64 Years | 0 (0.0%) | 5 (5.0%) |
| 65 to 74 Years | 0 (0.0%) | 0 (0.0%) |
| 75 Years and over | 0 (0.0%) | 7 (41.2%) |
Disability Class: Vision Difficulty
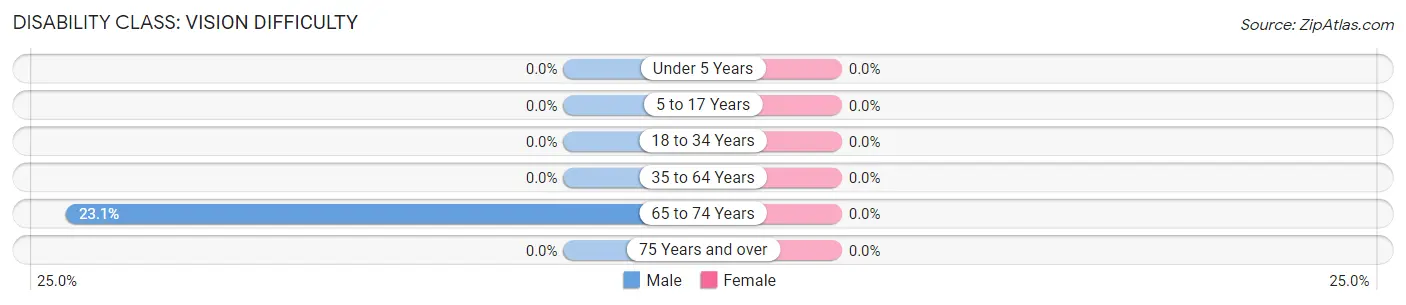
| Age Bracket | Male | Female |
| Under 5 Years | 0 (0.0%) | 0 (0.0%) |
| 5 to 17 Years | 0 (0.0%) | 0 (0.0%) |
| 18 to 34 Years | 0 (0.0%) | 0 (0.0%) |
| 35 to 64 Years | 0 (0.0%) | 0 (0.0%) |
| 65 to 74 Years | 6 (23.1%) | 0 (0.0%) |
| 75 Years and over | 0 (0.0%) | 0 (0.0%) |
Disability Class: Cognitive Difficulty
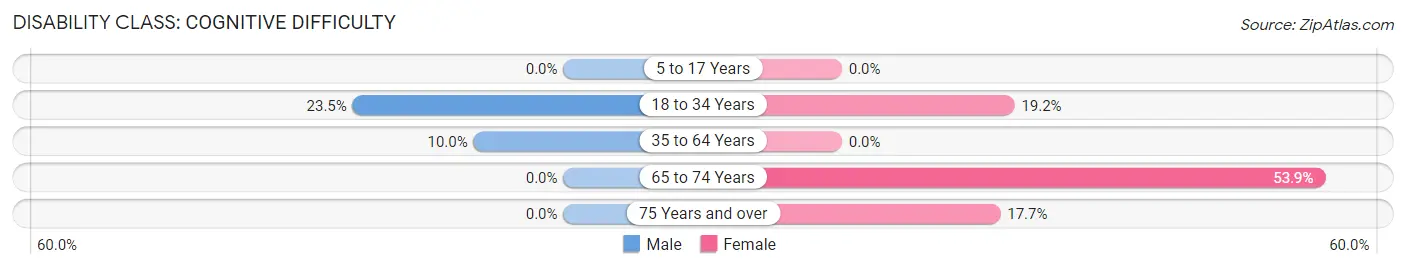
| Age Bracket | Male | Female |
| 5 to 17 Years | 0 (0.0%) | 0 (0.0%) |
| 18 to 34 Years | 23 (23.5%) | 10 (19.2%) |
| 35 to 64 Years | 6 (10.0%) | 0 (0.0%) |
| 65 to 74 Years | 0 (0.0%) | 7 (53.8%) |
| 75 Years and over | 0 (0.0%) | 3 (17.6%) |
Disability Class: Ambulatory Difficulty
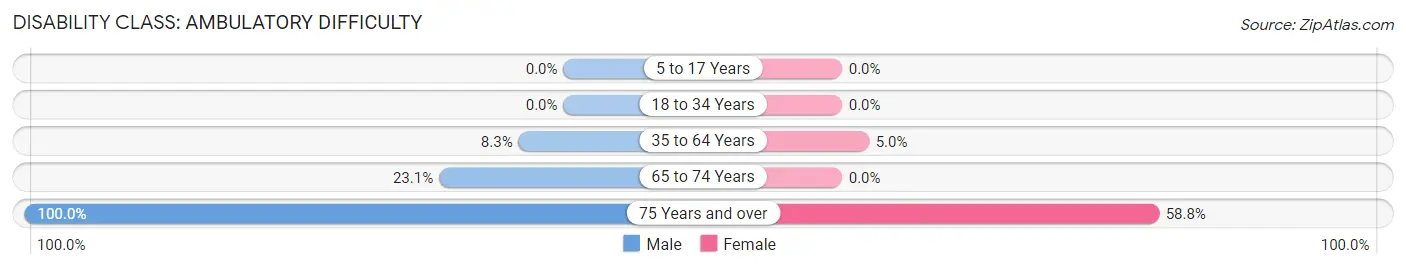
| Age Bracket | Male | Female |
| 5 to 17 Years | 0 (0.0%) | 0 (0.0%) |
| 18 to 34 Years | 0 (0.0%) | 0 (0.0%) |
| 35 to 64 Years | 5 (8.3%) | 5 (5.0%) |
| 65 to 74 Years | 6 (23.1%) | 0 (0.0%) |
| 75 Years and over | 6 (100.0%) | 10 (58.8%) |
Disability Class: Self-Care Difficulty
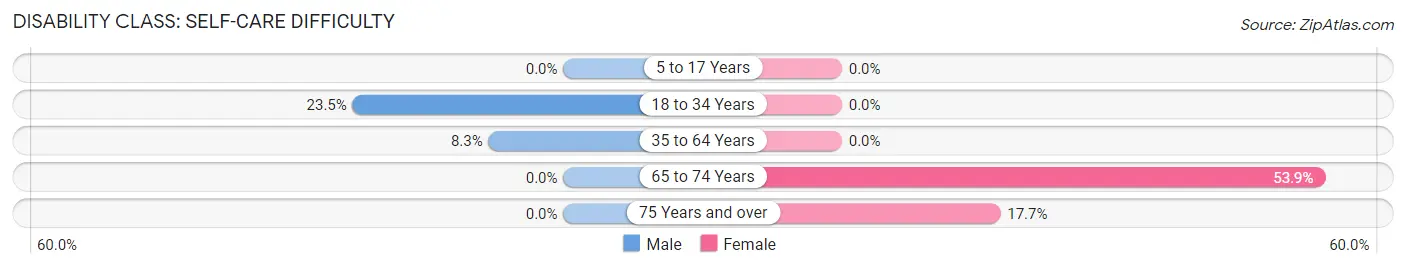
| Age Bracket | Male | Female |
| 5 to 17 Years | 0 (0.0%) | 0 (0.0%) |
| 18 to 34 Years | 23 (23.5%) | 0 (0.0%) |
| 35 to 64 Years | 5 (8.3%) | 0 (0.0%) |
| 65 to 74 Years | 0 (0.0%) | 7 (53.8%) |
| 75 Years and over | 0 (0.0%) | 3 (17.6%) |
Technology Access in Jeffersonville
Computing Device Access in Jeffersonville
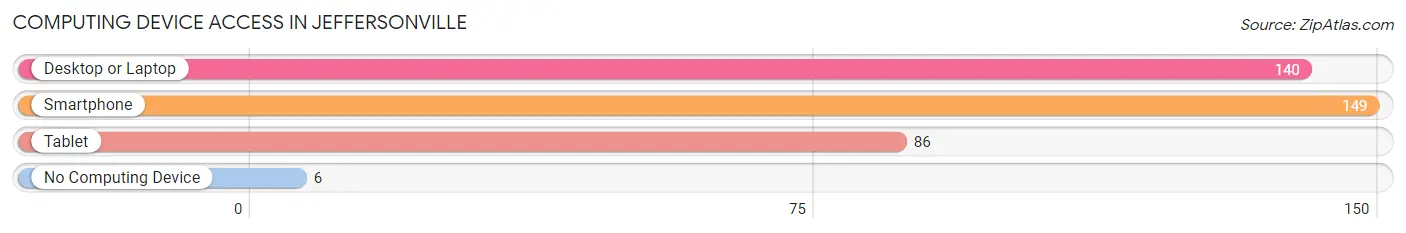
| Device Type | # Households | % Households |
| Desktop or Laptop | 140 | 87.5% |
| Smartphone | 149 | 93.1% |
| Tablet | 86 | 53.7% |
| No Computing Device | 6 | 3.7% |
| Total | 160 | 100.0% |
Internet Access in Jeffersonville
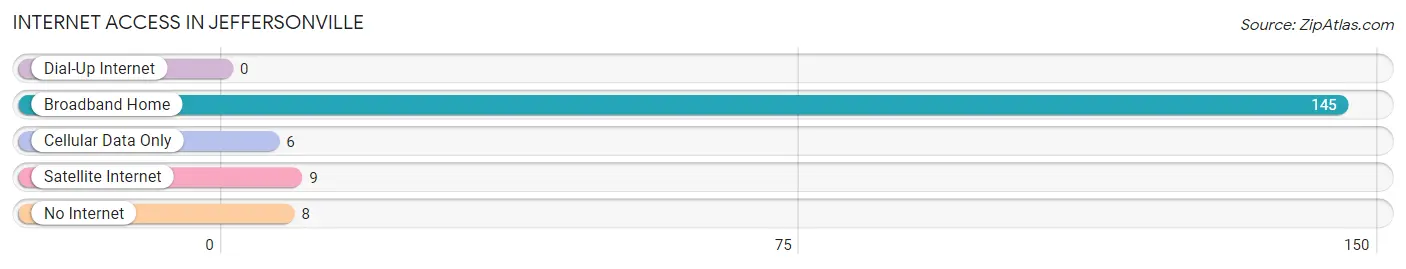
| Internet Type | # Households | % Households |
| Dial-Up Internet | 0 | 0.0% |
| Broadband Home | 145 | 90.6% |
| Cellular Data Only | 6 | 3.7% |
| Satellite Internet | 9 | 5.6% |
| No Internet | 8 | 5.0% |
| Total | 160 | 100.0% |
Jeffersonville Summary
Jeffersonville is a small village located in Sullivan County, New York, United States. It is situated in the Town of Callicoon, and is part of the Catskill Mountains region. The population was 1,092 at the 2010 census.
History
Jeffersonville was founded in 1798 by John Jefferson, a Revolutionary War veteran. He purchased the land from the local Native American tribes and named the village after himself. The village was incorporated in 1845.
In the 19th century, Jeffersonville was a popular summer resort destination for wealthy New Yorkers. The village was home to several grand hotels, including the Jefferson House, the Jefferson Hotel, and the Jefferson Inn. These hotels attracted many famous guests, including President Ulysses S. Grant, who stayed at the Jefferson House in 1872.
Geography
Jeffersonville is located at 41°45'25" North, 75°10'25" West (41.756944, -75.173611). According to the United States Census Bureau, the village has a total area of 0.6 square miles (1.6 km2), all of it land.
The village is located in the Catskill Mountains region of New York. It is situated in the Town of Callicoon, and is bordered by the Town of Cochecton to the north, the Town of Fremont to the east, and the Town of Delaware to the south.
Economy
Jeffersonville is a small, rural village with a limited economy. The primary industries are tourism and agriculture.
Tourism is the main source of income for the village. The village is home to several bed and breakfasts, as well as a few restaurants and shops. The village also hosts several annual festivals and events, including the Jeffersonville Arts and Crafts Festival and the Jeffersonville Harvest Festival.
Agriculture is also an important part of the local economy. The village is home to several farms, which produce a variety of crops, including apples, corn, and hay.
Demographics
As of the census of 2010, there were 1,092 people, 441 households, and 287 families residing in the village. The population density was 1,817.3 people per square mile (700.7/km2). There were 486 housing units at an average density of 806.7 per square mile (311.3/km2). The racial makeup of the village was 97.2% White, 0.7% African American, 0.2% Native American, 0.2% Asian, 0.2% from other races, and 1.7% from two or more races. Hispanic or Latino of any race were 2.2% of the population.
There were 441 households, out of which 28.2% had children under the age of 18 living with them, 51.6% were married couples living together, 9.3% had a female householder with no husband present, and 34.2% were non-families. 28.2% of all households were made up of individuals, and 11.6% had someone living alone who was 65 years of age or older. The average household size was 2.47 and the average family size was 3.03.
In the village, the population was spread out, with 24.2% under the age of 18, 6.2% from 18 to 24, 25.2% from 25 to 44, 28.2% from 45 to 64, and 16.2% who were 65 years of age or older. The median age was 41 years. For every 100 females, there were 97.2 males. For every 100 females age 18 and over, there were 94.2 males.
The median income for a household in the village was $41,250, and the median income for a family was $50,000. Males had a median income of $35,000 versus $25,000 for females. The per capita income for the village was $20,945. About 8.2% of families and 10.2% of the population were below the poverty line, including 14.3% of those under age 18 and 8.3% of those age 65 or over.
Common Questions
What is the Total Population of Jeffersonville?
Total Population of Jeffersonville is 434.
What is the Total Male Population of Jeffersonville?
Total Male Population of Jeffersonville is 195.
What is the Total Female Population of Jeffersonville?
Total Female Population of Jeffersonville is 239.
What is the Ratio of Males per 100 Females in Jeffersonville?
There are 81.59 Males per 100 Females in Jeffersonville.
What is the Ratio of Females per 100 Males in Jeffersonville?
There are 122.56 Females per 100 Males in Jeffersonville.
What is the Median Population Age in Jeffersonville?
Median Population Age in Jeffersonville is 39.3 Years.
What is the Average Family Size in Jeffersonville
Average Family Size in Jeffersonville is 3.0 People.
What is the Average Household Size in Jeffersonville
Average Household Size in Jeffersonville is 2.4 People.
What is Per Capita Income in Jeffersonville?
Per Capita income in Jeffersonville is $30,453.
What is the Median Family Income in Jeffersonville?
Median Family Income in Jeffersonville is $126,667.
What is the Median Household income in Jeffersonville?
Median Household Income in Jeffersonville is $55,000.
What is Inequality or Gini Index in Jeffersonville?
Inequality or Gini Index in Jeffersonville is 0.46.
How Large is the Labor Force in Jeffersonville?
There are 239 People in the Labor Forcein in Jeffersonville.
What is the Percentage of People in the Labor Force in Jeffersonville?
63.2% of People are in the Labor Force in Jeffersonville.
What is the Unemployment Rate in Jeffersonville?
Unemployment Rate in Jeffersonville is 0.8%.