Cities with the Highest Percentage of Immigrants from Lebanon in New Jersey
RELATED REPORTS & OPTIONS
Lebanon
New Jersey
Compare Cities
Map of Cities with the Highest Percentage of Immigrants from Lebanon in New Jersey
0.00%
4.00%
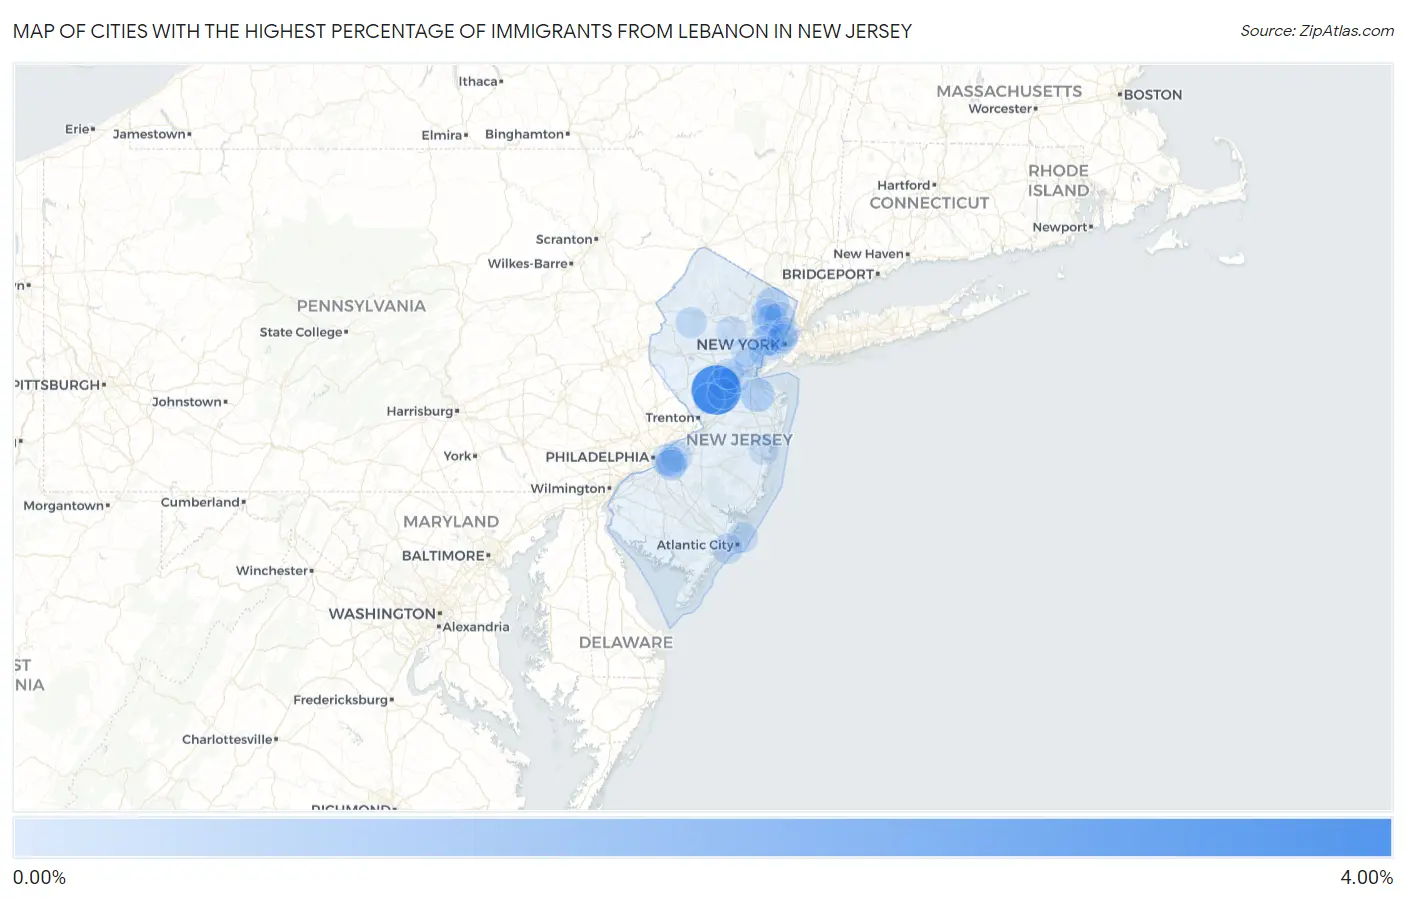
Cities with the Highest Percentage of Immigrants from Lebanon in New Jersey
| City | Lebanon | vs State | vs National | |
| 1. | East Rocky Hill | 3.89% | 0.047%(+3.85)#-1 | 0.040%(+3.85)#0 |
| 2. | Fieldsboro Borough | 1.37% | 0.047%(+1.32)#0 | 0.040%(+1.33)#1 |
| 3. | Woodland Park Borough | 1.32% | 0.047%(+1.28)#1 | 0.040%(+1.28)#2 |
| 4. | Clearbrook | 1.15% | 0.047%(+1.11)#11 | 0.040%(+1.11)#57 |
| 5. | North Caldwell Borough | 1.12% | 0.047%(+1.07)#81 | 0.040%(+1.08)#608 |
| 6. | Milltown Borough | 1.07% | 0.047%(+1.02)#82 | 0.040%(+1.03)#609 |
| 7. | Spring Lake Heights Borough | 0.97% | 0.047%(+0.920)#83 | 0.040%(+0.926)#610 |
| 8. | Stockton University | 0.78% | 0.047%(+0.730)#84 | 0.040%(+0.736)#611 |
| 9. | Gibbsboro Borough | 0.75% | 0.047%(+0.700)#85 | 0.040%(+0.706)#612 |
| 10. | Morganville | 0.74% | 0.047%(+0.691)#86 | 0.040%(+0.697)#613 |
| 11. | Ridgewood | 0.61% | 0.047%(+0.568)#97 | 0.040%(+0.574)#799 |
| 12. | Totowa Borough | 0.57% | 0.047%(+0.527)#98 | 0.040%(+0.534)#800 |
| 13. | Mickleton | 0.57% | 0.047%(+0.519)#99 | 0.040%(+0.526)#801 |
| 14. | Great Notch | 0.55% | 0.047%(+0.501)#100 | 0.040%(+0.507)#802 |
| 15. | Ridgefield Borough | 0.54% | 0.047%(+0.494)#101 | 0.040%(+0.501)#803 |
| 16. | Rumson Borough | 0.44% | 0.047%(+0.393)#102 | 0.040%(+0.399)#804 |
| 17. | Golden Triangle | 0.36% | 0.047%(+0.316)#103 | 0.040%(+0.323)#805 |
| 18. | Cliffside Park Borough | 0.36% | 0.047%(+0.313)#106 | 0.040%(+0.320)#892 |
| 19. | Westwood Borough | 0.35% | 0.047%(+0.300)#107 | 0.040%(+0.307)#893 |
| 20. | Alpine Borough | 0.35% | 0.047%(+0.298)#108 | 0.040%(+0.305)#894 |
| 21. | River Edge Borough | 0.34% | 0.047%(+0.294)#109 | 0.040%(+0.301)#895 |
| 22. | Victory Gardens Borough | 0.34% | 0.047%(+0.294)#110 | 0.040%(+0.301)#896 |
| 23. | Allendale Borough | 0.31% | 0.047%(+0.261)#111 | 0.040%(+0.268)#897 |
| 24. | Moorestown Lenola | 0.30% | 0.047%(+0.252)#112 | 0.040%(+0.259)#898 |
| 25. | Saddle River Borough | 0.30% | 0.047%(+0.251)#113 | 0.040%(+0.257)#899 |
| 26. | Hillsdale Borough | 0.30% | 0.047%(+0.250)#114 | 0.040%(+0.256)#900 |
| 27. | Hasbrouck Heights Borough | 0.29% | 0.047%(+0.243)#115 | 0.040%(+0.250)#901 |
| 28. | Prospect Park Borough | 0.29% | 0.047%(+0.239)#116 | 0.040%(+0.246)#902 |
| 29. | New Providence Borough | 0.28% | 0.047%(+0.233)#117 | 0.040%(+0.239)#903 |
| 30. | Clifton | 0.26% | 0.047%(+0.214)#118 | 0.040%(+0.220)#904 |
| 31. | Highlands Borough | 0.26% | 0.047%(+0.212)#119 | 0.040%(+0.218)#905 |
| 32. | Mount Arlington Borough | 0.26% | 0.047%(+0.209)#120 | 0.040%(+0.216)#906 |
| 33. | North Arlington Borough | 0.25% | 0.047%(+0.204)#121 | 0.040%(+0.211)#907 |
| 34. | Wanaque Borough | 0.25% | 0.047%(+0.203)#122 | 0.040%(+0.209)#908 |
| 35. | Lake Hopatcong | 0.25% | 0.047%(+0.201)#123 | 0.040%(+0.208)#909 |
| 36. | Packanack Lake | 0.23% | 0.047%(+0.187)#124 | 0.040%(+0.194)#910 |
| 37. | Kingston Estates | 0.21% | 0.047%(+0.168)#125 | 0.040%(+0.174)#911 |
| 38. | Highland Park Borough | 0.21% | 0.047%(+0.167)#126 | 0.040%(+0.173)#912 |
| 39. | Closter Borough | 0.21% | 0.047%(+0.164)#127 | 0.040%(+0.170)#913 |
| 40. | Hackettstown | 0.21% | 0.047%(+0.161)#128 | 0.040%(+0.168)#914 |
| 41. | Chatham Borough | 0.21% | 0.047%(+0.160)#129 | 0.040%(+0.166)#915 |
| 42. | Ledgewood | 0.20% | 0.047%(+0.149)#130 | 0.040%(+0.156)#916 |
| 43. | Keyport Borough | 0.19% | 0.047%(+0.148)#131 | 0.040%(+0.155)#917 |
| 44. | Hackensack | 0.19% | 0.047%(+0.148)#132 | 0.040%(+0.154)#918 |
| 45. | Raritan Borough | 0.18% | 0.047%(+0.134)#133 | 0.040%(+0.141)#919 |
| 46. | Sicklerville | 0.17% | 0.047%(+0.121)#134 | 0.040%(+0.128)#920 |
| 47. | Demarest Borough | 0.16% | 0.047%(+0.116)#135 | 0.040%(+0.122)#921 |
| 48. | Dumont Borough | 0.16% | 0.047%(+0.114)#136 | 0.040%(+0.121)#965 |
| 49. | Barclay | 0.16% | 0.047%(+0.109)#137 | 0.040%(+0.115)#966 |
| 50. | Maywood Borough | 0.15% | 0.047%(+0.103)#138 | 0.040%(+0.109)#967 |
| 51. | Franklin Park | 0.15% | 0.047%(+0.102)#139 | 0.040%(+0.109)#968 |
| 52. | New Brunswick | 0.15% | 0.047%(+0.099)#140 | 0.040%(+0.105)#1,310 |
| 53. | Franklin Lakes Borough | 0.15% | 0.047%(+0.099)#141 | 0.040%(+0.105)#1,311 |
| 54. | Hawthorne Borough | 0.14% | 0.047%(+0.097)#142 | 0.040%(+0.104)#1,312 |
| 55. | Midland Park Borough | 0.14% | 0.047%(+0.096)#143 | 0.040%(+0.102)#1,313 |
| 56. | Brigantine | 0.14% | 0.047%(+0.095)#144 | 0.040%(+0.101)#1,314 |
| 57. | Hillsborough | 0.13% | 0.047%(+0.086)#145 | 0.040%(+0.092)#1,315 |
| 58. | Paramus Borough | 0.12% | 0.047%(+0.077)#146 | 0.040%(+0.084)#1,316 |
| 59. | Red Bank Borough | 0.12% | 0.047%(+0.070)#147 | 0.040%(+0.076)#1,317 |
| 60. | Margate City | 0.11% | 0.047%(+0.066)#148 | 0.040%(+0.072)#1,318 |
| 61. | Haledon Borough | 0.11% | 0.047%(+0.065)#149 | 0.040%(+0.072)#1,319 |
| 62. | Princeton | 0.11% | 0.047%(+0.065)#150 | 0.040%(+0.071)#1,320 |
| 63. | Leonia Borough | 0.11% | 0.047%(+0.061)#151 | 0.040%(+0.068)#1,321 |
| 64. | Colonia | 0.10% | 0.047%(+0.056)#152 | 0.040%(+0.062)#1,322 |
| 65. | New Milford Borough | 0.10% | 0.047%(+0.054)#153 | 0.040%(+0.060)#1,323 |
| 66. | Elmwood Park Borough | 0.099% | 0.047%(+0.052)#154 | 0.040%(+0.059)#1,324 |
| 67. | Roselle Park Borough | 0.093% | 0.047%(+0.046)#155 | 0.040%(+0.053)#1,325 |
| 68. | Bergenfield Borough | 0.092% | 0.047%(+0.045)#156 | 0.040%(+0.052)#1,326 |
| 69. | Lincoln Park Borough | 0.092% | 0.047%(+0.045)#157 | 0.040%(+0.052)#1,327 |
| 70. | Morristown | 0.089% | 0.047%(+0.043)#158 | 0.040%(+0.049)#1,328 |
| 71. | Oradell Borough | 0.085% | 0.047%(+0.039)#159 | 0.040%(+0.045)#1,329 |
| 72. | Palisades Park Borough | 0.084% | 0.047%(+0.037)#160 | 0.040%(+0.044)#1,330 |
| 73. | Northvale Borough | 0.084% | 0.047%(+0.037)#161 | 0.040%(+0.044)#1,331 |
| 74. | Fort Lee Borough | 0.083% | 0.047%(+0.036)#162 | 0.040%(+0.043)#1,332 |
| 75. | Paterson | 0.080% | 0.047%(+0.033)#163 | 0.040%(+0.040)#1,333 |
| 76. | Jersey City | 0.077% | 0.047%(+0.030)#164 | 0.040%(+0.037)#1,334 |
| 77. | Fair Lawn Borough | 0.074% | 0.047%(+0.028)#165 | 0.040%(+0.034)#1,335 |
| 78. | Upper Saddle River Borough | 0.072% | 0.047%(+0.025)#166 | 0.040%(+0.032)#1,336 |
| 79. | Garfield | 0.065% | 0.047%(+0.018)#167 | 0.040%(+0.024)#1,337 |
| 80. | Ringwood Borough | 0.060% | 0.047%(+0.013)#168 | 0.040%(+0.020)#1,338 |
| 81. | Preakness | 0.059% | 0.047%(+0.012)#169 | 0.040%(+0.019)#1,339 |
| 82. | Sayreville Borough | 0.049% | 0.047%(+0.002)#170 | 0.040%(+0.009)#1,340 |
| 83. | West Long Branch Borough | 0.047% | 0.047%(+0.000)#171 | 0.040%(+0.007)#1,341 |
| 84. | Harrison | 0.042% | 0.047%(-0.005)#172 | 0.040%(+0.001)#1,342 |
| 85. | Monmouth Junction | 0.041% | 0.047%(-0.006)#173 | 0.040%(+0.001)#1,343 |
| 86. | Union City | 0.039% | 0.047%(-0.008)#174 | 0.040%(-0.002)#1,534 |
| 87. | Somerset | 0.037% | 0.047%(-0.010)#175 | 0.040%(-0.003)#1,535 |
| 88. | West New York | 0.036% | 0.047%(-0.011)#176 | 0.040%(-0.004)#1,536 |
| 89. | Westfield | 0.032% | 0.047%(-0.014)#177 | 0.040%(-0.008)#1,537 |
| 90. | Point Pleasant Borough | 0.032% | 0.047%(-0.015)#178 | 0.040%(-0.009)#1,538 |
| 91. | Newark | 0.031% | 0.047%(-0.016)#179 | 0.040%(-0.009)#1,568 |
| 92. | Elizabeth | 0.029% | 0.047%(-0.018)#180 | 0.040%(-0.011)#1,569 |
| 93. | Hoboken | 0.027% | 0.047%(-0.020)#181 | 0.040%(-0.013)#1,570 |
| 94. | Toms River | 0.023% | 0.047%(-0.024)#182 | 0.040%(-0.018)#1,571 |
Common Questions
What are the Top 10 Cities with the Highest Percentage of Immigrants from Lebanon in New Jersey?
Top 10 Cities with the Highest Percentage of Immigrants from Lebanon in New Jersey are:
#1
3.89%
#2
0.74%
#3
0.61%
#4
0.36%
#5
0.30%
#6
0.26%
#7
0.21%
#8
0.21%
#9
0.19%
#10
0.16%
What city has the Highest Percentage of Immigrants from Lebanon in New Jersey?
East Rocky Hill has the Highest Percentage of Immigrants from Lebanon in New Jersey with 3.89%.
What is the Percentage of Immigrants from Lebanon in the State of New Jersey?
Percentage of Immigrants from Lebanon in New Jersey is 0.047%.
What is the Percentage of Immigrants from Lebanon in the United States?
Percentage of Immigrants from Lebanon in the United States is 0.040%.