Bloomville, NY
Bloomville Map
Bloomville Overview
290
TOTAL POPULATION
161
MALE POPULATION
129
FEMALE POPULATION
124.81
MALES / 100 FEMALES
80.12
FEMALES / 100 MALES
35.7
MEDIAN AGE
4.2
AVG FAMILY SIZE
3.2
AVG HOUSEHOLD SIZE
$32,130
PER CAPITA INCOME
$79,271
AVG FAMILY INCOME
$78,021
AVG HOUSEHOLD INCOME
0.30
INEQUALITY / GINI INDEX
219
LABOR FORCE [ PEOPLE ]
81.4%
PERCENT IN LABOR FORCE
12.3%
UNEMPLOYMENT RATE
Bloomville Zip Codes
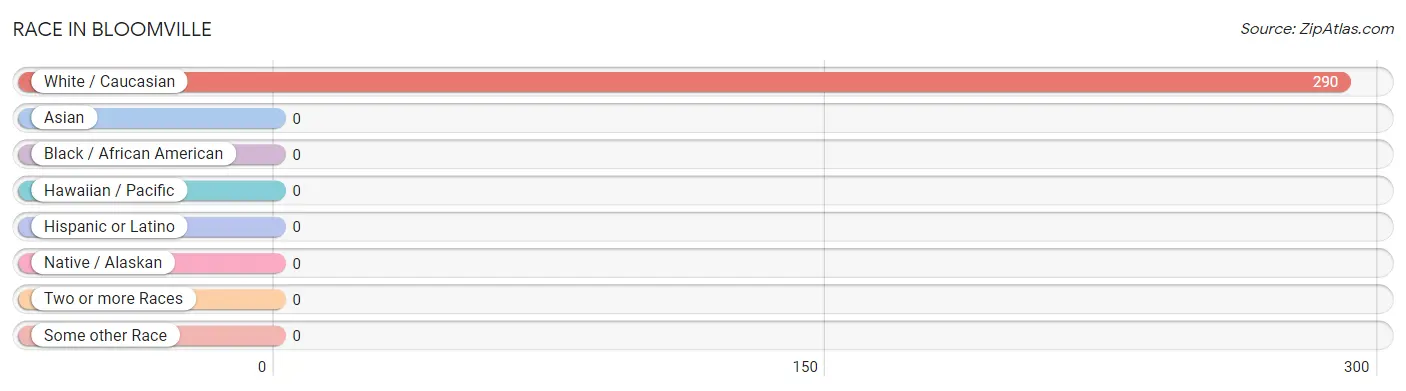
Race in Bloomville
The most populous races in Bloomville are , and White / Caucasian (290 | 100.0%).
| Race | # Population | % Population |
| Asian | 0 | 0.0% |
| Black / African American | 0 | 0.0% |
| Hawaiian / Pacific | 0 | 0.0% |
| Hispanic or Latino | 0 | 0.0% |
| Native / Alaskan | 0 | 0.0% |
| White / Caucasian | 290 | 100.0% |
| Two or more Races | 0 | 0.0% |
| Some other Race | 0 | 0.0% |
| Total | 290 | 100.0% |
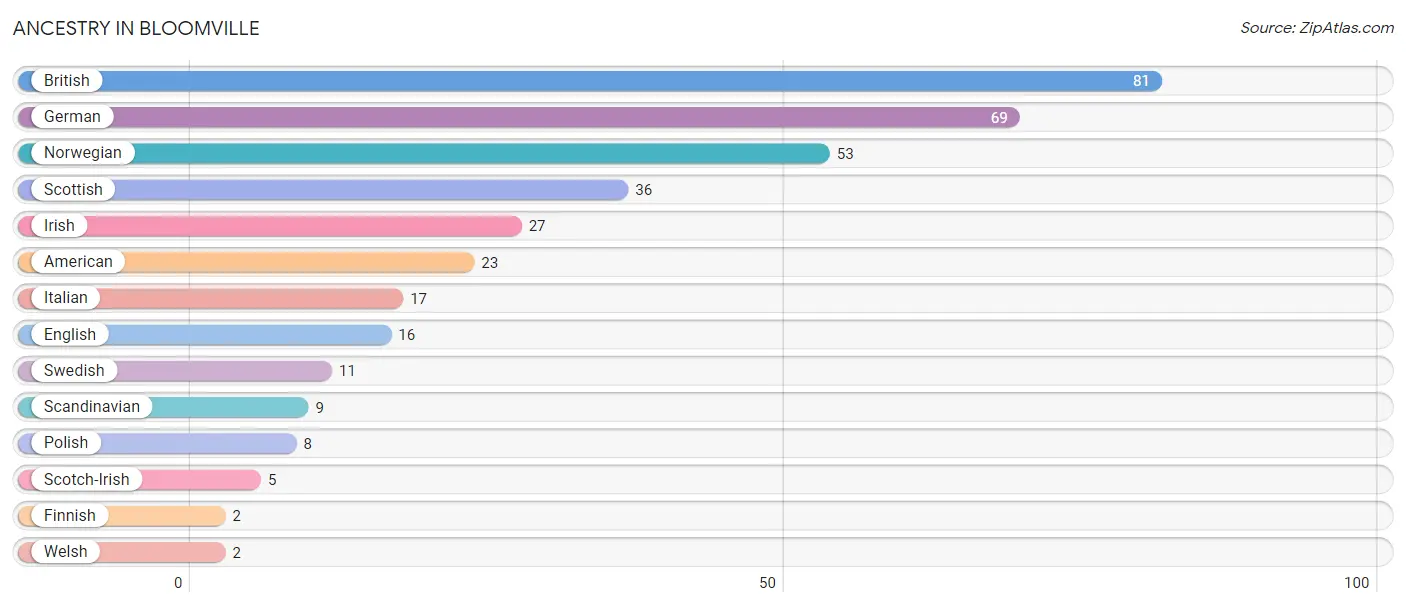
Ancestry in Bloomville
The most populous ancestries reported in Bloomville are British (81 | 27.9%), German (69 | 23.8%), Norwegian (53 | 18.3%), Scottish (36 | 12.4%), and Irish (27 | 9.3%), together accounting for 91.7% of all Bloomville residents.
| Ancestry | # Population | % Population |
| American | 23 | 7.9% |
| British | 81 | 27.9% |
| English | 16 | 5.5% |
| Finnish | 2 | 0.7% |
| German | 69 | 23.8% |
| Irish | 27 | 9.3% |
| Italian | 17 | 5.9% |
| Norwegian | 53 | 18.3% |
| Polish | 8 | 2.8% |
| Scandinavian | 9 | 3.1% |
| Scotch-Irish | 5 | 1.7% |
| Scottish | 36 | 12.4% |
| Swedish | 11 | 3.8% |
| Welsh | 2 | 0.7% | View All 14 Rows |
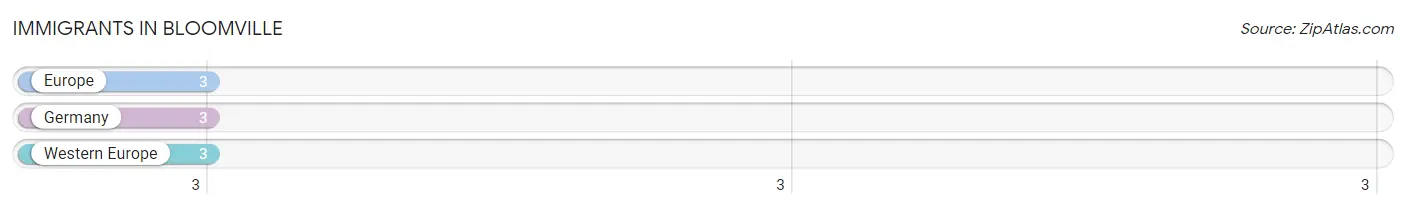
Immigrants in Bloomville
The most numerous immigrant groups reported in Bloomville came from Europe (3 | 1.0%), Germany (3 | 1.0%), and Western Europe (3 | 1.0%), together accounting for 3.1% of all Bloomville residents.
| Immigration Origin | # Population | % Population |
| Europe | 3 | 1.0% |
| Germany | 3 | 1.0% |
| Western Europe | 3 | 1.0% | View All 3 Rows |
Sex and Age in Bloomville
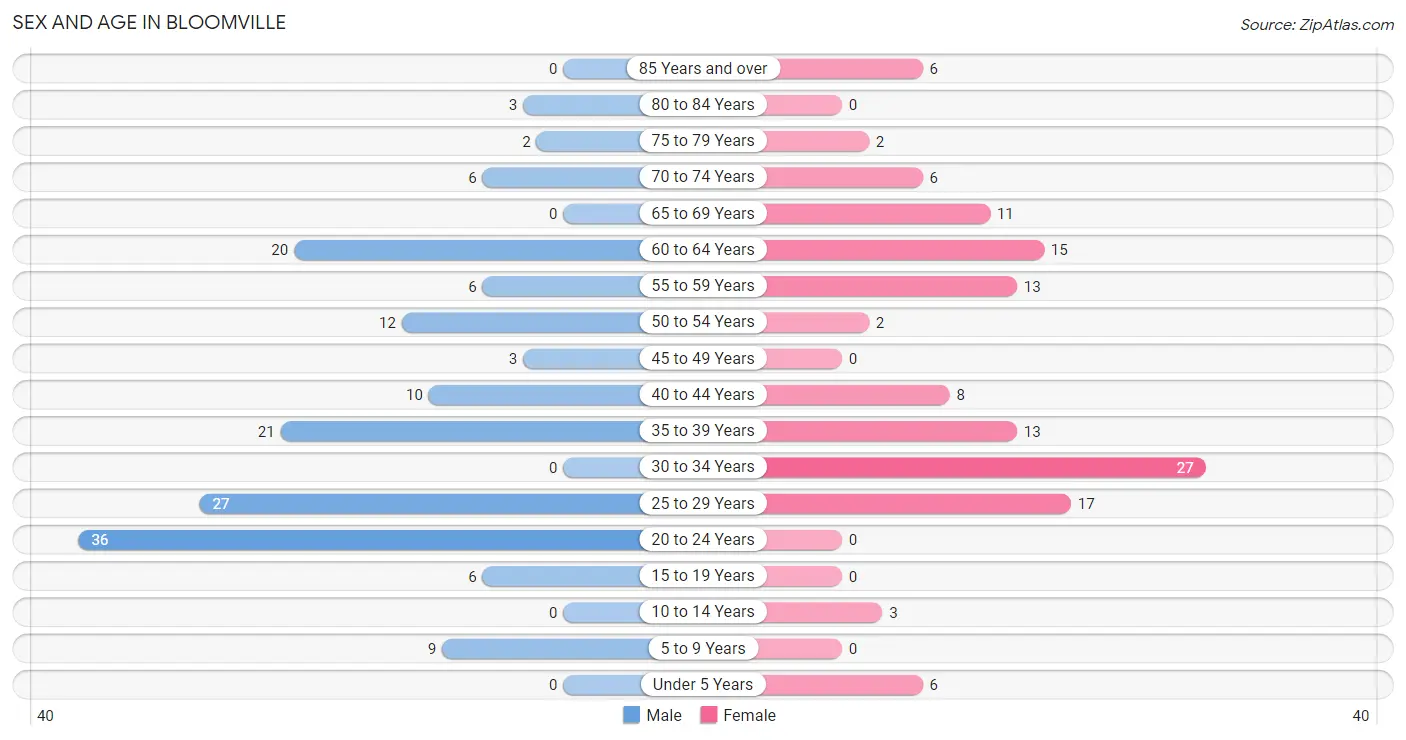
Sex and Age in Bloomville
The most populous age groups in Bloomville are 20 to 24 Years (36 | 22.4%) for men and 30 to 34 Years (27 | 20.9%) for women.
| Age Bracket | Male | Female |
| Under 5 Years | 0 (0.0%) | 6 (4.6%) |
| 5 to 9 Years | 9 (5.6%) | 0 (0.0%) |
| 10 to 14 Years | 0 (0.0%) | 3 (2.3%) |
| 15 to 19 Years | 6 (3.7%) | 0 (0.0%) |
| 20 to 24 Years | 36 (22.4%) | 0 (0.0%) |
| 25 to 29 Years | 27 (16.8%) | 17 (13.2%) |
| 30 to 34 Years | 0 (0.0%) | 27 (20.9%) |
| 35 to 39 Years | 21 (13.0%) | 13 (10.1%) |
| 40 to 44 Years | 10 (6.2%) | 8 (6.2%) |
| 45 to 49 Years | 3 (1.9%) | 0 (0.0%) |
| 50 to 54 Years | 12 (7.4%) | 2 (1.5%) |
| 55 to 59 Years | 6 (3.7%) | 13 (10.1%) |
| 60 to 64 Years | 20 (12.4%) | 15 (11.6%) |
| 65 to 69 Years | 0 (0.0%) | 11 (8.5%) |
| 70 to 74 Years | 6 (3.7%) | 6 (4.6%) |
| 75 to 79 Years | 2 (1.2%) | 2 (1.5%) |
| 80 to 84 Years | 3 (1.9%) | 0 (0.0%) |
| 85 Years and over | 0 (0.0%) | 6 (4.6%) |
| Total | 161 (100.0%) | 129 (100.0%) |
Families and Households in Bloomville
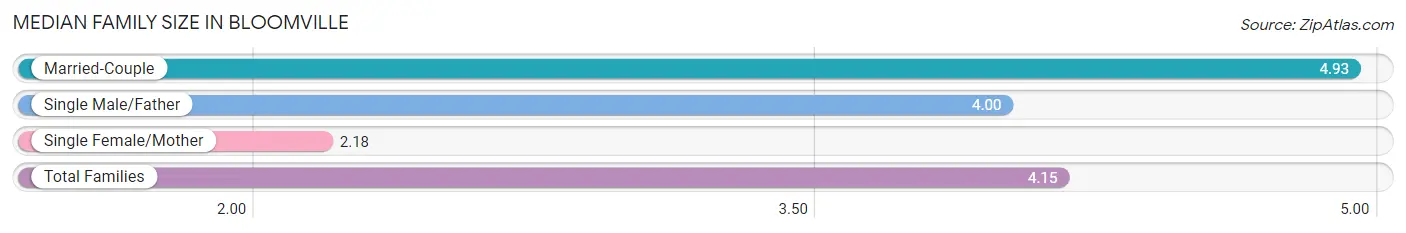
Median Family Size in Bloomville
The median family size in Bloomville is 4.15 persons per family, with married-couple families (30 | 56.6%) accounting for the largest median family size of 4.93 persons per family. On the other hand, single female/mother families (11 | 20.7%) represent the smallest median family size with 2.18 persons per family.
| Family Type | # Families | Family Size |
| Married-Couple | 30 (56.6%) | 4.93 |
| Single Male/Father | 12 (22.6%) | 4.00 |
| Single Female/Mother | 11 (20.7%) | 2.18 |
| Total Families | 53 (100.0%) | 4.15 |
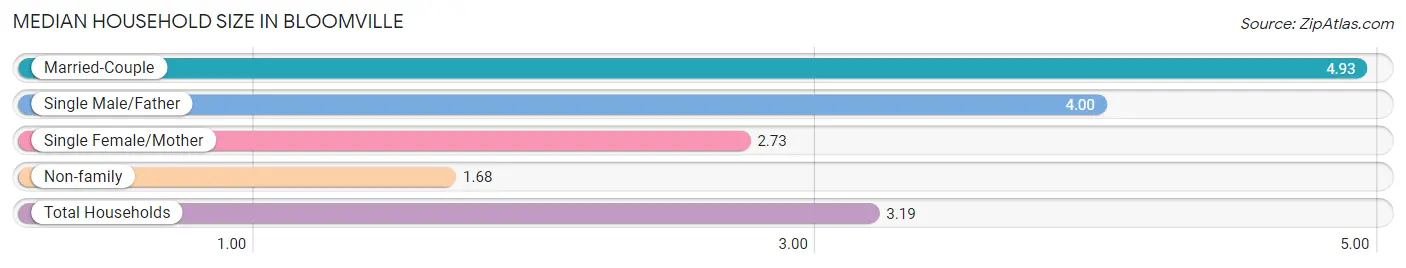
Median Household Size in Bloomville
The median household size in Bloomville is 3.19 persons per household, with married-couple households (30 | 33.0%) accounting for the largest median household size of 4.93 persons per household. non-family households (38 | 41.8%) represent the smallest median household size with 1.68 persons per household.
| Household Type | # Households | Household Size |
| Married-Couple | 30 (33.0%) | 4.93 |
| Single Male/Father | 12 (13.2%) | 4.00 |
| Single Female/Mother | 11 (12.1%) | 2.73 |
| Non-family | 38 (41.8%) | 1.68 |
| Total Households | 91 (100.0%) | 3.19 |
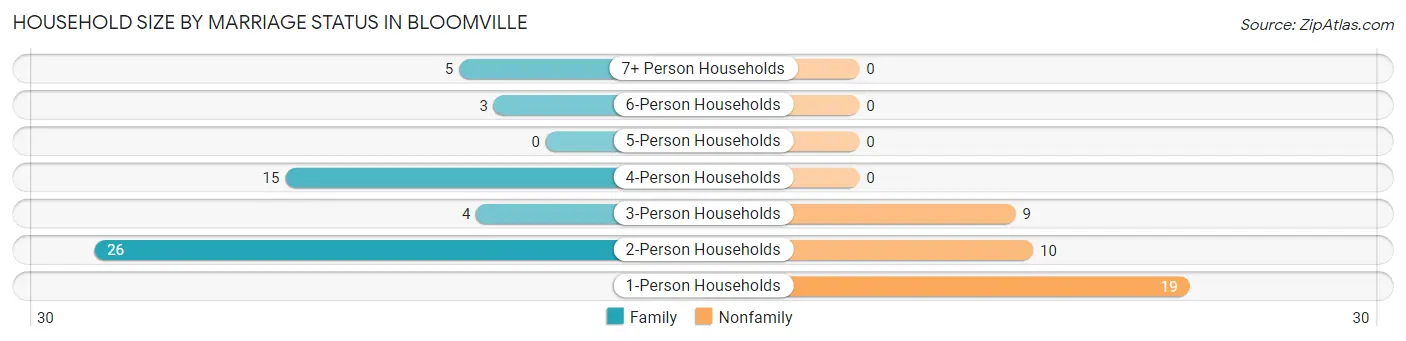
Household Size by Marriage Status in Bloomville
Out of a total of 91 households in Bloomville, 53 (58.2%) are family households, while 38 (41.8%) are nonfamily households. The most numerous type of family households are 2-person households, comprising 26, and the most common type of nonfamily households are 1-person households, comprising 19.
| Household Size | Family Households | Nonfamily Households |
| 1-Person Households | - | 19 (20.9%) |
| 2-Person Households | 26 (28.6%) | 10 (11.0%) |
| 3-Person Households | 4 (4.4%) | 9 (9.9%) |
| 4-Person Households | 15 (16.5%) | 0 (0.0%) |
| 5-Person Households | 0 (0.0%) | 0 (0.0%) |
| 6-Person Households | 3 (3.3%) | 0 (0.0%) |
| 7+ Person Households | 5 (5.5%) | 0 (0.0%) |
| Total | 53 (58.2%) | 38 (41.8%) |
Female Fertility in Bloomville
Fertility by Age in Bloomville
Average fertility rate in Bloomville is 77.0 births per 1,000 women. Women in the age bracket of 35 to 50 years have the highest fertility rate with 238.0 births per 1,000 women. Women in the age bracket of 35 to 50 years acount for 100.0% of all women with births.
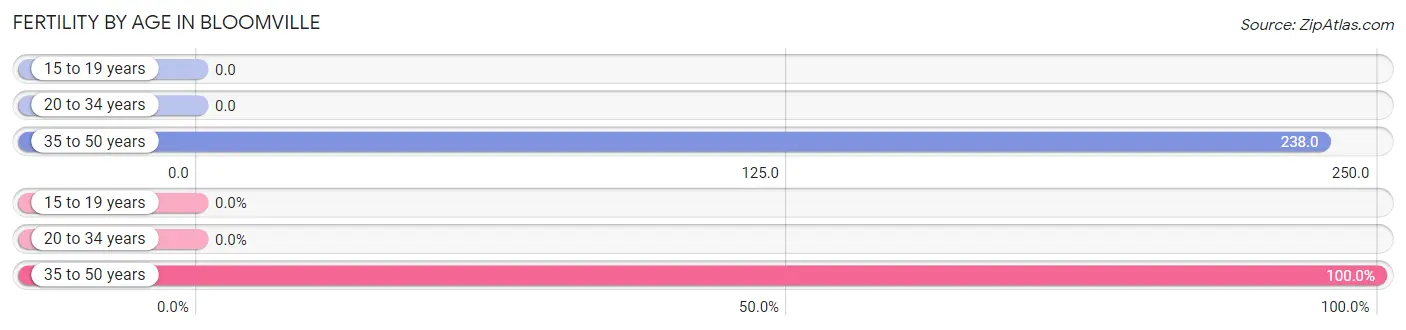
| Age Bracket | Women with Births | Births / 1,000 Women |
| 15 to 19 years | 0 (0.0%) | 0.0 |
| 20 to 34 years | 0 (0.0%) | 0.0 |
| 35 to 50 years | 5 (100.0%) | 238.0 |
| Total | 5 (100.0%) | 77.0 |
Fertility by Age by Marriage Status in Bloomville
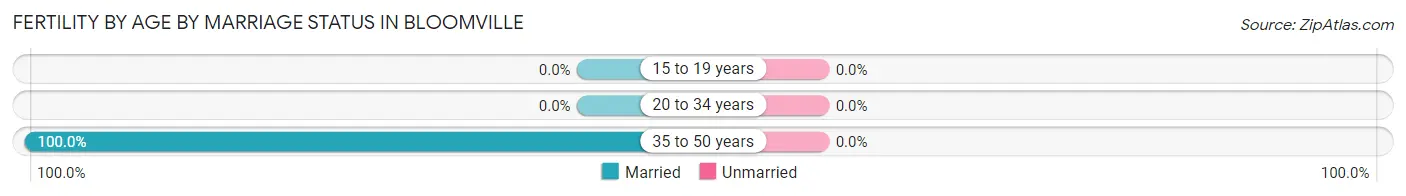
| Age Bracket | Married | Unmarried |
| 15 to 19 years | 0 (0.0%) | 0 (0.0%) |
| 20 to 34 years | 0 (0.0%) | 0 (0.0%) |
| 35 to 50 years | 5 (100.0%) | 0 (0.0%) |
| Total | 5 (100.0%) | 0 (0.0%) |
Fertility by Education in Bloomville
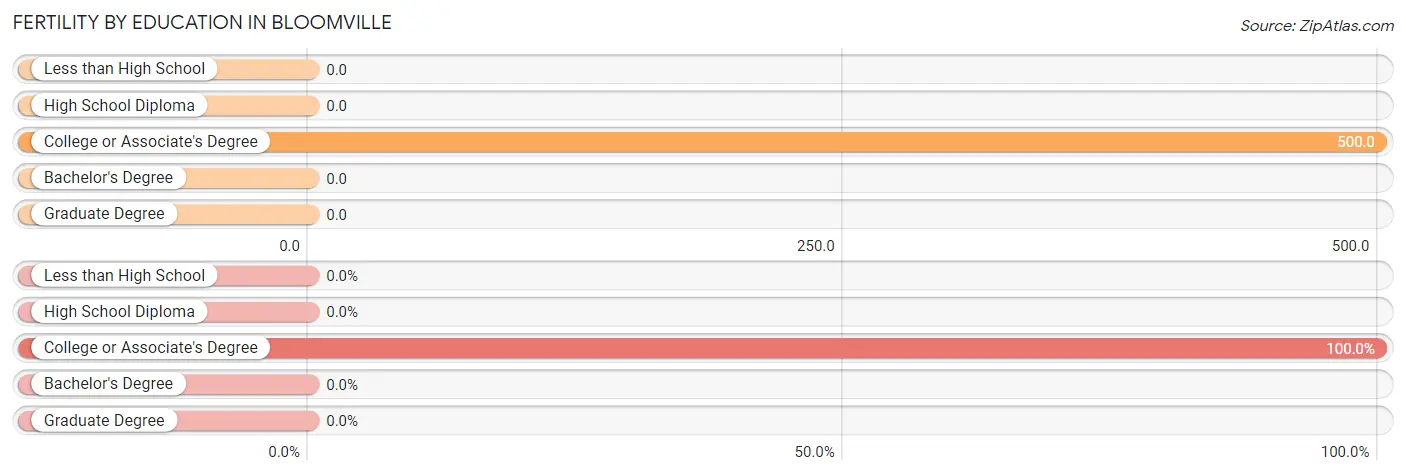
| Educational Attainment | Women with Births | Births / 1,000 Women |
| Less than High School | 0 (0.0%) | 0.0 |
| High School Diploma | 0 (0.0%) | 0.0 |
| College or Associate's Degree | 5 (100.0%) | 500.0 |
| Bachelor's Degree | 0 (0.0%) | 0.0 |
| Graduate Degree | 0 (0.0%) | 0.0 |
| Total | 5 (100.0%) | 77.0 |
Fertility by Education by Marriage Status in Bloomville
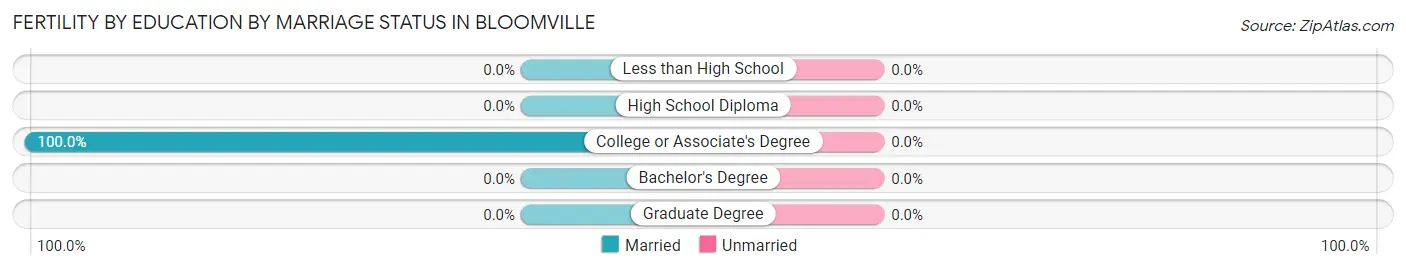
| Educational Attainment | Married | Unmarried |
| Less than High School | 0 (0.0%) | 0 (0.0%) |
| High School Diploma | 0 (0.0%) | 0 (0.0%) |
| College or Associate's Degree | 5 (100.0%) | 0 (0.0%) |
| Bachelor's Degree | 0 (0.0%) | 0 (0.0%) |
| Graduate Degree | 0 (0.0%) | 0 (0.0%) |
| Total | 5 (100.0%) | 0 (0.0%) |
Income in Bloomville
Income Overview in Bloomville
Per Capita Income in Bloomville is $32,130, while median incomes of families and households are $79,271 and $78,021 respectively.
| Characteristic | Number | Measure |
| Per Capita Income | 290 | $32,130 |
| Median Family Income | 53 | $79,271 |
| Mean Family Income | 53 | $99,325 |
| Median Household Income | 91 | $78,021 |
| Mean Household Income | 91 | $92,088 |
| Income Deficit | 53 | $0 |
| Wage / Income Gap (%) | 290 | 0.00% |
| Wage / Income Gap ($) | 290 | 100.00¢ per $1 |
| Gini / Inequality Index | 290 | 0.30 |
Earnings by Sex in Bloomville
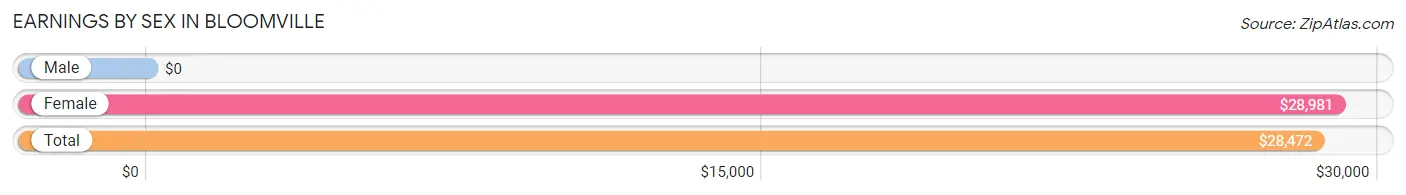
| Sex | Number | Average Earnings |
| Male | 107 (53.2%) | $0 |
| Female | 94 (46.8%) | $28,981 |
| Total | 201 (100.0%) | $28,472 |
Earnings by Sex by Income Bracket in Bloomville
The most common earnings brackets in Bloomville are $15,000 to $17,499 for men (36 | 33.6%) and $25,000 to $29,999 for women (27 | 28.7%).
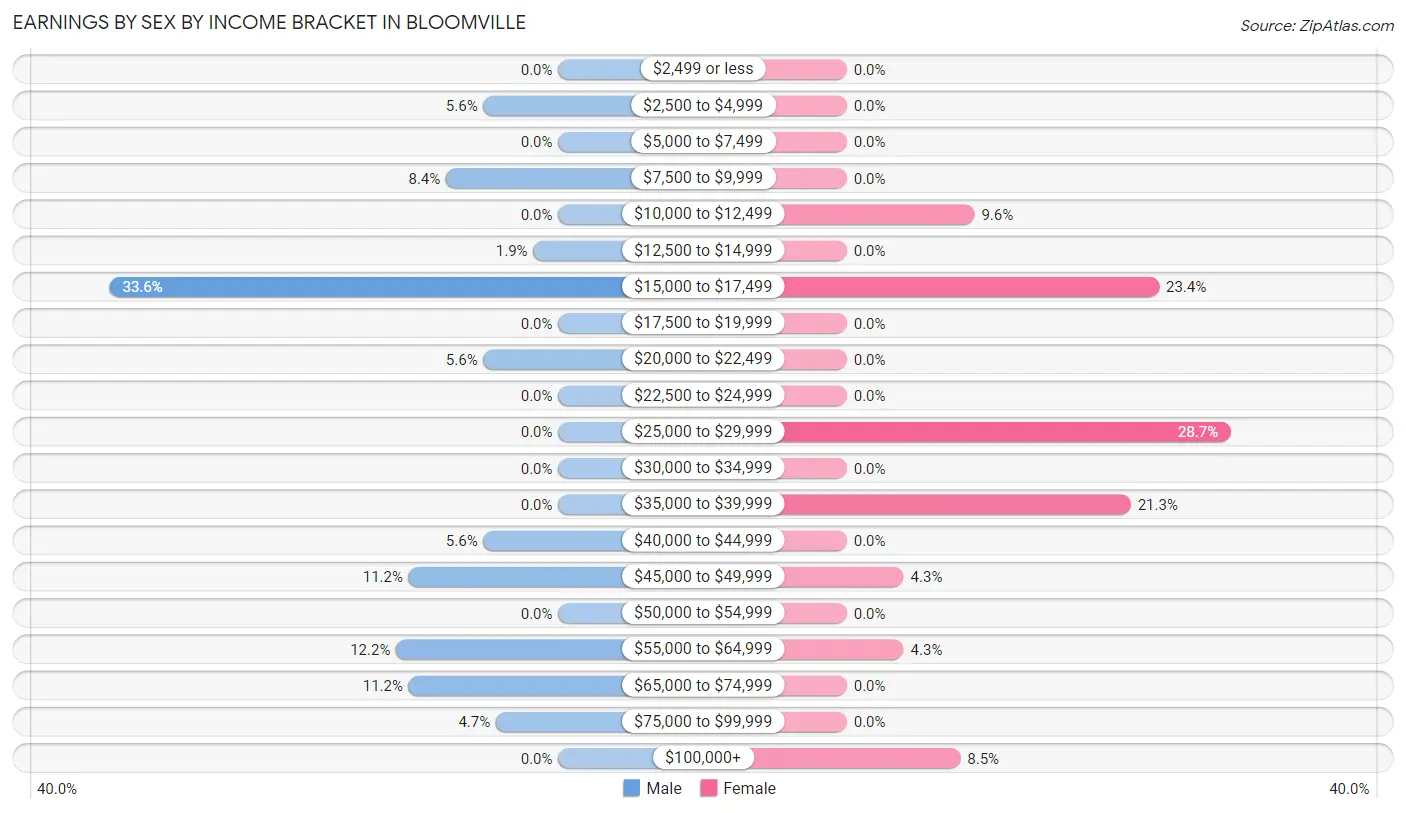
| Income | Male | Female |
| $2,499 or less | 0 (0.0%) | 0 (0.0%) |
| $2,500 to $4,999 | 6 (5.6%) | 0 (0.0%) |
| $5,000 to $7,499 | 0 (0.0%) | 0 (0.0%) |
| $7,500 to $9,999 | 9 (8.4%) | 0 (0.0%) |
| $10,000 to $12,499 | 0 (0.0%) | 9 (9.6%) |
| $12,500 to $14,999 | 2 (1.9%) | 0 (0.0%) |
| $15,000 to $17,499 | 36 (33.6%) | 22 (23.4%) |
| $17,500 to $19,999 | 0 (0.0%) | 0 (0.0%) |
| $20,000 to $22,499 | 6 (5.6%) | 0 (0.0%) |
| $22,500 to $24,999 | 0 (0.0%) | 0 (0.0%) |
| $25,000 to $29,999 | 0 (0.0%) | 27 (28.7%) |
| $30,000 to $34,999 | 0 (0.0%) | 0 (0.0%) |
| $35,000 to $39,999 | 0 (0.0%) | 20 (21.3%) |
| $40,000 to $44,999 | 6 (5.6%) | 0 (0.0%) |
| $45,000 to $49,999 | 12 (11.2%) | 4 (4.3%) |
| $50,000 to $54,999 | 0 (0.0%) | 0 (0.0%) |
| $55,000 to $64,999 | 13 (12.1%) | 4 (4.3%) |
| $65,000 to $74,999 | 12 (11.2%) | 0 (0.0%) |
| $75,000 to $99,999 | 5 (4.7%) | 0 (0.0%) |
| $100,000+ | 0 (0.0%) | 8 (8.5%) |
| Total | 107 (100.0%) | 94 (100.0%) |
Earnings by Sex by Educational Attainment in Bloomville
Average earnings in Bloomville are $46,354 for men and $28,981 for women, a difference of 37.5%. Men with an educational attainment of college or associate's degree enjoy the highest average annual earnings of $20,417, while those with college or associate's degree education earn the least with $20,417. Women with an educational attainment of college or associate's degree earn the most with the average annual earnings of $36,083, while those with college or associate's degree education have the smallest earnings of $36,083.
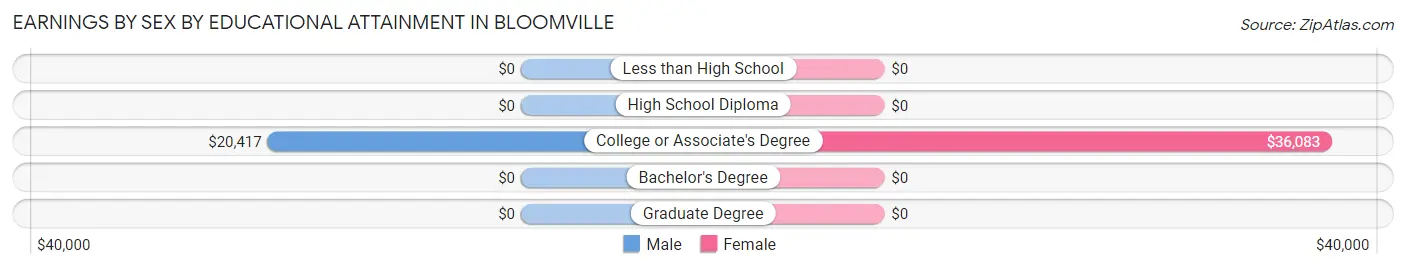
| Educational Attainment | Male Income | Female Income |
| Less than High School | - | - |
| High School Diploma | - | - |
| College or Associate's Degree | $20,417 | $36,083 |
| Bachelor's Degree | - | - |
| Graduate Degree | - | - |
| Total | $46,354 | $28,981 |
Family Income in Bloomville
Family Income Brackets in Bloomville
According to the Bloomville family income data, there are 20 families falling into the $150,000 to $199,999 income range, which is the most common income bracket and makes up 37.7% of all families.
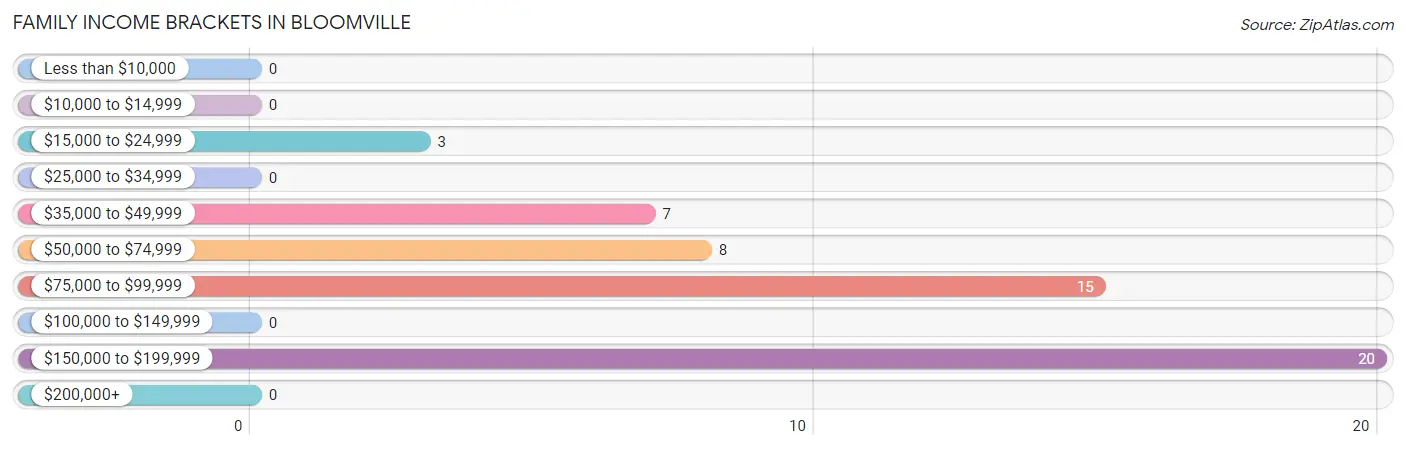
| Income Bracket | # Families | % Families |
| Less than $10,000 | 0 | 0.0% |
| $10,000 to $14,999 | 0 | 0.0% |
| $15,000 to $24,999 | 3 | 5.7% |
| $25,000 to $34,999 | 0 | 0.0% |
| $35,000 to $49,999 | 7 | 13.2% |
| $50,000 to $74,999 | 8 | 15.1% |
| $75,000 to $99,999 | 15 | 28.3% |
| $100,000 to $149,999 | 0 | 0.0% |
| $150,000 to $199,999 | 20 | 37.7% |
| $200,000+ | 0 | 0.0% |
Family Income by Famaliy Size in Bloomville
2-person families (30 | 56.6%) account for the highest median family income in Bloomville with $74,063 per family, while 2-person families (30 | 56.6%) have the highest median income of $37,032 per family member.
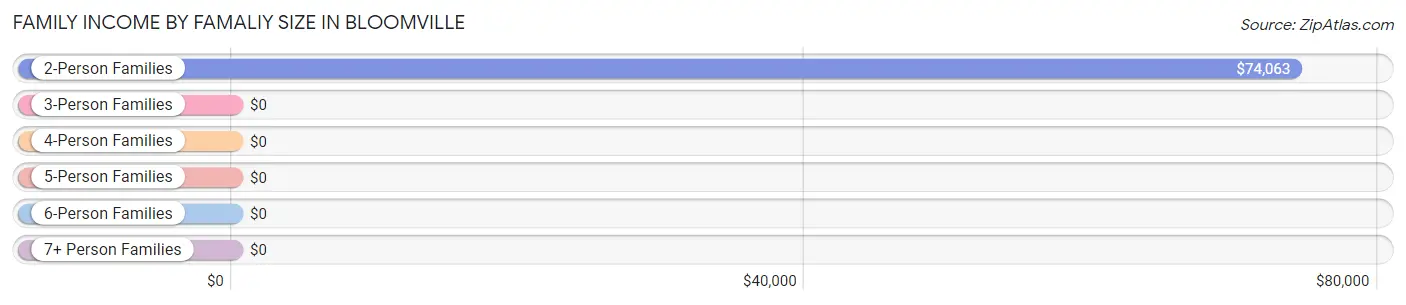
| Income Bracket | # Families | Median Income |
| 2-Person Families | 30 (56.6%) | $74,063 |
| 3-Person Families | 0 (0.0%) | $0 |
| 4-Person Families | 15 (28.3%) | $0 |
| 5-Person Families | 0 (0.0%) | $0 |
| 6-Person Families | 3 (5.7%) | $0 |
| 7+ Person Families | 5 (9.4%) | $0 |
| Total | 53 (100.0%) | $79,271 |
Family Income by Number of Earners in Bloomville
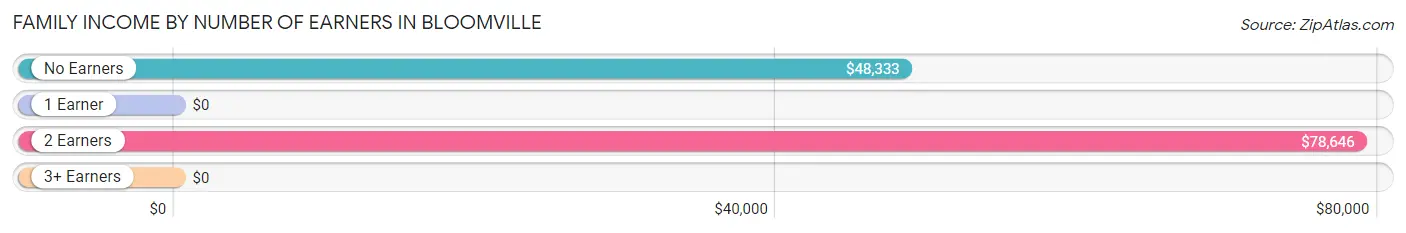
| Number of Earners | # Families | Median Income |
| No Earners | 8 (15.1%) | $48,333 |
| 1 Earner | 6 (11.3%) | $0 |
| 2 Earners | 19 (35.8%) | $78,646 |
| 3+ Earners | 20 (37.7%) | $0 |
| Total | 53 (100.0%) | $79,271 |
Household Income in Bloomville
Household Income Brackets in Bloomville
With 29 households falling in the category, the $75,000 to $99,999 income range is the most frequent in Bloomville, accounting for 31.9% of all households.
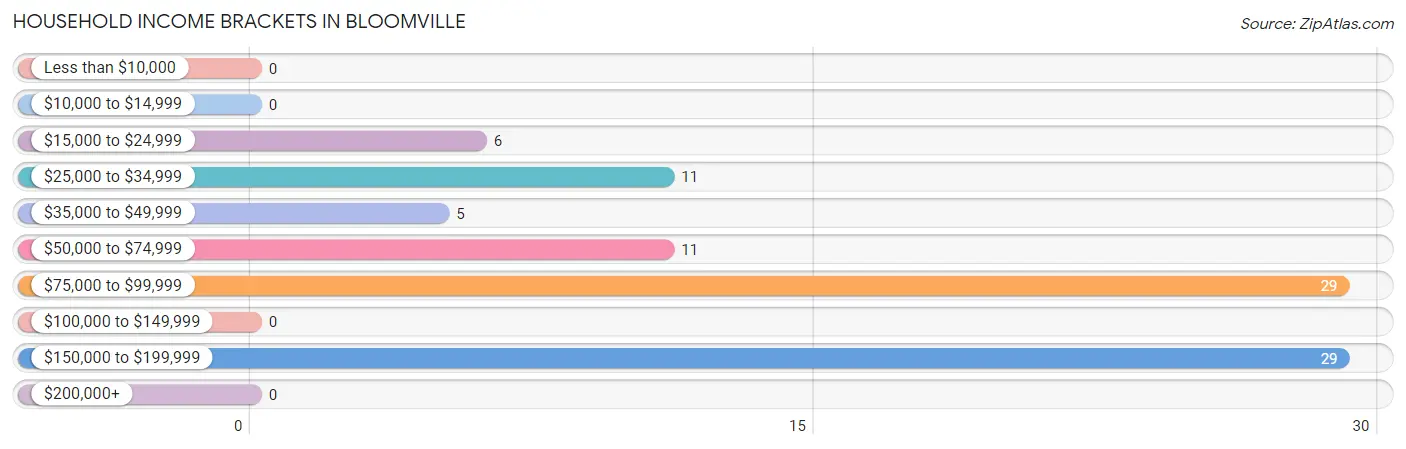
| Income Bracket | # Households | % Households |
| Less than $10,000 | 0 | 0.0% |
| $10,000 to $14,999 | 0 | 0.0% |
| $15,000 to $24,999 | 6 | 6.6% |
| $25,000 to $34,999 | 11 | 12.1% |
| $35,000 to $49,999 | 5 | 5.5% |
| $50,000 to $74,999 | 11 | 12.1% |
| $75,000 to $99,999 | 29 | 31.9% |
| $100,000 to $149,999 | 0 | 0.0% |
| $150,000 to $199,999 | 29 | 31.9% |
| $200,000+ | 0 | 0.0% |
Household Income by Householder Age in Bloomville
The median household income in Bloomville is $78,021, with the highest median household income of $32,083 found in the 65+ years age bracket for the primary householder. A total of 27 households (29.7%) fall into this category.
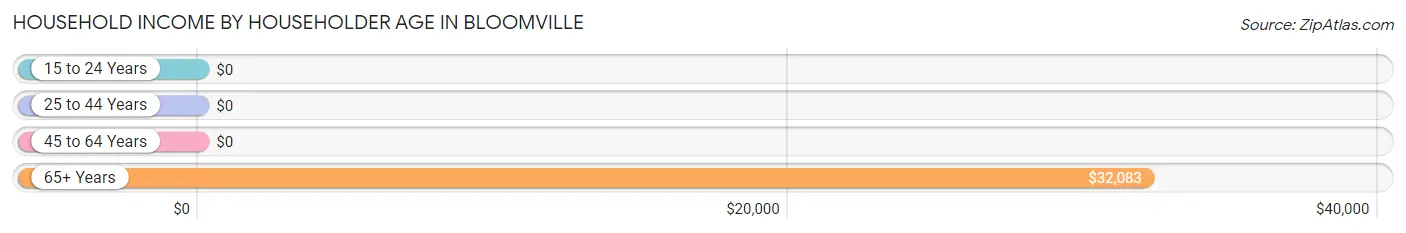
| Income Bracket | # Households | Median Income |
| 15 to 24 Years | 0 (0.0%) | $0 |
| 25 to 44 Years | 19 (20.9%) | $0 |
| 45 to 64 Years | 45 (49.4%) | $0 |
| 65+ Years | 27 (29.7%) | $32,083 |
| Total | 91 (100.0%) | $78,021 |
Poverty in Bloomville
Income Below Poverty by Sex and Age in Bloomville
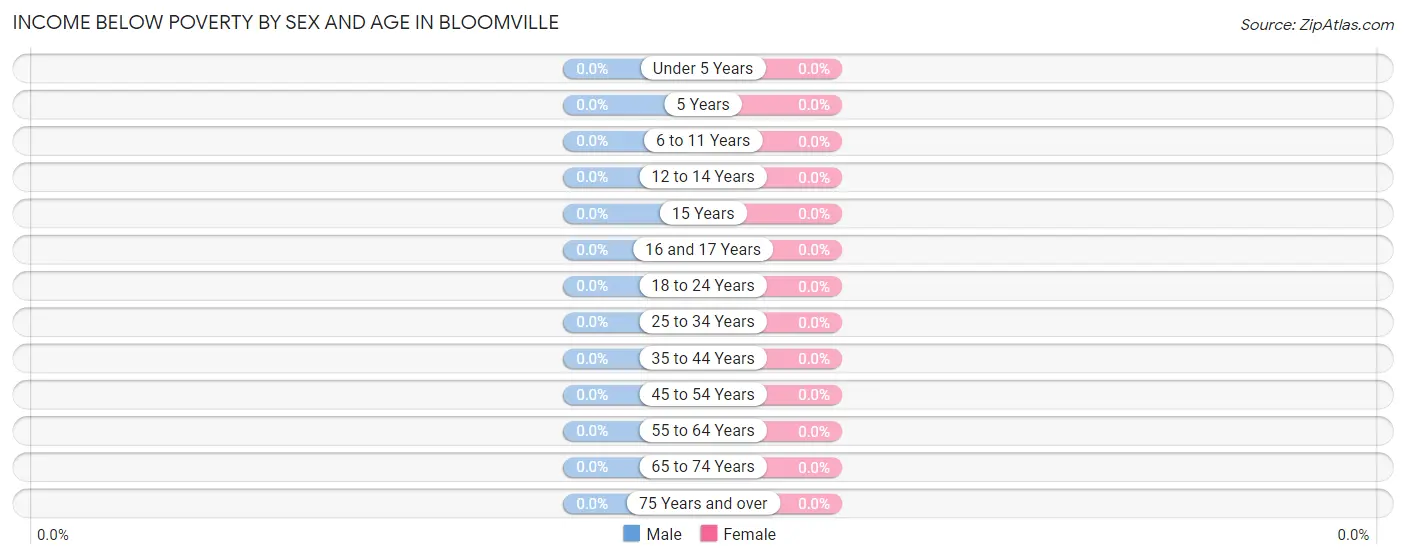
| Age Bracket | Male | Female |
| Under 5 Years | 0 (0.0%) | 0 (0.0%) |
| 5 Years | 0 (0.0%) | 0 (0.0%) |
| 6 to 11 Years | 0 (0.0%) | 0 (0.0%) |
| 12 to 14 Years | 0 (0.0%) | 0 (0.0%) |
| 15 Years | 0 (0.0%) | 0 (0.0%) |
| 16 and 17 Years | 0 (0.0%) | 0 (0.0%) |
| 18 to 24 Years | 0 (0.0%) | 0 (0.0%) |
| 25 to 34 Years | 0 (0.0%) | 0 (0.0%) |
| 35 to 44 Years | 0 (0.0%) | 0 (0.0%) |
| 45 to 54 Years | 0 (0.0%) | 0 (0.0%) |
| 55 to 64 Years | 0 (0.0%) | 0 (0.0%) |
| 65 to 74 Years | 0 (0.0%) | 0 (0.0%) |
| 75 Years and over | 0 (0.0%) | 0 (0.0%) |
| Total | 0 (0.0%) | 0 (0.0%) |
Income Above Poverty by Sex and Age in Bloomville
According to the poverty statistics in Bloomville, males aged 6 to 11 years and females aged under 5 years are the age groups that are most secure financially, with 100.0% of males and 100.0% of females in these age groups living above the poverty line.
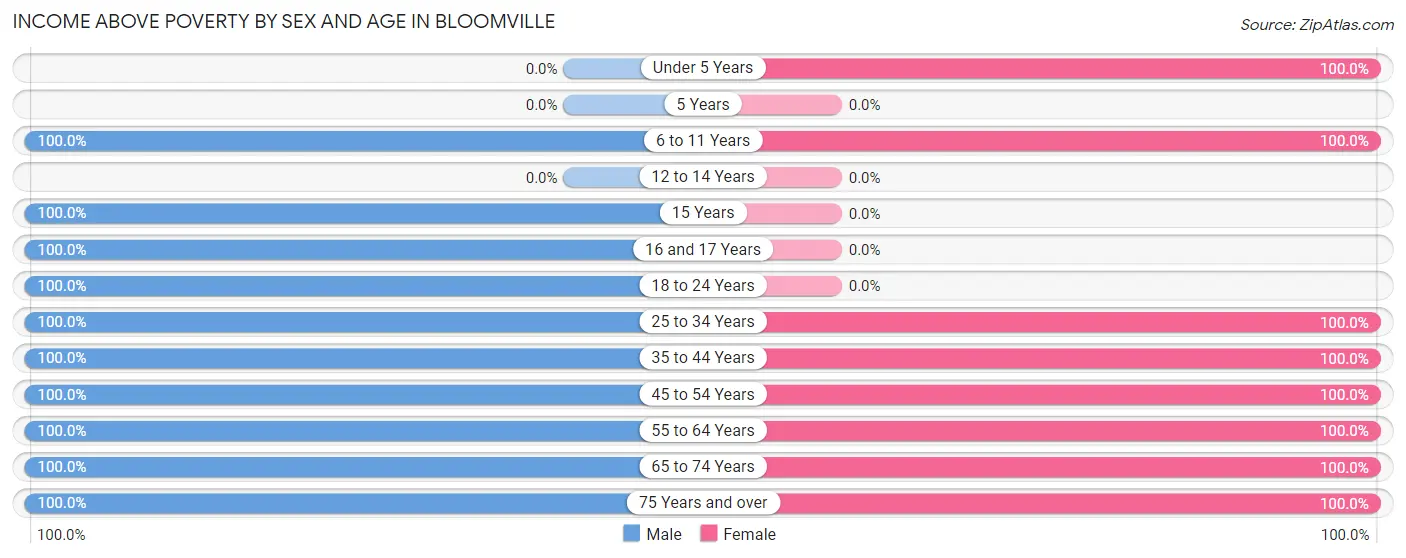
| Age Bracket | Male | Female |
| Under 5 Years | 0 (0.0%) | 6 (100.0%) |
| 5 Years | 0 (0.0%) | 0 (0.0%) |
| 6 to 11 Years | 3 (100.0%) | 3 (100.0%) |
| 12 to 14 Years | 0 (0.0%) | 0 (0.0%) |
| 15 Years | 3 (100.0%) | 0 (0.0%) |
| 16 and 17 Years | 3 (100.0%) | 0 (0.0%) |
| 18 to 24 Years | 36 (100.0%) | 0 (0.0%) |
| 25 to 34 Years | 27 (100.0%) | 44 (100.0%) |
| 35 to 44 Years | 31 (100.0%) | 21 (100.0%) |
| 45 to 54 Years | 15 (100.0%) | 2 (100.0%) |
| 55 to 64 Years | 26 (100.0%) | 28 (100.0%) |
| 65 to 74 Years | 6 (100.0%) | 17 (100.0%) |
| 75 Years and over | 5 (100.0%) | 8 (100.0%) |
| Total | 155 (100.0%) | 129 (100.0%) |
Income Below Poverty Among Married-Couple Families in Bloomville
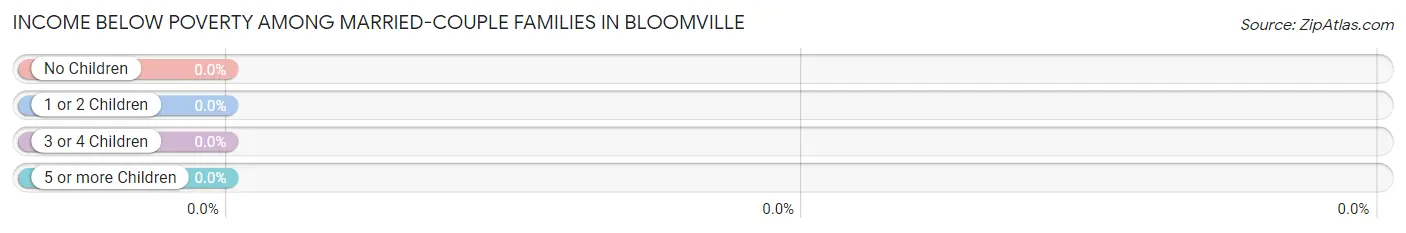
| Children | Above Poverty | Below Poverty |
| No Children | 22 (100.0%) | 0 (0.0%) |
| 1 or 2 Children | 5 (100.0%) | 0 (0.0%) |
| 3 or 4 Children | 3 (100.0%) | 0 (0.0%) |
| 5 or more Children | 0 (0.0%) | 0 (0.0%) |
| Total | 30 (100.0%) | 0 (0.0%) |
Income Below Poverty Among Single-Parent Households in Bloomville
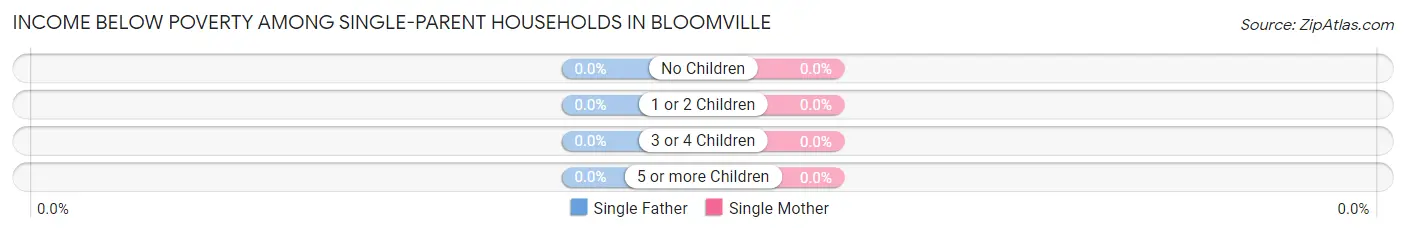
| Children | Single Father | Single Mother |
| No Children | 0 (0.0%) | 0 (0.0%) |
| 1 or 2 Children | 0 (0.0%) | 0 (0.0%) |
| 3 or 4 Children | 0 (0.0%) | 0 (0.0%) |
| 5 or more Children | 0 (0.0%) | 0 (0.0%) |
| Total | 0 (0.0%) | 0 (0.0%) |
Income Below Poverty Among Married-Couple vs Single-Parent Households in Bloomville
| Children | Married-Couple Families | Single-Parent Households |
| No Children | 0 (0.0%) | 0 (0.0%) |
| 1 or 2 Children | 0 (0.0%) | 0 (0.0%) |
| 3 or 4 Children | 0 (0.0%) | 0 (0.0%) |
| 5 or more Children | 0 (0.0%) | 0 (0.0%) |
| Total | 0 (0.0%) | 0 (0.0%) |
Employment Characteristics in Bloomville
Employment by Class of Employer in Bloomville
Among the 192 employed individuals in Bloomville, private company employees (97 | 50.5%), local government employees (40 | 20.8%), and not-for-profit organizations (20 | 10.4%) make up the most common classes of employment.
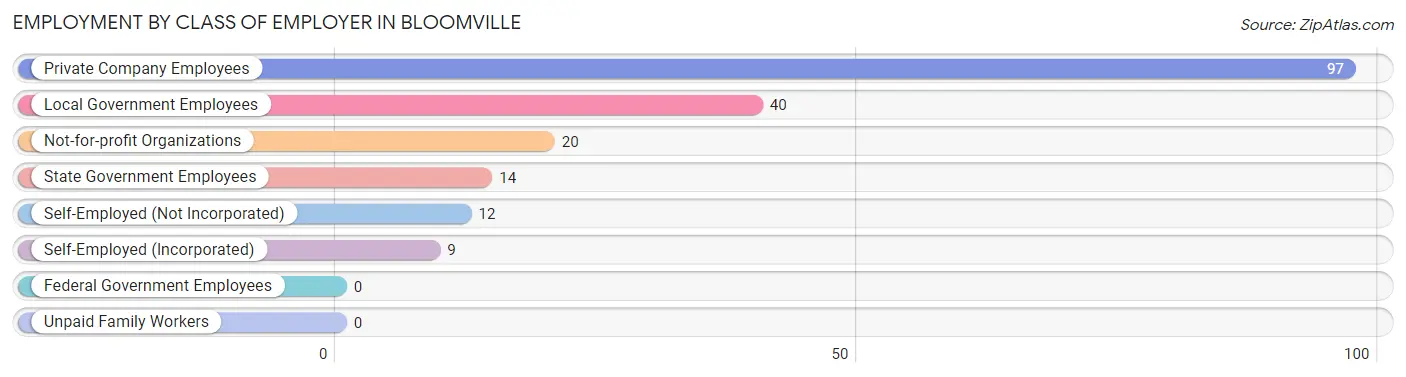
| Employer Class | # Employees | % Employees |
| Private Company Employees | 97 | 50.5% |
| Self-Employed (Incorporated) | 9 | 4.7% |
| Self-Employed (Not Incorporated) | 12 | 6.2% |
| Not-for-profit Organizations | 20 | 10.4% |
| Local Government Employees | 40 | 20.8% |
| State Government Employees | 14 | 7.3% |
| Federal Government Employees | 0 | 0.0% |
| Unpaid Family Workers | 0 | 0.0% |
| Total | 192 | 100.0% |
Employment Status by Age in Bloomville
According to the labor force statistics for Bloomville, out of the total population over 16 years of age (269), 81.4% or 219 individuals are in the labor force, with 12.3% or 27 of them unemployed. The age group with the highest labor force participation rate is 20 to 24 years, with 100.0% or 36 individuals in the labor force. Within the labor force, the 25 to 29 years age range has the highest percentage of unemployed individuals, with 61.4% or 27 of them being unemployed.
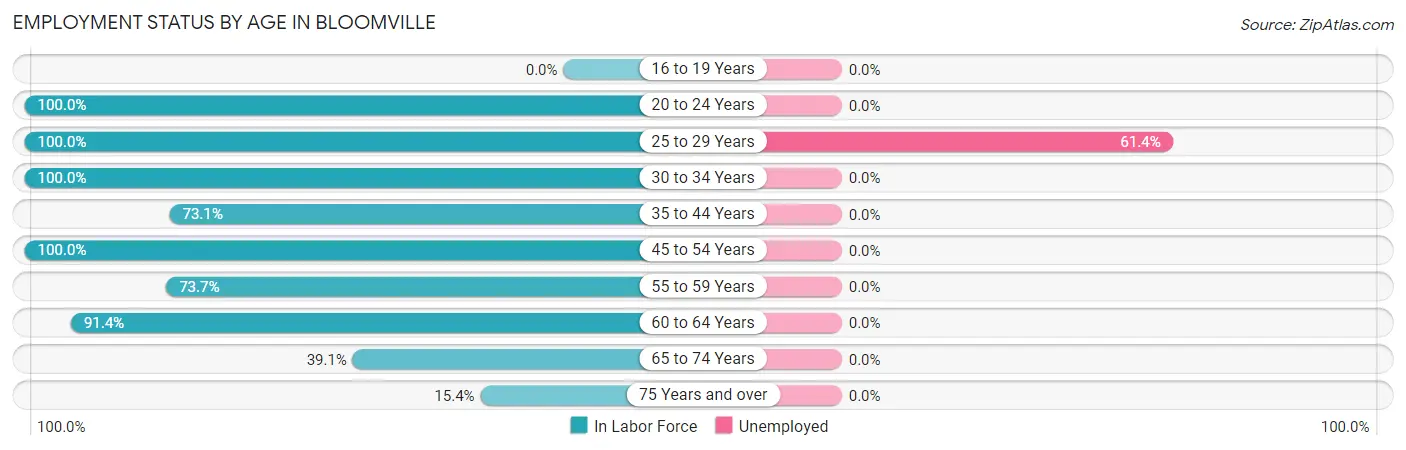
| Age Bracket | In Labor Force | Unemployed |
| 16 to 19 Years | 0 (0.0%) | 0 (0.0%) |
| 20 to 24 Years | 36 (100.0%) | 0 (0.0%) |
| 25 to 29 Years | 44 (100.0%) | 27 (61.4%) |
| 30 to 34 Years | 27 (100.0%) | 0 (0.0%) |
| 35 to 44 Years | 38 (73.1%) | 0 (0.0%) |
| 45 to 54 Years | 17 (100.0%) | 0 (0.0%) |
| 55 to 59 Years | 14 (73.7%) | 0 (0.0%) |
| 60 to 64 Years | 32 (91.4%) | 0 (0.0%) |
| 65 to 74 Years | 9 (39.1%) | 0 (0.0%) |
| 75 Years and over | 2 (15.4%) | 0 (0.0%) |
| Total | 219 (81.4%) | 27 (12.3%) |
Employment Status by Educational Attainment in Bloomville
According to labor force statistics for Bloomville, 88.7% of individuals (172) out of the total population between 25 and 64 years of age (194) are in the labor force, with 15.7% or 27 of them being unemployed. The group with the highest labor force participation rate are those with the educational attainment of less than high school, with 100.0% or 28 individuals in the labor force. Within the labor force, individuals with bachelor's degree or higher education have the highest percentage of unemployment, with 34.2% or 27 of them being unemployed.
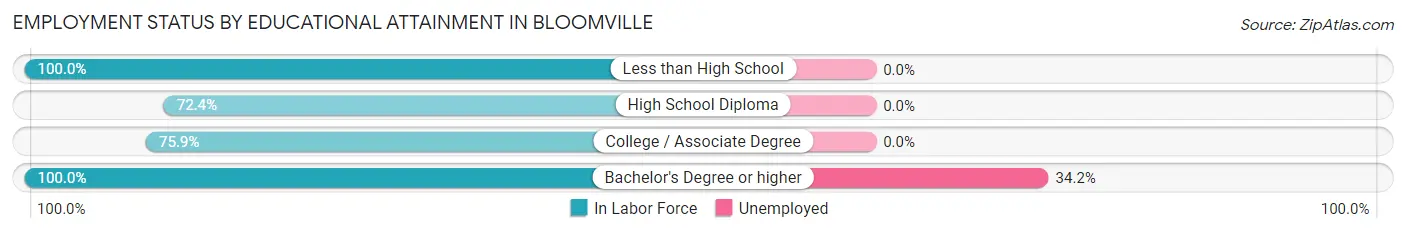
| Educational Attainment | In Labor Force | Unemployed |
| Less than High School | 28 (100.0%) | 0 (0.0%) |
| High School Diploma | 21 (72.4%) | 0 (0.0%) |
| College / Associate Degree | 44 (75.9%) | 0 (0.0%) |
| Bachelor's Degree or higher | 79 (100.0%) | 27 (34.2%) |
| Total | 172 (88.7%) | 30 (15.7%) |
Employment Occupations by Sex in Bloomville
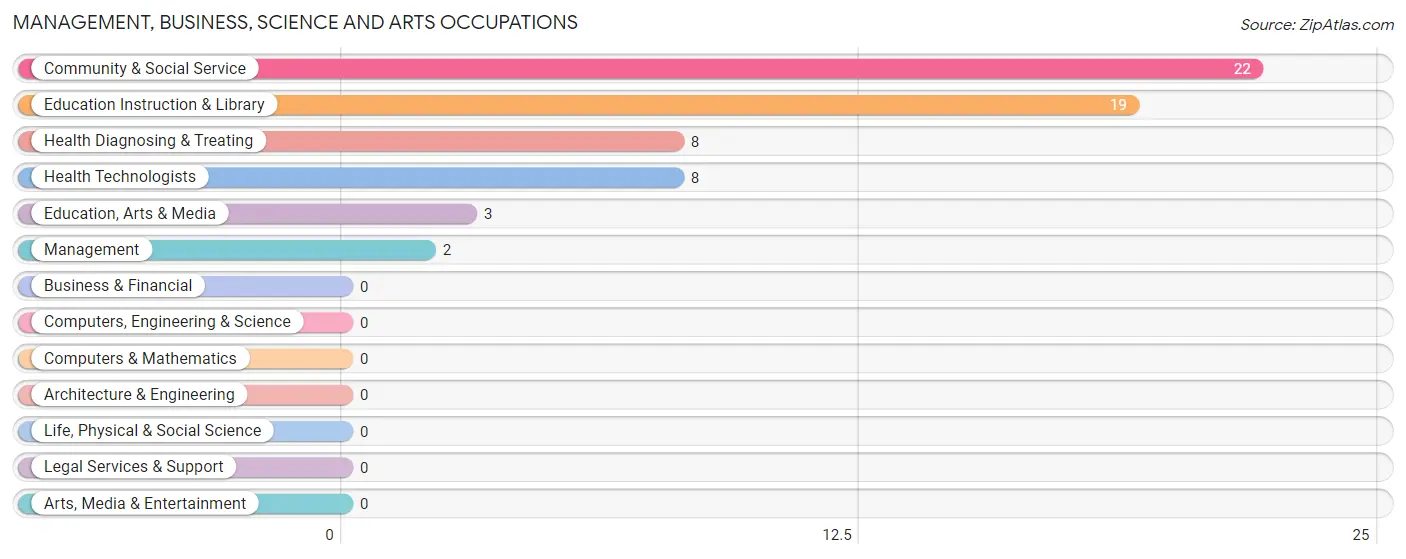
Management, Business, Science and Arts Occupations
The most common Management, Business, Science and Arts occupations in Bloomville are Community & Social Service (22 | 11.5%), Education Instruction & Library (19 | 9.9%), Health Diagnosing & Treating (8 | 4.2%), Health Technologists (8 | 4.2%), and Education, Arts & Media (3 | 1.6%).
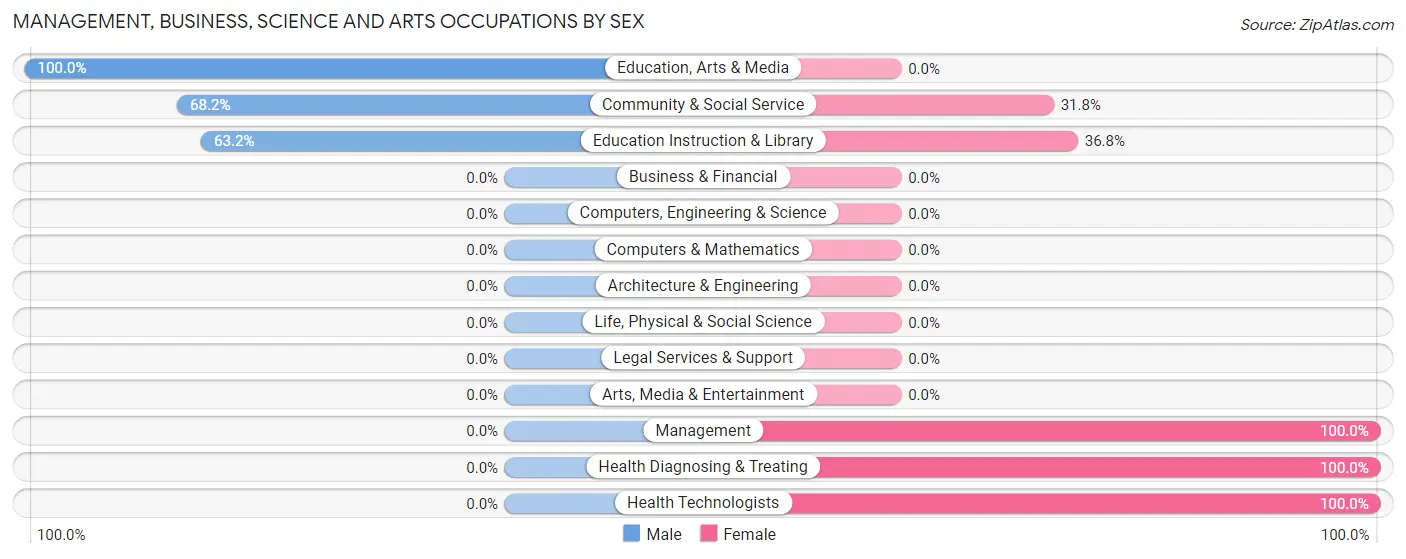
Management, Business, Science and Arts Occupations by Sex
Within the Management, Business, Science and Arts occupations in Bloomville, the most male-oriented occupations are Education, Arts & Media (100.0%), Community & Social Service (68.2%), and Education Instruction & Library (63.2%), while the most female-oriented occupations are Management (100.0%), Health Diagnosing & Treating (100.0%), and Health Technologists (100.0%).
| Occupation | Male | Female |
| Management | 0 (0.0%) | 2 (100.0%) |
| Business & Financial | 0 (0.0%) | 0 (0.0%) |
| Computers, Engineering & Science | 0 (0.0%) | 0 (0.0%) |
| Computers & Mathematics | 0 (0.0%) | 0 (0.0%) |
| Architecture & Engineering | 0 (0.0%) | 0 (0.0%) |
| Life, Physical & Social Science | 0 (0.0%) | 0 (0.0%) |
| Community & Social Service | 15 (68.2%) | 7 (31.8%) |
| Education, Arts & Media | 3 (100.0%) | 0 (0.0%) |
| Legal Services & Support | 0 (0.0%) | 0 (0.0%) |
| Education Instruction & Library | 12 (63.2%) | 7 (36.8%) |
| Arts, Media & Entertainment | 0 (0.0%) | 0 (0.0%) |
| Health Diagnosing & Treating | 0 (0.0%) | 8 (100.0%) |
| Health Technologists | 0 (0.0%) | 8 (100.0%) |
| Total (Category) | 15 (46.9%) | 17 (53.1%) |
| Total (Overall) | 98 (51.0%) | 94 (49.0%) |
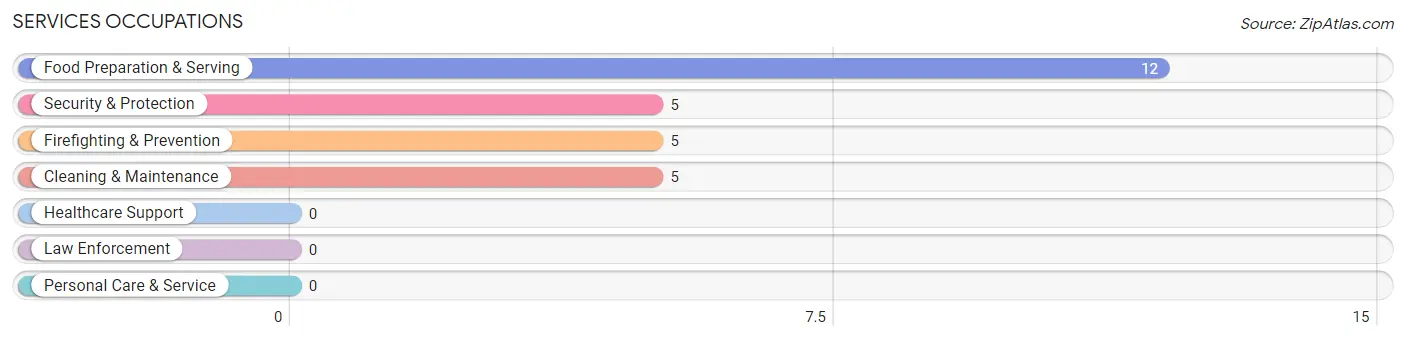
Services Occupations
The most common Services occupations in Bloomville are Food Preparation & Serving (12 | 6.2%), Security & Protection (5 | 2.6%), Firefighting & Prevention (5 | 2.6%), and Cleaning & Maintenance (5 | 2.6%).
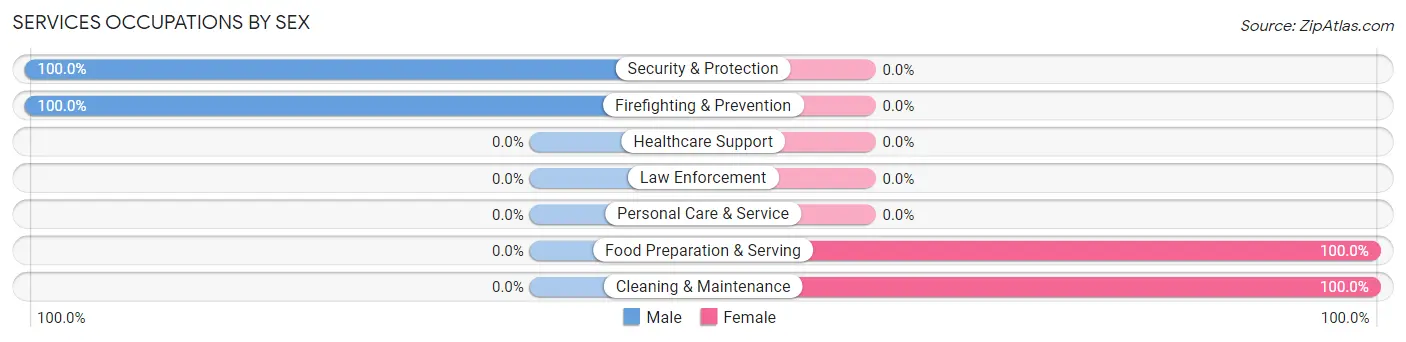
Services Occupations by Sex
Within the Services occupations in Bloomville, the most male-oriented occupations are Security & Protection (100.0%), and Firefighting & Prevention (100.0%), while the most female-oriented occupations are Food Preparation & Serving (100.0%), and Cleaning & Maintenance (100.0%).
| Occupation | Male | Female |
| Healthcare Support | 0 (0.0%) | 0 (0.0%) |
| Security & Protection | 5 (100.0%) | 0 (0.0%) |
| Firefighting & Prevention | 5 (100.0%) | 0 (0.0%) |
| Law Enforcement | 0 (0.0%) | 0 (0.0%) |
| Food Preparation & Serving | 0 (0.0%) | 12 (100.0%) |
| Cleaning & Maintenance | 0 (0.0%) | 5 (100.0%) |
| Personal Care & Service | 0 (0.0%) | 0 (0.0%) |
| Total (Category) | 5 (22.7%) | 17 (77.3%) |
| Total (Overall) | 98 (51.0%) | 94 (49.0%) |
Sales and Office Occupations
The most common Sales and Office occupations in Bloomville are Sales & Related (36 | 18.8%), and Office & Administration (24 | 12.5%).

Sales and Office Occupations by Sex
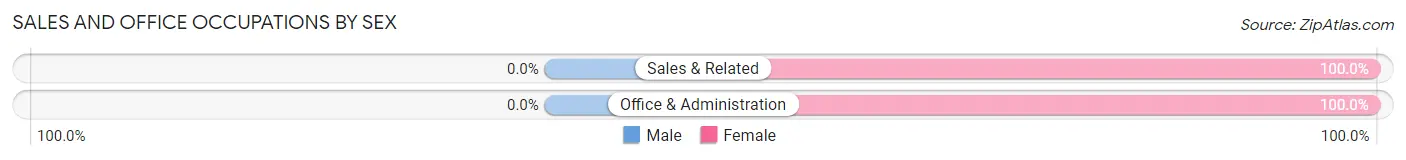
| Occupation | Male | Female |
| Sales & Related | 0 (0.0%) | 36 (100.0%) |
| Office & Administration | 0 (0.0%) | 24 (100.0%) |
| Total (Category) | 0 (0.0%) | 60 (100.0%) |
| Total (Overall) | 98 (51.0%) | 94 (49.0%) |
Natural Resources, Construction and Maintenance Occupations
The most common Natural Resources, Construction and Maintenance occupations in Bloomville are Construction & Extraction (18 | 9.4%), and Farming, Fishing & Forestry (10 | 5.2%).
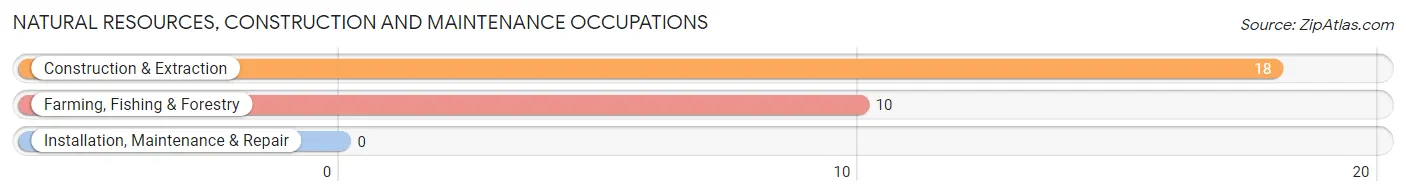
Natural Resources, Construction and Maintenance Occupations by Sex

| Occupation | Male | Female |
| Farming, Fishing & Forestry | 10 (100.0%) | 0 (0.0%) |
| Construction & Extraction | 18 (100.0%) | 0 (0.0%) |
| Installation, Maintenance & Repair | 0 (0.0%) | 0 (0.0%) |
| Total (Category) | 28 (100.0%) | 0 (0.0%) |
| Total (Overall) | 98 (51.0%) | 94 (49.0%) |
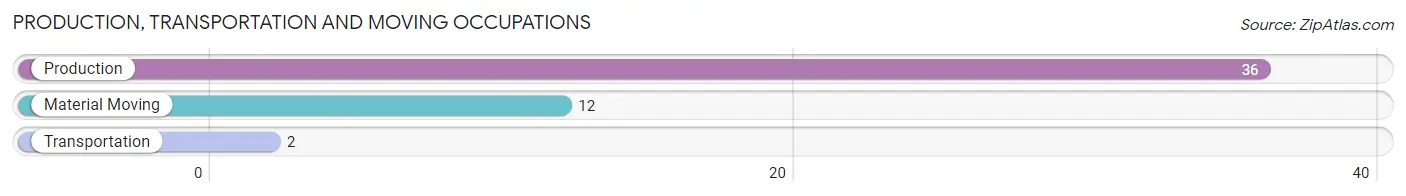
Production, Transportation and Moving Occupations
The most common Production, Transportation and Moving occupations in Bloomville are Production (36 | 18.8%), Material Moving (12 | 6.2%), and Transportation (2 | 1.0%).
Production, Transportation and Moving Occupations by Sex
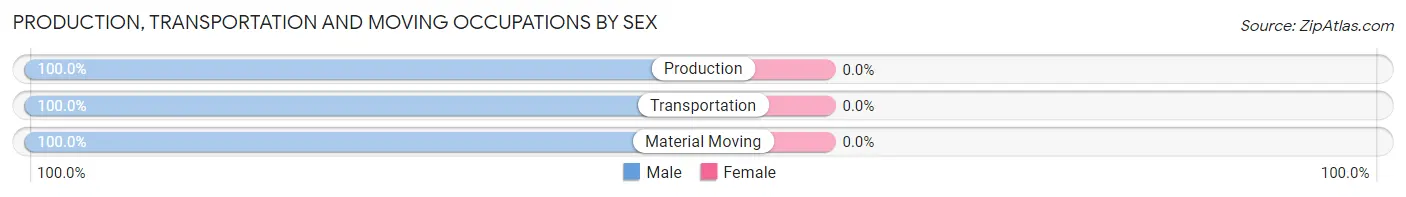
| Occupation | Male | Female |
| Production | 36 (100.0%) | 0 (0.0%) |
| Transportation | 2 (100.0%) | 0 (0.0%) |
| Material Moving | 12 (100.0%) | 0 (0.0%) |
| Total (Category) | 50 (100.0%) | 0 (0.0%) |
| Total (Overall) | 98 (51.0%) | 94 (49.0%) |
Employment Industries by Sex in Bloomville
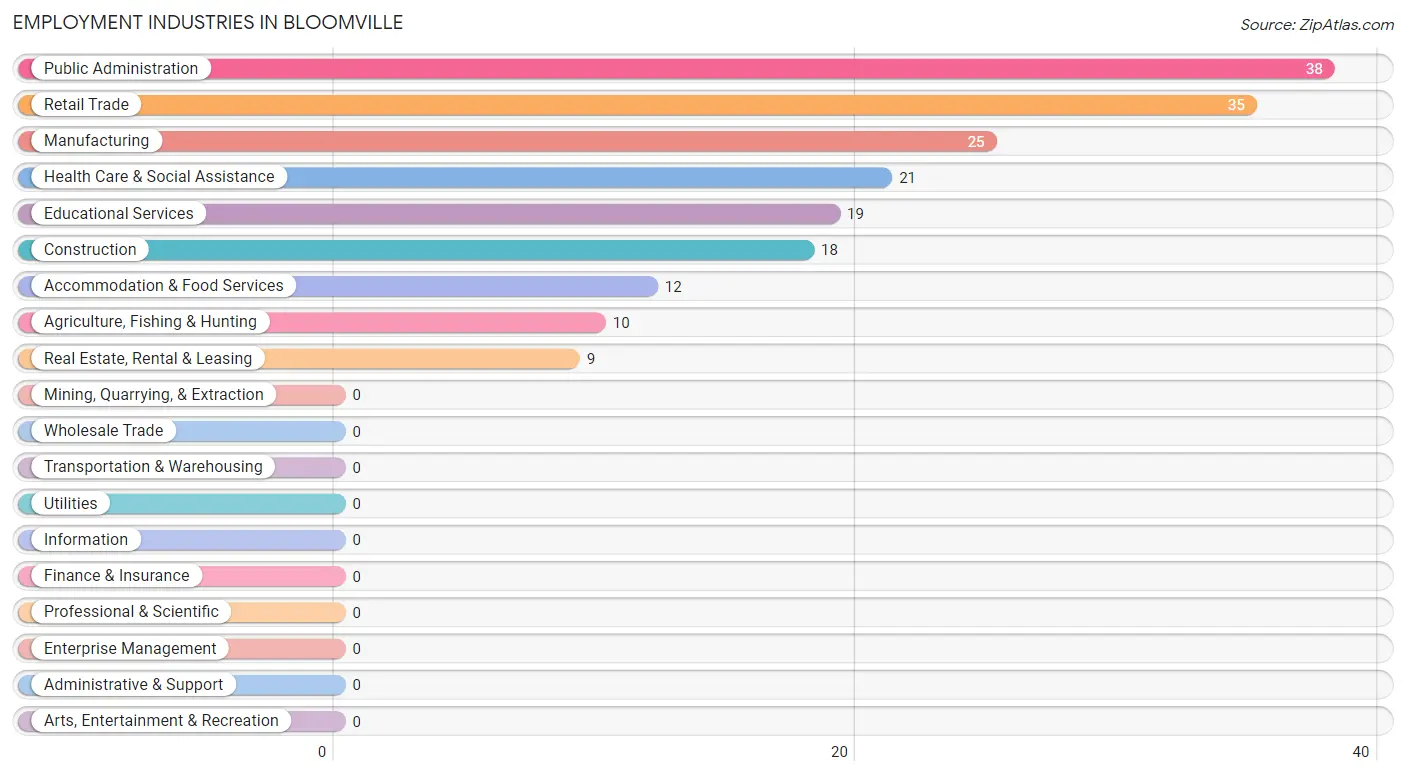
Employment Industries in Bloomville
The major employment industries in Bloomville include Public Administration (38 | 19.8%), Retail Trade (35 | 18.2%), Manufacturing (25 | 13.0%), Health Care & Social Assistance (21 | 10.9%), and Educational Services (19 | 9.9%).
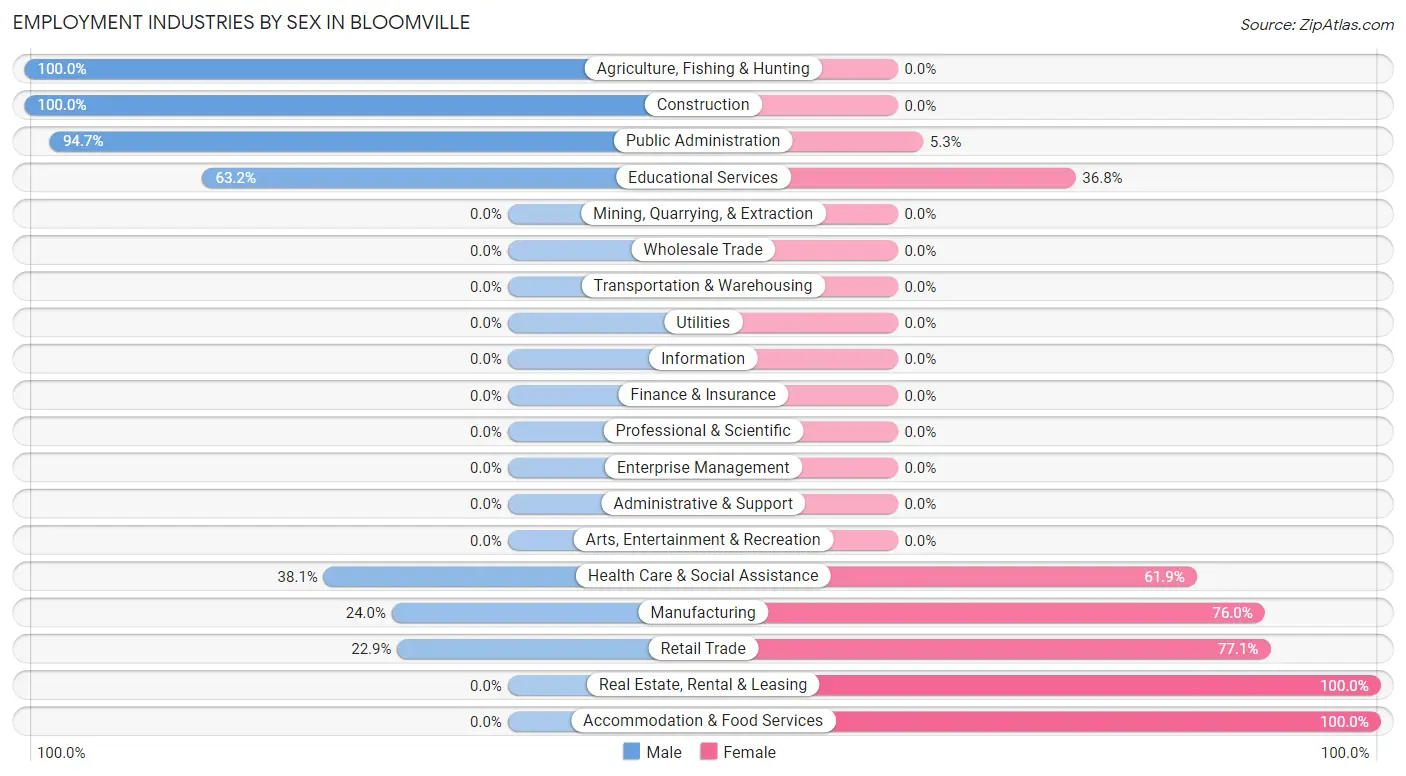
Employment Industries by Sex in Bloomville
The Bloomville industries that see more men than women are Agriculture, Fishing & Hunting (100.0%), Construction (100.0%), and Public Administration (94.7%), whereas the industries that tend to have a higher number of women are Real Estate, Rental & Leasing (100.0%), Accommodation & Food Services (100.0%), and Retail Trade (77.1%).
| Industry | Male | Female |
| Agriculture, Fishing & Hunting | 10 (100.0%) | 0 (0.0%) |
| Mining, Quarrying, & Extraction | 0 (0.0%) | 0 (0.0%) |
| Construction | 18 (100.0%) | 0 (0.0%) |
| Manufacturing | 6 (24.0%) | 19 (76.0%) |
| Wholesale Trade | 0 (0.0%) | 0 (0.0%) |
| Retail Trade | 8 (22.9%) | 27 (77.1%) |
| Transportation & Warehousing | 0 (0.0%) | 0 (0.0%) |
| Utilities | 0 (0.0%) | 0 (0.0%) |
| Information | 0 (0.0%) | 0 (0.0%) |
| Finance & Insurance | 0 (0.0%) | 0 (0.0%) |
| Real Estate, Rental & Leasing | 0 (0.0%) | 9 (100.0%) |
| Professional & Scientific | 0 (0.0%) | 0 (0.0%) |
| Enterprise Management | 0 (0.0%) | 0 (0.0%) |
| Administrative & Support | 0 (0.0%) | 0 (0.0%) |
| Educational Services | 12 (63.2%) | 7 (36.8%) |
| Health Care & Social Assistance | 8 (38.1%) | 13 (61.9%) |
| Arts, Entertainment & Recreation | 0 (0.0%) | 0 (0.0%) |
| Accommodation & Food Services | 0 (0.0%) | 12 (100.0%) |
| Public Administration | 36 (94.7%) | 2 (5.3%) |
| Total | 98 (51.0%) | 94 (49.0%) |
Education in Bloomville
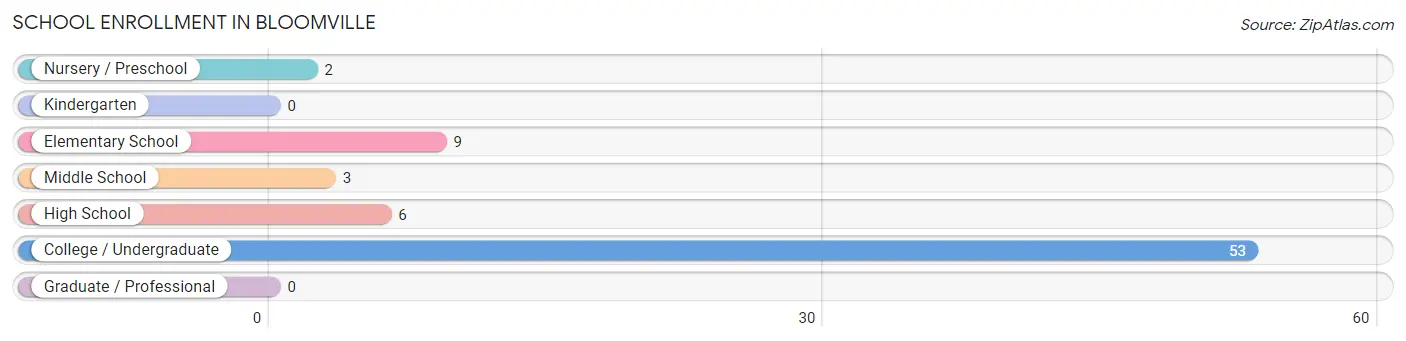
School Enrollment in Bloomville
The most common levels of schooling among the 73 students in Bloomville are college / undergraduate (53 | 72.6%), elementary school (9 | 12.3%), and high school (6 | 8.2%).
| School Level | # Students | % Students |
| Nursery / Preschool | 2 | 2.7% |
| Kindergarten | 0 | 0.0% |
| Elementary School | 9 | 12.3% |
| Middle School | 3 | 4.1% |
| High School | 6 | 8.2% |
| College / Undergraduate | 53 | 72.6% |
| Graduate / Professional | 0 | 0.0% |
| Total | 73 | 100.0% |
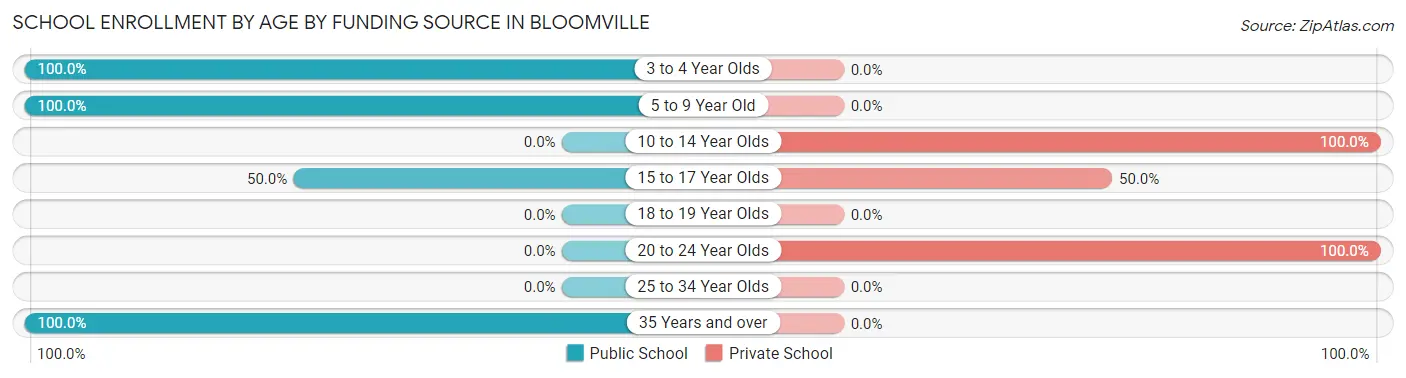
School Enrollment by Age by Funding Source in Bloomville
Out of a total of 73 students who are enrolled in schools in Bloomville, 42 (57.5%) attend a private institution, while the remaining 31 (42.5%) are enrolled in public schools. The age group of 10 to 14 year olds has the highest likelihood of being enrolled in private schools, with 3 (100.0% in the age bracket) enrolled. Conversely, the age group of 3 to 4 year olds has the lowest likelihood of being enrolled in a private school, with 2 (100.0% in the age bracket) attending a public institution.
| Age Bracket | Public School | Private School |
| 3 to 4 Year Olds | 2 (100.0%) | 0 (0.0%) |
| 5 to 9 Year Old | 9 (100.0%) | 0 (0.0%) |
| 10 to 14 Year Olds | 0 (0.0%) | 3 (100.0%) |
| 15 to 17 Year Olds | 3 (50.0%) | 3 (50.0%) |
| 18 to 19 Year Olds | 0 (0.0%) | 0 (0.0%) |
| 20 to 24 Year Olds | 0 (0.0%) | 36 (100.0%) |
| 25 to 34 Year Olds | 0 (0.0%) | 0 (0.0%) |
| 35 Years and over | 17 (100.0%) | 0 (0.0%) |
| Total | 31 (42.5%) | 42 (57.5%) |
Educational Attainment by Field of Study in Bloomville
Education (29 | 32.2%), computers & mathematics (27 | 30.0%), arts & humanities (12 | 13.3%), psychology (11 | 12.2%), and business (9 | 10.0%) are the most common fields of study among 90 individuals in Bloomville who have obtained a bachelor's degree or higher.
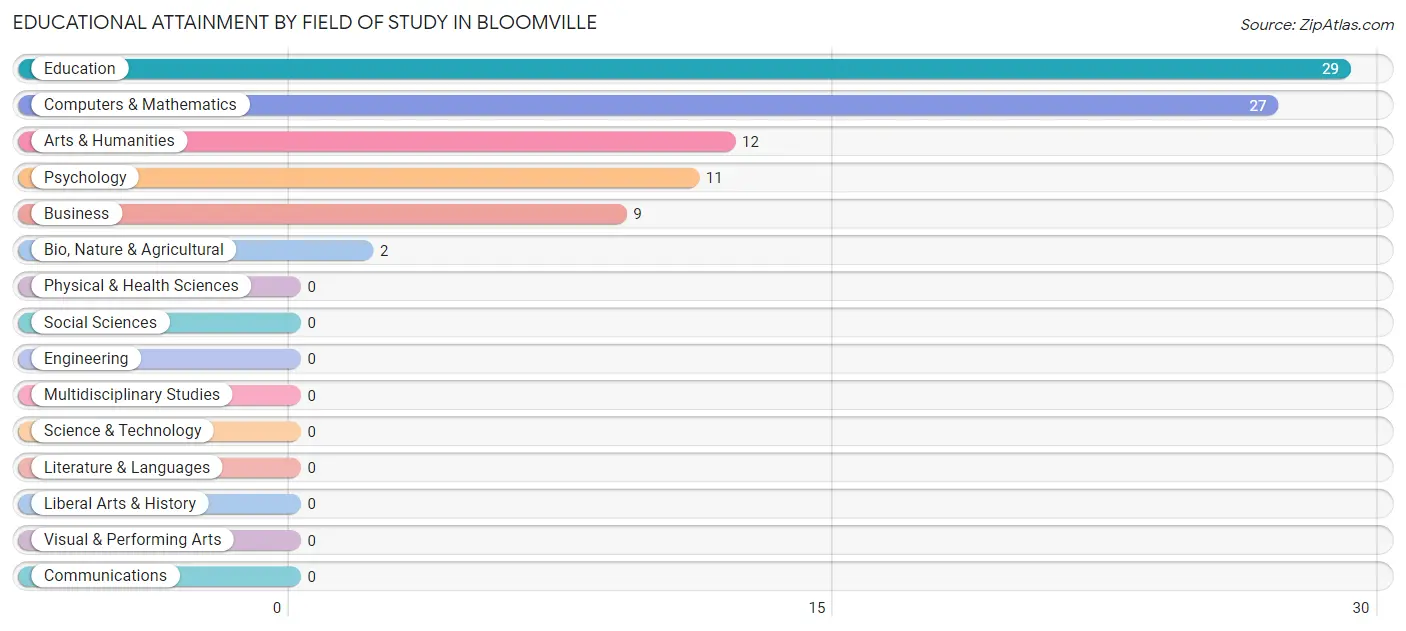
| Field of Study | # Graduates | % Graduates |
| Computers & Mathematics | 27 | 30.0% |
| Bio, Nature & Agricultural | 2 | 2.2% |
| Physical & Health Sciences | 0 | 0.0% |
| Psychology | 11 | 12.2% |
| Social Sciences | 0 | 0.0% |
| Engineering | 0 | 0.0% |
| Multidisciplinary Studies | 0 | 0.0% |
| Science & Technology | 0 | 0.0% |
| Business | 9 | 10.0% |
| Education | 29 | 32.2% |
| Literature & Languages | 0 | 0.0% |
| Liberal Arts & History | 0 | 0.0% |
| Visual & Performing Arts | 0 | 0.0% |
| Communications | 0 | 0.0% |
| Arts & Humanities | 12 | 13.3% |
| Total | 90 | 100.0% |
Transportation & Commute in Bloomville
Vehicle Availability by Sex in Bloomville
The most prevalent vehicle ownership categories in Bloomville are males with 3 vehicles (75, accounting for 76.5%) and females with 3 vehicles (17, making up 79.8%).
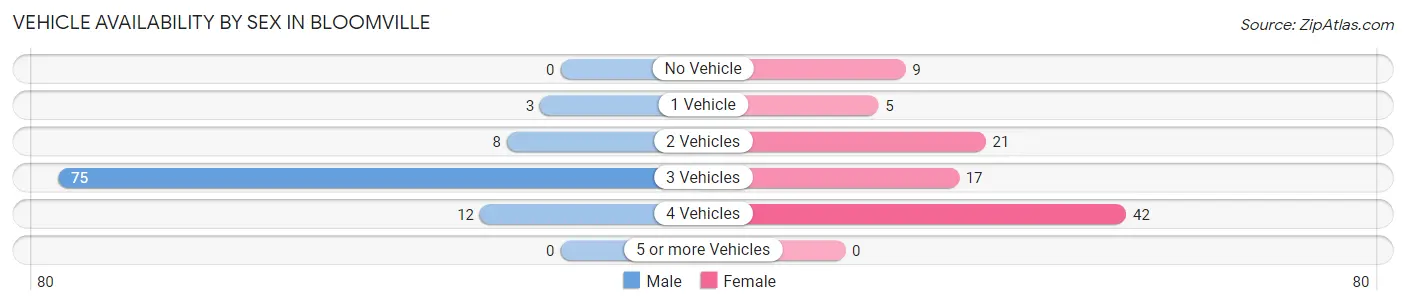
| Vehicles Available | Male | Female |
| No Vehicle | 0 (0.0%) | 9 (9.6%) |
| 1 Vehicle | 3 (3.1%) | 5 (5.3%) |
| 2 Vehicles | 8 (8.2%) | 21 (22.3%) |
| 3 Vehicles | 75 (76.5%) | 17 (18.1%) |
| 4 Vehicles | 12 (12.2%) | 42 (44.7%) |
| 5 or more Vehicles | 0 (0.0%) | 0 (0.0%) |
| Total | 98 (100.0%) | 94 (100.0%) |
Commute Time in Bloomville
The most frequently occuring commute durations in Bloomville are 30 to 34 minutes (61 commuters, 31.8%), 15 to 19 minutes (43 commuters, 22.4%), and 20 to 24 minutes (31 commuters, 16.2%).
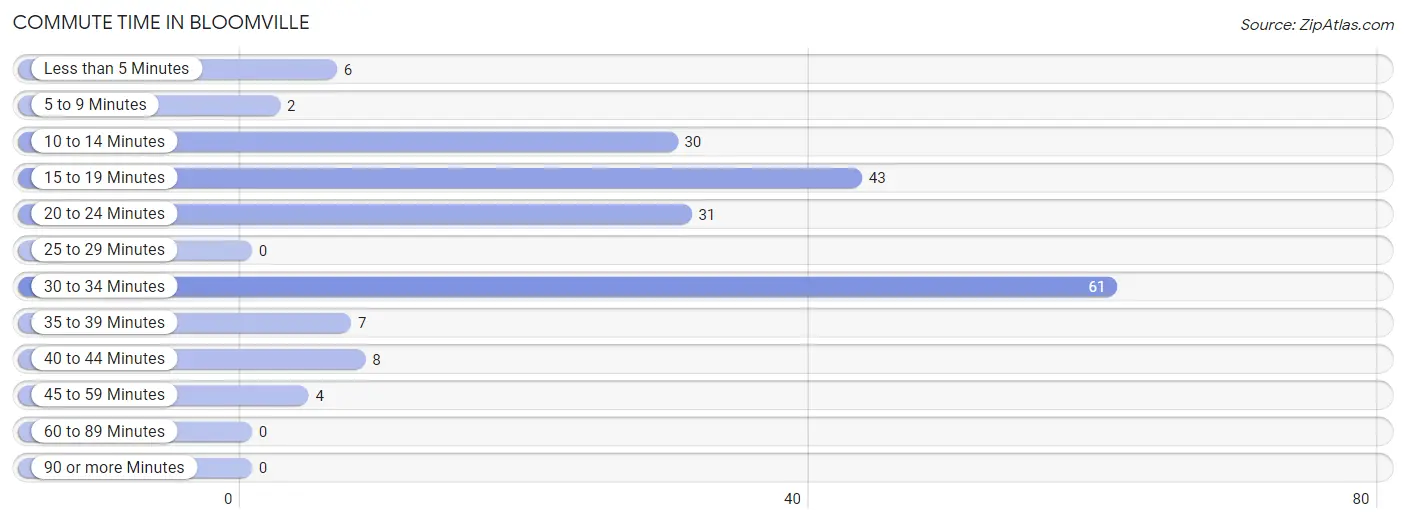
| Commute Time | # Commuters | % Commuters |
| Less than 5 Minutes | 6 | 3.1% |
| 5 to 9 Minutes | 2 | 1.0% |
| 10 to 14 Minutes | 30 | 15.6% |
| 15 to 19 Minutes | 43 | 22.4% |
| 20 to 24 Minutes | 31 | 16.2% |
| 25 to 29 Minutes | 0 | 0.0% |
| 30 to 34 Minutes | 61 | 31.8% |
| 35 to 39 Minutes | 7 | 3.6% |
| 40 to 44 Minutes | 8 | 4.2% |
| 45 to 59 Minutes | 4 | 2.1% |
| 60 to 89 Minutes | 0 | 0.0% |
| 90 or more Minutes | 0 | 0.0% |
Commute Time by Sex in Bloomville
The most common commute times in Bloomville are 30 to 34 minutes (61 commuters, 62.2%) for males and 15 to 19 minutes (32 commuters, 34.0%) for females.
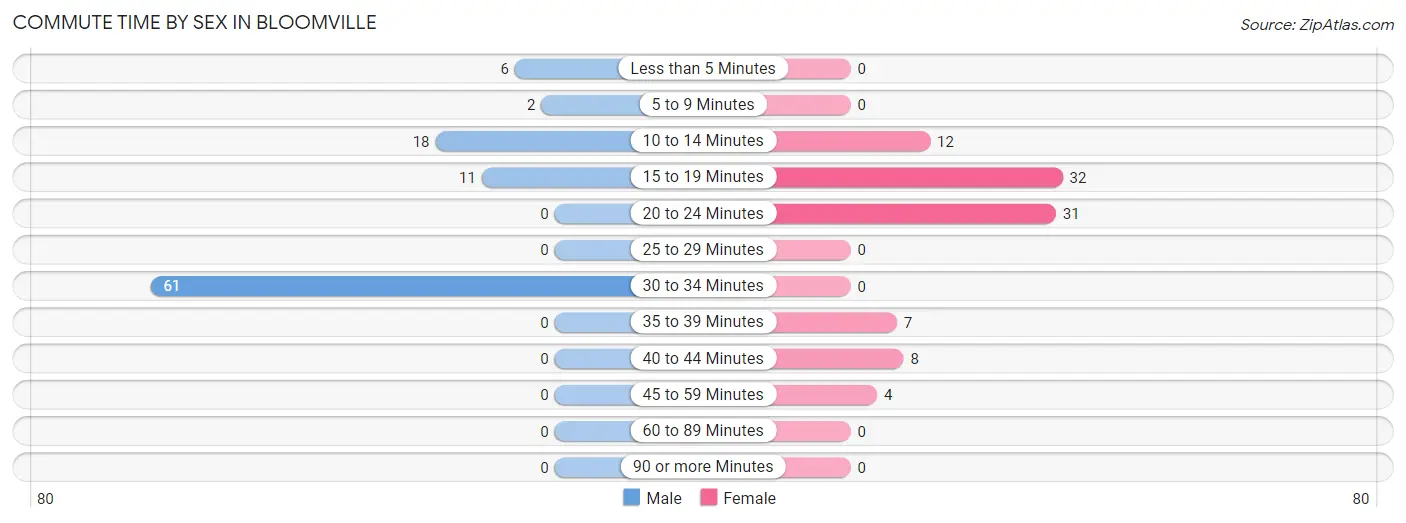
| Commute Time | Male | Female |
| Less than 5 Minutes | 6 (6.1%) | 0 (0.0%) |
| 5 to 9 Minutes | 2 (2.0%) | 0 (0.0%) |
| 10 to 14 Minutes | 18 (18.4%) | 12 (12.8%) |
| 15 to 19 Minutes | 11 (11.2%) | 32 (34.0%) |
| 20 to 24 Minutes | 0 (0.0%) | 31 (33.0%) |
| 25 to 29 Minutes | 0 (0.0%) | 0 (0.0%) |
| 30 to 34 Minutes | 61 (62.2%) | 0 (0.0%) |
| 35 to 39 Minutes | 0 (0.0%) | 7 (7.4%) |
| 40 to 44 Minutes | 0 (0.0%) | 8 (8.5%) |
| 45 to 59 Minutes | 0 (0.0%) | 4 (4.3%) |
| 60 to 89 Minutes | 0 (0.0%) | 0 (0.0%) |
| 90 or more Minutes | 0 (0.0%) | 0 (0.0%) |
Time of Departure to Work by Sex in Bloomville
The most frequent times of departure to work in Bloomville are 6:30 AM to 6:59 AM (38, 38.8%) for males and 5:00 AM to 5:29 AM (31, 33.0%) for females.
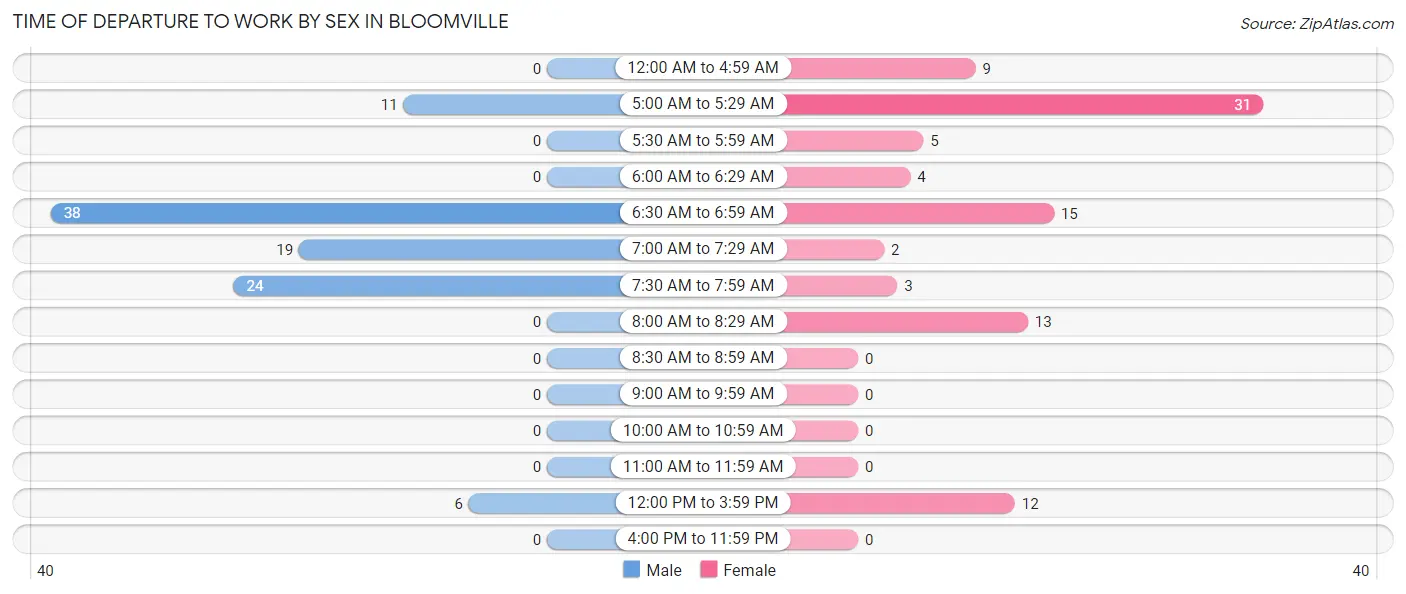
| Time of Departure | Male | Female |
| 12:00 AM to 4:59 AM | 0 (0.0%) | 9 (9.6%) |
| 5:00 AM to 5:29 AM | 11 (11.2%) | 31 (33.0%) |
| 5:30 AM to 5:59 AM | 0 (0.0%) | 5 (5.3%) |
| 6:00 AM to 6:29 AM | 0 (0.0%) | 4 (4.3%) |
| 6:30 AM to 6:59 AM | 38 (38.8%) | 15 (16.0%) |
| 7:00 AM to 7:29 AM | 19 (19.4%) | 2 (2.1%) |
| 7:30 AM to 7:59 AM | 24 (24.5%) | 3 (3.2%) |
| 8:00 AM to 8:29 AM | 0 (0.0%) | 13 (13.8%) |
| 8:30 AM to 8:59 AM | 0 (0.0%) | 0 (0.0%) |
| 9:00 AM to 9:59 AM | 0 (0.0%) | 0 (0.0%) |
| 10:00 AM to 10:59 AM | 0 (0.0%) | 0 (0.0%) |
| 11:00 AM to 11:59 AM | 0 (0.0%) | 0 (0.0%) |
| 12:00 PM to 3:59 PM | 6 (6.1%) | 12 (12.8%) |
| 4:00 PM to 11:59 PM | 0 (0.0%) | 0 (0.0%) |
| Total | 98 (100.0%) | 94 (100.0%) |
Housing Occupancy in Bloomville
Occupancy by Ownership in Bloomville
Of the total 91 dwellings in Bloomville, owner-occupied units account for 63 (69.2%), while renter-occupied units make up 28 (30.8%).
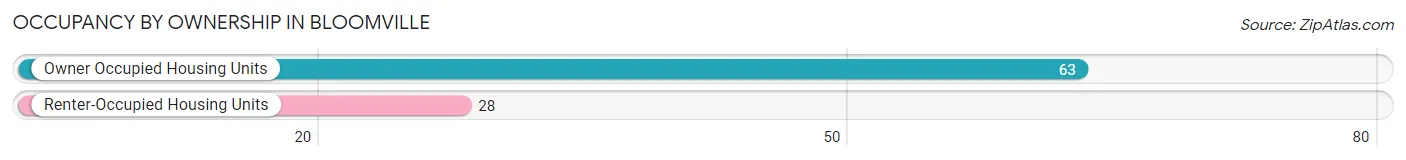
| Occupancy | # Housing Units | % Housing Units |
| Owner Occupied Housing Units | 63 | 69.2% |
| Renter-Occupied Housing Units | 28 | 30.8% |
| Total Occupied Housing Units | 91 | 100.0% |
Occupancy by Household Size in Bloomville
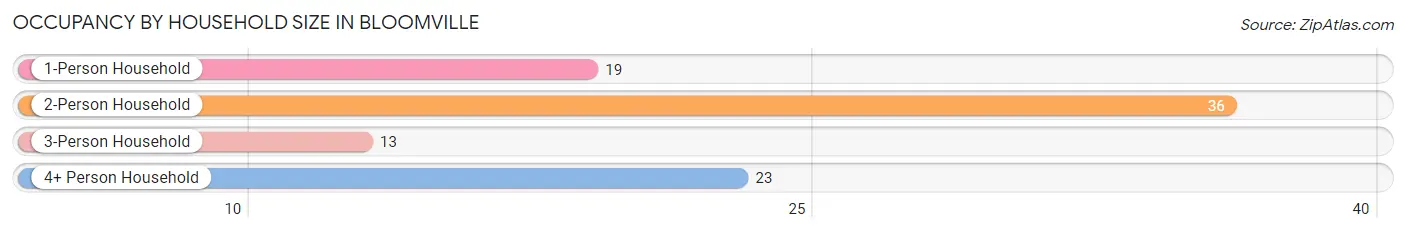
| Household Size | # Housing Units | % Housing Units |
| 1-Person Household | 19 | 20.9% |
| 2-Person Household | 36 | 39.6% |
| 3-Person Household | 13 | 14.3% |
| 4+ Person Household | 23 | 25.3% |
| Total Housing Units | 91 | 100.0% |
Occupancy by Ownership by Household Size in Bloomville
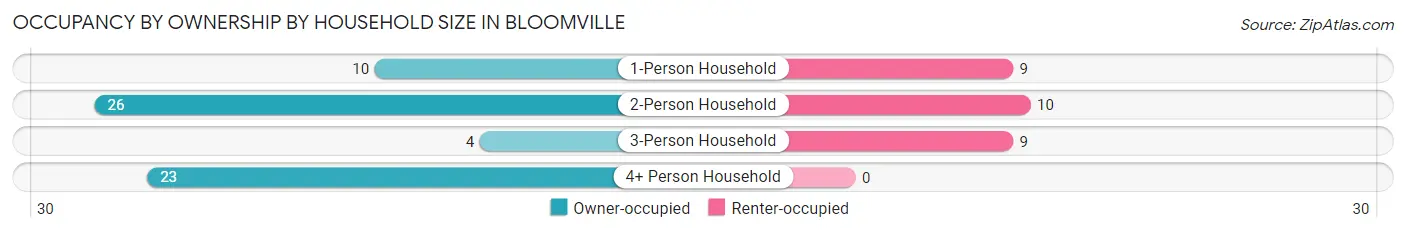
| Household Size | Owner-occupied | Renter-occupied |
| 1-Person Household | 10 (52.6%) | 9 (47.4%) |
| 2-Person Household | 26 (72.2%) | 10 (27.8%) |
| 3-Person Household | 4 (30.8%) | 9 (69.2%) |
| 4+ Person Household | 23 (100.0%) | 0 (0.0%) |
| Total Housing Units | 63 (69.2%) | 28 (30.8%) |
Occupancy by Educational Attainment in Bloomville
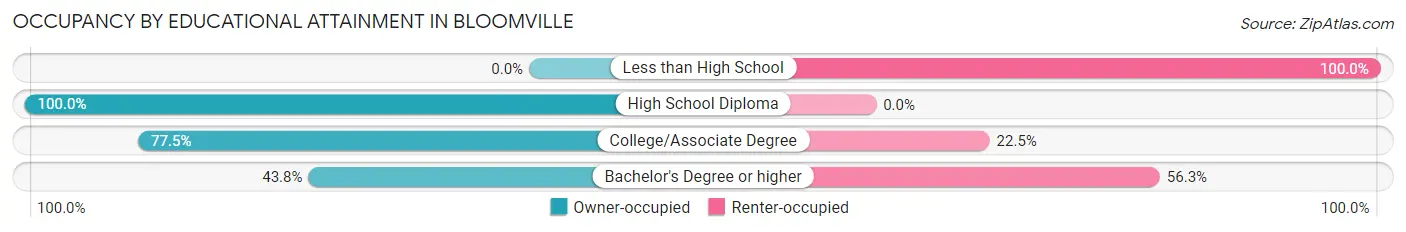
| Household Size | Owner-occupied | Renter-occupied |
| Less than High School | 0 (0.0%) | 10 (100.0%) |
| High School Diploma | 25 (100.0%) | 0 (0.0%) |
| College/Associate Degree | 31 (77.5%) | 9 (22.5%) |
| Bachelor's Degree or higher | 7 (43.8%) | 9 (56.2%) |
Occupancy by Age of Householder in Bloomville
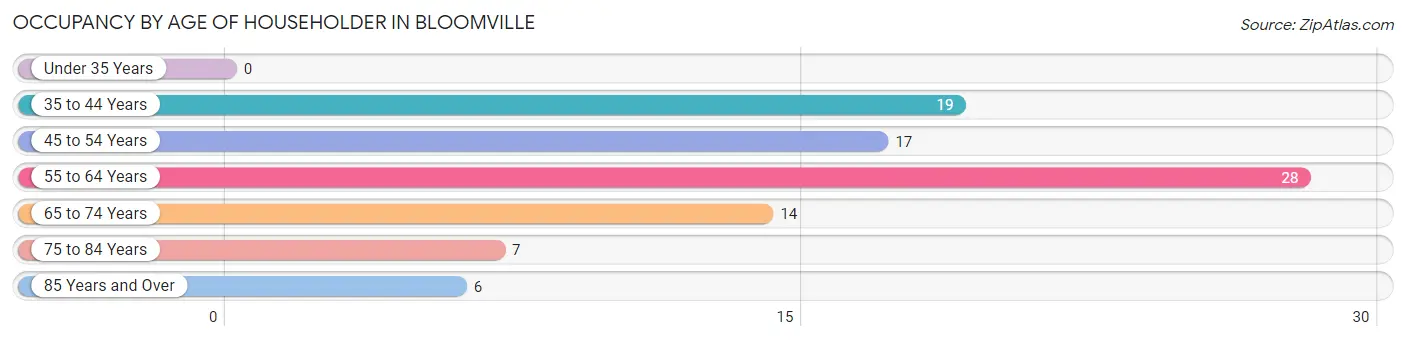
| Age Bracket | # Households | % Households |
| Under 35 Years | 0 | 0.0% |
| 35 to 44 Years | 19 | 20.9% |
| 45 to 54 Years | 17 | 18.7% |
| 55 to 64 Years | 28 | 30.8% |
| 65 to 74 Years | 14 | 15.4% |
| 75 to 84 Years | 7 | 7.7% |
| 85 Years and Over | 6 | 6.6% |
| Total | 91 | 100.0% |
Housing Finances in Bloomville
Median Income by Occupancy in Bloomville
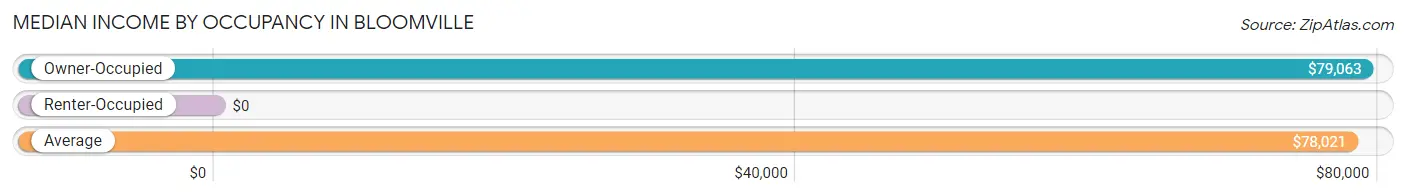
| Occupancy Type | # Households | Median Income |
| Owner-Occupied | 63 (69.2%) | $79,063 |
| Renter-Occupied | 28 (30.8%) | $0 |
| Average | 91 (100.0%) | $78,021 |
Occupancy by Householder Income Bracket in Bloomville
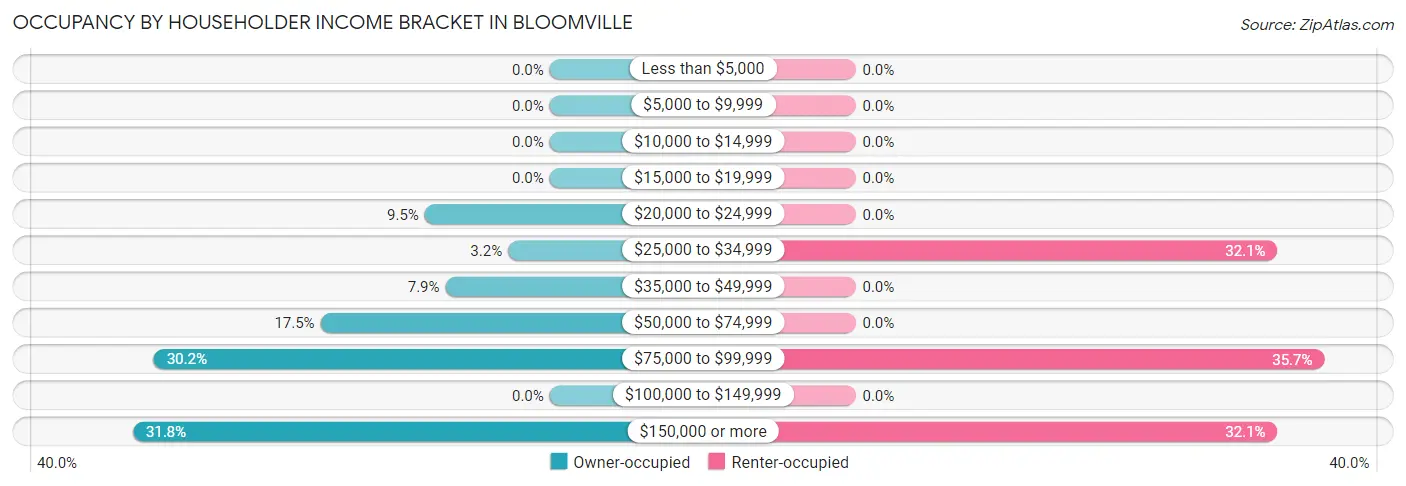
| Income Bracket | Owner-occupied | Renter-occupied |
| Less than $5,000 | 0 (0.0%) | 0 (0.0%) |
| $5,000 to $9,999 | 0 (0.0%) | 0 (0.0%) |
| $10,000 to $14,999 | 0 (0.0%) | 0 (0.0%) |
| $15,000 to $19,999 | 0 (0.0%) | 0 (0.0%) |
| $20,000 to $24,999 | 6 (9.5%) | 0 (0.0%) |
| $25,000 to $34,999 | 2 (3.2%) | 9 (32.1%) |
| $35,000 to $49,999 | 5 (7.9%) | 0 (0.0%) |
| $50,000 to $74,999 | 11 (17.5%) | 0 (0.0%) |
| $75,000 to $99,999 | 19 (30.2%) | 10 (35.7%) |
| $100,000 to $149,999 | 0 (0.0%) | 0 (0.0%) |
| $150,000 or more | 20 (31.8%) | 9 (32.1%) |
| Total | 63 (100.0%) | 28 (100.0%) |
Monthly Housing Cost Tiers in Bloomville
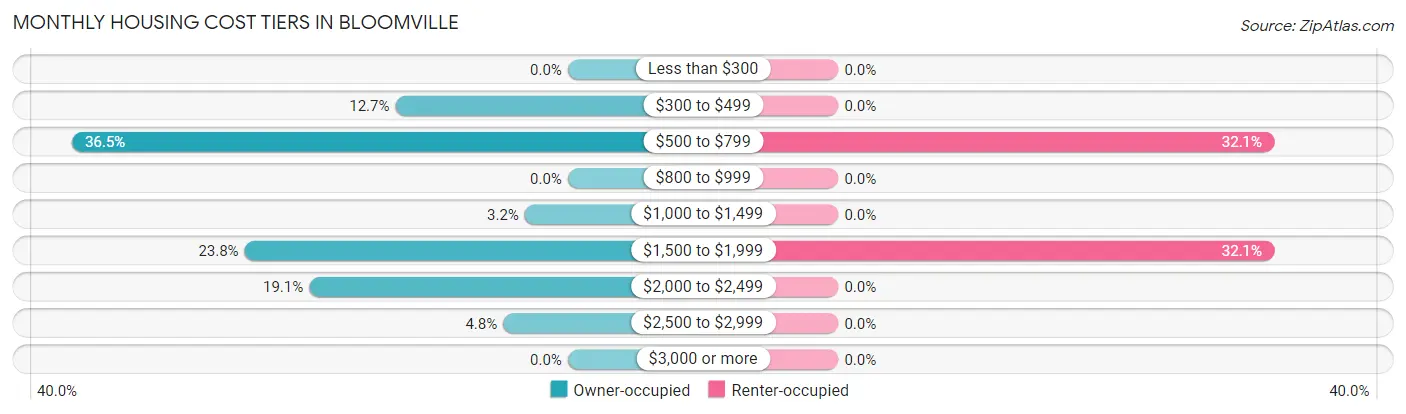
| Monthly Cost | Owner-occupied | Renter-occupied |
| Less than $300 | 0 (0.0%) | 0 (0.0%) |
| $300 to $499 | 8 (12.7%) | 0 (0.0%) |
| $500 to $799 | 23 (36.5%) | 9 (32.1%) |
| $800 to $999 | 0 (0.0%) | 0 (0.0%) |
| $1,000 to $1,499 | 2 (3.2%) | 0 (0.0%) |
| $1,500 to $1,999 | 15 (23.8%) | 9 (32.1%) |
| $2,000 to $2,499 | 12 (19.1%) | 0 (0.0%) |
| $2,500 to $2,999 | 3 (4.8%) | 0 (0.0%) |
| $3,000 or more | 0 (0.0%) | 0 (0.0%) |
| Total | 63 (100.0%) | 28 (100.0%) |
Physical Housing Characteristics in Bloomville
Housing Structures in Bloomville
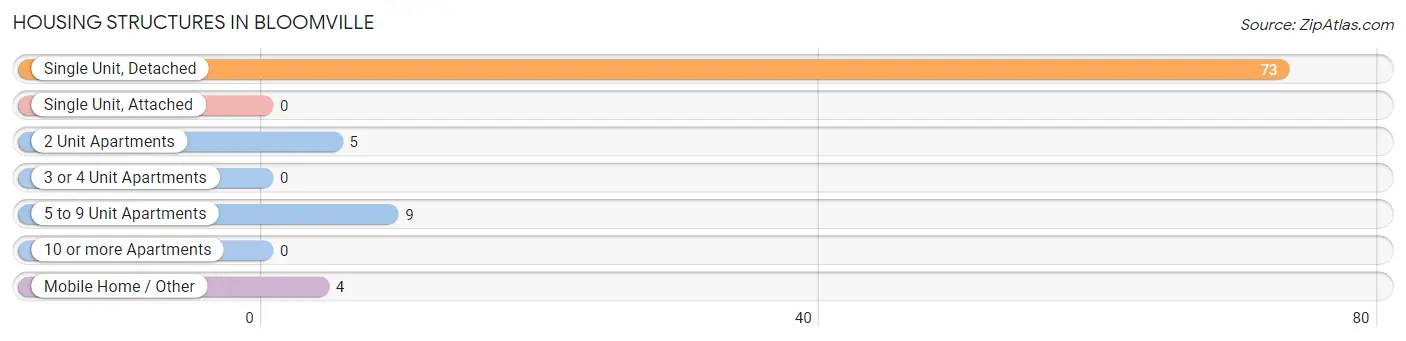
| Structure Type | # Housing Units | % Housing Units |
| Single Unit, Detached | 73 | 80.2% |
| Single Unit, Attached | 0 | 0.0% |
| 2 Unit Apartments | 5 | 5.5% |
| 3 or 4 Unit Apartments | 0 | 0.0% |
| 5 to 9 Unit Apartments | 9 | 9.9% |
| 10 or more Apartments | 0 | 0.0% |
| Mobile Home / Other | 4 | 4.4% |
| Total | 91 | 100.0% |
Housing Structures by Occupancy in Bloomville
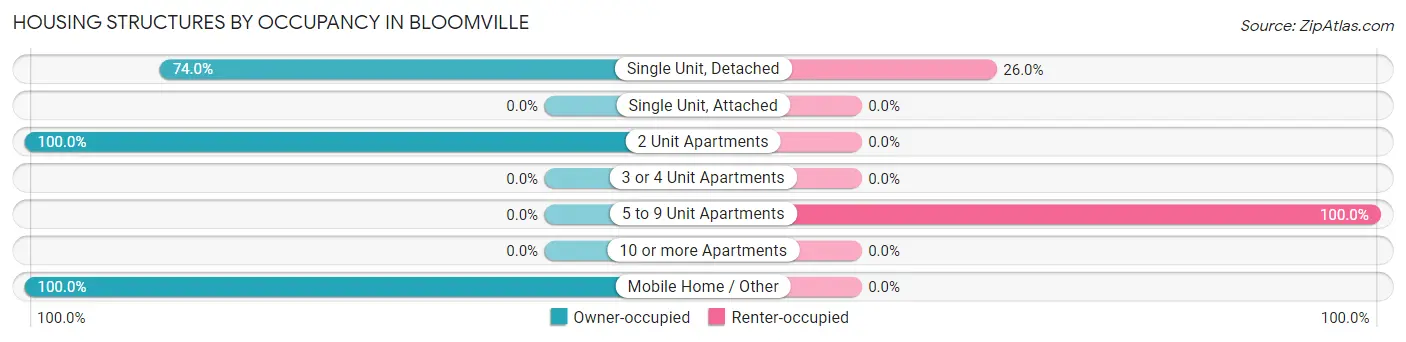
| Structure Type | Owner-occupied | Renter-occupied |
| Single Unit, Detached | 54 (74.0%) | 19 (26.0%) |
| Single Unit, Attached | 0 (0.0%) | 0 (0.0%) |
| 2 Unit Apartments | 5 (100.0%) | 0 (0.0%) |
| 3 or 4 Unit Apartments | 0 (0.0%) | 0 (0.0%) |
| 5 to 9 Unit Apartments | 0 (0.0%) | 9 (100.0%) |
| 10 or more Apartments | 0 (0.0%) | 0 (0.0%) |
| Mobile Home / Other | 4 (100.0%) | 0 (0.0%) |
| Total | 63 (69.2%) | 28 (30.8%) |
Housing Structures by Number of Rooms in Bloomville
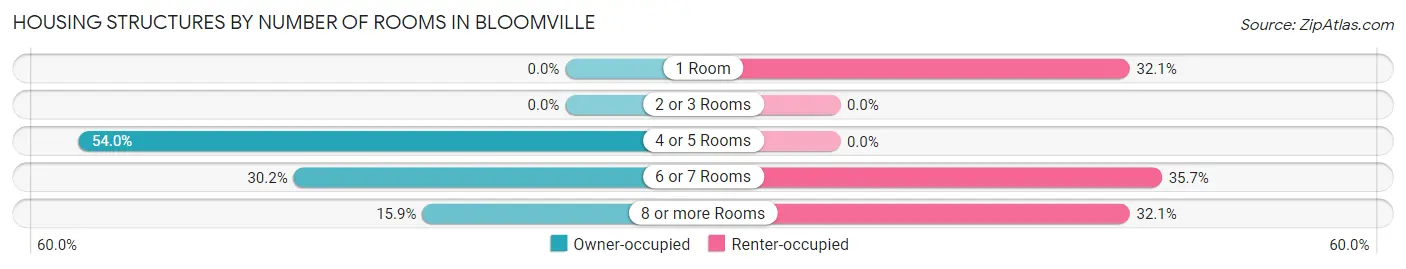
| Number of Rooms | Owner-occupied | Renter-occupied |
| 1 Room | 0 (0.0%) | 9 (32.1%) |
| 2 or 3 Rooms | 0 (0.0%) | 0 (0.0%) |
| 4 or 5 Rooms | 34 (54.0%) | 0 (0.0%) |
| 6 or 7 Rooms | 19 (30.2%) | 10 (35.7%) |
| 8 or more Rooms | 10 (15.9%) | 9 (32.1%) |
| Total | 63 (100.0%) | 28 (100.0%) |
Housing Structure by Heating Type in Bloomville
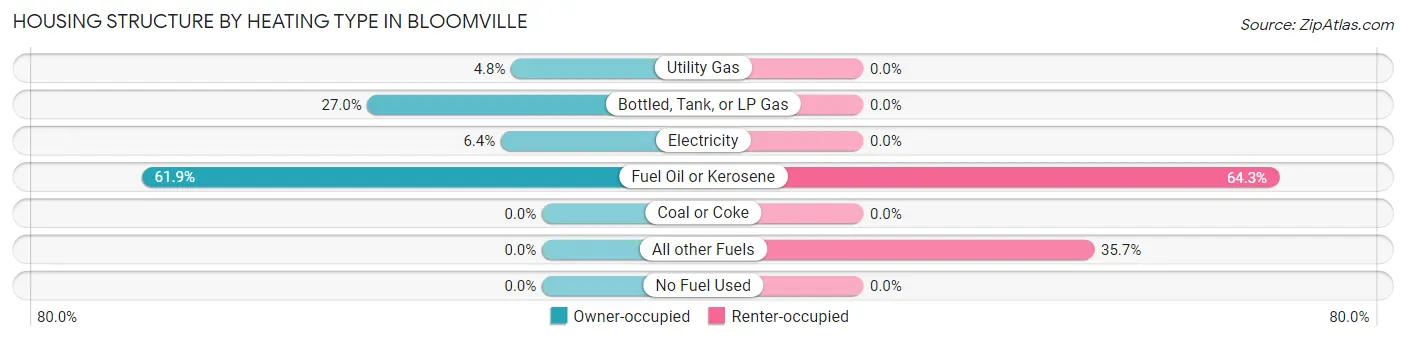
| Heating Type | Owner-occupied | Renter-occupied |
| Utility Gas | 3 (4.8%) | 0 (0.0%) |
| Bottled, Tank, or LP Gas | 17 (27.0%) | 0 (0.0%) |
| Electricity | 4 (6.4%) | 0 (0.0%) |
| Fuel Oil or Kerosene | 39 (61.9%) | 18 (64.3%) |
| Coal or Coke | 0 (0.0%) | 0 (0.0%) |
| All other Fuels | 0 (0.0%) | 10 (35.7%) |
| No Fuel Used | 0 (0.0%) | 0 (0.0%) |
| Total | 63 (100.0%) | 28 (100.0%) |
Household Vehicle Usage in Bloomville
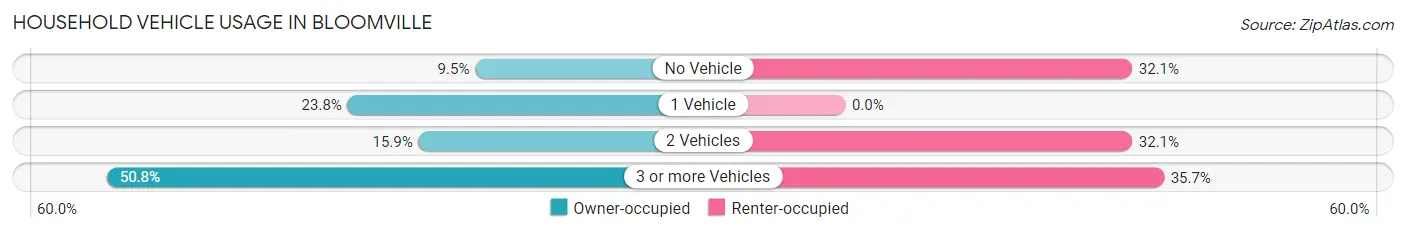
| Vehicles per Household | Owner-occupied | Renter-occupied |
| No Vehicle | 6 (9.5%) | 9 (32.1%) |
| 1 Vehicle | 15 (23.8%) | 0 (0.0%) |
| 2 Vehicles | 10 (15.9%) | 9 (32.1%) |
| 3 or more Vehicles | 32 (50.8%) | 10 (35.7%) |
| Total | 63 (100.0%) | 28 (100.0%) |
Real Estate & Mortgages in Bloomville
Real Estate and Mortgage Overview in Bloomville
| Characteristic | Without Mortgage | With Mortgage |
| Housing Units | 24 | 39 |
| Median Property Value | $98,000 | $0 |
| Median Household Income | $72,813 | $15 |
| Monthly Housing Costs | $625 | $0 |
| Real Estate Taxes | $1,625 | $4 |
Property Value by Mortgage Status in Bloomville
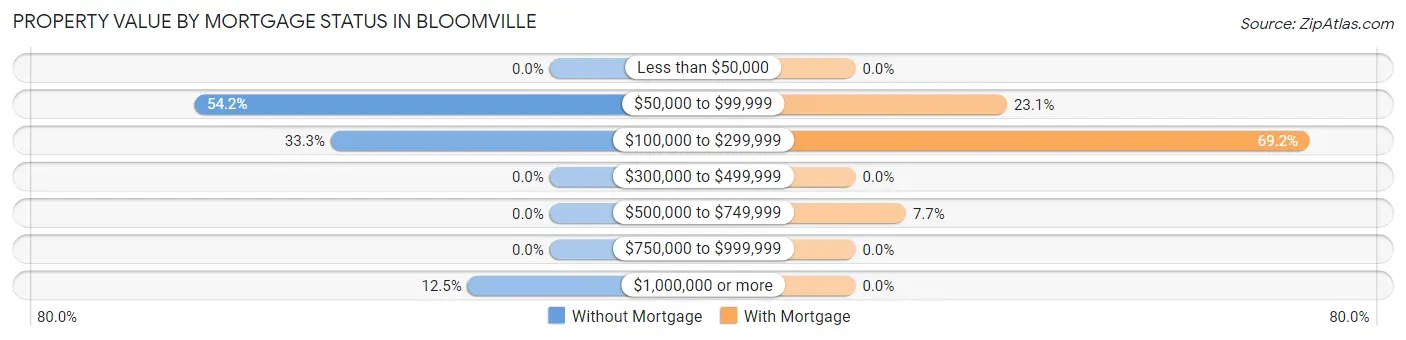
| Property Value | Without Mortgage | With Mortgage |
| Less than $50,000 | 0 (0.0%) | 0 (0.0%) |
| $50,000 to $99,999 | 13 (54.2%) | 9 (23.1%) |
| $100,000 to $299,999 | 8 (33.3%) | 27 (69.2%) |
| $300,000 to $499,999 | 0 (0.0%) | 0 (0.0%) |
| $500,000 to $749,999 | 0 (0.0%) | 3 (7.7%) |
| $750,000 to $999,999 | 0 (0.0%) | 0 (0.0%) |
| $1,000,000 or more | 3 (12.5%) | 0 (0.0%) |
| Total | 24 (100.0%) | 39 (100.0%) |
Household Income by Mortgage Status in Bloomville
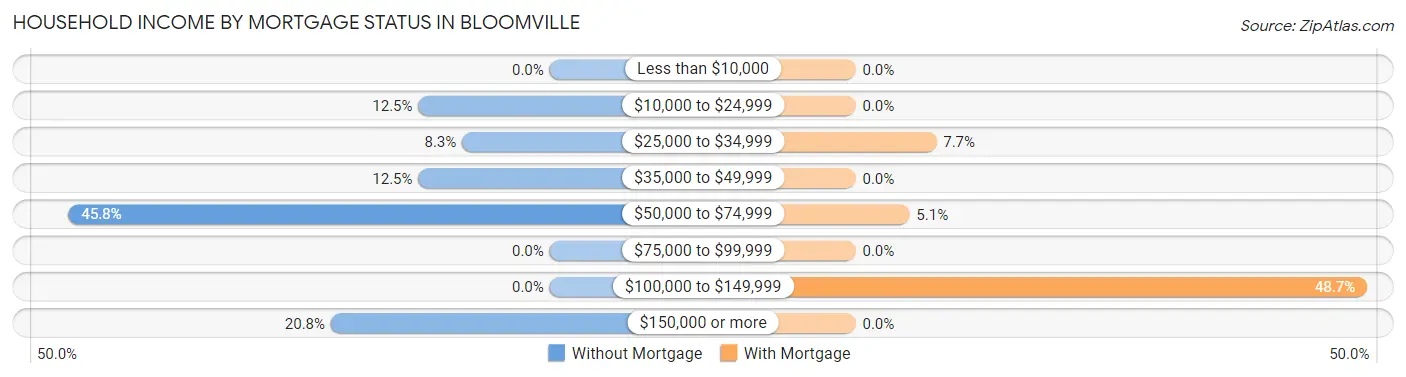
| Household Income | Without Mortgage | With Mortgage |
| Less than $10,000 | 0 (0.0%) | 0 (0.0%) |
| $10,000 to $24,999 | 3 (12.5%) | 0 (0.0%) |
| $25,000 to $34,999 | 2 (8.3%) | 3 (7.7%) |
| $35,000 to $49,999 | 3 (12.5%) | 0 (0.0%) |
| $50,000 to $74,999 | 11 (45.8%) | 2 (5.1%) |
| $75,000 to $99,999 | 0 (0.0%) | 0 (0.0%) |
| $100,000 to $149,999 | 0 (0.0%) | 19 (48.7%) |
| $150,000 or more | 5 (20.8%) | 0 (0.0%) |
| Total | 24 (100.0%) | 39 (100.0%) |
Property Value to Household Income Ratio in Bloomville
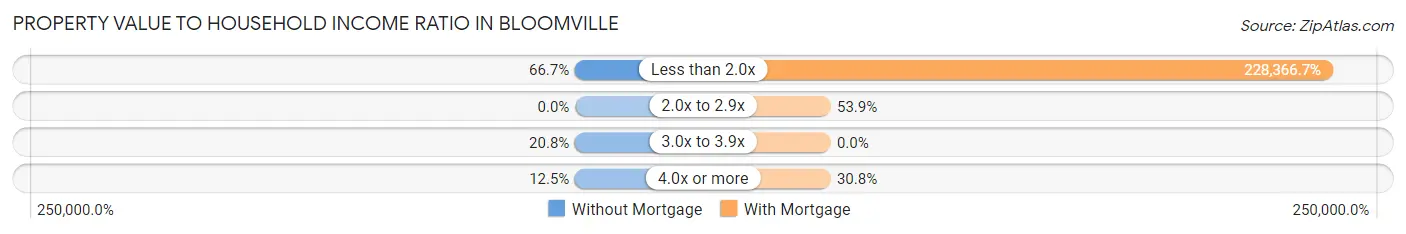
| Value-to-Income Ratio | Without Mortgage | With Mortgage |
| Less than 2.0x | 16 (66.7%) | 89,063 (228,366.7%) |
| 2.0x to 2.9x | 0 (0.0%) | 21 (53.8%) |
| 3.0x to 3.9x | 5 (20.8%) | 0 (0.0%) |
| 4.0x or more | 3 (12.5%) | 12 (30.8%) |
| Total | 24 (100.0%) | 39 (100.0%) |
Real Estate Taxes by Mortgage Status in Bloomville
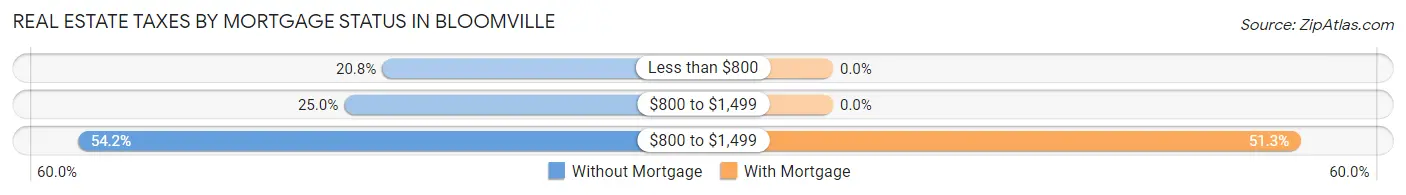
| Property Taxes | Without Mortgage | With Mortgage |
| Less than $800 | 5 (20.8%) | 0 (0.0%) |
| $800 to $1,499 | 6 (25.0%) | 0 (0.0%) |
| $800 to $1,499 | 13 (54.2%) | 20 (51.3%) |
| Total | 24 (100.0%) | 39 (100.0%) |
Health & Disability in Bloomville
Health Insurance Coverage by Age in Bloomville
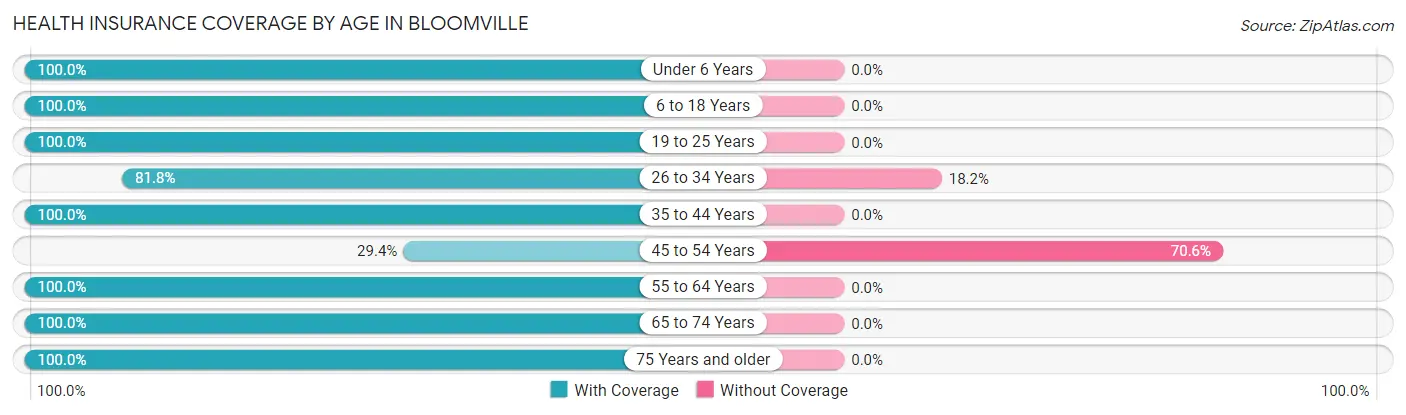
| Age Bracket | With Coverage | Without Coverage |
| Under 6 Years | 6 (100.0%) | 0 (0.0%) |
| 6 to 18 Years | 18 (100.0%) | 0 (0.0%) |
| 19 to 25 Years | 41 (100.0%) | 0 (0.0%) |
| 26 to 34 Years | 54 (81.8%) | 12 (18.2%) |
| 35 to 44 Years | 52 (100.0%) | 0 (0.0%) |
| 45 to 54 Years | 5 (29.4%) | 12 (70.6%) |
| 55 to 64 Years | 54 (100.0%) | 0 (0.0%) |
| 65 to 74 Years | 23 (100.0%) | 0 (0.0%) |
| 75 Years and older | 13 (100.0%) | 0 (0.0%) |
| Total | 266 (91.7%) | 24 (8.3%) |
Health Insurance Coverage by Citizenship Status in Bloomville
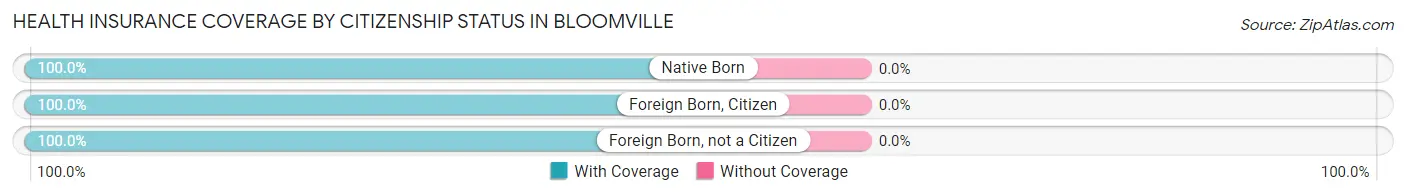
| Citizenship Status | With Coverage | Without Coverage |
| Native Born | 6 (100.0%) | 0 (0.0%) |
| Foreign Born, Citizen | 18 (100.0%) | 0 (0.0%) |
| Foreign Born, not a Citizen | 41 (100.0%) | 0 (0.0%) |
Health Insurance Coverage by Household Income in Bloomville
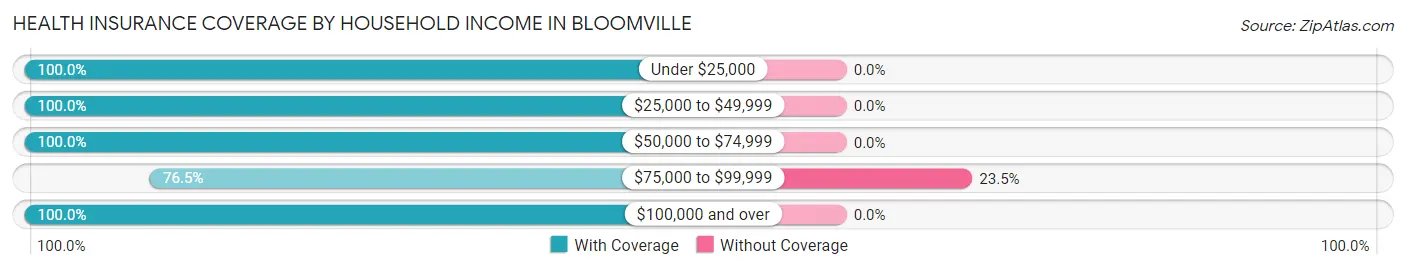
| Household Income | With Coverage | Without Coverage |
| Under $25,000 | 9 (100.0%) | 0 (0.0%) |
| $25,000 to $49,999 | 19 (100.0%) | 0 (0.0%) |
| $50,000 to $74,999 | 22 (100.0%) | 0 (0.0%) |
| $75,000 to $99,999 | 78 (76.5%) | 24 (23.5%) |
| $100,000 and over | 138 (100.0%) | 0 (0.0%) |
Public vs Private Health Insurance Coverage by Age in Bloomville
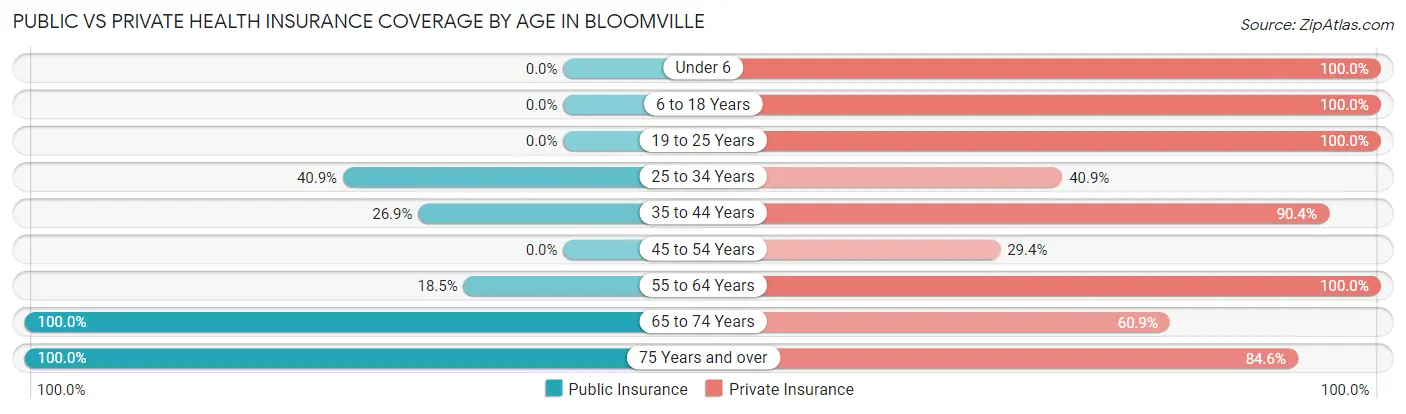
| Age Bracket | Public Insurance | Private Insurance |
| Under 6 | 0 (0.0%) | 6 (100.0%) |
| 6 to 18 Years | 0 (0.0%) | 18 (100.0%) |
| 19 to 25 Years | 0 (0.0%) | 41 (100.0%) |
| 25 to 34 Years | 27 (40.9%) | 27 (40.9%) |
| 35 to 44 Years | 14 (26.9%) | 47 (90.4%) |
| 45 to 54 Years | 0 (0.0%) | 5 (29.4%) |
| 55 to 64 Years | 10 (18.5%) | 54 (100.0%) |
| 65 to 74 Years | 23 (100.0%) | 14 (60.9%) |
| 75 Years and over | 13 (100.0%) | 11 (84.6%) |
| Total | 87 (30.0%) | 223 (76.9%) |
Disability Status by Sex by Age in Bloomville
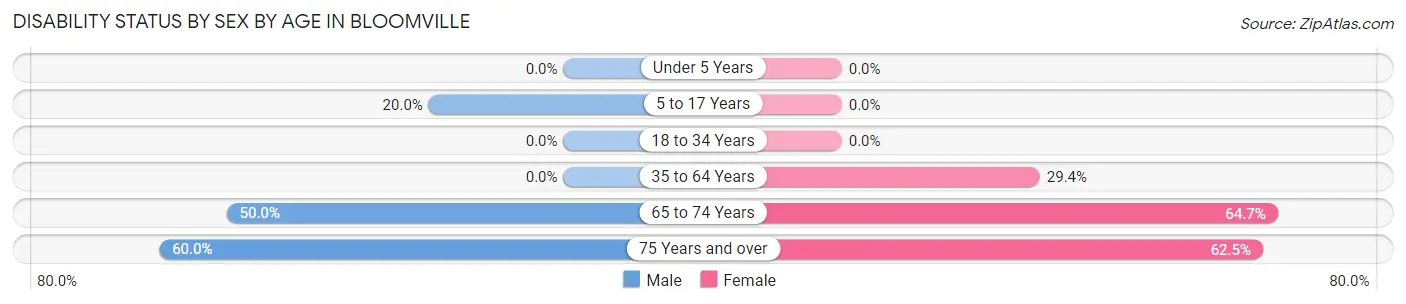
| Age Bracket | Male | Female |
| Under 5 Years | 0 (0.0%) | 0 (0.0%) |
| 5 to 17 Years | 3 (20.0%) | 0 (0.0%) |
| 18 to 34 Years | 0 (0.0%) | 0 (0.0%) |
| 35 to 64 Years | 0 (0.0%) | 15 (29.4%) |
| 65 to 74 Years | 3 (50.0%) | 11 (64.7%) |
| 75 Years and over | 3 (60.0%) | 5 (62.5%) |
Disability Class by Sex by Age in Bloomville
Disability Class: Hearing Difficulty
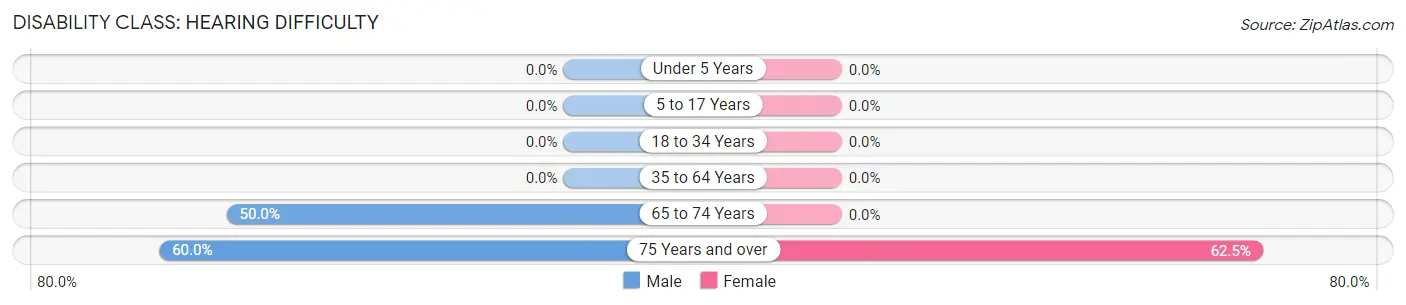
| Age Bracket | Male | Female |
| Under 5 Years | 0 (0.0%) | 0 (0.0%) |
| 5 to 17 Years | 0 (0.0%) | 0 (0.0%) |
| 18 to 34 Years | 0 (0.0%) | 0 (0.0%) |
| 35 to 64 Years | 0 (0.0%) | 0 (0.0%) |
| 65 to 74 Years | 3 (50.0%) | 0 (0.0%) |
| 75 Years and over | 3 (60.0%) | 5 (62.5%) |
Disability Class: Vision Difficulty
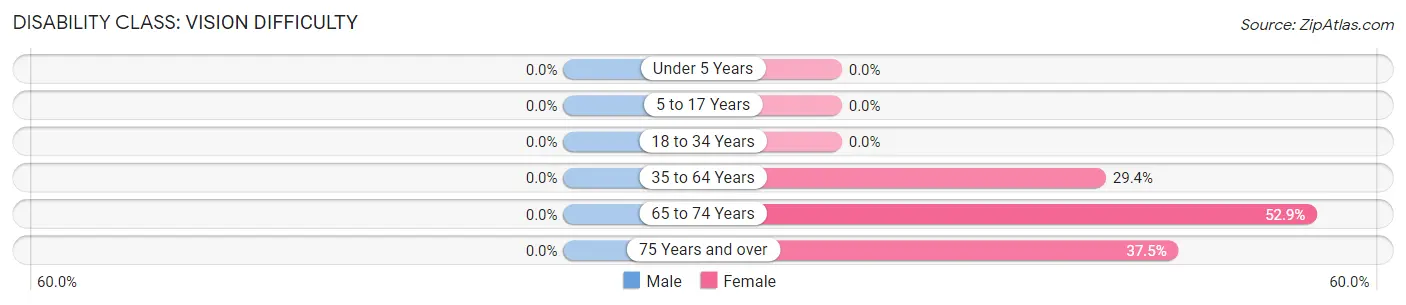
| Age Bracket | Male | Female |
| Under 5 Years | 0 (0.0%) | 0 (0.0%) |
| 5 to 17 Years | 0 (0.0%) | 0 (0.0%) |
| 18 to 34 Years | 0 (0.0%) | 0 (0.0%) |
| 35 to 64 Years | 0 (0.0%) | 15 (29.4%) |
| 65 to 74 Years | 0 (0.0%) | 9 (52.9%) |
| 75 Years and over | 0 (0.0%) | 3 (37.5%) |
Disability Class: Cognitive Difficulty
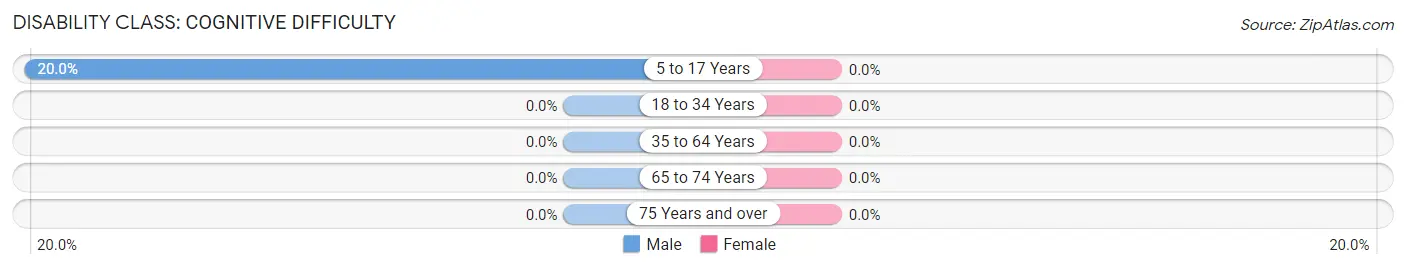
| Age Bracket | Male | Female |
| 5 to 17 Years | 3 (20.0%) | 0 (0.0%) |
| 18 to 34 Years | 0 (0.0%) | 0 (0.0%) |
| 35 to 64 Years | 0 (0.0%) | 0 (0.0%) |
| 65 to 74 Years | 0 (0.0%) | 0 (0.0%) |
| 75 Years and over | 0 (0.0%) | 0 (0.0%) |
Disability Class: Ambulatory Difficulty
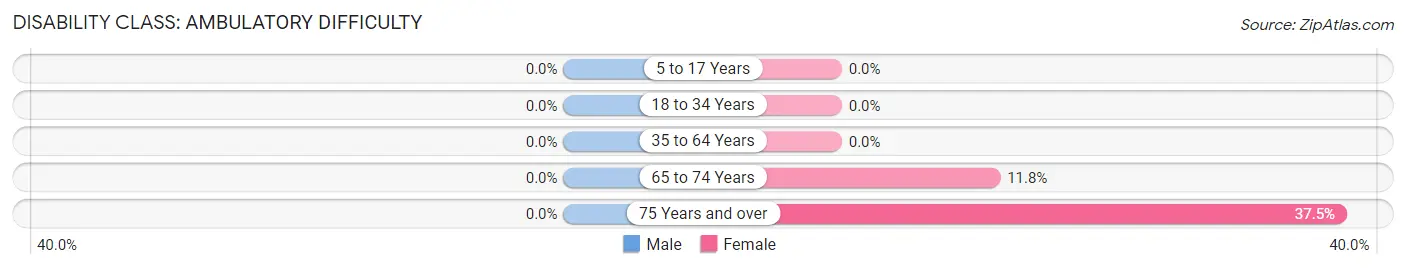
| Age Bracket | Male | Female |
| 5 to 17 Years | 0 (0.0%) | 0 (0.0%) |
| 18 to 34 Years | 0 (0.0%) | 0 (0.0%) |
| 35 to 64 Years | 0 (0.0%) | 0 (0.0%) |
| 65 to 74 Years | 0 (0.0%) | 2 (11.8%) |
| 75 Years and over | 0 (0.0%) | 3 (37.5%) |
Disability Class: Self-Care Difficulty
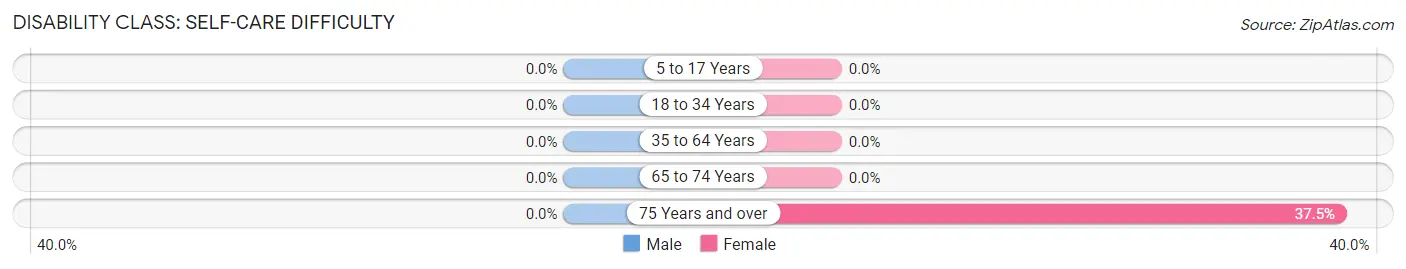
| Age Bracket | Male | Female |
| 5 to 17 Years | 0 (0.0%) | 0 (0.0%) |
| 18 to 34 Years | 0 (0.0%) | 0 (0.0%) |
| 35 to 64 Years | 0 (0.0%) | 0 (0.0%) |
| 65 to 74 Years | 0 (0.0%) | 0 (0.0%) |
| 75 Years and over | 0 (0.0%) | 3 (37.5%) |
Technology Access in Bloomville
Computing Device Access in Bloomville
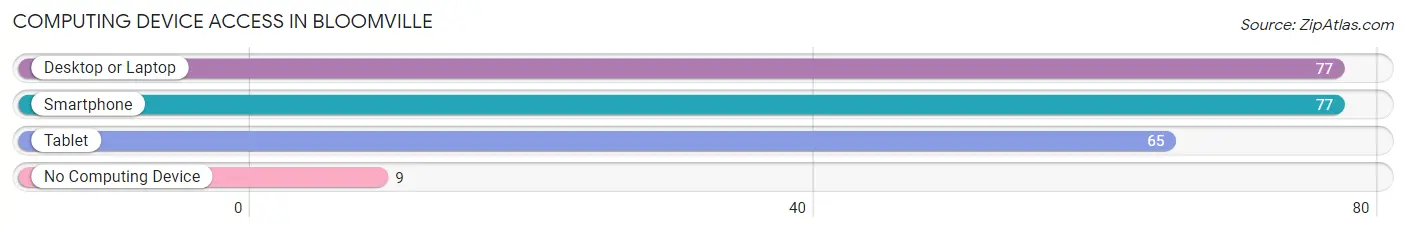
| Device Type | # Households | % Households |
| Desktop or Laptop | 77 | 84.6% |
| Smartphone | 77 | 84.6% |
| Tablet | 65 | 71.4% |
| No Computing Device | 9 | 9.9% |
| Total | 91 | 100.0% |
Internet Access in Bloomville
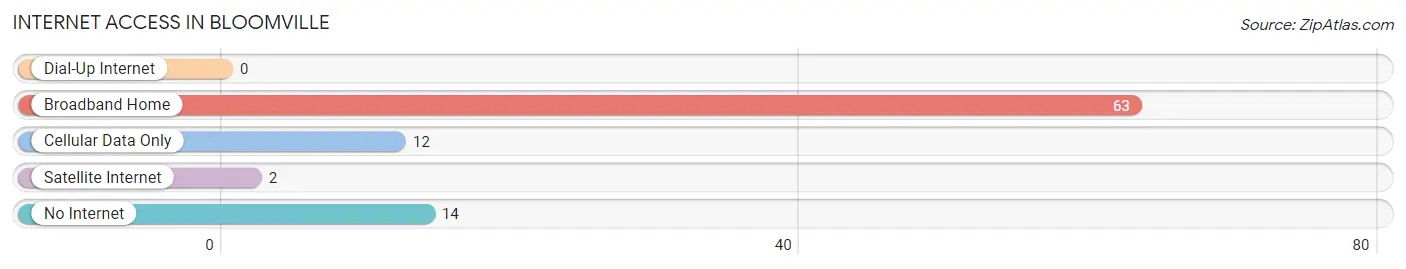
| Internet Type | # Households | % Households |
| Dial-Up Internet | 0 | 0.0% |
| Broadband Home | 63 | 69.2% |
| Cellular Data Only | 12 | 13.2% |
| Satellite Internet | 2 | 2.2% |
| No Internet | 14 | 15.4% |
| Total | 91 | 100.0% |
Bloomville Summary
History
The town of Bloomville is located in Delaware County, New York, and is part of the Catskill Mountains region. The town was first settled in 1790 by a group of settlers from Connecticut. The town was originally known as “Bloom’s Settlement” after the first settler, John Bloom. The town was officially established in 1819 and was named after the first settler.
The town of Bloomville was an important center of commerce in the 19th century. It was home to several mills, including a grist mill, a saw mill, and a woolen mill. The town was also home to a number of stores, including a general store, a drug store, and a hardware store. The town was also home to a number of churches, including the Methodist Episcopal Church, the Presbyterian Church, and the Baptist Church.
The town of Bloomville was also home to a number of schools, including the Bloomville Academy, which was established in 1820. The academy was a private school that offered classes in a variety of subjects, including mathematics, science, and literature. The school was eventually closed in 1876.
The town of Bloomville was also home to a number of industries, including a tannery, a brickyard, and a furniture factory. The town was also home to a number of hotels, including the Bloomville Hotel, which was established in 1825. The hotel was a popular destination for travelers and was known for its excellent food and hospitality.
The town of Bloomville was also home to a number of cultural institutions, including the Bloomville Opera House, which was established in 1883. The opera house was a popular destination for theater and musical performances. The opera house was eventually closed in the early 20th century.
Geography
The town of Bloomville is located in the Catskill Mountains region of New York. The town is situated in the western part of Delaware County, and is bordered by the towns of Delhi, Meredith, and Andes. The town is located at an elevation of 1,400 feet above sea level.
The town of Bloomville is located in a rural area, and is surrounded by forests and rolling hills. The town is home to several small lakes, including Lake Delaware, which is located in the northern part of the town. The town is also home to several small streams, including the East Branch of the Delaware River.
The town of Bloomville is located in a temperate climate, with warm summers and cold winters. The average temperature in the summer is around 75 degrees Fahrenheit, and the average temperature in the winter is around 25 degrees Fahrenheit. The town receives an average of 40 inches of precipitation per year.
Economy
The town of Bloomville is a rural community, and the economy is largely based on agriculture and tourism. The town is home to several small farms, which produce a variety of crops, including corn, soybeans, and hay. The town is also home to several small businesses, including restaurants, stores, and hotels.
The town of Bloomville is also home to a number of tourist attractions, including the Bloomville Opera House, which is a popular destination for theater and musical performances. The town is also home to several small museums, including the Delaware County Historical Society Museum, which is located in the town center.
The town of Bloomville is also home to a number of outdoor recreational activities, including fishing, hunting, and hiking. The town is also home to several parks, including the Bloomville Park, which is located in the town center.
Demographics
The town of Bloomville has a population of 1,845, according to the 2010 census. The population is largely white, with 94.3% of the population identifying as white. The town also has a small Hispanic population, with 4.2% of the population identifying as Hispanic or Latino.
The median household income in the town of Bloomville is $41,250, and the median home value is $117,400. The town has a poverty rate of 11.3%, which is slightly higher than the national average. The town also has a high rate of unemployment, with 8.2% of the population unemployed.
Common Questions
What is the Total Population of Bloomville?
Total Population of Bloomville is 290.
What is the Total Male Population of Bloomville?
Total Male Population of Bloomville is 161.
What is the Total Female Population of Bloomville?
Total Female Population of Bloomville is 129.
What is the Ratio of Males per 100 Females in Bloomville?
There are 124.81 Males per 100 Females in Bloomville.
What is the Ratio of Females per 100 Males in Bloomville?
There are 80.12 Females per 100 Males in Bloomville.
What is the Median Population Age in Bloomville?
Median Population Age in Bloomville is 35.7 Years.
What is the Average Family Size in Bloomville
Average Family Size in Bloomville is 4.2 People.
What is the Average Household Size in Bloomville
Average Household Size in Bloomville is 3.2 People.
What is Per Capita Income in Bloomville?
Per Capita income in Bloomville is $32,130.
What is the Median Family Income in Bloomville?
Median Family Income in Bloomville is $79,271.
What is the Median Household income in Bloomville?
Median Household Income in Bloomville is $78,021.
What is Inequality or Gini Index in Bloomville?
Inequality or Gini Index in Bloomville is 0.30.
How Large is the Labor Force in Bloomville?
There are 219 People in the Labor Forcein in Bloomville.
What is the Percentage of People in the Labor Force in Bloomville?
81.4% of People are in the Labor Force in Bloomville.
What is the Unemployment Rate in Bloomville?
Unemployment Rate in Bloomville is 12.3%.