Stone Ridge, NY
Stone Ridge Map
Stone Ridge Overview
1,900
TOTAL POPULATION
1,009
MALE POPULATION
891
FEMALE POPULATION
113.24
MALES / 100 FEMALES
88.31
FEMALES / 100 MALES
37.6
MEDIAN AGE
2.7
AVG FAMILY SIZE
2.6
AVG HOUSEHOLD SIZE
$48,646
PER CAPITA INCOME
$117,992
AVG FAMILY INCOME
$117,683
AVG HOUSEHOLD INCOME
0.38
INEQUALITY / GINI INDEX
818
LABOR FORCE [ PEOPLE ]
55.3%
PERCENT IN LABOR FORCE
7.6%
UNEMPLOYMENT RATE
Stone Ridge Zip Codes
Stone Ridge Area Codes
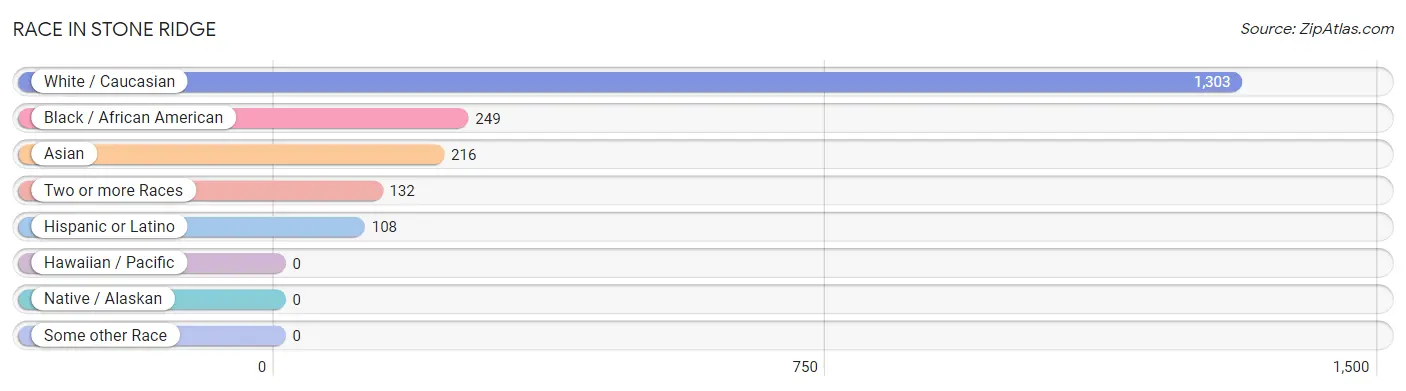
Race in Stone Ridge
The most populous races in Stone Ridge are White / Caucasian (1,303 | 68.6%), Black / African American (249 | 13.1%), and Asian (216 | 11.4%).
| Race | # Population | % Population |
| Asian | 216 | 11.4% |
| Black / African American | 249 | 13.1% |
| Hawaiian / Pacific | 0 | 0.0% |
| Hispanic or Latino | 108 | 5.7% |
| Native / Alaskan | 0 | 0.0% |
| White / Caucasian | 1,303 | 68.6% |
| Two or more Races | 132 | 7.0% |
| Some other Race | 0 | 0.0% |
| Total | 1,900 | 100.0% |
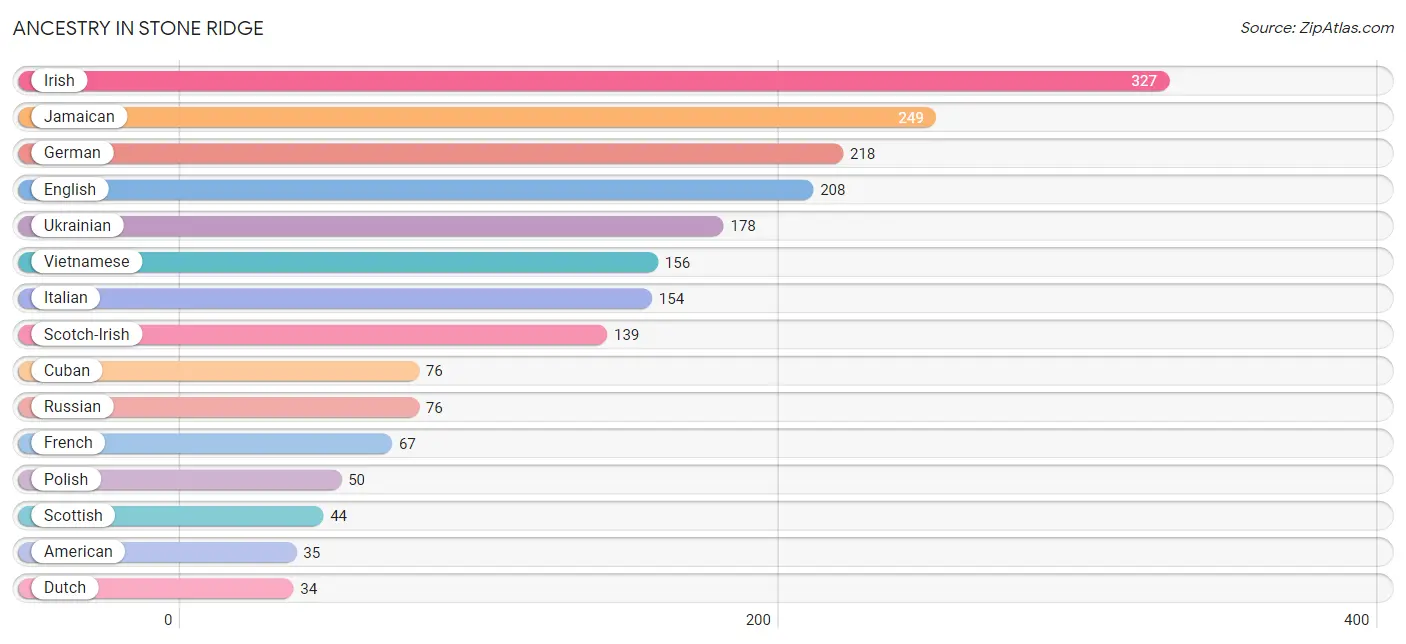
Ancestry in Stone Ridge
The most populous ancestries reported in Stone Ridge are Irish (327 | 17.2%), Jamaican (249 | 13.1%), German (218 | 11.5%), English (208 | 11.0%), and Ukrainian (178 | 9.4%), together accounting for 62.1% of all Stone Ridge residents.
| Ancestry | # Population | % Population |
| American | 35 | 1.8% |
| Austrian | 8 | 0.4% |
| British | 10 | 0.5% |
| Croatian | 11 | 0.6% |
| Cuban | 76 | 4.0% |
| Dutch | 34 | 1.8% |
| English | 208 | 11.0% |
| French | 67 | 3.5% |
| German | 218 | 11.5% |
| Irish | 327 | 17.2% |
| Italian | 154 | 8.1% |
| Jamaican | 249 | 13.1% |
| Norwegian | 13 | 0.7% |
| Polish | 50 | 2.6% |
| Russian | 76 | 4.0% |
| Scotch-Irish | 139 | 7.3% |
| Scottish | 44 | 2.3% |
| Spaniard | 32 | 1.7% |
| Ukrainian | 178 | 9.4% |
| Vietnamese | 156 | 8.2% |
| Welsh | 7 | 0.4% | View All 21 Rows |
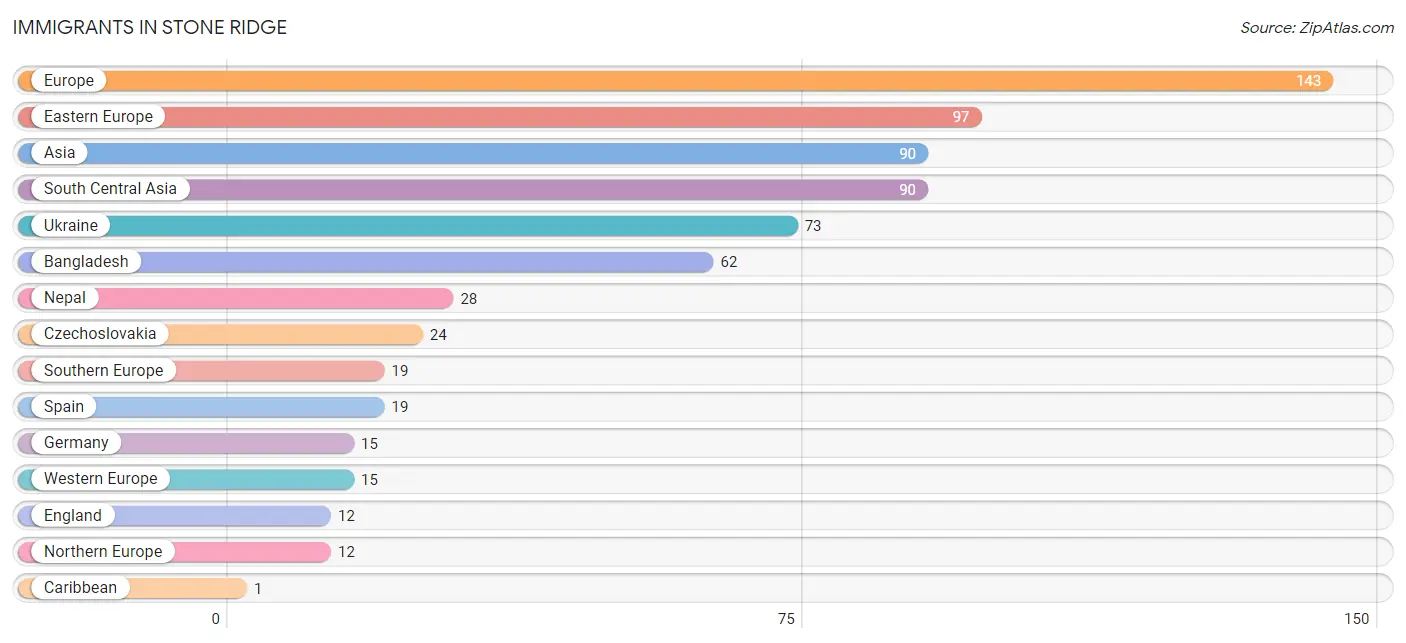
Immigrants in Stone Ridge
The most numerous immigrant groups reported in Stone Ridge came from Europe (143 | 7.5%), Eastern Europe (97 | 5.1%), Asia (90 | 4.7%), South Central Asia (90 | 4.7%), and Ukraine (73 | 3.8%), together accounting for 26.0% of all Stone Ridge residents.
| Immigration Origin | # Population | % Population |
| Asia | 90 | 4.7% |
| Bangladesh | 62 | 3.3% |
| Caribbean | 1 | 0.1% |
| Cuba | 1 | 0.1% |
| Czechoslovakia | 24 | 1.3% |
| Eastern Europe | 97 | 5.1% |
| England | 12 | 0.6% |
| Europe | 143 | 7.5% |
| Germany | 15 | 0.8% |
| Latin America | 1 | 0.1% |
| Nepal | 28 | 1.5% |
| Northern Europe | 12 | 0.6% |
| South Central Asia | 90 | 4.7% |
| Southern Europe | 19 | 1.0% |
| Spain | 19 | 1.0% |
| Ukraine | 73 | 3.8% |
| Western Europe | 15 | 0.8% | View All 17 Rows |
Sex and Age in Stone Ridge
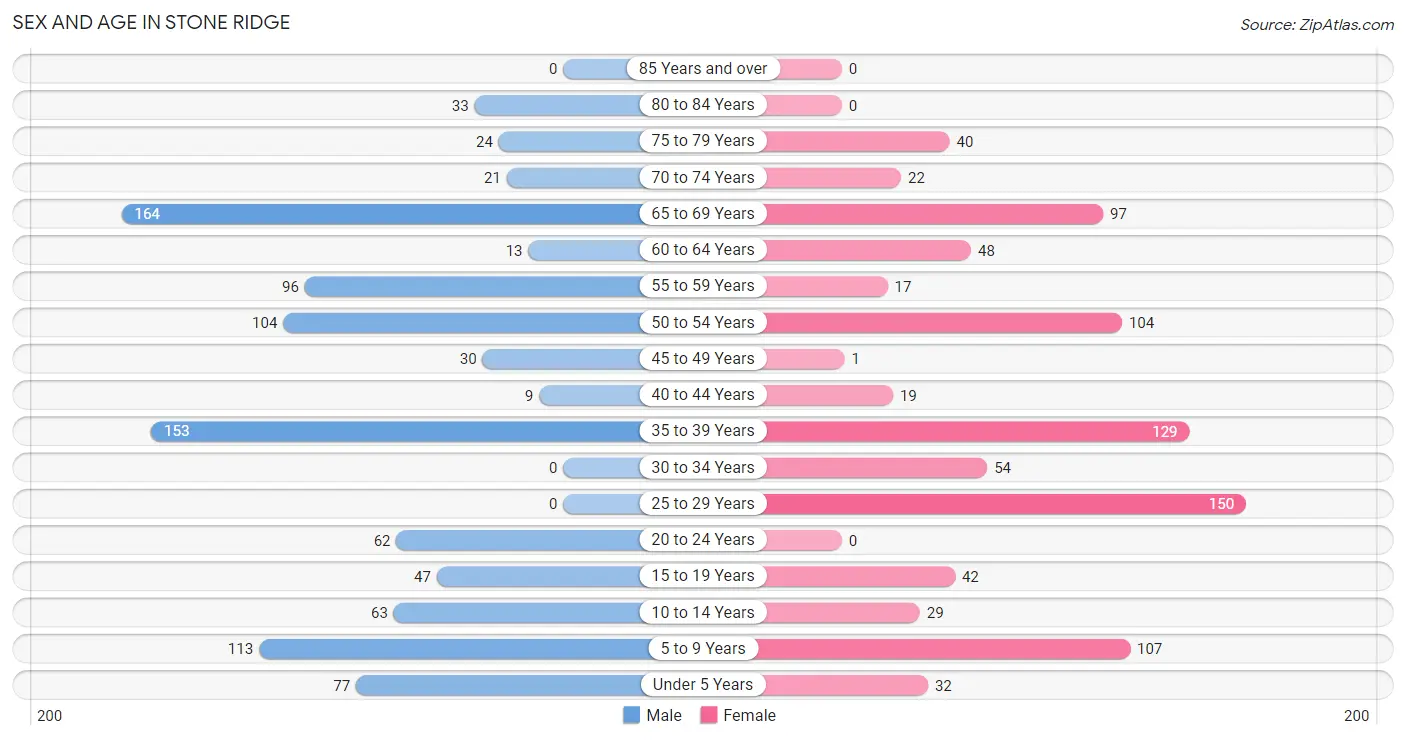
Sex and Age in Stone Ridge
The most populous age groups in Stone Ridge are 65 to 69 Years (164 | 16.3%) for men and 25 to 29 Years (150 | 16.8%) for women.
| Age Bracket | Male | Female |
| Under 5 Years | 77 (7.6%) | 32 (3.6%) |
| 5 to 9 Years | 113 (11.2%) | 107 (12.0%) |
| 10 to 14 Years | 63 (6.2%) | 29 (3.3%) |
| 15 to 19 Years | 47 (4.7%) | 42 (4.7%) |
| 20 to 24 Years | 62 (6.1%) | 0 (0.0%) |
| 25 to 29 Years | 0 (0.0%) | 150 (16.8%) |
| 30 to 34 Years | 0 (0.0%) | 54 (6.1%) |
| 35 to 39 Years | 153 (15.2%) | 129 (14.5%) |
| 40 to 44 Years | 9 (0.9%) | 19 (2.1%) |
| 45 to 49 Years | 30 (3.0%) | 1 (0.1%) |
| 50 to 54 Years | 104 (10.3%) | 104 (11.7%) |
| 55 to 59 Years | 96 (9.5%) | 17 (1.9%) |
| 60 to 64 Years | 13 (1.3%) | 48 (5.4%) |
| 65 to 69 Years | 164 (16.3%) | 97 (10.9%) |
| 70 to 74 Years | 21 (2.1%) | 22 (2.5%) |
| 75 to 79 Years | 24 (2.4%) | 40 (4.5%) |
| 80 to 84 Years | 33 (3.3%) | 0 (0.0%) |
| 85 Years and over | 0 (0.0%) | 0 (0.0%) |
| Total | 1,009 (100.0%) | 891 (100.0%) |
Families and Households in Stone Ridge
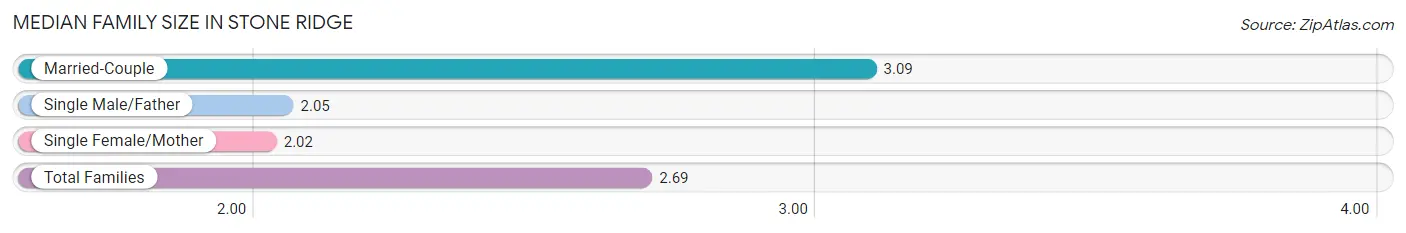
Median Family Size in Stone Ridge
The median family size in Stone Ridge is 2.69 persons per family, with married-couple families (405 | 62.6%) accounting for the largest median family size of 3.09 persons per family. On the other hand, single female/mother families (199 | 30.8%) represent the smallest median family size with 2.02 persons per family.
| Family Type | # Families | Family Size |
| Married-Couple | 405 (62.6%) | 3.09 |
| Single Male/Father | 43 (6.7%) | 2.05 |
| Single Female/Mother | 199 (30.8%) | 2.02 |
| Total Families | 647 (100.0%) | 2.69 |
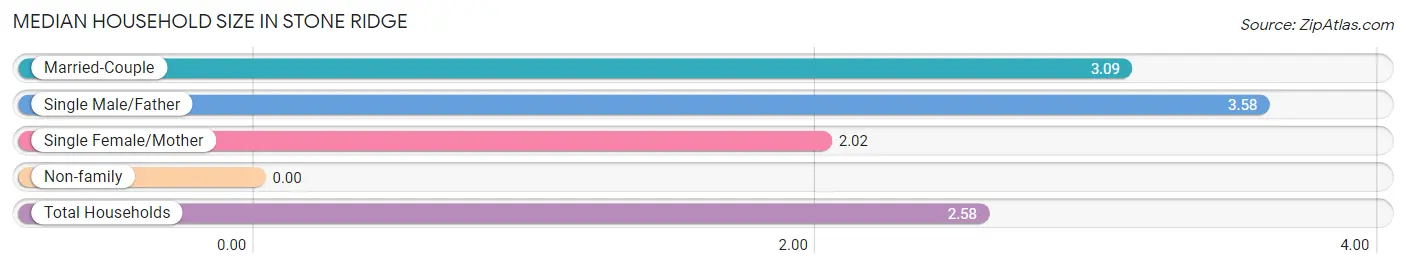
Median Household Size in Stone Ridge
| Household Type | # Households | Household Size |
| Married-Couple | 405 (55.3%) | 3.09 |
| Single Male/Father | 43 (5.9%) | 3.58 |
| Single Female/Mother | 199 (27.2%) | 2.02 |
| Non-family | 85 (11.6%) | - |
| Total Households | 732 (100.0%) | 2.58 |
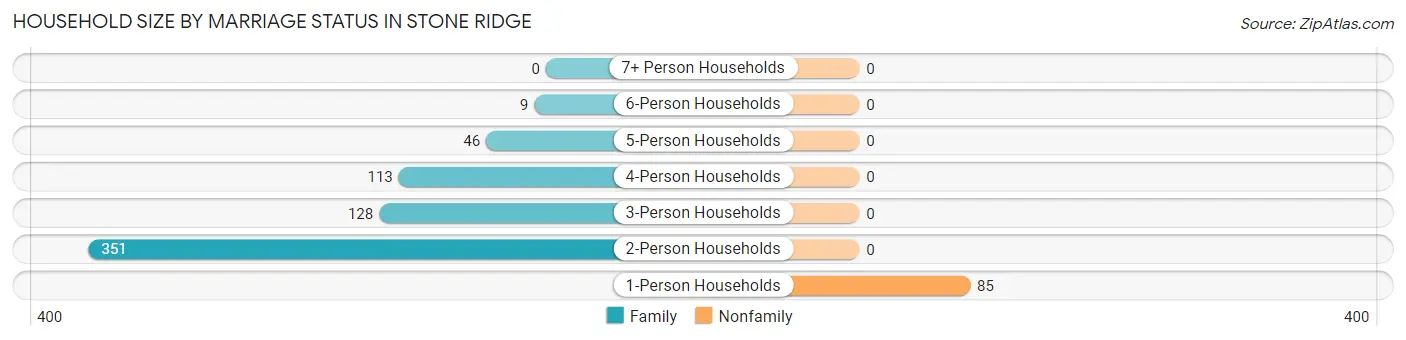
Household Size by Marriage Status in Stone Ridge
Out of a total of 732 households in Stone Ridge, 647 (88.4%) are family households, while 85 (11.6%) are nonfamily households. The most numerous type of family households are 2-person households, comprising 351, and the most common type of nonfamily households are 1-person households, comprising 85.
| Household Size | Family Households | Nonfamily Households |
| 1-Person Households | - | 85 (11.6%) |
| 2-Person Households | 351 (47.9%) | 0 (0.0%) |
| 3-Person Households | 128 (17.5%) | 0 (0.0%) |
| 4-Person Households | 113 (15.4%) | 0 (0.0%) |
| 5-Person Households | 46 (6.3%) | 0 (0.0%) |
| 6-Person Households | 9 (1.2%) | 0 (0.0%) |
| 7+ Person Households | 0 (0.0%) | 0 (0.0%) |
| Total | 647 (88.4%) | 85 (11.6%) |
Female Fertility in Stone Ridge
Fertility by Age in Stone Ridge
| Age Bracket | Women with Births | Births / 1,000 Women |
| 15 to 19 years | 0 (0.0%) | 0.0 |
| 20 to 34 years | 0 (0.0%) | 0.0 |
| 35 to 50 years | 0 (0.0%) | 0.0 |
| Total | 0 (0.0%) | 0.0 |
Fertility by Age by Marriage Status in Stone Ridge
| Age Bracket | Married | Unmarried |
| 15 to 19 years | 0 (0.0%) | 0 (0.0%) |
| 20 to 34 years | 0 (0.0%) | 0 (0.0%) |
| 35 to 50 years | 0 (0.0%) | 0 (0.0%) |
| Total | 0 (0.0%) | 0 (0.0%) |
Fertility by Education in Stone Ridge
| Educational Attainment | Women with Births | Births / 1,000 Women |
| Less than High School | 0 (0.0%) | 0.0 |
| High School Diploma | 0 (0.0%) | 0.0 |
| College or Associate's Degree | 0 (0.0%) | 0.0 |
| Bachelor's Degree | 0 (0.0%) | 0.0 |
| Graduate Degree | 0 (0.0%) | 0.0 |
| Total | 0 (0.0%) | 0.0 |
Fertility by Education by Marriage Status in Stone Ridge
| Educational Attainment | Married | Unmarried |
| Less than High School | 0 (0.0%) | 0 (0.0%) |
| High School Diploma | 0 (0.0%) | 0 (0.0%) |
| College or Associate's Degree | 0 (0.0%) | 0 (0.0%) |
| Bachelor's Degree | 0 (0.0%) | 0 (0.0%) |
| Graduate Degree | 0 (0.0%) | 0 (0.0%) |
| Total | 0 (0.0%) | 0 (0.0%) |
Income in Stone Ridge
Income Overview in Stone Ridge
Per Capita Income in Stone Ridge is $48,646, while median incomes of families and households are $117,992 and $117,683 respectively.
| Characteristic | Number | Measure |
| Per Capita Income | 1,900 | $48,646 |
| Median Family Income | 647 | $117,992 |
| Mean Family Income | 647 | $139,909 |
| Median Household Income | 732 | $117,683 |
| Mean Household Income | 732 | $133,867 |
| Income Deficit | 647 | $0 |
| Wage / Income Gap (%) | 1,900 | 0.00% |
| Wage / Income Gap ($) | 1,900 | 100.00¢ per $1 |
| Gini / Inequality Index | 1,900 | 0.38 |
Earnings by Sex in Stone Ridge
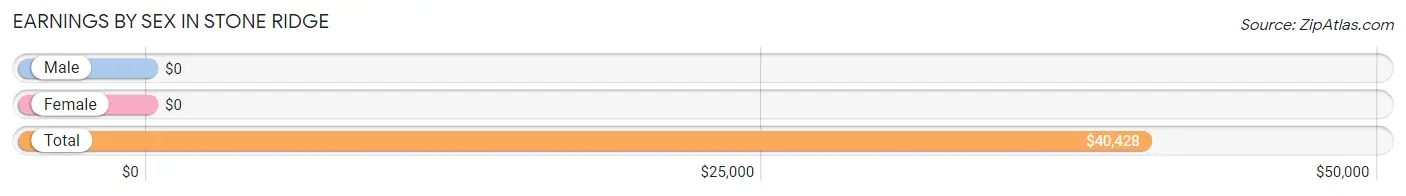
| Sex | Number | Average Earnings |
| Male | 474 (50.0%) | $0 |
| Female | 473 (49.9%) | $0 |
| Total | 947 (100.0%) | $40,428 |
Earnings by Sex by Income Bracket in Stone Ridge
The most common earnings brackets in Stone Ridge are $100,000+ for men (113 | 23.8%) and $100,000+ for women (173 | 36.6%).
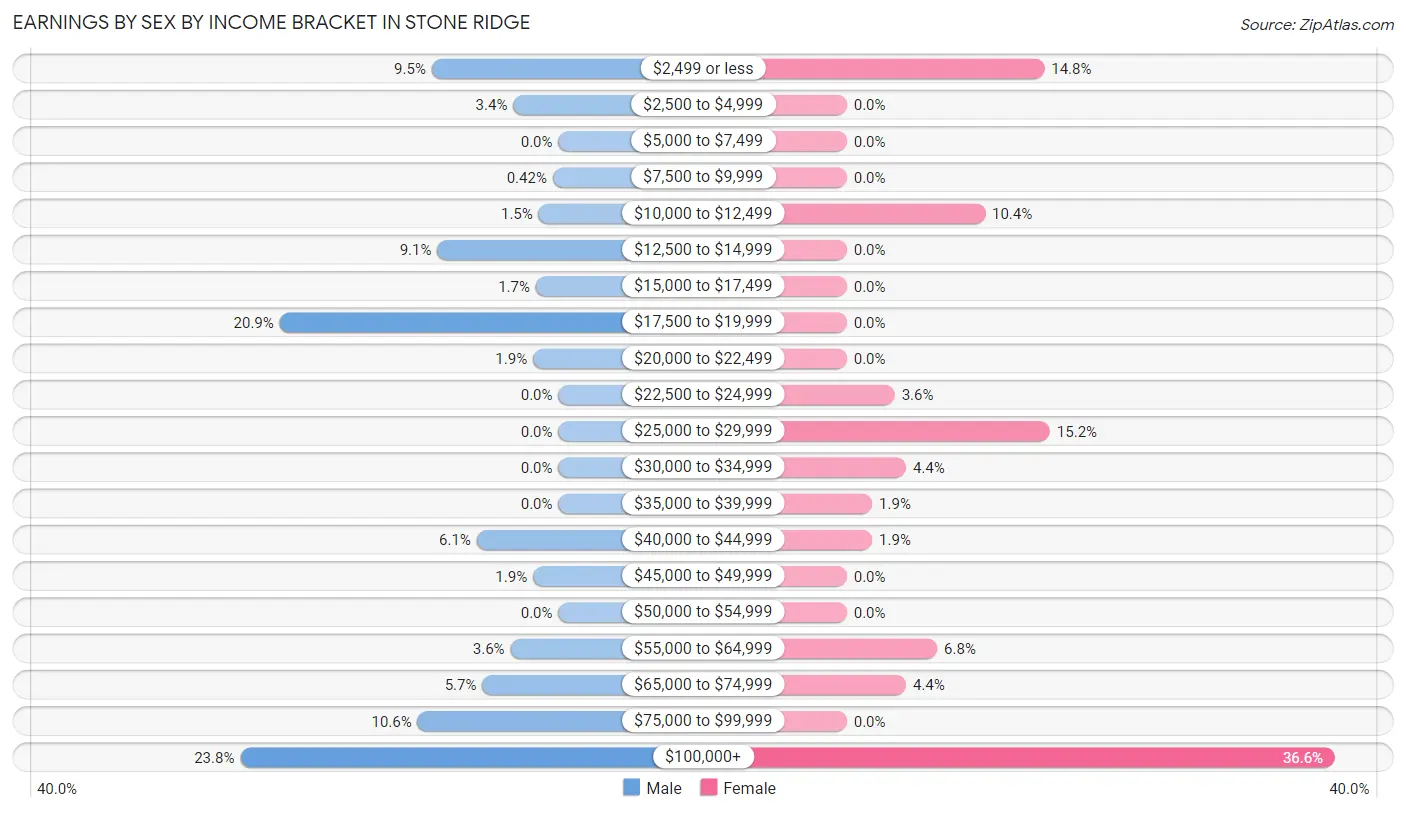
| Income | Male | Female |
| $2,499 or less | 45 (9.5%) | 70 (14.8%) |
| $2,500 to $4,999 | 16 (3.4%) | 0 (0.0%) |
| $5,000 to $7,499 | 0 (0.0%) | 0 (0.0%) |
| $7,500 to $9,999 | 2 (0.4%) | 0 (0.0%) |
| $10,000 to $12,499 | 7 (1.5%) | 49 (10.4%) |
| $12,500 to $14,999 | 43 (9.1%) | 0 (0.0%) |
| $15,000 to $17,499 | 8 (1.7%) | 0 (0.0%) |
| $17,500 to $19,999 | 99 (20.9%) | 0 (0.0%) |
| $20,000 to $22,499 | 9 (1.9%) | 0 (0.0%) |
| $22,500 to $24,999 | 0 (0.0%) | 17 (3.6%) |
| $25,000 to $29,999 | 0 (0.0%) | 72 (15.2%) |
| $30,000 to $34,999 | 0 (0.0%) | 21 (4.4%) |
| $35,000 to $39,999 | 0 (0.0%) | 9 (1.9%) |
| $40,000 to $44,999 | 29 (6.1%) | 9 (1.9%) |
| $45,000 to $49,999 | 9 (1.9%) | 0 (0.0%) |
| $50,000 to $54,999 | 0 (0.0%) | 0 (0.0%) |
| $55,000 to $64,999 | 17 (3.6%) | 32 (6.8%) |
| $65,000 to $74,999 | 27 (5.7%) | 21 (4.4%) |
| $75,000 to $99,999 | 50 (10.5%) | 0 (0.0%) |
| $100,000+ | 113 (23.8%) | 173 (36.6%) |
| Total | 474 (100.0%) | 473 (100.0%) |
Earnings by Sex by Educational Attainment in Stone Ridge
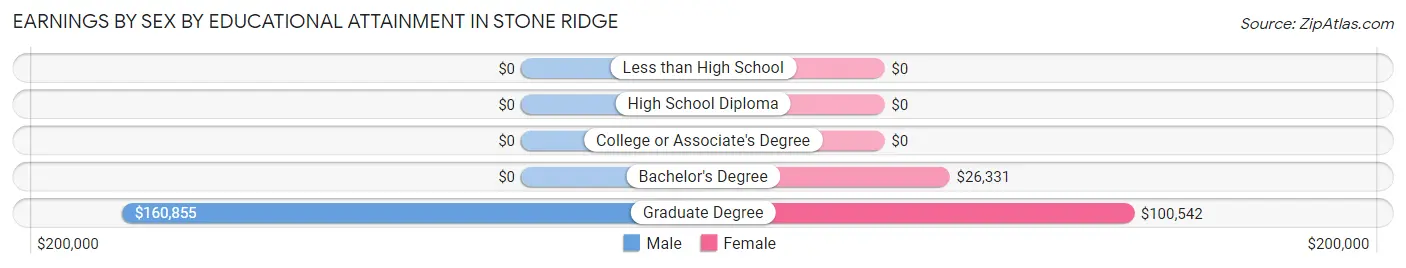
| Educational Attainment | Male Income | Female Income |
| Less than High School | - | - |
| High School Diploma | - | - |
| College or Associate's Degree | - | - |
| Bachelor's Degree | - | - |
| Graduate Degree | $160,855 | $100,542 |
| Total | $55,147 | $0 |
Family Income in Stone Ridge
Family Income Brackets in Stone Ridge
According to the Stone Ridge family income data, there are 213 families falling into the $100,000 to $149,999 income range, which is the most common income bracket and makes up 32.9% of all families.
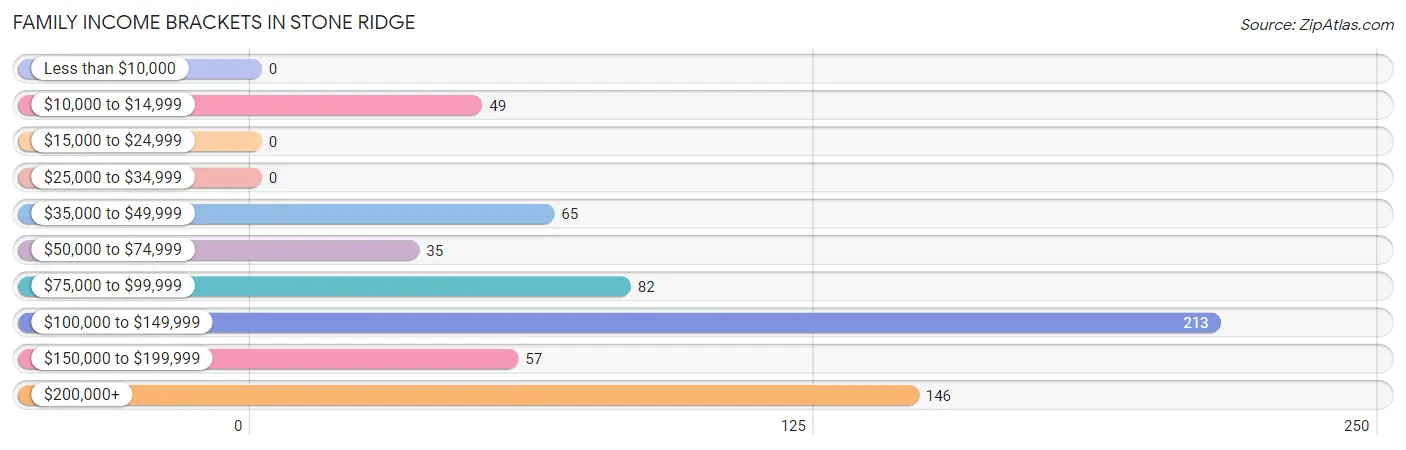
| Income Bracket | # Families | % Families |
| Less than $10,000 | 0 | 0.0% |
| $10,000 to $14,999 | 49 | 7.6% |
| $15,000 to $24,999 | 0 | 0.0% |
| $25,000 to $34,999 | 0 | 0.0% |
| $35,000 to $49,999 | 65 | 10.0% |
| $50,000 to $74,999 | 35 | 5.4% |
| $75,000 to $99,999 | 82 | 12.7% |
| $100,000 to $149,999 | 213 | 32.9% |
| $150,000 to $199,999 | 57 | 8.8% |
| $200,000+ | 146 | 22.6% |
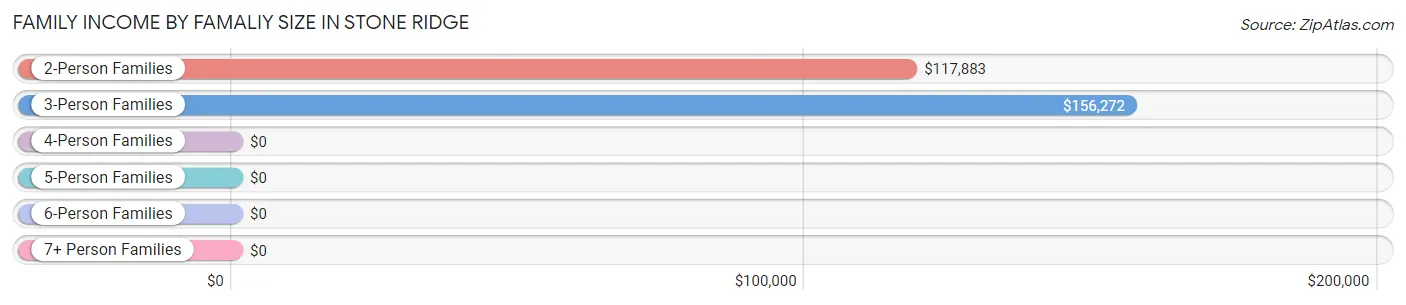
Family Income by Famaliy Size in Stone Ridge
3-person families (128 | 19.8%) account for the highest median family income in Stone Ridge with $156,272 per family, while 2-person families (368 | 56.9%) have the highest median income of $58,942 per family member.
| Income Bracket | # Families | Median Income |
| 2-Person Families | 368 (56.9%) | $117,883 |
| 3-Person Families | 128 (19.8%) | $156,272 |
| 4-Person Families | 113 (17.5%) | $0 |
| 5-Person Families | 29 (4.5%) | $0 |
| 6-Person Families | 9 (1.4%) | $0 |
| 7+ Person Families | 0 (0.0%) | $0 |
| Total | 647 (100.0%) | $117,992 |
Family Income by Number of Earners in Stone Ridge
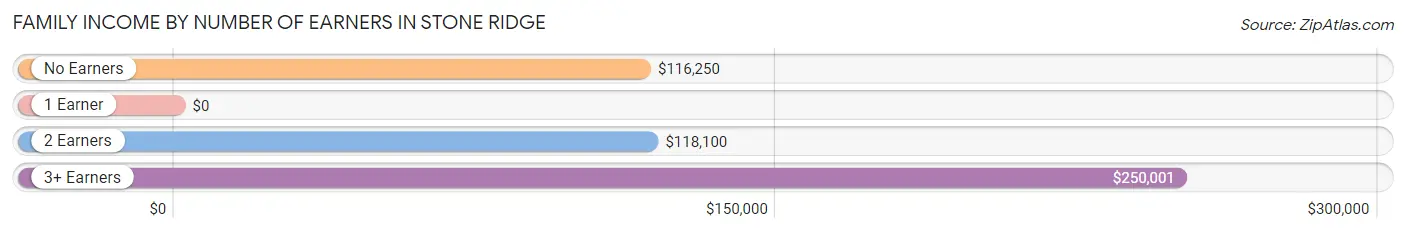
| Number of Earners | # Families | Median Income |
| No Earners | 98 (15.1%) | $116,250 |
| 1 Earner | 200 (30.9%) | $0 |
| 2 Earners | 306 (47.3%) | $118,100 |
| 3+ Earners | 43 (6.7%) | $250,001 |
| Total | 647 (100.0%) | $117,992 |
Household Income in Stone Ridge
Household Income Brackets in Stone Ridge
With 213 households falling in the category, the $100,000 to $149,999 income range is the most frequent in Stone Ridge, accounting for 29.1% of all households.
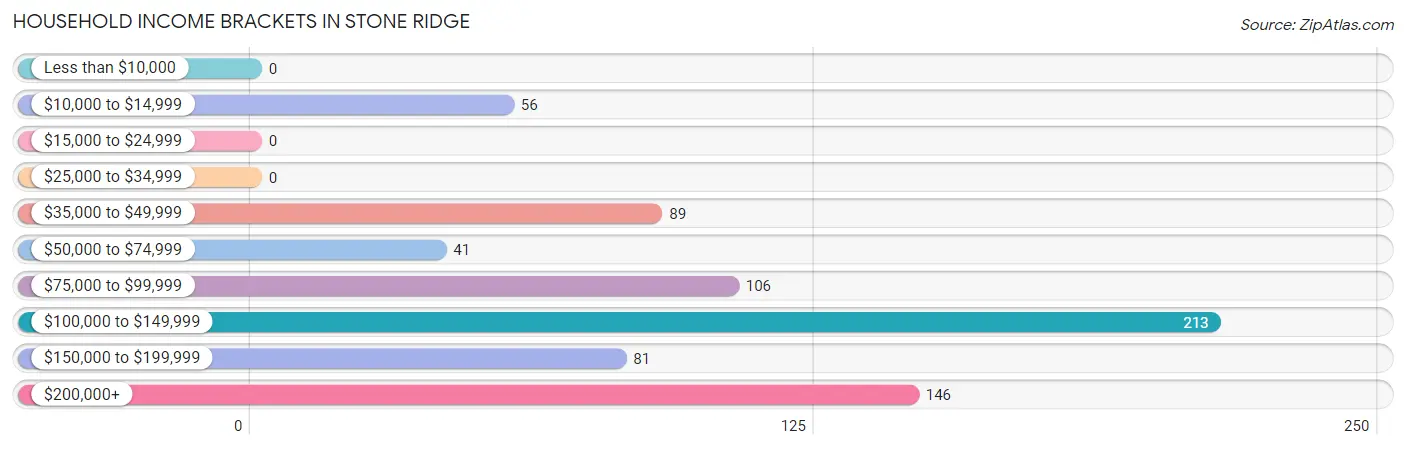
| Income Bracket | # Households | % Households |
| Less than $10,000 | 0 | 0.0% |
| $10,000 to $14,999 | 56 | 7.7% |
| $15,000 to $24,999 | 0 | 0.0% |
| $25,000 to $34,999 | 0 | 0.0% |
| $35,000 to $49,999 | 89 | 12.2% |
| $50,000 to $74,999 | 41 | 5.6% |
| $75,000 to $99,999 | 106 | 14.5% |
| $100,000 to $149,999 | 213 | 29.1% |
| $150,000 to $199,999 | 81 | 11.1% |
| $200,000+ | 146 | 19.9% |
Household Income by Householder Age in Stone Ridge
The median household income in Stone Ridge is $117,683, with the highest median household income of $171,198 found in the 45 to 64 years age bracket for the primary householder. A total of 249 households (34.0%) fall into this category.
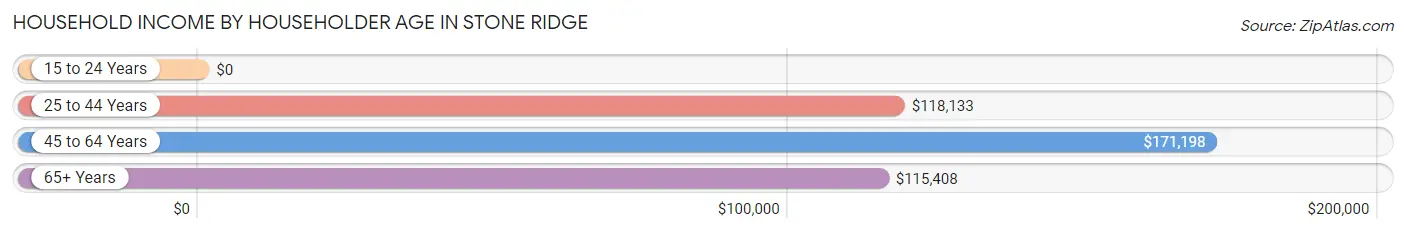
| Income Bracket | # Households | Median Income |
| 15 to 24 Years | 0 (0.0%) | $0 |
| 25 to 44 Years | 224 (30.6%) | $118,133 |
| 45 to 64 Years | 249 (34.0%) | $171,198 |
| 65+ Years | 259 (35.4%) | $115,408 |
| Total | 732 (100.0%) | $117,683 |
Poverty in Stone Ridge
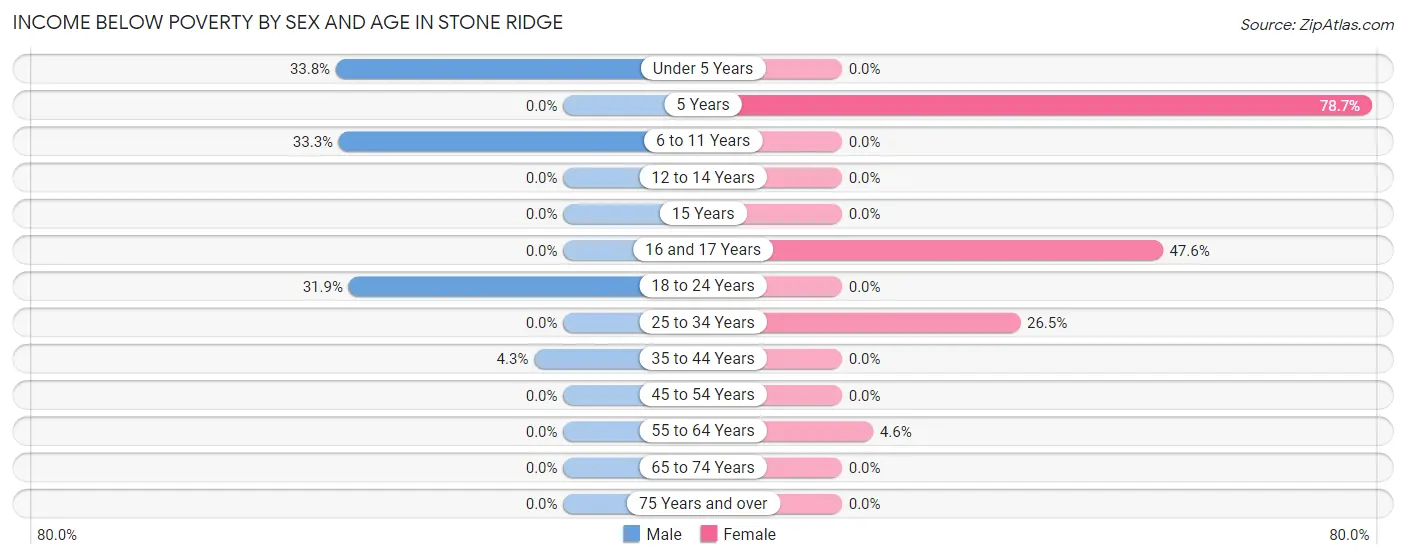
Income Below Poverty by Sex and Age in Stone Ridge
With 10.2% poverty level for males and 12.8% for females among the residents of Stone Ridge, under 5 year old males and 5 year old females are the most vulnerable to poverty, with 26 males (33.8%) and 37 females (78.7%) in their respective age groups living below the poverty level.
| Age Bracket | Male | Female |
| Under 5 Years | 26 (33.8%) | 0 (0.0%) |
| 5 Years | 0 (0.0%) | 37 (78.7%) |
| 6 to 11 Years | 41 (33.3%) | 0 (0.0%) |
| 12 to 14 Years | 0 (0.0%) | 0 (0.0%) |
| 15 Years | 0 (0.0%) | 0 (0.0%) |
| 16 and 17 Years | 0 (0.0%) | 20 (47.6%) |
| 18 to 24 Years | 29 (31.9%) | 0 (0.0%) |
| 25 to 34 Years | 0 (0.0%) | 54 (26.5%) |
| 35 to 44 Years | 7 (4.3%) | 0 (0.0%) |
| 45 to 54 Years | 0 (0.0%) | 0 (0.0%) |
| 55 to 64 Years | 0 (0.0%) | 3 (4.6%) |
| 65 to 74 Years | 0 (0.0%) | 0 (0.0%) |
| 75 Years and over | 0 (0.0%) | 0 (0.0%) |
| Total | 103 (10.2%) | 114 (12.8%) |
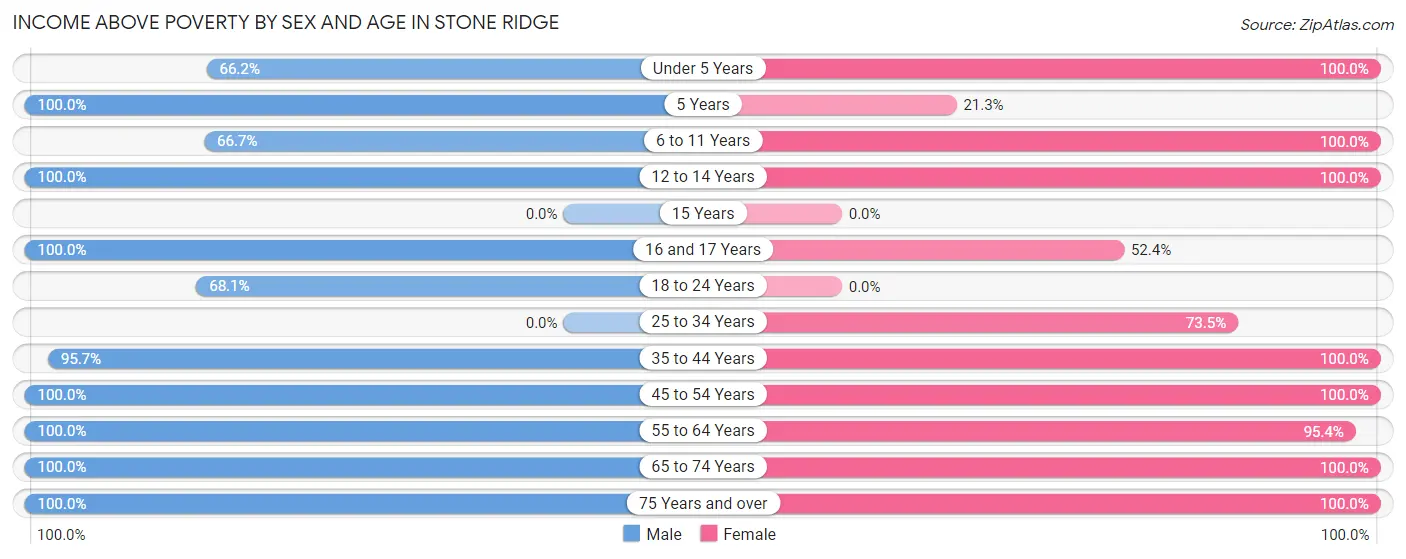
Income Above Poverty by Sex and Age in Stone Ridge
According to the poverty statistics in Stone Ridge, males aged 5 years and females aged under 5 years are the age groups that are most secure financially, with 100.0% of males and 100.0% of females in these age groups living above the poverty line.
| Age Bracket | Male | Female |
| Under 5 Years | 51 (66.2%) | 32 (100.0%) |
| 5 Years | 31 (100.0%) | 10 (21.3%) |
| 6 to 11 Years | 82 (66.7%) | 60 (100.0%) |
| 12 to 14 Years | 22 (100.0%) | 29 (100.0%) |
| 15 Years | 0 (0.0%) | 0 (0.0%) |
| 16 and 17 Years | 18 (100.0%) | 22 (52.4%) |
| 18 to 24 Years | 62 (68.1%) | 0 (0.0%) |
| 25 to 34 Years | 0 (0.0%) | 150 (73.5%) |
| 35 to 44 Years | 155 (95.7%) | 148 (100.0%) |
| 45 to 54 Years | 134 (100.0%) | 105 (100.0%) |
| 55 to 64 Years | 109 (100.0%) | 62 (95.4%) |
| 65 to 74 Years | 185 (100.0%) | 119 (100.0%) |
| 75 Years and over | 57 (100.0%) | 40 (100.0%) |
| Total | 906 (89.8%) | 777 (87.2%) |
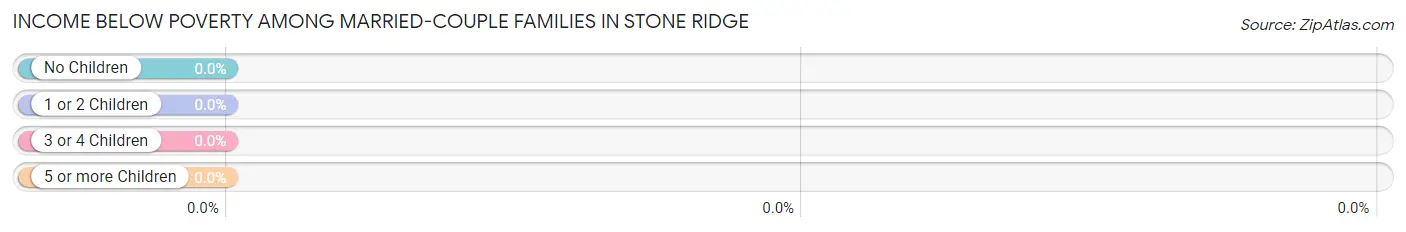
Income Below Poverty Among Married-Couple Families in Stone Ridge
| Children | Above Poverty | Below Poverty |
| No Children | 267 (100.0%) | 0 (0.0%) |
| 1 or 2 Children | 109 (100.0%) | 0 (0.0%) |
| 3 or 4 Children | 29 (100.0%) | 0 (0.0%) |
| 5 or more Children | 0 (0.0%) | 0 (0.0%) |
| Total | 405 (100.0%) | 0 (0.0%) |
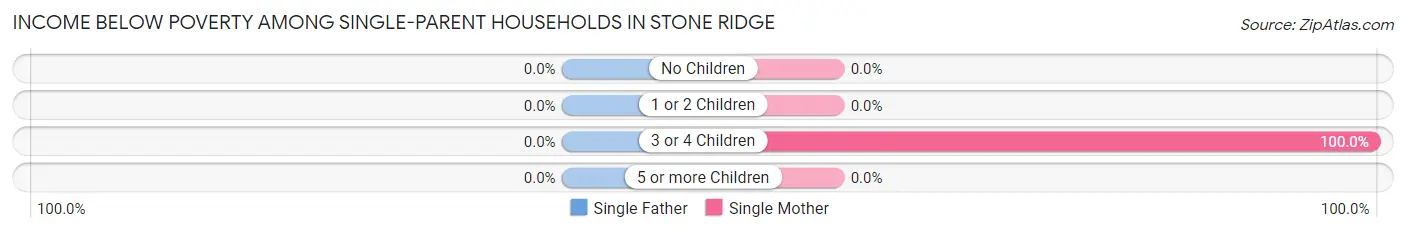
Income Below Poverty Among Single-Parent Households in Stone Ridge
| Children | Single Father | Single Mother |
| No Children | 0 (0.0%) | 0 (0.0%) |
| 1 or 2 Children | 0 (0.0%) | 0 (0.0%) |
| 3 or 4 Children | 0 (0.0%) | 49 (100.0%) |
| 5 or more Children | 0 (0.0%) | 0 (0.0%) |
| Total | 0 (0.0%) | 49 (24.6%) |
Income Below Poverty Among Married-Couple vs Single-Parent Households in Stone Ridge
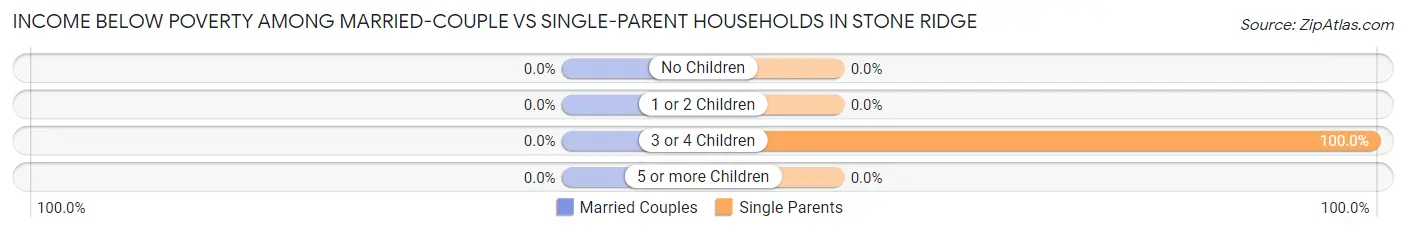
| Children | Married-Couple Families | Single-Parent Households |
| No Children | 0 (0.0%) | 0 (0.0%) |
| 1 or 2 Children | 0 (0.0%) | 0 (0.0%) |
| 3 or 4 Children | 0 (0.0%) | 49 (100.0%) |
| 5 or more Children | 0 (0.0%) | 0 (0.0%) |
| Total | 0 (0.0%) | 49 (20.3%) |
Employment Characteristics in Stone Ridge
Employment by Class of Employer in Stone Ridge
Among the 737 employed individuals in Stone Ridge, private company employees (298 | 40.4%), local government employees (211 | 28.6%), and not-for-profit organizations (76 | 10.3%) make up the most common classes of employment.
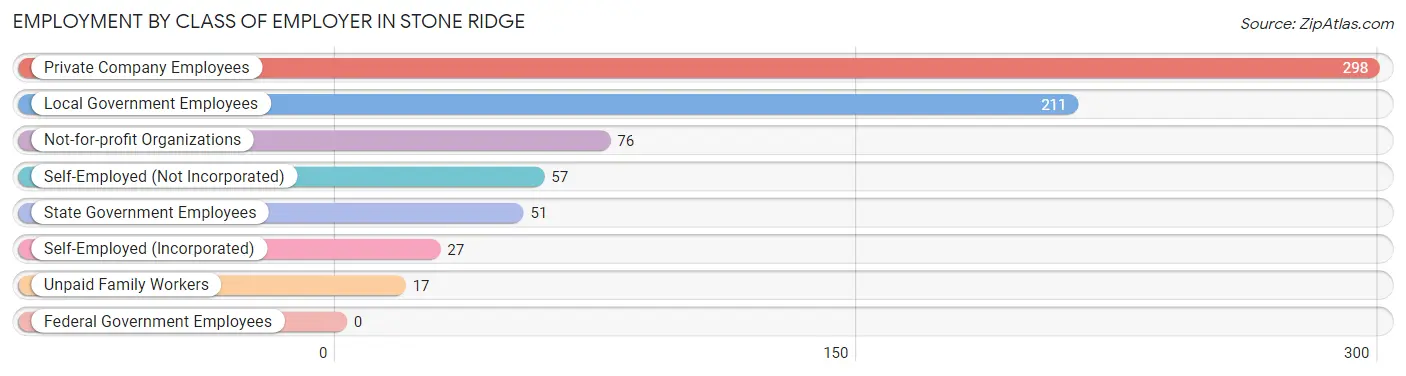
| Employer Class | # Employees | % Employees |
| Private Company Employees | 298 | 40.4% |
| Self-Employed (Incorporated) | 27 | 3.7% |
| Self-Employed (Not Incorporated) | 57 | 7.7% |
| Not-for-profit Organizations | 76 | 10.3% |
| Local Government Employees | 211 | 28.6% |
| State Government Employees | 51 | 6.9% |
| Federal Government Employees | 0 | 0.0% |
| Unpaid Family Workers | 17 | 2.3% |
| Total | 737 | 100.0% |
Employment Status by Age in Stone Ridge
According to the labor force statistics for Stone Ridge, out of the total population over 16 years of age (1,479), 55.3% or 818 individuals are in the labor force, with 7.6% or 62 of them unemployed. The age group with the highest labor force participation rate is 25 to 29 years, with 100.0% or 150 individuals in the labor force. Within the labor force, the 16 to 19 years age range has the highest percentage of unemployed individuals, with 100.0% or 1 of them being unemployed.
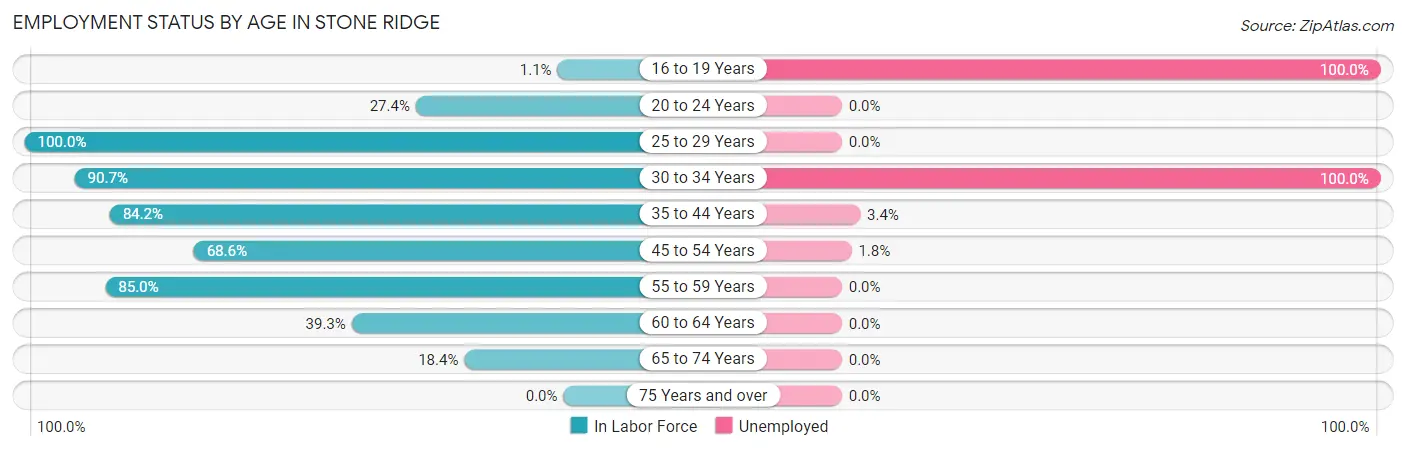
| Age Bracket | In Labor Force | Unemployed |
| 16 to 19 Years | 1 (1.1%) | 1 (100.0%) |
| 20 to 24 Years | 17 (27.4%) | 0 (0.0%) |
| 25 to 29 Years | 150 (100.0%) | 0 (0.0%) |
| 30 to 34 Years | 49 (90.7%) | 49 (100.0%) |
| 35 to 44 Years | 261 (84.2%) | 9 (3.4%) |
| 45 to 54 Years | 164 (68.6%) | 3 (1.8%) |
| 55 to 59 Years | 96 (85.0%) | 0 (0.0%) |
| 60 to 64 Years | 24 (39.3%) | 0 (0.0%) |
| 65 to 74 Years | 56 (18.4%) | 0 (0.0%) |
| 75 Years and over | 0 (0.0%) | 0 (0.0%) |
| Total | 818 (55.3%) | 62 (7.6%) |
Employment Status by Educational Attainment in Stone Ridge
According to labor force statistics for Stone Ridge, 80.3% of individuals (744) out of the total population between 25 and 64 years of age (927) are in the labor force, with 8.2% or 61 of them being unemployed. The group with the highest labor force participation rate are those with the educational attainment of high school diploma, with 84.8% or 28 individuals in the labor force. Within the labor force, individuals with college / associate degree education have the highest percentage of unemployment, with 48.5% or 49 of them being unemployed.
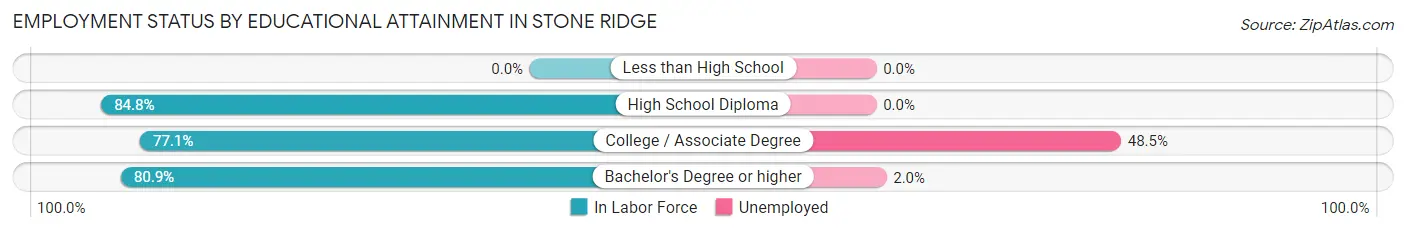
| Educational Attainment | In Labor Force | Unemployed |
| Less than High School | 0 (0.0%) | 0 (0.0%) |
| High School Diploma | 28 (84.8%) | 0 (0.0%) |
| College / Associate Degree | 101 (77.1%) | 64 (48.5%) |
| Bachelor's Degree or higher | 615 (80.9%) | 15 (2.0%) |
| Total | 744 (80.3%) | 76 (8.2%) |
Employment Occupations by Sex in Stone Ridge
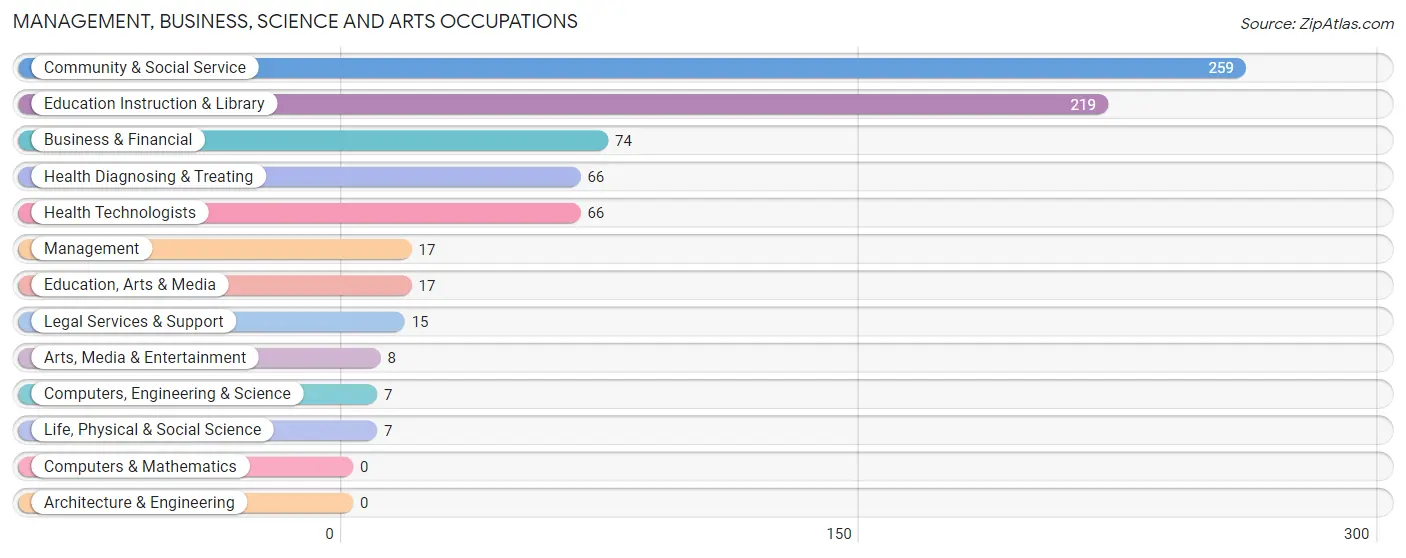
Management, Business, Science and Arts Occupations
The most common Management, Business, Science and Arts occupations in Stone Ridge are Community & Social Service (259 | 34.3%), Education Instruction & Library (219 | 29.0%), Business & Financial (74 | 9.8%), Health Diagnosing & Treating (66 | 8.7%), and Health Technologists (66 | 8.7%).
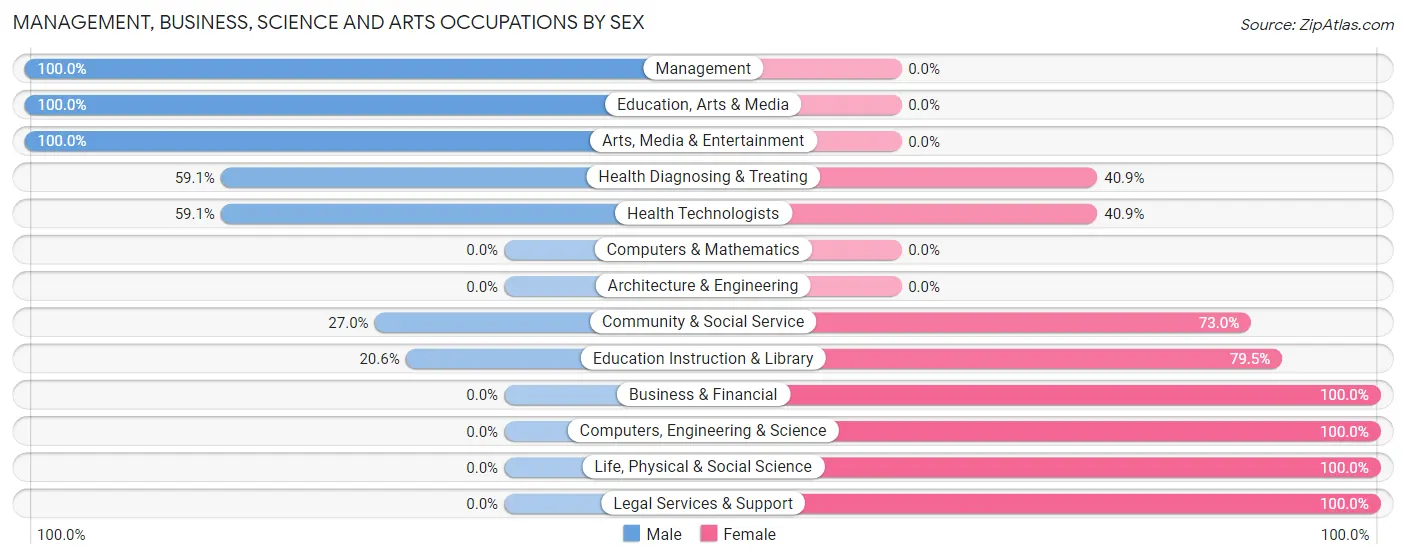
Management, Business, Science and Arts Occupations by Sex
Within the Management, Business, Science and Arts occupations in Stone Ridge, the most male-oriented occupations are Management (100.0%), Education, Arts & Media (100.0%), and Arts, Media & Entertainment (100.0%), while the most female-oriented occupations are Business & Financial (100.0%), Computers, Engineering & Science (100.0%), and Life, Physical & Social Science (100.0%).
| Occupation | Male | Female |
| Management | 17 (100.0%) | 0 (0.0%) |
| Business & Financial | 0 (0.0%) | 74 (100.0%) |
| Computers, Engineering & Science | 0 (0.0%) | 7 (100.0%) |
| Computers & Mathematics | 0 (0.0%) | 0 (0.0%) |
| Architecture & Engineering | 0 (0.0%) | 0 (0.0%) |
| Life, Physical & Social Science | 0 (0.0%) | 7 (100.0%) |
| Community & Social Service | 70 (27.0%) | 189 (73.0%) |
| Education, Arts & Media | 17 (100.0%) | 0 (0.0%) |
| Legal Services & Support | 0 (0.0%) | 15 (100.0%) |
| Education Instruction & Library | 45 (20.5%) | 174 (79.4%) |
| Arts, Media & Entertainment | 8 (100.0%) | 0 (0.0%) |
| Health Diagnosing & Treating | 39 (59.1%) | 27 (40.9%) |
| Health Technologists | 39 (59.1%) | 27 (40.9%) |
| Total (Category) | 126 (29.8%) | 297 (70.2%) |
| Total (Overall) | 413 (54.6%) | 343 (45.4%) |
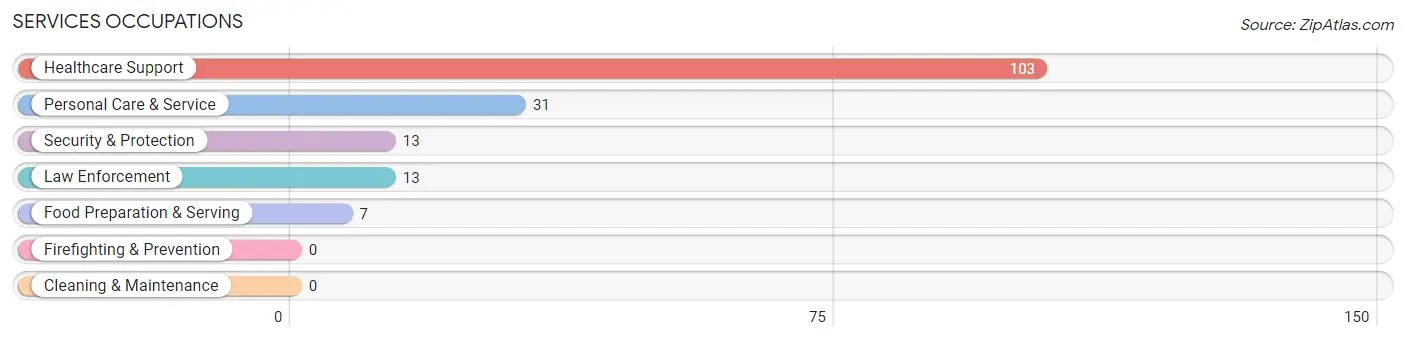
Services Occupations
The most common Services occupations in Stone Ridge are Healthcare Support (103 | 13.6%), Personal Care & Service (31 | 4.1%), Security & Protection (13 | 1.7%), Law Enforcement (13 | 1.7%), and Food Preparation & Serving (7 | 0.9%).
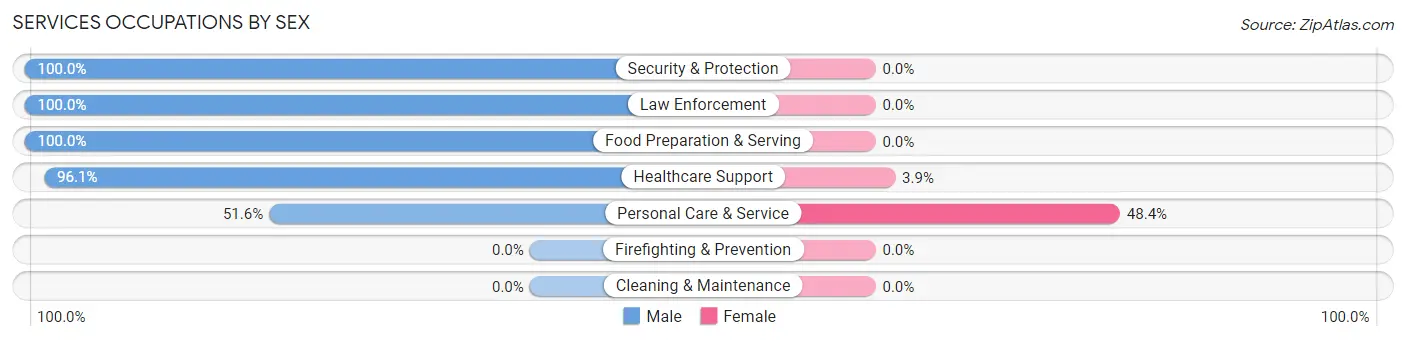
Services Occupations by Sex
Within the Services occupations in Stone Ridge, the most male-oriented occupations are Security & Protection (100.0%), Law Enforcement (100.0%), and Food Preparation & Serving (100.0%), while the most female-oriented occupations are Personal Care & Service (48.4%), and Healthcare Support (3.9%).
| Occupation | Male | Female |
| Healthcare Support | 99 (96.1%) | 4 (3.9%) |
| Security & Protection | 13 (100.0%) | 0 (0.0%) |
| Firefighting & Prevention | 0 (0.0%) | 0 (0.0%) |
| Law Enforcement | 13 (100.0%) | 0 (0.0%) |
| Food Preparation & Serving | 7 (100.0%) | 0 (0.0%) |
| Cleaning & Maintenance | 0 (0.0%) | 0 (0.0%) |
| Personal Care & Service | 16 (51.6%) | 15 (48.4%) |
| Total (Category) | 135 (87.7%) | 19 (12.3%) |
| Total (Overall) | 413 (54.6%) | 343 (45.4%) |
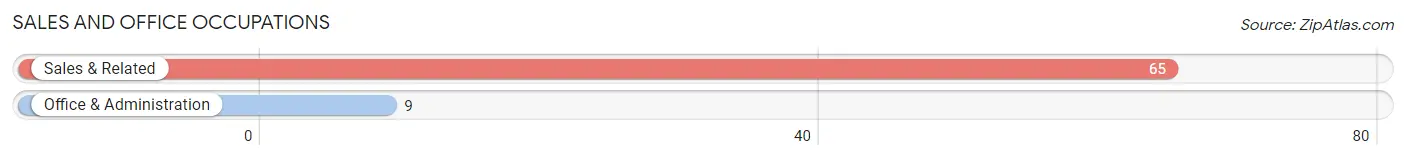
Sales and Office Occupations
The most common Sales and Office occupations in Stone Ridge are Sales & Related (65 | 8.6%), and Office & Administration (9 | 1.2%).
Sales and Office Occupations by Sex
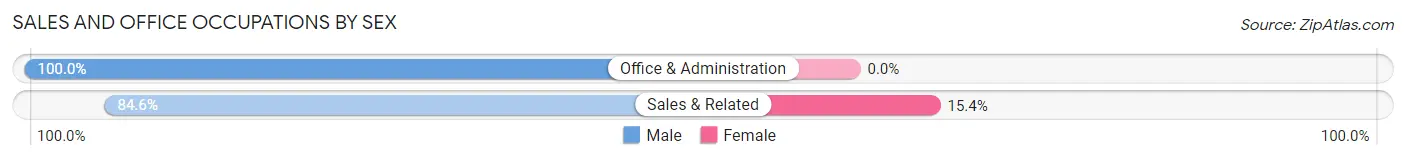
| Occupation | Male | Female |
| Sales & Related | 55 (84.6%) | 10 (15.4%) |
| Office & Administration | 9 (100.0%) | 0 (0.0%) |
| Total (Category) | 64 (86.5%) | 10 (13.5%) |
| Total (Overall) | 413 (54.6%) | 343 (45.4%) |
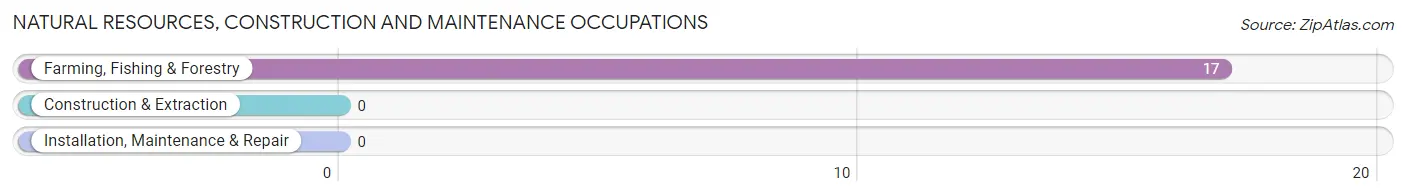
Natural Resources, Construction and Maintenance Occupations
The most common Natural Resources, Construction and Maintenance occupations in Stone Ridge are , and Farming, Fishing & Forestry (17 | 2.2%).
Natural Resources, Construction and Maintenance Occupations by Sex
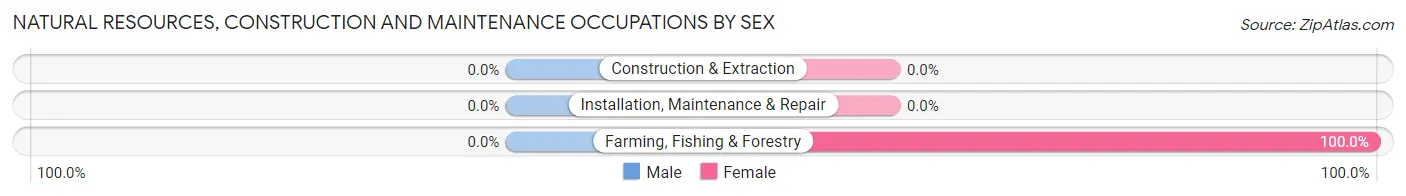
| Occupation | Male | Female |
| Farming, Fishing & Forestry | 0 (0.0%) | 17 (100.0%) |
| Construction & Extraction | 0 (0.0%) | 0 (0.0%) |
| Installation, Maintenance & Repair | 0 (0.0%) | 0 (0.0%) |
| Total (Category) | 0 (0.0%) | 17 (100.0%) |
| Total (Overall) | 413 (54.6%) | 343 (45.4%) |
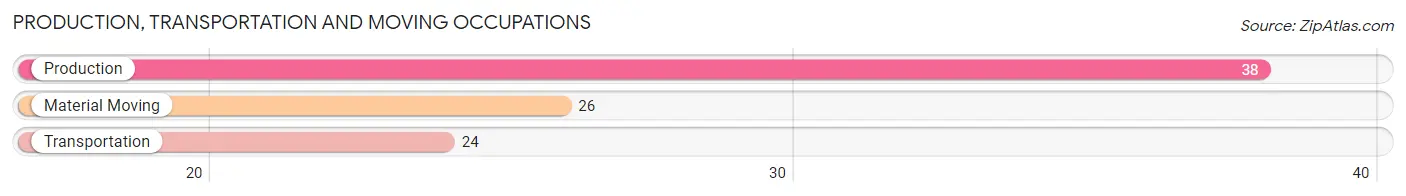
Production, Transportation and Moving Occupations
The most common Production, Transportation and Moving occupations in Stone Ridge are Production (38 | 5.0%), Material Moving (26 | 3.4%), and Transportation (24 | 3.2%).
Production, Transportation and Moving Occupations by Sex
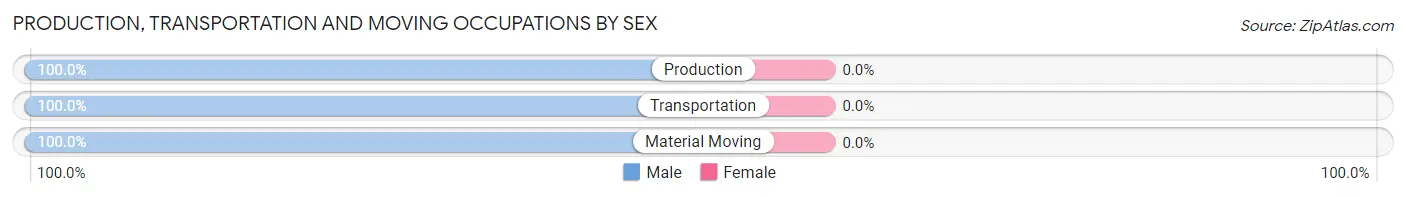
| Occupation | Male | Female |
| Production | 38 (100.0%) | 0 (0.0%) |
| Transportation | 24 (100.0%) | 0 (0.0%) |
| Material Moving | 26 (100.0%) | 0 (0.0%) |
| Total (Category) | 88 (100.0%) | 0 (0.0%) |
| Total (Overall) | 413 (54.6%) | 343 (45.4%) |
Employment Industries by Sex in Stone Ridge
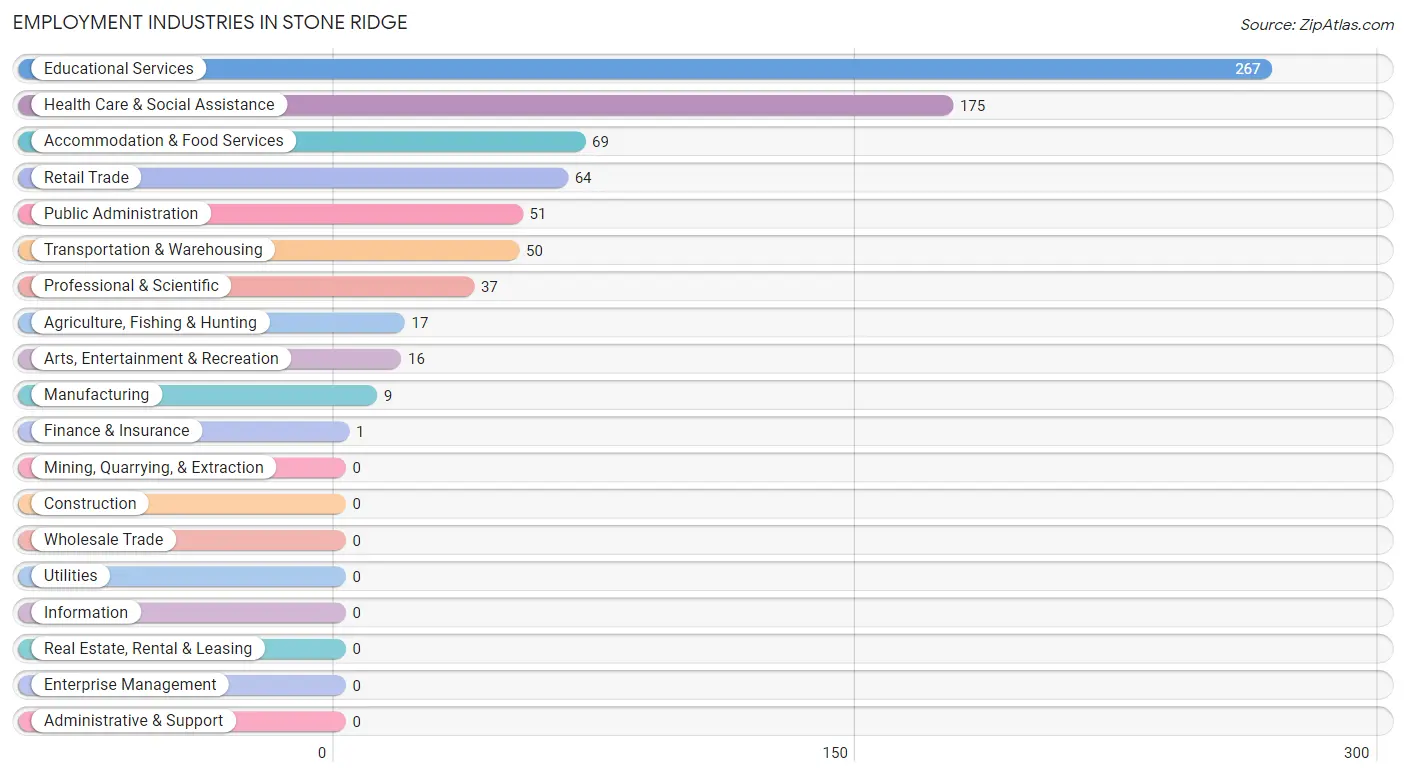
Employment Industries in Stone Ridge
The major employment industries in Stone Ridge include Educational Services (267 | 35.3%), Health Care & Social Assistance (175 | 23.2%), Accommodation & Food Services (69 | 9.1%), Retail Trade (64 | 8.5%), and Public Administration (51 | 6.8%).
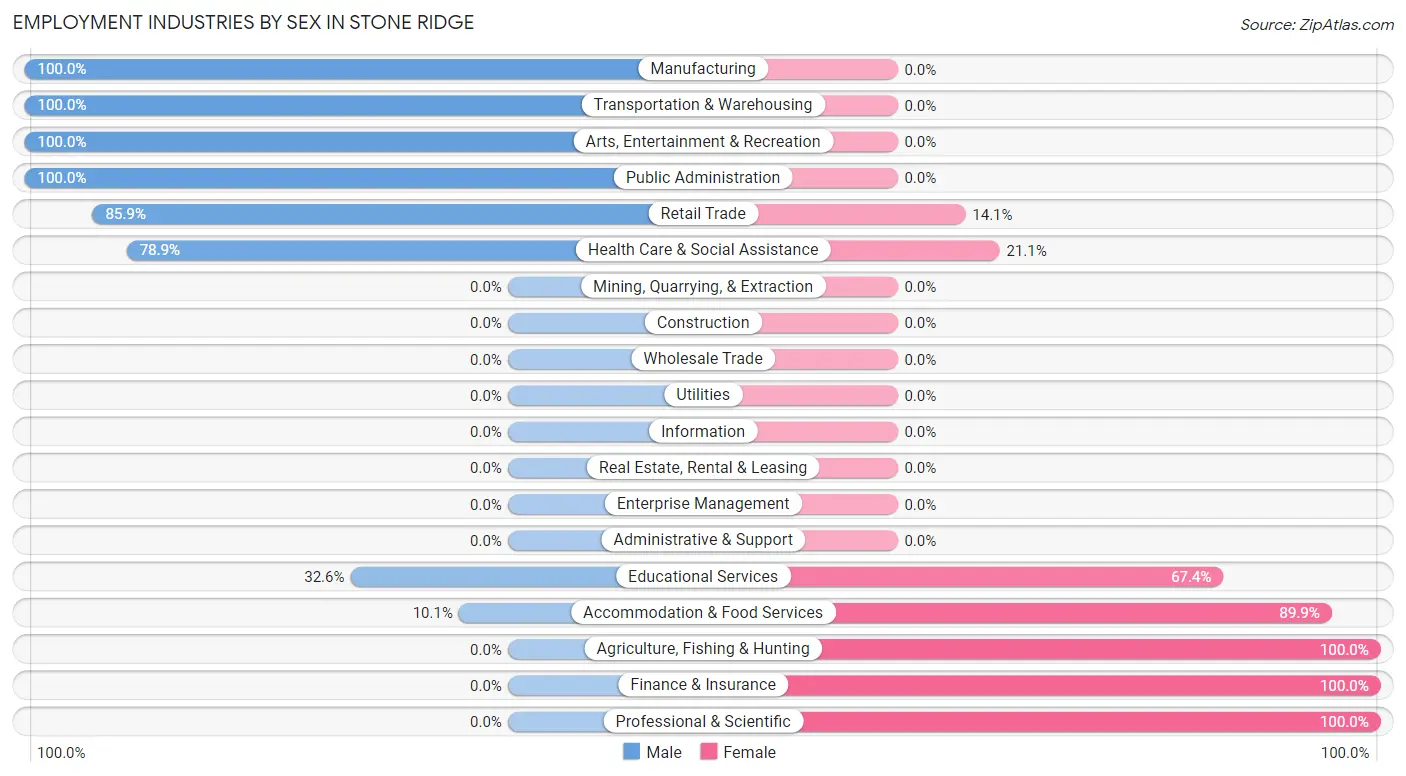
Employment Industries by Sex in Stone Ridge
The Stone Ridge industries that see more men than women are Manufacturing (100.0%), Transportation & Warehousing (100.0%), and Arts, Entertainment & Recreation (100.0%), whereas the industries that tend to have a higher number of women are Agriculture, Fishing & Hunting (100.0%), Finance & Insurance (100.0%), and Professional & Scientific (100.0%).
| Industry | Male | Female |
| Agriculture, Fishing & Hunting | 0 (0.0%) | 17 (100.0%) |
| Mining, Quarrying, & Extraction | 0 (0.0%) | 0 (0.0%) |
| Construction | 0 (0.0%) | 0 (0.0%) |
| Manufacturing | 9 (100.0%) | 0 (0.0%) |
| Wholesale Trade | 0 (0.0%) | 0 (0.0%) |
| Retail Trade | 55 (85.9%) | 9 (14.1%) |
| Transportation & Warehousing | 50 (100.0%) | 0 (0.0%) |
| Utilities | 0 (0.0%) | 0 (0.0%) |
| Information | 0 (0.0%) | 0 (0.0%) |
| Finance & Insurance | 0 (0.0%) | 1 (100.0%) |
| Real Estate, Rental & Leasing | 0 (0.0%) | 0 (0.0%) |
| Professional & Scientific | 0 (0.0%) | 37 (100.0%) |
| Enterprise Management | 0 (0.0%) | 0 (0.0%) |
| Administrative & Support | 0 (0.0%) | 0 (0.0%) |
| Educational Services | 87 (32.6%) | 180 (67.4%) |
| Health Care & Social Assistance | 138 (78.9%) | 37 (21.1%) |
| Arts, Entertainment & Recreation | 16 (100.0%) | 0 (0.0%) |
| Accommodation & Food Services | 7 (10.1%) | 62 (89.9%) |
| Public Administration | 51 (100.0%) | 0 (0.0%) |
| Total | 413 (54.6%) | 343 (45.4%) |
Education in Stone Ridge
School Enrollment in Stone Ridge
The most common levels of schooling among the 497 students in Stone Ridge are elementary school (142 | 28.6%), middle school (92 | 18.5%), and college / undergraduate (91 | 18.3%).
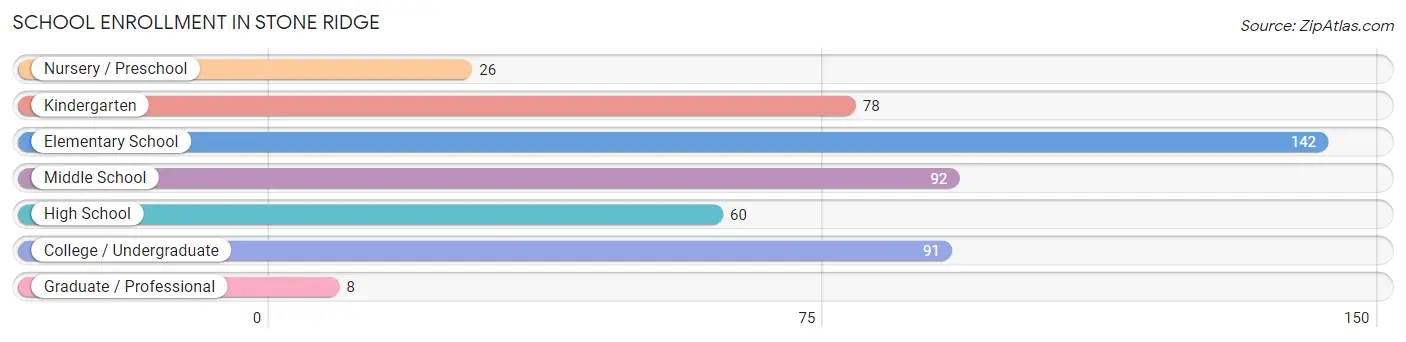
| School Level | # Students | % Students |
| Nursery / Preschool | 26 | 5.2% |
| Kindergarten | 78 | 15.7% |
| Elementary School | 142 | 28.6% |
| Middle School | 92 | 18.5% |
| High School | 60 | 12.1% |
| College / Undergraduate | 91 | 18.3% |
| Graduate / Professional | 8 | 1.6% |
| Total | 497 | 100.0% |
School Enrollment by Age by Funding Source in Stone Ridge
Out of a total of 497 students who are enrolled in schools in Stone Ridge, 145 (29.2%) attend a private institution, while the remaining 352 (70.8%) are enrolled in public schools. The age group of 3 to 4 year olds has the highest likelihood of being enrolled in private schools, with 26 (100.0% in the age bracket) enrolled. Conversely, the age group of 15 to 17 year olds has the lowest likelihood of being enrolled in a private school, with 60 (100.0% in the age bracket) attending a public institution.
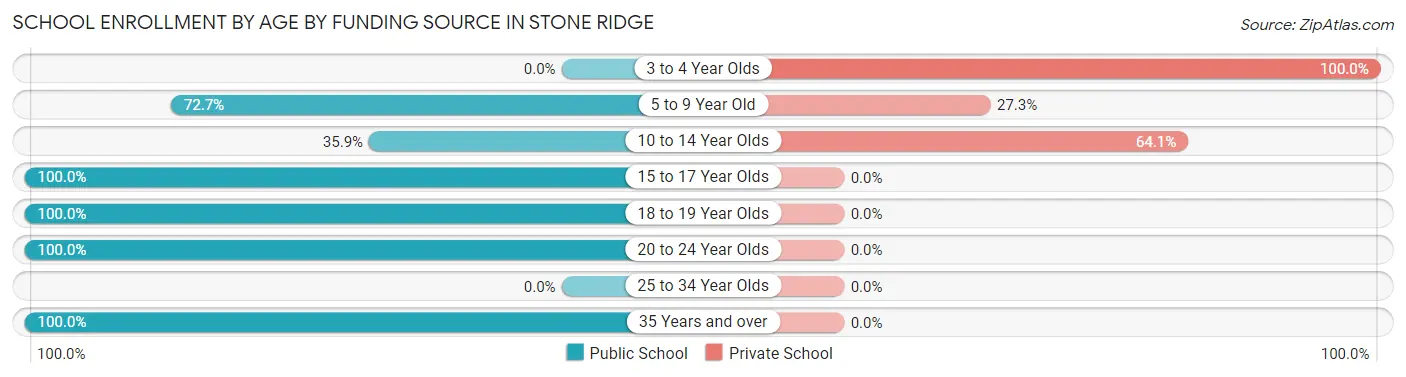
| Age Bracket | Public School | Private School |
| 3 to 4 Year Olds | 0 (0.0%) | 26 (100.0%) |
| 5 to 9 Year Old | 160 (72.7%) | 60 (27.3%) |
| 10 to 14 Year Olds | 33 (35.9%) | 59 (64.1%) |
| 15 to 17 Year Olds | 60 (100.0%) | 0 (0.0%) |
| 18 to 19 Year Olds | 29 (100.0%) | 0 (0.0%) |
| 20 to 24 Year Olds | 45 (100.0%) | 0 (0.0%) |
| 25 to 34 Year Olds | 0 (0.0%) | 0 (0.0%) |
| 35 Years and over | 25 (100.0%) | 0 (0.0%) |
| Total | 352 (70.8%) | 145 (29.2%) |
Educational Attainment by Field of Study in Stone Ridge
Literature & languages (241 | 21.4%), business (222 | 19.8%), education (122 | 10.8%), social sciences (90 | 8.0%), and psychology (88 | 7.8%) are the most common fields of study among 1,124 individuals in Stone Ridge who have obtained a bachelor's degree or higher.
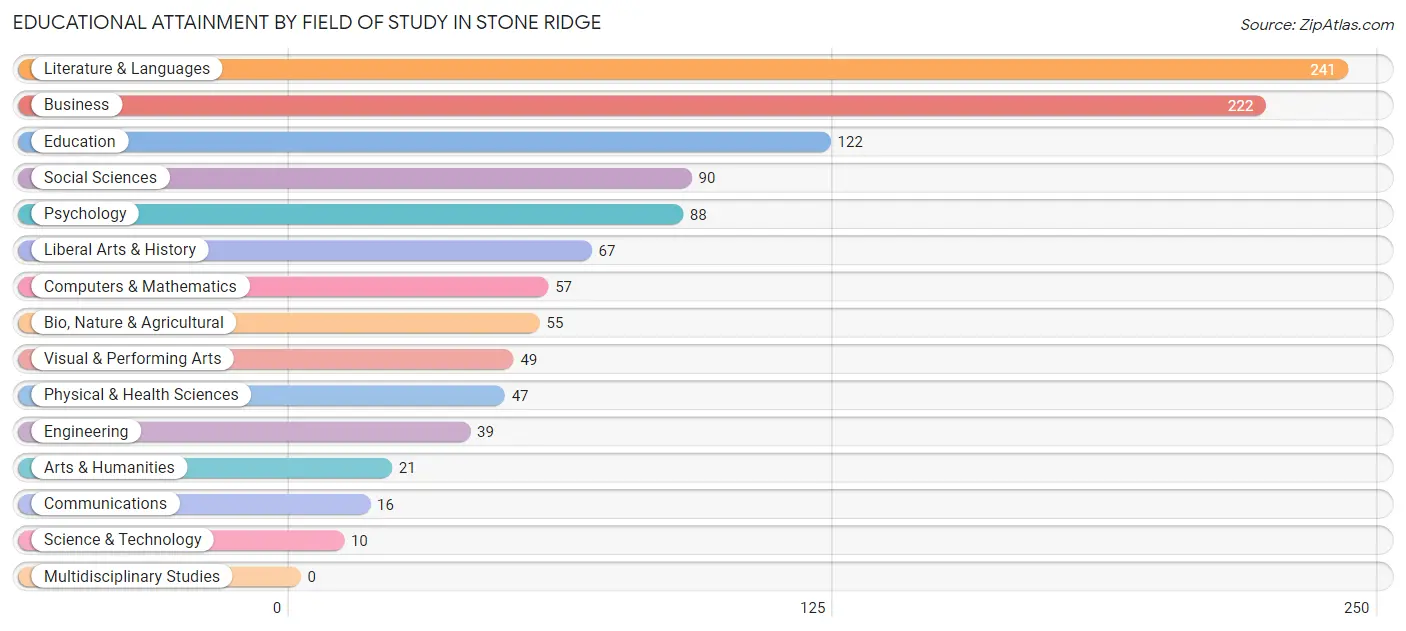
| Field of Study | # Graduates | % Graduates |
| Computers & Mathematics | 57 | 5.1% |
| Bio, Nature & Agricultural | 55 | 4.9% |
| Physical & Health Sciences | 47 | 4.2% |
| Psychology | 88 | 7.8% |
| Social Sciences | 90 | 8.0% |
| Engineering | 39 | 3.5% |
| Multidisciplinary Studies | 0 | 0.0% |
| Science & Technology | 10 | 0.9% |
| Business | 222 | 19.8% |
| Education | 122 | 10.8% |
| Literature & Languages | 241 | 21.4% |
| Liberal Arts & History | 67 | 6.0% |
| Visual & Performing Arts | 49 | 4.4% |
| Communications | 16 | 1.4% |
| Arts & Humanities | 21 | 1.9% |
| Total | 1,124 | 100.0% |
Transportation & Commute in Stone Ridge
Vehicle Availability by Sex in Stone Ridge
The most prevalent vehicle ownership categories in Stone Ridge are males with 2 vehicles (237, accounting for 57.4%) and females with 2 vehicles (203, making up 73.2%).
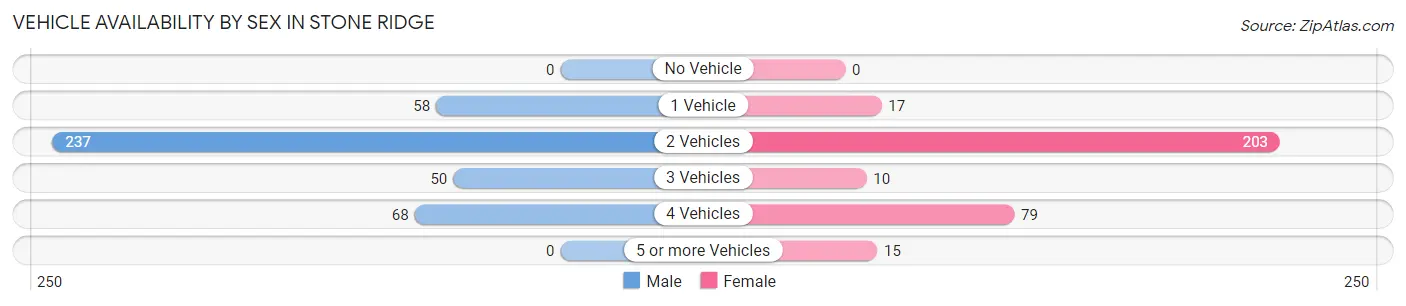
| Vehicles Available | Male | Female |
| No Vehicle | 0 (0.0%) | 0 (0.0%) |
| 1 Vehicle | 58 (14.0%) | 17 (5.2%) |
| 2 Vehicles | 237 (57.4%) | 203 (62.6%) |
| 3 Vehicles | 50 (12.1%) | 10 (3.1%) |
| 4 Vehicles | 68 (16.5%) | 79 (24.4%) |
| 5 or more Vehicles | 0 (0.0%) | 15 (4.6%) |
| Total | 413 (100.0%) | 324 (100.0%) |
Commute Time in Stone Ridge
The most frequently occuring commute durations in Stone Ridge are 25 to 29 minutes (117 commuters, 29.5%), 20 to 24 minutes (90 commuters, 22.7%), and 10 to 14 minutes (53 commuters, 13.4%).
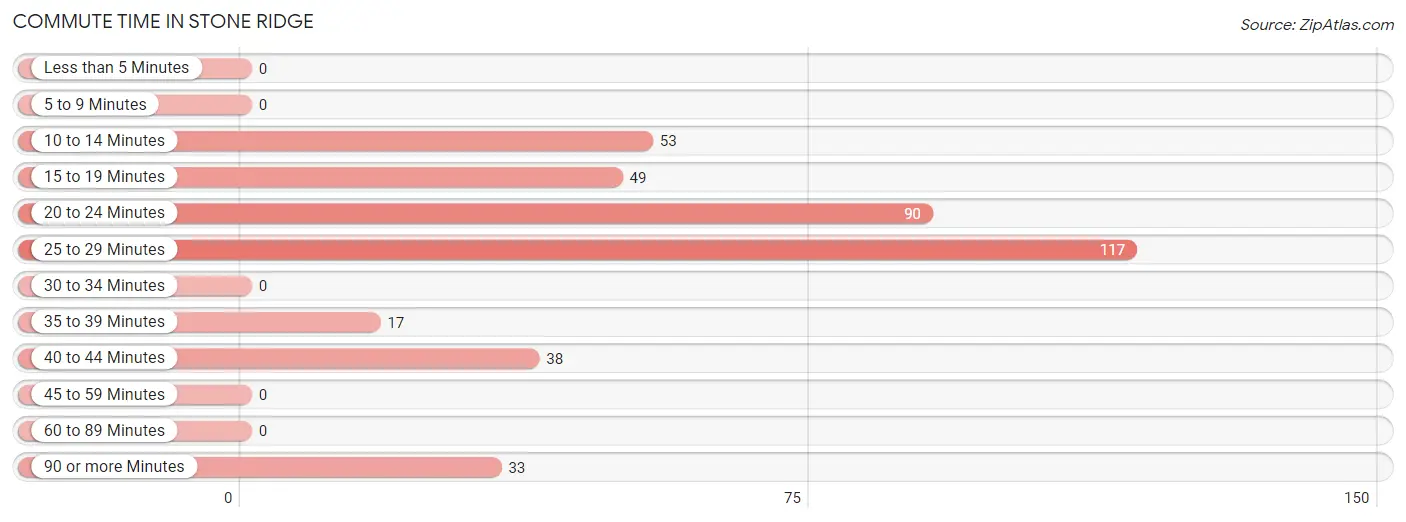
| Commute Time | # Commuters | % Commuters |
| Less than 5 Minutes | 0 | 0.0% |
| 5 to 9 Minutes | 0 | 0.0% |
| 10 to 14 Minutes | 53 | 13.4% |
| 15 to 19 Minutes | 49 | 12.3% |
| 20 to 24 Minutes | 90 | 22.7% |
| 25 to 29 Minutes | 117 | 29.5% |
| 30 to 34 Minutes | 0 | 0.0% |
| 35 to 39 Minutes | 17 | 4.3% |
| 40 to 44 Minutes | 38 | 9.6% |
| 45 to 59 Minutes | 0 | 0.0% |
| 60 to 89 Minutes | 0 | 0.0% |
| 90 or more Minutes | 33 | 8.3% |
Commute Time by Sex in Stone Ridge
The most common commute times in Stone Ridge are 20 to 24 minutes (81 commuters, 30.6%) for males and 25 to 29 minutes (62 commuters, 47.0%) for females.
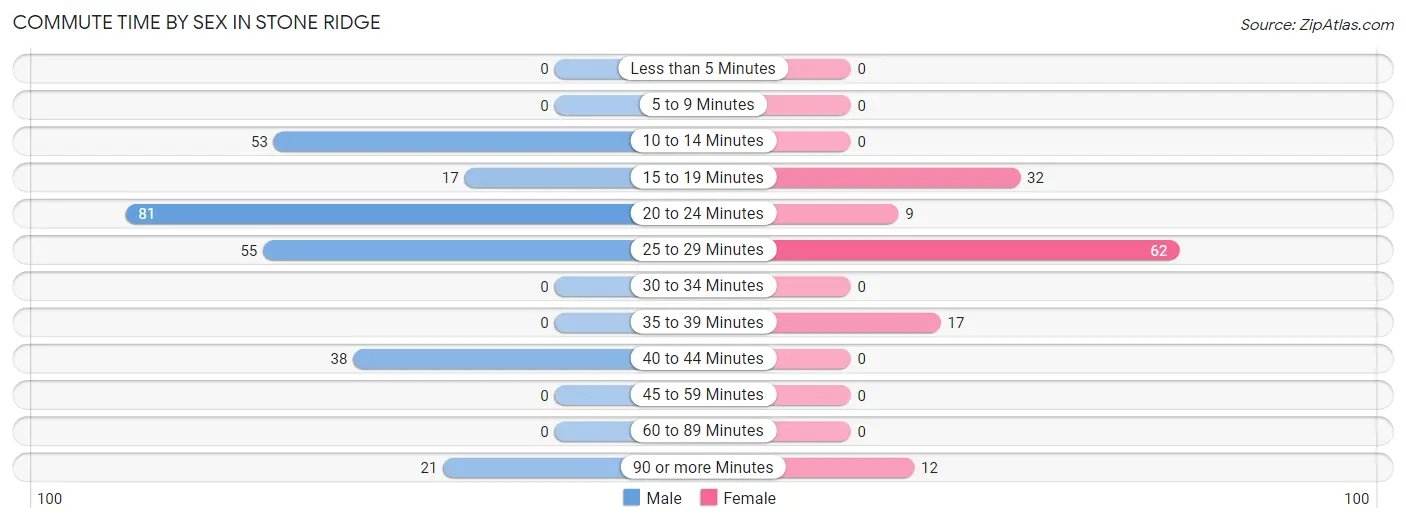
| Commute Time | Male | Female |
| Less than 5 Minutes | 0 (0.0%) | 0 (0.0%) |
| 5 to 9 Minutes | 0 (0.0%) | 0 (0.0%) |
| 10 to 14 Minutes | 53 (20.0%) | 0 (0.0%) |
| 15 to 19 Minutes | 17 (6.4%) | 32 (24.2%) |
| 20 to 24 Minutes | 81 (30.6%) | 9 (6.8%) |
| 25 to 29 Minutes | 55 (20.7%) | 62 (47.0%) |
| 30 to 34 Minutes | 0 (0.0%) | 0 (0.0%) |
| 35 to 39 Minutes | 0 (0.0%) | 17 (12.9%) |
| 40 to 44 Minutes | 38 (14.3%) | 0 (0.0%) |
| 45 to 59 Minutes | 0 (0.0%) | 0 (0.0%) |
| 60 to 89 Minutes | 0 (0.0%) | 0 (0.0%) |
| 90 or more Minutes | 21 (7.9%) | 12 (9.1%) |
Time of Departure to Work by Sex in Stone Ridge
The most frequent times of departure to work in Stone Ridge are 12:00 PM to 3:59 PM (62, 23.4%) for males and 8:30 AM to 8:59 AM (74, 56.1%) for females.
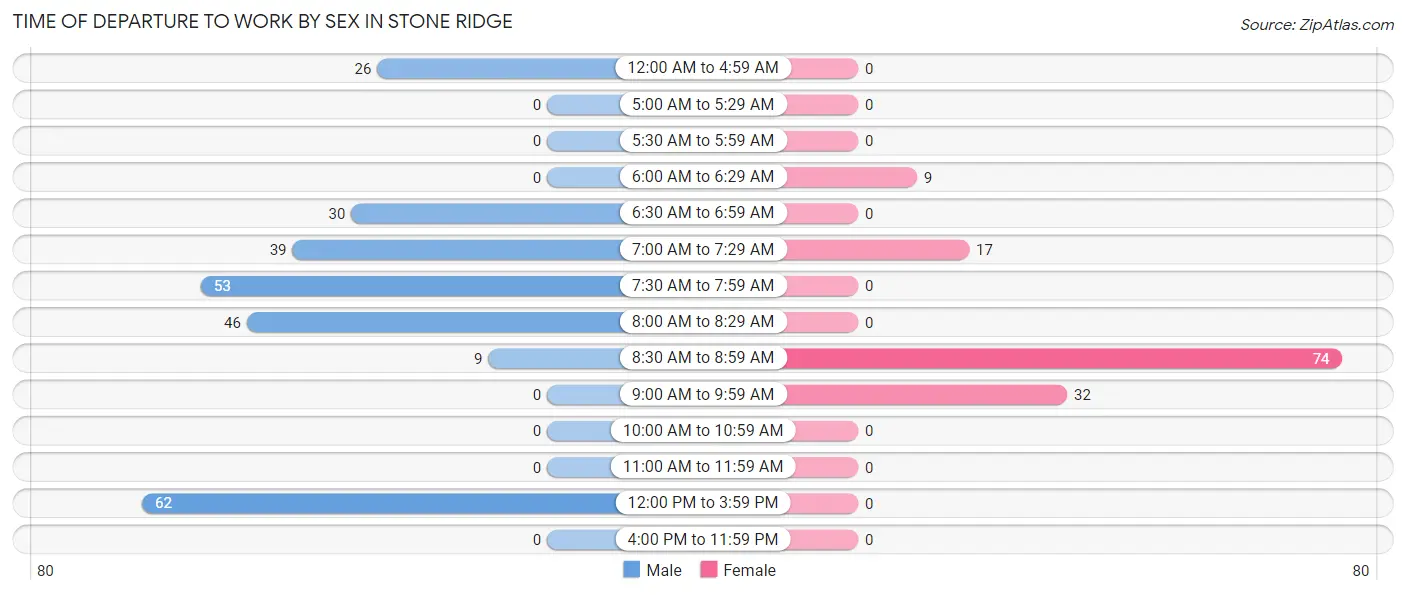
| Time of Departure | Male | Female |
| 12:00 AM to 4:59 AM | 26 (9.8%) | 0 (0.0%) |
| 5:00 AM to 5:29 AM | 0 (0.0%) | 0 (0.0%) |
| 5:30 AM to 5:59 AM | 0 (0.0%) | 0 (0.0%) |
| 6:00 AM to 6:29 AM | 0 (0.0%) | 9 (6.8%) |
| 6:30 AM to 6:59 AM | 30 (11.3%) | 0 (0.0%) |
| 7:00 AM to 7:29 AM | 39 (14.7%) | 17 (12.9%) |
| 7:30 AM to 7:59 AM | 53 (20.0%) | 0 (0.0%) |
| 8:00 AM to 8:29 AM | 46 (17.4%) | 0 (0.0%) |
| 8:30 AM to 8:59 AM | 9 (3.4%) | 74 (56.1%) |
| 9:00 AM to 9:59 AM | 0 (0.0%) | 32 (24.2%) |
| 10:00 AM to 10:59 AM | 0 (0.0%) | 0 (0.0%) |
| 11:00 AM to 11:59 AM | 0 (0.0%) | 0 (0.0%) |
| 12:00 PM to 3:59 PM | 62 (23.4%) | 0 (0.0%) |
| 4:00 PM to 11:59 PM | 0 (0.0%) | 0 (0.0%) |
| Total | 265 (100.0%) | 132 (100.0%) |
Housing Occupancy in Stone Ridge
Occupancy by Ownership in Stone Ridge
Of the total 732 dwellings in Stone Ridge, owner-occupied units account for 676 (92.3%), while renter-occupied units make up 56 (7.6%).
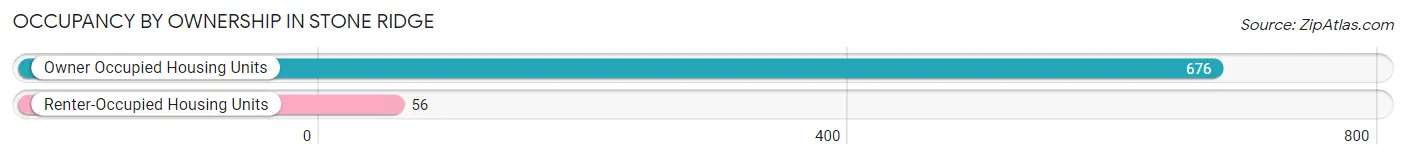
| Occupancy | # Housing Units | % Housing Units |
| Owner Occupied Housing Units | 676 | 92.3% |
| Renter-Occupied Housing Units | 56 | 7.6% |
| Total Occupied Housing Units | 732 | 100.0% |
Occupancy by Household Size in Stone Ridge
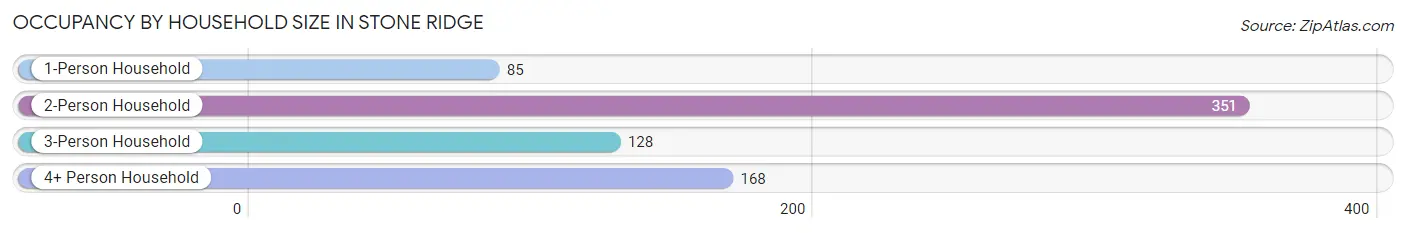
| Household Size | # Housing Units | % Housing Units |
| 1-Person Household | 85 | 11.6% |
| 2-Person Household | 351 | 47.9% |
| 3-Person Household | 128 | 17.5% |
| 4+ Person Household | 168 | 23.0% |
| Total Housing Units | 732 | 100.0% |
Occupancy by Ownership by Household Size in Stone Ridge
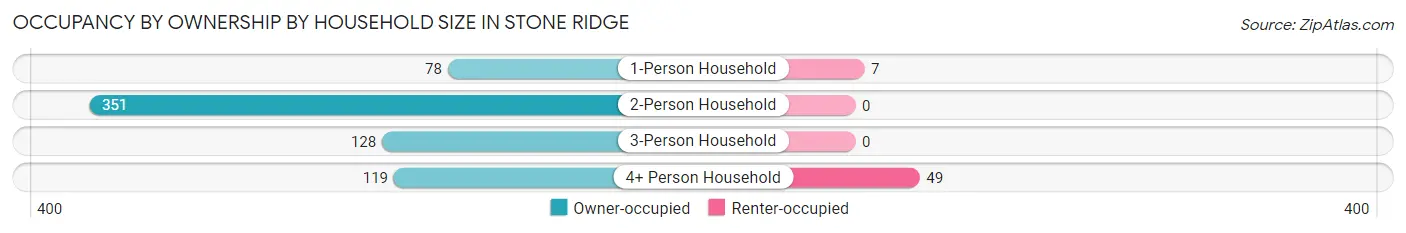
| Household Size | Owner-occupied | Renter-occupied |
| 1-Person Household | 78 (91.8%) | 7 (8.2%) |
| 2-Person Household | 351 (100.0%) | 0 (0.0%) |
| 3-Person Household | 128 (100.0%) | 0 (0.0%) |
| 4+ Person Household | 119 (70.8%) | 49 (29.2%) |
| Total Housing Units | 676 (92.3%) | 56 (7.6%) |
Occupancy by Educational Attainment in Stone Ridge
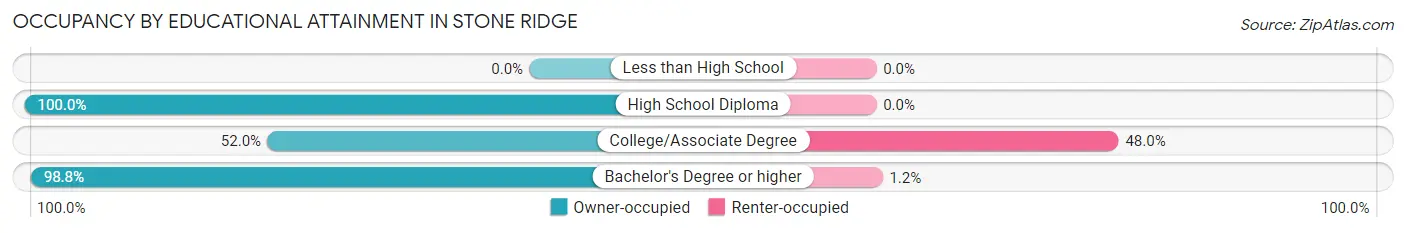
| Household Size | Owner-occupied | Renter-occupied |
| Less than High School | 0 (0.0%) | 0 (0.0%) |
| High School Diploma | 67 (100.0%) | 0 (0.0%) |
| College/Associate Degree | 53 (52.0%) | 49 (48.0%) |
| Bachelor's Degree or higher | 556 (98.8%) | 7 (1.2%) |
Occupancy by Age of Householder in Stone Ridge
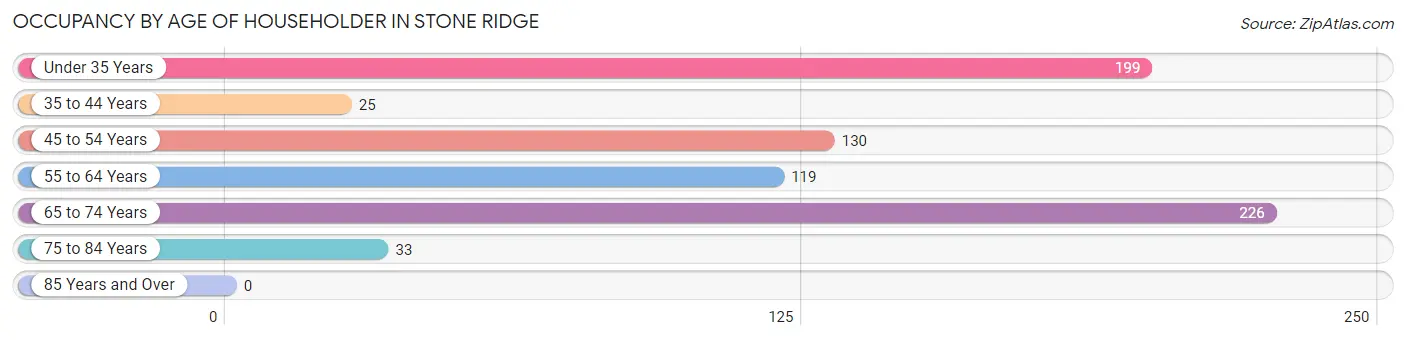
| Age Bracket | # Households | % Households |
| Under 35 Years | 199 | 27.2% |
| 35 to 44 Years | 25 | 3.4% |
| 45 to 54 Years | 130 | 17.8% |
| 55 to 64 Years | 119 | 16.3% |
| 65 to 74 Years | 226 | 30.9% |
| 75 to 84 Years | 33 | 4.5% |
| 85 Years and Over | 0 | 0.0% |
| Total | 732 | 100.0% |
Housing Finances in Stone Ridge
Median Income by Occupancy in Stone Ridge
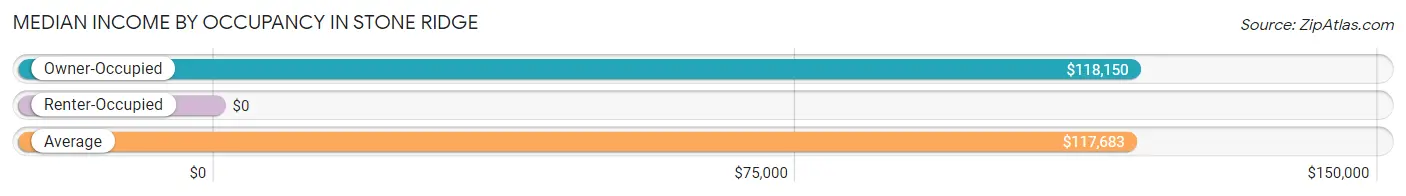
| Occupancy Type | # Households | Median Income |
| Owner-Occupied | 676 (92.3%) | $118,150 |
| Renter-Occupied | 56 (7.6%) | $0 |
| Average | 732 (100.0%) | $117,683 |
Occupancy by Householder Income Bracket in Stone Ridge
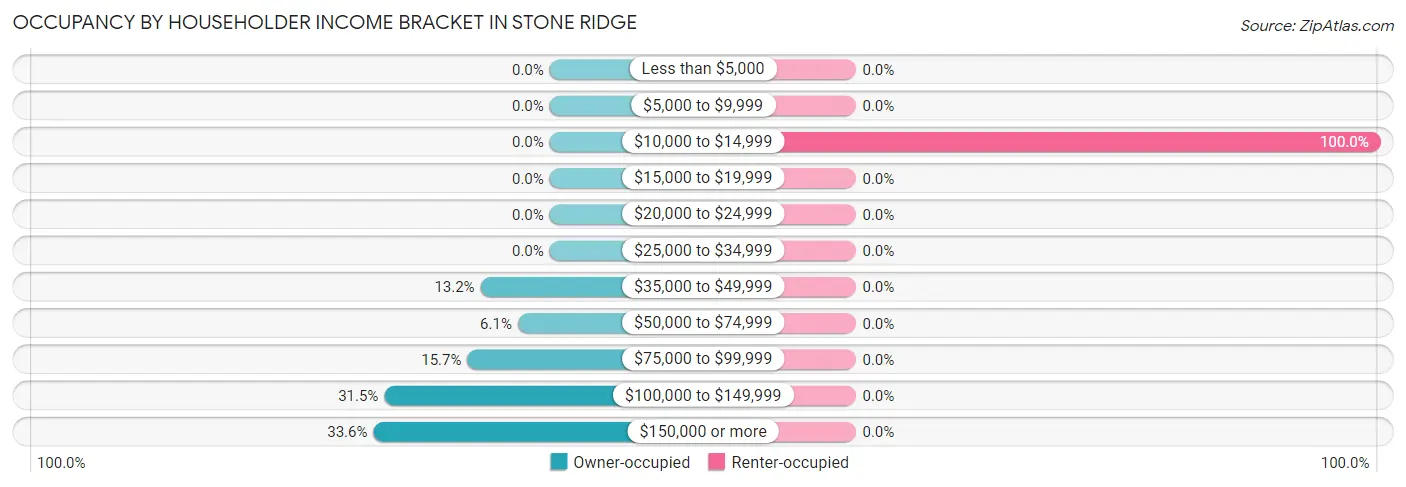
| Income Bracket | Owner-occupied | Renter-occupied |
| Less than $5,000 | 0 (0.0%) | 0 (0.0%) |
| $5,000 to $9,999 | 0 (0.0%) | 0 (0.0%) |
| $10,000 to $14,999 | 0 (0.0%) | 56 (100.0%) |
| $15,000 to $19,999 | 0 (0.0%) | 0 (0.0%) |
| $20,000 to $24,999 | 0 (0.0%) | 0 (0.0%) |
| $25,000 to $34,999 | 0 (0.0%) | 0 (0.0%) |
| $35,000 to $49,999 | 89 (13.2%) | 0 (0.0%) |
| $50,000 to $74,999 | 41 (6.1%) | 0 (0.0%) |
| $75,000 to $99,999 | 106 (15.7%) | 0 (0.0%) |
| $100,000 to $149,999 | 213 (31.5%) | 0 (0.0%) |
| $150,000 or more | 227 (33.6%) | 0 (0.0%) |
| Total | 676 (100.0%) | 56 (100.0%) |
Monthly Housing Cost Tiers in Stone Ridge
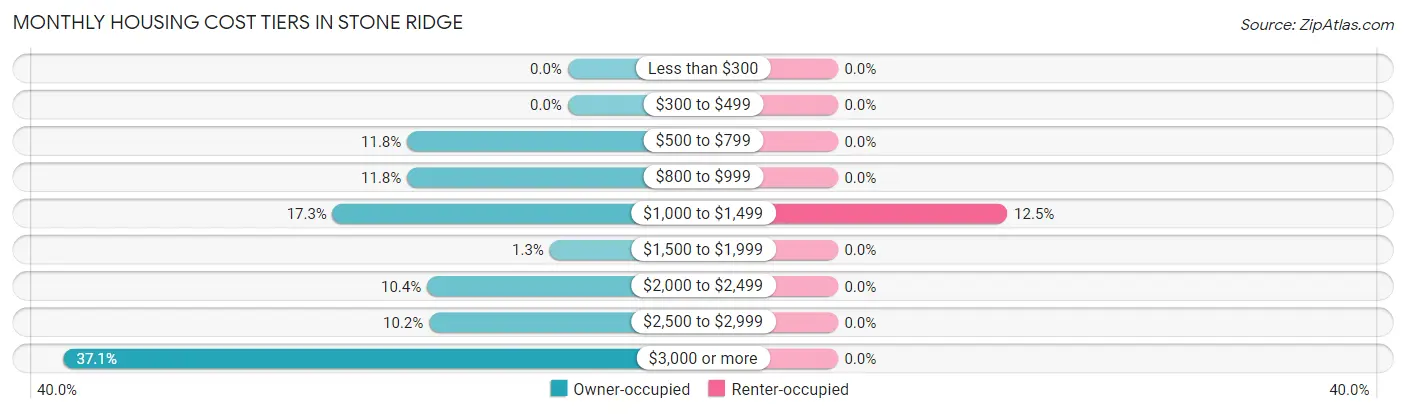
| Monthly Cost | Owner-occupied | Renter-occupied |
| Less than $300 | 0 (0.0%) | 0 (0.0%) |
| $300 to $499 | 0 (0.0%) | 0 (0.0%) |
| $500 to $799 | 80 (11.8%) | 0 (0.0%) |
| $800 to $999 | 80 (11.8%) | 0 (0.0%) |
| $1,000 to $1,499 | 117 (17.3%) | 7 (12.5%) |
| $1,500 to $1,999 | 9 (1.3%) | 0 (0.0%) |
| $2,000 to $2,499 | 70 (10.4%) | 0 (0.0%) |
| $2,500 to $2,999 | 69 (10.2%) | 0 (0.0%) |
| $3,000 or more | 251 (37.1%) | 0 (0.0%) |
| Total | 676 (100.0%) | 56 (100.0%) |
Physical Housing Characteristics in Stone Ridge
Housing Structures in Stone Ridge
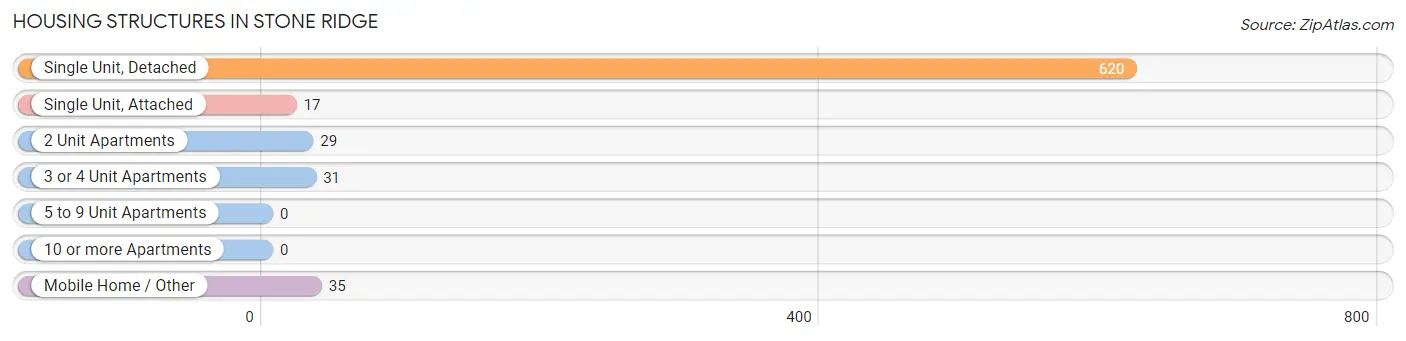
| Structure Type | # Housing Units | % Housing Units |
| Single Unit, Detached | 620 | 84.7% |
| Single Unit, Attached | 17 | 2.3% |
| 2 Unit Apartments | 29 | 4.0% |
| 3 or 4 Unit Apartments | 31 | 4.2% |
| 5 to 9 Unit Apartments | 0 | 0.0% |
| 10 or more Apartments | 0 | 0.0% |
| Mobile Home / Other | 35 | 4.8% |
| Total | 732 | 100.0% |
Housing Structures by Occupancy in Stone Ridge
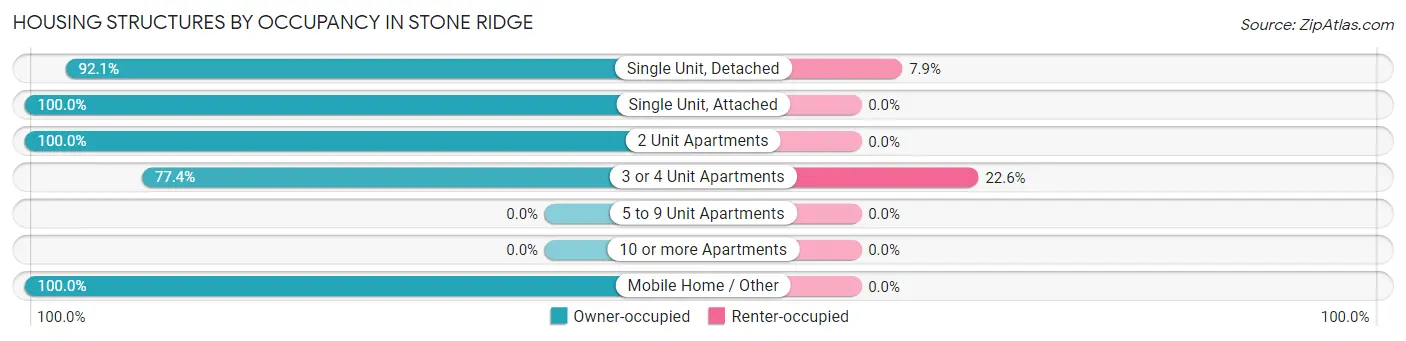
| Structure Type | Owner-occupied | Renter-occupied |
| Single Unit, Detached | 571 (92.1%) | 49 (7.9%) |
| Single Unit, Attached | 17 (100.0%) | 0 (0.0%) |
| 2 Unit Apartments | 29 (100.0%) | 0 (0.0%) |
| 3 or 4 Unit Apartments | 24 (77.4%) | 7 (22.6%) |
| 5 to 9 Unit Apartments | 0 (0.0%) | 0 (0.0%) |
| 10 or more Apartments | 0 (0.0%) | 0 (0.0%) |
| Mobile Home / Other | 35 (100.0%) | 0 (0.0%) |
| Total | 676 (92.3%) | 56 (7.6%) |
Housing Structures by Number of Rooms in Stone Ridge
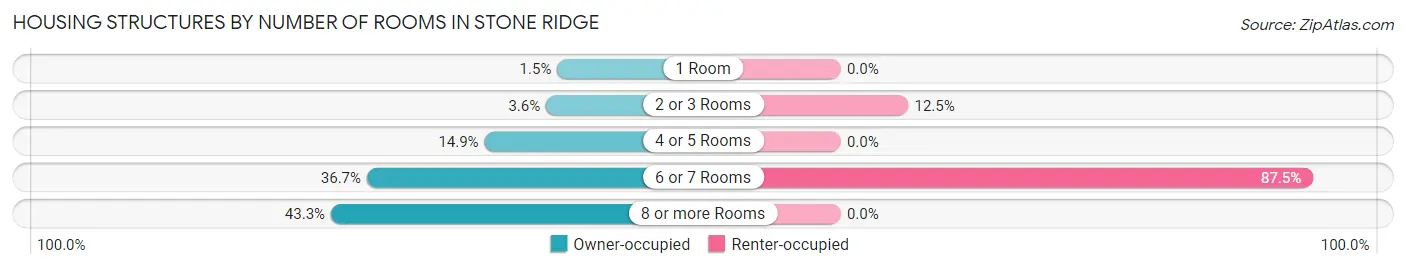
| Number of Rooms | Owner-occupied | Renter-occupied |
| 1 Room | 10 (1.5%) | 0 (0.0%) |
| 2 or 3 Rooms | 24 (3.5%) | 7 (12.5%) |
| 4 or 5 Rooms | 101 (14.9%) | 0 (0.0%) |
| 6 or 7 Rooms | 248 (36.7%) | 49 (87.5%) |
| 8 or more Rooms | 293 (43.3%) | 0 (0.0%) |
| Total | 676 (100.0%) | 56 (100.0%) |
Housing Structure by Heating Type in Stone Ridge
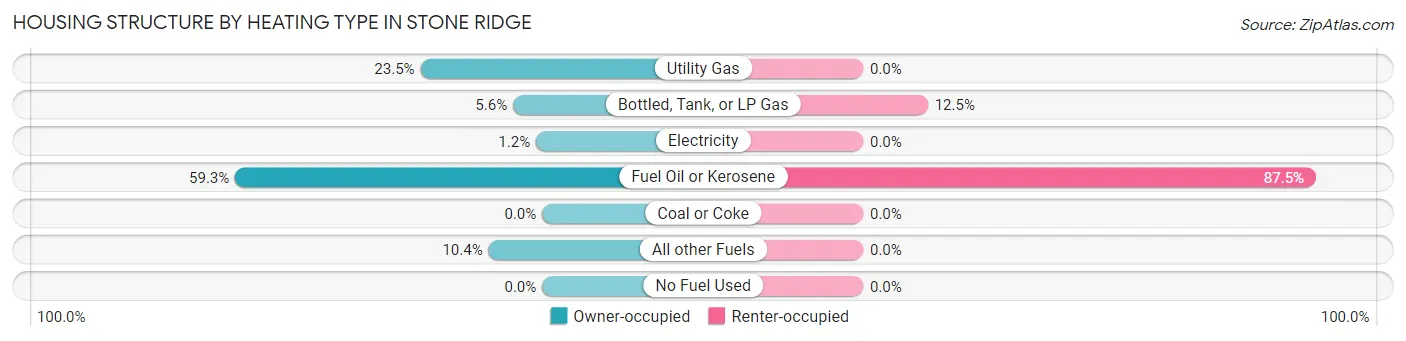
| Heating Type | Owner-occupied | Renter-occupied |
| Utility Gas | 159 (23.5%) | 0 (0.0%) |
| Bottled, Tank, or LP Gas | 38 (5.6%) | 7 (12.5%) |
| Electricity | 8 (1.2%) | 0 (0.0%) |
| Fuel Oil or Kerosene | 401 (59.3%) | 49 (87.5%) |
| Coal or Coke | 0 (0.0%) | 0 (0.0%) |
| All other Fuels | 70 (10.4%) | 0 (0.0%) |
| No Fuel Used | 0 (0.0%) | 0 (0.0%) |
| Total | 676 (100.0%) | 56 (100.0%) |
Household Vehicle Usage in Stone Ridge
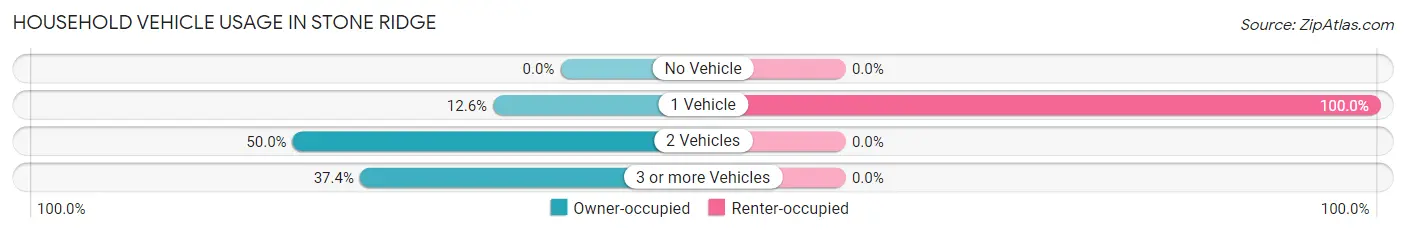
| Vehicles per Household | Owner-occupied | Renter-occupied |
| No Vehicle | 0 (0.0%) | 0 (0.0%) |
| 1 Vehicle | 85 (12.6%) | 56 (100.0%) |
| 2 Vehicles | 338 (50.0%) | 0 (0.0%) |
| 3 or more Vehicles | 253 (37.4%) | 0 (0.0%) |
| Total | 676 (100.0%) | 56 (100.0%) |
Real Estate & Mortgages in Stone Ridge
Real Estate and Mortgage Overview in Stone Ridge
| Characteristic | Without Mortgage | With Mortgage |
| Housing Units | 205 | 471 |
| Median Property Value | $290,100 | $417,600 |
| Median Household Income | - | - |
| Monthly Housing Costs | $992 | $225 |
| Real Estate Taxes | $6,440 | $0 |
Property Value by Mortgage Status in Stone Ridge
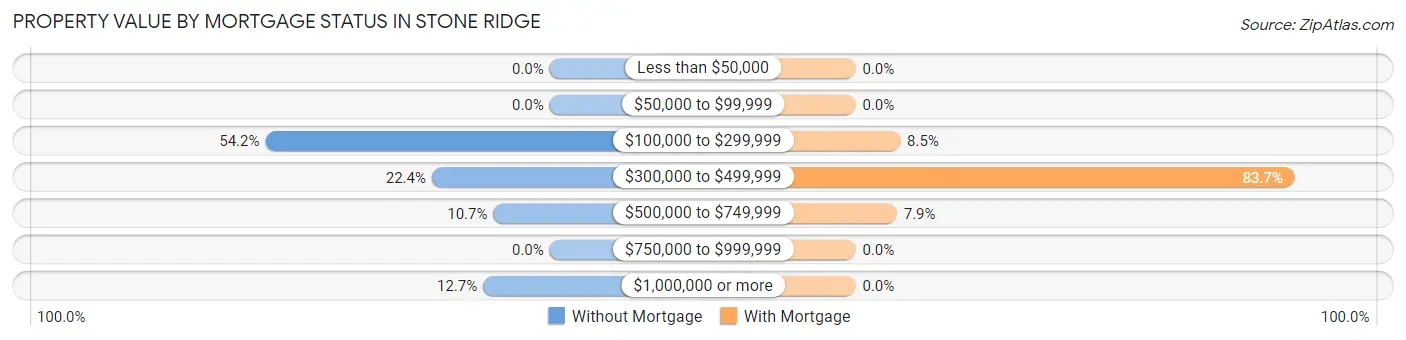
| Property Value | Without Mortgage | With Mortgage |
| Less than $50,000 | 0 (0.0%) | 0 (0.0%) |
| $50,000 to $99,999 | 0 (0.0%) | 0 (0.0%) |
| $100,000 to $299,999 | 111 (54.1%) | 40 (8.5%) |
| $300,000 to $499,999 | 46 (22.4%) | 394 (83.7%) |
| $500,000 to $749,999 | 22 (10.7%) | 37 (7.9%) |
| $750,000 to $999,999 | 0 (0.0%) | 0 (0.0%) |
| $1,000,000 or more | 26 (12.7%) | 0 (0.0%) |
| Total | 205 (100.0%) | 471 (100.0%) |
Household Income by Mortgage Status in Stone Ridge
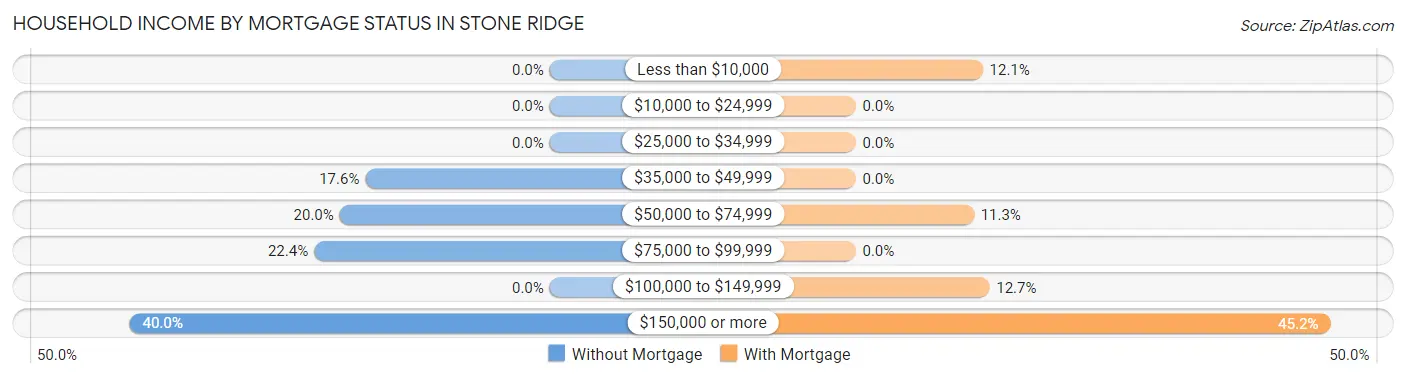
| Household Income | Without Mortgage | With Mortgage |
| Less than $10,000 | 0 (0.0%) | 57 (12.1%) |
| $10,000 to $24,999 | 0 (0.0%) | 0 (0.0%) |
| $25,000 to $34,999 | 0 (0.0%) | 0 (0.0%) |
| $35,000 to $49,999 | 36 (17.6%) | 0 (0.0%) |
| $50,000 to $74,999 | 41 (20.0%) | 53 (11.3%) |
| $75,000 to $99,999 | 46 (22.4%) | 0 (0.0%) |
| $100,000 to $149,999 | 0 (0.0%) | 60 (12.7%) |
| $150,000 or more | 82 (40.0%) | 213 (45.2%) |
| Total | 205 (100.0%) | 471 (100.0%) |
Property Value to Household Income Ratio in Stone Ridge
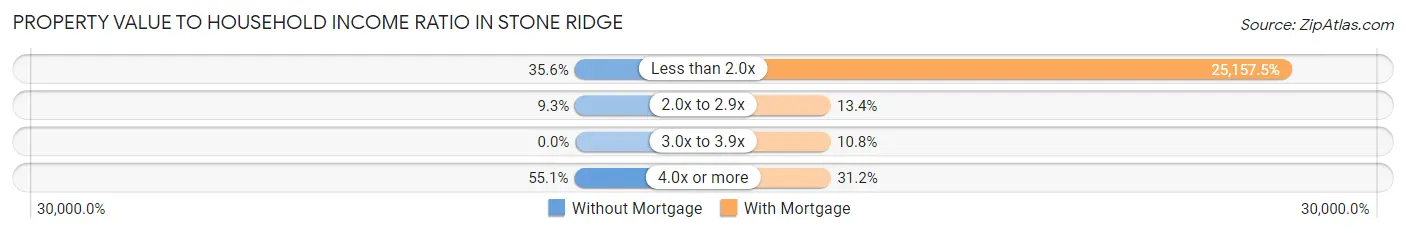
| Value-to-Income Ratio | Without Mortgage | With Mortgage |
| Less than 2.0x | 73 (35.6%) | 118,492 (25,157.5%) |
| 2.0x to 2.9x | 19 (9.3%) | 63 (13.4%) |
| 3.0x to 3.9x | 0 (0.0%) | 51 (10.8%) |
| 4.0x or more | 113 (55.1%) | 147 (31.2%) |
| Total | 205 (100.0%) | 471 (100.0%) |
Real Estate Taxes by Mortgage Status in Stone Ridge

| Property Taxes | Without Mortgage | With Mortgage |
| Less than $800 | 0 (0.0%) | 0 (0.0%) |
| $800 to $1,499 | 0 (0.0%) | 0 (0.0%) |
| $800 to $1,499 | 205 (100.0%) | 0 (0.0%) |
| Total | 205 (100.0%) | 471 (100.0%) |
Health & Disability in Stone Ridge
Health Insurance Coverage by Age in Stone Ridge
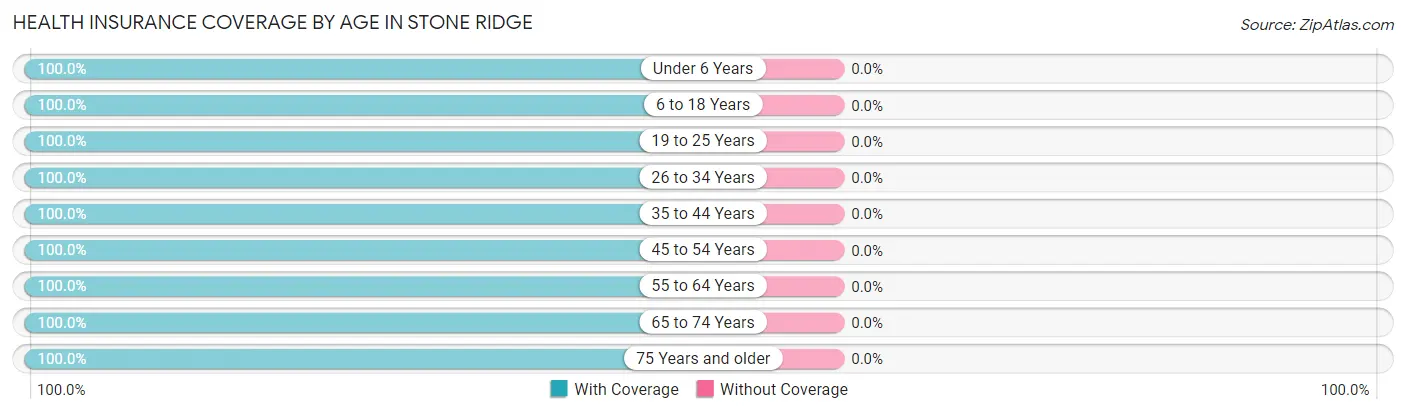
| Age Bracket | With Coverage | Without Coverage |
| Under 6 Years | 187 (100.0%) | 0 (0.0%) |
| 6 to 18 Years | 294 (100.0%) | 0 (0.0%) |
| 19 to 25 Years | 91 (100.0%) | 0 (0.0%) |
| 26 to 34 Years | 204 (100.0%) | 0 (0.0%) |
| 35 to 44 Years | 310 (100.0%) | 0 (0.0%) |
| 45 to 54 Years | 239 (100.0%) | 0 (0.0%) |
| 55 to 64 Years | 174 (100.0%) | 0 (0.0%) |
| 65 to 74 Years | 304 (100.0%) | 0 (0.0%) |
| 75 Years and older | 97 (100.0%) | 0 (0.0%) |
| Total | 1,900 (100.0%) | 0 (0.0%) |
Health Insurance Coverage by Citizenship Status in Stone Ridge
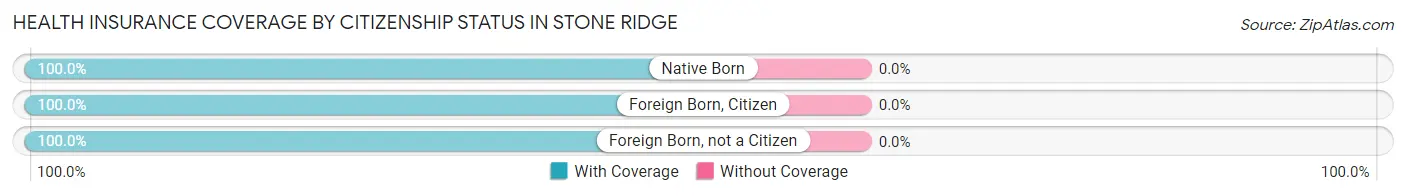
| Citizenship Status | With Coverage | Without Coverage |
| Native Born | 187 (100.0%) | 0 (0.0%) |
| Foreign Born, Citizen | 294 (100.0%) | 0 (0.0%) |
| Foreign Born, not a Citizen | 91 (100.0%) | 0 (0.0%) |
Health Insurance Coverage by Household Income in Stone Ridge
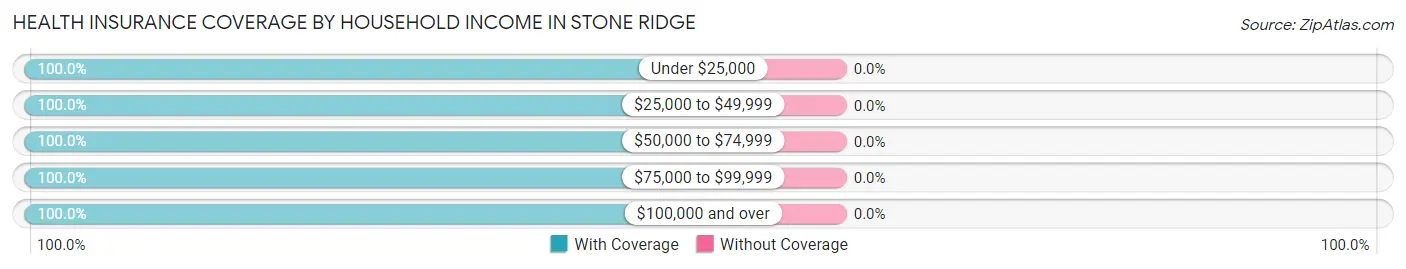
| Household Income | With Coverage | Without Coverage |
| Under $25,000 | 160 (100.0%) | 0 (0.0%) |
| $25,000 to $49,999 | 252 (100.0%) | 0 (0.0%) |
| $50,000 to $74,999 | 114 (100.0%) | 0 (0.0%) |
| $75,000 to $99,999 | 360 (100.0%) | 0 (0.0%) |
| $100,000 and over | 1,006 (100.0%) | 0 (0.0%) |
Public vs Private Health Insurance Coverage by Age in Stone Ridge
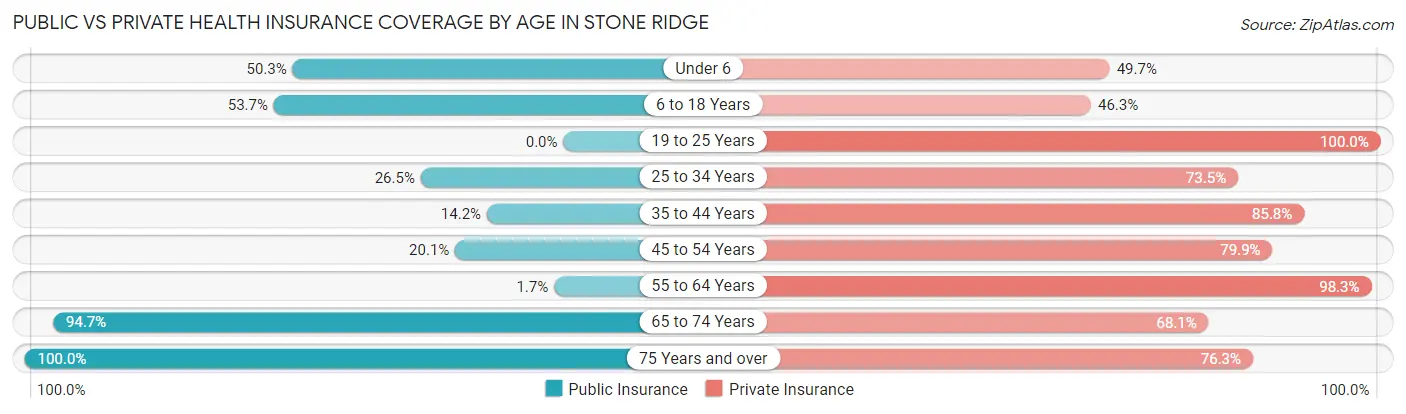
| Age Bracket | Public Insurance | Private Insurance |
| Under 6 | 94 (50.3%) | 93 (49.7%) |
| 6 to 18 Years | 158 (53.7%) | 136 (46.3%) |
| 19 to 25 Years | 0 (0.0%) | 91 (100.0%) |
| 25 to 34 Years | 54 (26.5%) | 150 (73.5%) |
| 35 to 44 Years | 44 (14.2%) | 266 (85.8%) |
| 45 to 54 Years | 48 (20.1%) | 191 (79.9%) |
| 55 to 64 Years | 3 (1.7%) | 171 (98.3%) |
| 65 to 74 Years | 288 (94.7%) | 207 (68.1%) |
| 75 Years and over | 97 (100.0%) | 74 (76.3%) |
| Total | 786 (41.4%) | 1,379 (72.6%) |
Disability Status by Sex by Age in Stone Ridge
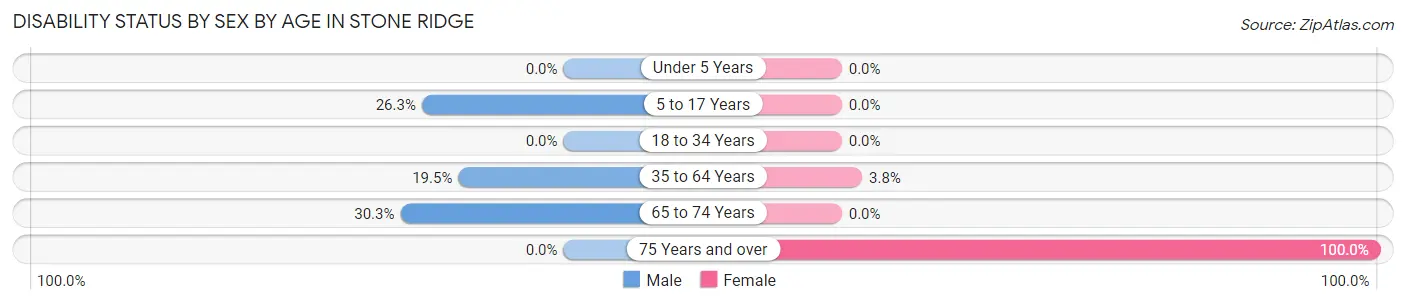
| Age Bracket | Male | Female |
| Under 5 Years | 0 (0.0%) | 0 (0.0%) |
| 5 to 17 Years | 51 (26.3%) | 0 (0.0%) |
| 18 to 34 Years | 0 (0.0%) | 0 (0.0%) |
| 35 to 64 Years | 79 (19.5%) | 12 (3.8%) |
| 65 to 74 Years | 56 (30.3%) | 0 (0.0%) |
| 75 Years and over | 0 (0.0%) | 40 (100.0%) |
Disability Class by Sex by Age in Stone Ridge
Disability Class: Hearing Difficulty
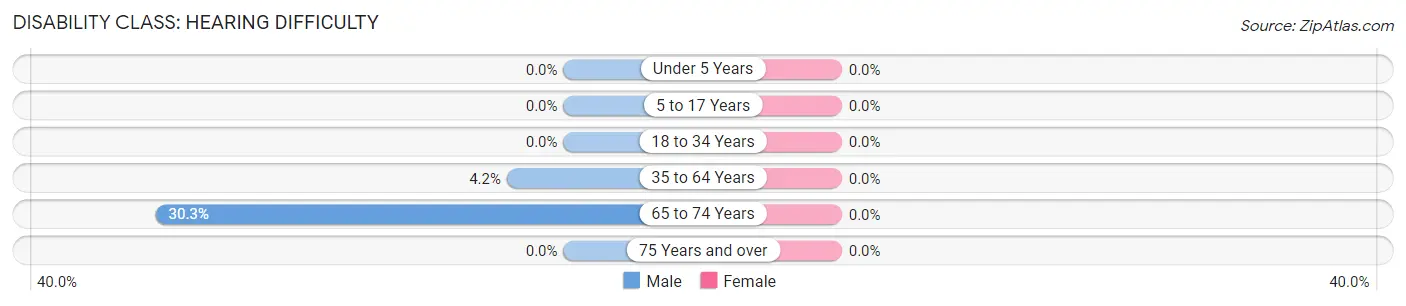
| Age Bracket | Male | Female |
| Under 5 Years | 0 (0.0%) | 0 (0.0%) |
| 5 to 17 Years | 0 (0.0%) | 0 (0.0%) |
| 18 to 34 Years | 0 (0.0%) | 0 (0.0%) |
| 35 to 64 Years | 17 (4.2%) | 0 (0.0%) |
| 65 to 74 Years | 56 (30.3%) | 0 (0.0%) |
| 75 Years and over | 0 (0.0%) | 0 (0.0%) |
Disability Class: Vision Difficulty
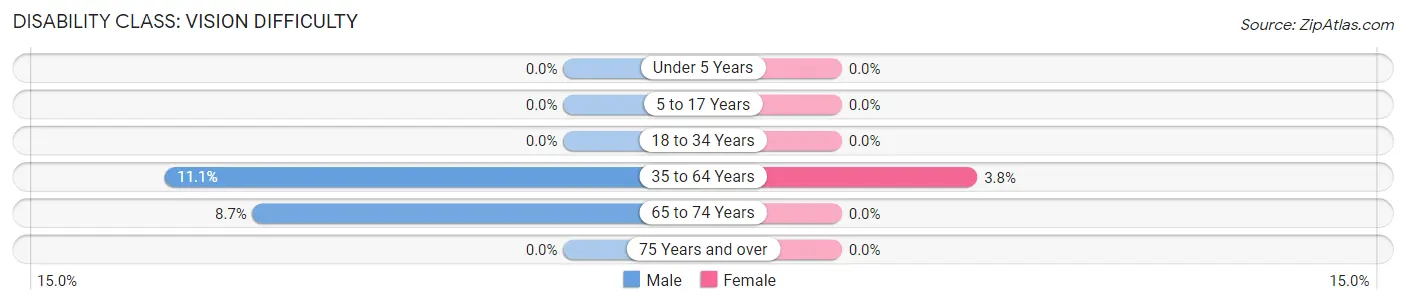
| Age Bracket | Male | Female |
| Under 5 Years | 0 (0.0%) | 0 (0.0%) |
| 5 to 17 Years | 0 (0.0%) | 0 (0.0%) |
| 18 to 34 Years | 0 (0.0%) | 0 (0.0%) |
| 35 to 64 Years | 45 (11.1%) | 12 (3.8%) |
| 65 to 74 Years | 16 (8.6%) | 0 (0.0%) |
| 75 Years and over | 0 (0.0%) | 0 (0.0%) |
Disability Class: Cognitive Difficulty
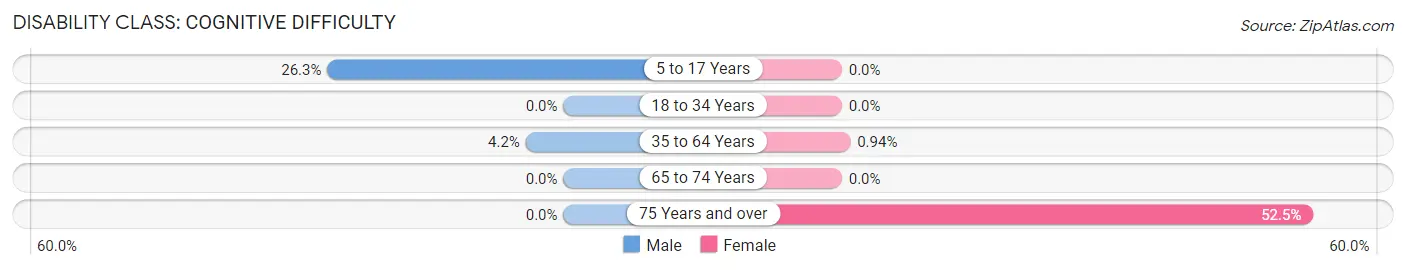
| Age Bracket | Male | Female |
| 5 to 17 Years | 51 (26.3%) | 0 (0.0%) |
| 18 to 34 Years | 0 (0.0%) | 0 (0.0%) |
| 35 to 64 Years | 17 (4.2%) | 3 (0.9%) |
| 65 to 74 Years | 0 (0.0%) | 0 (0.0%) |
| 75 Years and over | 0 (0.0%) | 21 (52.5%) |
Disability Class: Ambulatory Difficulty
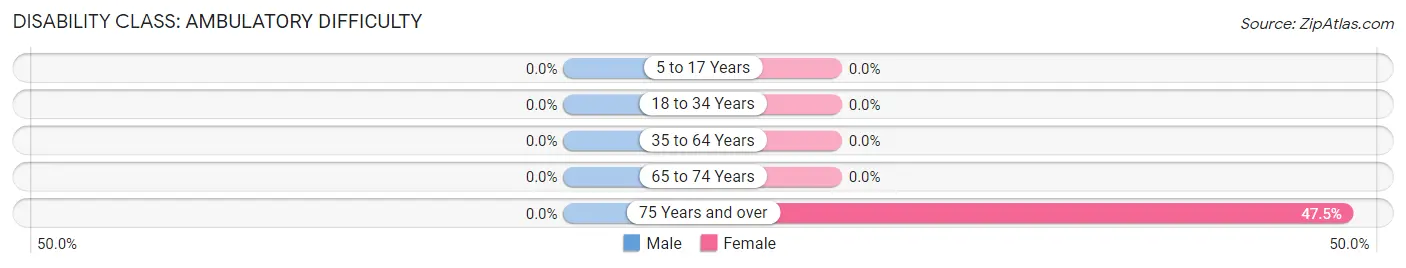
| Age Bracket | Male | Female |
| 5 to 17 Years | 0 (0.0%) | 0 (0.0%) |
| 18 to 34 Years | 0 (0.0%) | 0 (0.0%) |
| 35 to 64 Years | 0 (0.0%) | 0 (0.0%) |
| 65 to 74 Years | 0 (0.0%) | 0 (0.0%) |
| 75 Years and over | 0 (0.0%) | 19 (47.5%) |
Disability Class: Self-Care Difficulty
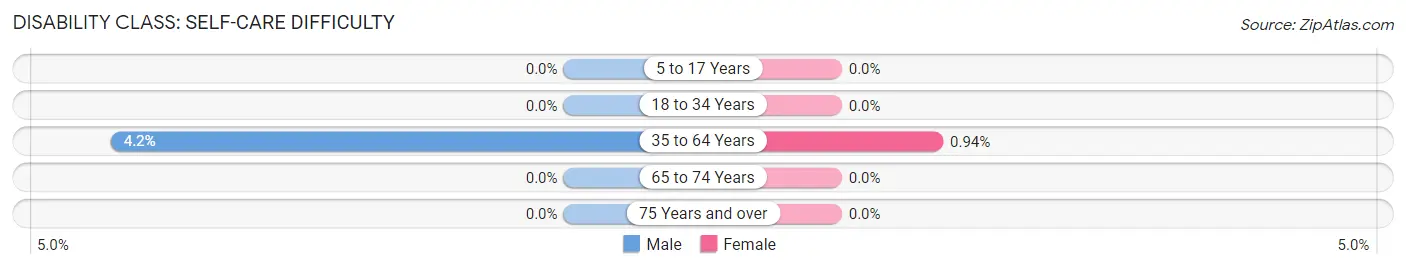
| Age Bracket | Male | Female |
| 5 to 17 Years | 0 (0.0%) | 0 (0.0%) |
| 18 to 34 Years | 0 (0.0%) | 0 (0.0%) |
| 35 to 64 Years | 17 (4.2%) | 3 (0.9%) |
| 65 to 74 Years | 0 (0.0%) | 0 (0.0%) |
| 75 Years and over | 0 (0.0%) | 0 (0.0%) |
Technology Access in Stone Ridge
Computing Device Access in Stone Ridge
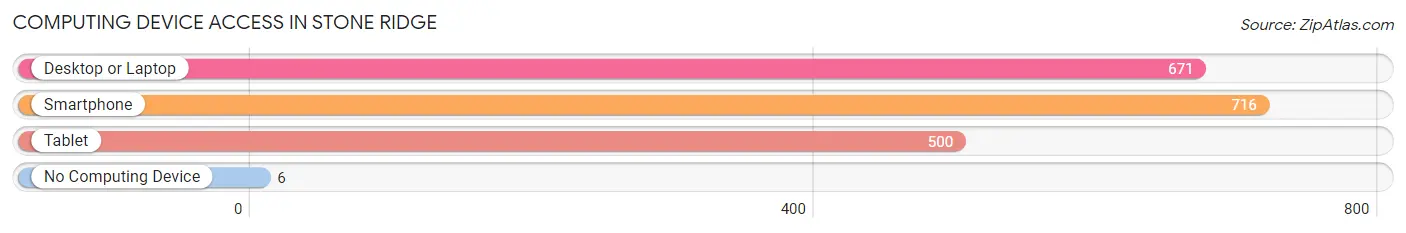
| Device Type | # Households | % Households |
| Desktop or Laptop | 671 | 91.7% |
| Smartphone | 716 | 97.8% |
| Tablet | 500 | 68.3% |
| No Computing Device | 6 | 0.8% |
| Total | 732 | 100.0% |
Internet Access in Stone Ridge
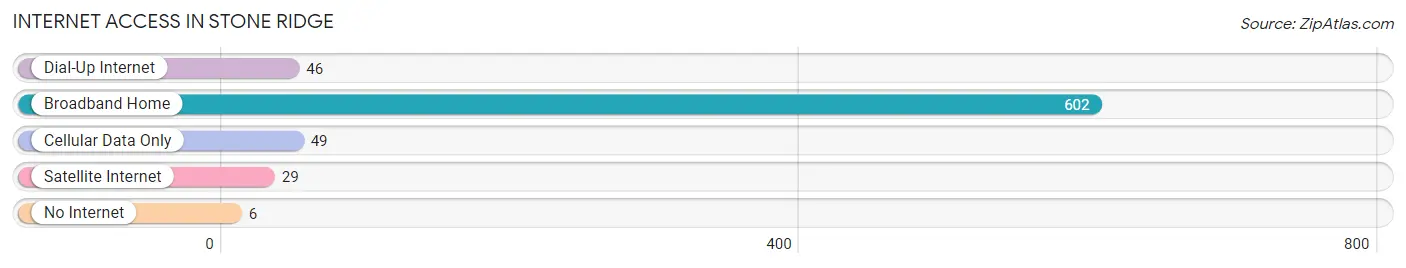
| Internet Type | # Households | % Households |
| Dial-Up Internet | 46 | 6.3% |
| Broadband Home | 602 | 82.2% |
| Cellular Data Only | 49 | 6.7% |
| Satellite Internet | 29 | 4.0% |
| No Internet | 6 | 0.8% |
| Total | 732 | 100.0% |
Stone Ridge Summary
Stone Ridge is a hamlet located in the town of Marbletown in Ulster County, New York. It is situated in the foothills of the Shawangunk Mountains, about 10 miles south of the city of Kingston. The hamlet is home to a diverse population of about 1,500 people, and is known for its rural charm and scenic beauty.
History
Stone Ridge was first settled in the late 17th century by Dutch and German immigrants. The hamlet was originally known as “Kleine Dorp”, which translates to “Little Village” in Dutch. The name was changed to Stone Ridge in the early 19th century, when the hamlet was incorporated into the town of Marbletown.
The hamlet was an important stop on the Ulster and Delaware Railroad, which ran from Kingston to Oneonta. The railroad was a major factor in the growth of Stone Ridge, as it allowed for the transportation of goods and people to and from the hamlet.
In the late 19th century, Stone Ridge became a popular summer destination for wealthy New Yorkers. Many of the grand homes that were built during this period still stand today.
Geography
Stone Ridge is located in the foothills of the Shawangunk Mountains, about 10 miles south of the city of Kingston. The hamlet is situated on the banks of the Rondout Creek, which flows through the town of Marbletown.
The hamlet is surrounded by rolling hills and lush forests, making it a popular destination for outdoor activities such as hiking, biking, and camping. The nearby Mohonk Preserve is a popular destination for rock climbing and other outdoor activities.
Economy
Stone Ridge is a small, rural community with a diverse economy. The hamlet is home to a variety of small businesses, including restaurants, shops, and galleries. The hamlet is also home to several farms, which produce a variety of fruits and vegetables.
The hamlet is also home to several wineries, which produce a variety of wines. The hamlet is also home to several bed and breakfasts, which attract visitors from all over the world.
Demographics
As of the 2010 census, Stone Ridge had a population of 1,500 people. The racial makeup of the hamlet was 94.2% White, 1.7% African American, 0.7% Native American, 0.7% Asian, 0.3% from other races, and 2.3% from two or more races. Hispanic or Latino of any race were 2.3% of the population.
The median household income in Stone Ridge was $50,000, and the median family income was $60,000. The per capita income for the hamlet was $25,000. About 8.3% of families and 10.7% of the population were below the poverty line, including 15.3% of those under age 18 and 5.3% of those age 65 or over.
Stone Ridge is a small, rural hamlet with a diverse population and a unique history. The hamlet is home to a variety of small businesses, farms, and wineries, and is a popular destination for outdoor activities. The hamlet is also home to a diverse population, with a median household income of $50,000 and a median family income of $60,000.
Common Questions
What is the Total Population of Stone Ridge?
Total Population of Stone Ridge is 1,900.
What is the Total Male Population of Stone Ridge?
Total Male Population of Stone Ridge is 1,009.
What is the Total Female Population of Stone Ridge?
Total Female Population of Stone Ridge is 891.
What is the Ratio of Males per 100 Females in Stone Ridge?
There are 113.24 Males per 100 Females in Stone Ridge.
What is the Ratio of Females per 100 Males in Stone Ridge?
There are 88.31 Females per 100 Males in Stone Ridge.
What is the Median Population Age in Stone Ridge?
Median Population Age in Stone Ridge is 37.6 Years.
What is the Average Family Size in Stone Ridge
Average Family Size in Stone Ridge is 2.7 People.
What is the Average Household Size in Stone Ridge
Average Household Size in Stone Ridge is 2.6 People.
What is Per Capita Income in Stone Ridge?
Per Capita income in Stone Ridge is $48,646.
What is the Median Family Income in Stone Ridge?
Median Family Income in Stone Ridge is $117,992.
What is the Median Household income in Stone Ridge?
Median Household Income in Stone Ridge is $117,683.
What is Inequality or Gini Index in Stone Ridge?
Inequality or Gini Index in Stone Ridge is 0.38.
How Large is the Labor Force in Stone Ridge?
There are 818 People in the Labor Forcein in Stone Ridge.
What is the Percentage of People in the Labor Force in Stone Ridge?
55.3% of People are in the Labor Force in Stone Ridge.
What is the Unemployment Rate in Stone Ridge?
Unemployment Rate in Stone Ridge is 7.6%.