Roscoe, NY
Roscoe Map
Roscoe Overview
442
TOTAL POPULATION
183
MALE POPULATION
259
FEMALE POPULATION
70.66
MALES / 100 FEMALES
141.53
FEMALES / 100 MALES
57.8
MEDIAN AGE
2.8
AVG FAMILY SIZE
2.5
AVG HOUSEHOLD SIZE
$22,957
PER CAPITA INCOME
$58,500
AVG FAMILY INCOME
$56,343
AVG HOUSEHOLD INCOME
0.33
INEQUALITY / GINI INDEX
172
LABOR FORCE [ PEOPLE ]
42.4%
PERCENT IN LABOR FORCE
Roscoe Zip Codes
Roscoe Area Codes
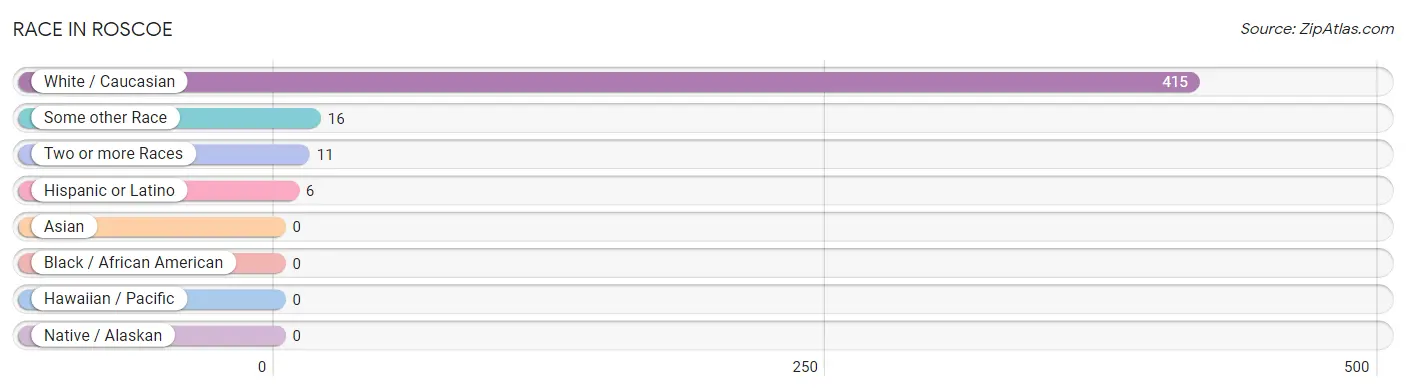
Race in Roscoe
The most populous races in Roscoe are White / Caucasian (415 | 93.9%), Some other Race (16 | 3.6%), and Two or more Races (11 | 2.5%).
| Race | # Population | % Population |
| Asian | 0 | 0.0% |
| Black / African American | 0 | 0.0% |
| Hawaiian / Pacific | 0 | 0.0% |
| Hispanic or Latino | 6 | 1.4% |
| Native / Alaskan | 0 | 0.0% |
| White / Caucasian | 415 | 93.9% |
| Two or more Races | 11 | 2.5% |
| Some other Race | 16 | 3.6% |
| Total | 442 | 100.0% |
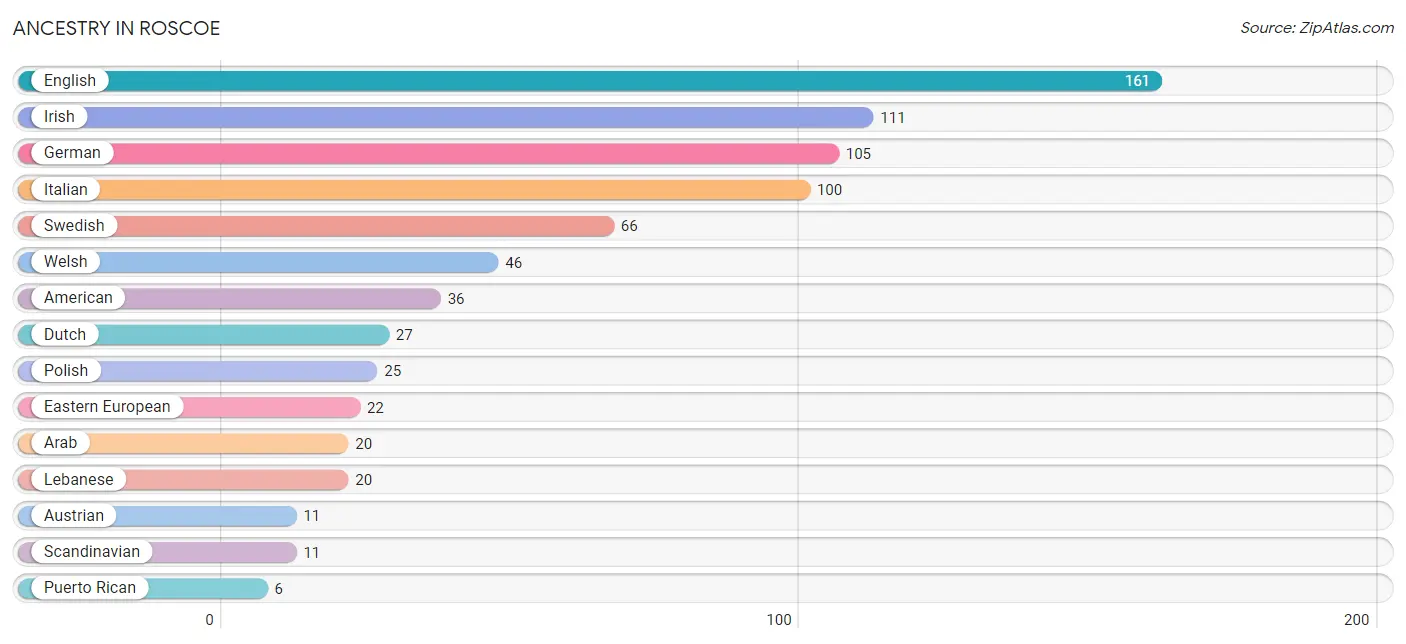
Ancestry in Roscoe
The most populous ancestries reported in Roscoe are English (161 | 36.4%), Irish (111 | 25.1%), German (105 | 23.8%), Italian (100 | 22.6%), and Swedish (66 | 14.9%), together accounting for 122.8% of all Roscoe residents.
| Ancestry | # Population | % Population |
| American | 36 | 8.1% |
| Arab | 20 | 4.5% |
| Austrian | 11 | 2.5% |
| Dutch | 27 | 6.1% |
| Eastern European | 22 | 5.0% |
| English | 161 | 36.4% |
| German | 105 | 23.8% |
| Irish | 111 | 25.1% |
| Italian | 100 | 22.6% |
| Lebanese | 20 | 4.5% |
| Polish | 25 | 5.7% |
| Puerto Rican | 6 | 1.4% |
| Scandinavian | 11 | 2.5% |
| Scotch-Irish | 5 | 1.1% |
| Swedish | 66 | 14.9% |
| Welsh | 46 | 10.4% | View All 16 Rows |
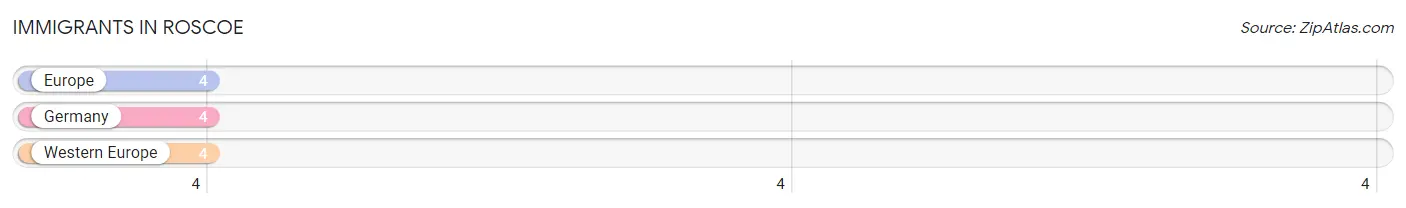
Immigrants in Roscoe
The most numerous immigrant groups reported in Roscoe came from Europe (4 | 0.9%), Germany (4 | 0.9%), and Western Europe (4 | 0.9%), together accounting for 2.7% of all Roscoe residents.
| Immigration Origin | # Population | % Population |
| Europe | 4 | 0.9% |
| Germany | 4 | 0.9% |
| Western Europe | 4 | 0.9% | View All 3 Rows |
Sex and Age in Roscoe
Sex and Age in Roscoe
The most populous age groups in Roscoe are 45 to 49 Years (32 | 17.5%) for men and 70 to 74 Years (101 | 39.0%) for women.
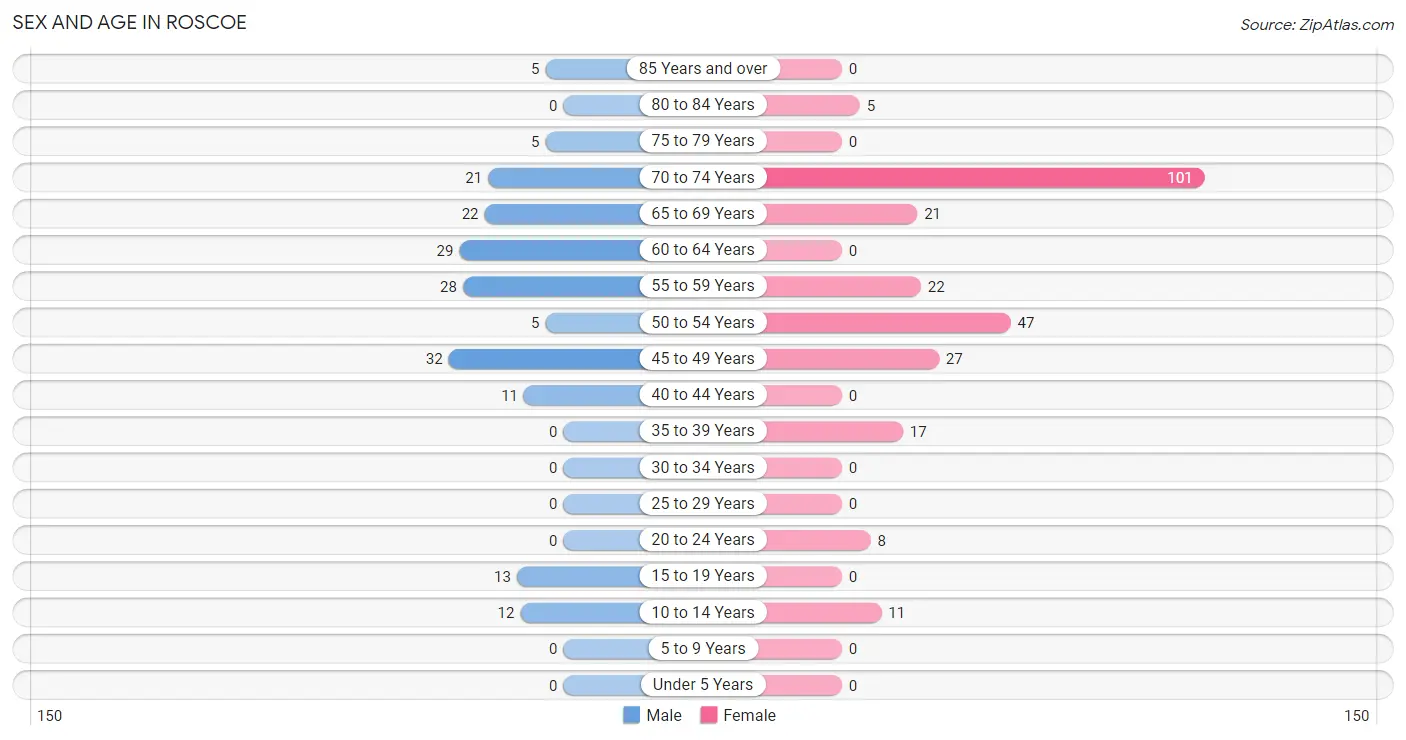
| Age Bracket | Male | Female |
| Under 5 Years | 0 (0.0%) | 0 (0.0%) |
| 5 to 9 Years | 0 (0.0%) | 0 (0.0%) |
| 10 to 14 Years | 12 (6.6%) | 11 (4.3%) |
| 15 to 19 Years | 13 (7.1%) | 0 (0.0%) |
| 20 to 24 Years | 0 (0.0%) | 8 (3.1%) |
| 25 to 29 Years | 0 (0.0%) | 0 (0.0%) |
| 30 to 34 Years | 0 (0.0%) | 0 (0.0%) |
| 35 to 39 Years | 0 (0.0%) | 17 (6.6%) |
| 40 to 44 Years | 11 (6.0%) | 0 (0.0%) |
| 45 to 49 Years | 32 (17.5%) | 27 (10.4%) |
| 50 to 54 Years | 5 (2.7%) | 47 (18.1%) |
| 55 to 59 Years | 28 (15.3%) | 22 (8.5%) |
| 60 to 64 Years | 29 (15.9%) | 0 (0.0%) |
| 65 to 69 Years | 22 (12.0%) | 21 (8.1%) |
| 70 to 74 Years | 21 (11.5%) | 101 (39.0%) |
| 75 to 79 Years | 5 (2.7%) | 0 (0.0%) |
| 80 to 84 Years | 0 (0.0%) | 5 (1.9%) |
| 85 Years and over | 5 (2.7%) | 0 (0.0%) |
| Total | 183 (100.0%) | 259 (100.0%) |
Families and Households in Roscoe
Median Family Size in Roscoe
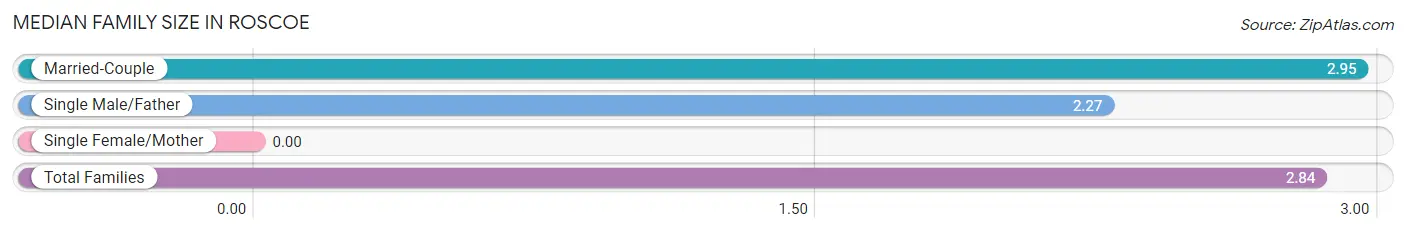
| Family Type | # Families | Family Size |
| Married-Couple | 112 (83.6%) | 2.95 |
| Single Male/Father | 22 (16.4%) | 2.27 |
| Single Female/Mother | 0 (0.0%) | - |
| Total Families | 134 (100.0%) | 2.84 |
Median Household Size in Roscoe
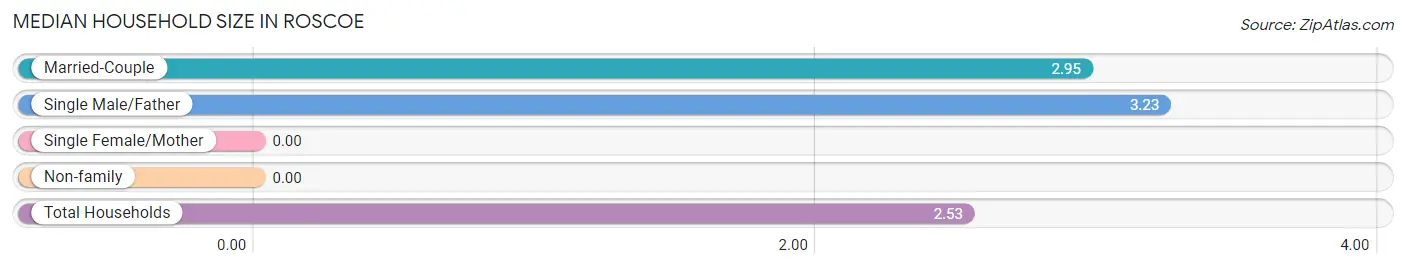
| Household Type | # Households | Household Size |
| Married-Couple | 112 (64.0%) | 2.95 |
| Single Male/Father | 22 (12.6%) | 3.23 |
| Single Female/Mother | 0 (0.0%) | - |
| Non-family | 41 (23.4%) | - |
| Total Households | 175 (100.0%) | 2.53 |
Household Size by Marriage Status in Roscoe
Out of a total of 175 households in Roscoe, 134 (76.6%) are family households, while 41 (23.4%) are nonfamily households. The most numerous type of family households are 2-person households, comprising 69, and the most common type of nonfamily households are 1-person households, comprising 41.
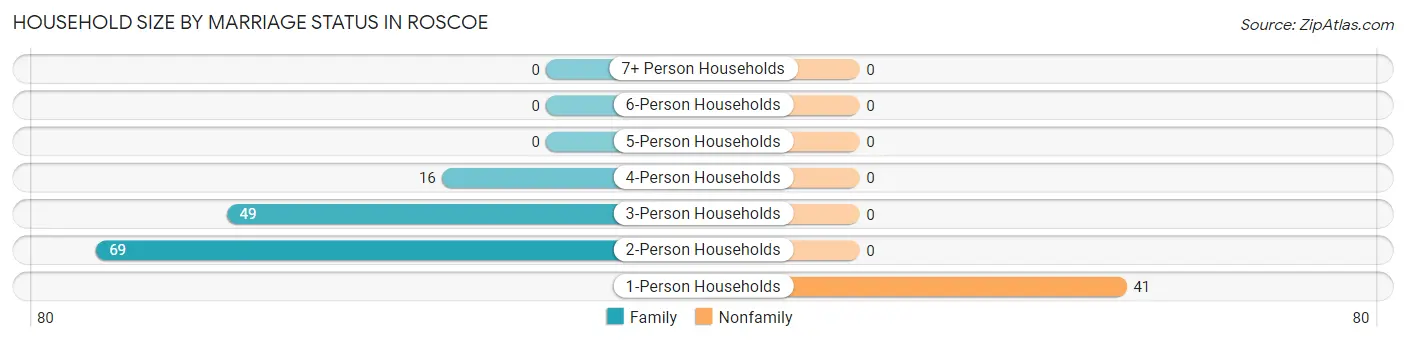
| Household Size | Family Households | Nonfamily Households |
| 1-Person Households | - | 41 (23.4%) |
| 2-Person Households | 69 (39.4%) | 0 (0.0%) |
| 3-Person Households | 49 (28.0%) | 0 (0.0%) |
| 4-Person Households | 16 (9.1%) | 0 (0.0%) |
| 5-Person Households | 0 (0.0%) | 0 (0.0%) |
| 6-Person Households | 0 (0.0%) | 0 (0.0%) |
| 7+ Person Households | 0 (0.0%) | 0 (0.0%) |
| Total | 134 (76.6%) | 41 (23.4%) |
Female Fertility in Roscoe
Fertility by Age in Roscoe
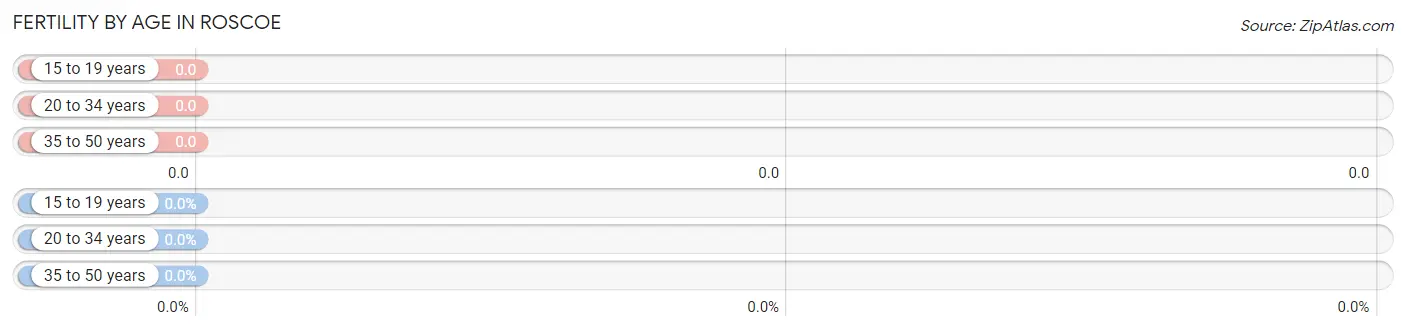
| Age Bracket | Women with Births | Births / 1,000 Women |
| 15 to 19 years | 0 (0.0%) | 0.0 |
| 20 to 34 years | 0 (0.0%) | 0.0 |
| 35 to 50 years | 0 (0.0%) | 0.0 |
| Total | 0 (0.0%) | 0.0 |
Fertility by Age by Marriage Status in Roscoe
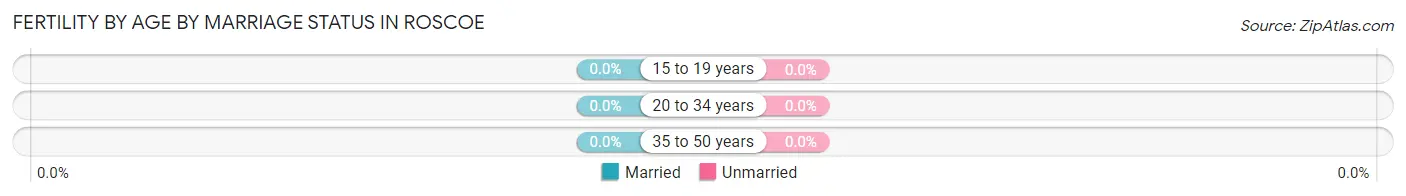
| Age Bracket | Married | Unmarried |
| 15 to 19 years | 0 (0.0%) | 0 (0.0%) |
| 20 to 34 years | 0 (0.0%) | 0 (0.0%) |
| 35 to 50 years | 0 (0.0%) | 0 (0.0%) |
| Total | 0 (0.0%) | 0 (0.0%) |
Fertility by Education in Roscoe
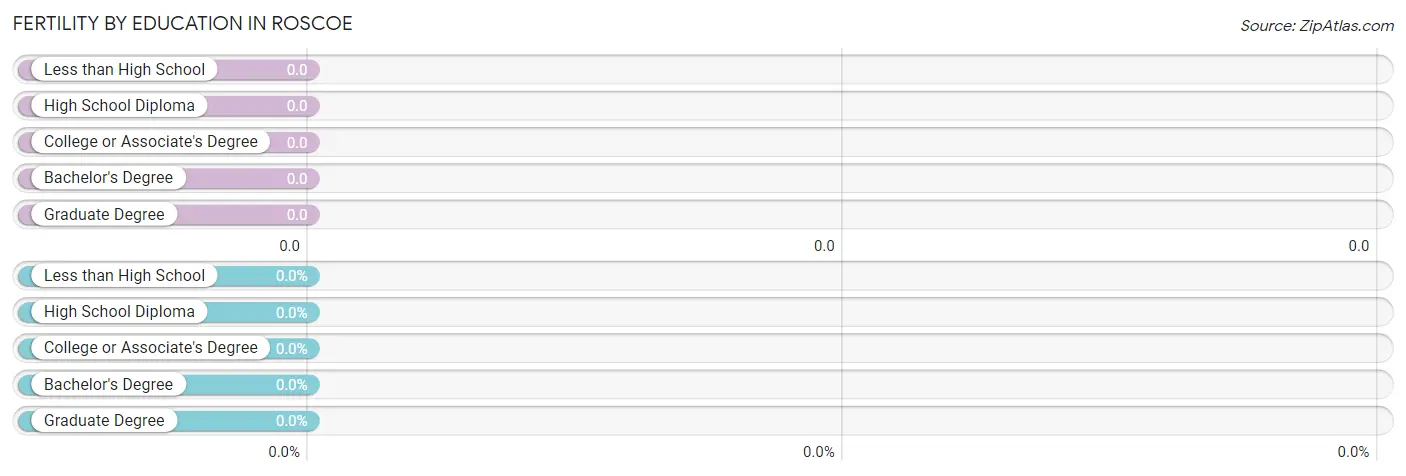
| Educational Attainment | Women with Births | Births / 1,000 Women |
| Less than High School | 0 (0.0%) | 0.0 |
| High School Diploma | 0 (0.0%) | 0.0 |
| College or Associate's Degree | 0 (0.0%) | 0.0 |
| Bachelor's Degree | 0 (0.0%) | 0.0 |
| Graduate Degree | 0 (0.0%) | 0.0 |
| Total | 0 (0.0%) | 0.0 |
Fertility by Education by Marriage Status in Roscoe
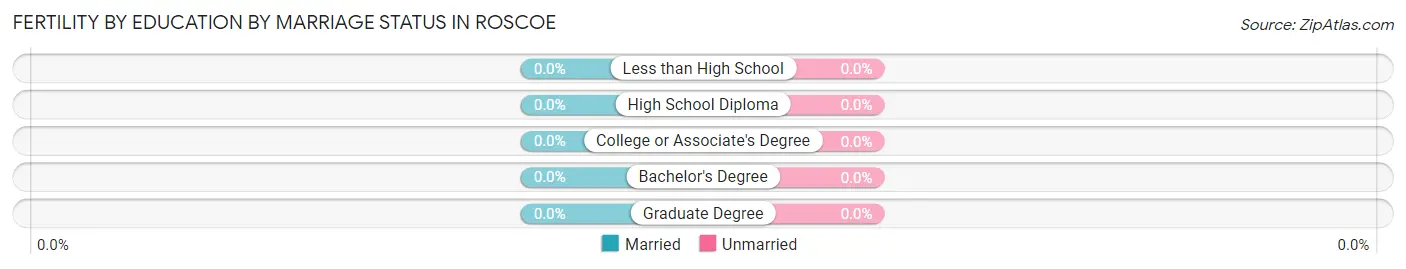
| Educational Attainment | Married | Unmarried |
| Less than High School | 0 (0.0%) | 0 (0.0%) |
| High School Diploma | 0 (0.0%) | 0 (0.0%) |
| College or Associate's Degree | 0 (0.0%) | 0 (0.0%) |
| Bachelor's Degree | 0 (0.0%) | 0 (0.0%) |
| Graduate Degree | 0 (0.0%) | 0 (0.0%) |
| Total | 0 (0.0%) | 0 (0.0%) |
Income in Roscoe
Income Overview in Roscoe
Per Capita Income in Roscoe is $22,957, while median incomes of families and households are $58,500 and $56,343 respectively.
| Characteristic | Number | Measure |
| Per Capita Income | 442 | $22,957 |
| Median Family Income | 134 | $58,500 |
| Mean Family Income | 134 | $63,031 |
| Median Household Income | 175 | $56,343 |
| Mean Household Income | 175 | $55,942 |
| Income Deficit | 134 | $0 |
| Wage / Income Gap (%) | 442 | 0.00% |
| Wage / Income Gap ($) | 442 | 100.00¢ per $1 |
| Gini / Inequality Index | 442 | 0.33 |
Earnings by Sex in Roscoe
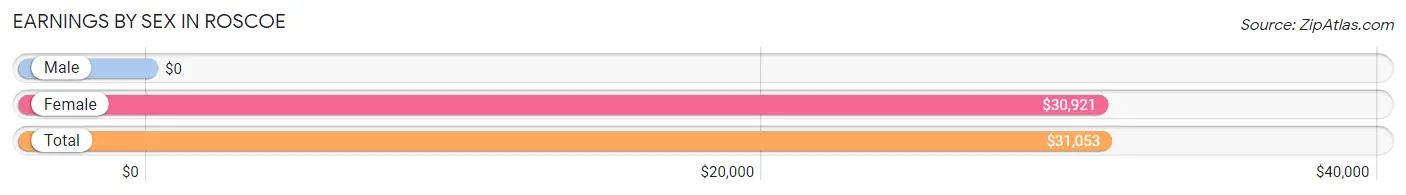
| Sex | Number | Average Earnings |
| Male | 100 (52.1%) | $0 |
| Female | 92 (47.9%) | $30,921 |
| Total | 192 (100.0%) | $31,053 |
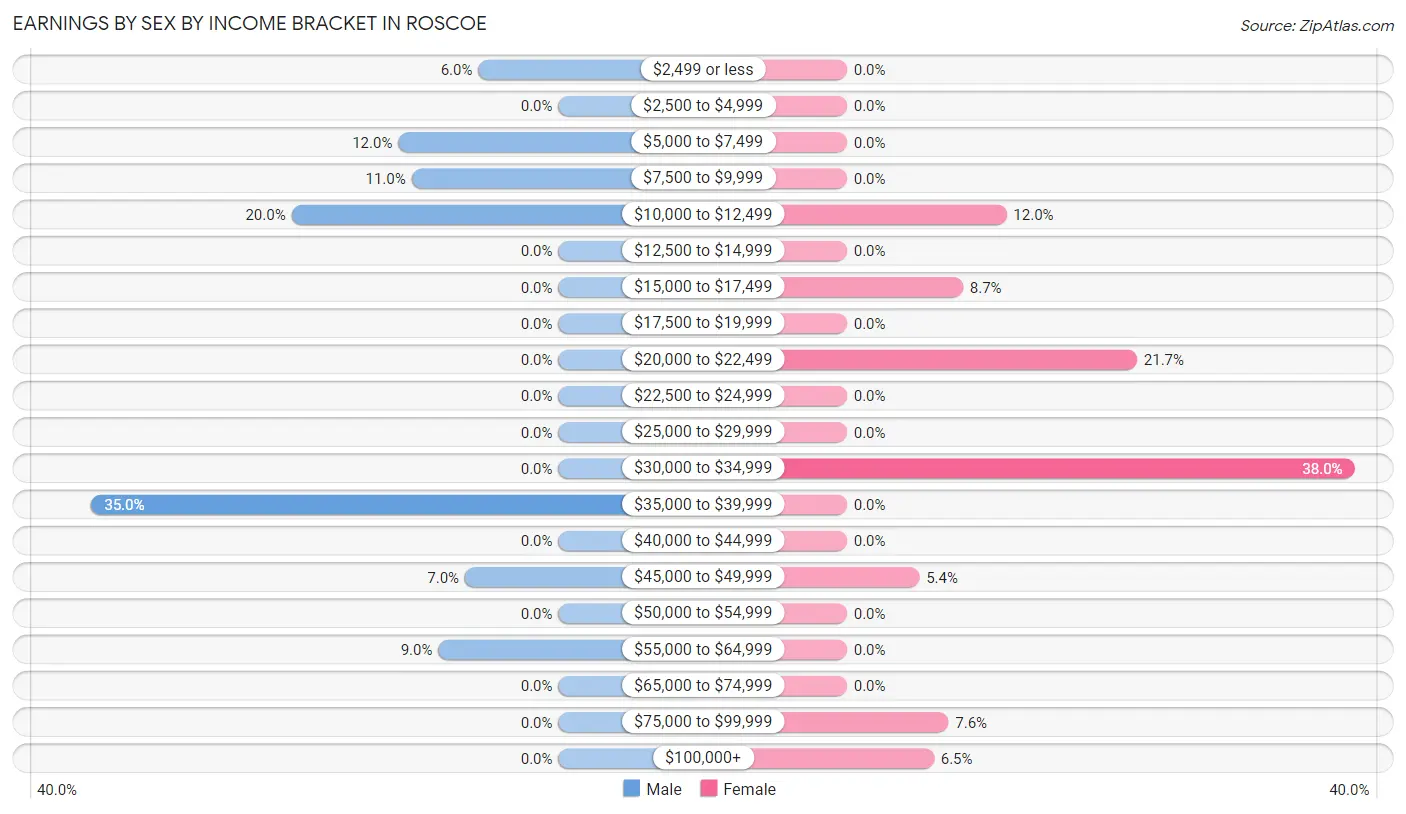
Earnings by Sex by Income Bracket in Roscoe
The most common earnings brackets in Roscoe are $35,000 to $39,999 for men (35 | 35.0%) and $30,000 to $34,999 for women (35 | 38.0%).
| Income | Male | Female |
| $2,499 or less | 6 (6.0%) | 0 (0.0%) |
| $2,500 to $4,999 | 0 (0.0%) | 0 (0.0%) |
| $5,000 to $7,499 | 12 (12.0%) | 0 (0.0%) |
| $7,500 to $9,999 | 11 (11.0%) | 0 (0.0%) |
| $10,000 to $12,499 | 20 (20.0%) | 11 (12.0%) |
| $12,500 to $14,999 | 0 (0.0%) | 0 (0.0%) |
| $15,000 to $17,499 | 0 (0.0%) | 8 (8.7%) |
| $17,500 to $19,999 | 0 (0.0%) | 0 (0.0%) |
| $20,000 to $22,499 | 0 (0.0%) | 20 (21.7%) |
| $22,500 to $24,999 | 0 (0.0%) | 0 (0.0%) |
| $25,000 to $29,999 | 0 (0.0%) | 0 (0.0%) |
| $30,000 to $34,999 | 0 (0.0%) | 35 (38.0%) |
| $35,000 to $39,999 | 35 (35.0%) | 0 (0.0%) |
| $40,000 to $44,999 | 0 (0.0%) | 0 (0.0%) |
| $45,000 to $49,999 | 7 (7.0%) | 5 (5.4%) |
| $50,000 to $54,999 | 0 (0.0%) | 0 (0.0%) |
| $55,000 to $64,999 | 9 (9.0%) | 0 (0.0%) |
| $65,000 to $74,999 | 0 (0.0%) | 0 (0.0%) |
| $75,000 to $99,999 | 0 (0.0%) | 7 (7.6%) |
| $100,000+ | 0 (0.0%) | 6 (6.5%) |
| Total | 100 (100.0%) | 92 (100.0%) |
Earnings by Sex by Educational Attainment in Roscoe
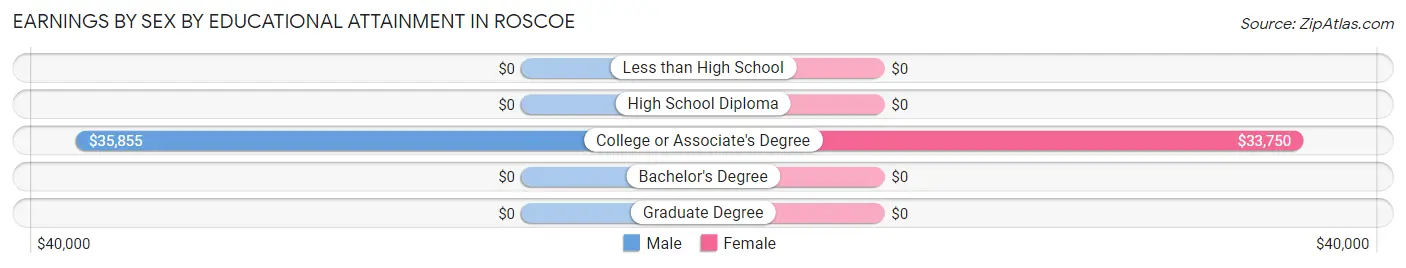
| Educational Attainment | Male Income | Female Income |
| Less than High School | - | - |
| High School Diploma | - | - |
| College or Associate's Degree | $35,855 | $33,750 |
| Bachelor's Degree | - | - |
| Graduate Degree | - | - |
| Total | - | - |
Family Income in Roscoe
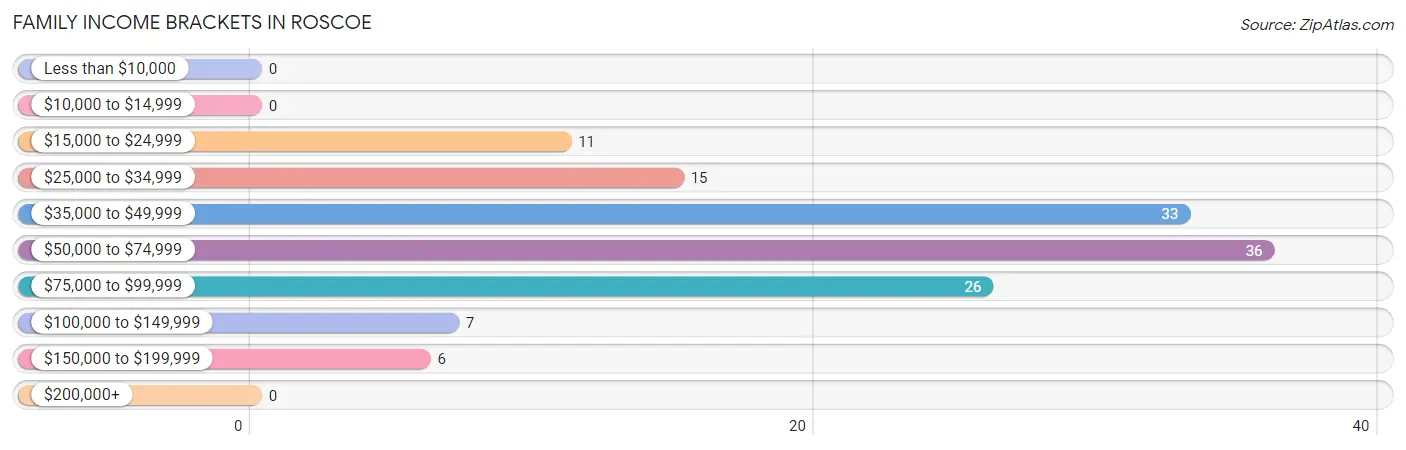
Family Income Brackets in Roscoe
According to the Roscoe family income data, there are 36 families falling into the $50,000 to $74,999 income range, which is the most common income bracket and makes up 26.9% of all families.
| Income Bracket | # Families | % Families |
| Less than $10,000 | 0 | 0.0% |
| $10,000 to $14,999 | 0 | 0.0% |
| $15,000 to $24,999 | 11 | 8.2% |
| $25,000 to $34,999 | 15 | 11.2% |
| $35,000 to $49,999 | 33 | 24.6% |
| $50,000 to $74,999 | 36 | 26.9% |
| $75,000 to $99,999 | 26 | 19.4% |
| $100,000 to $149,999 | 7 | 5.2% |
| $150,000 to $199,999 | 6 | 4.5% |
| $200,000+ | 0 | 0.0% |
Family Income by Famaliy Size in Roscoe
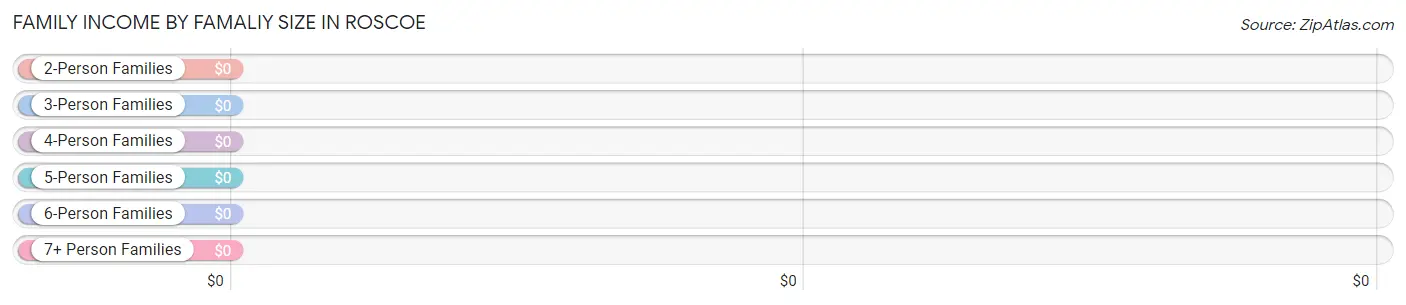
| Income Bracket | # Families | Median Income |
| 2-Person Families | 91 (67.9%) | $0 |
| 3-Person Families | 27 (20.2%) | $0 |
| 4-Person Families | 16 (11.9%) | $0 |
| 5-Person Families | 0 (0.0%) | $0 |
| 6-Person Families | 0 (0.0%) | $0 |
| 7+ Person Families | 0 (0.0%) | $0 |
| Total | 134 (100.0%) | $58,500 |
Family Income by Number of Earners in Roscoe
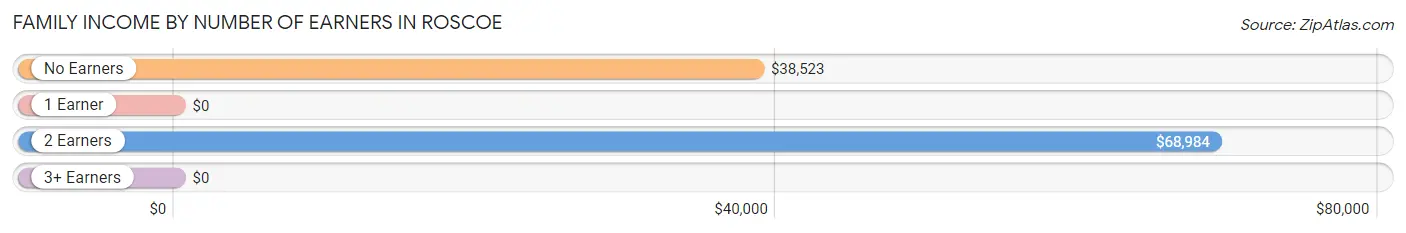
| Number of Earners | # Families | Median Income |
| No Earners | 48 (35.8%) | $38,523 |
| 1 Earner | 5 (3.7%) | $0 |
| 2 Earners | 81 (60.5%) | $68,984 |
| 3+ Earners | 0 (0.0%) | $0 |
| Total | 134 (100.0%) | $58,500 |
Household Income in Roscoe
Household Income Brackets in Roscoe
With 63 households falling in the category, the $50,000 to $74,999 income range is the most frequent in Roscoe, accounting for 36.0% of all households.
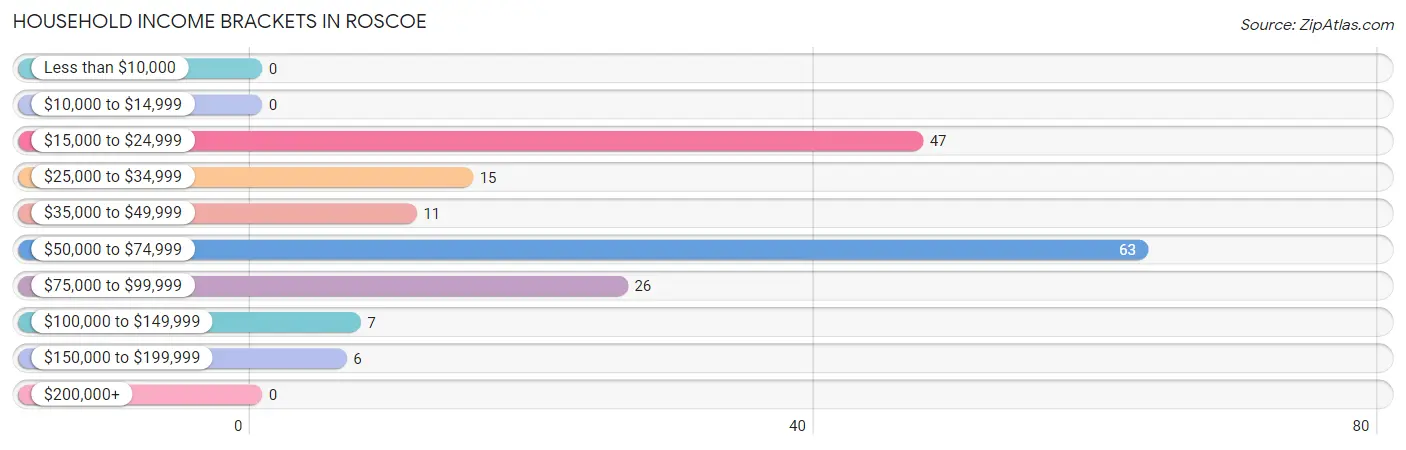
| Income Bracket | # Households | % Households |
| Less than $10,000 | 0 | 0.0% |
| $10,000 to $14,999 | 0 | 0.0% |
| $15,000 to $24,999 | 47 | 26.9% |
| $25,000 to $34,999 | 15 | 8.6% |
| $35,000 to $49,999 | 11 | 6.3% |
| $50,000 to $74,999 | 63 | 36.0% |
| $75,000 to $99,999 | 26 | 14.9% |
| $100,000 to $149,999 | 7 | 4.0% |
| $150,000 to $199,999 | 6 | 3.4% |
| $200,000+ | 0 | 0.0% |
Household Income by Householder Age in Roscoe
The median household income in Roscoe is $56,343, with the highest median household income of $63,750 found in the 45 to 64 years age bracket for the primary householder. A total of 90 households (51.4%) fall into this category.
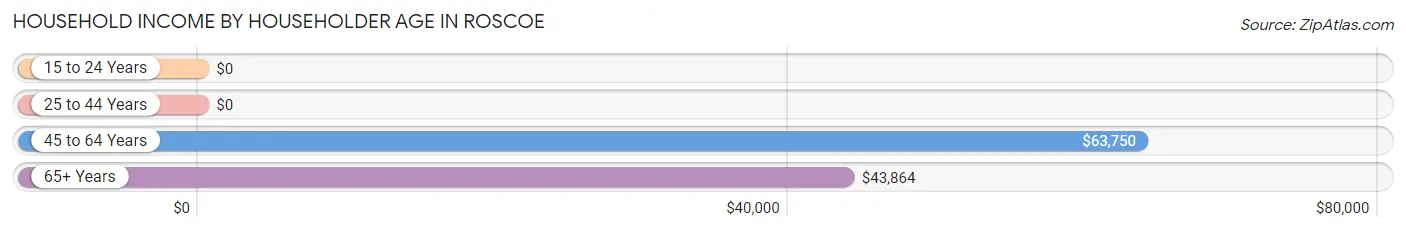
| Income Bracket | # Households | Median Income |
| 15 to 24 Years | 0 (0.0%) | $0 |
| 25 to 44 Years | 11 (6.3%) | $0 |
| 45 to 64 Years | 90 (51.4%) | $63,750 |
| 65+ Years | 74 (42.3%) | $43,864 |
| Total | 175 (100.0%) | $56,343 |
Poverty in Roscoe
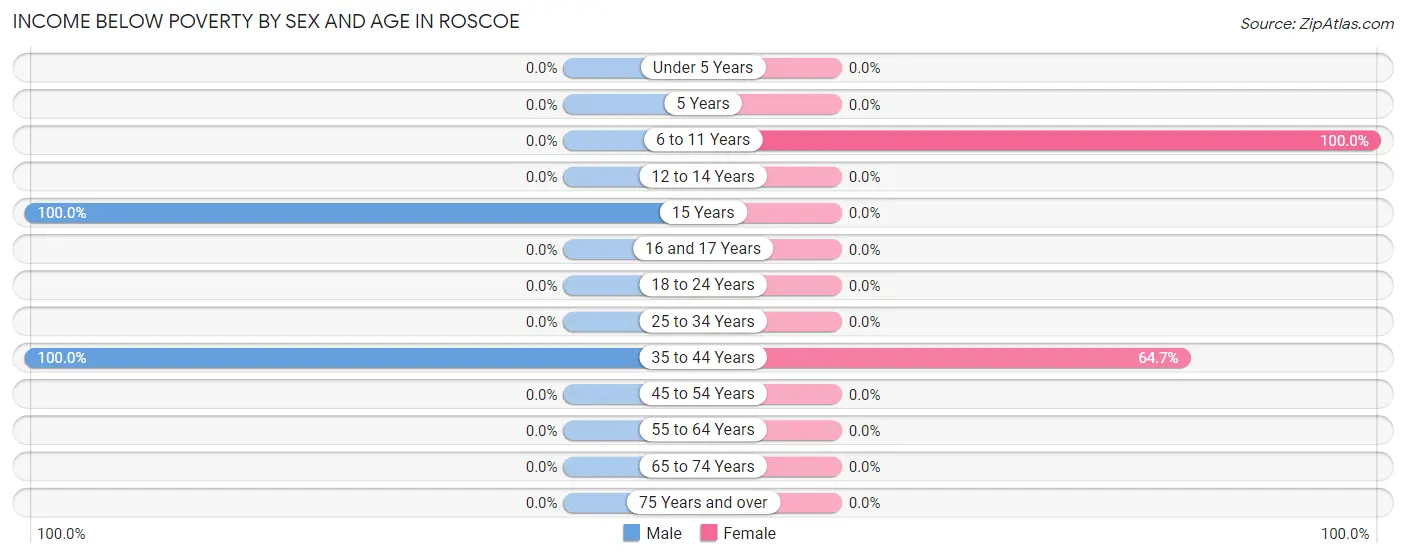
Income Below Poverty by Sex and Age in Roscoe
With 13.1% poverty level for males and 8.5% for females among the residents of Roscoe, 15 year old males and 6 to 11 year old females are the most vulnerable to poverty, with 13 males (100.0%) and 11 females (100.0%) in their respective age groups living below the poverty level.
| Age Bracket | Male | Female |
| Under 5 Years | 0 (0.0%) | 0 (0.0%) |
| 5 Years | 0 (0.0%) | 0 (0.0%) |
| 6 to 11 Years | 0 (0.0%) | 11 (100.0%) |
| 12 to 14 Years | 0 (0.0%) | 0 (0.0%) |
| 15 Years | 13 (100.0%) | 0 (0.0%) |
| 16 and 17 Years | 0 (0.0%) | 0 (0.0%) |
| 18 to 24 Years | 0 (0.0%) | 0 (0.0%) |
| 25 to 34 Years | 0 (0.0%) | 0 (0.0%) |
| 35 to 44 Years | 11 (100.0%) | 11 (64.7%) |
| 45 to 54 Years | 0 (0.0%) | 0 (0.0%) |
| 55 to 64 Years | 0 (0.0%) | 0 (0.0%) |
| 65 to 74 Years | 0 (0.0%) | 0 (0.0%) |
| 75 Years and over | 0 (0.0%) | 0 (0.0%) |
| Total | 24 (13.1%) | 22 (8.5%) |
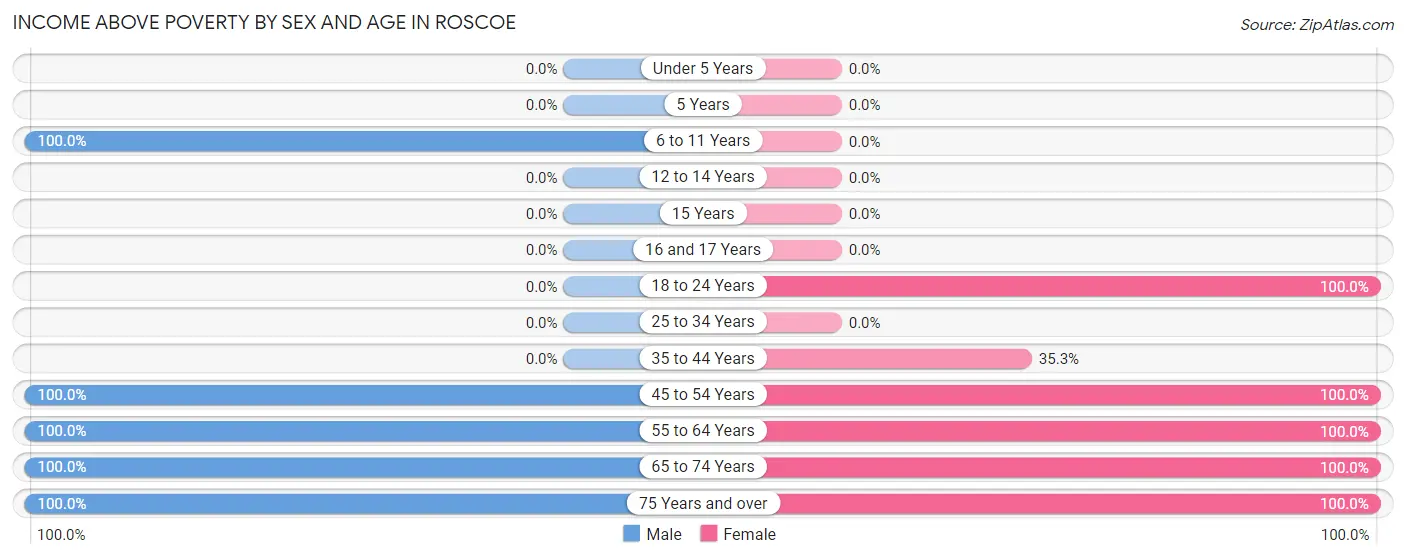
Income Above Poverty by Sex and Age in Roscoe
According to the poverty statistics in Roscoe, males aged 6 to 11 years and females aged 18 to 24 years are the age groups that are most secure financially, with 100.0% of males and 100.0% of females in these age groups living above the poverty line.
| Age Bracket | Male | Female |
| Under 5 Years | 0 (0.0%) | 0 (0.0%) |
| 5 Years | 0 (0.0%) | 0 (0.0%) |
| 6 to 11 Years | 12 (100.0%) | 0 (0.0%) |
| 12 to 14 Years | 0 (0.0%) | 0 (0.0%) |
| 15 Years | 0 (0.0%) | 0 (0.0%) |
| 16 and 17 Years | 0 (0.0%) | 0 (0.0%) |
| 18 to 24 Years | 0 (0.0%) | 8 (100.0%) |
| 25 to 34 Years | 0 (0.0%) | 0 (0.0%) |
| 35 to 44 Years | 0 (0.0%) | 6 (35.3%) |
| 45 to 54 Years | 37 (100.0%) | 74 (100.0%) |
| 55 to 64 Years | 57 (100.0%) | 22 (100.0%) |
| 65 to 74 Years | 43 (100.0%) | 122 (100.0%) |
| 75 Years and over | 10 (100.0%) | 5 (100.0%) |
| Total | 159 (86.9%) | 237 (91.5%) |
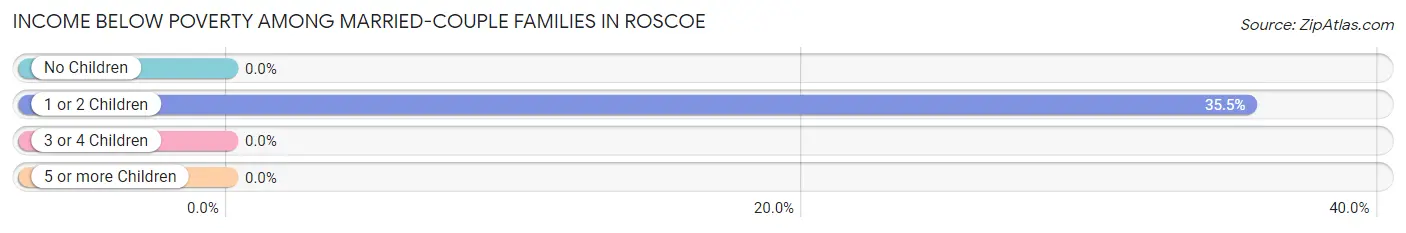
Income Below Poverty Among Married-Couple Families in Roscoe
The poverty statistics for married-couple families in Roscoe show that 9.8% or 11 of the total 112 families live below the poverty line. Families with 1 or 2 children have the highest poverty rate of 35.5%, comprising of 11 families. On the other hand, families with no children have the lowest poverty rate of 0.0%, which includes 0 families.
| Children | Above Poverty | Below Poverty |
| No Children | 81 (100.0%) | 0 (0.0%) |
| 1 or 2 Children | 20 (64.5%) | 11 (35.5%) |
| 3 or 4 Children | 0 (0.0%) | 0 (0.0%) |
| 5 or more Children | 0 (0.0%) | 0 (0.0%) |
| Total | 101 (90.2%) | 11 (9.8%) |
Income Below Poverty Among Single-Parent Households in Roscoe
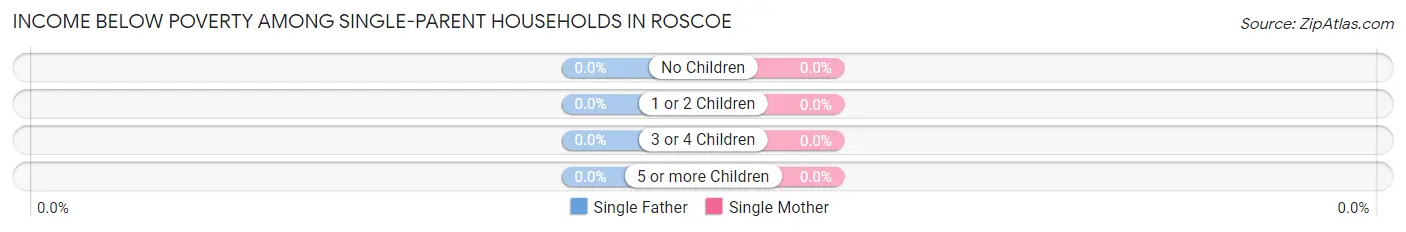
| Children | Single Father | Single Mother |
| No Children | 0 (0.0%) | 0 (0.0%) |
| 1 or 2 Children | 0 (0.0%) | 0 (0.0%) |
| 3 or 4 Children | 0 (0.0%) | 0 (0.0%) |
| 5 or more Children | 0 (0.0%) | 0 (0.0%) |
| Total | 0 (0.0%) | 0 (0.0%) |
Income Below Poverty Among Married-Couple vs Single-Parent Households in Roscoe
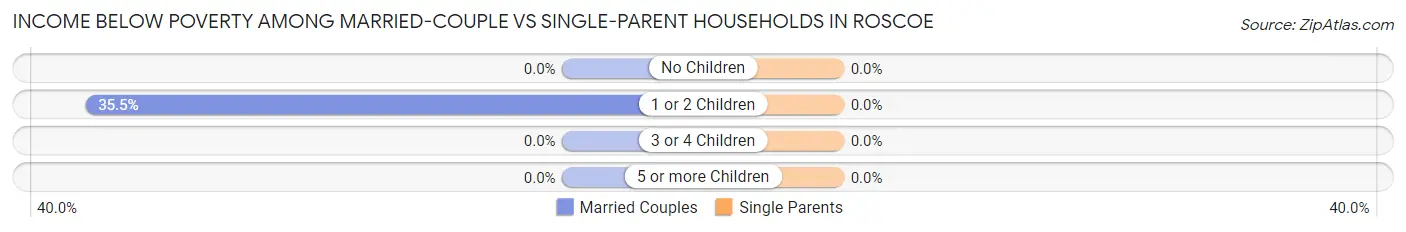
| Children | Married-Couple Families | Single-Parent Households |
| No Children | 0 (0.0%) | 0 (0.0%) |
| 1 or 2 Children | 11 (35.5%) | 0 (0.0%) |
| 3 or 4 Children | 0 (0.0%) | 0 (0.0%) |
| 5 or more Children | 0 (0.0%) | 0 (0.0%) |
| Total | 11 (9.8%) | 0 (0.0%) |
Employment Characteristics in Roscoe
Employment by Class of Employer in Roscoe
Among the 172 employed individuals in Roscoe, private company employees (69 | 40.1%), local government employees (45 | 26.2%), and self-employed (not incorporated) (36 | 20.9%) make up the most common classes of employment.
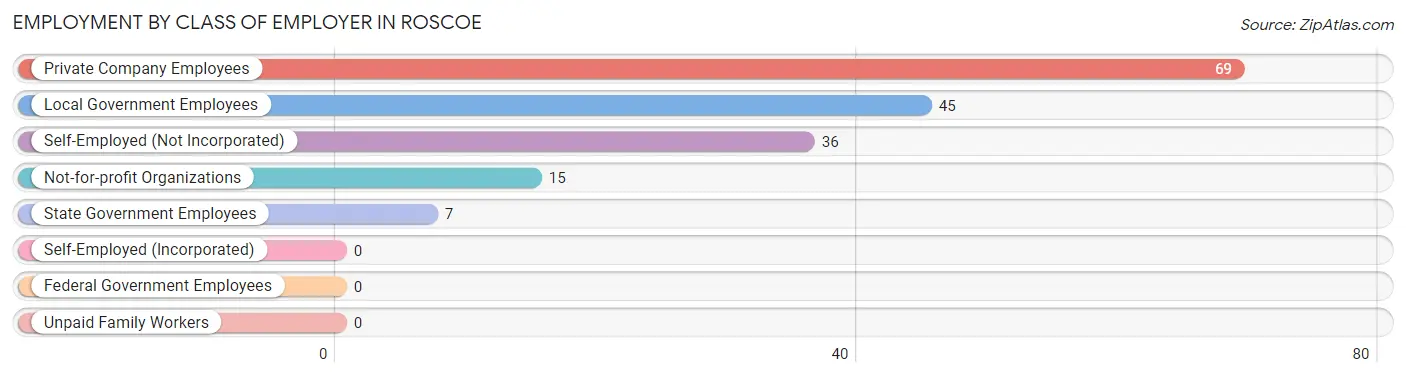
| Employer Class | # Employees | % Employees |
| Private Company Employees | 69 | 40.1% |
| Self-Employed (Incorporated) | 0 | 0.0% |
| Self-Employed (Not Incorporated) | 36 | 20.9% |
| Not-for-profit Organizations | 15 | 8.7% |
| Local Government Employees | 45 | 26.2% |
| State Government Employees | 7 | 4.1% |
| Federal Government Employees | 0 | 0.0% |
| Unpaid Family Workers | 0 | 0.0% |
| Total | 172 | 100.0% |
Employment Status by Age in Roscoe
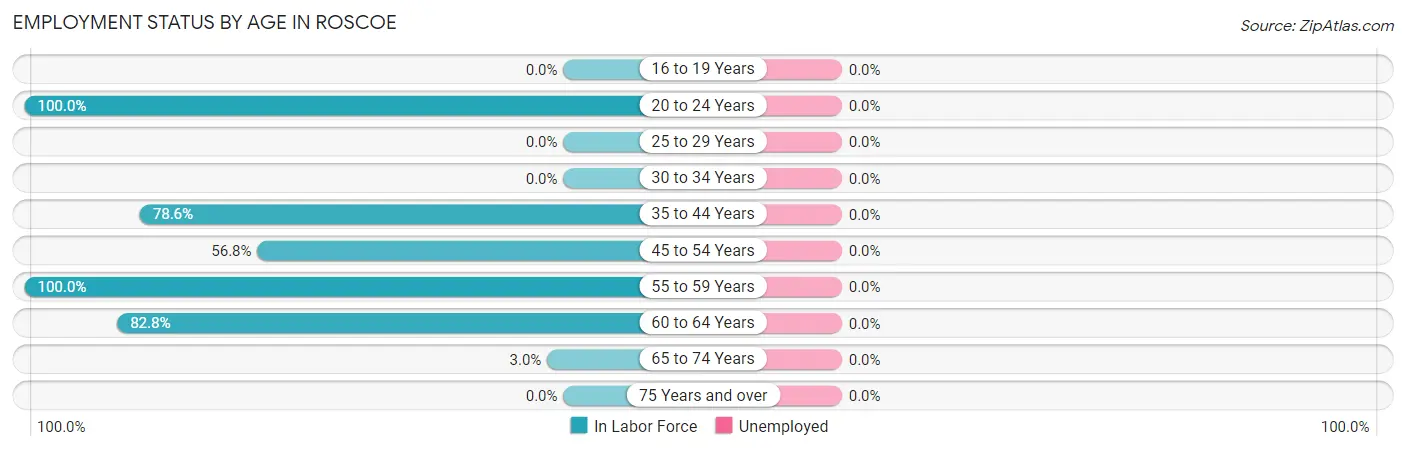
| Age Bracket | In Labor Force | Unemployed |
| 16 to 19 Years | 0 (0.0%) | 0 (0.0%) |
| 20 to 24 Years | 8 (100.0%) | 0 (0.0%) |
| 25 to 29 Years | 0 (0.0%) | 0 (0.0%) |
| 30 to 34 Years | 0 (0.0%) | 0 (0.0%) |
| 35 to 44 Years | 22 (78.6%) | 0 (0.0%) |
| 45 to 54 Years | 63 (56.8%) | 0 (0.0%) |
| 55 to 59 Years | 50 (100.0%) | 0 (0.0%) |
| 60 to 64 Years | 24 (82.8%) | 0 (0.0%) |
| 65 to 74 Years | 5 (3.0%) | 0 (0.0%) |
| 75 Years and over | 0 (0.0%) | 0 (0.0%) |
| Total | 172 (42.4%) | 0 (0.0%) |
Employment Status by Educational Attainment in Roscoe
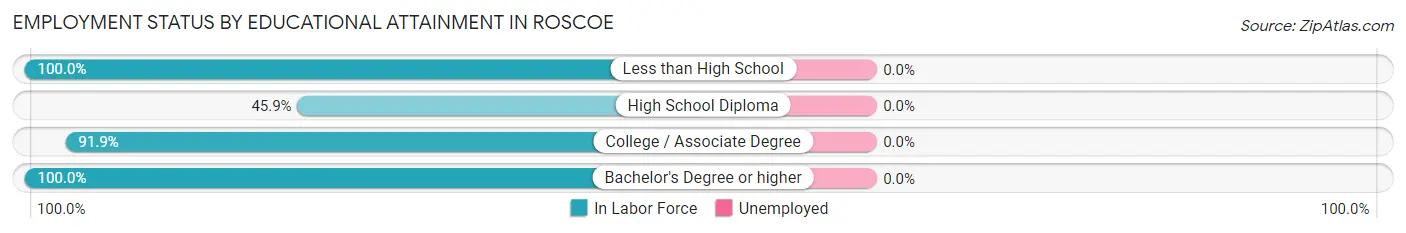
| Educational Attainment | In Labor Force | Unemployed |
| Less than High School | 19 (100.0%) | 0 (0.0%) |
| High School Diploma | 45 (45.9%) | 0 (0.0%) |
| College / Associate Degree | 68 (91.9%) | 0 (0.0%) |
| Bachelor's Degree or higher | 27 (100.0%) | 0 (0.0%) |
| Total | 159 (72.9%) | 0 (0.0%) |
Employment Occupations by Sex in Roscoe
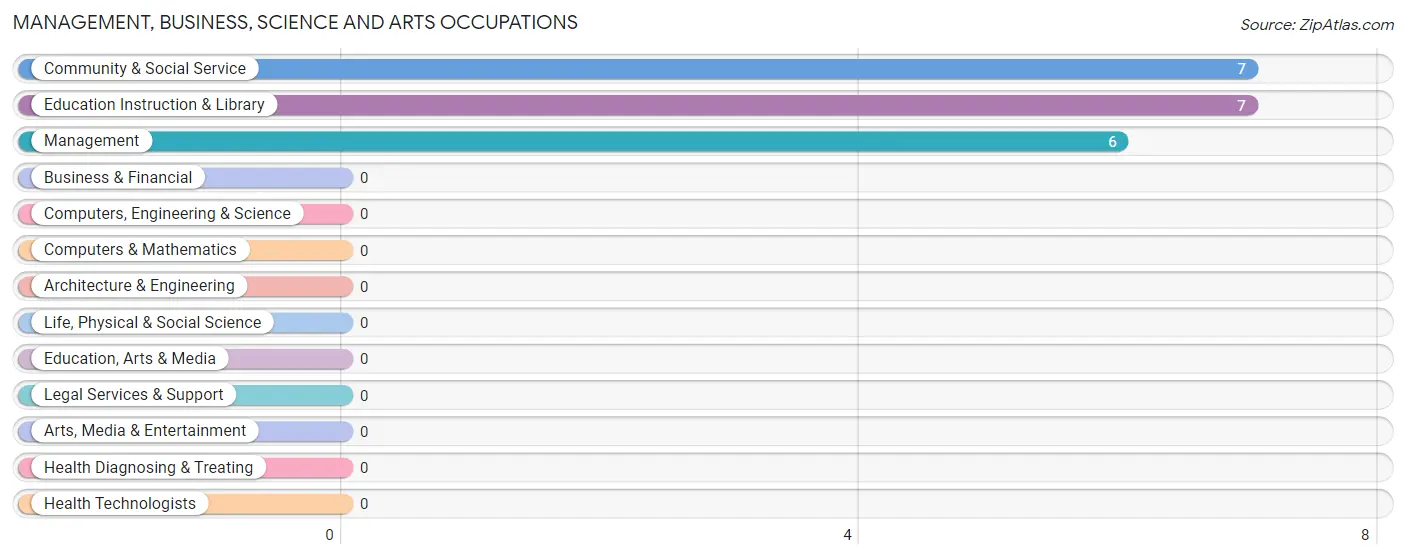
Management, Business, Science and Arts Occupations
The most common Management, Business, Science and Arts occupations in Roscoe are Community & Social Service (7 | 4.1%), Education Instruction & Library (7 | 4.1%), and Management (6 | 3.5%).
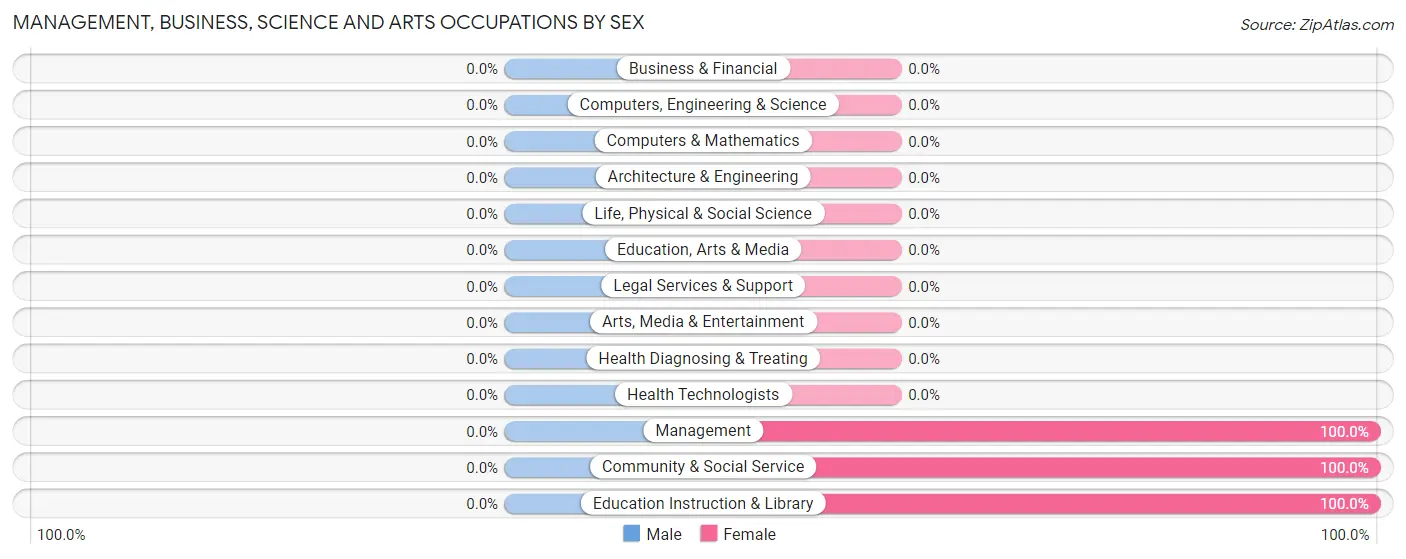
Management, Business, Science and Arts Occupations by Sex
| Occupation | Male | Female |
| Management | 0 (0.0%) | 6 (100.0%) |
| Business & Financial | 0 (0.0%) | 0 (0.0%) |
| Computers, Engineering & Science | 0 (0.0%) | 0 (0.0%) |
| Computers & Mathematics | 0 (0.0%) | 0 (0.0%) |
| Architecture & Engineering | 0 (0.0%) | 0 (0.0%) |
| Life, Physical & Social Science | 0 (0.0%) | 0 (0.0%) |
| Community & Social Service | 0 (0.0%) | 7 (100.0%) |
| Education, Arts & Media | 0 (0.0%) | 0 (0.0%) |
| Legal Services & Support | 0 (0.0%) | 0 (0.0%) |
| Education Instruction & Library | 0 (0.0%) | 7 (100.0%) |
| Arts, Media & Entertainment | 0 (0.0%) | 0 (0.0%) |
| Health Diagnosing & Treating | 0 (0.0%) | 0 (0.0%) |
| Health Technologists | 0 (0.0%) | 0 (0.0%) |
| Total (Category) | 0 (0.0%) | 13 (100.0%) |
| Total (Overall) | 100 (58.1%) | 72 (41.9%) |
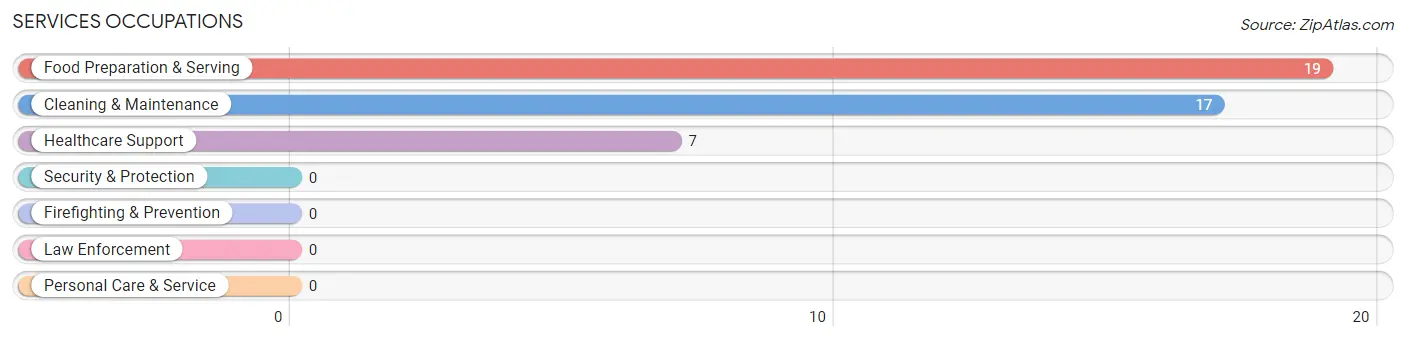
Services Occupations
The most common Services occupations in Roscoe are Food Preparation & Serving (19 | 11.1%), Cleaning & Maintenance (17 | 9.9%), and Healthcare Support (7 | 4.1%).
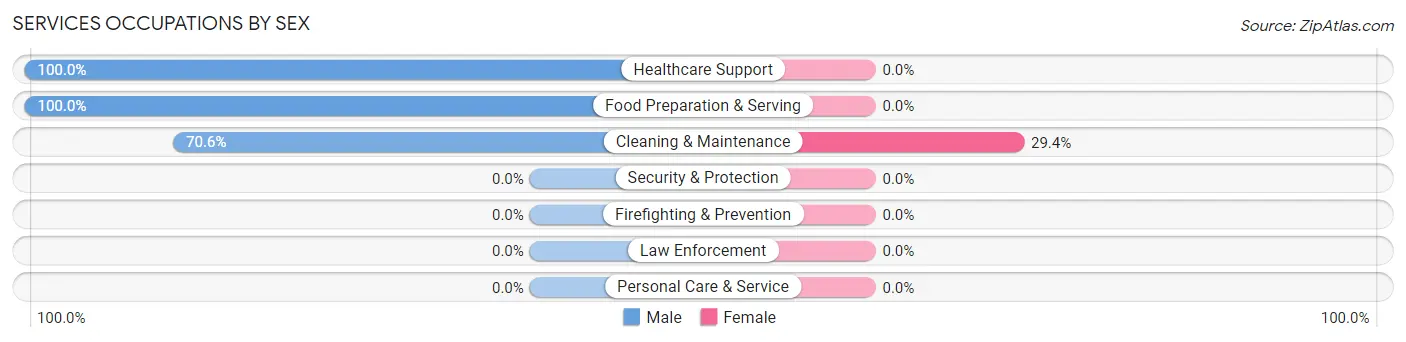
Services Occupations by Sex
| Occupation | Male | Female |
| Healthcare Support | 7 (100.0%) | 0 (0.0%) |
| Security & Protection | 0 (0.0%) | 0 (0.0%) |
| Firefighting & Prevention | 0 (0.0%) | 0 (0.0%) |
| Law Enforcement | 0 (0.0%) | 0 (0.0%) |
| Food Preparation & Serving | 19 (100.0%) | 0 (0.0%) |
| Cleaning & Maintenance | 12 (70.6%) | 5 (29.4%) |
| Personal Care & Service | 0 (0.0%) | 0 (0.0%) |
| Total (Category) | 38 (88.4%) | 5 (11.6%) |
| Total (Overall) | 100 (58.1%) | 72 (41.9%) |
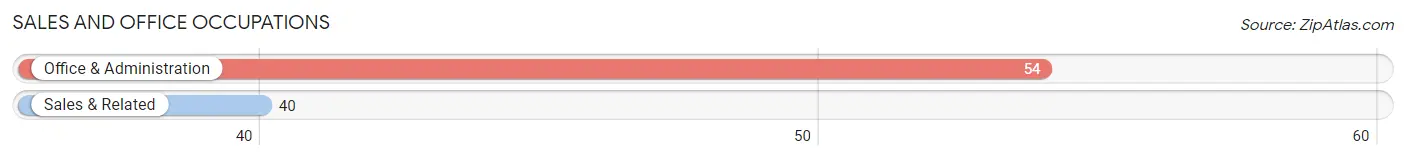
Sales and Office Occupations
The most common Sales and Office occupations in Roscoe are Office & Administration (54 | 31.4%), and Sales & Related (40 | 23.3%).
Sales and Office Occupations by Sex
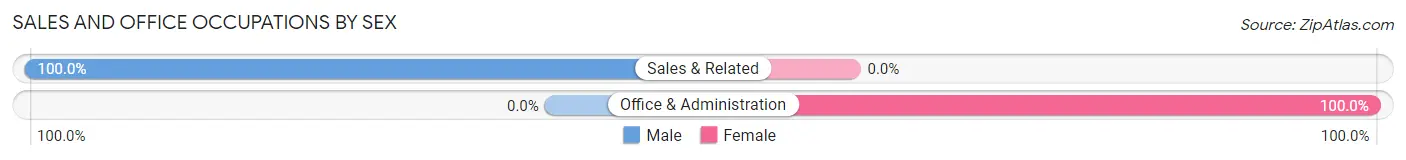
| Occupation | Male | Female |
| Sales & Related | 40 (100.0%) | 0 (0.0%) |
| Office & Administration | 0 (0.0%) | 54 (100.0%) |
| Total (Category) | 40 (42.5%) | 54 (57.5%) |
| Total (Overall) | 100 (58.1%) | 72 (41.9%) |
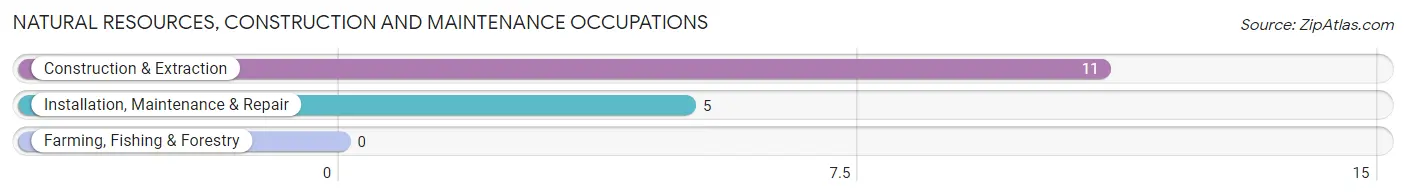
Natural Resources, Construction and Maintenance Occupations
The most common Natural Resources, Construction and Maintenance occupations in Roscoe are Construction & Extraction (11 | 6.4%), and Installation, Maintenance & Repair (5 | 2.9%).
Natural Resources, Construction and Maintenance Occupations by Sex
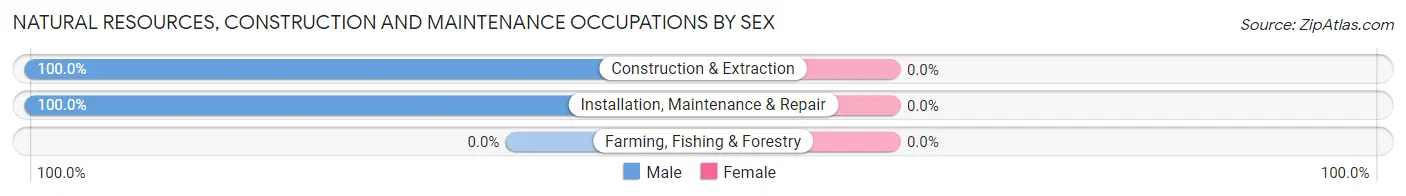
| Occupation | Male | Female |
| Farming, Fishing & Forestry | 0 (0.0%) | 0 (0.0%) |
| Construction & Extraction | 11 (100.0%) | 0 (0.0%) |
| Installation, Maintenance & Repair | 5 (100.0%) | 0 (0.0%) |
| Total (Category) | 16 (100.0%) | 0 (0.0%) |
| Total (Overall) | 100 (58.1%) | 72 (41.9%) |
Production, Transportation and Moving Occupations
The most common Production, Transportation and Moving occupations in Roscoe are , and Production (6 | 3.5%).
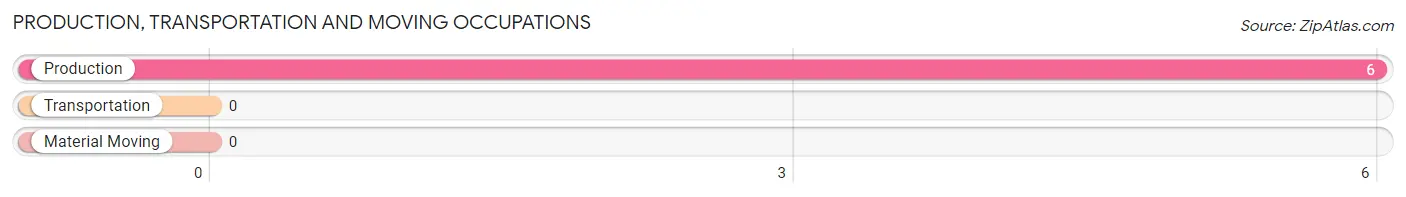
Production, Transportation and Moving Occupations by Sex
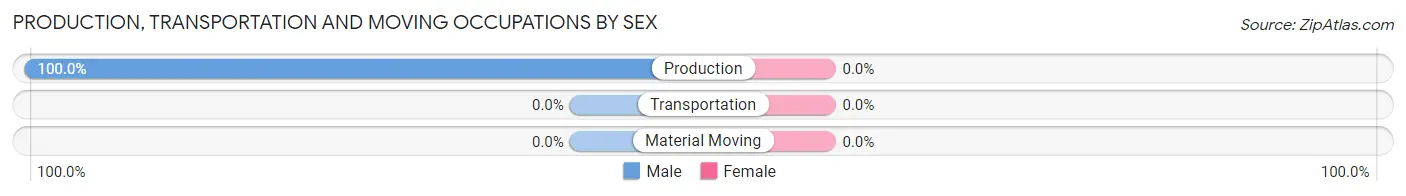
| Occupation | Male | Female |
| Production | 6 (100.0%) | 0 (0.0%) |
| Transportation | 0 (0.0%) | 0 (0.0%) |
| Material Moving | 0 (0.0%) | 0 (0.0%) |
| Total (Category) | 6 (100.0%) | 0 (0.0%) |
| Total (Overall) | 100 (58.1%) | 72 (41.9%) |
Employment Industries by Sex in Roscoe
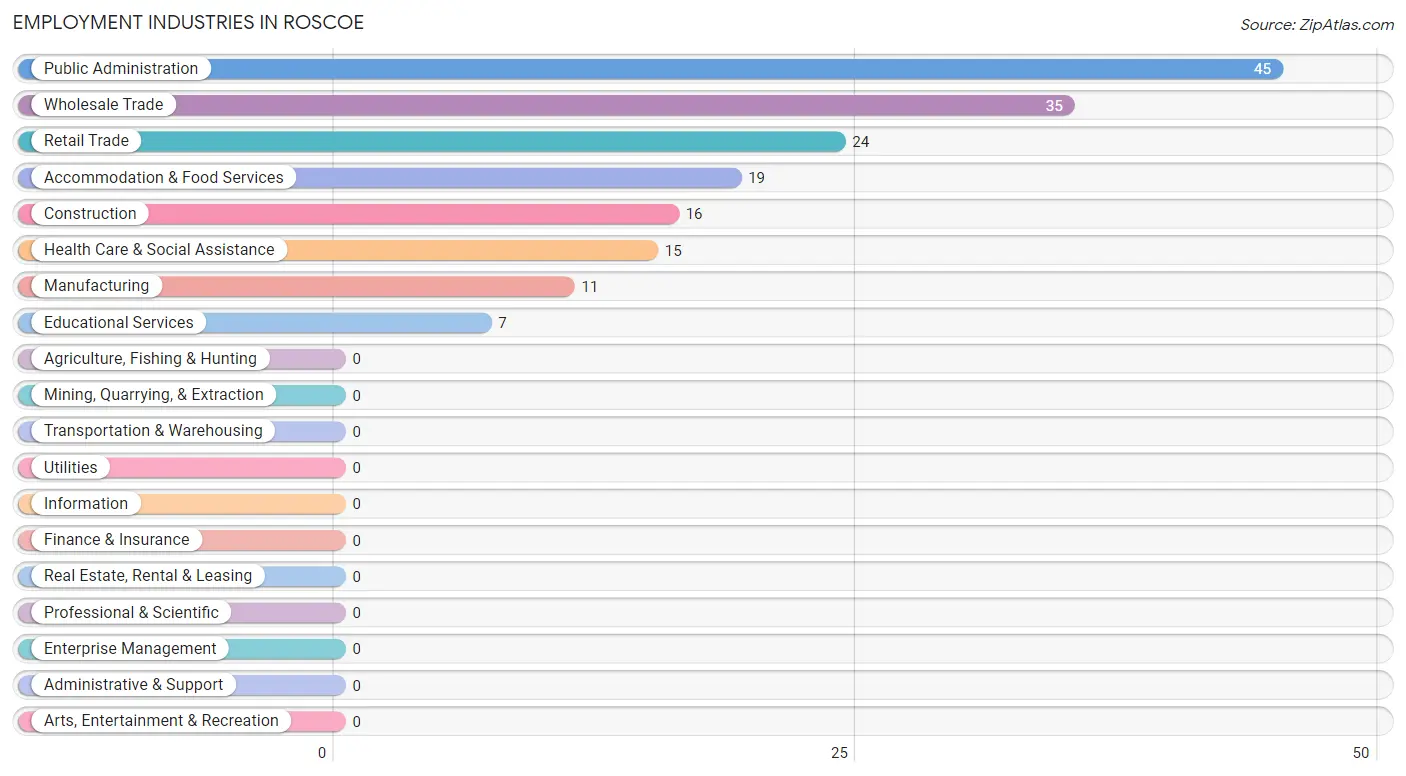
Employment Industries in Roscoe
The major employment industries in Roscoe include Public Administration (45 | 26.2%), Wholesale Trade (35 | 20.3%), Retail Trade (24 | 14.0%), Accommodation & Food Services (19 | 11.1%), and Construction (16 | 9.3%).
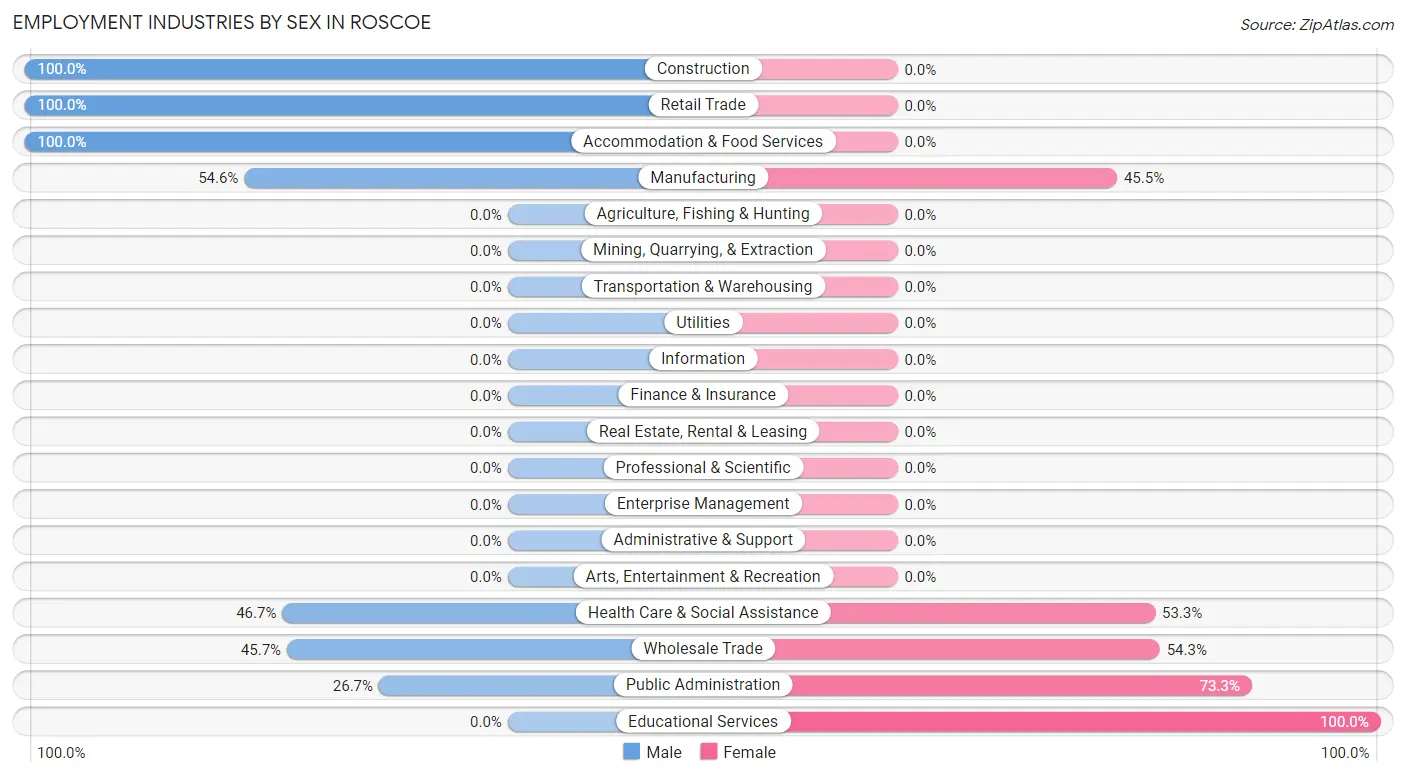
Employment Industries by Sex in Roscoe
The Roscoe industries that see more men than women are Construction (100.0%), Retail Trade (100.0%), and Accommodation & Food Services (100.0%), whereas the industries that tend to have a higher number of women are Educational Services (100.0%), Public Administration (73.3%), and Wholesale Trade (54.3%).
| Industry | Male | Female |
| Agriculture, Fishing & Hunting | 0 (0.0%) | 0 (0.0%) |
| Mining, Quarrying, & Extraction | 0 (0.0%) | 0 (0.0%) |
| Construction | 16 (100.0%) | 0 (0.0%) |
| Manufacturing | 6 (54.5%) | 5 (45.5%) |
| Wholesale Trade | 16 (45.7%) | 19 (54.3%) |
| Retail Trade | 24 (100.0%) | 0 (0.0%) |
| Transportation & Warehousing | 0 (0.0%) | 0 (0.0%) |
| Utilities | 0 (0.0%) | 0 (0.0%) |
| Information | 0 (0.0%) | 0 (0.0%) |
| Finance & Insurance | 0 (0.0%) | 0 (0.0%) |
| Real Estate, Rental & Leasing | 0 (0.0%) | 0 (0.0%) |
| Professional & Scientific | 0 (0.0%) | 0 (0.0%) |
| Enterprise Management | 0 (0.0%) | 0 (0.0%) |
| Administrative & Support | 0 (0.0%) | 0 (0.0%) |
| Educational Services | 0 (0.0%) | 7 (100.0%) |
| Health Care & Social Assistance | 7 (46.7%) | 8 (53.3%) |
| Arts, Entertainment & Recreation | 0 (0.0%) | 0 (0.0%) |
| Accommodation & Food Services | 19 (100.0%) | 0 (0.0%) |
| Public Administration | 12 (26.7%) | 33 (73.3%) |
| Total | 100 (58.1%) | 72 (41.9%) |
Education in Roscoe
School Enrollment in Roscoe
The most common levels of schooling among the 36 students in Roscoe are middle school (23 | 63.9%), and high school (13 | 36.1%).
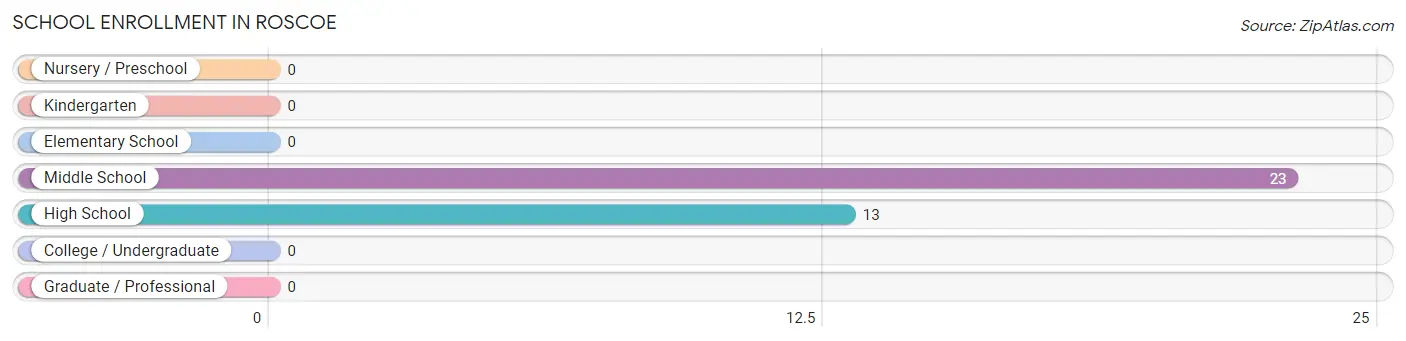
| School Level | # Students | % Students |
| Nursery / Preschool | 0 | 0.0% |
| Kindergarten | 0 | 0.0% |
| Elementary School | 0 | 0.0% |
| Middle School | 23 | 63.9% |
| High School | 13 | 36.1% |
| College / Undergraduate | 0 | 0.0% |
| Graduate / Professional | 0 | 0.0% |
| Total | 36 | 100.0% |
School Enrollment by Age by Funding Source in Roscoe
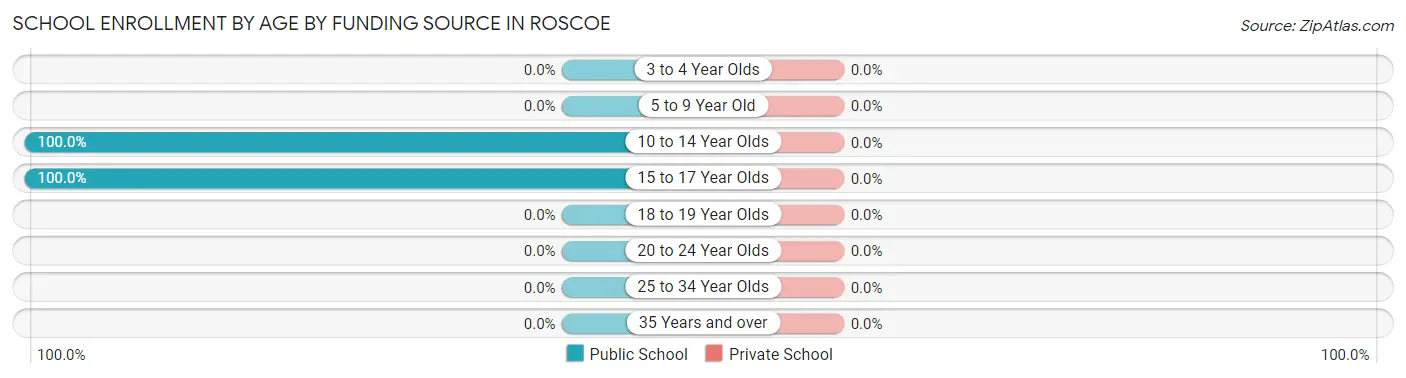
| Age Bracket | Public School | Private School |
| 3 to 4 Year Olds | 0 (0.0%) | 0 (0.0%) |
| 5 to 9 Year Old | 0 (0.0%) | 0 (0.0%) |
| 10 to 14 Year Olds | 23 (100.0%) | 0 (0.0%) |
| 15 to 17 Year Olds | 13 (100.0%) | 0 (0.0%) |
| 18 to 19 Year Olds | 0 (0.0%) | 0 (0.0%) |
| 20 to 24 Year Olds | 0 (0.0%) | 0 (0.0%) |
| 25 to 34 Year Olds | 0 (0.0%) | 0 (0.0%) |
| 35 Years and over | 0 (0.0%) | 0 (0.0%) |
| Total | 36 (100.0%) | 0 (0.0%) |
Educational Attainment by Field of Study in Roscoe
Bio, nature & agricultural (77 | 45.3%), science & technology (66 | 38.8%), arts & humanities (20 | 11.8%), and education (7 | 4.1%) are the most common fields of study among 170 individuals in Roscoe who have obtained a bachelor's degree or higher.
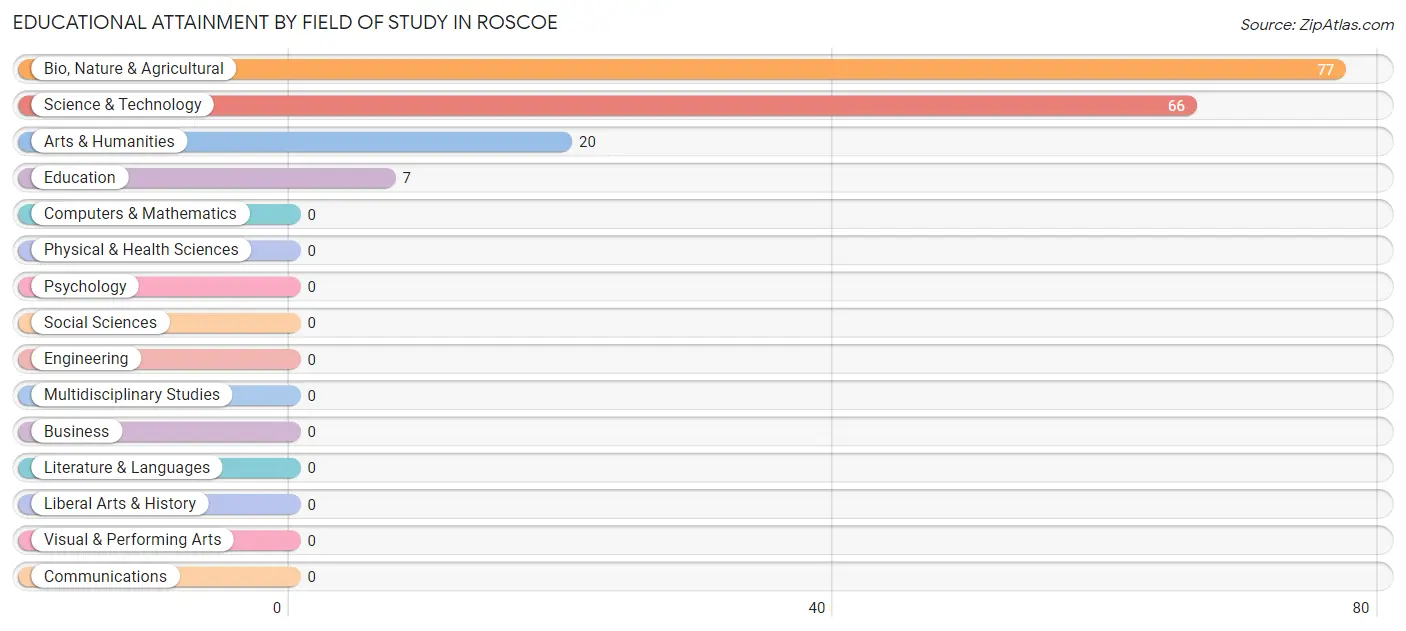
| Field of Study | # Graduates | % Graduates |
| Computers & Mathematics | 0 | 0.0% |
| Bio, Nature & Agricultural | 77 | 45.3% |
| Physical & Health Sciences | 0 | 0.0% |
| Psychology | 0 | 0.0% |
| Social Sciences | 0 | 0.0% |
| Engineering | 0 | 0.0% |
| Multidisciplinary Studies | 0 | 0.0% |
| Science & Technology | 66 | 38.8% |
| Business | 0 | 0.0% |
| Education | 7 | 4.1% |
| Literature & Languages | 0 | 0.0% |
| Liberal Arts & History | 0 | 0.0% |
| Visual & Performing Arts | 0 | 0.0% |
| Communications | 0 | 0.0% |
| Arts & Humanities | 20 | 11.8% |
| Total | 170 | 100.0% |
Transportation & Commute in Roscoe
Vehicle Availability by Sex in Roscoe
The most prevalent vehicle ownership categories in Roscoe are males with 2 vehicles (58, accounting for 58.0%) and females with 2 vehicles (46, making up 80.6%).
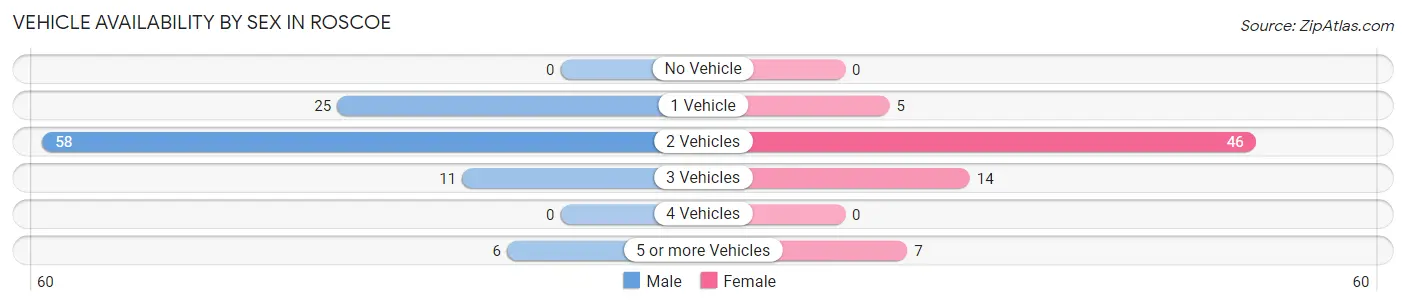
| Vehicles Available | Male | Female |
| No Vehicle | 0 (0.0%) | 0 (0.0%) |
| 1 Vehicle | 25 (25.0%) | 5 (6.9%) |
| 2 Vehicles | 58 (58.0%) | 46 (63.9%) |
| 3 Vehicles | 11 (11.0%) | 14 (19.4%) |
| 4 Vehicles | 0 (0.0%) | 0 (0.0%) |
| 5 or more Vehicles | 6 (6.0%) | 7 (9.7%) |
| Total | 100 (100.0%) | 72 (100.0%) |
Commute Time in Roscoe
The most frequently occuring commute durations in Roscoe are less than 5 minutes (40 commuters, 23.3%), 10 to 14 minutes (38 commuters, 22.1%), and 25 to 29 minutes (28 commuters, 16.3%).
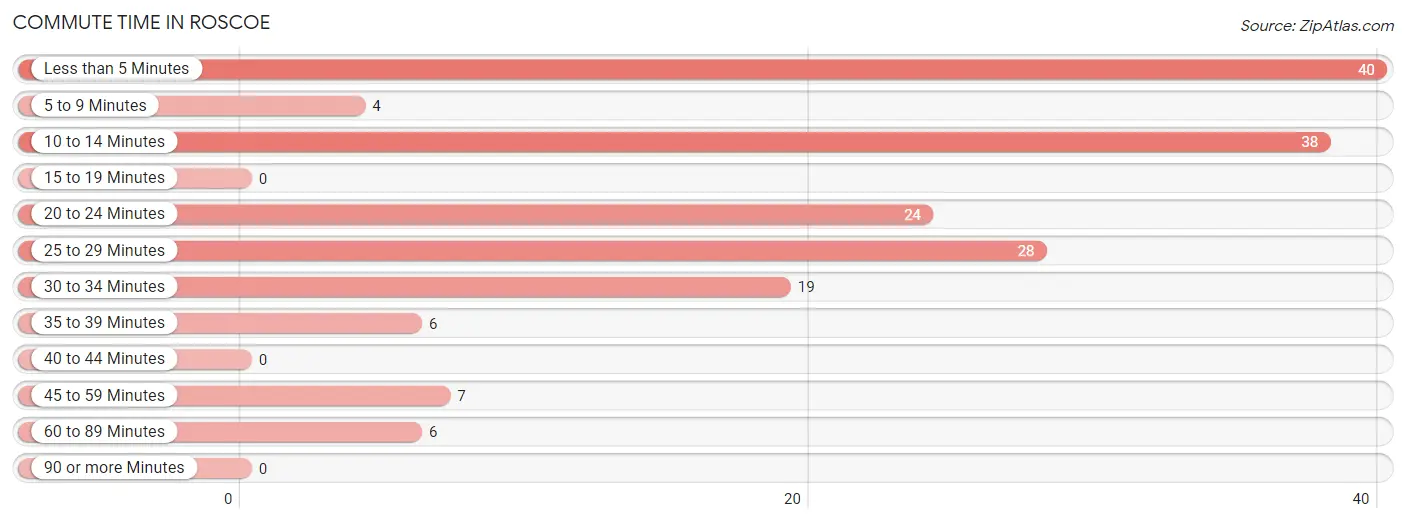
| Commute Time | # Commuters | % Commuters |
| Less than 5 Minutes | 40 | 23.3% |
| 5 to 9 Minutes | 4 | 2.3% |
| 10 to 14 Minutes | 38 | 22.1% |
| 15 to 19 Minutes | 0 | 0.0% |
| 20 to 24 Minutes | 24 | 14.0% |
| 25 to 29 Minutes | 28 | 16.3% |
| 30 to 34 Minutes | 19 | 11.1% |
| 35 to 39 Minutes | 6 | 3.5% |
| 40 to 44 Minutes | 0 | 0.0% |
| 45 to 59 Minutes | 7 | 4.1% |
| 60 to 89 Minutes | 6 | 3.5% |
| 90 or more Minutes | 0 | 0.0% |
Commute Time by Sex in Roscoe
The most common commute times in Roscoe are less than 5 minutes (40 commuters, 40.0%) for males and 20 to 24 minutes (24 commuters, 33.3%) for females.
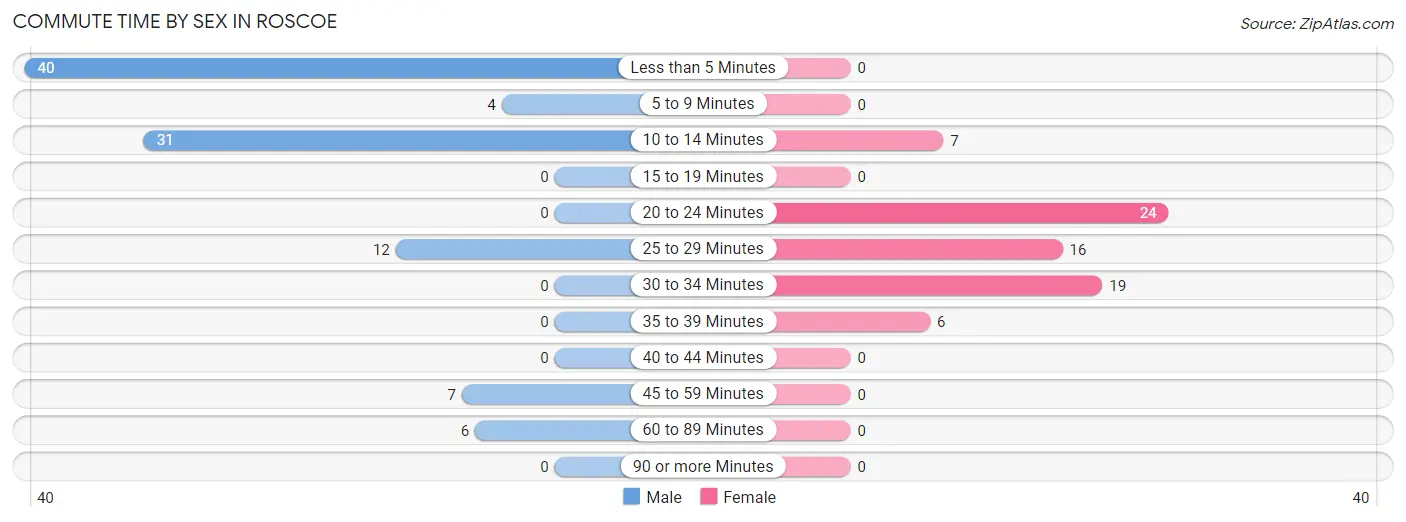
| Commute Time | Male | Female |
| Less than 5 Minutes | 40 (40.0%) | 0 (0.0%) |
| 5 to 9 Minutes | 4 (4.0%) | 0 (0.0%) |
| 10 to 14 Minutes | 31 (31.0%) | 7 (9.7%) |
| 15 to 19 Minutes | 0 (0.0%) | 0 (0.0%) |
| 20 to 24 Minutes | 0 (0.0%) | 24 (33.3%) |
| 25 to 29 Minutes | 12 (12.0%) | 16 (22.2%) |
| 30 to 34 Minutes | 0 (0.0%) | 19 (26.4%) |
| 35 to 39 Minutes | 0 (0.0%) | 6 (8.3%) |
| 40 to 44 Minutes | 0 (0.0%) | 0 (0.0%) |
| 45 to 59 Minutes | 7 (7.0%) | 0 (0.0%) |
| 60 to 89 Minutes | 6 (6.0%) | 0 (0.0%) |
| 90 or more Minutes | 0 (0.0%) | 0 (0.0%) |
Time of Departure to Work by Sex in Roscoe
The most frequent times of departure to work in Roscoe are 7:30 AM to 7:59 AM (51, 51.0%) for males and 8:00 AM to 8:29 AM (29, 40.3%) for females.
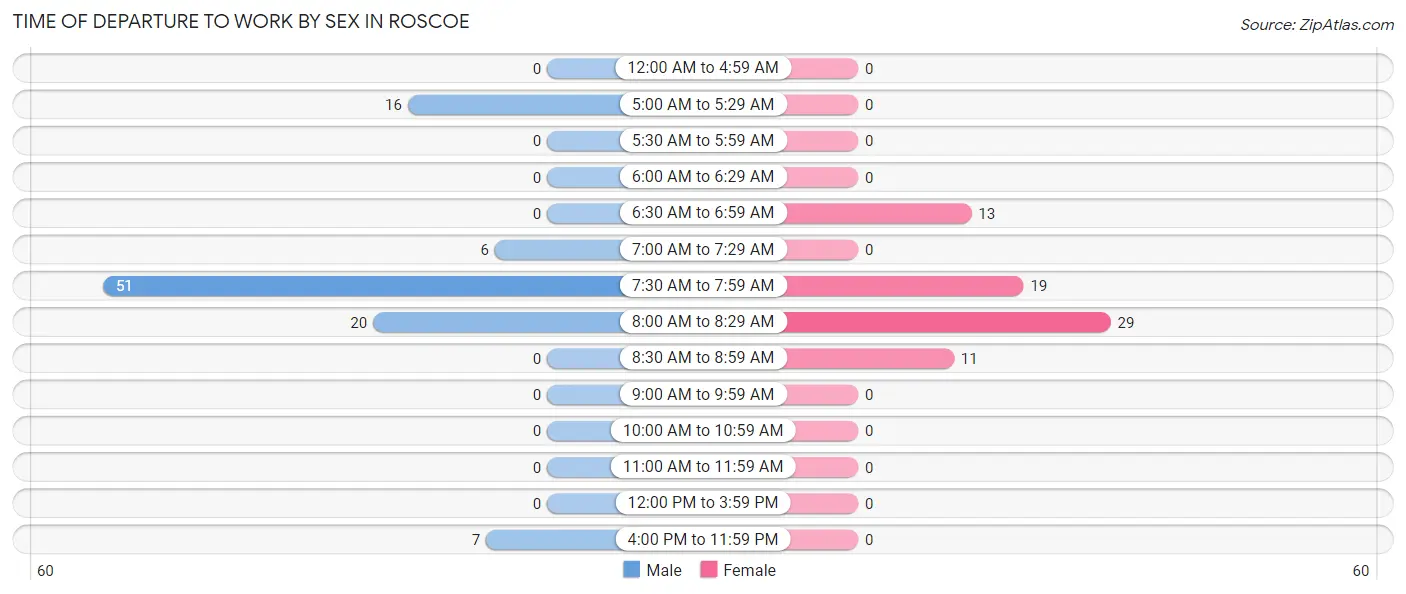
| Time of Departure | Male | Female |
| 12:00 AM to 4:59 AM | 0 (0.0%) | 0 (0.0%) |
| 5:00 AM to 5:29 AM | 16 (16.0%) | 0 (0.0%) |
| 5:30 AM to 5:59 AM | 0 (0.0%) | 0 (0.0%) |
| 6:00 AM to 6:29 AM | 0 (0.0%) | 0 (0.0%) |
| 6:30 AM to 6:59 AM | 0 (0.0%) | 13 (18.1%) |
| 7:00 AM to 7:29 AM | 6 (6.0%) | 0 (0.0%) |
| 7:30 AM to 7:59 AM | 51 (51.0%) | 19 (26.4%) |
| 8:00 AM to 8:29 AM | 20 (20.0%) | 29 (40.3%) |
| 8:30 AM to 8:59 AM | 0 (0.0%) | 11 (15.3%) |
| 9:00 AM to 9:59 AM | 0 (0.0%) | 0 (0.0%) |
| 10:00 AM to 10:59 AM | 0 (0.0%) | 0 (0.0%) |
| 11:00 AM to 11:59 AM | 0 (0.0%) | 0 (0.0%) |
| 12:00 PM to 3:59 PM | 0 (0.0%) | 0 (0.0%) |
| 4:00 PM to 11:59 PM | 7 (7.0%) | 0 (0.0%) |
| Total | 100 (100.0%) | 72 (100.0%) |
Housing Occupancy in Roscoe
Occupancy by Ownership in Roscoe
Of the total 175 dwellings in Roscoe, owner-occupied units account for 148 (84.6%), while renter-occupied units make up 27 (15.4%).
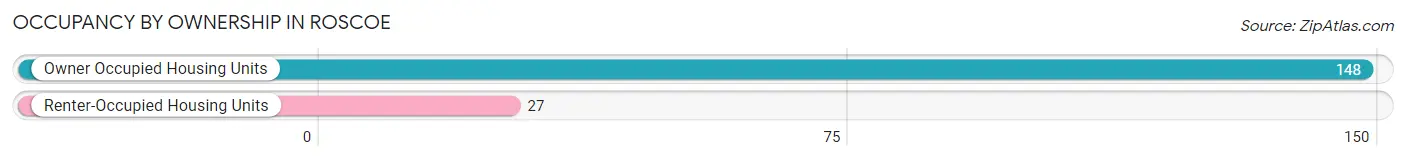
| Occupancy | # Housing Units | % Housing Units |
| Owner Occupied Housing Units | 148 | 84.6% |
| Renter-Occupied Housing Units | 27 | 15.4% |
| Total Occupied Housing Units | 175 | 100.0% |
Occupancy by Household Size in Roscoe
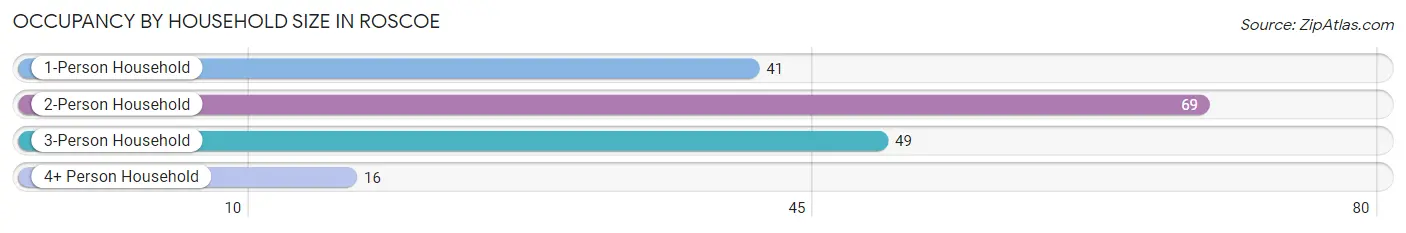
| Household Size | # Housing Units | % Housing Units |
| 1-Person Household | 41 | 23.4% |
| 2-Person Household | 69 | 39.4% |
| 3-Person Household | 49 | 28.0% |
| 4+ Person Household | 16 | 9.1% |
| Total Housing Units | 175 | 100.0% |
Occupancy by Ownership by Household Size in Roscoe
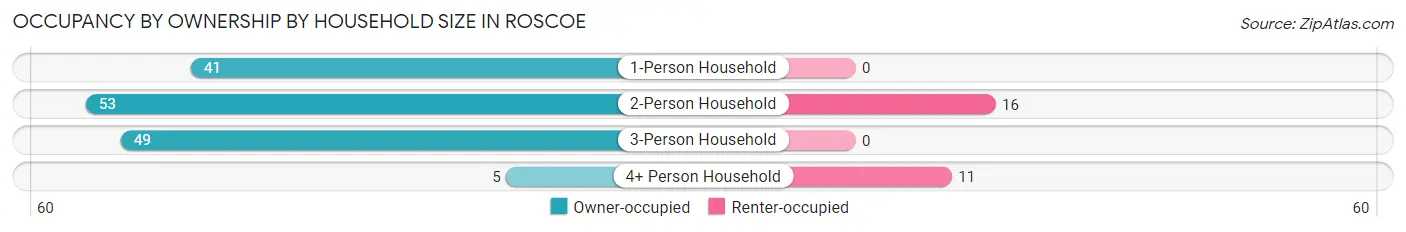
| Household Size | Owner-occupied | Renter-occupied |
| 1-Person Household | 41 (100.0%) | 0 (0.0%) |
| 2-Person Household | 53 (76.8%) | 16 (23.2%) |
| 3-Person Household | 49 (100.0%) | 0 (0.0%) |
| 4+ Person Household | 5 (31.2%) | 11 (68.8%) |
| Total Housing Units | 148 (84.6%) | 27 (15.4%) |
Occupancy by Educational Attainment in Roscoe
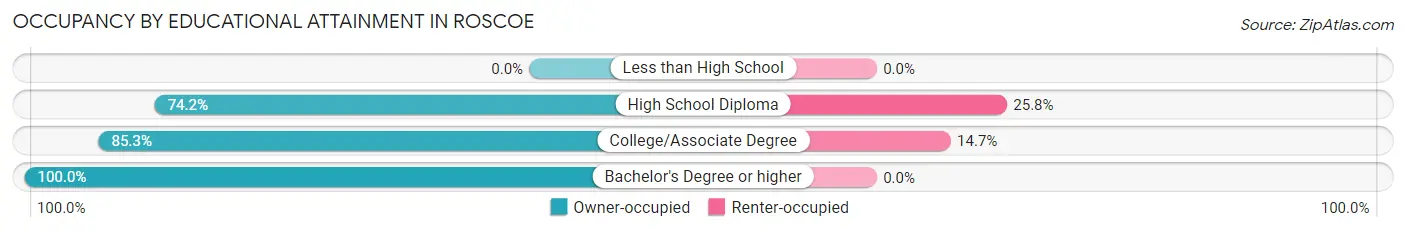
| Household Size | Owner-occupied | Renter-occupied |
| Less than High School | 0 (0.0%) | 0 (0.0%) |
| High School Diploma | 46 (74.2%) | 16 (25.8%) |
| College/Associate Degree | 64 (85.3%) | 11 (14.7%) |
| Bachelor's Degree or higher | 38 (100.0%) | 0 (0.0%) |
Occupancy by Age of Householder in Roscoe
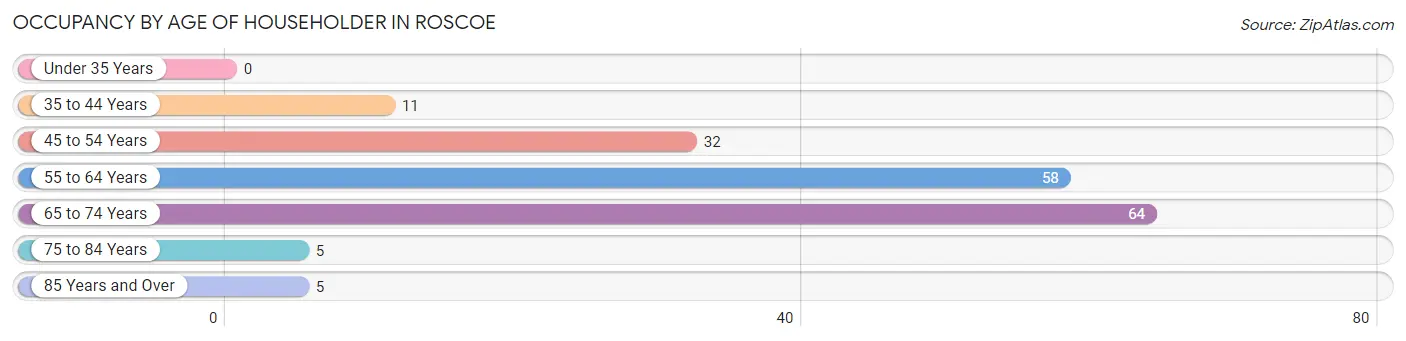
| Age Bracket | # Households | % Households |
| Under 35 Years | 0 | 0.0% |
| 35 to 44 Years | 11 | 6.3% |
| 45 to 54 Years | 32 | 18.3% |
| 55 to 64 Years | 58 | 33.1% |
| 65 to 74 Years | 64 | 36.6% |
| 75 to 84 Years | 5 | 2.9% |
| 85 Years and Over | 5 | 2.9% |
| Total | 175 | 100.0% |
Housing Finances in Roscoe
Median Income by Occupancy in Roscoe
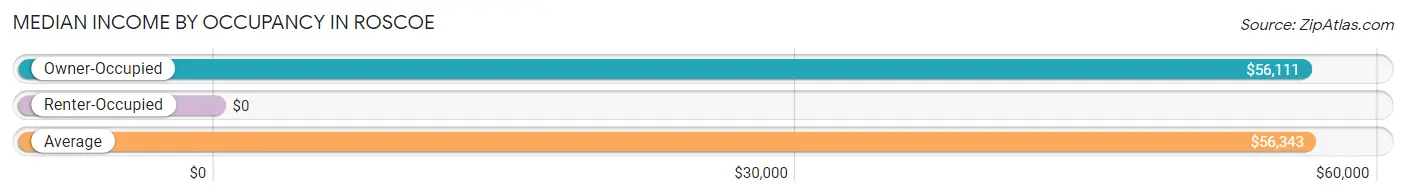
| Occupancy Type | # Households | Median Income |
| Owner-Occupied | 148 (84.6%) | $56,111 |
| Renter-Occupied | 27 (15.4%) | $0 |
| Average | 175 (100.0%) | $56,343 |
Occupancy by Householder Income Bracket in Roscoe
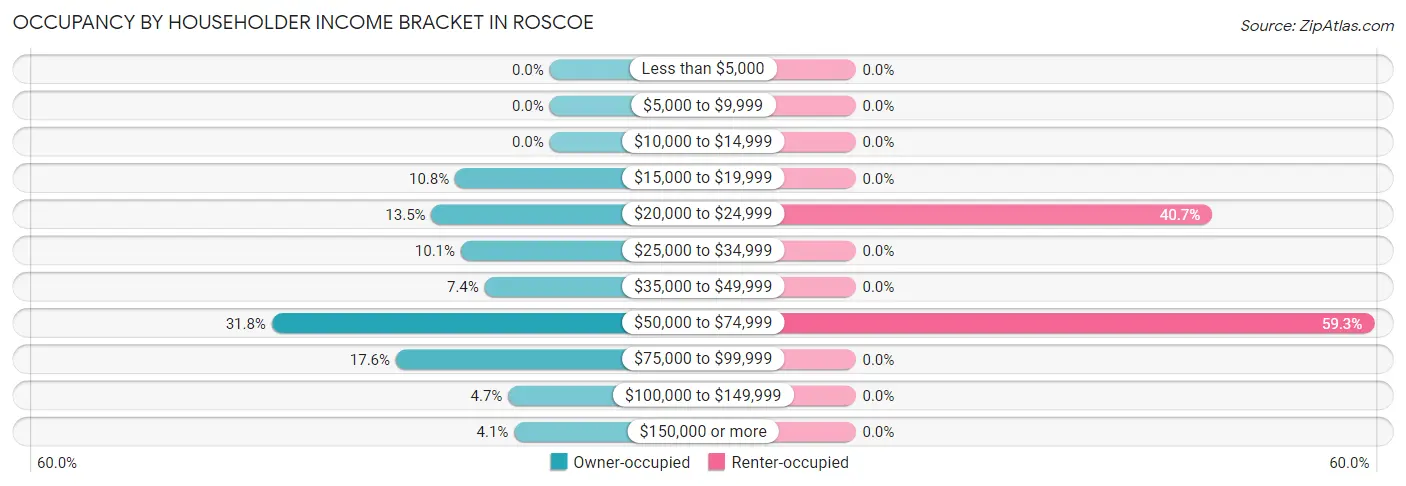
| Income Bracket | Owner-occupied | Renter-occupied |
| Less than $5,000 | 0 (0.0%) | 0 (0.0%) |
| $5,000 to $9,999 | 0 (0.0%) | 0 (0.0%) |
| $10,000 to $14,999 | 0 (0.0%) | 0 (0.0%) |
| $15,000 to $19,999 | 16 (10.8%) | 0 (0.0%) |
| $20,000 to $24,999 | 20 (13.5%) | 11 (40.7%) |
| $25,000 to $34,999 | 15 (10.1%) | 0 (0.0%) |
| $35,000 to $49,999 | 11 (7.4%) | 0 (0.0%) |
| $50,000 to $74,999 | 47 (31.8%) | 16 (59.3%) |
| $75,000 to $99,999 | 26 (17.6%) | 0 (0.0%) |
| $100,000 to $149,999 | 7 (4.7%) | 0 (0.0%) |
| $150,000 or more | 6 (4.1%) | 0 (0.0%) |
| Total | 148 (100.0%) | 27 (100.0%) |
Monthly Housing Cost Tiers in Roscoe
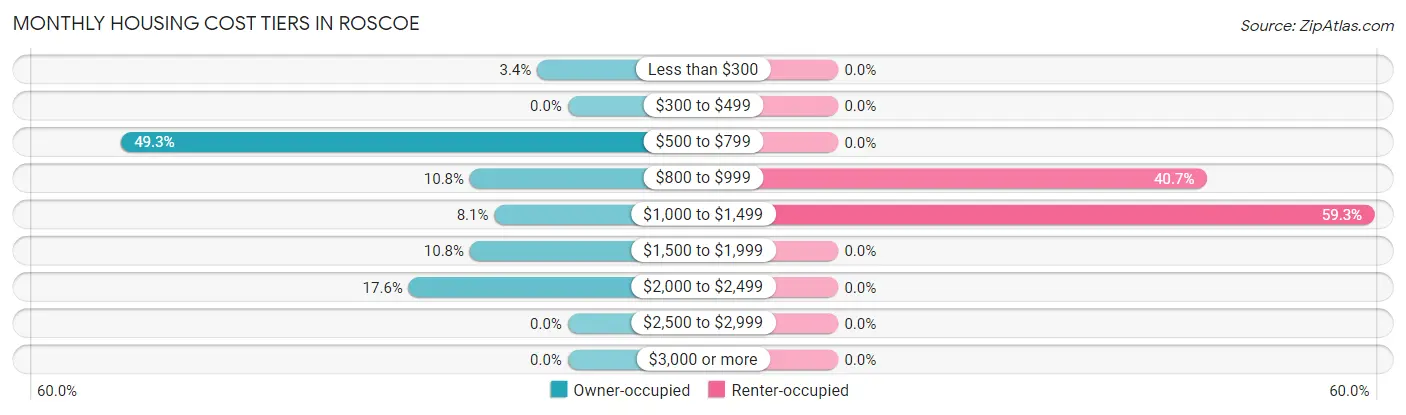
| Monthly Cost | Owner-occupied | Renter-occupied |
| Less than $300 | 5 (3.4%) | 0 (0.0%) |
| $300 to $499 | 0 (0.0%) | 0 (0.0%) |
| $500 to $799 | 73 (49.3%) | 0 (0.0%) |
| $800 to $999 | 16 (10.8%) | 11 (40.7%) |
| $1,000 to $1,499 | 12 (8.1%) | 16 (59.3%) |
| $1,500 to $1,999 | 16 (10.8%) | 0 (0.0%) |
| $2,000 to $2,499 | 26 (17.6%) | 0 (0.0%) |
| $2,500 to $2,999 | 0 (0.0%) | 0 (0.0%) |
| $3,000 or more | 0 (0.0%) | 0 (0.0%) |
| Total | 148 (100.0%) | 27 (100.0%) |
Physical Housing Characteristics in Roscoe
Housing Structures in Roscoe
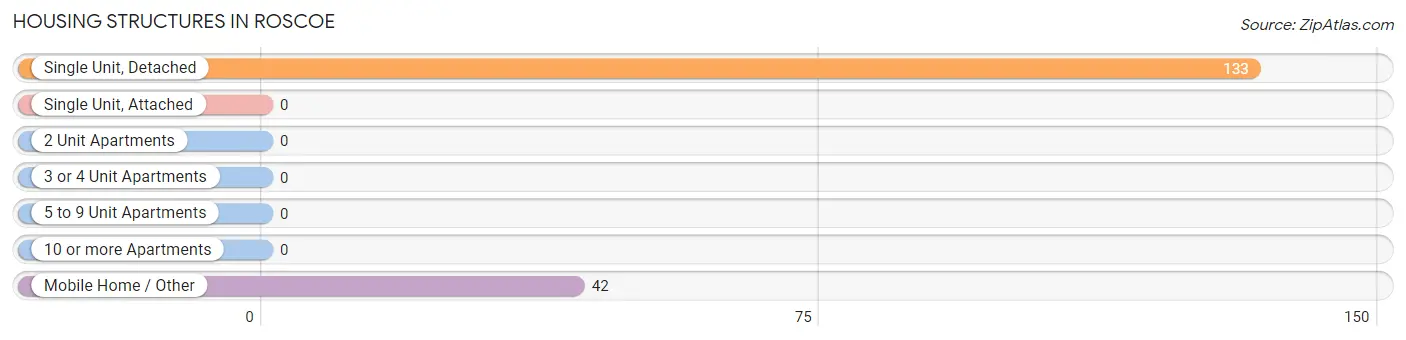
| Structure Type | # Housing Units | % Housing Units |
| Single Unit, Detached | 133 | 76.0% |
| Single Unit, Attached | 0 | 0.0% |
| 2 Unit Apartments | 0 | 0.0% |
| 3 or 4 Unit Apartments | 0 | 0.0% |
| 5 to 9 Unit Apartments | 0 | 0.0% |
| 10 or more Apartments | 0 | 0.0% |
| Mobile Home / Other | 42 | 24.0% |
| Total | 175 | 100.0% |
Housing Structures by Occupancy in Roscoe
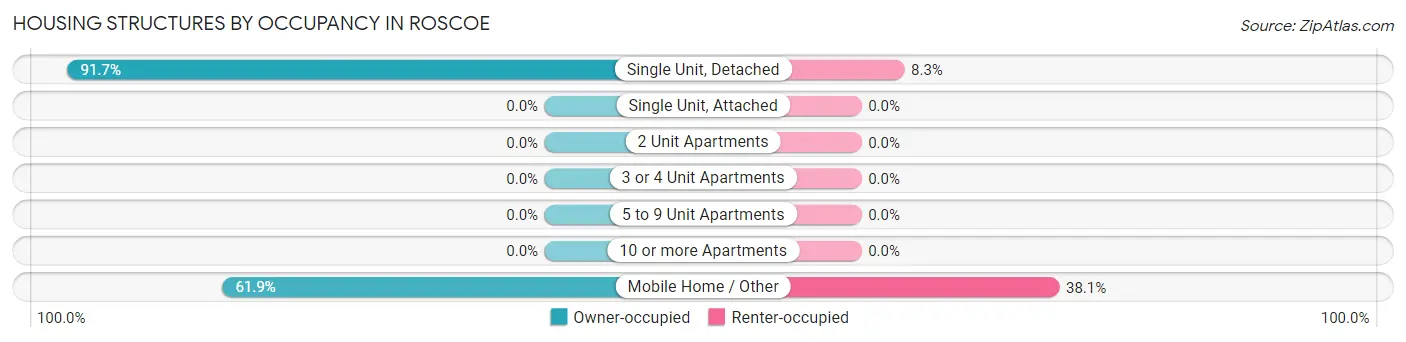
| Structure Type | Owner-occupied | Renter-occupied |
| Single Unit, Detached | 122 (91.7%) | 11 (8.3%) |
| Single Unit, Attached | 0 (0.0%) | 0 (0.0%) |
| 2 Unit Apartments | 0 (0.0%) | 0 (0.0%) |
| 3 or 4 Unit Apartments | 0 (0.0%) | 0 (0.0%) |
| 5 to 9 Unit Apartments | 0 (0.0%) | 0 (0.0%) |
| 10 or more Apartments | 0 (0.0%) | 0 (0.0%) |
| Mobile Home / Other | 26 (61.9%) | 16 (38.1%) |
| Total | 148 (84.6%) | 27 (15.4%) |
Housing Structures by Number of Rooms in Roscoe
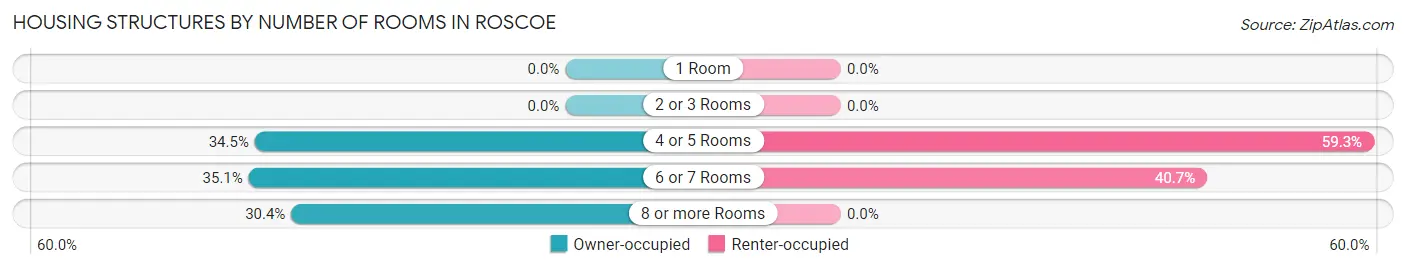
| Number of Rooms | Owner-occupied | Renter-occupied |
| 1 Room | 0 (0.0%) | 0 (0.0%) |
| 2 or 3 Rooms | 0 (0.0%) | 0 (0.0%) |
| 4 or 5 Rooms | 51 (34.5%) | 16 (59.3%) |
| 6 or 7 Rooms | 52 (35.1%) | 11 (40.7%) |
| 8 or more Rooms | 45 (30.4%) | 0 (0.0%) |
| Total | 148 (100.0%) | 27 (100.0%) |
Housing Structure by Heating Type in Roscoe
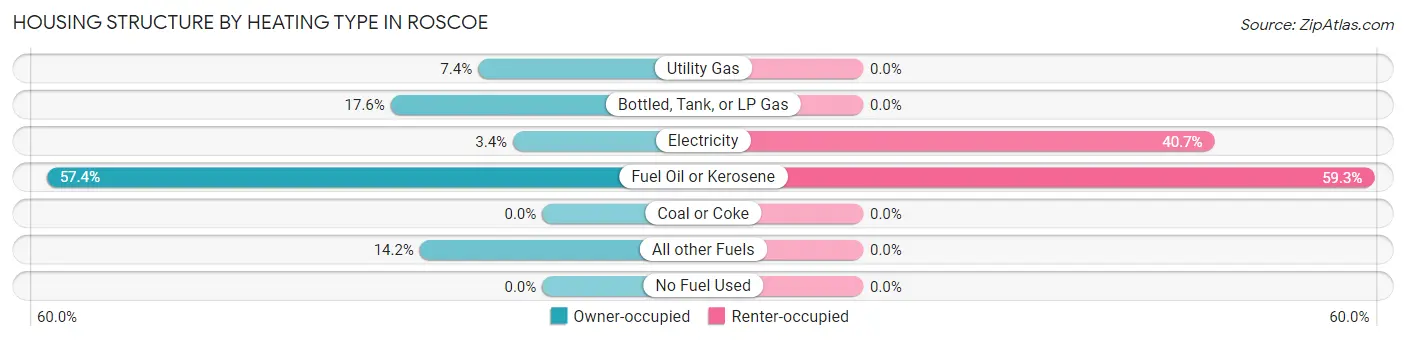
| Heating Type | Owner-occupied | Renter-occupied |
| Utility Gas | 11 (7.4%) | 0 (0.0%) |
| Bottled, Tank, or LP Gas | 26 (17.6%) | 0 (0.0%) |
| Electricity | 5 (3.4%) | 11 (40.7%) |
| Fuel Oil or Kerosene | 85 (57.4%) | 16 (59.3%) |
| Coal or Coke | 0 (0.0%) | 0 (0.0%) |
| All other Fuels | 21 (14.2%) | 0 (0.0%) |
| No Fuel Used | 0 (0.0%) | 0 (0.0%) |
| Total | 148 (100.0%) | 27 (100.0%) |
Household Vehicle Usage in Roscoe
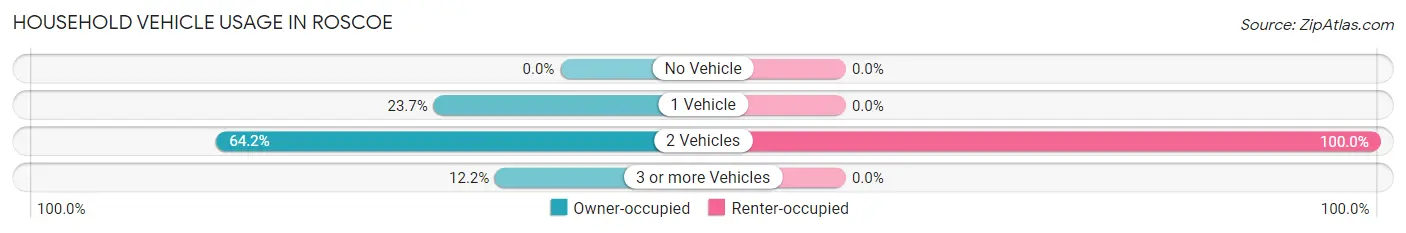
| Vehicles per Household | Owner-occupied | Renter-occupied |
| No Vehicle | 0 (0.0%) | 0 (0.0%) |
| 1 Vehicle | 35 (23.6%) | 0 (0.0%) |
| 2 Vehicles | 95 (64.2%) | 27 (100.0%) |
| 3 or more Vehicles | 18 (12.2%) | 0 (0.0%) |
| Total | 148 (100.0%) | 27 (100.0%) |
Real Estate & Mortgages in Roscoe
Real Estate and Mortgage Overview in Roscoe
| Characteristic | Without Mortgage | With Mortgage |
| Housing Units | 76 | 72 |
| Median Property Value | $86,300 | $122,000 |
| Median Household Income | $44,091 | $6 |
| Monthly Housing Costs | $562 | $0 |
| Real Estate Taxes | - | - |
Property Value by Mortgage Status in Roscoe
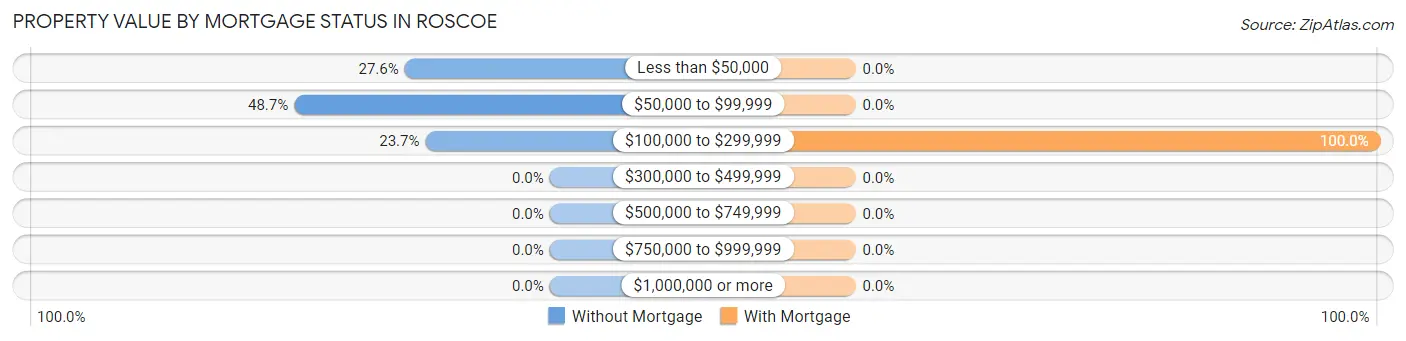
| Property Value | Without Mortgage | With Mortgage |
| Less than $50,000 | 21 (27.6%) | 0 (0.0%) |
| $50,000 to $99,999 | 37 (48.7%) | 0 (0.0%) |
| $100,000 to $299,999 | 18 (23.7%) | 72 (100.0%) |
| $300,000 to $499,999 | 0 (0.0%) | 0 (0.0%) |
| $500,000 to $749,999 | 0 (0.0%) | 0 (0.0%) |
| $750,000 to $999,999 | 0 (0.0%) | 0 (0.0%) |
| $1,000,000 or more | 0 (0.0%) | 0 (0.0%) |
| Total | 76 (100.0%) | 72 (100.0%) |
Household Income by Mortgage Status in Roscoe
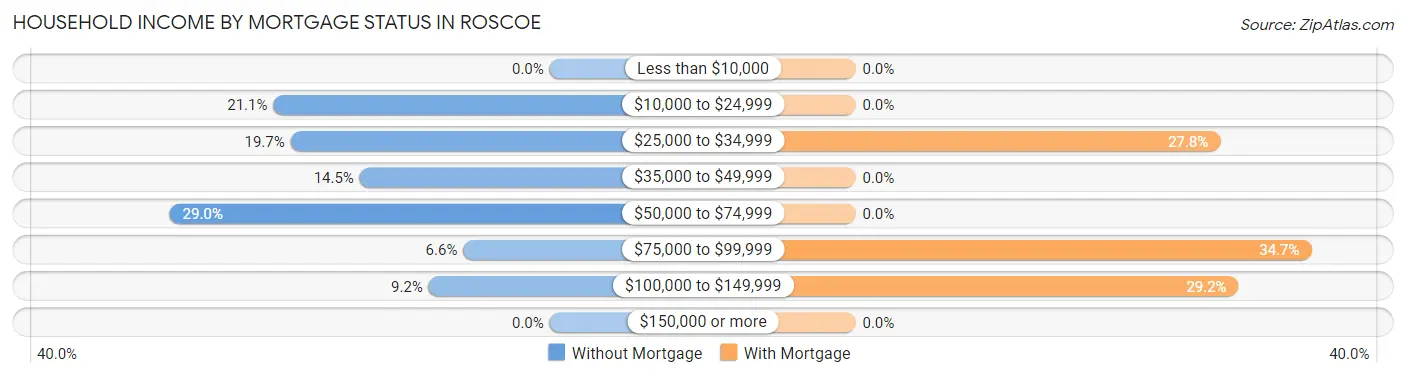
| Household Income | Without Mortgage | With Mortgage |
| Less than $10,000 | 0 (0.0%) | 0 (0.0%) |
| $10,000 to $24,999 | 16 (21.0%) | 0 (0.0%) |
| $25,000 to $34,999 | 15 (19.7%) | 20 (27.8%) |
| $35,000 to $49,999 | 11 (14.5%) | 0 (0.0%) |
| $50,000 to $74,999 | 22 (28.9%) | 0 (0.0%) |
| $75,000 to $99,999 | 5 (6.6%) | 25 (34.7%) |
| $100,000 to $149,999 | 7 (9.2%) | 21 (29.2%) |
| $150,000 or more | 0 (0.0%) | 0 (0.0%) |
| Total | 76 (100.0%) | 72 (100.0%) |
Property Value to Household Income Ratio in Roscoe
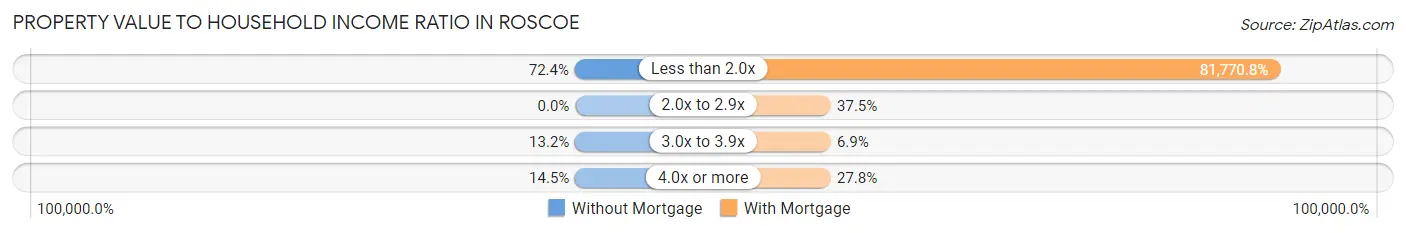
| Value-to-Income Ratio | Without Mortgage | With Mortgage |
| Less than 2.0x | 55 (72.4%) | 58,875 (81,770.8%) |
| 2.0x to 2.9x | 0 (0.0%) | 27 (37.5%) |
| 3.0x to 3.9x | 10 (13.2%) | 5 (6.9%) |
| 4.0x or more | 11 (14.5%) | 20 (27.8%) |
| Total | 76 (100.0%) | 72 (100.0%) |
Real Estate Taxes by Mortgage Status in Roscoe
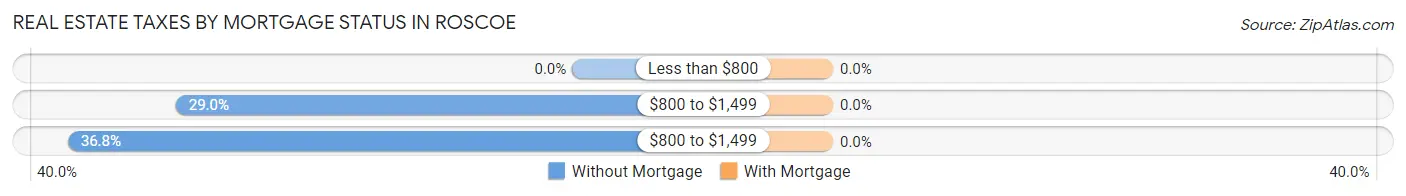
| Property Taxes | Without Mortgage | With Mortgage |
| Less than $800 | 0 (0.0%) | 0 (0.0%) |
| $800 to $1,499 | 22 (28.9%) | 0 (0.0%) |
| $800 to $1,499 | 28 (36.8%) | 0 (0.0%) |
| Total | 76 (100.0%) | 72 (100.0%) |
Health & Disability in Roscoe
Health Insurance Coverage by Age in Roscoe
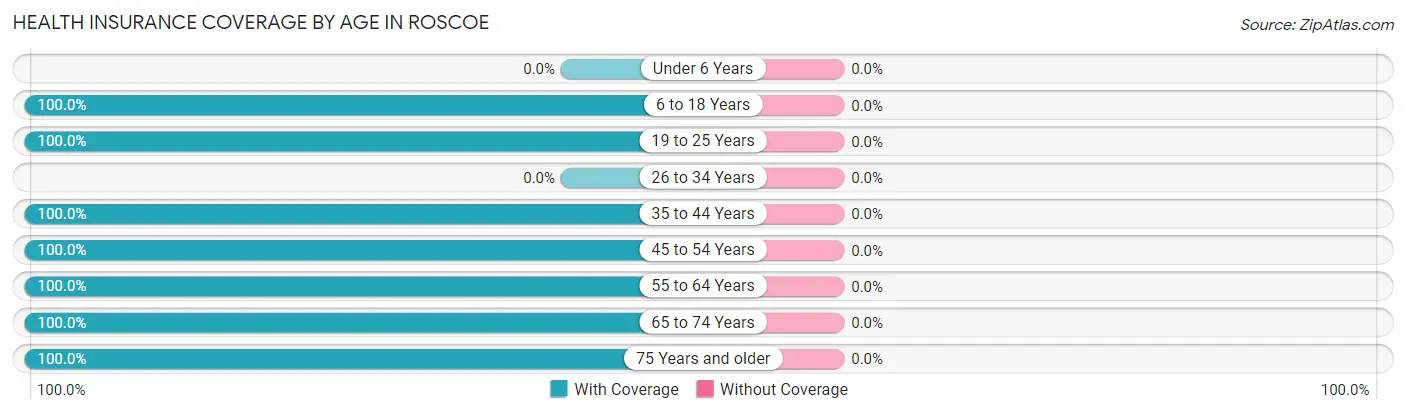
| Age Bracket | With Coverage | Without Coverage |
| Under 6 Years | 0 (0.0%) | 0 (0.0%) |
| 6 to 18 Years | 36 (100.0%) | 0 (0.0%) |
| 19 to 25 Years | 8 (100.0%) | 0 (0.0%) |
| 26 to 34 Years | 0 (0.0%) | 0 (0.0%) |
| 35 to 44 Years | 28 (100.0%) | 0 (0.0%) |
| 45 to 54 Years | 111 (100.0%) | 0 (0.0%) |
| 55 to 64 Years | 79 (100.0%) | 0 (0.0%) |
| 65 to 74 Years | 165 (100.0%) | 0 (0.0%) |
| 75 Years and older | 15 (100.0%) | 0 (0.0%) |
| Total | 442 (100.0%) | 0 (0.0%) |
Health Insurance Coverage by Citizenship Status in Roscoe
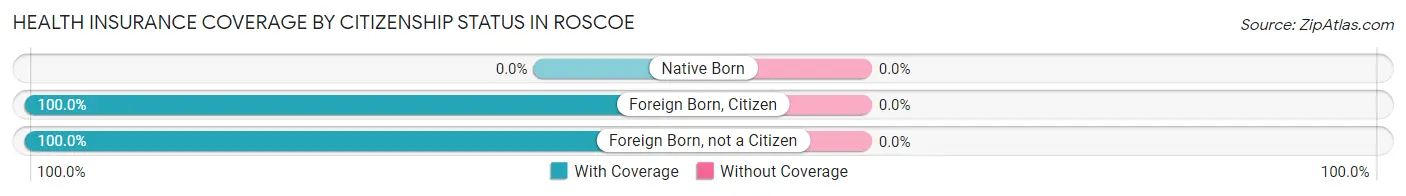
| Citizenship Status | With Coverage | Without Coverage |
| Native Born | 0 (0.0%) | 0 (0.0%) |
| Foreign Born, Citizen | 36 (100.0%) | 0 (0.0%) |
| Foreign Born, not a Citizen | 8 (100.0%) | 0 (0.0%) |
Health Insurance Coverage by Household Income in Roscoe
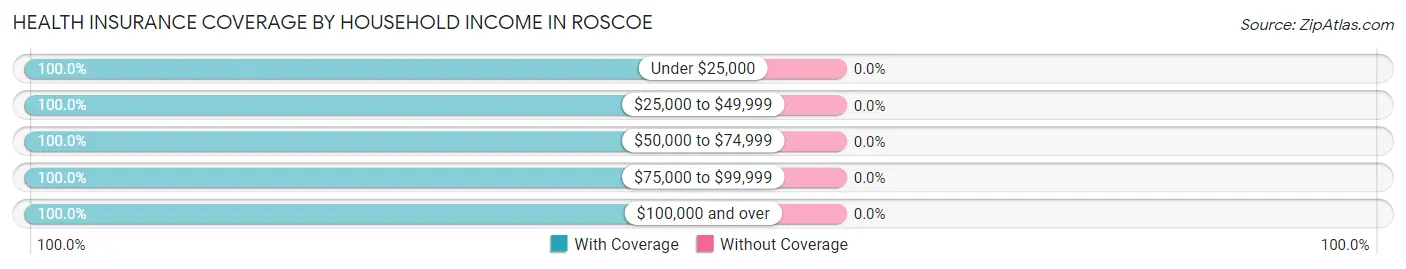
| Household Income | With Coverage | Without Coverage |
| Under $25,000 | 82 (100.0%) | 0 (0.0%) |
| $25,000 to $49,999 | 106 (100.0%) | 0 (0.0%) |
| $50,000 to $74,999 | 162 (100.0%) | 0 (0.0%) |
| $75,000 to $99,999 | 63 (100.0%) | 0 (0.0%) |
| $100,000 and over | 29 (100.0%) | 0 (0.0%) |
Public vs Private Health Insurance Coverage by Age in Roscoe
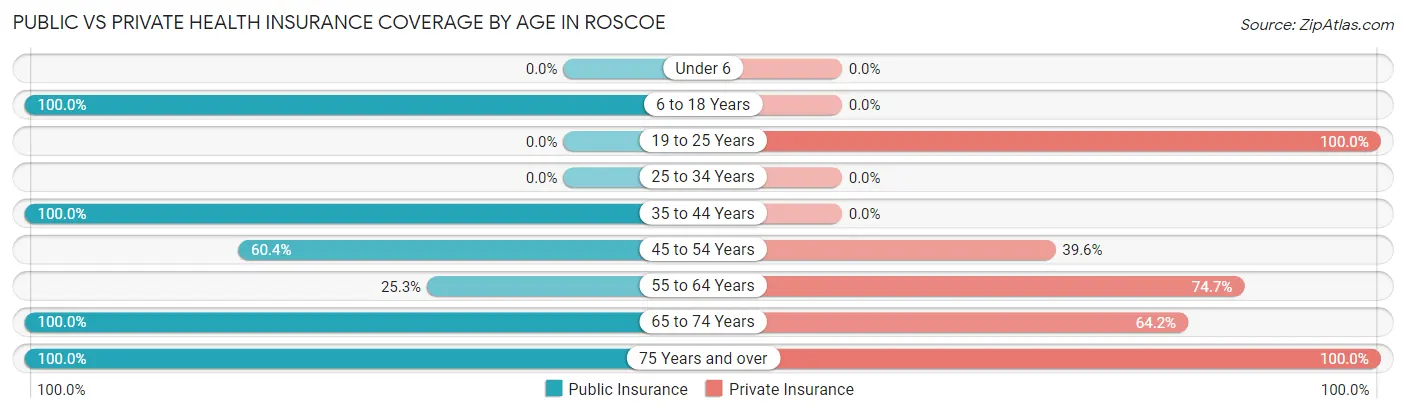
| Age Bracket | Public Insurance | Private Insurance |
| Under 6 | 0 (0.0%) | 0 (0.0%) |
| 6 to 18 Years | 36 (100.0%) | 0 (0.0%) |
| 19 to 25 Years | 0 (0.0%) | 8 (100.0%) |
| 25 to 34 Years | 0 (0.0%) | 0 (0.0%) |
| 35 to 44 Years | 28 (100.0%) | 0 (0.0%) |
| 45 to 54 Years | 67 (60.4%) | 44 (39.6%) |
| 55 to 64 Years | 20 (25.3%) | 59 (74.7%) |
| 65 to 74 Years | 165 (100.0%) | 106 (64.2%) |
| 75 Years and over | 15 (100.0%) | 15 (100.0%) |
| Total | 331 (74.9%) | 232 (52.5%) |
Disability Status by Sex by Age in Roscoe
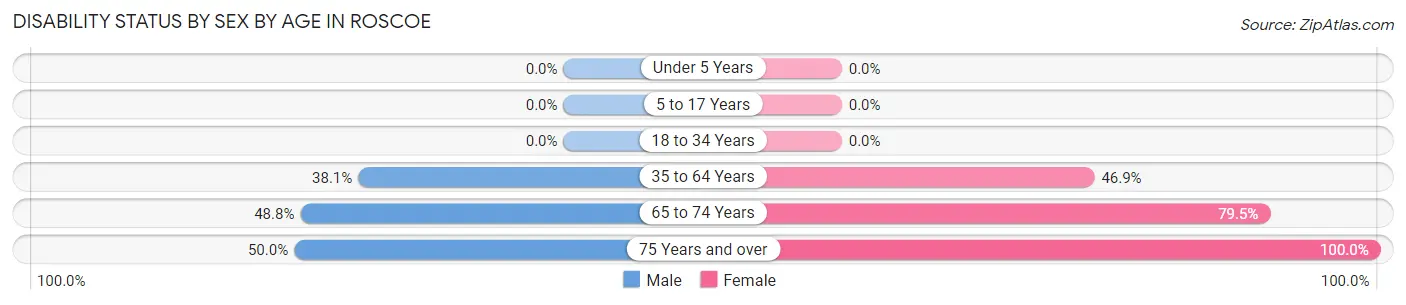
| Age Bracket | Male | Female |
| Under 5 Years | 0 (0.0%) | 0 (0.0%) |
| 5 to 17 Years | 0 (0.0%) | 0 (0.0%) |
| 18 to 34 Years | 0 (0.0%) | 0 (0.0%) |
| 35 to 64 Years | 40 (38.1%) | 53 (46.9%) |
| 65 to 74 Years | 21 (48.8%) | 97 (79.5%) |
| 75 Years and over | 5 (50.0%) | 5 (100.0%) |
Disability Class by Sex by Age in Roscoe
Disability Class: Hearing Difficulty
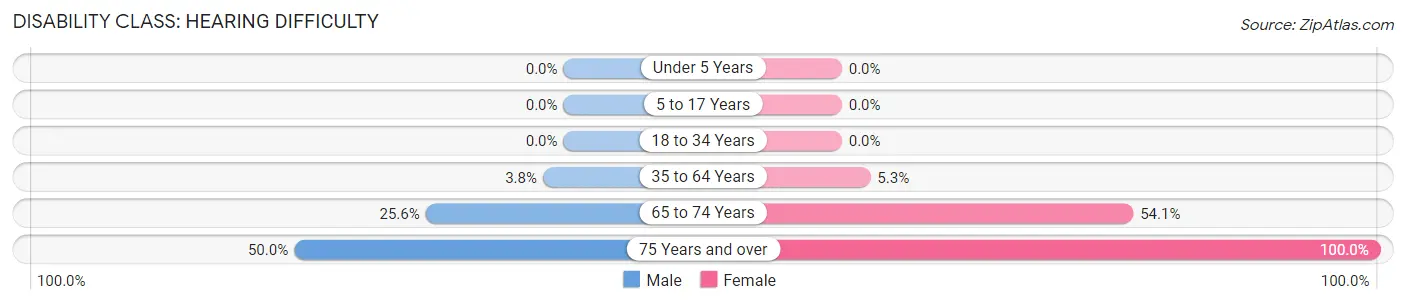
| Age Bracket | Male | Female |
| Under 5 Years | 0 (0.0%) | 0 (0.0%) |
| 5 to 17 Years | 0 (0.0%) | 0 (0.0%) |
| 18 to 34 Years | 0 (0.0%) | 0 (0.0%) |
| 35 to 64 Years | 4 (3.8%) | 6 (5.3%) |
| 65 to 74 Years | 11 (25.6%) | 66 (54.1%) |
| 75 Years and over | 5 (50.0%) | 5 (100.0%) |
Disability Class: Vision Difficulty
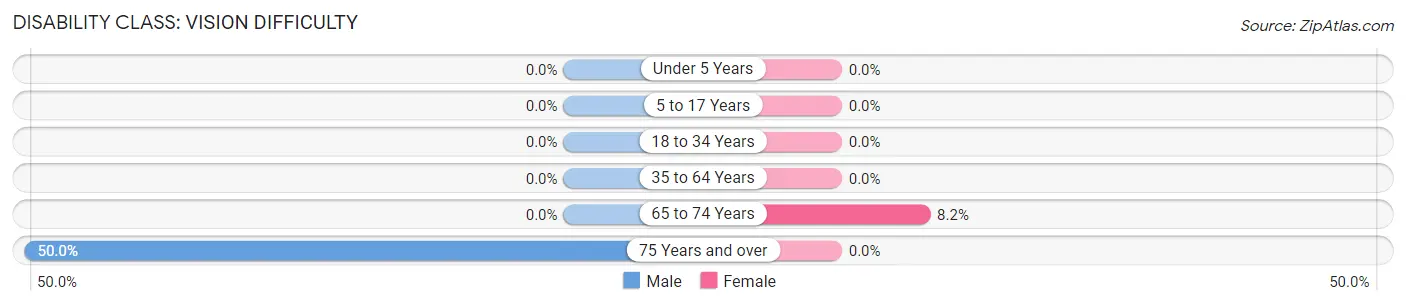
| Age Bracket | Male | Female |
| Under 5 Years | 0 (0.0%) | 0 (0.0%) |
| 5 to 17 Years | 0 (0.0%) | 0 (0.0%) |
| 18 to 34 Years | 0 (0.0%) | 0 (0.0%) |
| 35 to 64 Years | 0 (0.0%) | 0 (0.0%) |
| 65 to 74 Years | 0 (0.0%) | 10 (8.2%) |
| 75 Years and over | 5 (50.0%) | 0 (0.0%) |
Disability Class: Cognitive Difficulty
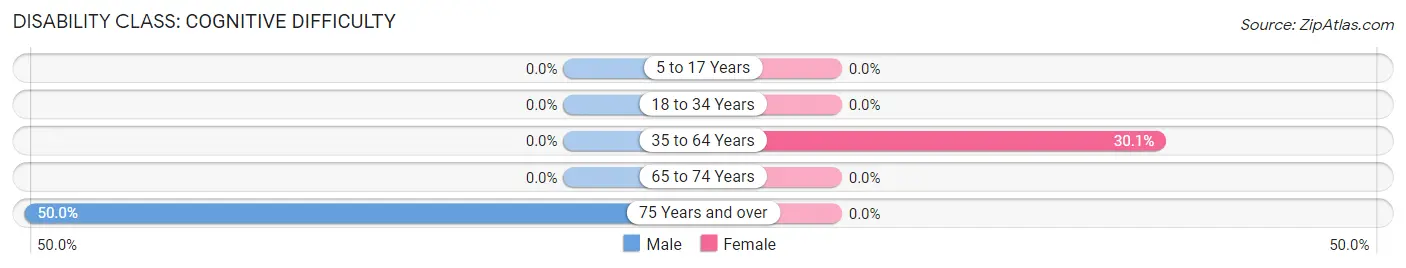
| Age Bracket | Male | Female |
| 5 to 17 Years | 0 (0.0%) | 0 (0.0%) |
| 18 to 34 Years | 0 (0.0%) | 0 (0.0%) |
| 35 to 64 Years | 0 (0.0%) | 34 (30.1%) |
| 65 to 74 Years | 0 (0.0%) | 0 (0.0%) |
| 75 Years and over | 5 (50.0%) | 0 (0.0%) |
Disability Class: Ambulatory Difficulty
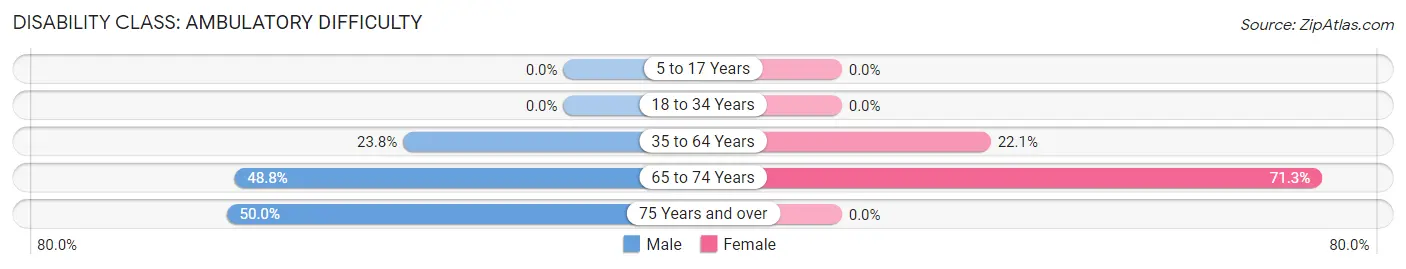
| Age Bracket | Male | Female |
| 5 to 17 Years | 0 (0.0%) | 0 (0.0%) |
| 18 to 34 Years | 0 (0.0%) | 0 (0.0%) |
| 35 to 64 Years | 25 (23.8%) | 25 (22.1%) |
| 65 to 74 Years | 21 (48.8%) | 87 (71.3%) |
| 75 Years and over | 5 (50.0%) | 0 (0.0%) |
Disability Class: Self-Care Difficulty
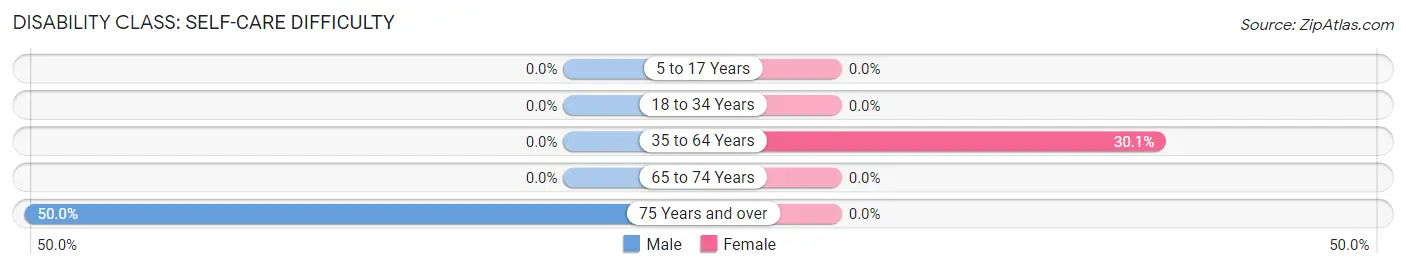
| Age Bracket | Male | Female |
| 5 to 17 Years | 0 (0.0%) | 0 (0.0%) |
| 18 to 34 Years | 0 (0.0%) | 0 (0.0%) |
| 35 to 64 Years | 0 (0.0%) | 34 (30.1%) |
| 65 to 74 Years | 0 (0.0%) | 0 (0.0%) |
| 75 Years and over | 5 (50.0%) | 0 (0.0%) |
Technology Access in Roscoe
Computing Device Access in Roscoe
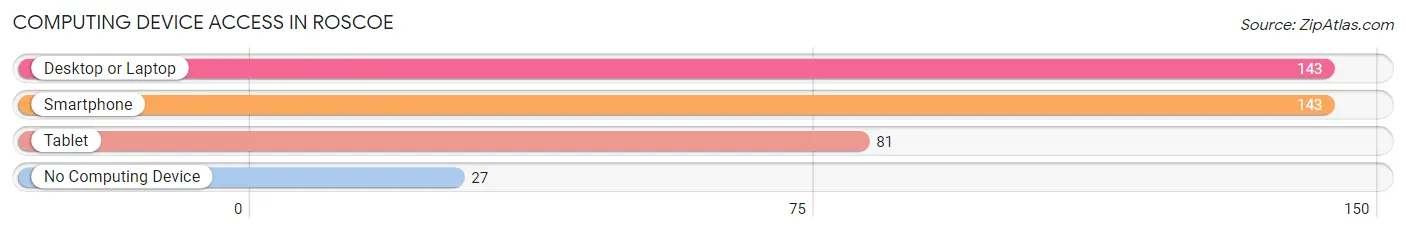
| Device Type | # Households | % Households |
| Desktop or Laptop | 143 | 81.7% |
| Smartphone | 143 | 81.7% |
| Tablet | 81 | 46.3% |
| No Computing Device | 27 | 15.4% |
| Total | 175 | 100.0% |
Internet Access in Roscoe
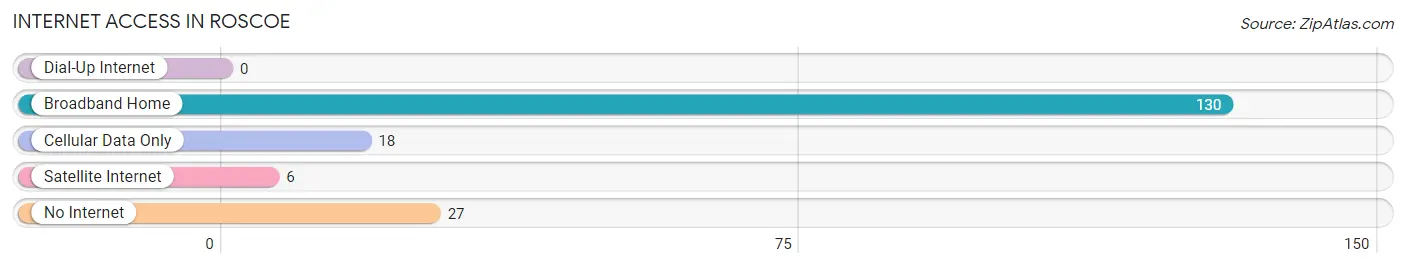
| Internet Type | # Households | % Households |
| Dial-Up Internet | 0 | 0.0% |
| Broadband Home | 130 | 74.3% |
| Cellular Data Only | 18 | 10.3% |
| Satellite Internet | 6 | 3.4% |
| No Internet | 27 | 15.4% |
| Total | 175 | 100.0% |
Roscoe Summary
Roscoe, NY is a small village located in the Catskill Mountains of New York State. It is situated in the Town of Rockland, in Sullivan County, and is part of the Catskill Park. The village is located on the banks of the Beaverkill River, and is home to a population of approximately 500 people.
History
The area that is now Roscoe, NY was first settled in the late 1700s by a group of Dutch settlers. The village was originally known as “Beaverkill”, and was later renamed “Roscoe” in 1817, after the local postmaster, Roscoe Conkling. The village was officially incorporated in 1848.
In the late 1800s, Roscoe became a popular destination for anglers, as the Beaverkill River was known for its excellent trout fishing. The village was also home to a number of resorts and hotels, which attracted visitors from all over the country.
In the early 1900s, Roscoe was a popular destination for the wealthy, who built large summer homes in the area. The village was also home to a number of artists, writers, and musicians, who were drawn to the area’s natural beauty.
Geography
Roscoe is located in the Catskill Mountains of New York State, in the Town of Rockland, in Sullivan County. The village is situated on the banks of the Beaverkill River, and is surrounded by the Catskill Park. The village is located approximately 90 miles northwest of New York City.
The village is located at an elevation of 1,400 feet, and has a total area of 0.6 square miles. The terrain is mostly hilly, with some flat areas. The climate is humid continental, with cold winters and warm summers.
Economy
The economy of Roscoe is largely based on tourism. The village is home to a number of resorts and hotels, which attract visitors from all over the country. The village is also home to a number of restaurants, shops, and other businesses, which cater to the needs of visitors.
The village is also home to a number of small businesses, including a brewery, a winery, and a distillery. The village is also home to a number of artists, writers, and musicians, who are drawn to the area’s natural beauty.
Demographics
As of the 2010 census, the population of Roscoe was 498. The racial makeup of the village was 97.2% White, 0.6% African American, 0.2% Native American, 0.2% Asian, 0.2% from other races, and 1.8% from two or more races. Hispanic or Latino of any race were 1.2% of the population.
The median household income in Roscoe was $41,250, and the median family income was $50,000. The per capita income for the village was $20,945. About 10.2% of families and 13.2% of the population were below the poverty line, including 16.7% of those under age 18 and 8.3% of those age 65 or over.
Roscoe is a small village with a rich history and a vibrant economy. The village is home to a number of resorts and businesses, which attract visitors from all over the country. The village is also home to a number of artists, writers, and musicians, who are drawn to the area’s natural beauty. The village is a great place to live, work, and visit.
Common Questions
What is the Total Population of Roscoe?
Total Population of Roscoe is 442.
What is the Total Male Population of Roscoe?
Total Male Population of Roscoe is 183.
What is the Total Female Population of Roscoe?
Total Female Population of Roscoe is 259.
What is the Ratio of Males per 100 Females in Roscoe?
There are 70.66 Males per 100 Females in Roscoe.
What is the Ratio of Females per 100 Males in Roscoe?
There are 141.53 Females per 100 Males in Roscoe.
What is the Median Population Age in Roscoe?
Median Population Age in Roscoe is 57.8 Years.
What is the Average Family Size in Roscoe
Average Family Size in Roscoe is 2.8 People.
What is the Average Household Size in Roscoe
Average Household Size in Roscoe is 2.5 People.
What is Per Capita Income in Roscoe?
Per Capita income in Roscoe is $22,957.
What is the Median Family Income in Roscoe?
Median Family Income in Roscoe is $58,500.
What is the Median Household income in Roscoe?
Median Household Income in Roscoe is $56,343.
What is Inequality or Gini Index in Roscoe?
Inequality or Gini Index in Roscoe is 0.33.
How Large is the Labor Force in Roscoe?
There are 172 People in the Labor Forcein in Roscoe.
What is the Percentage of People in the Labor Force in Roscoe?
42.4% of People are in the Labor Force in Roscoe.