Millbrook, NY
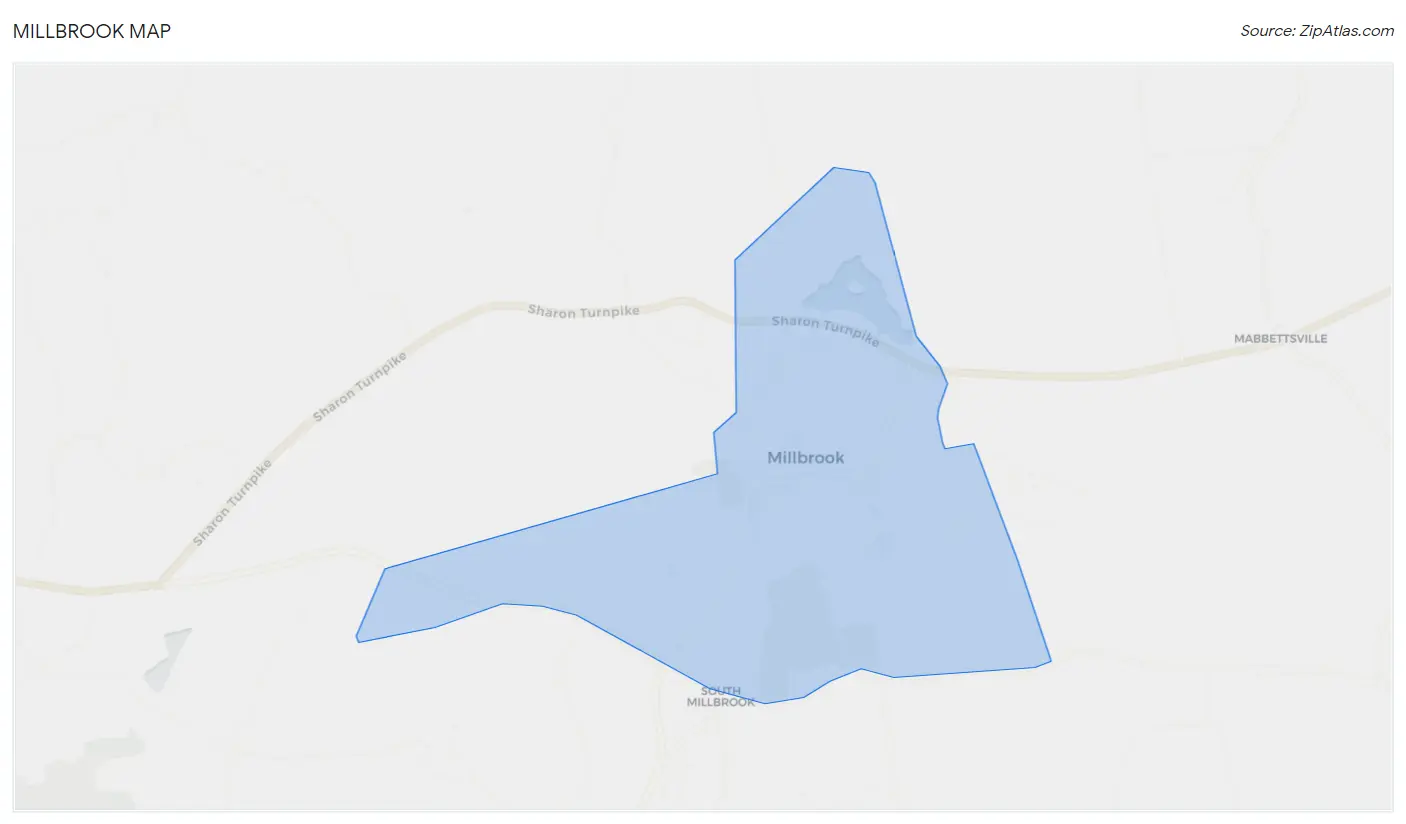
Millbrook Map
Millbrook Overview
1,382
TOTAL POPULATION
656
MALE POPULATION
726
FEMALE POPULATION
90.36
MALES / 100 FEMALES
110.67
FEMALES / 100 MALES
58.7
MEDIAN AGE
2.6
AVG FAMILY SIZE
1.9
AVG HOUSEHOLD SIZE
$56,525
PER CAPITA INCOME
$147,750
AVG FAMILY INCOME
$71,477
AVG HOUSEHOLD INCOME
19.2%
WAGE / INCOME GAP [ % ]
80.8¢/ $1
WAGE / INCOME GAP [ $ ]
0.49
INEQUALITY / GINI INDEX
670
LABOR FORCE [ PEOPLE ]
52.8%
PERCENT IN LABOR FORCE
Millbrook Zip Codes
Millbrook Area Codes
Race in Millbrook
The most populous races in Millbrook are White / Caucasian (1,206 | 87.3%), Asian (66 | 4.8%), and Black / African American (52 | 3.8%).
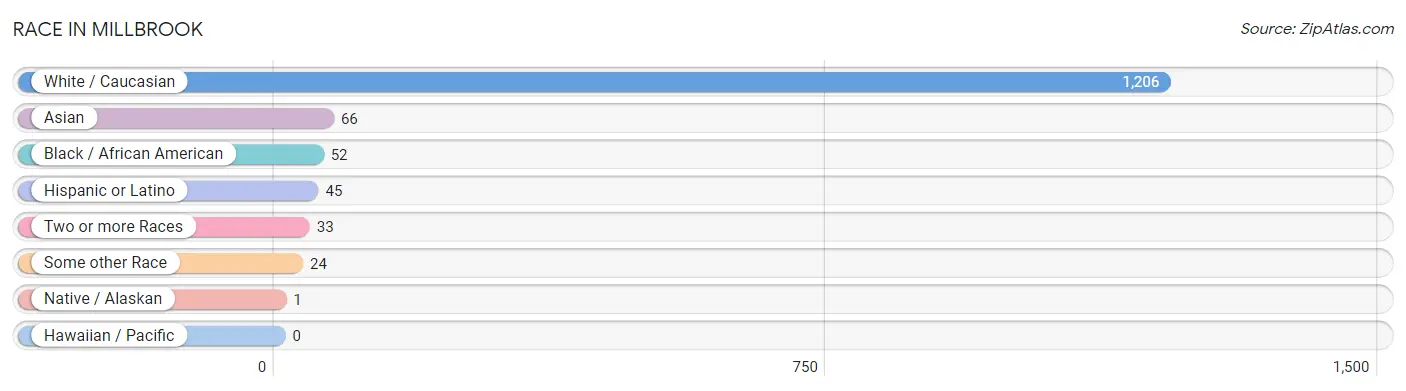
| Race | # Population | % Population |
| Asian | 66 | 4.8% |
| Black / African American | 52 | 3.8% |
| Hawaiian / Pacific | 0 | 0.0% |
| Hispanic or Latino | 45 | 3.3% |
| Native / Alaskan | 1 | 0.1% |
| White / Caucasian | 1,206 | 87.3% |
| Two or more Races | 33 | 2.4% |
| Some other Race | 24 | 1.7% |
| Total | 1,382 | 100.0% |
Ancestry in Millbrook
The most populous ancestries reported in Millbrook are Irish (366 | 26.5%), Italian (338 | 24.5%), German (214 | 15.5%), English (207 | 15.0%), and Thai (74 | 5.3%), together accounting for 86.7% of all Millbrook residents.
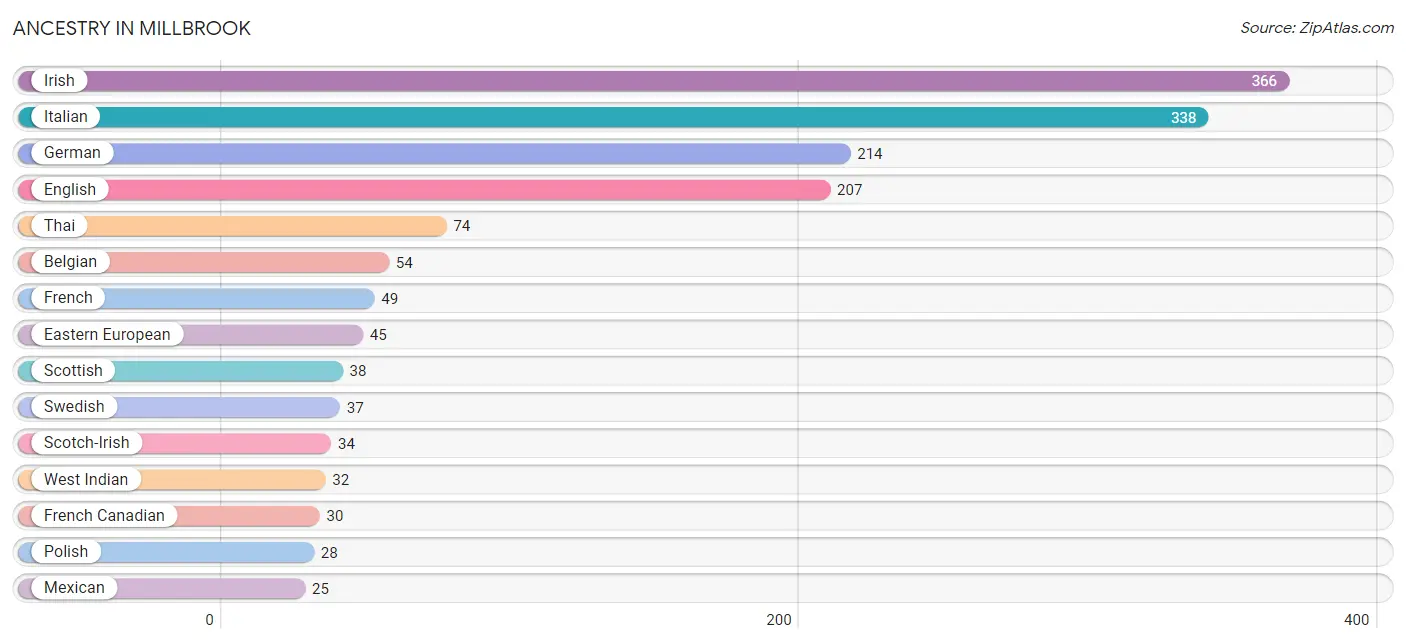
| Ancestry | # Population | % Population |
| American | 11 | 0.8% |
| Belgian | 54 | 3.9% |
| British | 8 | 0.6% |
| Canadian | 17 | 1.2% |
| Celtic | 4 | 0.3% |
| Central American | 1 | 0.1% |
| Czech | 24 | 1.7% |
| Dutch | 11 | 0.8% |
| Eastern European | 45 | 3.3% |
| English | 207 | 15.0% |
| European | 12 | 0.9% |
| French | 49 | 3.5% |
| French Canadian | 30 | 2.2% |
| German | 214 | 15.5% |
| Haitian | 12 | 0.9% |
| Hungarian | 15 | 1.1% |
| Irish | 366 | 26.5% |
| Italian | 338 | 24.5% |
| Mexican | 25 | 1.8% |
| Norwegian | 25 | 1.8% |
| Pennsylvania German | 12 | 0.9% |
| Peruvian | 3 | 0.2% |
| Polish | 28 | 2.0% |
| Portuguese | 4 | 0.3% |
| Puerto Rican | 16 | 1.2% |
| Russian | 10 | 0.7% |
| Salvadoran | 1 | 0.1% |
| Scotch-Irish | 34 | 2.5% |
| Scottish | 38 | 2.8% |
| Slovene | 4 | 0.3% |
| South American | 3 | 0.2% |
| Swedish | 37 | 2.7% |
| Swiss | 12 | 0.9% |
| Thai | 74 | 5.3% |
| West Indian | 32 | 2.3% | View All 35 Rows |
Immigrants in Millbrook
The most numerous immigrant groups reported in Millbrook came from Europe (43 | 3.1%), Asia (24 | 1.7%), South Central Asia (24 | 1.7%), India (23 | 1.7%), and Latin America (20 | 1.5%), together accounting for 9.7% of all Millbrook residents.
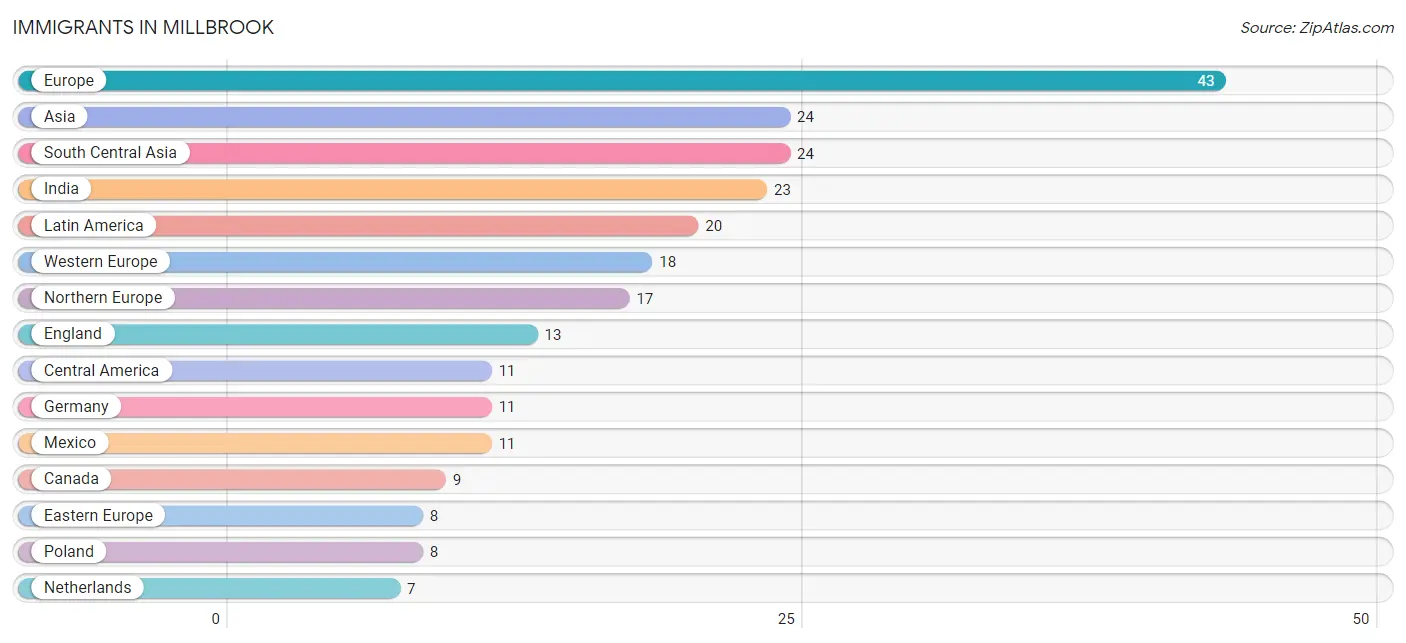
| Immigration Origin | # Population | % Population |
| Asia | 24 | 1.7% |
| Canada | 9 | 0.6% |
| Caribbean | 6 | 0.4% |
| Central America | 11 | 0.8% |
| Eastern Europe | 8 | 0.6% |
| England | 13 | 0.9% |
| Europe | 43 | 3.1% |
| Germany | 11 | 0.8% |
| India | 23 | 1.7% |
| Latin America | 20 | 1.5% |
| Mexico | 11 | 0.8% |
| Netherlands | 7 | 0.5% |
| Northern Europe | 17 | 1.2% |
| Peru | 3 | 0.2% |
| Poland | 8 | 0.6% |
| South America | 3 | 0.2% |
| South Central Asia | 24 | 1.7% |
| Sri Lanka | 1 | 0.1% |
| Western Europe | 18 | 1.3% | View All 19 Rows |
Sex and Age in Millbrook
Sex and Age in Millbrook
The most populous age groups in Millbrook are 30 to 34 Years (79 | 12.0%) for men and 75 to 79 Years (144 | 19.8%) for women.
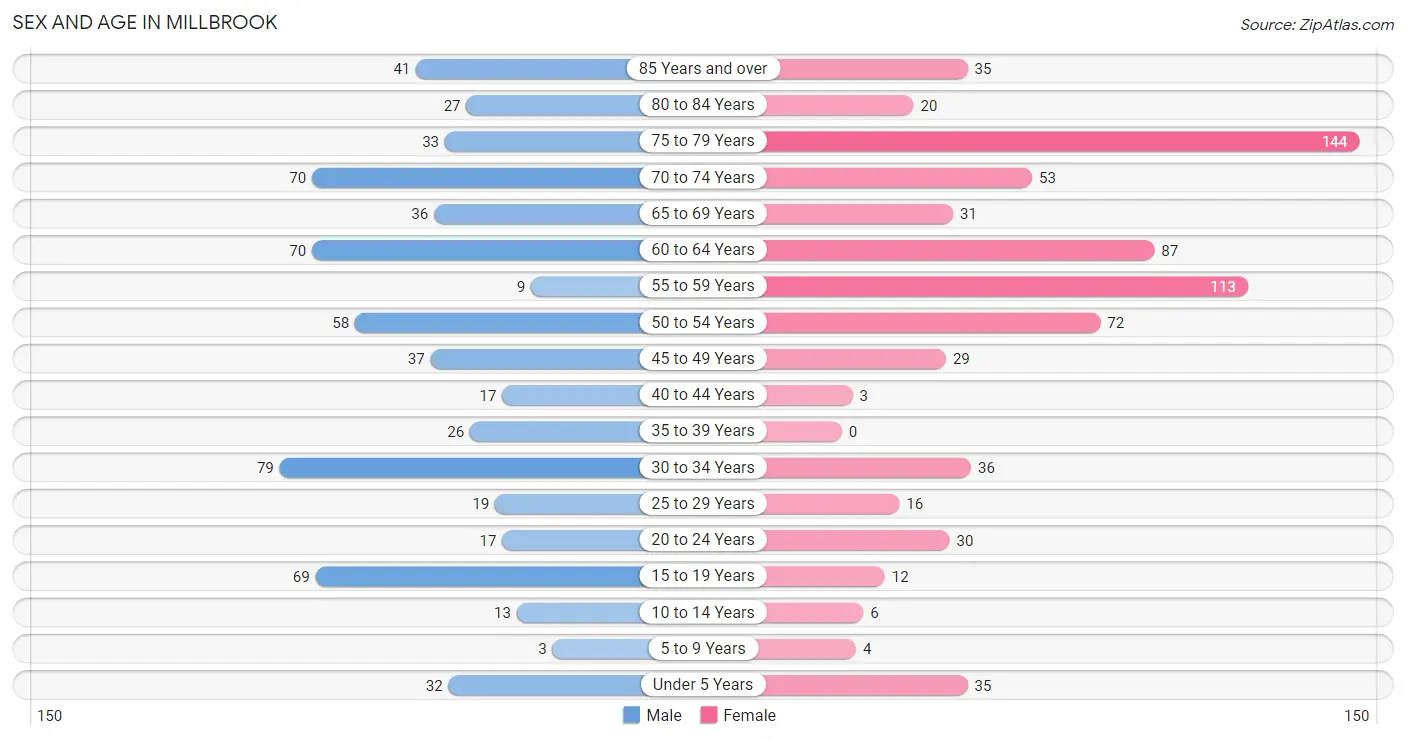
| Age Bracket | Male | Female |
| Under 5 Years | 32 (4.9%) | 35 (4.8%) |
| 5 to 9 Years | 3 (0.5%) | 4 (0.5%) |
| 10 to 14 Years | 13 (2.0%) | 6 (0.8%) |
| 15 to 19 Years | 69 (10.5%) | 12 (1.7%) |
| 20 to 24 Years | 17 (2.6%) | 30 (4.1%) |
| 25 to 29 Years | 19 (2.9%) | 16 (2.2%) |
| 30 to 34 Years | 79 (12.0%) | 36 (5.0%) |
| 35 to 39 Years | 26 (4.0%) | 0 (0.0%) |
| 40 to 44 Years | 17 (2.6%) | 3 (0.4%) |
| 45 to 49 Years | 37 (5.6%) | 29 (4.0%) |
| 50 to 54 Years | 58 (8.8%) | 72 (9.9%) |
| 55 to 59 Years | 9 (1.4%) | 113 (15.6%) |
| 60 to 64 Years | 70 (10.7%) | 87 (12.0%) |
| 65 to 69 Years | 36 (5.5%) | 31 (4.3%) |
| 70 to 74 Years | 70 (10.7%) | 53 (7.3%) |
| 75 to 79 Years | 33 (5.0%) | 144 (19.8%) |
| 80 to 84 Years | 27 (4.1%) | 20 (2.8%) |
| 85 Years and over | 41 (6.2%) | 35 (4.8%) |
| Total | 656 (100.0%) | 726 (100.0%) |
Families and Households in Millbrook
Median Family Size in Millbrook
The median family size in Millbrook is 2.64 persons per family, with single male/father families (4 | 1.2%) accounting for the largest median family size of 3.5 persons per family. On the other hand, married-couple families (302 | 89.6%) represent the smallest median family size with 2.55 persons per family.
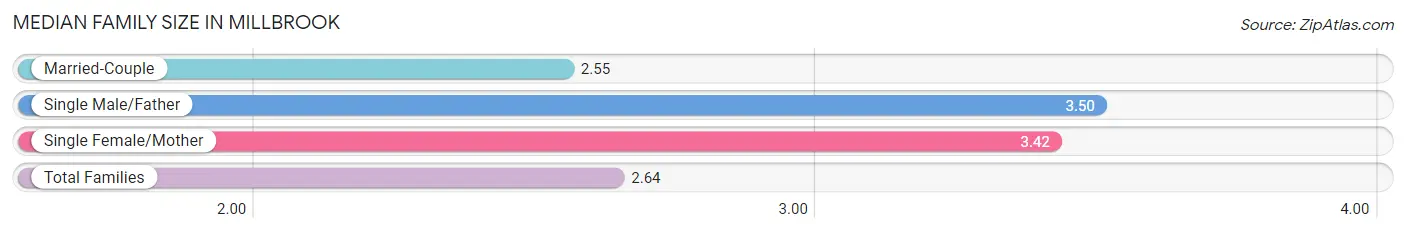
| Family Type | # Families | Family Size |
| Married-Couple | 302 (89.6%) | 2.55 |
| Single Male/Father | 4 (1.2%) | 3.50 |
| Single Female/Mother | 31 (9.2%) | 3.42 |
| Total Families | 337 (100.0%) | 2.64 |
Median Household Size in Millbrook
The median household size in Millbrook is 1.85 persons per household, with single male/father households (4 | 0.5%) accounting for the largest median household size of 8.25 persons per household. non-family households (401 | 54.3%) represent the smallest median household size with 1.14 persons per household.
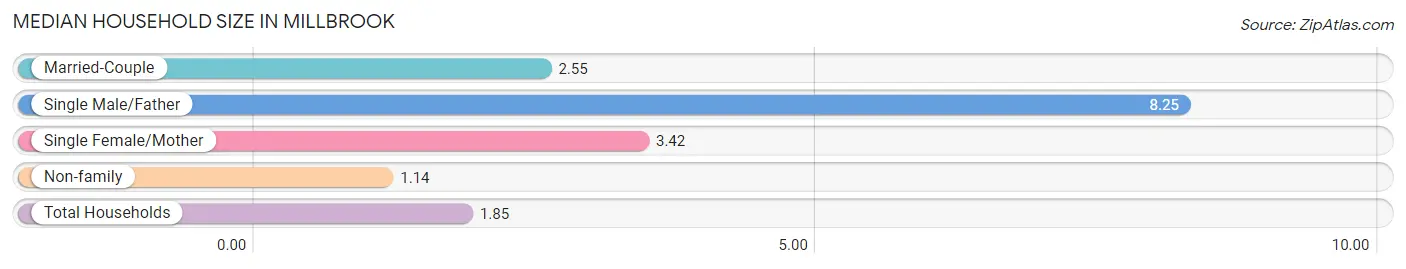
| Household Type | # Households | Household Size |
| Married-Couple | 302 (40.9%) | 2.55 |
| Single Male/Father | 4 (0.5%) | 8.25 |
| Single Female/Mother | 31 (4.2%) | 3.42 |
| Non-family | 401 (54.3%) | 1.14 |
| Total Households | 738 (100.0%) | 1.85 |
Household Size by Marriage Status in Millbrook
Out of a total of 738 households in Millbrook, 337 (45.7%) are family households, while 401 (54.3%) are nonfamily households. The most numerous type of family households are 2-person households, comprising 208, and the most common type of nonfamily households are 1-person households, comprising 363.
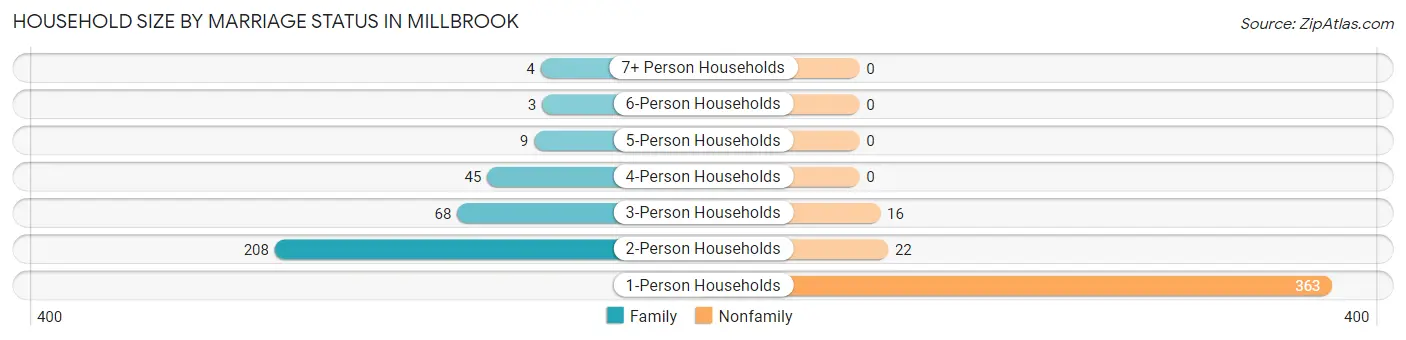
| Household Size | Family Households | Nonfamily Households |
| 1-Person Households | - | 363 (49.2%) |
| 2-Person Households | 208 (28.2%) | 22 (3.0%) |
| 3-Person Households | 68 (9.2%) | 16 (2.2%) |
| 4-Person Households | 45 (6.1%) | 0 (0.0%) |
| 5-Person Households | 9 (1.2%) | 0 (0.0%) |
| 6-Person Households | 3 (0.4%) | 0 (0.0%) |
| 7+ Person Households | 4 (0.5%) | 0 (0.0%) |
| Total | 337 (45.7%) | 401 (54.3%) |
Female Fertility in Millbrook
Fertility by Age in Millbrook
Average fertility rate in Millbrook is 87.0 births per 1,000 women. Women in the age bracket of 20 to 34 years have the highest fertility rate with 134.0 births per 1,000 women. Women in the age bracket of 20 to 34 years acount for 100.0% of all women with births.
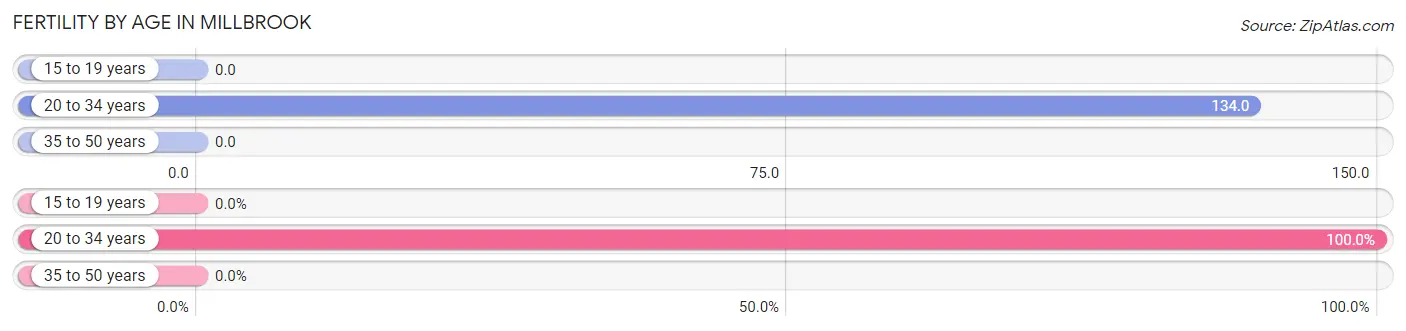
| Age Bracket | Women with Births | Births / 1,000 Women |
| 15 to 19 years | 0 (0.0%) | 0.0 |
| 20 to 34 years | 11 (100.0%) | 134.0 |
| 35 to 50 years | 0 (0.0%) | 0.0 |
| Total | 11 (100.0%) | 87.0 |
Fertility by Age by Marriage Status in Millbrook
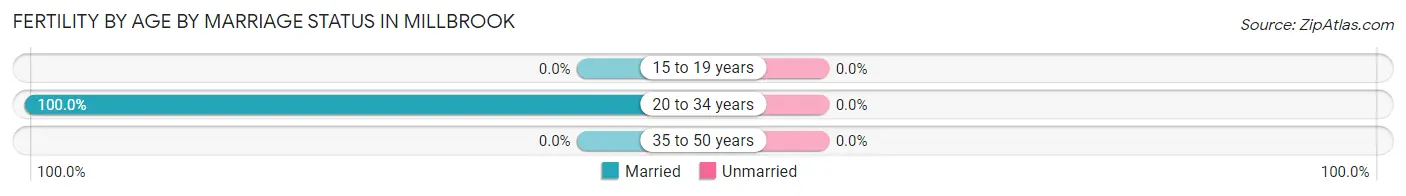
| Age Bracket | Married | Unmarried |
| 15 to 19 years | 0 (0.0%) | 0 (0.0%) |
| 20 to 34 years | 11 (100.0%) | 0 (0.0%) |
| 35 to 50 years | 0 (0.0%) | 0 (0.0%) |
| Total | 11 (100.0%) | 0 (0.0%) |
Fertility by Education in Millbrook
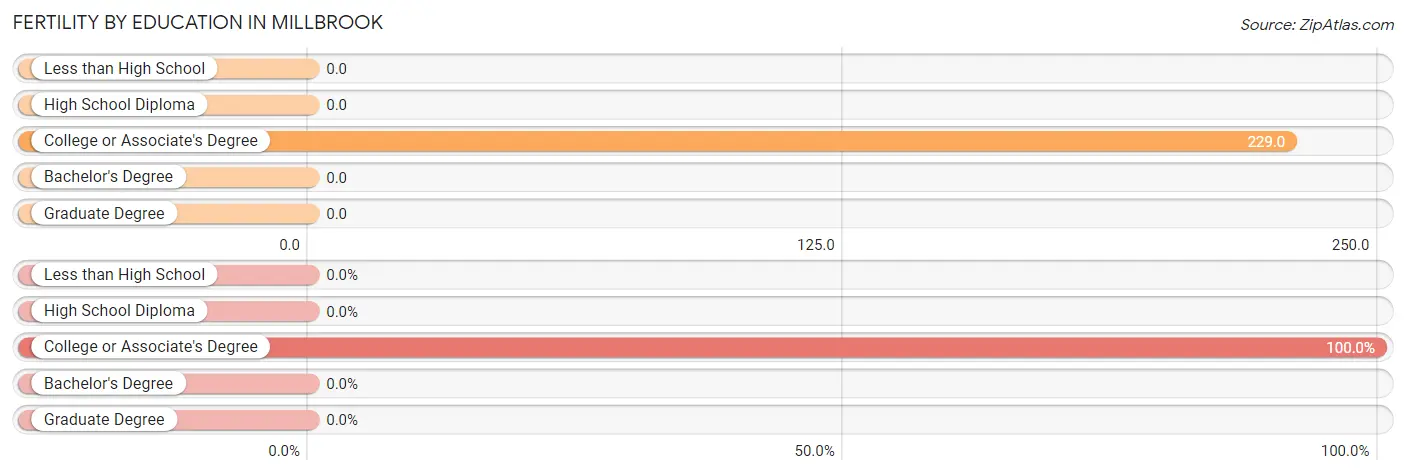
| Educational Attainment | Women with Births | Births / 1,000 Women |
| Less than High School | 0 (0.0%) | 0.0 |
| High School Diploma | 0 (0.0%) | 0.0 |
| College or Associate's Degree | 11 (100.0%) | 229.0 |
| Bachelor's Degree | 0 (0.0%) | 0.0 |
| Graduate Degree | 0 (0.0%) | 0.0 |
| Total | 11 (100.0%) | 87.0 |
Fertility by Education by Marriage Status in Millbrook
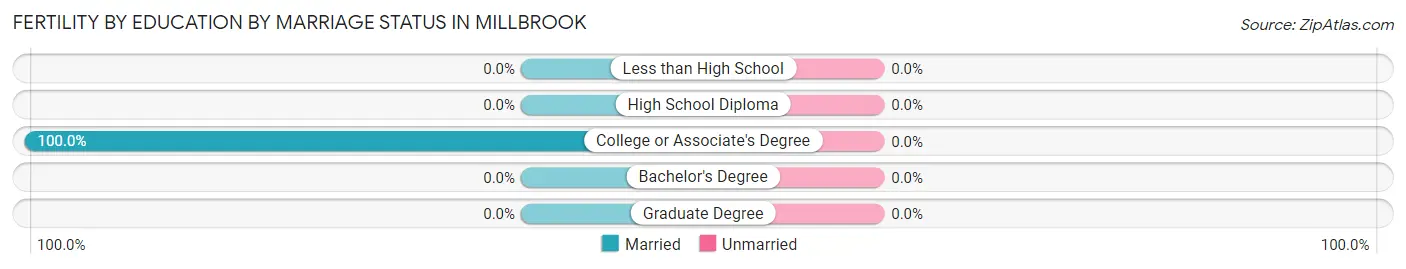
| Educational Attainment | Married | Unmarried |
| Less than High School | 0 (0.0%) | 0 (0.0%) |
| High School Diploma | 0 (0.0%) | 0 (0.0%) |
| College or Associate's Degree | 11 (100.0%) | 0 (0.0%) |
| Bachelor's Degree | 0 (0.0%) | 0 (0.0%) |
| Graduate Degree | 0 (0.0%) | 0 (0.0%) |
| Total | 11 (100.0%) | 0 (0.0%) |
Income in Millbrook
Income Overview in Millbrook
Per Capita Income in Millbrook is $56,525, while median incomes of families and households are $147,750 and $71,477 respectively.
| Characteristic | Number | Measure |
| Per Capita Income | 1,382 | $56,525 |
| Median Family Income | 337 | $147,750 |
| Mean Family Income | 337 | $161,490 |
| Median Household Income | 738 | $71,477 |
| Mean Household Income | 738 | $106,905 |
| Income Deficit | 337 | $0 |
| Wage / Income Gap (%) | 1,382 | 19.24% |
| Wage / Income Gap ($) | 1,382 | 80.76¢ per $1 |
| Gini / Inequality Index | 1,382 | 0.49 |
Earnings by Sex in Millbrook
Average Earnings in Millbrook are $45,000, $54,643 for men and $44,129 for women, a difference of 19.2%.
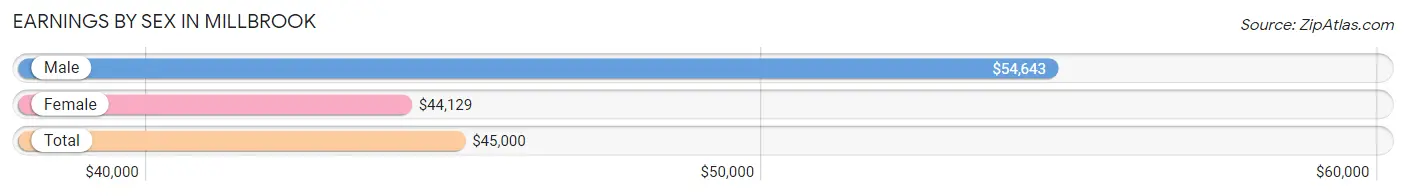
| Sex | Number | Average Earnings |
| Male | 338 (48.6%) | $54,643 |
| Female | 358 (51.4%) | $44,129 |
| Total | 696 (100.0%) | $45,000 |
Earnings by Sex by Income Bracket in Millbrook
The most common earnings brackets in Millbrook are $100,000+ for men (98 | 29.0%) and $40,000 to $44,999 for women (78 | 21.8%).
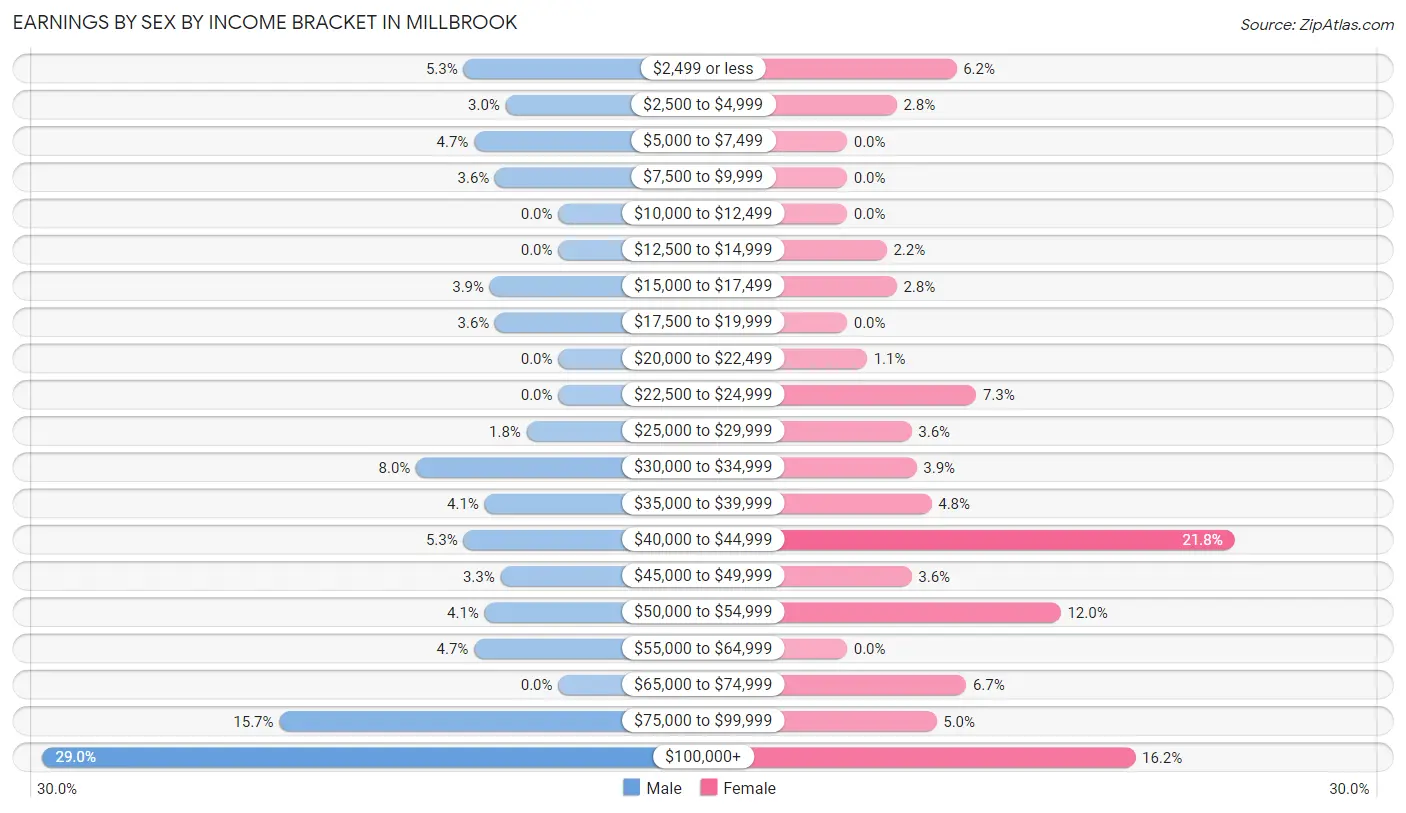
| Income | Male | Female |
| $2,499 or less | 18 (5.3%) | 22 (6.1%) |
| $2,500 to $4,999 | 10 (3.0%) | 10 (2.8%) |
| $5,000 to $7,499 | 16 (4.7%) | 0 (0.0%) |
| $7,500 to $9,999 | 12 (3.5%) | 0 (0.0%) |
| $10,000 to $12,499 | 0 (0.0%) | 0 (0.0%) |
| $12,500 to $14,999 | 0 (0.0%) | 8 (2.2%) |
| $15,000 to $17,499 | 13 (3.8%) | 10 (2.8%) |
| $17,500 to $19,999 | 12 (3.5%) | 0 (0.0%) |
| $20,000 to $22,499 | 0 (0.0%) | 4 (1.1%) |
| $22,500 to $24,999 | 0 (0.0%) | 26 (7.3%) |
| $25,000 to $29,999 | 6 (1.8%) | 13 (3.6%) |
| $30,000 to $34,999 | 27 (8.0%) | 14 (3.9%) |
| $35,000 to $39,999 | 14 (4.1%) | 17 (4.8%) |
| $40,000 to $44,999 | 18 (5.3%) | 78 (21.8%) |
| $45,000 to $49,999 | 11 (3.3%) | 13 (3.6%) |
| $50,000 to $54,999 | 14 (4.1%) | 43 (12.0%) |
| $55,000 to $64,999 | 16 (4.7%) | 0 (0.0%) |
| $65,000 to $74,999 | 0 (0.0%) | 24 (6.7%) |
| $75,000 to $99,999 | 53 (15.7%) | 18 (5.0%) |
| $100,000+ | 98 (29.0%) | 58 (16.2%) |
| Total | 338 (100.0%) | 358 (100.0%) |
Earnings by Sex by Educational Attainment in Millbrook
Average earnings in Millbrook are $80,956 for men and $44,924 for women, a difference of 44.5%. Men with an educational attainment of high school diploma enjoy the highest average annual earnings of $81,771, while those with bachelor's degree education earn the least with $63,516. Women with an educational attainment of graduate degree earn the most with the average annual earnings of $100,625, while those with college or associate's degree education have the smallest earnings of $44,190.
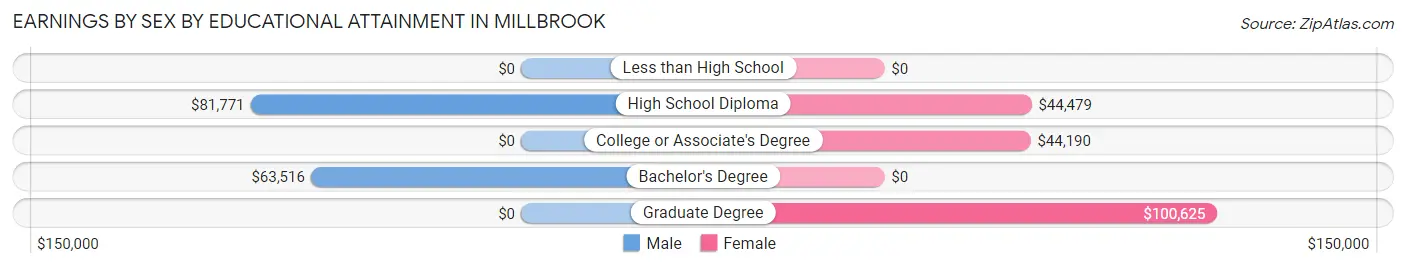
| Educational Attainment | Male Income | Female Income |
| Less than High School | - | - |
| High School Diploma | $81,771 | $44,479 |
| College or Associate's Degree | - | - |
| Bachelor's Degree | $63,516 | $0 |
| Graduate Degree | - | - |
| Total | $80,956 | $44,924 |
Family Income in Millbrook
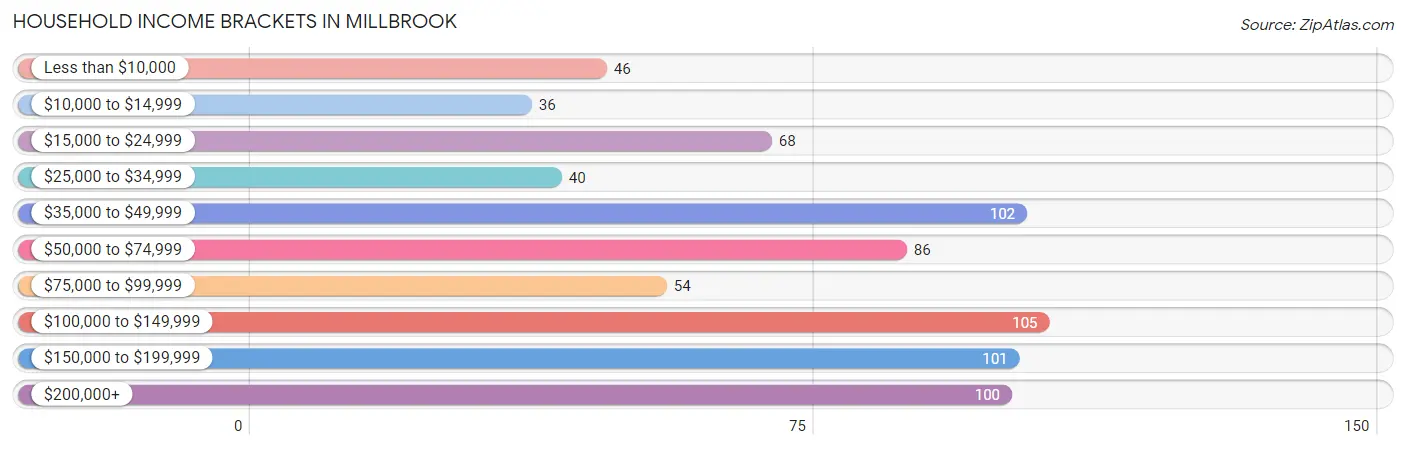
Family Income Brackets in Millbrook
According to the Millbrook family income data, there are 89 families falling into the $150,000 to $199,999 income range, which is the most common income bracket and makes up 26.4% of all families.
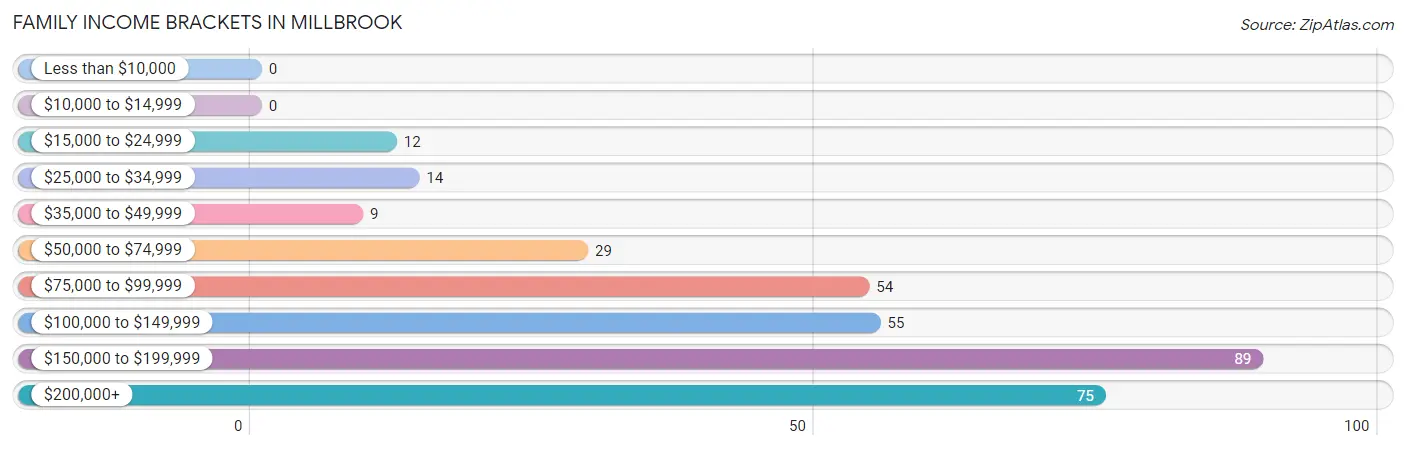
| Income Bracket | # Families | % Families |
| Less than $10,000 | 0 | 0.0% |
| $10,000 to $14,999 | 0 | 0.0% |
| $15,000 to $24,999 | 12 | 3.6% |
| $25,000 to $34,999 | 14 | 4.2% |
| $35,000 to $49,999 | 9 | 2.7% |
| $50,000 to $74,999 | 29 | 8.6% |
| $75,000 to $99,999 | 54 | 16.0% |
| $100,000 to $149,999 | 55 | 16.3% |
| $150,000 to $199,999 | 89 | 26.4% |
| $200,000+ | 75 | 22.3% |
Family Income by Famaliy Size in Millbrook
4-person families (45 | 13.4%) account for the highest median family income in Millbrook with $243,839 per family, while 3-person families (72 | 21.4%) have the highest median income of $65,556 per family member.
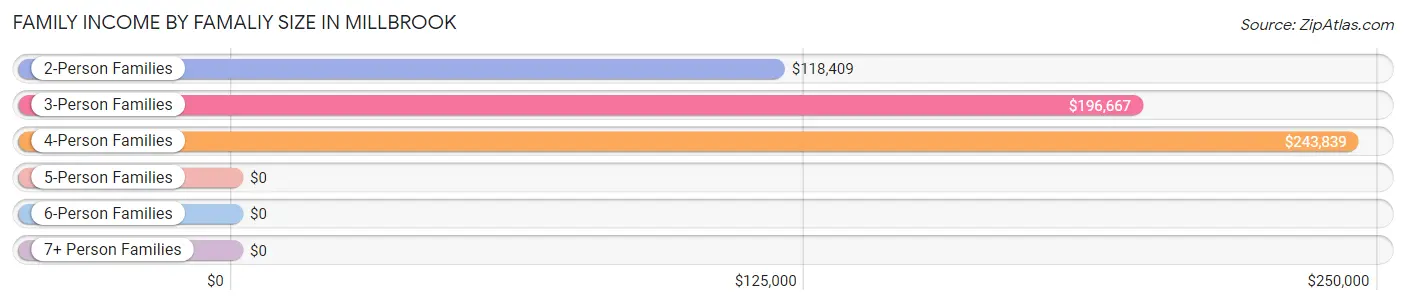
| Income Bracket | # Families | Median Income |
| 2-Person Families | 208 (61.7%) | $118,409 |
| 3-Person Families | 72 (21.4%) | $196,667 |
| 4-Person Families | 45 (13.4%) | $243,839 |
| 5-Person Families | 9 (2.7%) | $0 |
| 6-Person Families | 3 (0.9%) | $0 |
| 7+ Person Families | 0 (0.0%) | $0 |
| Total | 337 (100.0%) | $147,750 |
Family Income by Number of Earners in Millbrook
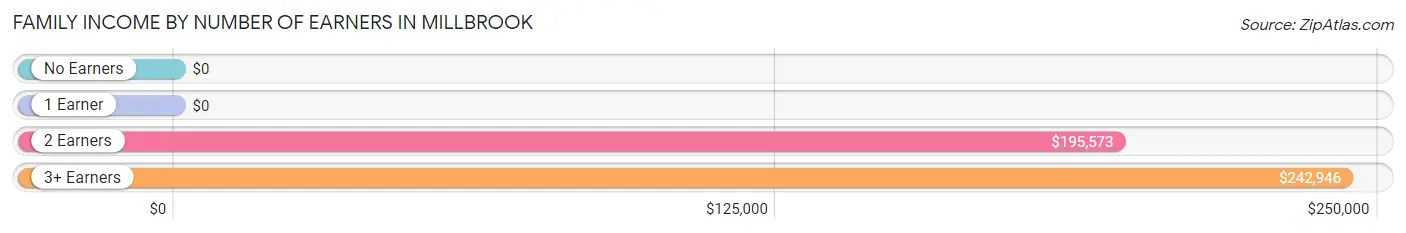
| Number of Earners | # Families | Median Income |
| No Earners | 123 (36.5%) | $0 |
| 1 Earner | 28 (8.3%) | $0 |
| 2 Earners | 163 (48.4%) | $195,573 |
| 3+ Earners | 23 (6.8%) | $242,946 |
| Total | 337 (100.0%) | $147,750 |
Household Income in Millbrook
Household Income Brackets in Millbrook
With 105 households falling in the category, the $100,000 to $149,999 income range is the most frequent in Millbrook, accounting for 14.2% of all households. In contrast, only 36 households (4.9%) fall into the $10,000 to $14,999 income bracket, making it the least populous group.
| Income Bracket | # Households | % Households |
| Less than $10,000 | 46 | 6.2% |
| $10,000 to $14,999 | 36 | 4.9% |
| $15,000 to $24,999 | 68 | 9.2% |
| $25,000 to $34,999 | 40 | 5.4% |
| $35,000 to $49,999 | 102 | 13.8% |
| $50,000 to $74,999 | 86 | 11.7% |
| $75,000 to $99,999 | 54 | 7.3% |
| $100,000 to $149,999 | 105 | 14.2% |
| $150,000 to $199,999 | 101 | 13.7% |
| $200,000+ | 100 | 13.6% |
Household Income by Householder Age in Millbrook
The median household income in Millbrook is $71,477, with the highest median household income of $105,446 found in the 25 to 44 years age bracket for the primary householder. A total of 77 households (10.4%) fall into this category.
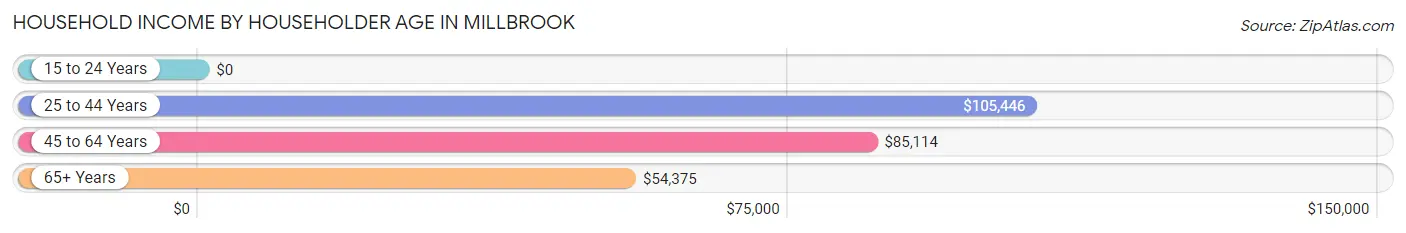
| Income Bracket | # Households | Median Income |
| 15 to 24 Years | 0 (0.0%) | $0 |
| 25 to 44 Years | 77 (10.4%) | $105,446 |
| 45 to 64 Years | 329 (44.6%) | $85,114 |
| 65+ Years | 332 (45.0%) | $54,375 |
| Total | 738 (100.0%) | $71,477 |
Poverty in Millbrook
Income Below Poverty by Sex and Age in Millbrook
With 11.7% poverty level for males and 12.4% for females among the residents of Millbrook, 6 to 11 year old males and 5 year old females are the most vulnerable to poverty, with 1 males (100.0%) and 1 females (100.0%) in their respective age groups living below the poverty level.
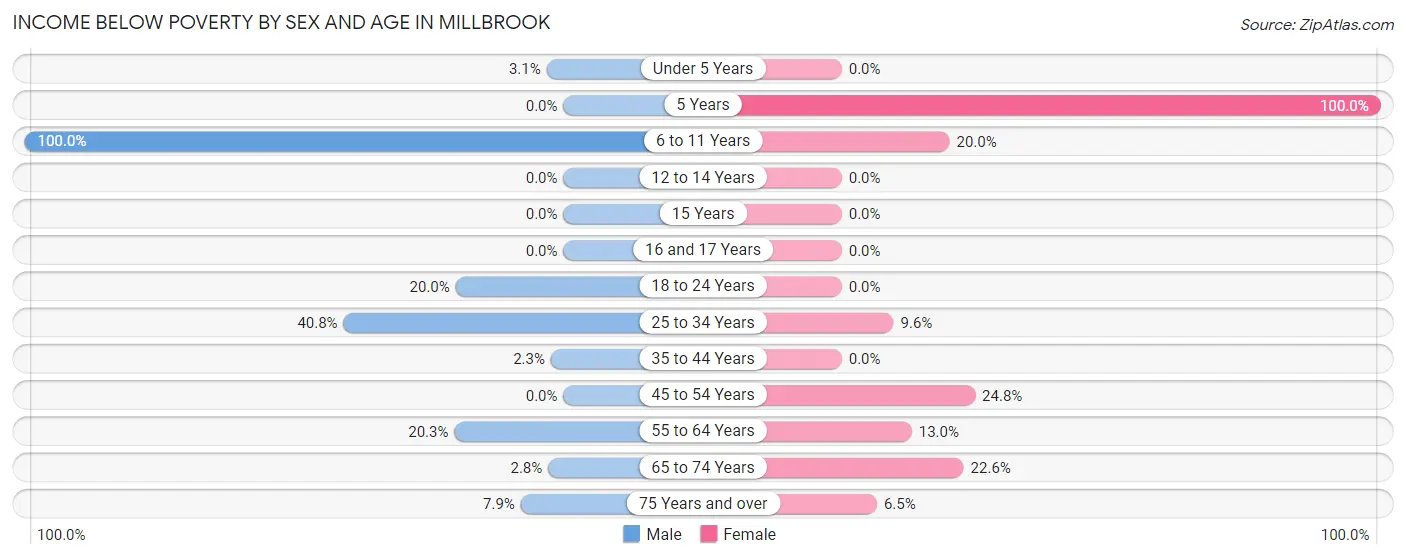
| Age Bracket | Male | Female |
| Under 5 Years | 1 (3.1%) | 0 (0.0%) |
| 5 Years | 0 (0.0%) | 1 (100.0%) |
| 6 to 11 Years | 1 (100.0%) | 1 (20.0%) |
| 12 to 14 Years | 0 (0.0%) | 0 (0.0%) |
| 15 Years | 0 (0.0%) | 0 (0.0%) |
| 16 and 17 Years | 0 (0.0%) | 0 (0.0%) |
| 18 to 24 Years | 6 (20.0%) | 0 (0.0%) |
| 25 to 34 Years | 40 (40.8%) | 5 (9.6%) |
| 35 to 44 Years | 1 (2.3%) | 0 (0.0%) |
| 45 to 54 Years | 0 (0.0%) | 25 (24.7%) |
| 55 to 64 Years | 16 (20.3%) | 26 (13.0%) |
| 65 to 74 Years | 3 (2.8%) | 19 (22.6%) |
| 75 Years and over | 8 (7.9%) | 13 (6.5%) |
| Total | 76 (11.7%) | 90 (12.4%) |
Income Above Poverty by Sex and Age in Millbrook
According to the poverty statistics in Millbrook, males aged 5 years and females aged under 5 years are the age groups that are most secure financially, with 100.0% of males and 100.0% of females in these age groups living above the poverty line.
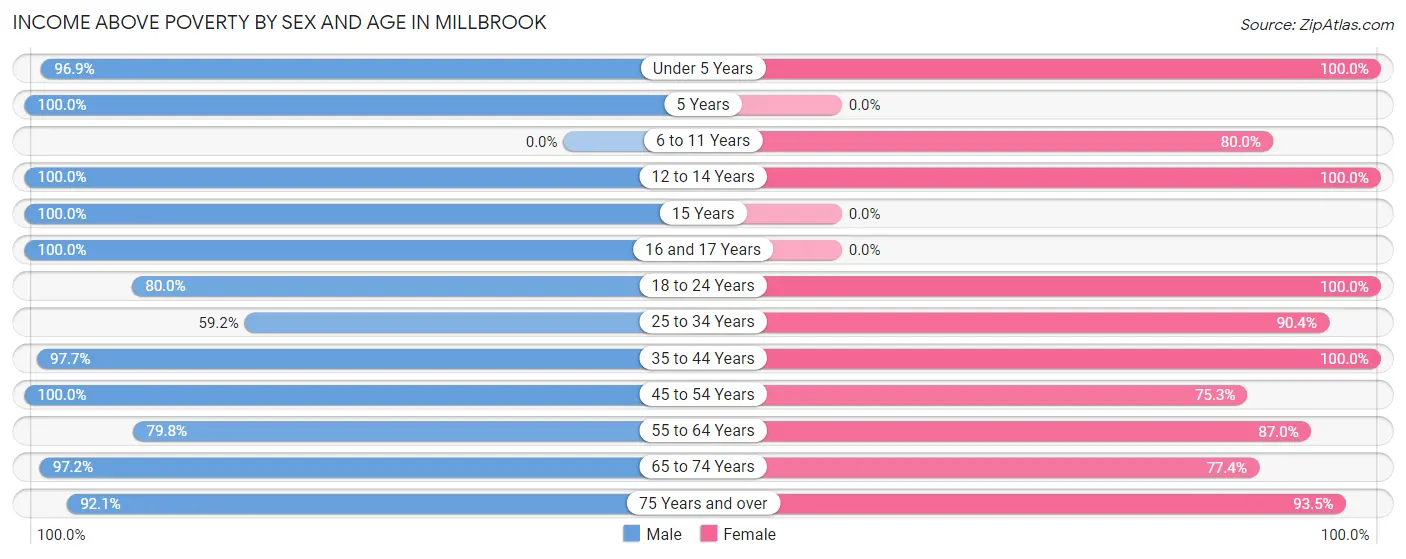
| Age Bracket | Male | Female |
| Under 5 Years | 31 (96.9%) | 35 (100.0%) |
| 5 Years | 2 (100.0%) | 0 (0.0%) |
| 6 to 11 Years | 0 (0.0%) | 4 (80.0%) |
| 12 to 14 Years | 4 (100.0%) | 4 (100.0%) |
| 15 Years | 21 (100.0%) | 0 (0.0%) |
| 16 and 17 Years | 35 (100.0%) | 0 (0.0%) |
| 18 to 24 Years | 24 (80.0%) | 42 (100.0%) |
| 25 to 34 Years | 58 (59.2%) | 47 (90.4%) |
| 35 to 44 Years | 42 (97.7%) | 3 (100.0%) |
| 45 to 54 Years | 95 (100.0%) | 76 (75.2%) |
| 55 to 64 Years | 63 (79.7%) | 174 (87.0%) |
| 65 to 74 Years | 103 (97.2%) | 65 (77.4%) |
| 75 Years and over | 93 (92.1%) | 186 (93.5%) |
| Total | 571 (88.2%) | 636 (87.6%) |
Income Below Poverty Among Married-Couple Families in Millbrook
The poverty statistics for married-couple families in Millbrook show that 4.3% or 13 of the total 302 families live below the poverty line. Families with 3 or 4 children have the highest poverty rate of 33.3%, comprising of 1 families. On the other hand, families with 1 or 2 children have the lowest poverty rate of 0.0%, which includes 0 families.
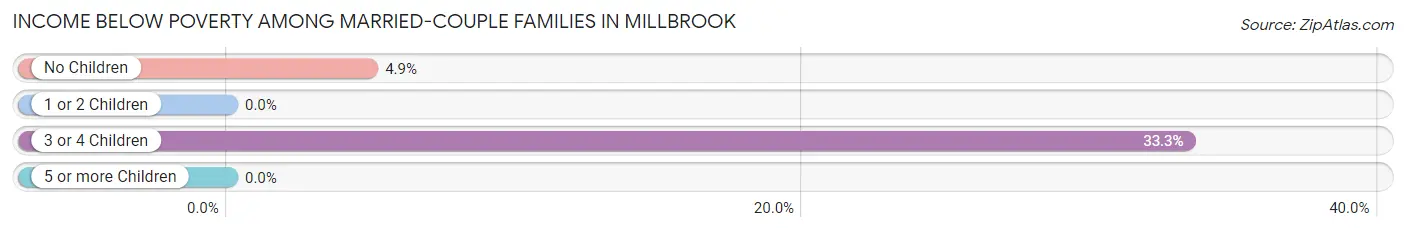
| Children | Above Poverty | Below Poverty |
| No Children | 234 (95.1%) | 12 (4.9%) |
| 1 or 2 Children | 53 (100.0%) | 0 (0.0%) |
| 3 or 4 Children | 2 (66.7%) | 1 (33.3%) |
| 5 or more Children | 0 (0.0%) | 0 (0.0%) |
| Total | 289 (95.7%) | 13 (4.3%) |
Income Below Poverty Among Single-Parent Households in Millbrook
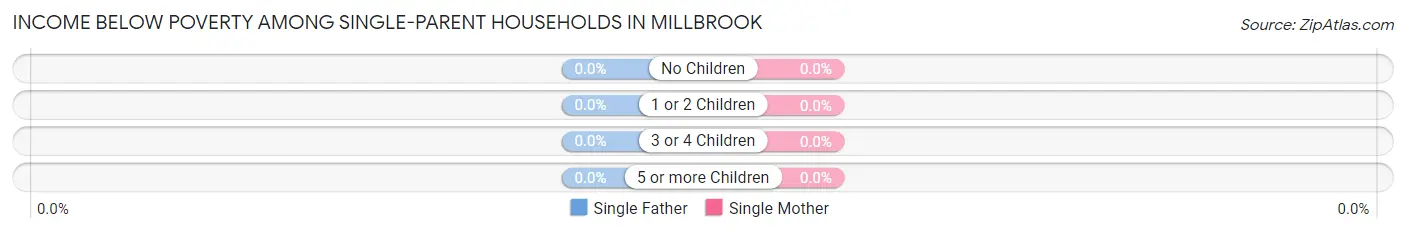
| Children | Single Father | Single Mother |
| No Children | 0 (0.0%) | 0 (0.0%) |
| 1 or 2 Children | 0 (0.0%) | 0 (0.0%) |
| 3 or 4 Children | 0 (0.0%) | 0 (0.0%) |
| 5 or more Children | 0 (0.0%) | 0 (0.0%) |
| Total | 0 (0.0%) | 0 (0.0%) |
Income Below Poverty Among Married-Couple vs Single-Parent Households in Millbrook
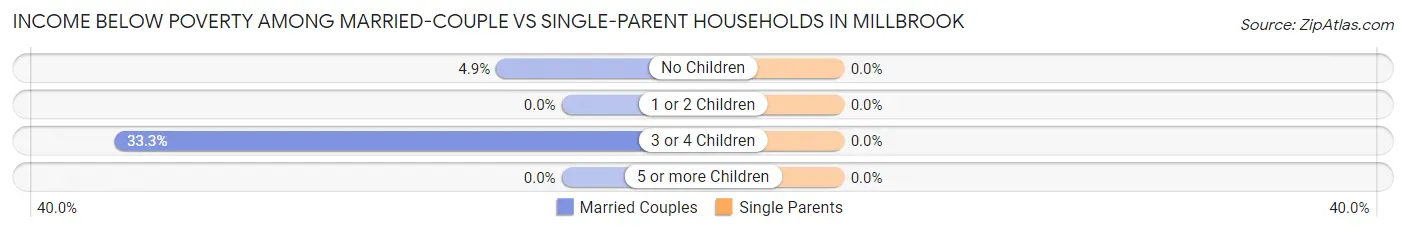
| Children | Married-Couple Families | Single-Parent Households |
| No Children | 12 (4.9%) | 0 (0.0%) |
| 1 or 2 Children | 0 (0.0%) | 0 (0.0%) |
| 3 or 4 Children | 1 (33.3%) | 0 (0.0%) |
| 5 or more Children | 0 (0.0%) | 0 (0.0%) |
| Total | 13 (4.3%) | 0 (0.0%) |
Employment Characteristics in Millbrook
Employment by Class of Employer in Millbrook
Among the 654 employed individuals in Millbrook, private company employees (359 | 54.9%), not-for-profit organizations (97 | 14.8%), and local government employees (90 | 13.8%) make up the most common classes of employment.
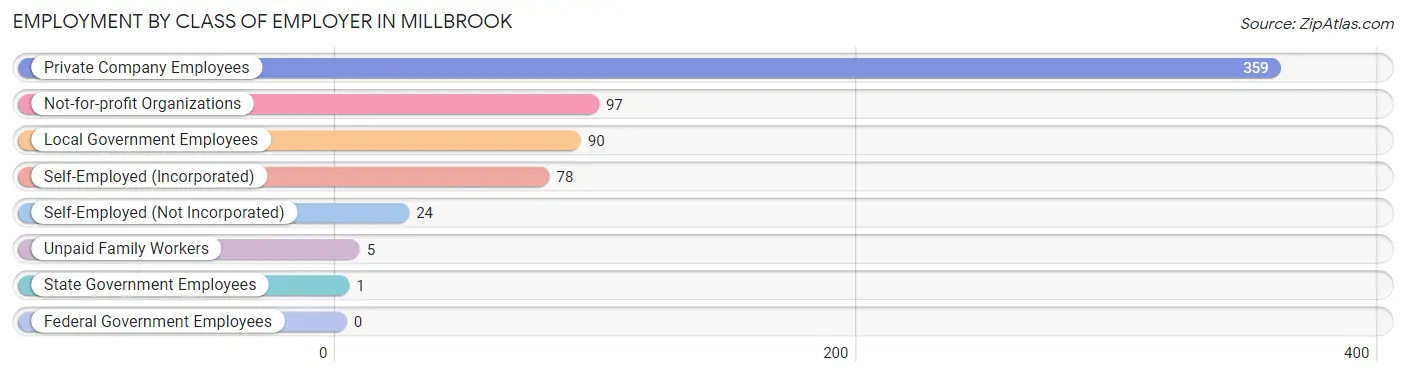
| Employer Class | # Employees | % Employees |
| Private Company Employees | 359 | 54.9% |
| Self-Employed (Incorporated) | 78 | 11.9% |
| Self-Employed (Not Incorporated) | 24 | 3.7% |
| Not-for-profit Organizations | 97 | 14.8% |
| Local Government Employees | 90 | 13.8% |
| State Government Employees | 1 | 0.2% |
| Federal Government Employees | 0 | 0.0% |
| Unpaid Family Workers | 5 | 0.8% |
| Total | 654 | 100.0% |
Employment Status by Age in Millbrook
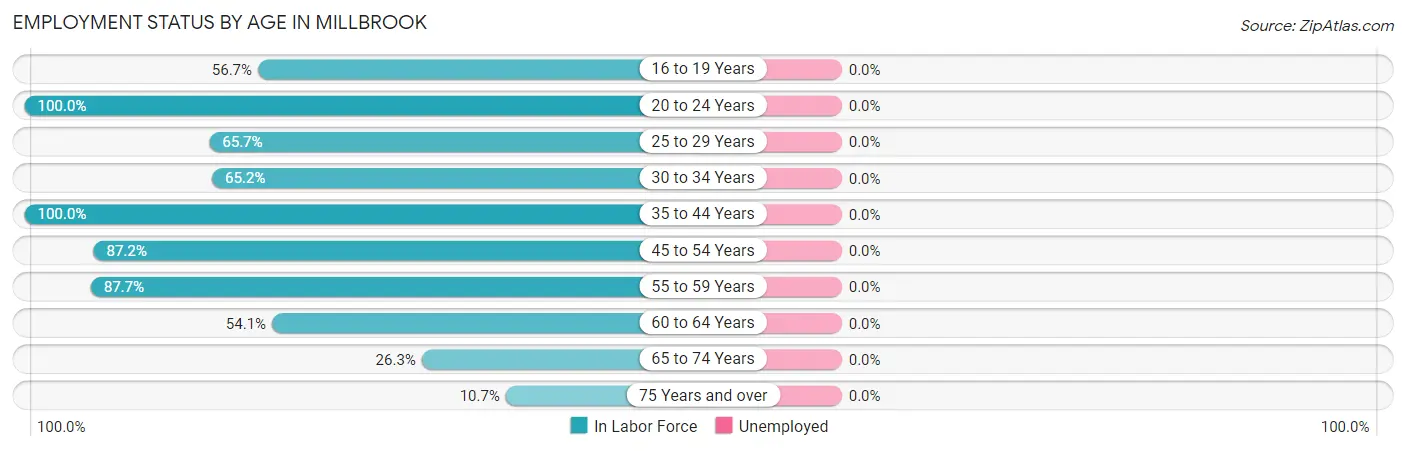
| Age Bracket | In Labor Force | Unemployed |
| 16 to 19 Years | 34 (56.7%) | 0 (0.0%) |
| 20 to 24 Years | 47 (100.0%) | 0 (0.0%) |
| 25 to 29 Years | 23 (65.7%) | 0 (0.0%) |
| 30 to 34 Years | 75 (65.2%) | 0 (0.0%) |
| 35 to 44 Years | 46 (100.0%) | 0 (0.0%) |
| 45 to 54 Years | 171 (87.2%) | 0 (0.0%) |
| 55 to 59 Years | 107 (87.7%) | 0 (0.0%) |
| 60 to 64 Years | 85 (54.1%) | 0 (0.0%) |
| 65 to 74 Years | 50 (26.3%) | 0 (0.0%) |
| 75 Years and over | 32 (10.7%) | 0 (0.0%) |
| Total | 670 (52.8%) | 0 (0.0%) |
Employment Status by Educational Attainment in Millbrook
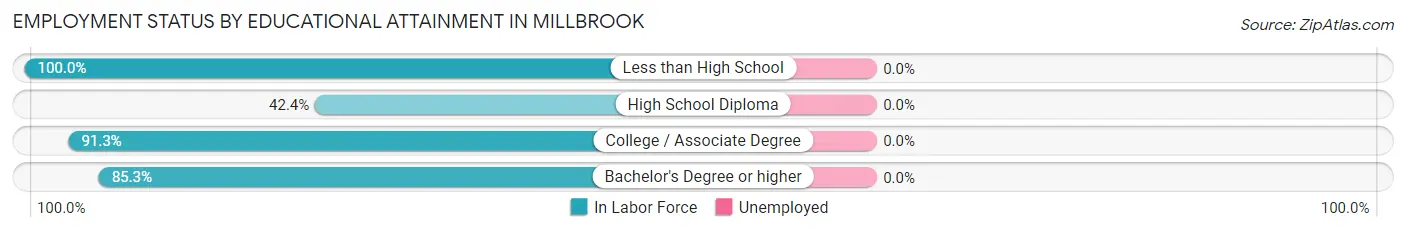
| Educational Attainment | In Labor Force | Unemployed |
| Less than High School | 1 (100.0%) | 0 (0.0%) |
| High School Diploma | 81 (42.4%) | 0 (0.0%) |
| College / Associate Degree | 251 (91.3%) | 0 (0.0%) |
| Bachelor's Degree or higher | 174 (85.3%) | 0 (0.0%) |
| Total | 507 (75.6%) | 0 (0.0%) |
Employment Occupations by Sex in Millbrook
Management, Business, Science and Arts Occupations
The most common Management, Business, Science and Arts occupations in Millbrook are Community & Social Service (119 | 17.8%), Health Diagnosing & Treating (62 | 9.2%), Health Technologists (58 | 8.7%), Arts, Media & Entertainment (54 | 8.1%), and Business & Financial (53 | 7.9%).
Management, Business, Science and Arts Occupations by Sex
Within the Management, Business, Science and Arts occupations in Millbrook, the most male-oriented occupations are Computers, Engineering & Science (100.0%), Computers & Mathematics (100.0%), and Architecture & Engineering (100.0%), while the most female-oriented occupations are Education Instruction & Library (96.4%), Health Diagnosing & Treating (80.6%), and Health Technologists (79.3%).
| Occupation | Male | Female |
| Management | 40 (88.9%) | 5 (11.1%) |
| Business & Financial | 15 (28.3%) | 38 (71.7%) |
| Computers, Engineering & Science | 10 (100.0%) | 0 (0.0%) |
| Computers & Mathematics | 5 (100.0%) | 0 (0.0%) |
| Architecture & Engineering | 5 (100.0%) | 0 (0.0%) |
| Life, Physical & Social Science | 0 (0.0%) | 0 (0.0%) |
| Community & Social Service | 44 (37.0%) | 75 (63.0%) |
| Education, Arts & Media | 2 (100.0%) | 0 (0.0%) |
| Legal Services & Support | 11 (31.4%) | 24 (68.6%) |
| Education Instruction & Library | 1 (3.6%) | 27 (96.4%) |
| Arts, Media & Entertainment | 30 (55.6%) | 24 (44.4%) |
| Health Diagnosing & Treating | 12 (19.4%) | 50 (80.6%) |
| Health Technologists | 12 (20.7%) | 46 (79.3%) |
| Total (Category) | 121 (41.9%) | 168 (58.1%) |
| Total (Overall) | 328 (49.0%) | 342 (51.0%) |
Services Occupations
The most common Services occupations in Millbrook are Personal Care & Service (59 | 8.8%), Food Preparation & Serving (38 | 5.7%), Healthcare Support (23 | 3.4%), Security & Protection (19 | 2.8%), and Firefighting & Prevention (15 | 2.2%).
Services Occupations by Sex
Within the Services occupations in Millbrook, the most male-oriented occupations are Security & Protection (100.0%), Firefighting & Prevention (100.0%), and Law Enforcement (100.0%), while the most female-oriented occupations are Healthcare Support (100.0%), Personal Care & Service (100.0%), and Food Preparation & Serving (26.3%).
| Occupation | Male | Female |
| Healthcare Support | 0 (0.0%) | 23 (100.0%) |
| Security & Protection | 19 (100.0%) | 0 (0.0%) |
| Firefighting & Prevention | 15 (100.0%) | 0 (0.0%) |
| Law Enforcement | 4 (100.0%) | 0 (0.0%) |
| Food Preparation & Serving | 28 (73.7%) | 10 (26.3%) |
| Cleaning & Maintenance | 0 (0.0%) | 0 (0.0%) |
| Personal Care & Service | 0 (0.0%) | 59 (100.0%) |
| Total (Category) | 47 (33.8%) | 92 (66.2%) |
| Total (Overall) | 328 (49.0%) | 342 (51.0%) |
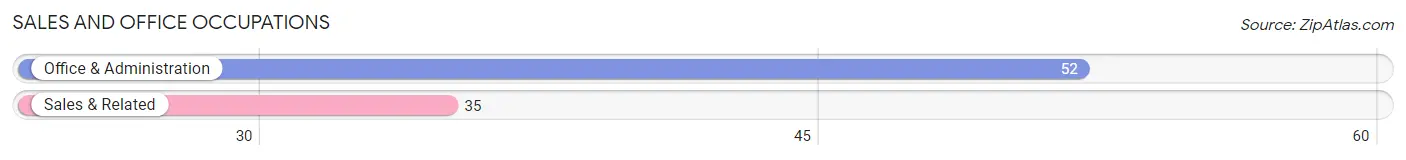
Sales and Office Occupations
The most common Sales and Office occupations in Millbrook are Office & Administration (52 | 7.8%), and Sales & Related (35 | 5.2%).
Sales and Office Occupations by Sex
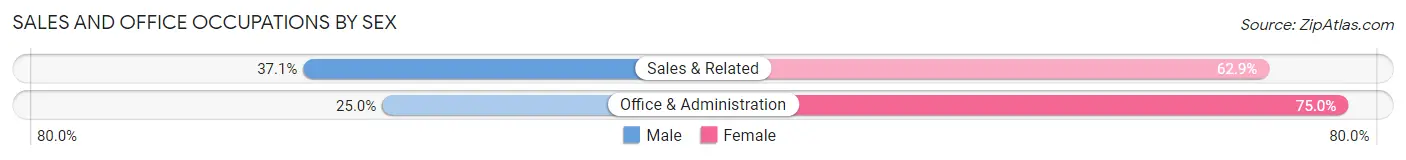
| Occupation | Male | Female |
| Sales & Related | 13 (37.1%) | 22 (62.9%) |
| Office & Administration | 13 (25.0%) | 39 (75.0%) |
| Total (Category) | 26 (29.9%) | 61 (70.1%) |
| Total (Overall) | 328 (49.0%) | 342 (51.0%) |
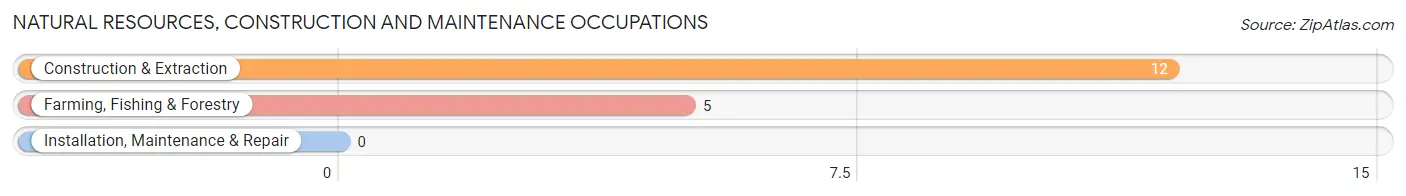
Natural Resources, Construction and Maintenance Occupations
The most common Natural Resources, Construction and Maintenance occupations in Millbrook are Construction & Extraction (12 | 1.8%), and Farming, Fishing & Forestry (5 | 0.7%).
Natural Resources, Construction and Maintenance Occupations by Sex
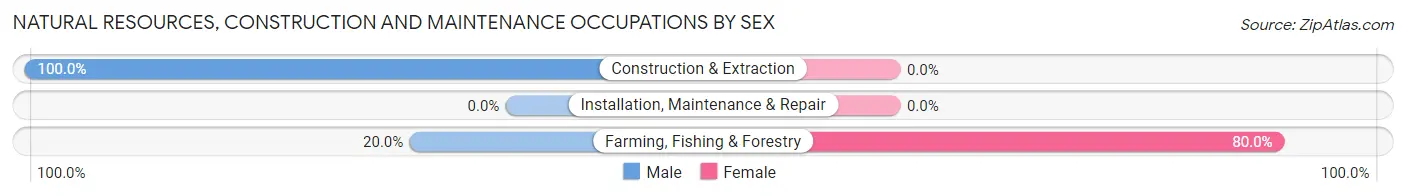
| Occupation | Male | Female |
| Farming, Fishing & Forestry | 1 (20.0%) | 4 (80.0%) |
| Construction & Extraction | 12 (100.0%) | 0 (0.0%) |
| Installation, Maintenance & Repair | 0 (0.0%) | 0 (0.0%) |
| Total (Category) | 13 (76.5%) | 4 (23.5%) |
| Total (Overall) | 328 (49.0%) | 342 (51.0%) |
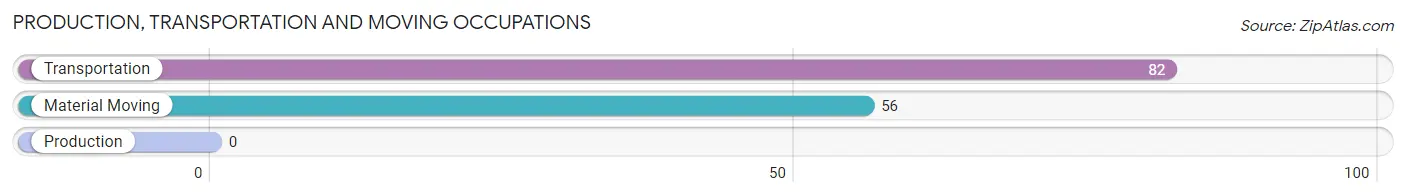
Production, Transportation and Moving Occupations
The most common Production, Transportation and Moving occupations in Millbrook are Transportation (82 | 12.2%), and Material Moving (56 | 8.4%).
Production, Transportation and Moving Occupations by Sex
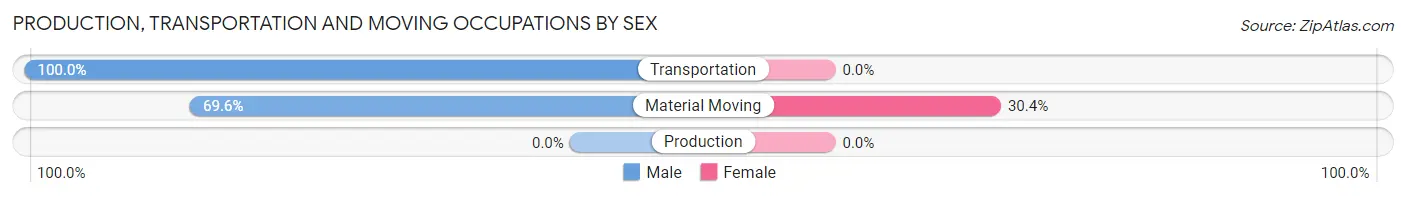
| Occupation | Male | Female |
| Production | 0 (0.0%) | 0 (0.0%) |
| Transportation | 82 (100.0%) | 0 (0.0%) |
| Material Moving | 39 (69.6%) | 17 (30.4%) |
| Total (Category) | 121 (87.7%) | 17 (12.3%) |
| Total (Overall) | 328 (49.0%) | 342 (51.0%) |
Employment Industries by Sex in Millbrook
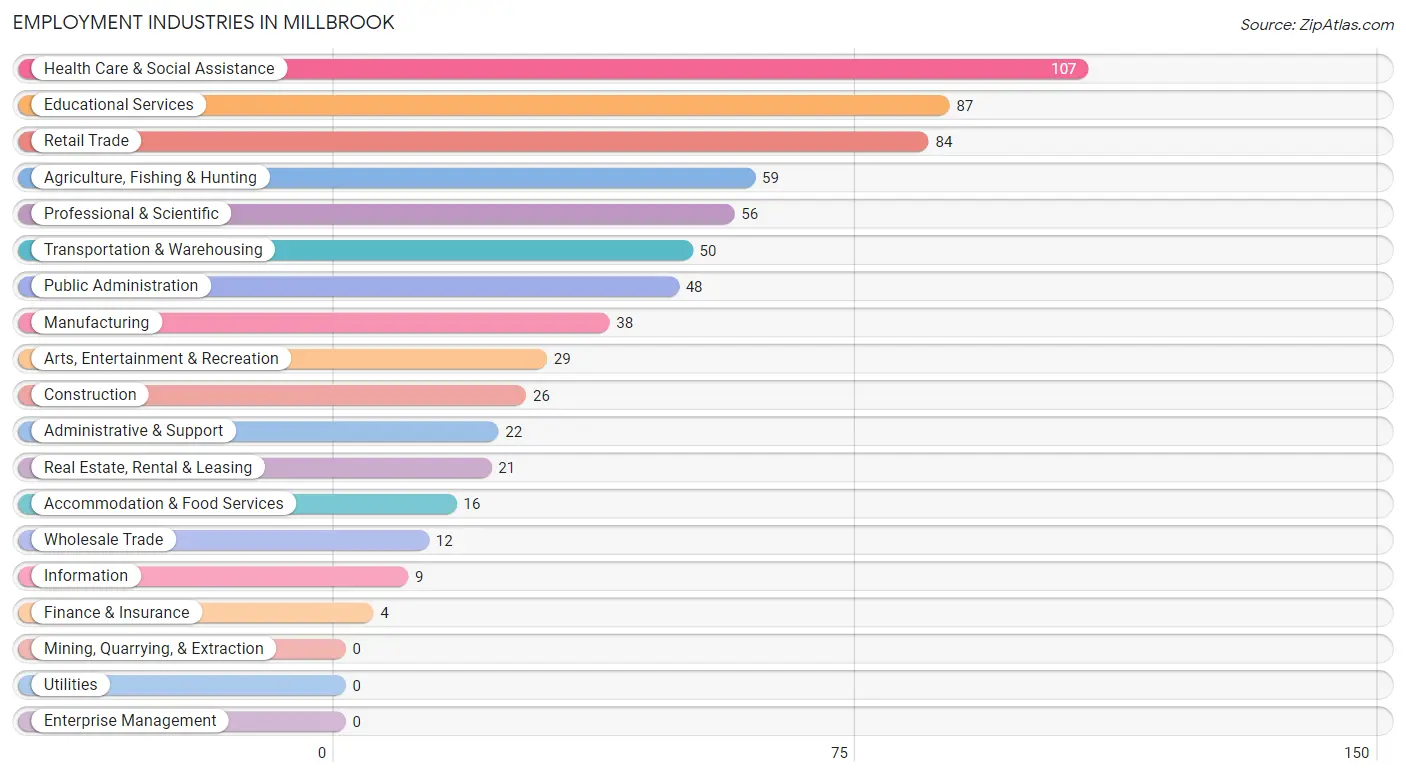
Employment Industries in Millbrook
The major employment industries in Millbrook include Health Care & Social Assistance (107 | 16.0%), Educational Services (87 | 13.0%), Retail Trade (84 | 12.5%), Agriculture, Fishing & Hunting (59 | 8.8%), and Professional & Scientific (56 | 8.4%).
Employment Industries by Sex in Millbrook
The Millbrook industries that see more men than women are Construction (100.0%), Wholesale Trade (100.0%), and Transportation & Warehousing (100.0%), whereas the industries that tend to have a higher number of women are Finance & Insurance (100.0%), Agriculture, Fishing & Hunting (98.3%), and Real Estate, Rental & Leasing (76.2%).
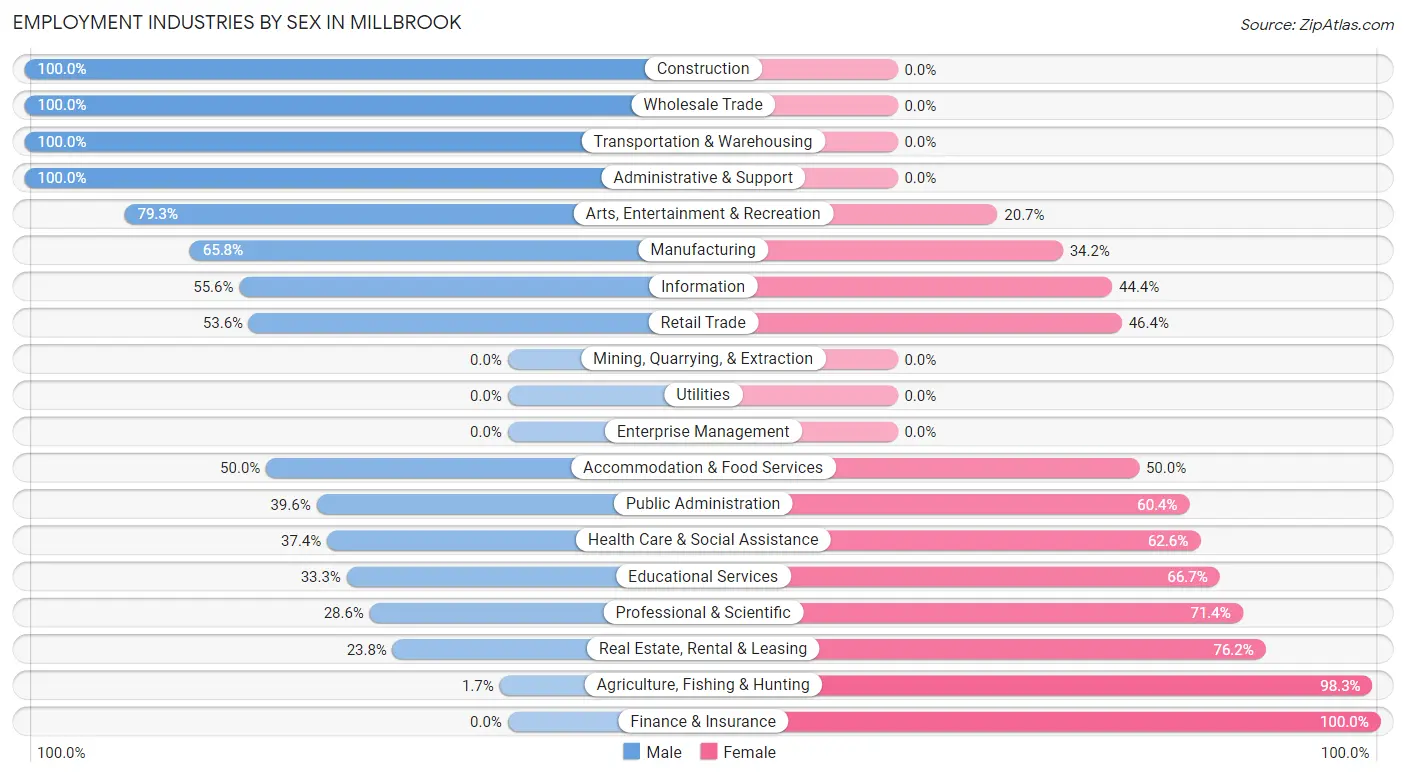
| Industry | Male | Female |
| Agriculture, Fishing & Hunting | 1 (1.7%) | 58 (98.3%) |
| Mining, Quarrying, & Extraction | 0 (0.0%) | 0 (0.0%) |
| Construction | 26 (100.0%) | 0 (0.0%) |
| Manufacturing | 25 (65.8%) | 13 (34.2%) |
| Wholesale Trade | 12 (100.0%) | 0 (0.0%) |
| Retail Trade | 45 (53.6%) | 39 (46.4%) |
| Transportation & Warehousing | 50 (100.0%) | 0 (0.0%) |
| Utilities | 0 (0.0%) | 0 (0.0%) |
| Information | 5 (55.6%) | 4 (44.4%) |
| Finance & Insurance | 0 (0.0%) | 4 (100.0%) |
| Real Estate, Rental & Leasing | 5 (23.8%) | 16 (76.2%) |
| Professional & Scientific | 16 (28.6%) | 40 (71.4%) |
| Enterprise Management | 0 (0.0%) | 0 (0.0%) |
| Administrative & Support | 22 (100.0%) | 0 (0.0%) |
| Educational Services | 29 (33.3%) | 58 (66.7%) |
| Health Care & Social Assistance | 40 (37.4%) | 67 (62.6%) |
| Arts, Entertainment & Recreation | 23 (79.3%) | 6 (20.7%) |
| Accommodation & Food Services | 8 (50.0%) | 8 (50.0%) |
| Public Administration | 19 (39.6%) | 29 (60.4%) |
| Total | 328 (49.0%) | 342 (51.0%) |
Education in Millbrook
School Enrollment in Millbrook
The most common levels of schooling among the 177 students in Millbrook are high school (76 | 42.9%), college / undergraduate (34 | 19.2%), and graduate / professional (33 | 18.6%).
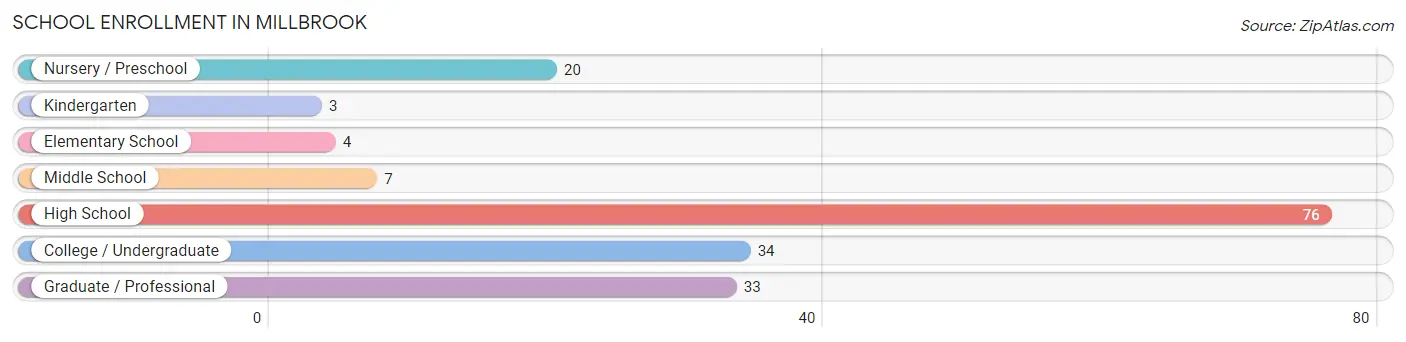
| School Level | # Students | % Students |
| Nursery / Preschool | 20 | 11.3% |
| Kindergarten | 3 | 1.7% |
| Elementary School | 4 | 2.3% |
| Middle School | 7 | 4.0% |
| High School | 76 | 42.9% |
| College / Undergraduate | 34 | 19.2% |
| Graduate / Professional | 33 | 18.6% |
| Total | 177 | 100.0% |
School Enrollment by Age by Funding Source in Millbrook
Out of a total of 177 students who are enrolled in schools in Millbrook, 44 (24.9%) attend a private institution, while the remaining 133 (75.1%) are enrolled in public schools. The age group of 20 to 24 year olds has the highest likelihood of being enrolled in private schools, with 17 (50.0% in the age bracket) enrolled. Conversely, the age group of 3 to 4 year olds has the lowest likelihood of being enrolled in a private school, with 20 (100.0% in the age bracket) attending a public institution.
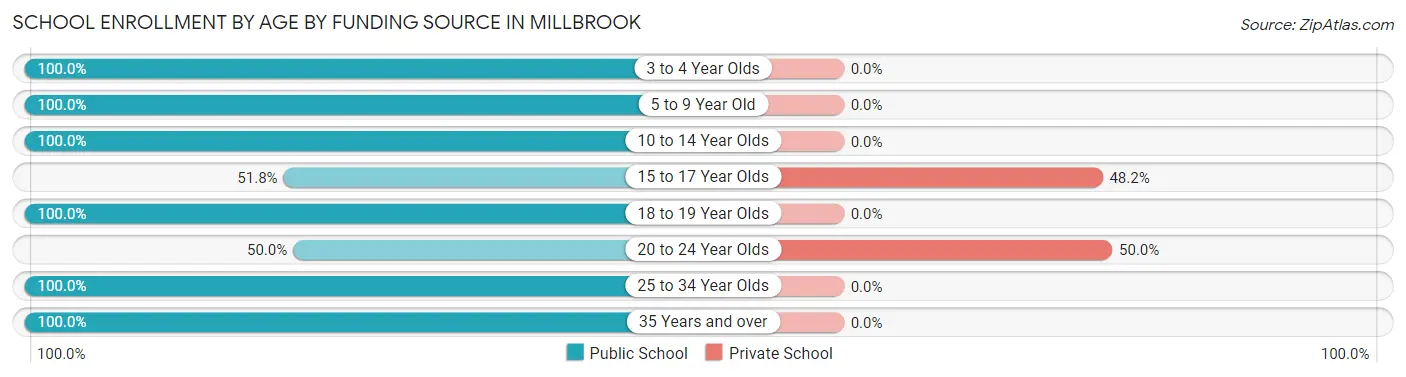
| Age Bracket | Public School | Private School |
| 3 to 4 Year Olds | 20 (100.0%) | 0 (0.0%) |
| 5 to 9 Year Old | 7 (100.0%) | 0 (0.0%) |
| 10 to 14 Year Olds | 19 (100.0%) | 0 (0.0%) |
| 15 to 17 Year Olds | 29 (51.8%) | 27 (48.2%) |
| 18 to 19 Year Olds | 25 (100.0%) | 0 (0.0%) |
| 20 to 24 Year Olds | 17 (50.0%) | 17 (50.0%) |
| 25 to 34 Year Olds | 12 (100.0%) | 0 (0.0%) |
| 35 Years and over | 4 (100.0%) | 0 (0.0%) |
| Total | 133 (75.1%) | 44 (24.9%) |
Educational Attainment by Field of Study in Millbrook
Literature & languages (104 | 20.7%), social sciences (95 | 18.9%), education (81 | 16.1%), business (58 | 11.6%), and liberal arts & history (36 | 7.2%) are the most common fields of study among 502 individuals in Millbrook who have obtained a bachelor's degree or higher.
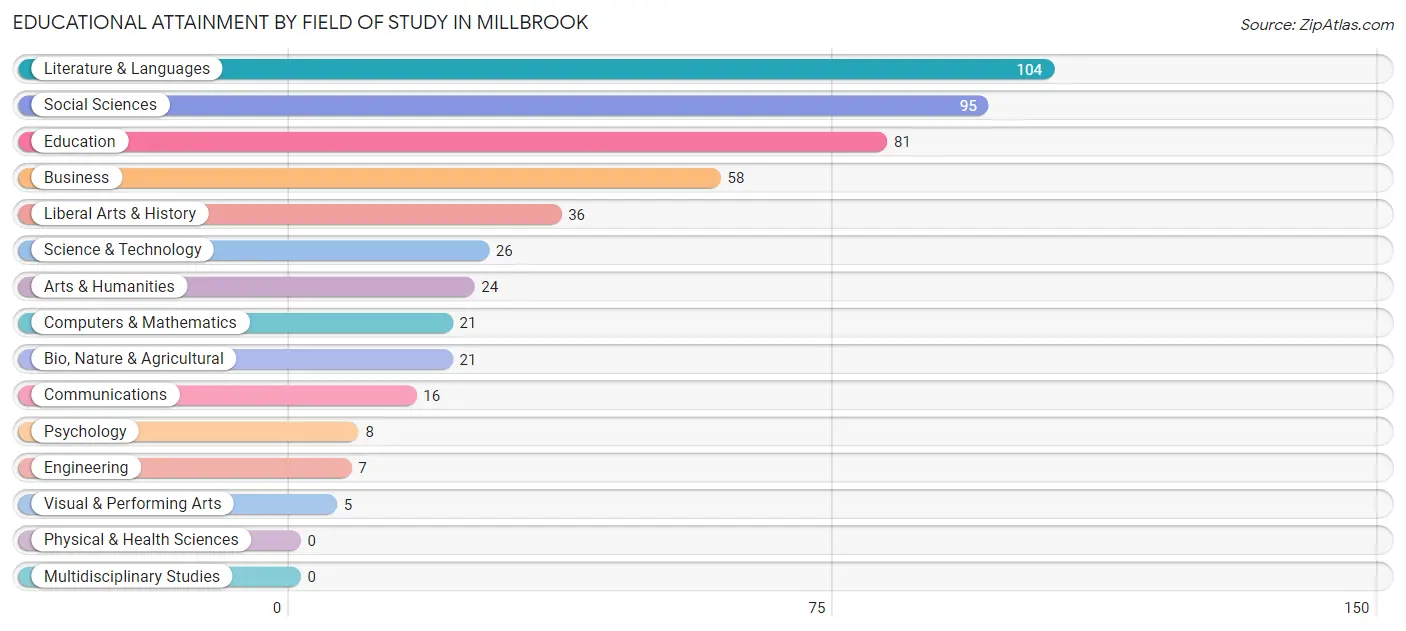
| Field of Study | # Graduates | % Graduates |
| Computers & Mathematics | 21 | 4.2% |
| Bio, Nature & Agricultural | 21 | 4.2% |
| Physical & Health Sciences | 0 | 0.0% |
| Psychology | 8 | 1.6% |
| Social Sciences | 95 | 18.9% |
| Engineering | 7 | 1.4% |
| Multidisciplinary Studies | 0 | 0.0% |
| Science & Technology | 26 | 5.2% |
| Business | 58 | 11.6% |
| Education | 81 | 16.1% |
| Literature & Languages | 104 | 20.7% |
| Liberal Arts & History | 36 | 7.2% |
| Visual & Performing Arts | 5 | 1.0% |
| Communications | 16 | 3.2% |
| Arts & Humanities | 24 | 4.8% |
| Total | 502 | 100.0% |
Transportation & Commute in Millbrook
Vehicle Availability by Sex in Millbrook
The most prevalent vehicle ownership categories in Millbrook are males with 3 vehicles (98, accounting for 30.5%) and females with 3 vehicles (43, making up 29.6%).
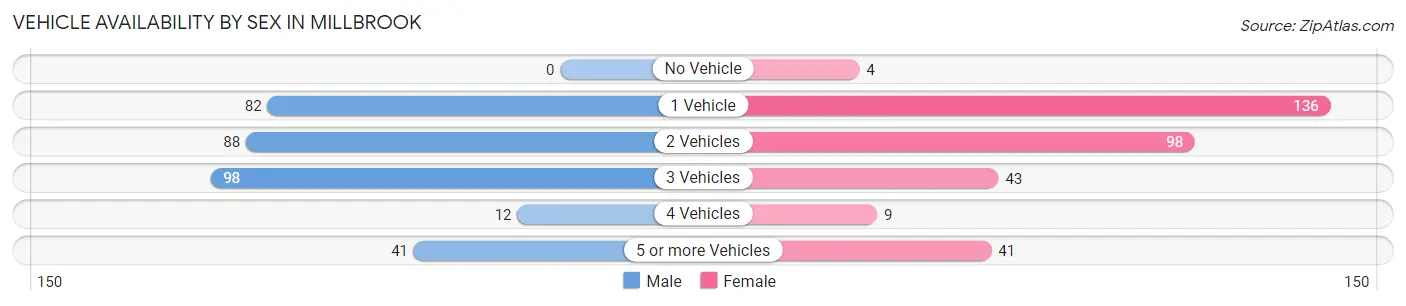
| Vehicles Available | Male | Female |
| No Vehicle | 0 (0.0%) | 4 (1.2%) |
| 1 Vehicle | 82 (25.6%) | 136 (41.1%) |
| 2 Vehicles | 88 (27.4%) | 98 (29.6%) |
| 3 Vehicles | 98 (30.5%) | 43 (13.0%) |
| 4 Vehicles | 12 (3.7%) | 9 (2.7%) |
| 5 or more Vehicles | 41 (12.8%) | 41 (12.4%) |
| Total | 321 (100.0%) | 331 (100.0%) |
Commute Time in Millbrook
The most frequently occuring commute durations in Millbrook are 45 to 59 minutes (93 commuters, 15.9%), less than 5 minutes (74 commuters, 12.7%), and 30 to 34 minutes (71 commuters, 12.2%).
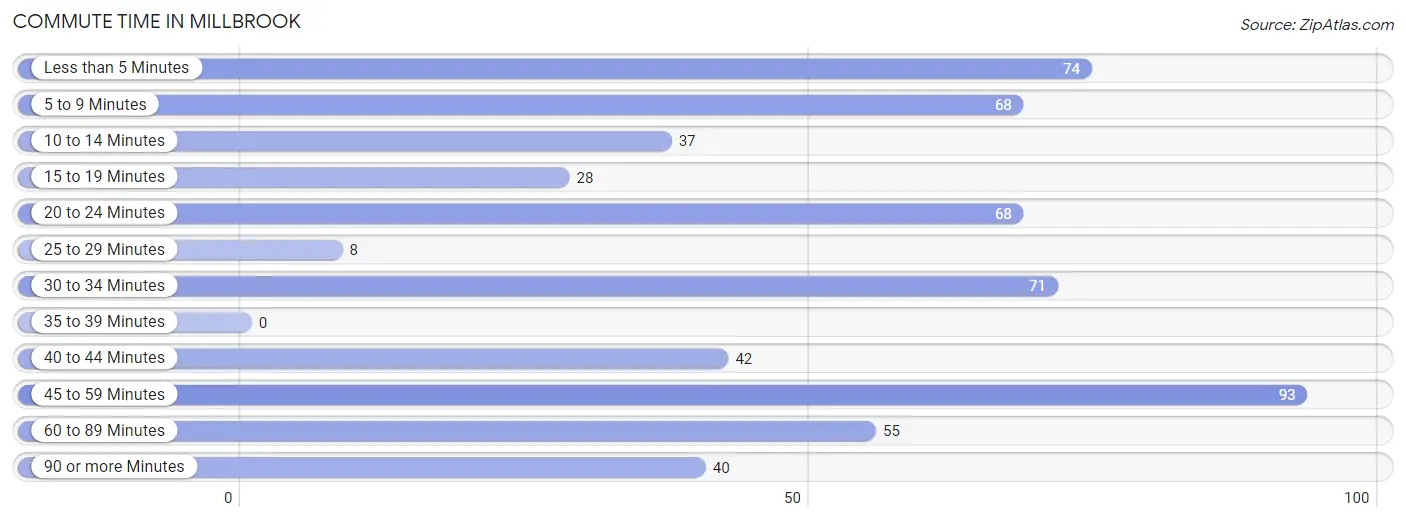
| Commute Time | # Commuters | % Commuters |
| Less than 5 Minutes | 74 | 12.7% |
| 5 to 9 Minutes | 68 | 11.6% |
| 10 to 14 Minutes | 37 | 6.3% |
| 15 to 19 Minutes | 28 | 4.8% |
| 20 to 24 Minutes | 68 | 11.6% |
| 25 to 29 Minutes | 8 | 1.4% |
| 30 to 34 Minutes | 71 | 12.2% |
| 35 to 39 Minutes | 0 | 0.0% |
| 40 to 44 Minutes | 42 | 7.2% |
| 45 to 59 Minutes | 93 | 15.9% |
| 60 to 89 Minutes | 55 | 9.4% |
| 90 or more Minutes | 40 | 6.9% |
Commute Time by Sex in Millbrook
The most common commute times in Millbrook are 5 to 9 minutes (50 commuters, 16.3%) for males and 45 to 59 minutes (58 commuters, 20.9%) for females.
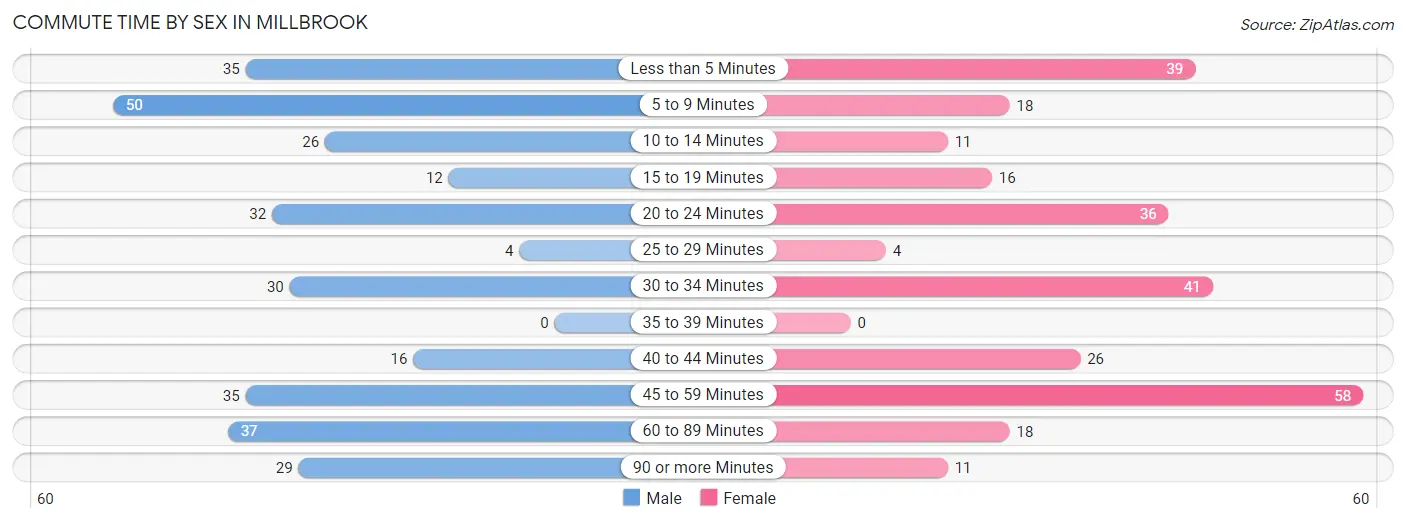
| Commute Time | Male | Female |
| Less than 5 Minutes | 35 (11.4%) | 39 (14.0%) |
| 5 to 9 Minutes | 50 (16.3%) | 18 (6.5%) |
| 10 to 14 Minutes | 26 (8.5%) | 11 (4.0%) |
| 15 to 19 Minutes | 12 (3.9%) | 16 (5.8%) |
| 20 to 24 Minutes | 32 (10.5%) | 36 (13.0%) |
| 25 to 29 Minutes | 4 (1.3%) | 4 (1.4%) |
| 30 to 34 Minutes | 30 (9.8%) | 41 (14.7%) |
| 35 to 39 Minutes | 0 (0.0%) | 0 (0.0%) |
| 40 to 44 Minutes | 16 (5.2%) | 26 (9.3%) |
| 45 to 59 Minutes | 35 (11.4%) | 58 (20.9%) |
| 60 to 89 Minutes | 37 (12.1%) | 18 (6.5%) |
| 90 or more Minutes | 29 (9.5%) | 11 (4.0%) |
Time of Departure to Work by Sex in Millbrook
The most frequent times of departure to work in Millbrook are 7:30 AM to 7:59 AM (65, 21.2%) for males and 7:30 AM to 7:59 AM (120, 43.2%) for females.
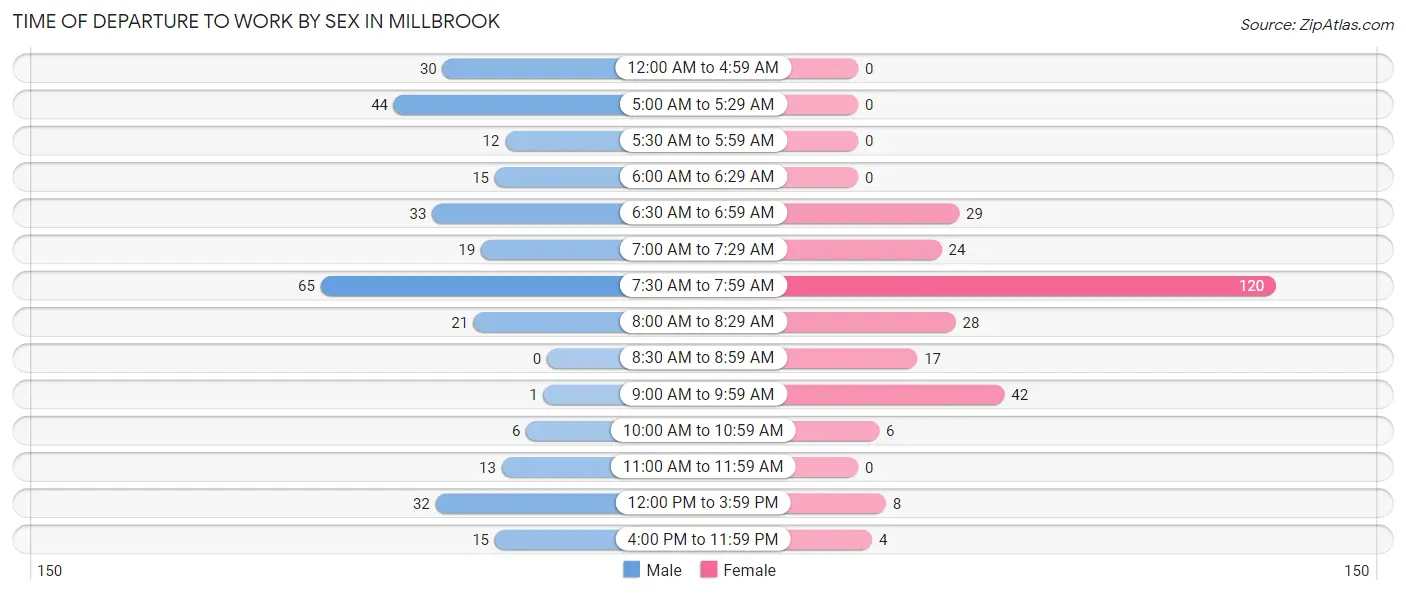
| Time of Departure | Male | Female |
| 12:00 AM to 4:59 AM | 30 (9.8%) | 0 (0.0%) |
| 5:00 AM to 5:29 AM | 44 (14.4%) | 0 (0.0%) |
| 5:30 AM to 5:59 AM | 12 (3.9%) | 0 (0.0%) |
| 6:00 AM to 6:29 AM | 15 (4.9%) | 0 (0.0%) |
| 6:30 AM to 6:59 AM | 33 (10.8%) | 29 (10.4%) |
| 7:00 AM to 7:29 AM | 19 (6.2%) | 24 (8.6%) |
| 7:30 AM to 7:59 AM | 65 (21.2%) | 120 (43.2%) |
| 8:00 AM to 8:29 AM | 21 (6.9%) | 28 (10.1%) |
| 8:30 AM to 8:59 AM | 0 (0.0%) | 17 (6.1%) |
| 9:00 AM to 9:59 AM | 1 (0.3%) | 42 (15.1%) |
| 10:00 AM to 10:59 AM | 6 (2.0%) | 6 (2.2%) |
| 11:00 AM to 11:59 AM | 13 (4.3%) | 0 (0.0%) |
| 12:00 PM to 3:59 PM | 32 (10.5%) | 8 (2.9%) |
| 4:00 PM to 11:59 PM | 15 (4.9%) | 4 (1.4%) |
| Total | 306 (100.0%) | 278 (100.0%) |
Housing Occupancy in Millbrook
Occupancy by Ownership in Millbrook
Of the total 738 dwellings in Millbrook, owner-occupied units account for 383 (51.9%), while renter-occupied units make up 355 (48.1%).
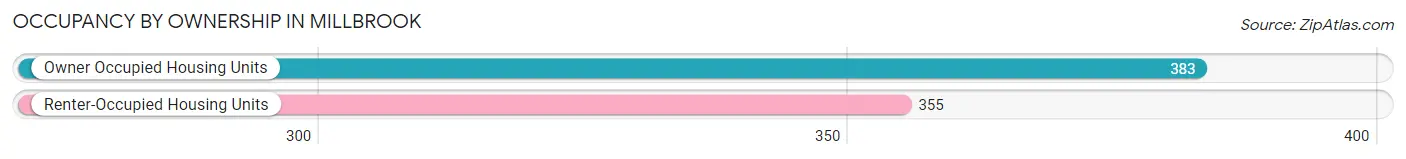
| Occupancy | # Housing Units | % Housing Units |
| Owner Occupied Housing Units | 383 | 51.9% |
| Renter-Occupied Housing Units | 355 | 48.1% |
| Total Occupied Housing Units | 738 | 100.0% |
Occupancy by Household Size in Millbrook
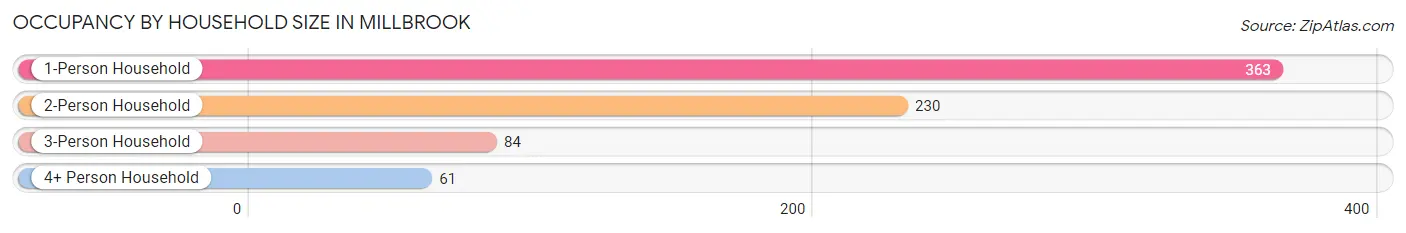
| Household Size | # Housing Units | % Housing Units |
| 1-Person Household | 363 | 49.2% |
| 2-Person Household | 230 | 31.2% |
| 3-Person Household | 84 | 11.4% |
| 4+ Person Household | 61 | 8.3% |
| Total Housing Units | 738 | 100.0% |
Occupancy by Ownership by Household Size in Millbrook
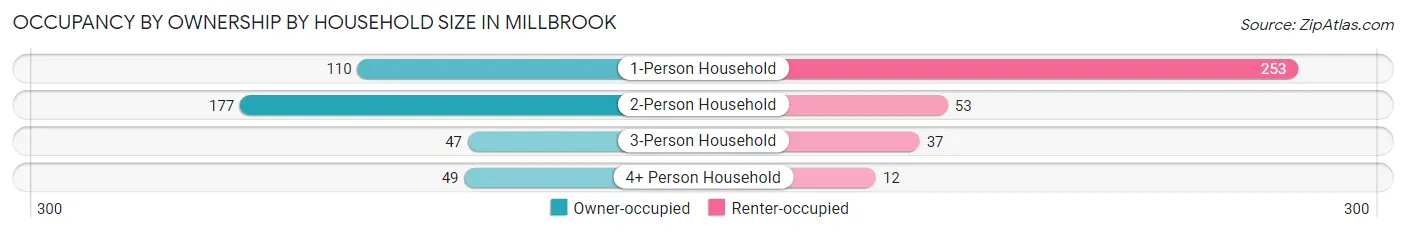
| Household Size | Owner-occupied | Renter-occupied |
| 1-Person Household | 110 (30.3%) | 253 (69.7%) |
| 2-Person Household | 177 (77.0%) | 53 (23.0%) |
| 3-Person Household | 47 (55.9%) | 37 (44.1%) |
| 4+ Person Household | 49 (80.3%) | 12 (19.7%) |
| Total Housing Units | 383 (51.9%) | 355 (48.1%) |
Occupancy by Educational Attainment in Millbrook
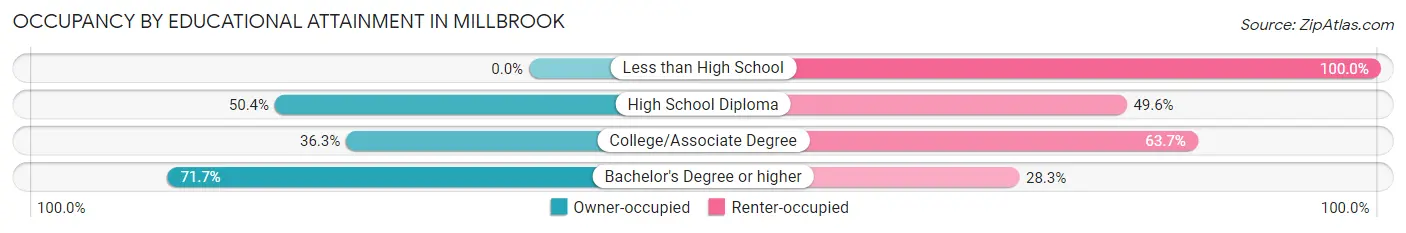
| Household Size | Owner-occupied | Renter-occupied |
| Less than High School | 0 (0.0%) | 19 (100.0%) |
| High School Diploma | 66 (50.4%) | 65 (49.6%) |
| College/Associate Degree | 107 (36.3%) | 188 (63.7%) |
| Bachelor's Degree or higher | 210 (71.7%) | 83 (28.3%) |
Occupancy by Age of Householder in Millbrook
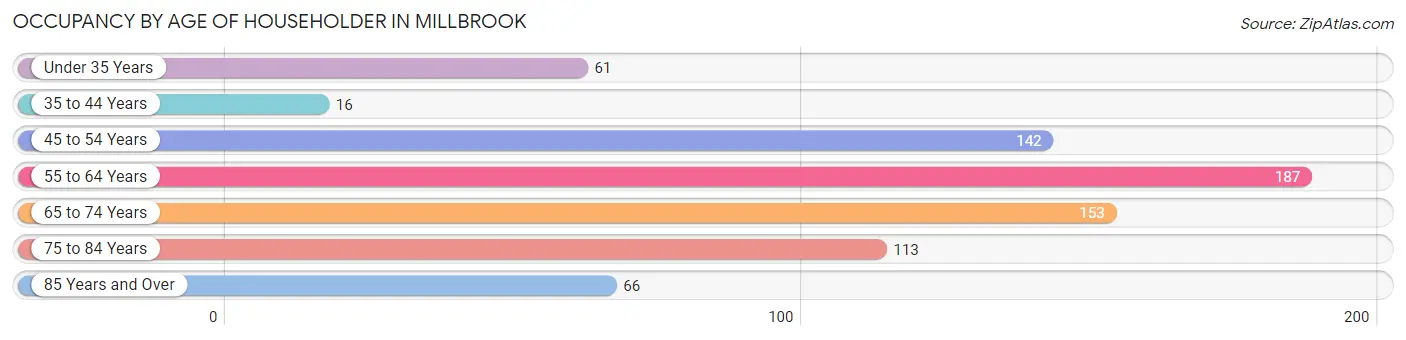
| Age Bracket | # Households | % Households |
| Under 35 Years | 61 | 8.3% |
| 35 to 44 Years | 16 | 2.2% |
| 45 to 54 Years | 142 | 19.2% |
| 55 to 64 Years | 187 | 25.3% |
| 65 to 74 Years | 153 | 20.7% |
| 75 to 84 Years | 113 | 15.3% |
| 85 Years and Over | 66 | 8.9% |
| Total | 738 | 100.0% |
Housing Finances in Millbrook
Median Income by Occupancy in Millbrook
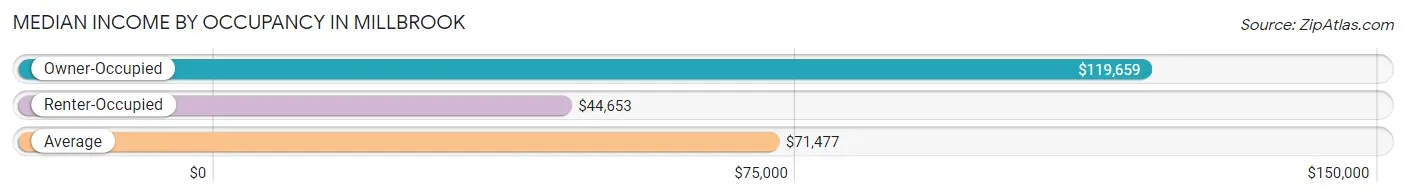
| Occupancy Type | # Households | Median Income |
| Owner-Occupied | 383 (51.9%) | $119,659 |
| Renter-Occupied | 355 (48.1%) | $44,653 |
| Average | 738 (100.0%) | $71,477 |
Occupancy by Householder Income Bracket in Millbrook
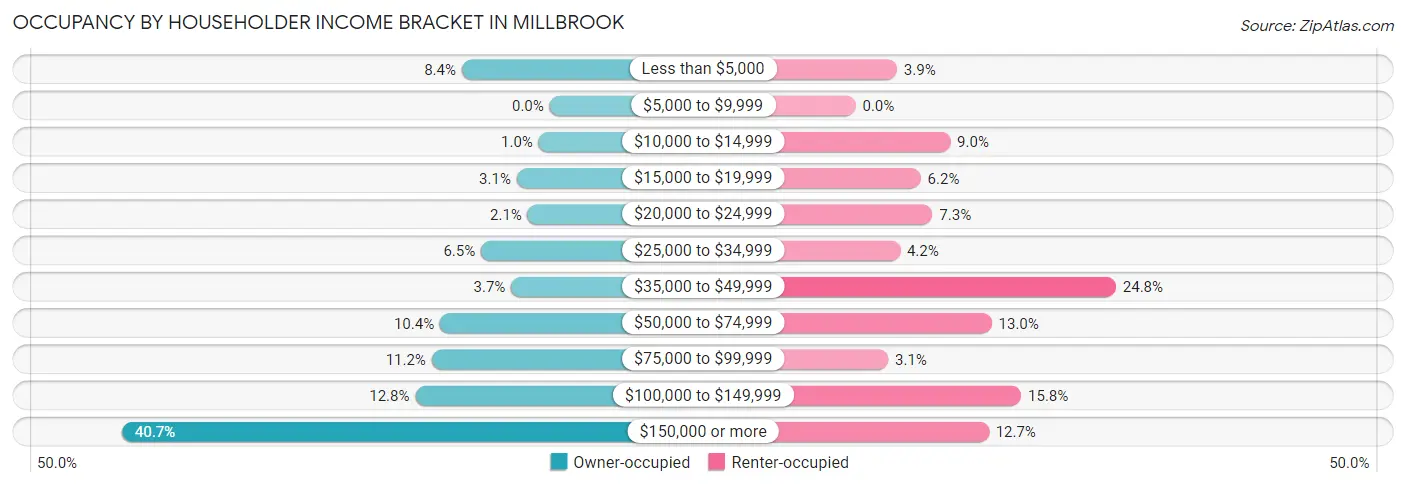
| Income Bracket | Owner-occupied | Renter-occupied |
| Less than $5,000 | 32 (8.4%) | 14 (3.9%) |
| $5,000 to $9,999 | 0 (0.0%) | 0 (0.0%) |
| $10,000 to $14,999 | 4 (1.0%) | 32 (9.0%) |
| $15,000 to $19,999 | 12 (3.1%) | 22 (6.2%) |
| $20,000 to $24,999 | 8 (2.1%) | 26 (7.3%) |
| $25,000 to $34,999 | 25 (6.5%) | 15 (4.2%) |
| $35,000 to $49,999 | 14 (3.7%) | 88 (24.8%) |
| $50,000 to $74,999 | 40 (10.4%) | 46 (13.0%) |
| $75,000 to $99,999 | 43 (11.2%) | 11 (3.1%) |
| $100,000 to $149,999 | 49 (12.8%) | 56 (15.8%) |
| $150,000 or more | 156 (40.7%) | 45 (12.7%) |
| Total | 383 (100.0%) | 355 (100.0%) |
Monthly Housing Cost Tiers in Millbrook
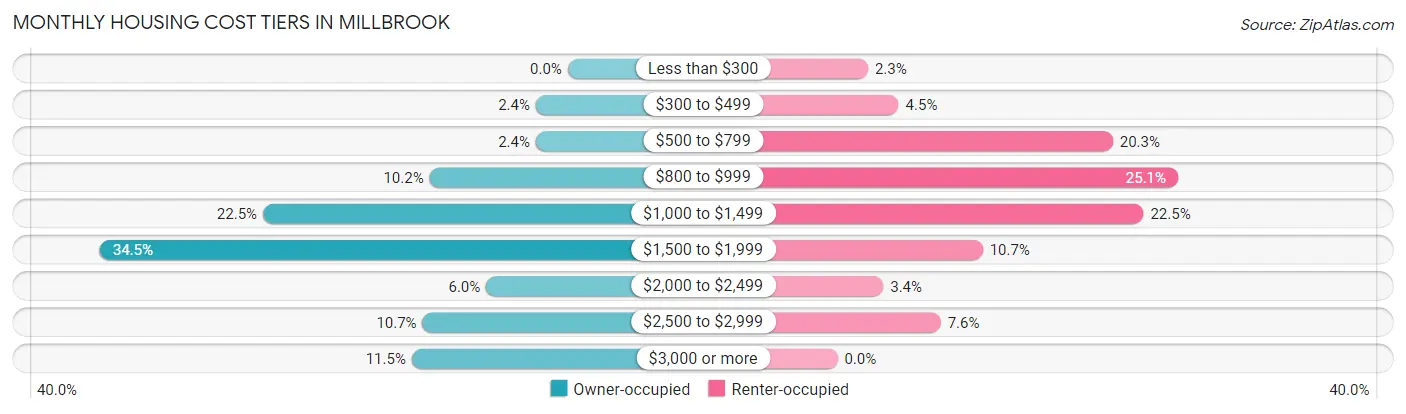
| Monthly Cost | Owner-occupied | Renter-occupied |
| Less than $300 | 0 (0.0%) | 8 (2.2%) |
| $300 to $499 | 9 (2.4%) | 16 (4.5%) |
| $500 to $799 | 9 (2.4%) | 72 (20.3%) |
| $800 to $999 | 39 (10.2%) | 89 (25.1%) |
| $1,000 to $1,499 | 86 (22.5%) | 80 (22.5%) |
| $1,500 to $1,999 | 132 (34.5%) | 38 (10.7%) |
| $2,000 to $2,499 | 23 (6.0%) | 12 (3.4%) |
| $2,500 to $2,999 | 41 (10.7%) | 27 (7.6%) |
| $3,000 or more | 44 (11.5%) | 0 (0.0%) |
| Total | 383 (100.0%) | 355 (100.0%) |
Physical Housing Characteristics in Millbrook
Housing Structures in Millbrook
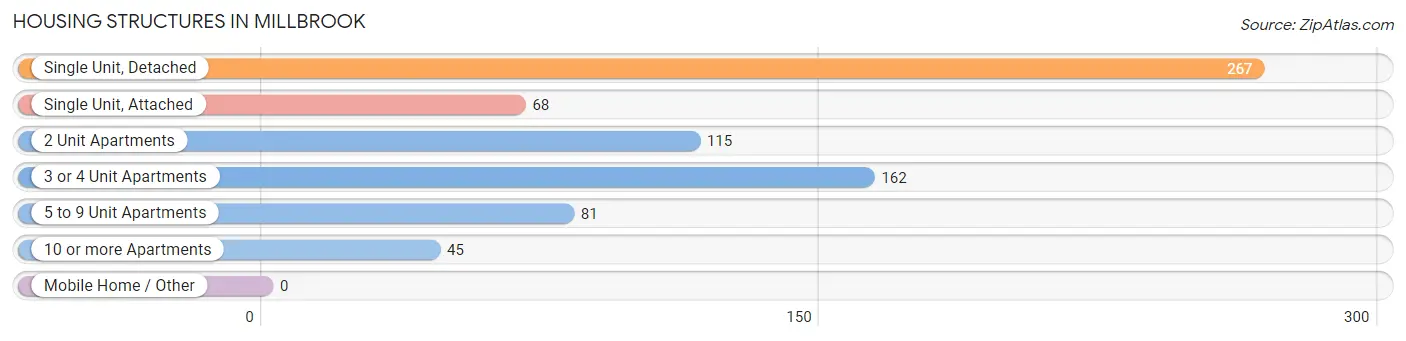
| Structure Type | # Housing Units | % Housing Units |
| Single Unit, Detached | 267 | 36.2% |
| Single Unit, Attached | 68 | 9.2% |
| 2 Unit Apartments | 115 | 15.6% |
| 3 or 4 Unit Apartments | 162 | 22.0% |
| 5 to 9 Unit Apartments | 81 | 11.0% |
| 10 or more Apartments | 45 | 6.1% |
| Mobile Home / Other | 0 | 0.0% |
| Total | 738 | 100.0% |
Housing Structures by Occupancy in Millbrook
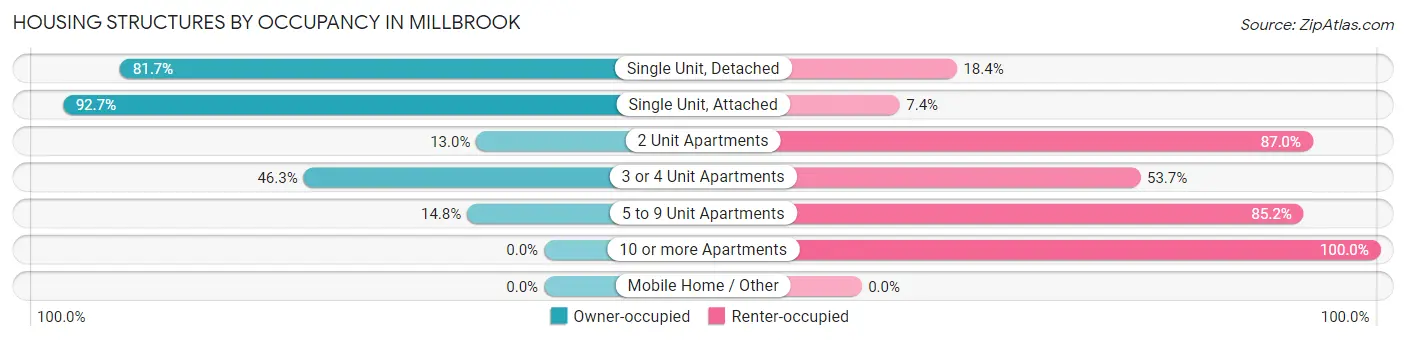
| Structure Type | Owner-occupied | Renter-occupied |
| Single Unit, Detached | 218 (81.7%) | 49 (18.3%) |
| Single Unit, Attached | 63 (92.6%) | 5 (7.3%) |
| 2 Unit Apartments | 15 (13.0%) | 100 (87.0%) |
| 3 or 4 Unit Apartments | 75 (46.3%) | 87 (53.7%) |
| 5 to 9 Unit Apartments | 12 (14.8%) | 69 (85.2%) |
| 10 or more Apartments | 0 (0.0%) | 45 (100.0%) |
| Mobile Home / Other | 0 (0.0%) | 0 (0.0%) |
| Total | 383 (51.9%) | 355 (48.1%) |
Housing Structures by Number of Rooms in Millbrook
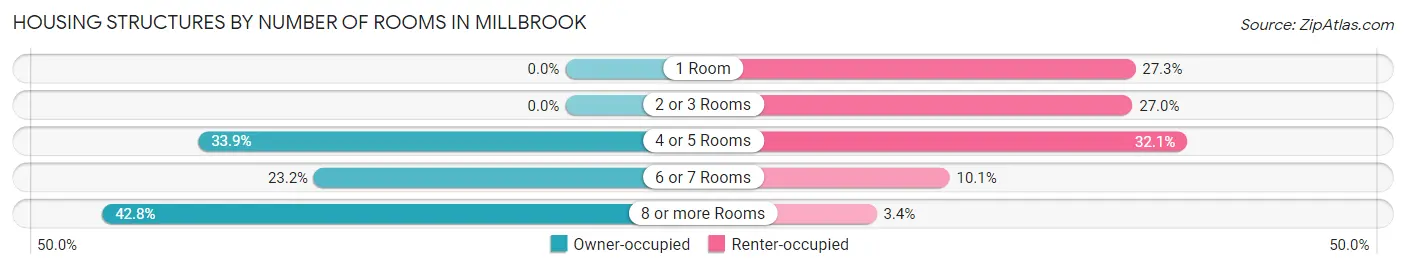
| Number of Rooms | Owner-occupied | Renter-occupied |
| 1 Room | 0 (0.0%) | 97 (27.3%) |
| 2 or 3 Rooms | 0 (0.0%) | 96 (27.0%) |
| 4 or 5 Rooms | 130 (33.9%) | 114 (32.1%) |
| 6 or 7 Rooms | 89 (23.2%) | 36 (10.1%) |
| 8 or more Rooms | 164 (42.8%) | 12 (3.4%) |
| Total | 383 (100.0%) | 355 (100.0%) |
Housing Structure by Heating Type in Millbrook
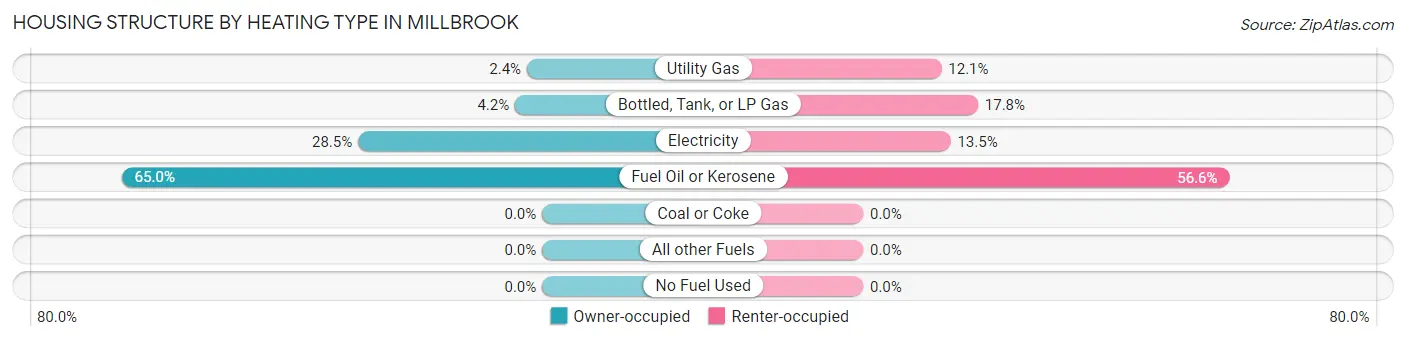
| Heating Type | Owner-occupied | Renter-occupied |
| Utility Gas | 9 (2.4%) | 43 (12.1%) |
| Bottled, Tank, or LP Gas | 16 (4.2%) | 63 (17.7%) |
| Electricity | 109 (28.5%) | 48 (13.5%) |
| Fuel Oil or Kerosene | 249 (65.0%) | 201 (56.6%) |
| Coal or Coke | 0 (0.0%) | 0 (0.0%) |
| All other Fuels | 0 (0.0%) | 0 (0.0%) |
| No Fuel Used | 0 (0.0%) | 0 (0.0%) |
| Total | 383 (100.0%) | 355 (100.0%) |
Household Vehicle Usage in Millbrook
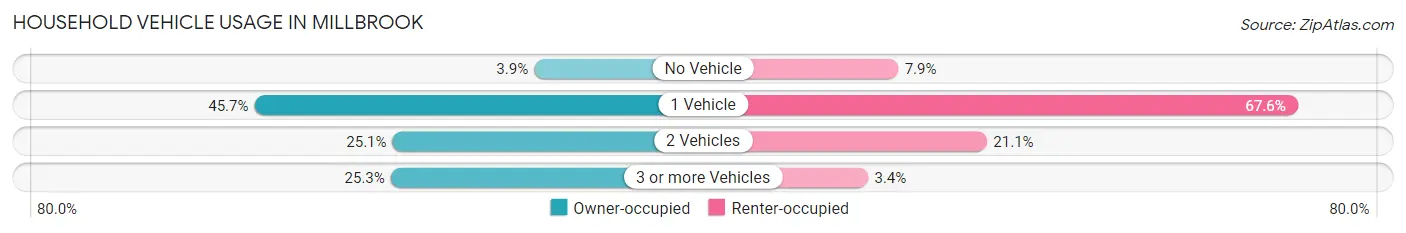
| Vehicles per Household | Owner-occupied | Renter-occupied |
| No Vehicle | 15 (3.9%) | 28 (7.9%) |
| 1 Vehicle | 175 (45.7%) | 240 (67.6%) |
| 2 Vehicles | 96 (25.1%) | 75 (21.1%) |
| 3 or more Vehicles | 97 (25.3%) | 12 (3.4%) |
| Total | 383 (100.0%) | 355 (100.0%) |
Real Estate & Mortgages in Millbrook
Real Estate and Mortgage Overview in Millbrook
| Characteristic | Without Mortgage | With Mortgage |
| Housing Units | 197 | 186 |
| Median Property Value | $376,900 | $337,500 |
| Median Household Income | $89,750 | $84 |
| Monthly Housing Costs | $1,174 | $44 |
| Real Estate Taxes | $6,230 | $0 |
Property Value by Mortgage Status in Millbrook
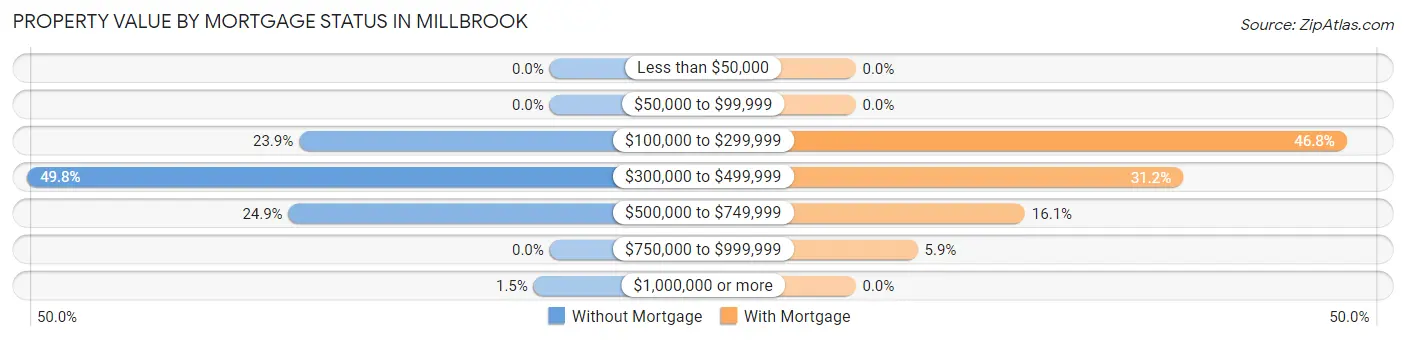
| Property Value | Without Mortgage | With Mortgage |
| Less than $50,000 | 0 (0.0%) | 0 (0.0%) |
| $50,000 to $99,999 | 0 (0.0%) | 0 (0.0%) |
| $100,000 to $299,999 | 47 (23.9%) | 87 (46.8%) |
| $300,000 to $499,999 | 98 (49.7%) | 58 (31.2%) |
| $500,000 to $749,999 | 49 (24.9%) | 30 (16.1%) |
| $750,000 to $999,999 | 0 (0.0%) | 11 (5.9%) |
| $1,000,000 or more | 3 (1.5%) | 0 (0.0%) |
| Total | 197 (100.0%) | 186 (100.0%) |
Household Income by Mortgage Status in Millbrook
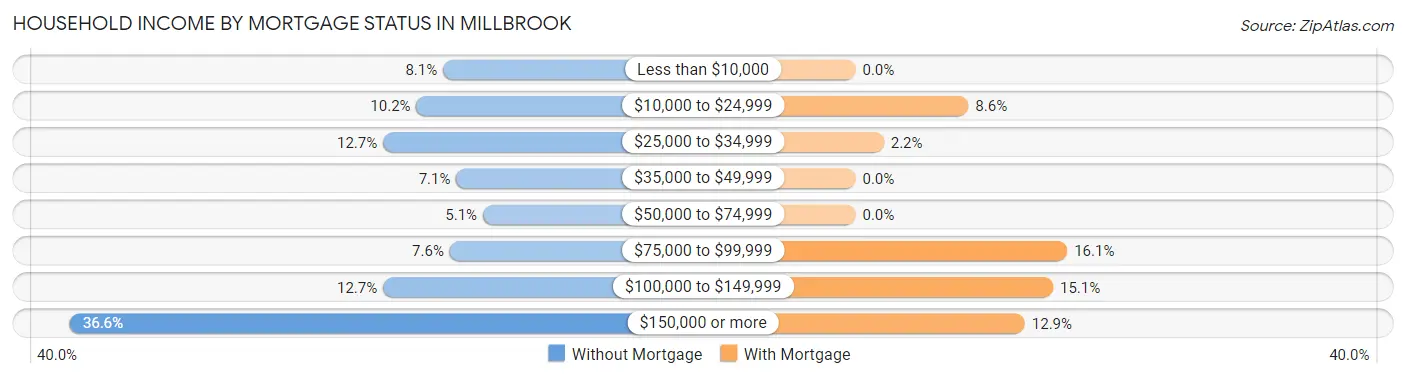
| Household Income | Without Mortgage | With Mortgage |
| Less than $10,000 | 16 (8.1%) | 0 (0.0%) |
| $10,000 to $24,999 | 20 (10.2%) | 16 (8.6%) |
| $25,000 to $34,999 | 25 (12.7%) | 4 (2.1%) |
| $35,000 to $49,999 | 14 (7.1%) | 0 (0.0%) |
| $50,000 to $74,999 | 10 (5.1%) | 0 (0.0%) |
| $75,000 to $99,999 | 15 (7.6%) | 30 (16.1%) |
| $100,000 to $149,999 | 25 (12.7%) | 28 (15.0%) |
| $150,000 or more | 72 (36.5%) | 24 (12.9%) |
| Total | 197 (100.0%) | 186 (100.0%) |
Property Value to Household Income Ratio in Millbrook
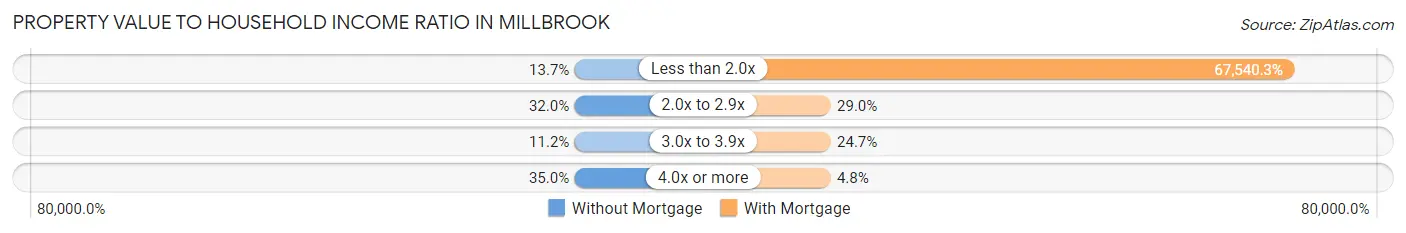
| Value-to-Income Ratio | Without Mortgage | With Mortgage |
| Less than 2.0x | 27 (13.7%) | 125,625 (67,540.3%) |
| 2.0x to 2.9x | 63 (32.0%) | 54 (29.0%) |
| 3.0x to 3.9x | 22 (11.2%) | 46 (24.7%) |
| 4.0x or more | 69 (35.0%) | 9 (4.8%) |
| Total | 197 (100.0%) | 186 (100.0%) |
Real Estate Taxes by Mortgage Status in Millbrook
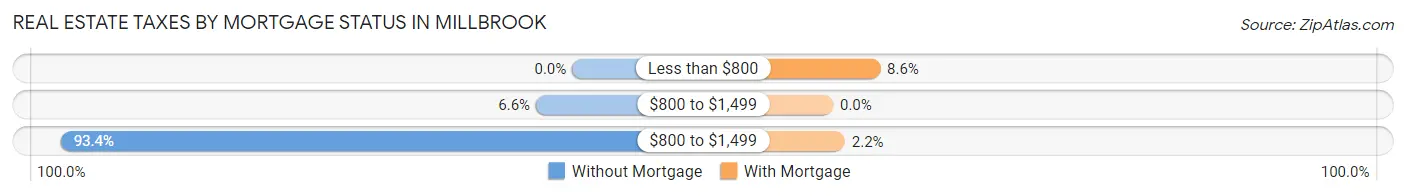
| Property Taxes | Without Mortgage | With Mortgage |
| Less than $800 | 0 (0.0%) | 16 (8.6%) |
| $800 to $1,499 | 13 (6.6%) | 0 (0.0%) |
| $800 to $1,499 | 184 (93.4%) | 4 (2.1%) |
| Total | 197 (100.0%) | 186 (100.0%) |
Health & Disability in Millbrook
Health Insurance Coverage by Age in Millbrook
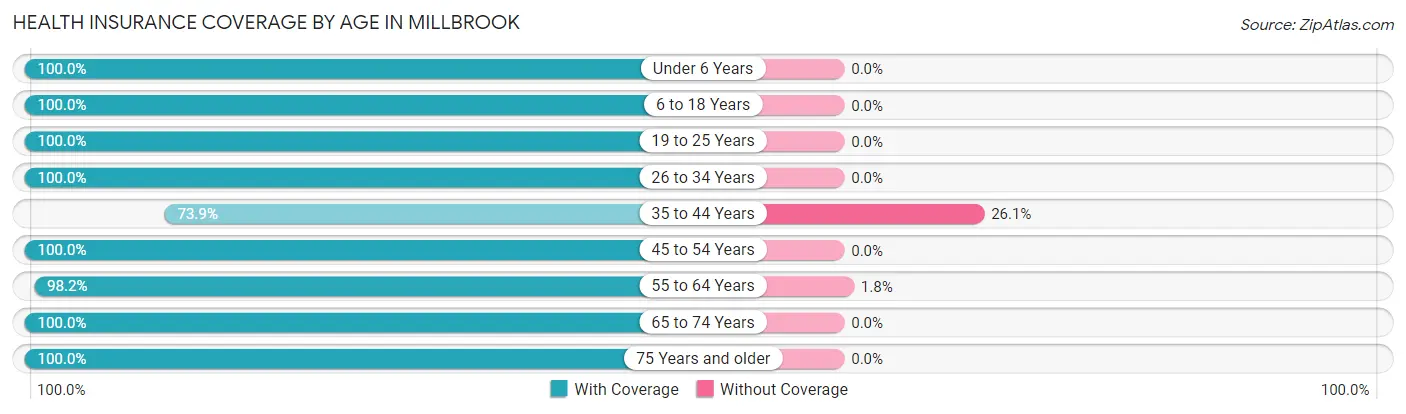
| Age Bracket | With Coverage | Without Coverage |
| Under 6 Years | 70 (100.0%) | 0 (0.0%) |
| 6 to 18 Years | 98 (100.0%) | 0 (0.0%) |
| 19 to 25 Years | 58 (100.0%) | 0 (0.0%) |
| 26 to 34 Years | 145 (100.0%) | 0 (0.0%) |
| 35 to 44 Years | 34 (73.9%) | 12 (26.1%) |
| 45 to 54 Years | 196 (100.0%) | 0 (0.0%) |
| 55 to 64 Years | 274 (98.2%) | 5 (1.8%) |
| 65 to 74 Years | 190 (100.0%) | 0 (0.0%) |
| 75 Years and older | 300 (100.0%) | 0 (0.0%) |
| Total | 1,365 (98.8%) | 17 (1.2%) |
Health Insurance Coverage by Citizenship Status in Millbrook
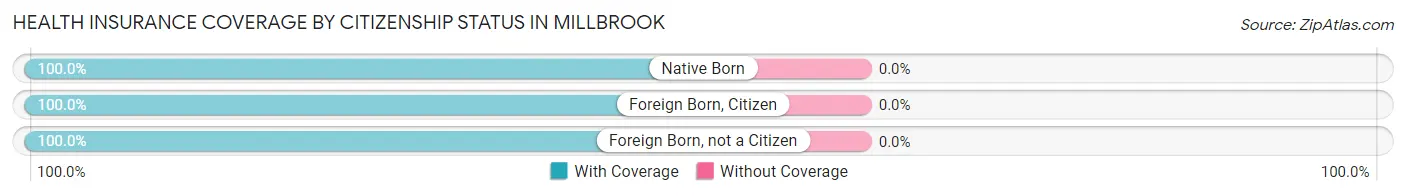
| Citizenship Status | With Coverage | Without Coverage |
| Native Born | 70 (100.0%) | 0 (0.0%) |
| Foreign Born, Citizen | 98 (100.0%) | 0 (0.0%) |
| Foreign Born, not a Citizen | 58 (100.0%) | 0 (0.0%) |
Health Insurance Coverage by Household Income in Millbrook
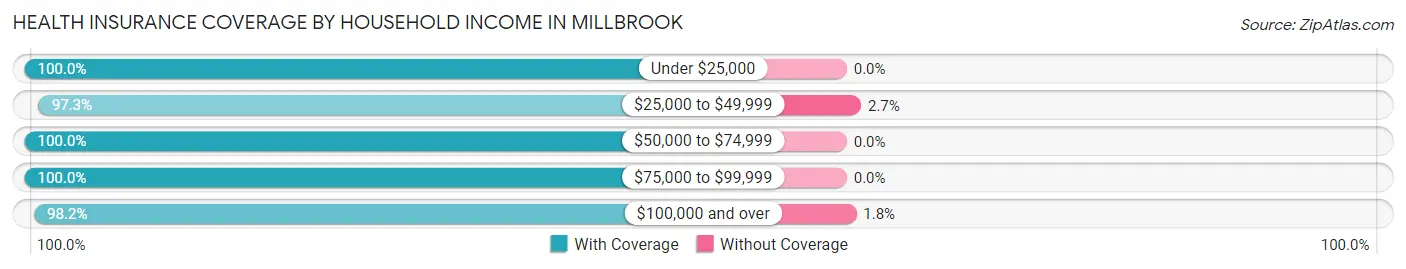
| Household Income | With Coverage | Without Coverage |
| Under $25,000 | 189 (100.0%) | 0 (0.0%) |
| $25,000 to $49,999 | 182 (97.3%) | 5 (2.7%) |
| $50,000 to $74,999 | 157 (100.0%) | 0 (0.0%) |
| $75,000 to $99,999 | 163 (100.0%) | 0 (0.0%) |
| $100,000 and over | 657 (98.2%) | 12 (1.8%) |
Public vs Private Health Insurance Coverage by Age in Millbrook
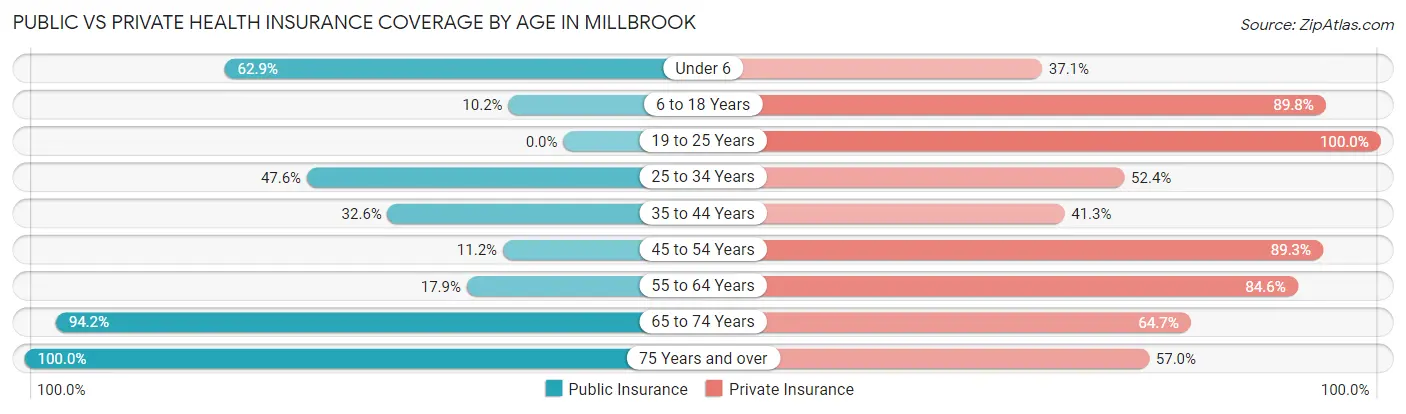
| Age Bracket | Public Insurance | Private Insurance |
| Under 6 | 44 (62.9%) | 26 (37.1%) |
| 6 to 18 Years | 10 (10.2%) | 88 (89.8%) |
| 19 to 25 Years | 0 (0.0%) | 58 (100.0%) |
| 25 to 34 Years | 69 (47.6%) | 76 (52.4%) |
| 35 to 44 Years | 15 (32.6%) | 19 (41.3%) |
| 45 to 54 Years | 22 (11.2%) | 175 (89.3%) |
| 55 to 64 Years | 50 (17.9%) | 236 (84.6%) |
| 65 to 74 Years | 179 (94.2%) | 123 (64.7%) |
| 75 Years and over | 300 (100.0%) | 171 (57.0%) |
| Total | 689 (49.9%) | 972 (70.3%) |
Disability Status by Sex by Age in Millbrook
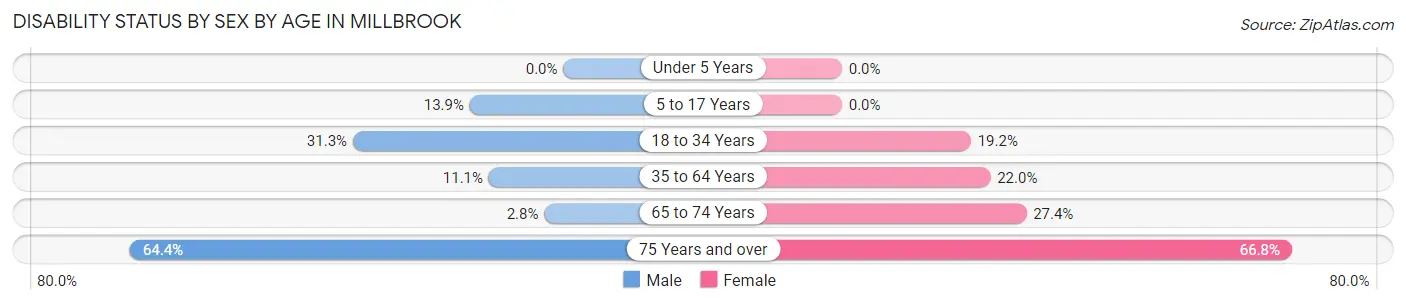
| Age Bracket | Male | Female |
| Under 5 Years | 0 (0.0%) | 0 (0.0%) |
| 5 to 17 Years | 10 (13.9%) | 0 (0.0%) |
| 18 to 34 Years | 40 (31.2%) | 18 (19.2%) |
| 35 to 64 Years | 24 (11.1%) | 67 (22.0%) |
| 65 to 74 Years | 3 (2.8%) | 23 (27.4%) |
| 75 Years and over | 65 (64.4%) | 133 (66.8%) |
Disability Class by Sex by Age in Millbrook
Disability Class: Hearing Difficulty
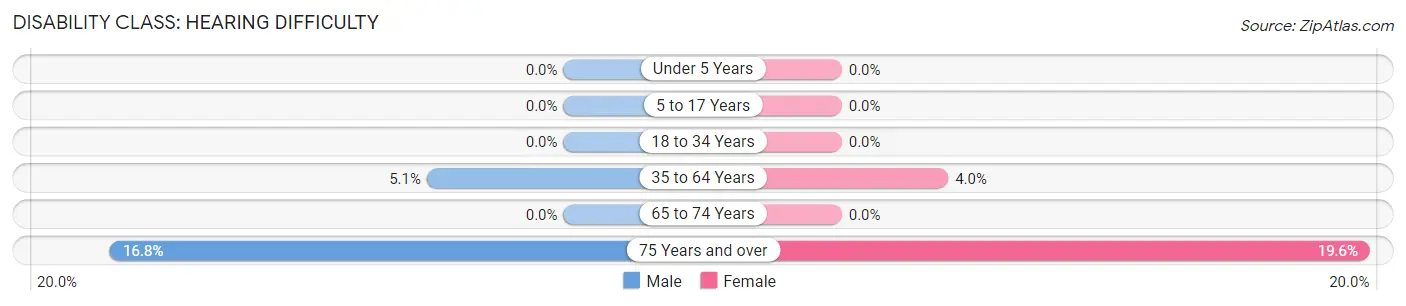
| Age Bracket | Male | Female |
| Under 5 Years | 0 (0.0%) | 0 (0.0%) |
| 5 to 17 Years | 0 (0.0%) | 0 (0.0%) |
| 18 to 34 Years | 0 (0.0%) | 0 (0.0%) |
| 35 to 64 Years | 11 (5.1%) | 12 (4.0%) |
| 65 to 74 Years | 0 (0.0%) | 0 (0.0%) |
| 75 Years and over | 17 (16.8%) | 39 (19.6%) |
Disability Class: Vision Difficulty
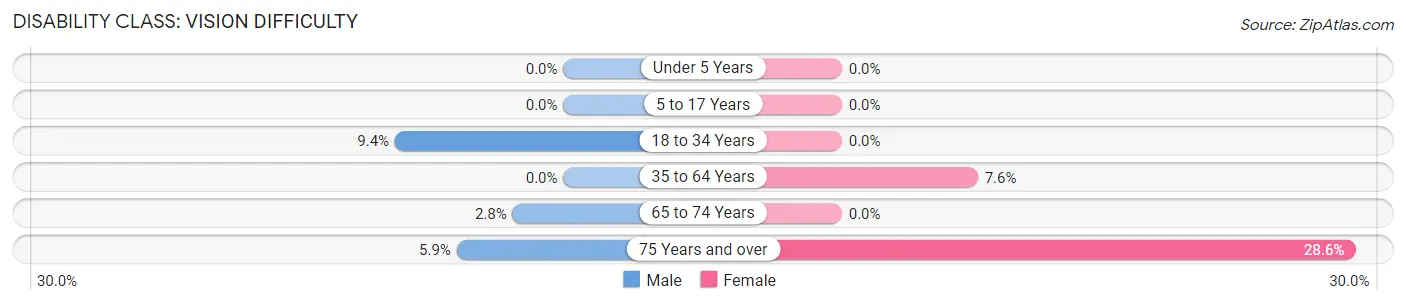
| Age Bracket | Male | Female |
| Under 5 Years | 0 (0.0%) | 0 (0.0%) |
| 5 to 17 Years | 0 (0.0%) | 0 (0.0%) |
| 18 to 34 Years | 12 (9.4%) | 0 (0.0%) |
| 35 to 64 Years | 0 (0.0%) | 23 (7.6%) |
| 65 to 74 Years | 3 (2.8%) | 0 (0.0%) |
| 75 Years and over | 6 (5.9%) | 57 (28.6%) |
Disability Class: Cognitive Difficulty
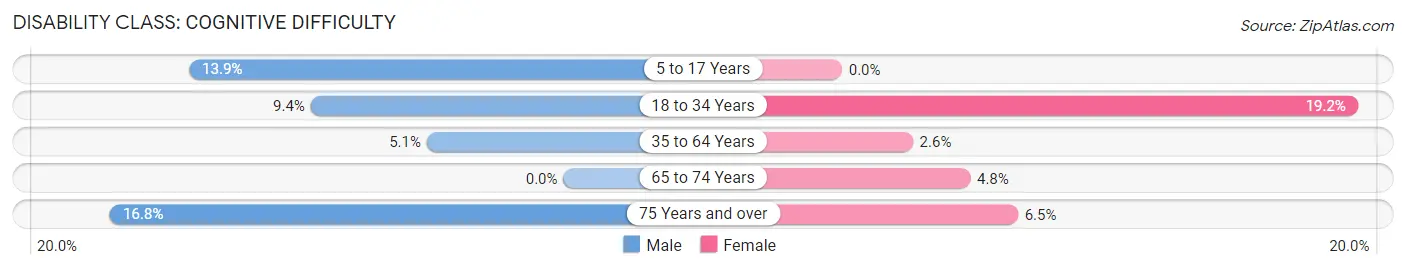
| Age Bracket | Male | Female |
| 5 to 17 Years | 10 (13.9%) | 0 (0.0%) |
| 18 to 34 Years | 12 (9.4%) | 18 (19.2%) |
| 35 to 64 Years | 11 (5.1%) | 8 (2.6%) |
| 65 to 74 Years | 0 (0.0%) | 4 (4.8%) |
| 75 Years and over | 17 (16.8%) | 13 (6.5%) |
Disability Class: Ambulatory Difficulty
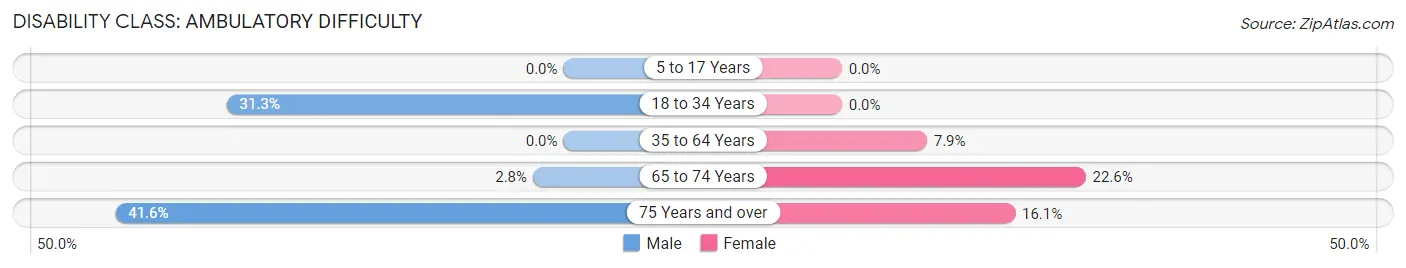
| Age Bracket | Male | Female |
| 5 to 17 Years | 0 (0.0%) | 0 (0.0%) |
| 18 to 34 Years | 40 (31.2%) | 0 (0.0%) |
| 35 to 64 Years | 0 (0.0%) | 24 (7.9%) |
| 65 to 74 Years | 3 (2.8%) | 19 (22.6%) |
| 75 Years and over | 42 (41.6%) | 32 (16.1%) |
Disability Class: Self-Care Difficulty
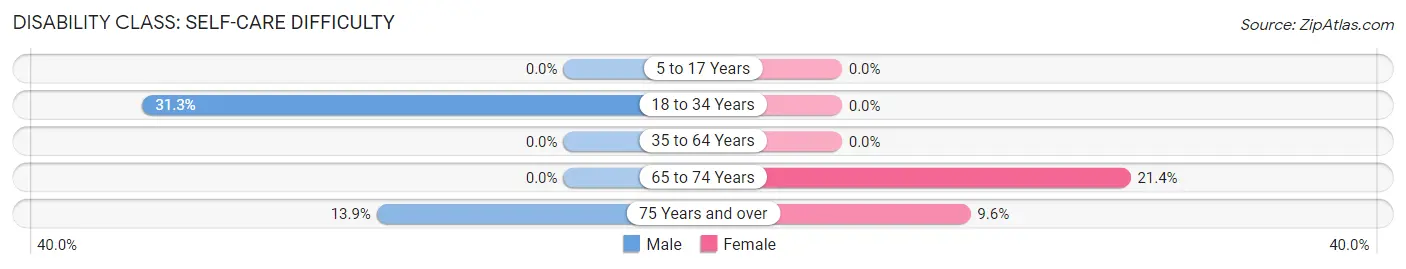
| Age Bracket | Male | Female |
| 5 to 17 Years | 0 (0.0%) | 0 (0.0%) |
| 18 to 34 Years | 40 (31.2%) | 0 (0.0%) |
| 35 to 64 Years | 0 (0.0%) | 0 (0.0%) |
| 65 to 74 Years | 0 (0.0%) | 18 (21.4%) |
| 75 Years and over | 14 (13.9%) | 19 (9.6%) |
Technology Access in Millbrook
Computing Device Access in Millbrook
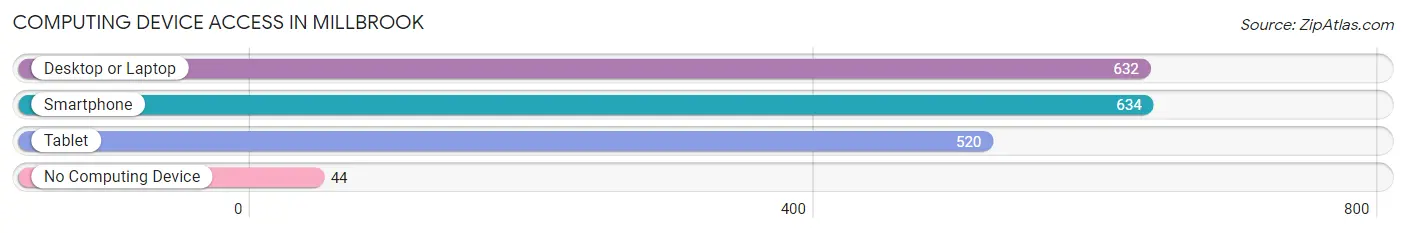
| Device Type | # Households | % Households |
| Desktop or Laptop | 632 | 85.6% |
| Smartphone | 634 | 85.9% |
| Tablet | 520 | 70.5% |
| No Computing Device | 44 | 6.0% |
| Total | 738 | 100.0% |
Internet Access in Millbrook
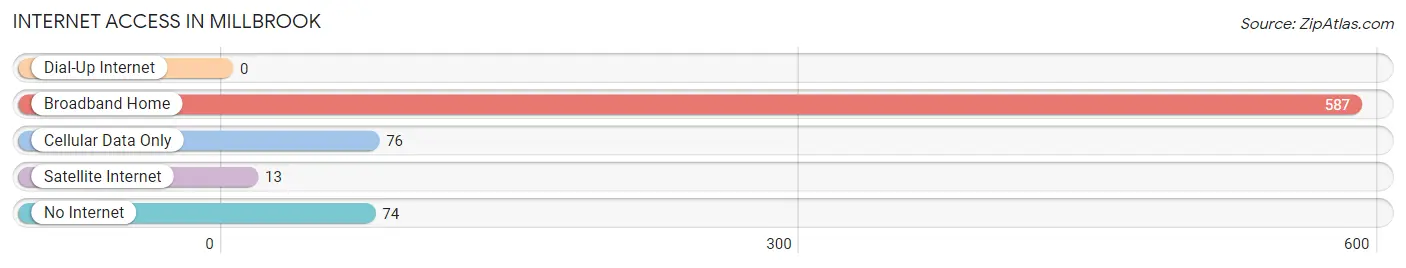
| Internet Type | # Households | % Households |
| Dial-Up Internet | 0 | 0.0% |
| Broadband Home | 587 | 79.5% |
| Cellular Data Only | 76 | 10.3% |
| Satellite Internet | 13 | 1.8% |
| No Internet | 74 | 10.0% |
| Total | 738 | 100.0% |
Millbrook Summary
Millbrook, NY is a small village located in Dutchess County, New York. It is situated in the Hudson Valley region of the state, approximately 90 miles north of New York City. The village is bordered by the towns of Washington, Union Vale, and LaGrange. Millbrook is a rural community with a population of 1,406 as of the 2010 census.
History
Millbrook was first settled in 1760 by a group of Dutch settlers. The village was originally known as “Mill Brook”, named after the nearby stream. The village was incorporated in 1866 and was officially named Millbrook.
In the late 19th century, Millbrook became a popular summer destination for wealthy New Yorkers. The village was home to several large estates, including the estate of William A. Rockefeller, brother of John D. Rockefeller. The village was also home to the Millbrook Hunt, a fox hunting club founded in 1881.
Geography
Millbrook is located in the Hudson Valley region of New York. The village is situated in the foothills of the Taconic Mountains, approximately 90 miles north of New York City. The village is bordered by the towns of Washington, Union Vale, and LaGrange.
The village is located on the banks of the Wappinger Creek, a tributary of the Hudson River. The terrain is mostly hilly, with elevations ranging from 500 to 1,000 feet above sea level. The climate is humid continental, with cold winters and hot, humid summers.
Economy
Millbrook’s economy is largely based on tourism and agriculture. The village is home to several wineries, including Millbrook Vineyards and Winery and Millbrook Winery. The village is also home to several farms, including the Millbrook Farm and the Millbrook Dairy Farm.
The village is home to several small businesses, including restaurants, shops, and galleries. The village is also home to several bed and breakfasts, as well as a few small hotels.
Demographics
As of the 2010 census, the population of Millbrook was 1,406. The racial makeup of the village was 94.3% White, 2.2% African American, 0.3% Native American, 0.7% Asian, 0.1% Pacific Islander, 0.9% from other races, and 1.5% from two or more races. Hispanic or Latino of any race were 3.2% of the population.
The median household income in Millbrook was $63,125, and the median family income was $76,250. The per capita income for the village was $35,945. About 4.3% of families and 6.2% of the population were below the poverty line, including 8.3% of those under age 18 and 4.2% of those age 65 or over.
Common Questions
What is the Total Population of Millbrook?
Total Population of Millbrook is 1,382.
What is the Total Male Population of Millbrook?
Total Male Population of Millbrook is 656.
What is the Total Female Population of Millbrook?
Total Female Population of Millbrook is 726.
What is the Ratio of Males per 100 Females in Millbrook?
There are 90.36 Males per 100 Females in Millbrook.
What is the Ratio of Females per 100 Males in Millbrook?
There are 110.67 Females per 100 Males in Millbrook.
What is the Median Population Age in Millbrook?
Median Population Age in Millbrook is 58.7 Years.
What is the Average Family Size in Millbrook
Average Family Size in Millbrook is 2.6 People.
What is the Average Household Size in Millbrook
Average Household Size in Millbrook is 1.9 People.
What is Per Capita Income in Millbrook?
Per Capita income in Millbrook is $56,525.
What is the Median Family Income in Millbrook?
Median Family Income in Millbrook is $147,750.
What is the Median Household income in Millbrook?
Median Household Income in Millbrook is $71,477.
What is Income or Wage Gap in Millbrook?
Income or Wage Gap in Millbrook is 19.2%.
Women in Millbrook earn 80.8 cents for every dollar earned by a man.
What is Inequality or Gini Index in Millbrook?
Inequality or Gini Index in Millbrook is 0.49.
How Large is the Labor Force in Millbrook?
There are 670 People in the Labor Forcein in Millbrook.
What is the Percentage of People in the Labor Force in Millbrook?
52.8% of People are in the Labor Force in Millbrook.