Liverpool, NY
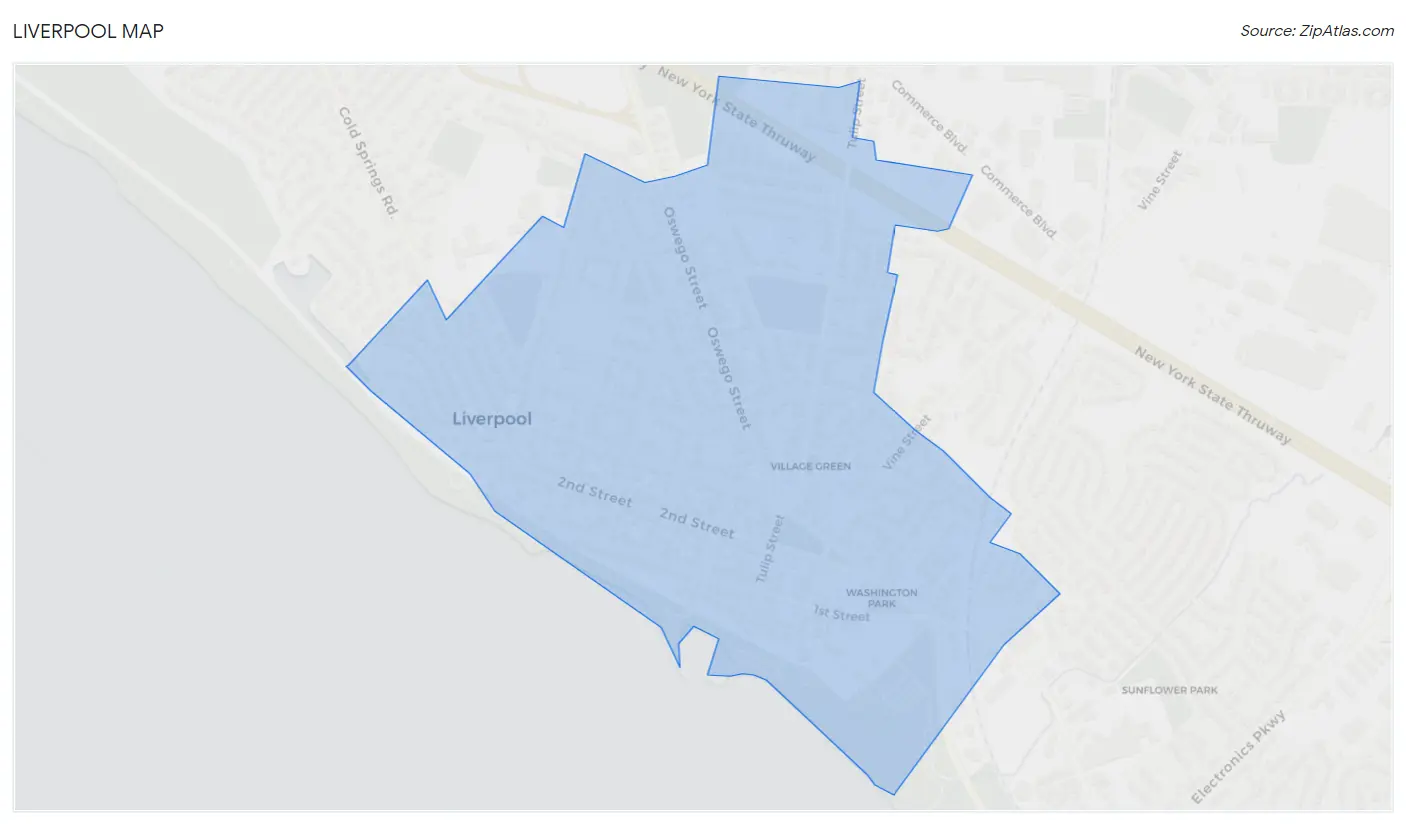
Liverpool Map
Liverpool Overview
2,331
TOTAL POPULATION
1,156
MALE POPULATION
1,175
FEMALE POPULATION
98.38
MALES / 100 FEMALES
101.64
FEMALES / 100 MALES
44.2
MEDIAN AGE
2.7
AVG FAMILY SIZE
2.0
AVG HOUSEHOLD SIZE
$43,730
PER CAPITA INCOME
$79,758
AVG FAMILY INCOME
$70,556
AVG HOUSEHOLD INCOME
15.6%
WAGE / INCOME GAP [ % ]
84.4¢/ $1
WAGE / INCOME GAP [ $ ]
0.47
INEQUALITY / GINI INDEX
1,157
LABOR FORCE [ PEOPLE ]
59.1%
PERCENT IN LABOR FORCE
2.9%
UNEMPLOYMENT RATE
Liverpool Area Codes
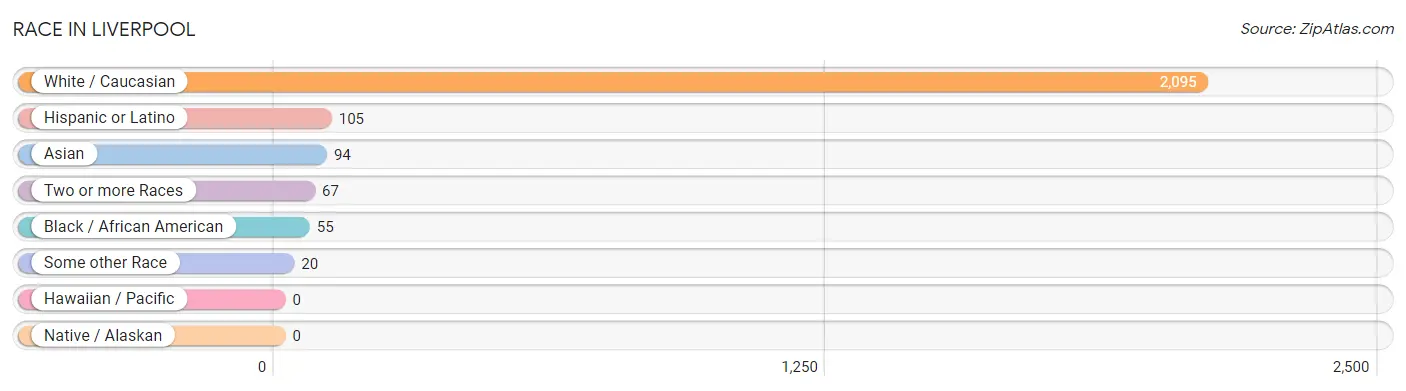
Race in Liverpool
The most populous races in Liverpool are White / Caucasian (2,095 | 89.9%), Hispanic or Latino (105 | 4.5%), and Asian (94 | 4.0%).
| Race | # Population | % Population |
| Asian | 94 | 4.0% |
| Black / African American | 55 | 2.4% |
| Hawaiian / Pacific | 0 | 0.0% |
| Hispanic or Latino | 105 | 4.5% |
| Native / Alaskan | 0 | 0.0% |
| White / Caucasian | 2,095 | 89.9% |
| Two or more Races | 67 | 2.9% |
| Some other Race | 20 | 0.9% |
| Total | 2,331 | 100.0% |
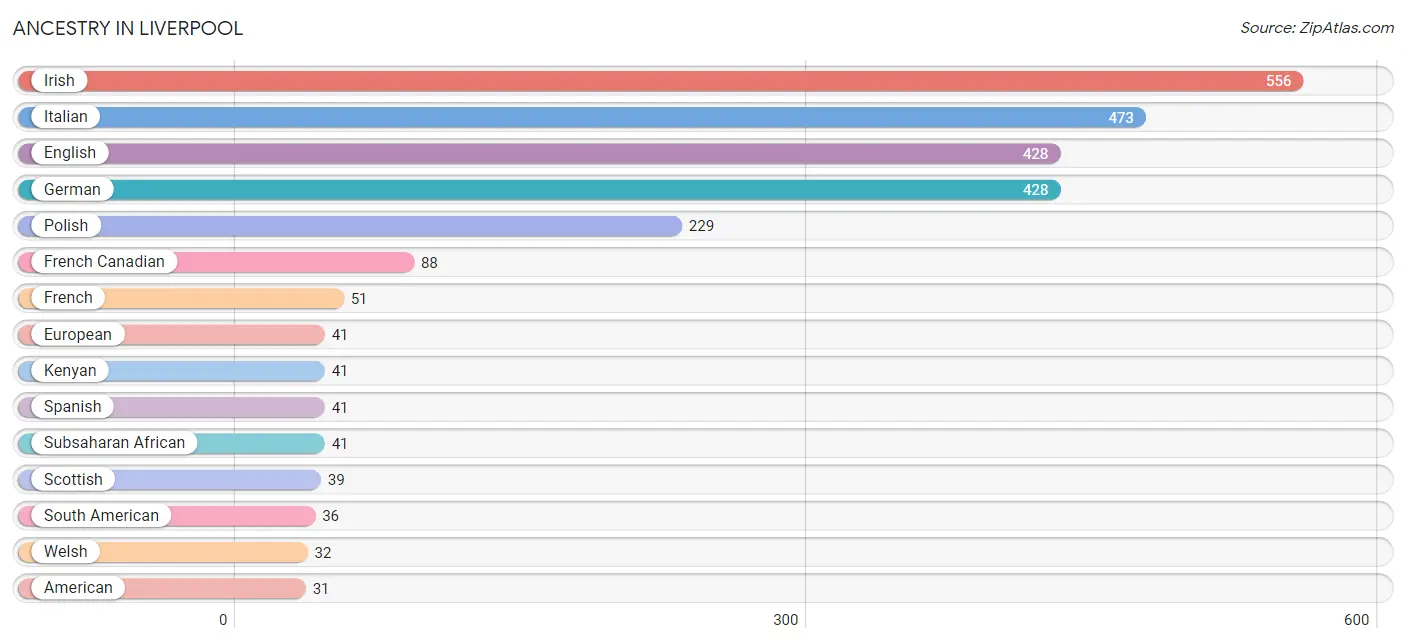
Ancestry in Liverpool
The most populous ancestries reported in Liverpool are Irish (556 | 23.8%), Italian (473 | 20.3%), English (428 | 18.4%), German (428 | 18.4%), and Polish (229 | 9.8%), together accounting for 90.7% of all Liverpool residents.
| Ancestry | # Population | % Population |
| American | 31 | 1.3% |
| Arab | 15 | 0.6% |
| Austrian | 3 | 0.1% |
| Belgian | 7 | 0.3% |
| British | 26 | 1.1% |
| Cuban | 9 | 0.4% |
| Czechoslovakian | 10 | 0.4% |
| Dutch | 22 | 0.9% |
| Ecuadorian | 21 | 0.9% |
| English | 428 | 18.4% |
| Estonian | 6 | 0.3% |
| European | 41 | 1.8% |
| French | 51 | 2.2% |
| French Canadian | 88 | 3.8% |
| German | 428 | 18.4% |
| Greek | 5 | 0.2% |
| Hungarian | 5 | 0.2% |
| Indian (Asian) | 3 | 0.1% |
| Irish | 556 | 23.8% |
| Iroquois | 12 | 0.5% |
| Italian | 473 | 20.3% |
| Kenyan | 41 | 1.8% |
| Korean | 3 | 0.1% |
| Lebanese | 5 | 0.2% |
| Norwegian | 13 | 0.6% |
| Polish | 229 | 9.8% |
| Puerto Rican | 13 | 0.6% |
| Russian | 9 | 0.4% |
| Scotch-Irish | 31 | 1.3% |
| Scottish | 39 | 1.7% |
| Serbian | 4 | 0.2% |
| Slovak | 16 | 0.7% |
| South American | 36 | 1.5% |
| Spanish | 41 | 1.8% |
| Sri Lankan | 12 | 0.5% |
| Subsaharan African | 41 | 1.8% |
| Swedish | 12 | 0.5% |
| Swiss | 13 | 0.6% |
| Ukrainian | 14 | 0.6% |
| Venezuelan | 15 | 0.6% |
| Welsh | 32 | 1.4% | View All 41 Rows |
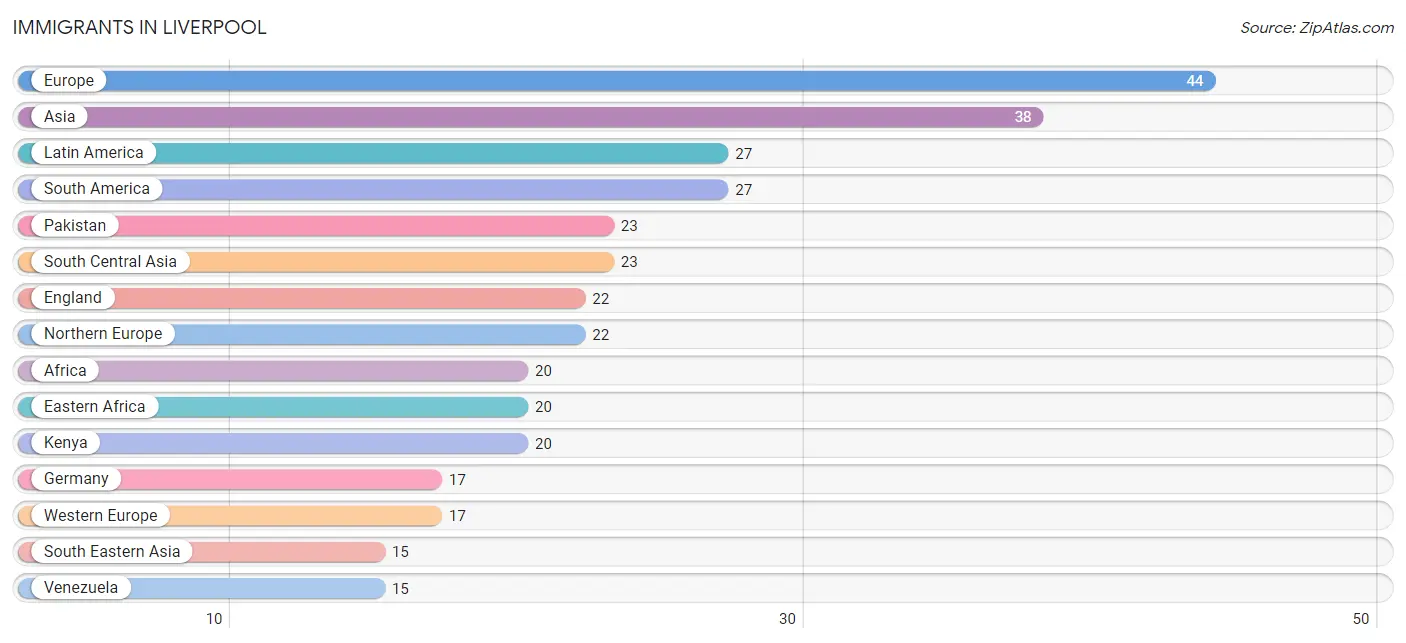
Immigrants in Liverpool
The most numerous immigrant groups reported in Liverpool came from Europe (44 | 1.9%), Asia (38 | 1.6%), Latin America (27 | 1.2%), South America (27 | 1.2%), and Pakistan (23 | 1.0%), together accounting for 6.8% of all Liverpool residents.
| Immigration Origin | # Population | % Population |
| Africa | 20 | 0.9% |
| Asia | 38 | 1.6% |
| Eastern Africa | 20 | 0.9% |
| Ecuador | 12 | 0.5% |
| England | 22 | 0.9% |
| Europe | 44 | 1.9% |
| Germany | 17 | 0.7% |
| Italy | 5 | 0.2% |
| Kenya | 20 | 0.9% |
| Latin America | 27 | 1.2% |
| Northern Europe | 22 | 0.9% |
| Pakistan | 23 | 1.0% |
| Philippines | 3 | 0.1% |
| South America | 27 | 1.2% |
| South Central Asia | 23 | 1.0% |
| South Eastern Asia | 15 | 0.6% |
| Southern Europe | 5 | 0.2% |
| Venezuela | 15 | 0.6% |
| Vietnam | 12 | 0.5% |
| Western Europe | 17 | 0.7% | View All 20 Rows |
Sex and Age in Liverpool
Sex and Age in Liverpool
The most populous age groups in Liverpool are 60 to 64 Years (129 | 11.2%) for men and 65 to 69 Years (111 | 9.5%) for women.
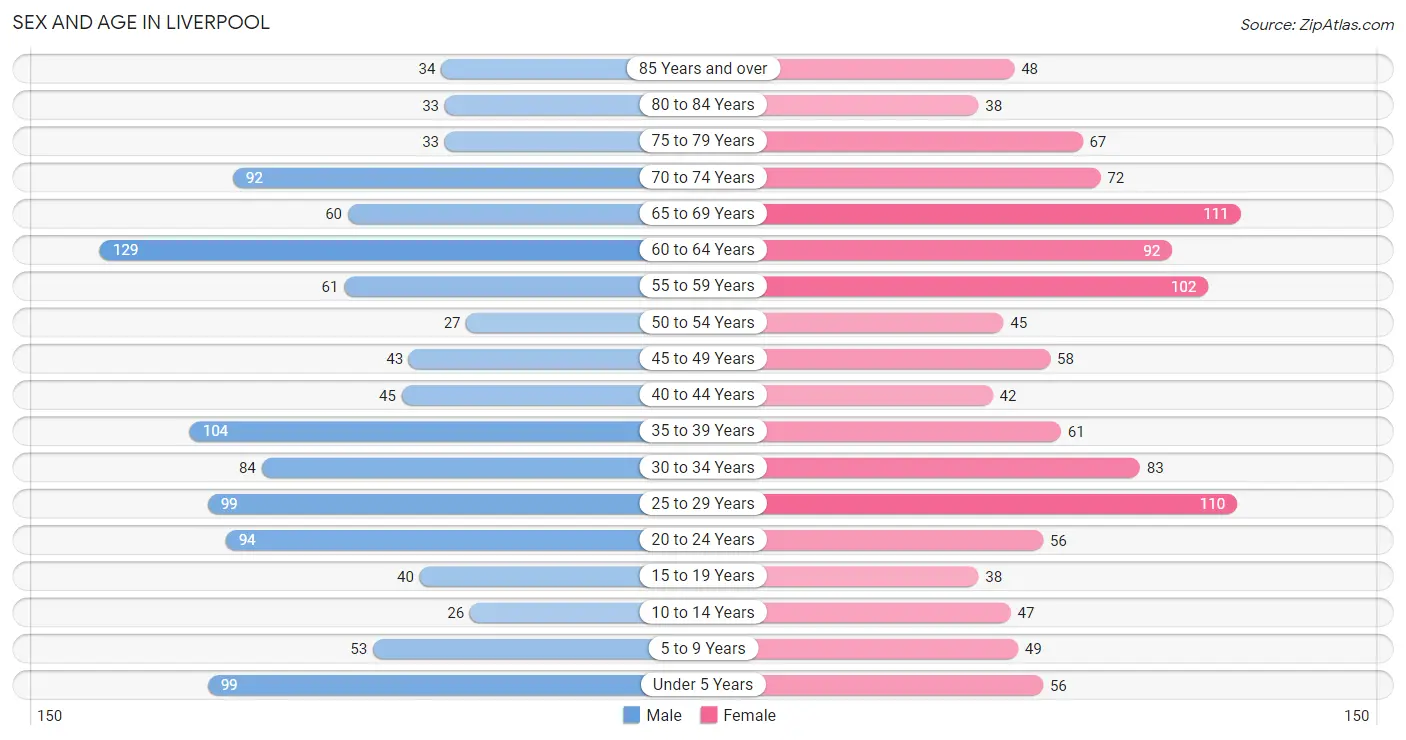
| Age Bracket | Male | Female |
| Under 5 Years | 99 (8.6%) | 56 (4.8%) |
| 5 to 9 Years | 53 (4.6%) | 49 (4.2%) |
| 10 to 14 Years | 26 (2.2%) | 47 (4.0%) |
| 15 to 19 Years | 40 (3.5%) | 38 (3.2%) |
| 20 to 24 Years | 94 (8.1%) | 56 (4.8%) |
| 25 to 29 Years | 99 (8.6%) | 110 (9.4%) |
| 30 to 34 Years | 84 (7.3%) | 83 (7.1%) |
| 35 to 39 Years | 104 (9.0%) | 61 (5.2%) |
| 40 to 44 Years | 45 (3.9%) | 42 (3.6%) |
| 45 to 49 Years | 43 (3.7%) | 58 (4.9%) |
| 50 to 54 Years | 27 (2.3%) | 45 (3.8%) |
| 55 to 59 Years | 61 (5.3%) | 102 (8.7%) |
| 60 to 64 Years | 129 (11.2%) | 92 (7.8%) |
| 65 to 69 Years | 60 (5.2%) | 111 (9.5%) |
| 70 to 74 Years | 92 (8.0%) | 72 (6.1%) |
| 75 to 79 Years | 33 (2.9%) | 67 (5.7%) |
| 80 to 84 Years | 33 (2.9%) | 38 (3.2%) |
| 85 Years and over | 34 (2.9%) | 48 (4.1%) |
| Total | 1,156 (100.0%) | 1,175 (100.0%) |
Families and Households in Liverpool
Median Family Size in Liverpool
The median family size in Liverpool is 2.74 persons per family, with married-couple families (479 | 80.1%) accounting for the largest median family size of 2.81 persons per family. On the other hand, single male/father families (36 | 6.0%) represent the smallest median family size with 2.36 persons per family.
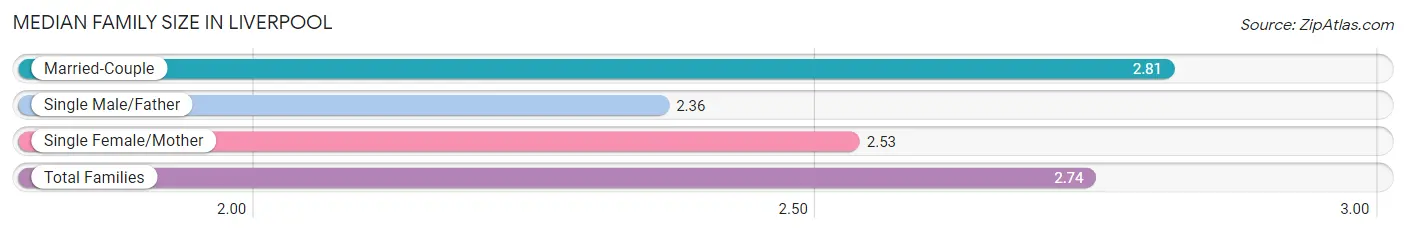
| Family Type | # Families | Family Size |
| Married-Couple | 479 (80.1%) | 2.81 |
| Single Male/Father | 36 (6.0%) | 2.36 |
| Single Female/Mother | 83 (13.9%) | 2.53 |
| Total Families | 598 (100.0%) | 2.74 |
Median Household Size in Liverpool
The median household size in Liverpool is 2.05 persons per household, with married-couple households (479 | 42.8%) accounting for the largest median household size of 2.81 persons per household. non-family households (520 | 46.5%) represent the smallest median household size with 1.22 persons per household.
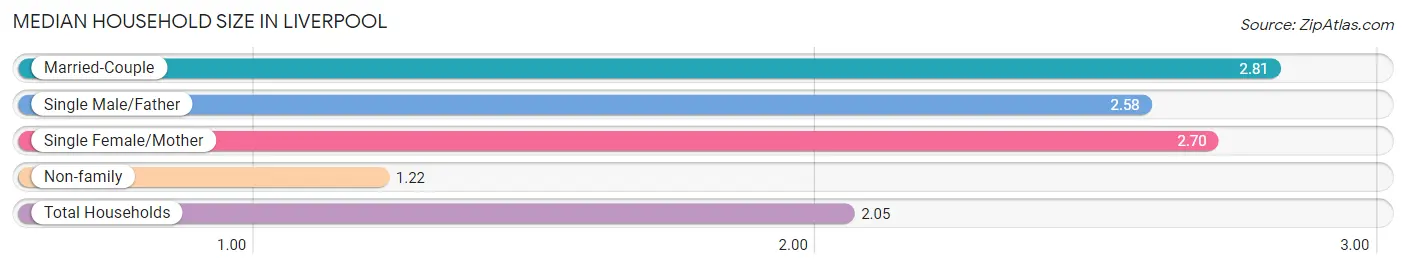
| Household Type | # Households | Household Size |
| Married-Couple | 479 (42.8%) | 2.81 |
| Single Male/Father | 36 (3.2%) | 2.58 |
| Single Female/Mother | 83 (7.4%) | 2.70 |
| Non-family | 520 (46.5%) | 1.22 |
| Total Households | 1,118 (100.0%) | 2.05 |
Household Size by Marriage Status in Liverpool
Out of a total of 1,118 households in Liverpool, 598 (53.5%) are family households, while 520 (46.5%) are nonfamily households. The most numerous type of family households are 2-person households, comprising 369, and the most common type of nonfamily households are 1-person households, comprising 422.
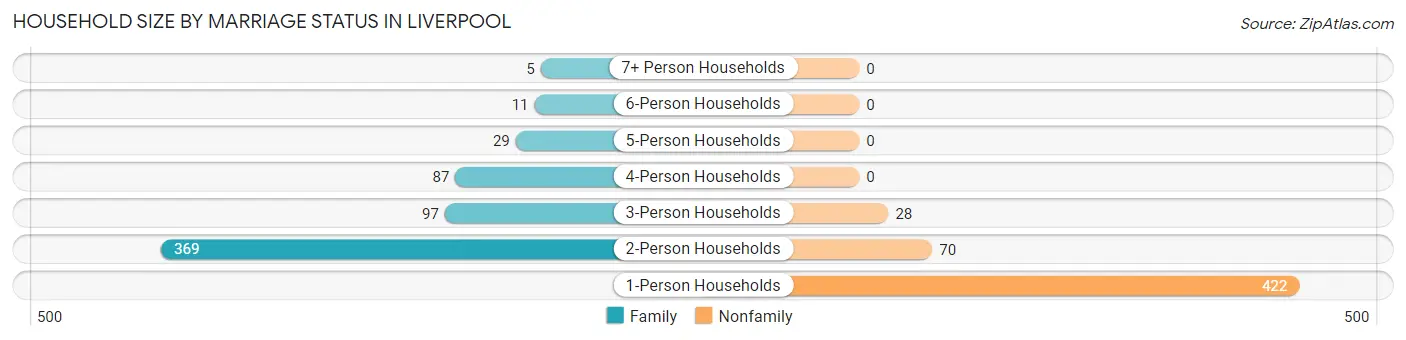
| Household Size | Family Households | Nonfamily Households |
| 1-Person Households | - | 422 (37.8%) |
| 2-Person Households | 369 (33.0%) | 70 (6.3%) |
| 3-Person Households | 97 (8.7%) | 28 (2.5%) |
| 4-Person Households | 87 (7.8%) | 0 (0.0%) |
| 5-Person Households | 29 (2.6%) | 0 (0.0%) |
| 6-Person Households | 11 (1.0%) | 0 (0.0%) |
| 7+ Person Households | 5 (0.4%) | 0 (0.0%) |
| Total | 598 (53.5%) | 520 (46.5%) |
Female Fertility in Liverpool
Fertility by Age in Liverpool
Average fertility rate in Liverpool is 65.0 births per 1,000 women. Women in the age bracket of 20 to 34 years have the highest fertility rate with 116.0 births per 1,000 women. Women in the age bracket of 20 to 34 years acount for 100.0% of all women with births.
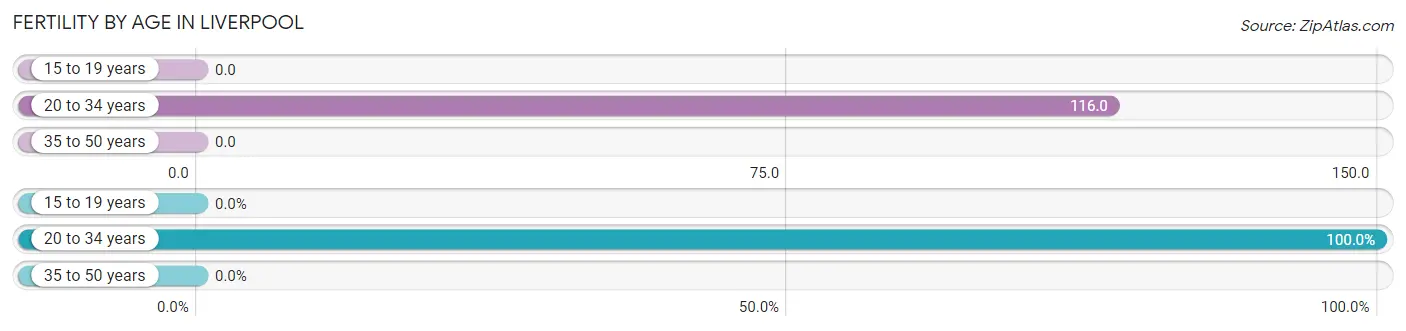
| Age Bracket | Women with Births | Births / 1,000 Women |
| 15 to 19 years | 0 (0.0%) | 0.0 |
| 20 to 34 years | 29 (100.0%) | 116.0 |
| 35 to 50 years | 0 (0.0%) | 0.0 |
| Total | 29 (100.0%) | 65.0 |
Fertility by Age by Marriage Status in Liverpool
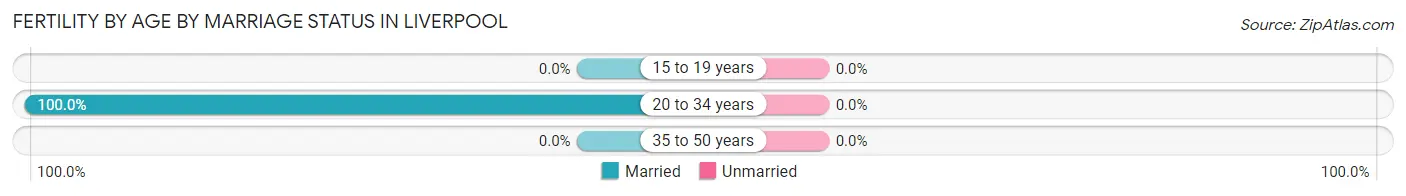
| Age Bracket | Married | Unmarried |
| 15 to 19 years | 0 (0.0%) | 0 (0.0%) |
| 20 to 34 years | 29 (100.0%) | 0 (0.0%) |
| 35 to 50 years | 0 (0.0%) | 0 (0.0%) |
| Total | 29 (100.0%) | 0 (0.0%) |
Fertility by Education in Liverpool
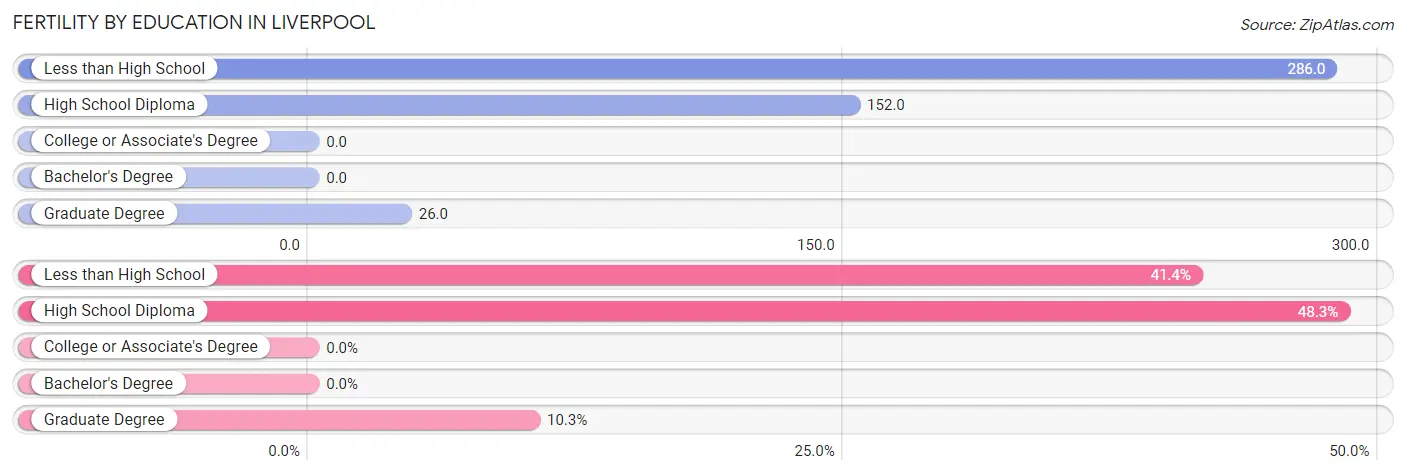
| Educational Attainment | Women with Births | Births / 1,000 Women |
| Less than High School | 12 (41.4%) | 286.0 |
| High School Diploma | 14 (48.3%) | 152.0 |
| College or Associate's Degree | 0 (0.0%) | 0.0 |
| Bachelor's Degree | 0 (0.0%) | 0.0 |
| Graduate Degree | 3 (10.3%) | 26.0 |
| Total | 29 (100.0%) | 65.0 |
Fertility by Education by Marriage Status in Liverpool
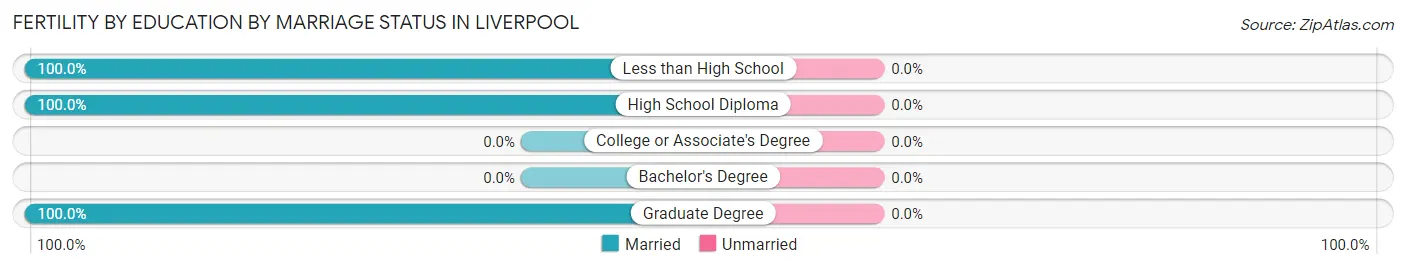
| Educational Attainment | Married | Unmarried |
| Less than High School | 12 (100.0%) | 0 (0.0%) |
| High School Diploma | 14 (100.0%) | 0 (0.0%) |
| College or Associate's Degree | 0 (0.0%) | 0 (0.0%) |
| Bachelor's Degree | 0 (0.0%) | 0 (0.0%) |
| Graduate Degree | 3 (100.0%) | 0 (0.0%) |
| Total | 29 (100.0%) | 0 (0.0%) |
Income in Liverpool
Income Overview in Liverpool
Per Capita Income in Liverpool is $43,730, while median incomes of families and households are $79,758 and $70,556 respectively.
| Characteristic | Number | Measure |
| Per Capita Income | 2,331 | $43,730 |
| Median Family Income | 598 | $79,758 |
| Mean Family Income | 598 | $115,899 |
| Median Household Income | 1,118 | $70,556 |
| Mean Household Income | 1,118 | $90,845 |
| Income Deficit | 598 | $0 |
| Wage / Income Gap (%) | 2,331 | 15.61% |
| Wage / Income Gap ($) | 2,331 | 84.39¢ per $1 |
| Gini / Inequality Index | 2,331 | 0.47 |
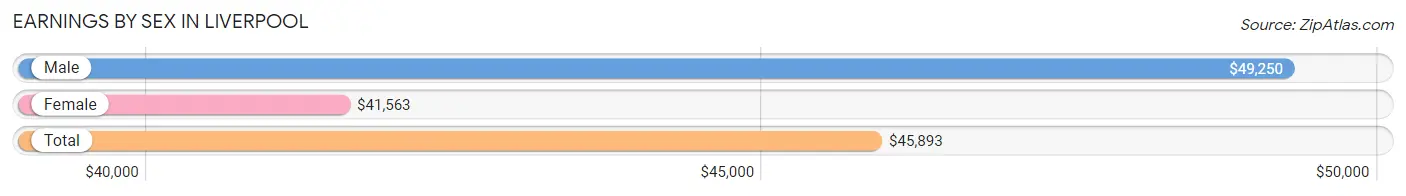
Earnings by Sex in Liverpool
Average Earnings in Liverpool are $45,893, $49,250 for men and $41,563 for women, a difference of 15.6%.
| Sex | Number | Average Earnings |
| Male | 654 (53.3%) | $49,250 |
| Female | 572 (46.7%) | $41,563 |
| Total | 1,226 (100.0%) | $45,893 |
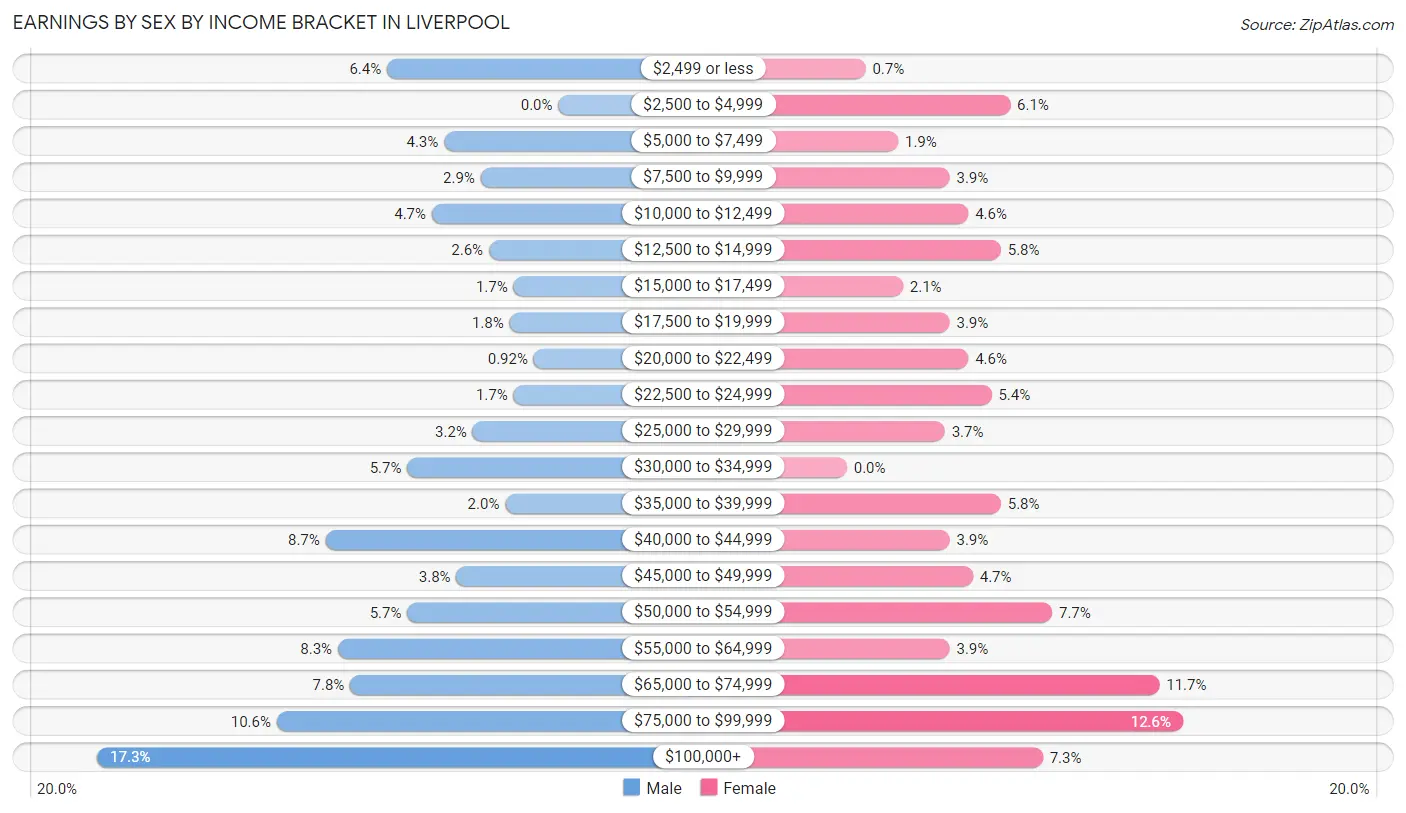
Earnings by Sex by Income Bracket in Liverpool
The most common earnings brackets in Liverpool are $100,000+ for men (113 | 17.3%) and $75,000 to $99,999 for women (72 | 12.6%).
| Income | Male | Female |
| $2,499 or less | 42 (6.4%) | 4 (0.7%) |
| $2,500 to $4,999 | 0 (0.0%) | 35 (6.1%) |
| $5,000 to $7,499 | 28 (4.3%) | 11 (1.9%) |
| $7,500 to $9,999 | 19 (2.9%) | 22 (3.8%) |
| $10,000 to $12,499 | 31 (4.7%) | 26 (4.5%) |
| $12,500 to $14,999 | 17 (2.6%) | 33 (5.8%) |
| $15,000 to $17,499 | 11 (1.7%) | 12 (2.1%) |
| $17,500 to $19,999 | 12 (1.8%) | 22 (3.8%) |
| $20,000 to $22,499 | 6 (0.9%) | 26 (4.5%) |
| $22,500 to $24,999 | 11 (1.7%) | 31 (5.4%) |
| $25,000 to $29,999 | 21 (3.2%) | 21 (3.7%) |
| $30,000 to $34,999 | 37 (5.7%) | 0 (0.0%) |
| $35,000 to $39,999 | 13 (2.0%) | 33 (5.8%) |
| $40,000 to $44,999 | 57 (8.7%) | 22 (3.8%) |
| $45,000 to $49,999 | 25 (3.8%) | 27 (4.7%) |
| $50,000 to $54,999 | 37 (5.7%) | 44 (7.7%) |
| $55,000 to $64,999 | 54 (8.3%) | 22 (3.8%) |
| $65,000 to $74,999 | 51 (7.8%) | 67 (11.7%) |
| $75,000 to $99,999 | 69 (10.5%) | 72 (12.6%) |
| $100,000+ | 113 (17.3%) | 42 (7.3%) |
| Total | 654 (100.0%) | 572 (100.0%) |
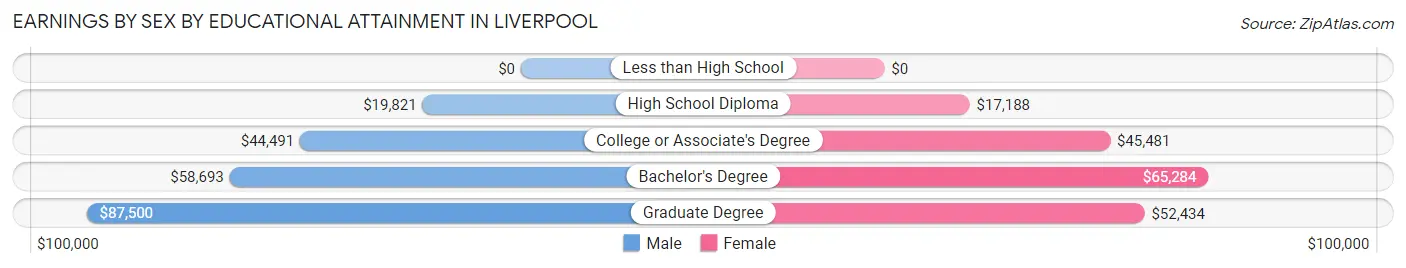
Earnings by Sex by Educational Attainment in Liverpool
Average earnings in Liverpool are $51,083 for men and $47,308 for women, a difference of 7.4%. Men with an educational attainment of graduate degree enjoy the highest average annual earnings of $87,500, while those with high school diploma education earn the least with $19,821. Women with an educational attainment of bachelor's degree earn the most with the average annual earnings of $65,284, while those with high school diploma education have the smallest earnings of $17,188.
| Educational Attainment | Male Income | Female Income |
| Less than High School | - | - |
| High School Diploma | $19,821 | $17,188 |
| College or Associate's Degree | $44,491 | $45,481 |
| Bachelor's Degree | $58,693 | $65,284 |
| Graduate Degree | $87,500 | $52,434 |
| Total | $51,083 | $47,308 |
Family Income in Liverpool
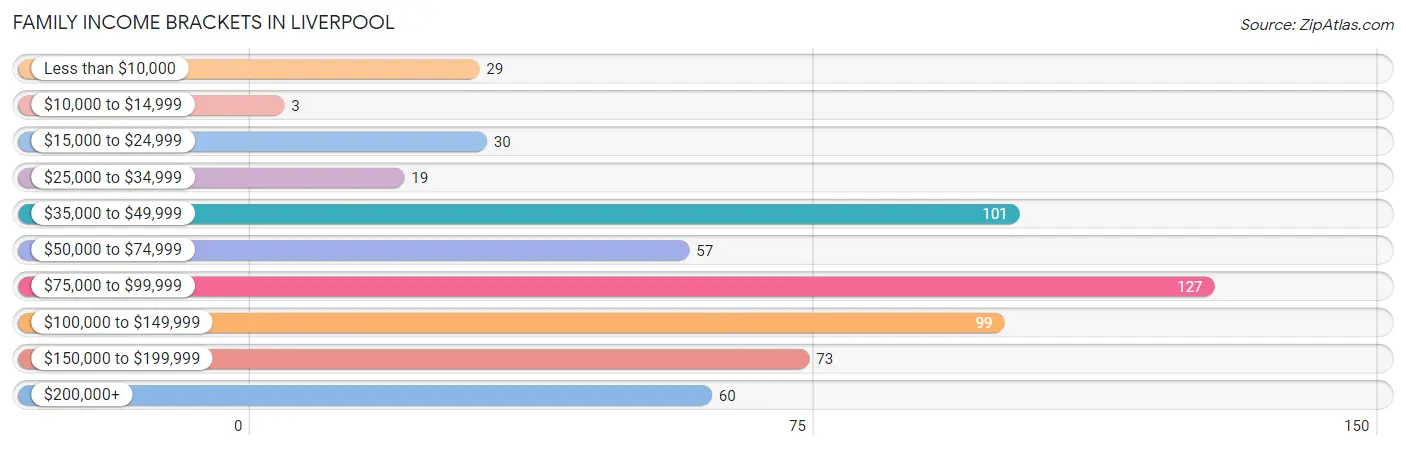
Family Income Brackets in Liverpool
According to the Liverpool family income data, there are 127 families falling into the $75,000 to $99,999 income range, which is the most common income bracket and makes up 21.2% of all families. Conversely, the $10,000 to $14,999 income bracket is the least frequent group with only 3 families (0.5%) belonging to this category.
| Income Bracket | # Families | % Families |
| Less than $10,000 | 29 | 4.8% |
| $10,000 to $14,999 | 3 | 0.5% |
| $15,000 to $24,999 | 30 | 5.0% |
| $25,000 to $34,999 | 19 | 3.2% |
| $35,000 to $49,999 | 101 | 16.9% |
| $50,000 to $74,999 | 57 | 9.5% |
| $75,000 to $99,999 | 127 | 21.2% |
| $100,000 to $149,999 | 99 | 16.6% |
| $150,000 to $199,999 | 73 | 12.2% |
| $200,000+ | 60 | 10.0% |
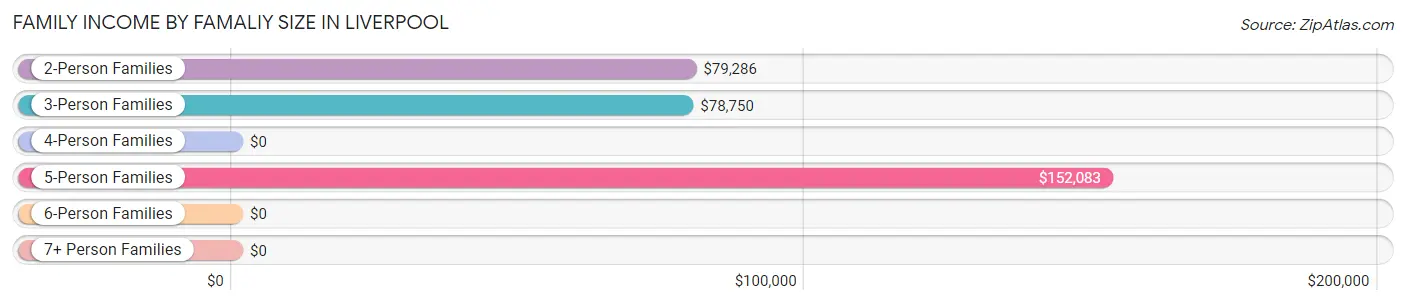
Family Income by Famaliy Size in Liverpool
5-person families (29 | 4.9%) account for the highest median family income in Liverpool with $152,083 per family, while 2-person families (376 | 62.9%) have the highest median income of $39,643 per family member.
| Income Bracket | # Families | Median Income |
| 2-Person Families | 376 (62.9%) | $79,286 |
| 3-Person Families | 105 (17.6%) | $78,750 |
| 4-Person Families | 72 (12.0%) | $0 |
| 5-Person Families | 29 (4.9%) | $152,083 |
| 6-Person Families | 11 (1.8%) | $0 |
| 7+ Person Families | 5 (0.8%) | $0 |
| Total | 598 (100.0%) | $79,758 |
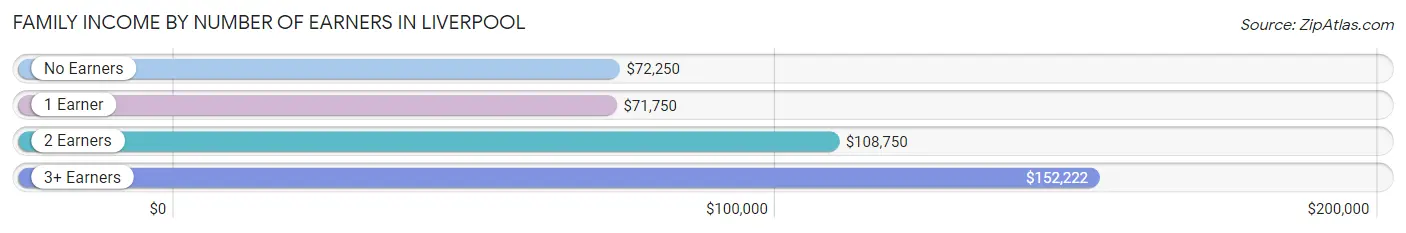
Family Income by Number of Earners in Liverpool
The median family income in Liverpool is $79,758, with families comprising 3+ earners (40) having the highest median family income of $152,222, while families with 1 earner (159) have the lowest median family income of $71,750, accounting for 6.7% and 26.6% of families, respectively.
| Number of Earners | # Families | Median Income |
| No Earners | 179 (29.9%) | $72,250 |
| 1 Earner | 159 (26.6%) | $71,750 |
| 2 Earners | 220 (36.8%) | $108,750 |
| 3+ Earners | 40 (6.7%) | $152,222 |
| Total | 598 (100.0%) | $79,758 |
Household Income in Liverpool
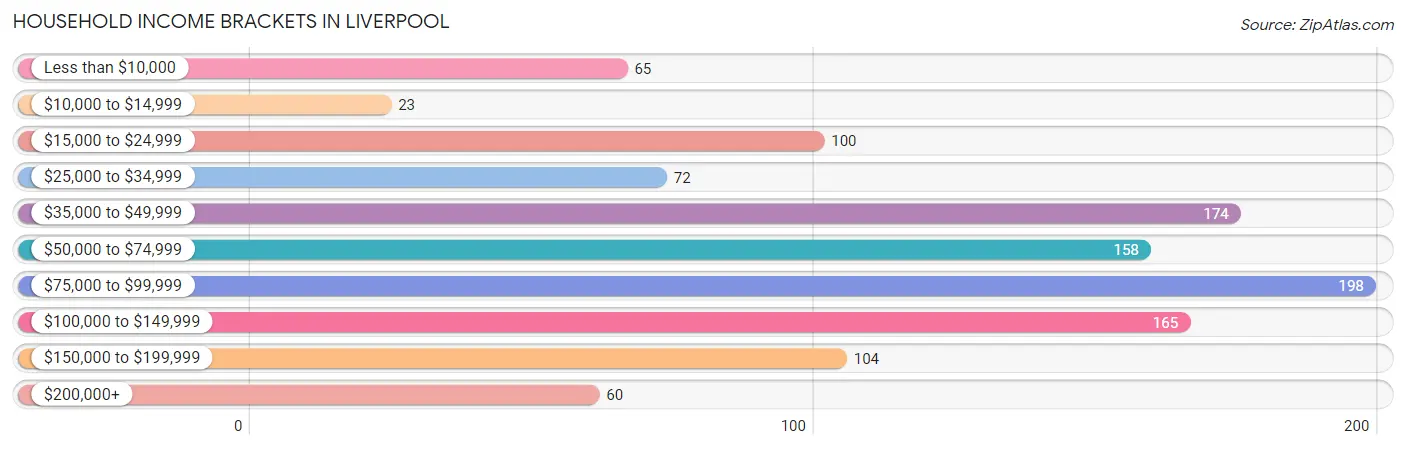
Household Income Brackets in Liverpool
With 198 households falling in the category, the $75,000 to $99,999 income range is the most frequent in Liverpool, accounting for 17.7% of all households. In contrast, only 23 households (2.1%) fall into the $10,000 to $14,999 income bracket, making it the least populous group.
| Income Bracket | # Households | % Households |
| Less than $10,000 | 65 | 5.8% |
| $10,000 to $14,999 | 23 | 2.1% |
| $15,000 to $24,999 | 100 | 8.9% |
| $25,000 to $34,999 | 72 | 6.4% |
| $35,000 to $49,999 | 174 | 15.6% |
| $50,000 to $74,999 | 158 | 14.1% |
| $75,000 to $99,999 | 198 | 17.7% |
| $100,000 to $149,999 | 165 | 14.8% |
| $150,000 to $199,999 | 104 | 9.3% |
| $200,000+ | 60 | 5.4% |
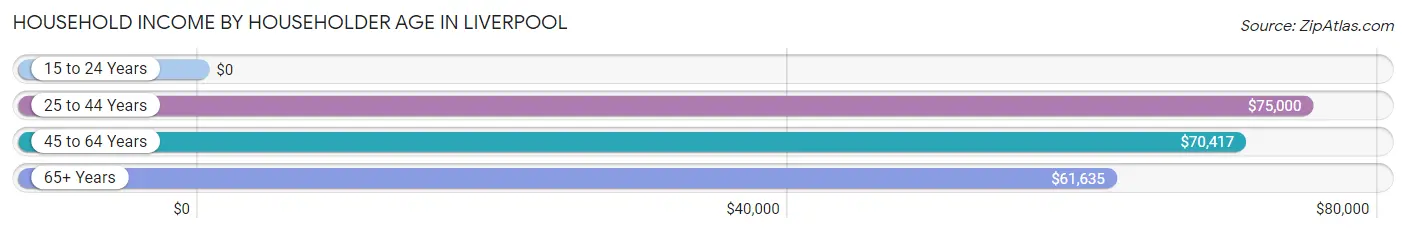
Household Income by Householder Age in Liverpool
The median household income in Liverpool is $70,556, with the highest median household income of $75,000 found in the 25 to 44 years age bracket for the primary householder. A total of 324 households (29.0%) fall into this category. Meanwhile, the 15 to 24 years age bracket for the primary householder has the lowest median household income of $0, with 60 households (5.4%) in this group.
| Income Bracket | # Households | Median Income |
| 15 to 24 Years | 60 (5.4%) | $0 |
| 25 to 44 Years | 324 (29.0%) | $75,000 |
| 45 to 64 Years | 354 (31.7%) | $70,417 |
| 65+ Years | 380 (34.0%) | $61,635 |
| Total | 1,118 (100.0%) | $70,556 |
Poverty in Liverpool
Income Below Poverty by Sex and Age in Liverpool
With 13.1% poverty level for males and 15.4% for females among the residents of Liverpool, 15 year old males and 18 to 24 year old females are the most vulnerable to poverty, with 17 males (53.1%) and 25 females (36.8%) in their respective age groups living below the poverty level.
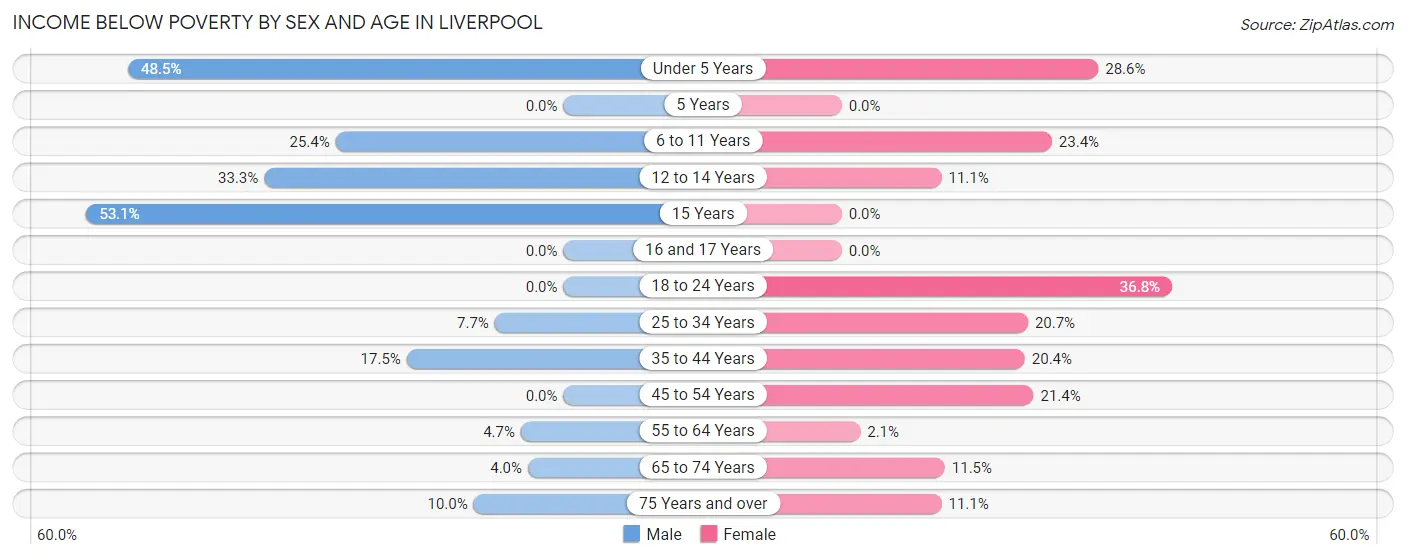
| Age Bracket | Male | Female |
| Under 5 Years | 48 (48.5%) | 16 (28.6%) |
| 5 Years | 0 (0.0%) | 0 (0.0%) |
| 6 to 11 Years | 17 (25.4%) | 11 (23.4%) |
| 12 to 14 Years | 4 (33.3%) | 4 (11.1%) |
| 15 Years | 17 (53.1%) | 0 (0.0%) |
| 16 and 17 Years | 0 (0.0%) | 0 (0.0%) |
| 18 to 24 Years | 0 (0.0%) | 25 (36.8%) |
| 25 to 34 Years | 14 (7.6%) | 40 (20.7%) |
| 35 to 44 Years | 26 (17.4%) | 21 (20.4%) |
| 45 to 54 Years | 0 (0.0%) | 22 (21.4%) |
| 55 to 64 Years | 9 (4.7%) | 4 (2.1%) |
| 65 to 74 Years | 6 (4.0%) | 21 (11.5%) |
| 75 Years and over | 10 (10.0%) | 17 (11.1%) |
| Total | 151 (13.1%) | 181 (15.4%) |
Income Above Poverty by Sex and Age in Liverpool
According to the poverty statistics in Liverpool, males aged 16 and 17 years and females aged 5 years are the age groups that are most secure financially, with 100.0% of males and 100.0% of females in these age groups living above the poverty line.
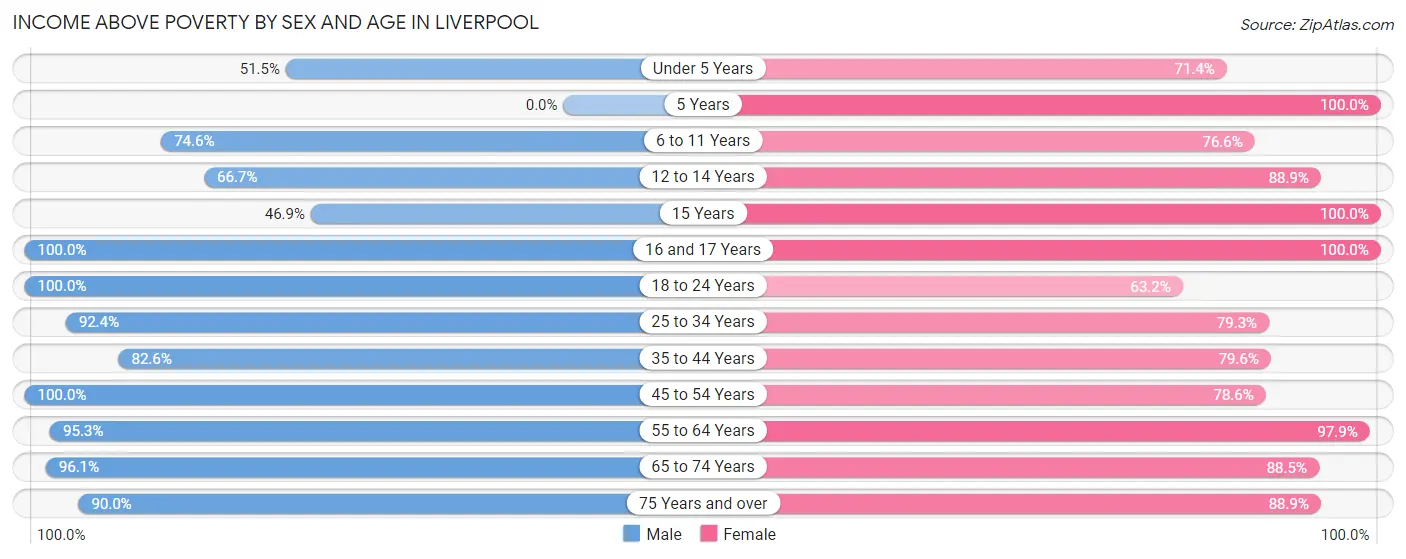
| Age Bracket | Male | Female |
| Under 5 Years | 51 (51.5%) | 40 (71.4%) |
| 5 Years | 0 (0.0%) | 13 (100.0%) |
| 6 to 11 Years | 50 (74.6%) | 36 (76.6%) |
| 12 to 14 Years | 8 (66.7%) | 32 (88.9%) |
| 15 Years | 15 (46.9%) | 12 (100.0%) |
| 16 and 17 Years | 8 (100.0%) | 14 (100.0%) |
| 18 to 24 Years | 94 (100.0%) | 43 (63.2%) |
| 25 to 34 Years | 169 (92.3%) | 153 (79.3%) |
| 35 to 44 Years | 123 (82.6%) | 82 (79.6%) |
| 45 to 54 Years | 70 (100.0%) | 81 (78.6%) |
| 55 to 64 Years | 181 (95.3%) | 190 (97.9%) |
| 65 to 74 Years | 146 (96.1%) | 162 (88.5%) |
| 75 Years and over | 90 (90.0%) | 136 (88.9%) |
| Total | 1,005 (86.9%) | 994 (84.6%) |
Income Below Poverty Among Married-Couple Families in Liverpool
The poverty statistics for married-couple families in Liverpool show that 5.2% or 25 of the total 479 families live below the poverty line. Families with 3 or 4 children have the highest poverty rate of 42.3%, comprising of 11 families. On the other hand, families with no children have the lowest poverty rate of 0.0%, which includes 0 families.
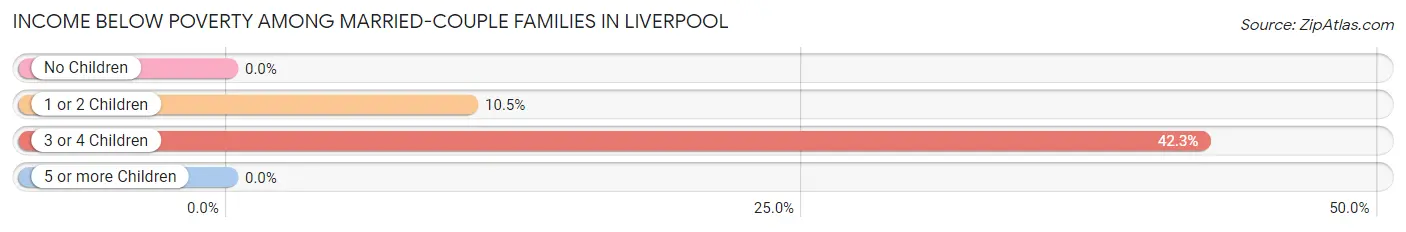
| Children | Above Poverty | Below Poverty |
| No Children | 319 (100.0%) | 0 (0.0%) |
| 1 or 2 Children | 120 (89.5%) | 14 (10.4%) |
| 3 or 4 Children | 15 (57.7%) | 11 (42.3%) |
| 5 or more Children | 0 (0.0%) | 0 (0.0%) |
| Total | 454 (94.8%) | 25 (5.2%) |
Income Below Poverty Among Single-Parent Households in Liverpool
According to the poverty data in Liverpool, 13.9% or 5 single-father households and 38.6% or 32 single-mother households are living below the poverty line. Among single-father households, those with no children have the highest poverty rate, with 5 households (20.8%) experiencing poverty. Likewise, among single-mother households, those with 3 or 4 children have the highest poverty rate, with 4 households (100.0%) falling below the poverty line.
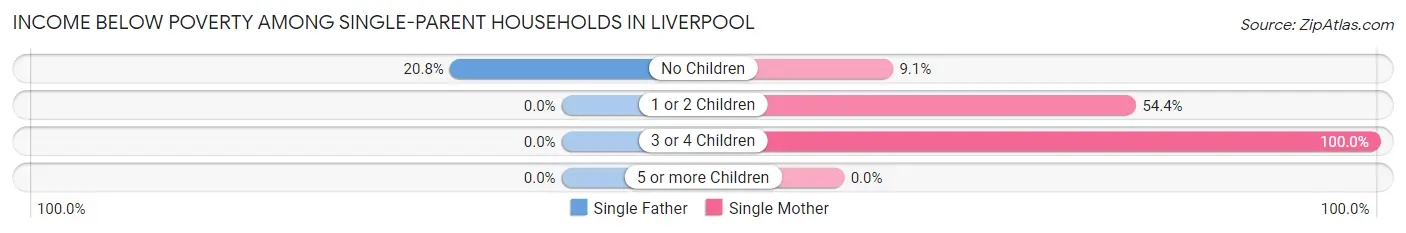
| Children | Single Father | Single Mother |
| No Children | 5 (20.8%) | 3 (9.1%) |
| 1 or 2 Children | 0 (0.0%) | 25 (54.3%) |
| 3 or 4 Children | 0 (0.0%) | 4 (100.0%) |
| 5 or more Children | 0 (0.0%) | 0 (0.0%) |
| Total | 5 (13.9%) | 32 (38.6%) |
Income Below Poverty Among Married-Couple vs Single-Parent Households in Liverpool
The poverty data for Liverpool shows that 25 of the married-couple family households (5.2%) and 37 of the single-parent households (31.1%) are living below the poverty level. Within the married-couple family households, those with 3 or 4 children have the highest poverty rate, with 11 households (42.3%) falling below the poverty line. Among the single-parent households, those with 3 or 4 children have the highest poverty rate, with 4 household (100.0%) living below poverty.
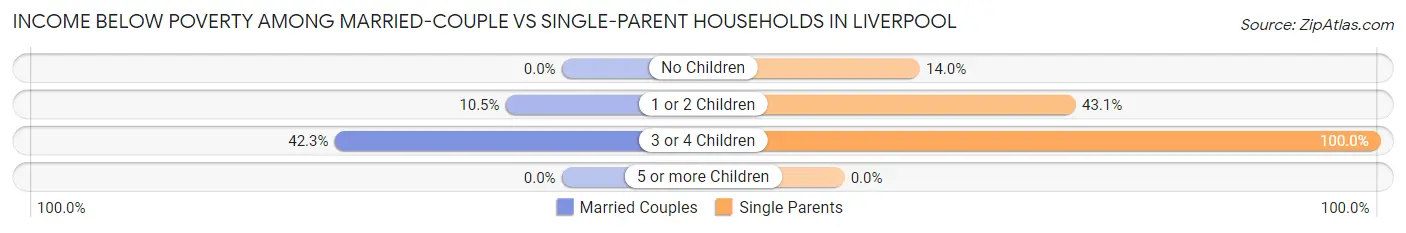
| Children | Married-Couple Families | Single-Parent Households |
| No Children | 0 (0.0%) | 8 (14.0%) |
| 1 or 2 Children | 14 (10.4%) | 25 (43.1%) |
| 3 or 4 Children | 11 (42.3%) | 4 (100.0%) |
| 5 or more Children | 0 (0.0%) | 0 (0.0%) |
| Total | 25 (5.2%) | 37 (31.1%) |
Employment Characteristics in Liverpool
Employment by Class of Employer in Liverpool
Among the 1,113 employed individuals in Liverpool, private company employees (649 | 58.3%), not-for-profit organizations (147 | 13.2%), and local government employees (108 | 9.7%) make up the most common classes of employment.
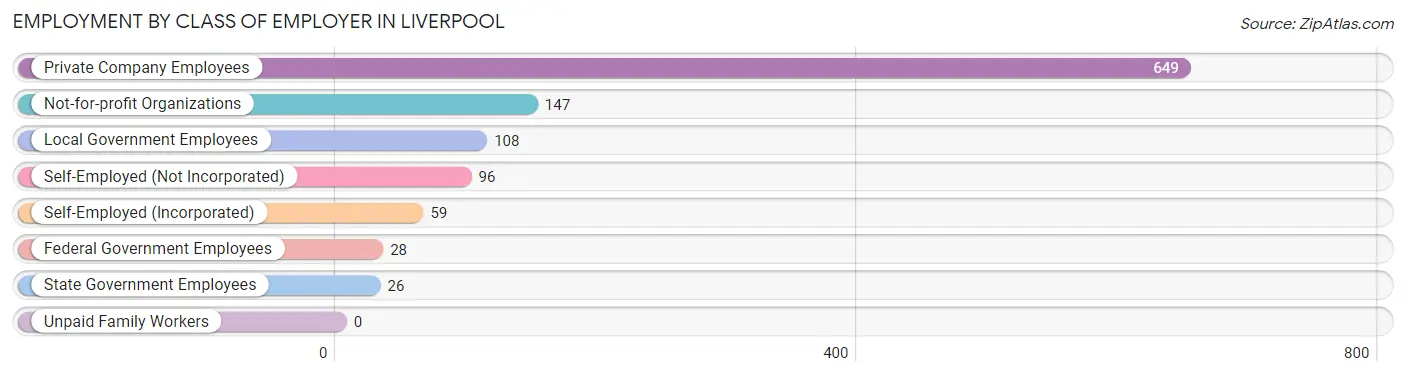
| Employer Class | # Employees | % Employees |
| Private Company Employees | 649 | 58.3% |
| Self-Employed (Incorporated) | 59 | 5.3% |
| Self-Employed (Not Incorporated) | 96 | 8.6% |
| Not-for-profit Organizations | 147 | 13.2% |
| Local Government Employees | 108 | 9.7% |
| State Government Employees | 26 | 2.3% |
| Federal Government Employees | 28 | 2.5% |
| Unpaid Family Workers | 0 | 0.0% |
| Total | 1,113 | 100.0% |
Employment Status by Age in Liverpool
According to the labor force statistics for Liverpool, out of the total population over 16 years of age (1,957), 59.1% or 1,157 individuals are in the labor force, with 2.9% or 34 of them unemployed. The age group with the highest labor force participation rate is 35 to 44 years, with 92.5% or 233 individuals in the labor force. Within the labor force, the 20 to 24 years age range has the highest percentage of unemployed individuals, with 12.1% or 16 of them being unemployed.
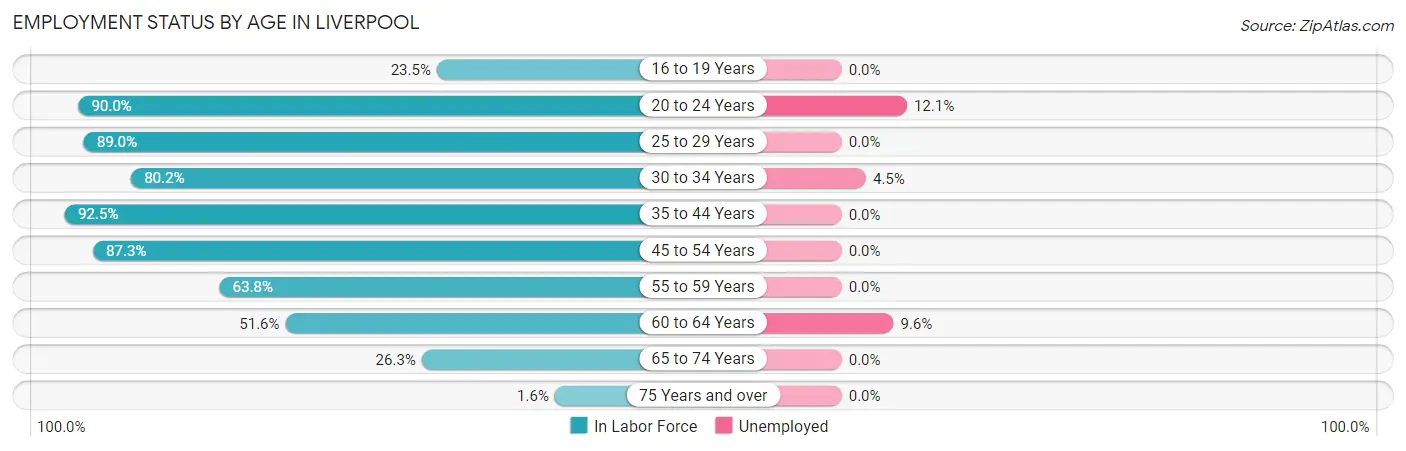
| Age Bracket | In Labor Force | Unemployed |
| 16 to 19 Years | 8 (23.5%) | 0 (0.0%) |
| 20 to 24 Years | 135 (90.0%) | 16 (12.1%) |
| 25 to 29 Years | 186 (89.0%) | 0 (0.0%) |
| 30 to 34 Years | 134 (80.2%) | 6 (4.5%) |
| 35 to 44 Years | 233 (92.5%) | 0 (0.0%) |
| 45 to 54 Years | 151 (87.3%) | 0 (0.0%) |
| 55 to 59 Years | 104 (63.8%) | 0 (0.0%) |
| 60 to 64 Years | 114 (51.6%) | 11 (9.6%) |
| 65 to 74 Years | 88 (26.3%) | 0 (0.0%) |
| 75 Years and over | 4 (1.6%) | 0 (0.0%) |
| Total | 1,157 (59.1%) | 34 (2.9%) |
Employment Status by Educational Attainment in Liverpool
According to labor force statistics for Liverpool, 77.8% of individuals (922) out of the total population between 25 and 64 years of age (1,185) are in the labor force, with 1.8% or 17 of them being unemployed. The group with the highest labor force participation rate are those with the educational attainment of bachelor's degree or higher, with 87.8% or 511 individuals in the labor force. Within the labor force, individuals with high school diploma education have the highest percentage of unemployment, with 5.1% or 7 of them being unemployed.
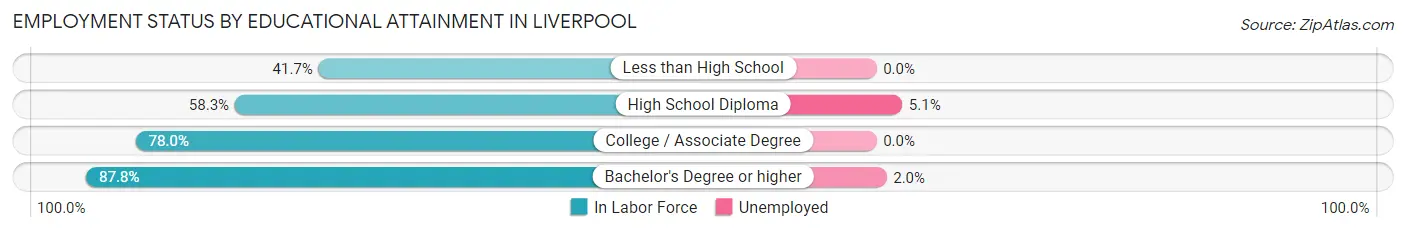
| Educational Attainment | In Labor Force | Unemployed |
| Less than High School | 15 (41.7%) | 0 (0.0%) |
| High School Diploma | 137 (58.3%) | 12 (5.1%) |
| College / Associate Degree | 259 (78.0%) | 0 (0.0%) |
| Bachelor's Degree or higher | 511 (87.8%) | 12 (2.0%) |
| Total | 922 (77.8%) | 21 (1.8%) |
Employment Occupations by Sex in Liverpool
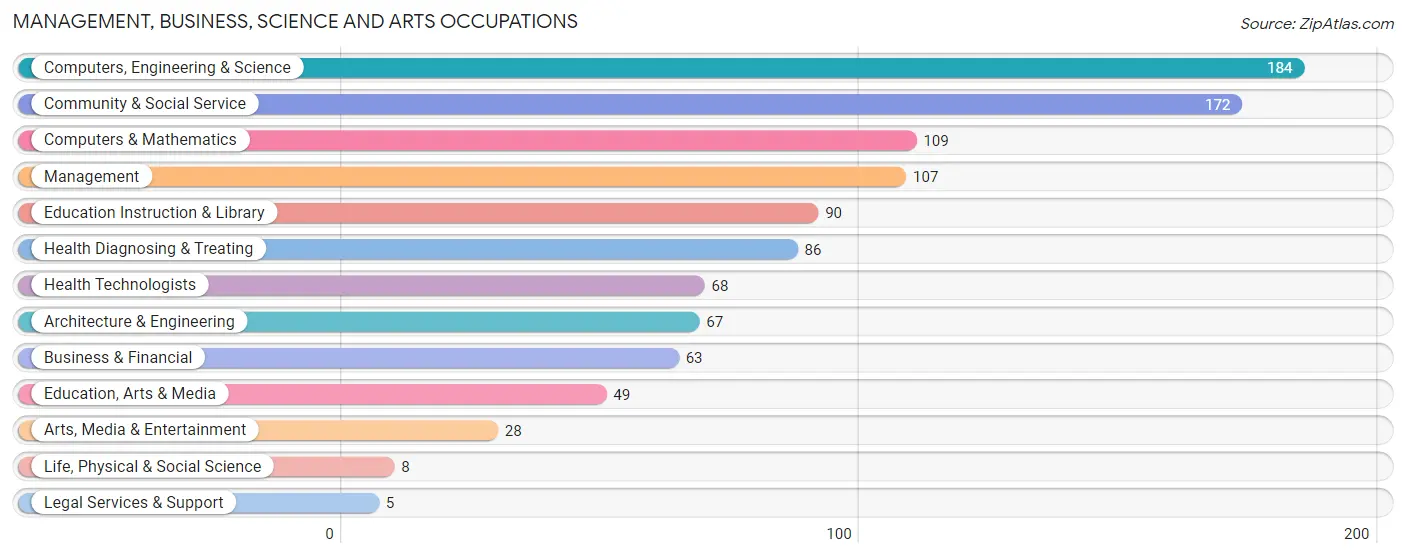
Management, Business, Science and Arts Occupations
The most common Management, Business, Science and Arts occupations in Liverpool are Computers, Engineering & Science (184 | 16.4%), Community & Social Service (172 | 15.3%), Computers & Mathematics (109 | 9.7%), Management (107 | 9.6%), and Education Instruction & Library (90 | 8.0%).
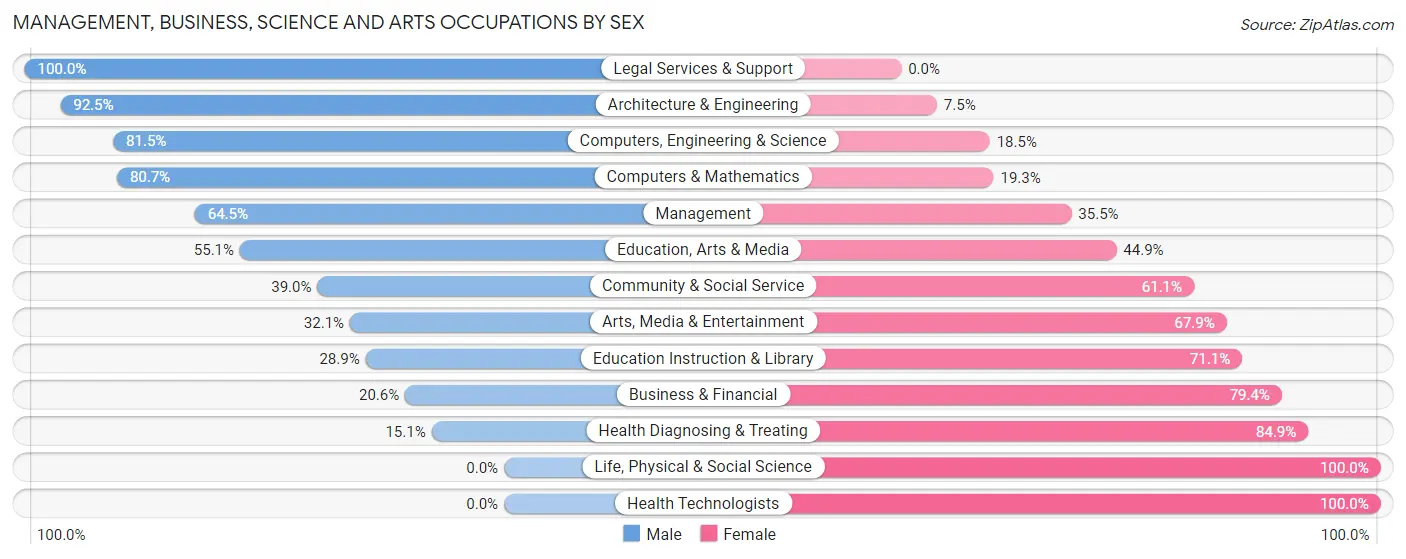
Management, Business, Science and Arts Occupations by Sex
Within the Management, Business, Science and Arts occupations in Liverpool, the most male-oriented occupations are Legal Services & Support (100.0%), Architecture & Engineering (92.5%), and Computers, Engineering & Science (81.5%), while the most female-oriented occupations are Life, Physical & Social Science (100.0%), Health Technologists (100.0%), and Health Diagnosing & Treating (84.9%).
| Occupation | Male | Female |
| Management | 69 (64.5%) | 38 (35.5%) |
| Business & Financial | 13 (20.6%) | 50 (79.4%) |
| Computers, Engineering & Science | 150 (81.5%) | 34 (18.5%) |
| Computers & Mathematics | 88 (80.7%) | 21 (19.3%) |
| Architecture & Engineering | 62 (92.5%) | 5 (7.5%) |
| Life, Physical & Social Science | 0 (0.0%) | 8 (100.0%) |
| Community & Social Service | 67 (39.0%) | 105 (61.1%) |
| Education, Arts & Media | 27 (55.1%) | 22 (44.9%) |
| Legal Services & Support | 5 (100.0%) | 0 (0.0%) |
| Education Instruction & Library | 26 (28.9%) | 64 (71.1%) |
| Arts, Media & Entertainment | 9 (32.1%) | 19 (67.9%) |
| Health Diagnosing & Treating | 13 (15.1%) | 73 (84.9%) |
| Health Technologists | 0 (0.0%) | 68 (100.0%) |
| Total (Category) | 312 (51.0%) | 300 (49.0%) |
| Total (Overall) | 621 (55.4%) | 500 (44.6%) |
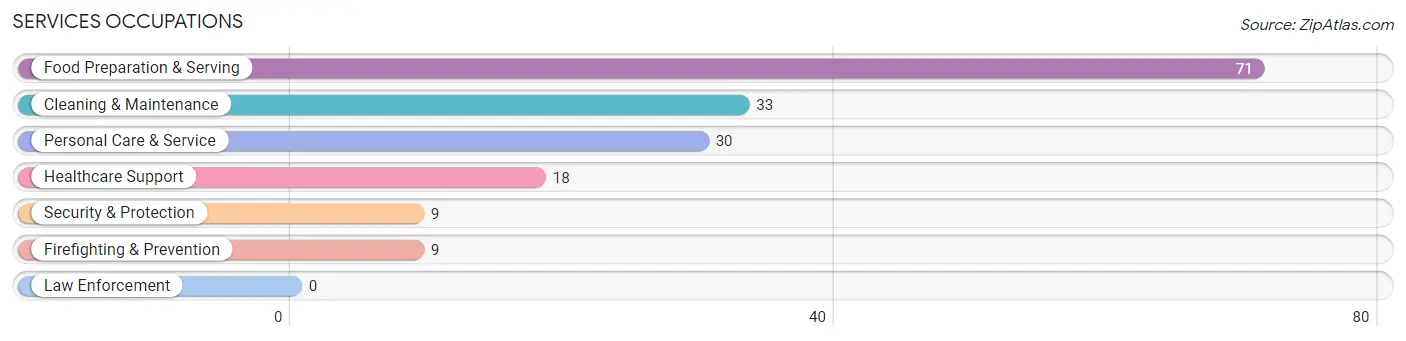
Services Occupations
The most common Services occupations in Liverpool are Food Preparation & Serving (71 | 6.3%), Cleaning & Maintenance (33 | 2.9%), Personal Care & Service (30 | 2.7%), Healthcare Support (18 | 1.6%), and Security & Protection (9 | 0.8%).
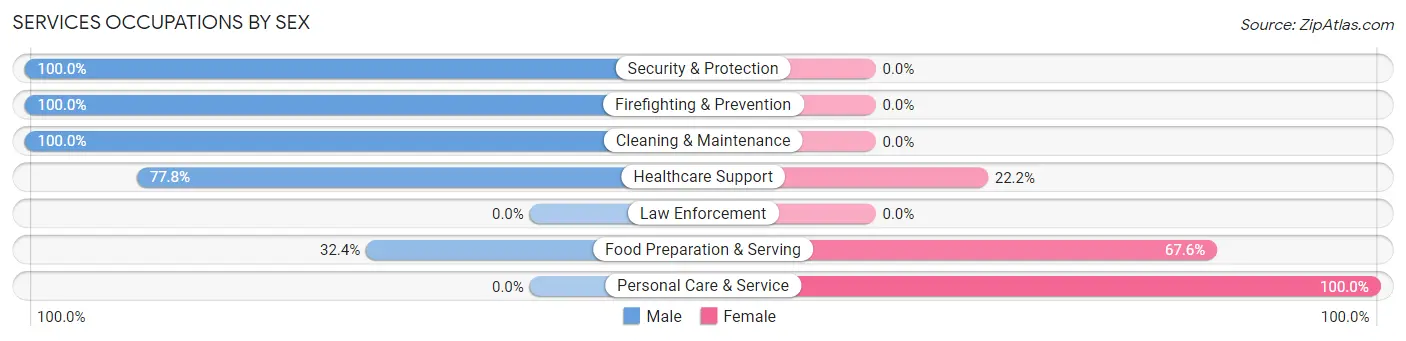
Services Occupations by Sex
Within the Services occupations in Liverpool, the most male-oriented occupations are Security & Protection (100.0%), Firefighting & Prevention (100.0%), and Cleaning & Maintenance (100.0%), while the most female-oriented occupations are Personal Care & Service (100.0%), Food Preparation & Serving (67.6%), and Healthcare Support (22.2%).
| Occupation | Male | Female |
| Healthcare Support | 14 (77.8%) | 4 (22.2%) |
| Security & Protection | 9 (100.0%) | 0 (0.0%) |
| Firefighting & Prevention | 9 (100.0%) | 0 (0.0%) |
| Law Enforcement | 0 (0.0%) | 0 (0.0%) |
| Food Preparation & Serving | 23 (32.4%) | 48 (67.6%) |
| Cleaning & Maintenance | 33 (100.0%) | 0 (0.0%) |
| Personal Care & Service | 0 (0.0%) | 30 (100.0%) |
| Total (Category) | 79 (49.1%) | 82 (50.9%) |
| Total (Overall) | 621 (55.4%) | 500 (44.6%) |
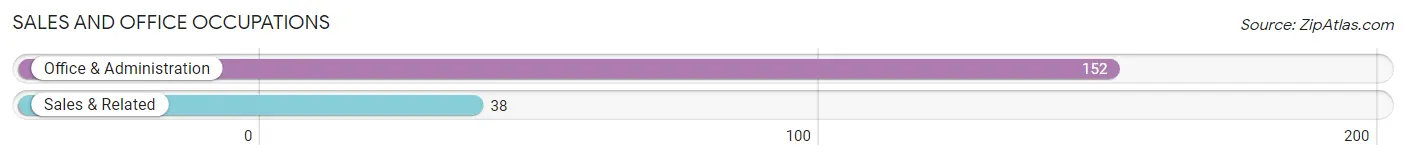
Sales and Office Occupations
The most common Sales and Office occupations in Liverpool are Office & Administration (152 | 13.6%), and Sales & Related (38 | 3.4%).
Sales and Office Occupations by Sex
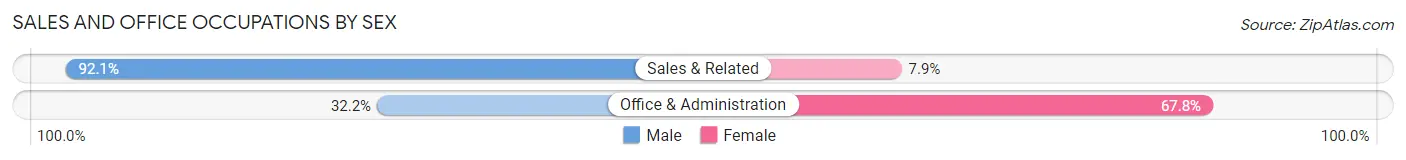
| Occupation | Male | Female |
| Sales & Related | 35 (92.1%) | 3 (7.9%) |
| Office & Administration | 49 (32.2%) | 103 (67.8%) |
| Total (Category) | 84 (44.2%) | 106 (55.8%) |
| Total (Overall) | 621 (55.4%) | 500 (44.6%) |
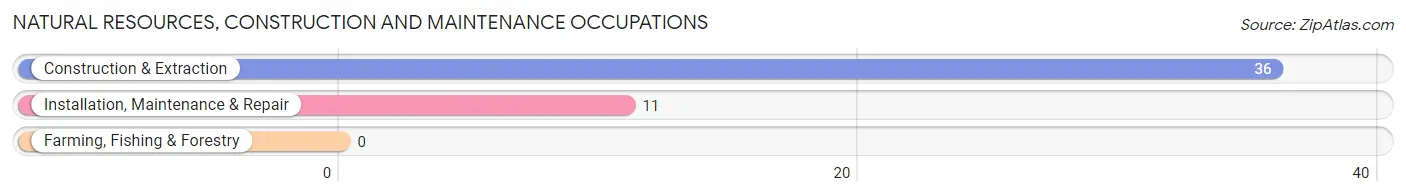
Natural Resources, Construction and Maintenance Occupations
The most common Natural Resources, Construction and Maintenance occupations in Liverpool are Construction & Extraction (36 | 3.2%), and Installation, Maintenance & Repair (11 | 1.0%).
Natural Resources, Construction and Maintenance Occupations by Sex
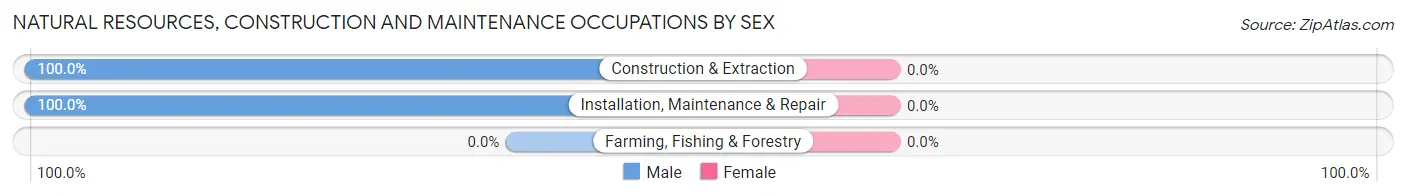
| Occupation | Male | Female |
| Farming, Fishing & Forestry | 0 (0.0%) | 0 (0.0%) |
| Construction & Extraction | 36 (100.0%) | 0 (0.0%) |
| Installation, Maintenance & Repair | 11 (100.0%) | 0 (0.0%) |
| Total (Category) | 47 (100.0%) | 0 (0.0%) |
| Total (Overall) | 621 (55.4%) | 500 (44.6%) |
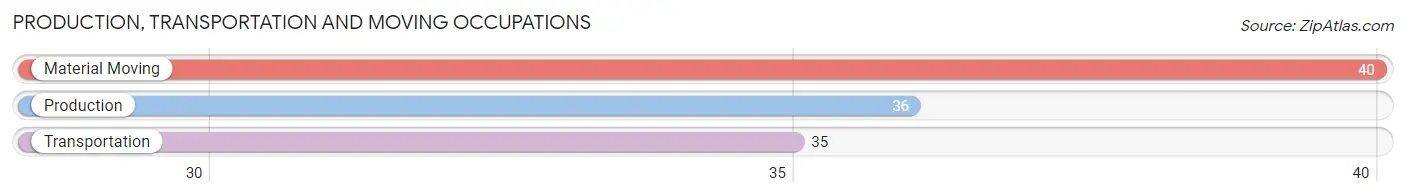
Production, Transportation and Moving Occupations
The most common Production, Transportation and Moving occupations in Liverpool are Material Moving (40 | 3.6%), Production (36 | 3.2%), and Transportation (35 | 3.1%).
Production, Transportation and Moving Occupations by Sex
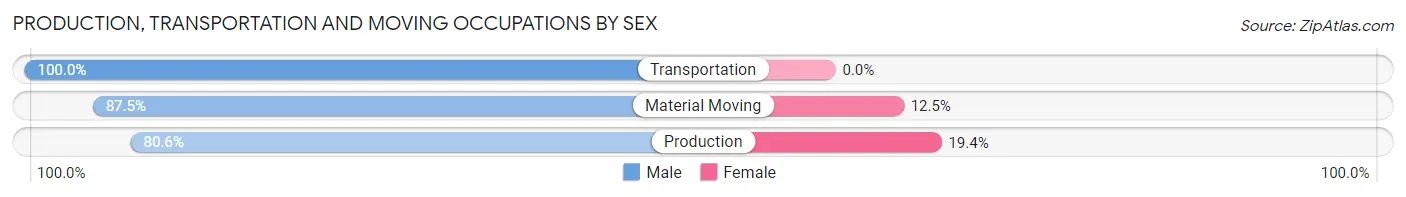
| Occupation | Male | Female |
| Production | 29 (80.6%) | 7 (19.4%) |
| Transportation | 35 (100.0%) | 0 (0.0%) |
| Material Moving | 35 (87.5%) | 5 (12.5%) |
| Total (Category) | 99 (89.2%) | 12 (10.8%) |
| Total (Overall) | 621 (55.4%) | 500 (44.6%) |
Employment Industries by Sex in Liverpool
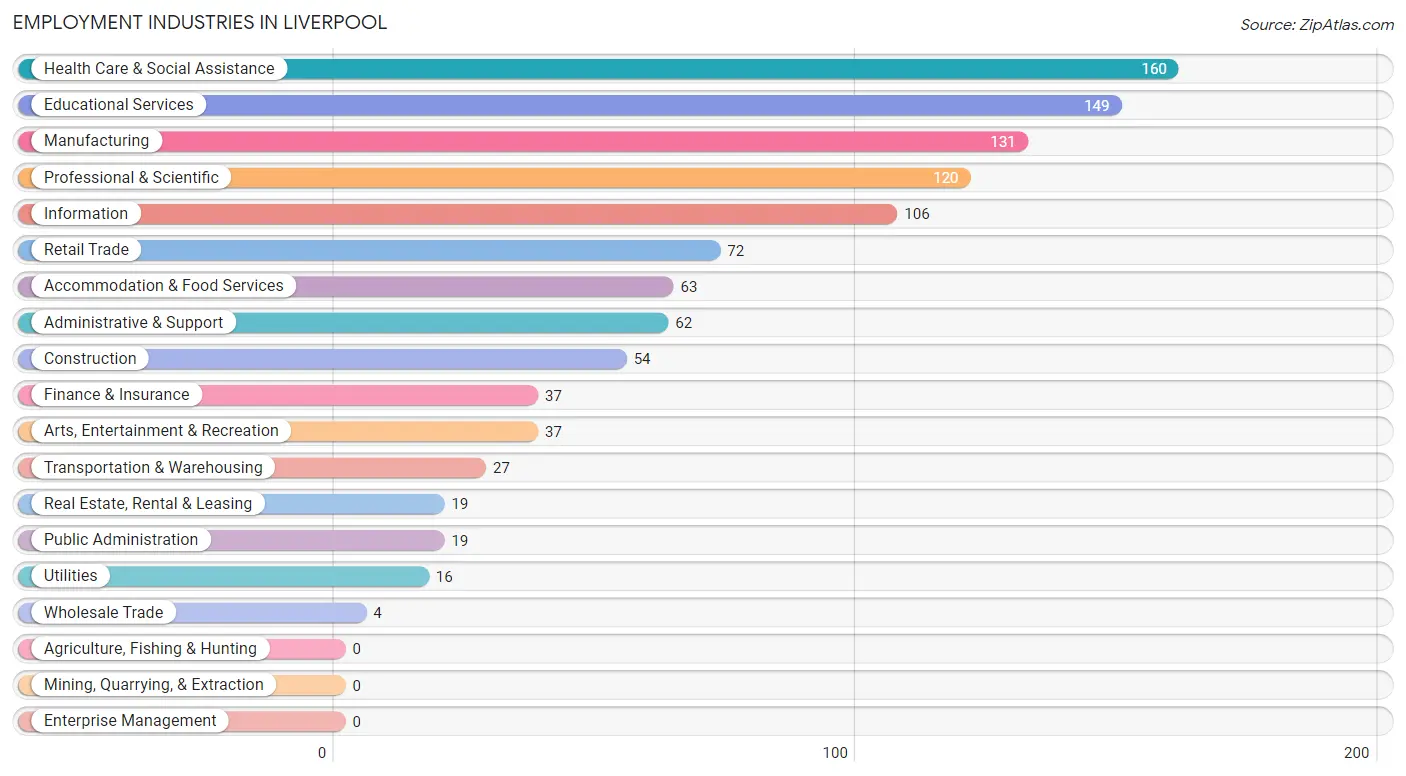
Employment Industries in Liverpool
The major employment industries in Liverpool include Health Care & Social Assistance (160 | 14.3%), Educational Services (149 | 13.3%), Manufacturing (131 | 11.7%), Professional & Scientific (120 | 10.7%), and Information (106 | 9.5%).
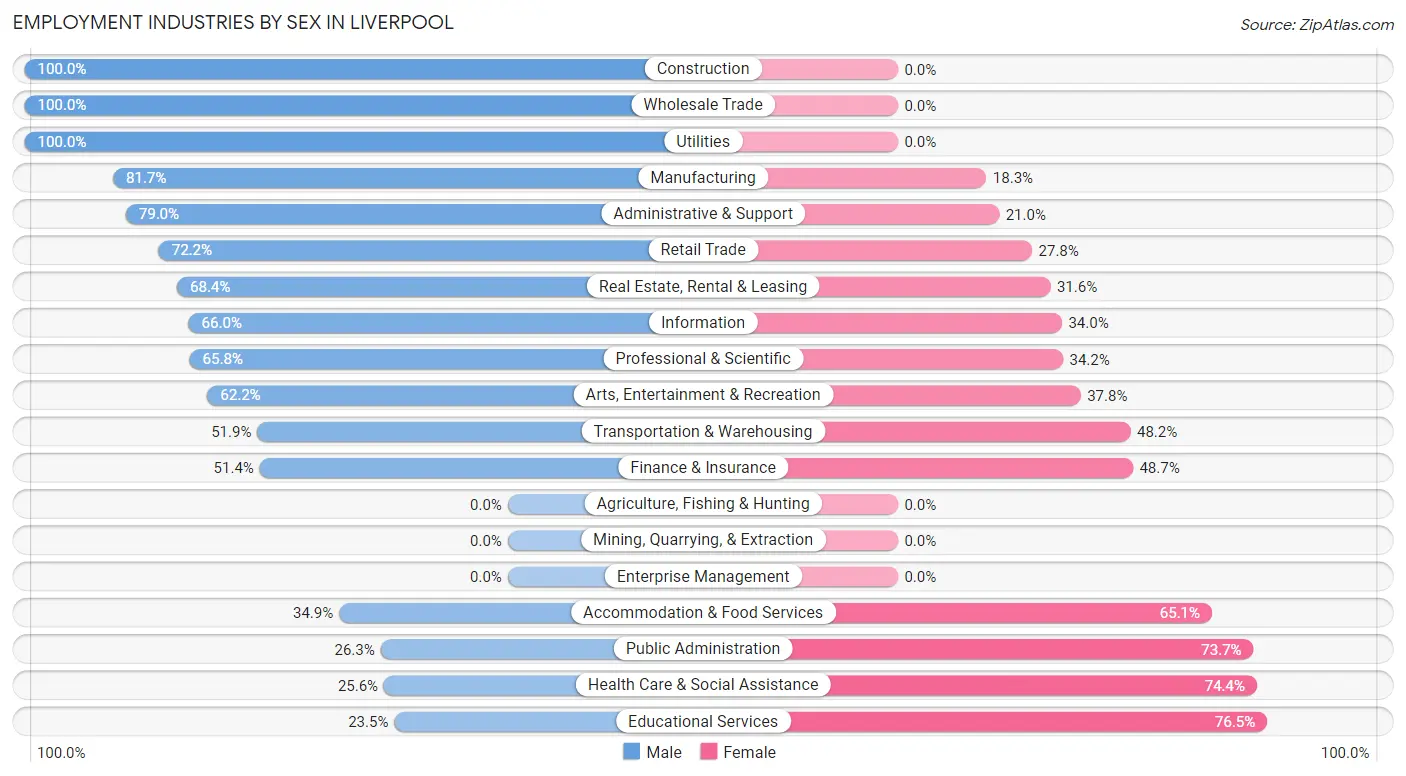
Employment Industries by Sex in Liverpool
The Liverpool industries that see more men than women are Construction (100.0%), Wholesale Trade (100.0%), and Utilities (100.0%), whereas the industries that tend to have a higher number of women are Educational Services (76.5%), Health Care & Social Assistance (74.4%), and Public Administration (73.7%).
| Industry | Male | Female |
| Agriculture, Fishing & Hunting | 0 (0.0%) | 0 (0.0%) |
| Mining, Quarrying, & Extraction | 0 (0.0%) | 0 (0.0%) |
| Construction | 54 (100.0%) | 0 (0.0%) |
| Manufacturing | 107 (81.7%) | 24 (18.3%) |
| Wholesale Trade | 4 (100.0%) | 0 (0.0%) |
| Retail Trade | 52 (72.2%) | 20 (27.8%) |
| Transportation & Warehousing | 14 (51.8%) | 13 (48.1%) |
| Utilities | 16 (100.0%) | 0 (0.0%) |
| Information | 70 (66.0%) | 36 (34.0%) |
| Finance & Insurance | 19 (51.3%) | 18 (48.6%) |
| Real Estate, Rental & Leasing | 13 (68.4%) | 6 (31.6%) |
| Professional & Scientific | 79 (65.8%) | 41 (34.2%) |
| Enterprise Management | 0 (0.0%) | 0 (0.0%) |
| Administrative & Support | 49 (79.0%) | 13 (21.0%) |
| Educational Services | 35 (23.5%) | 114 (76.5%) |
| Health Care & Social Assistance | 41 (25.6%) | 119 (74.4%) |
| Arts, Entertainment & Recreation | 23 (62.2%) | 14 (37.8%) |
| Accommodation & Food Services | 22 (34.9%) | 41 (65.1%) |
| Public Administration | 5 (26.3%) | 14 (73.7%) |
| Total | 621 (55.4%) | 500 (44.6%) |
Education in Liverpool
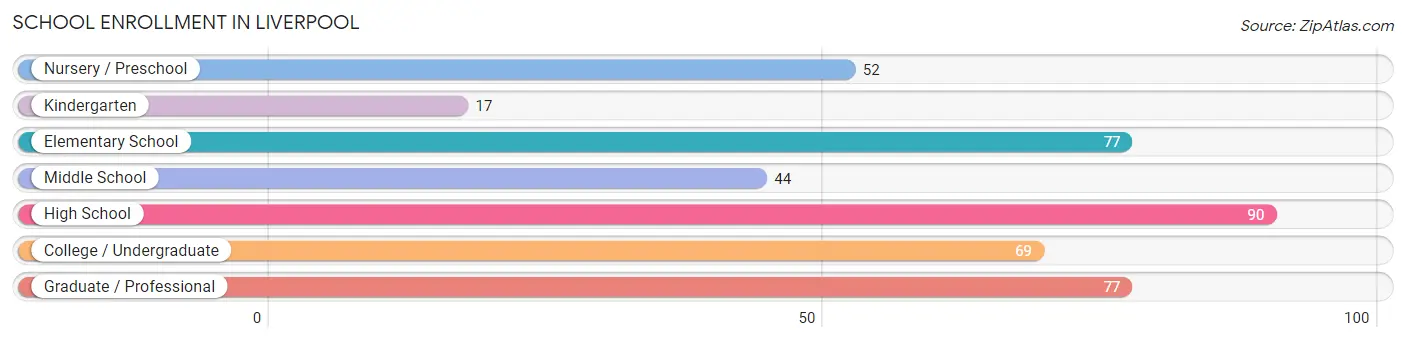
School Enrollment in Liverpool
The most common levels of schooling among the 426 students in Liverpool are high school (90 | 21.1%), elementary school (77 | 18.1%), and graduate / professional (77 | 18.1%).
| School Level | # Students | % Students |
| Nursery / Preschool | 52 | 12.2% |
| Kindergarten | 17 | 4.0% |
| Elementary School | 77 | 18.1% |
| Middle School | 44 | 10.3% |
| High School | 90 | 21.1% |
| College / Undergraduate | 69 | 16.2% |
| Graduate / Professional | 77 | 18.1% |
| Total | 426 | 100.0% |
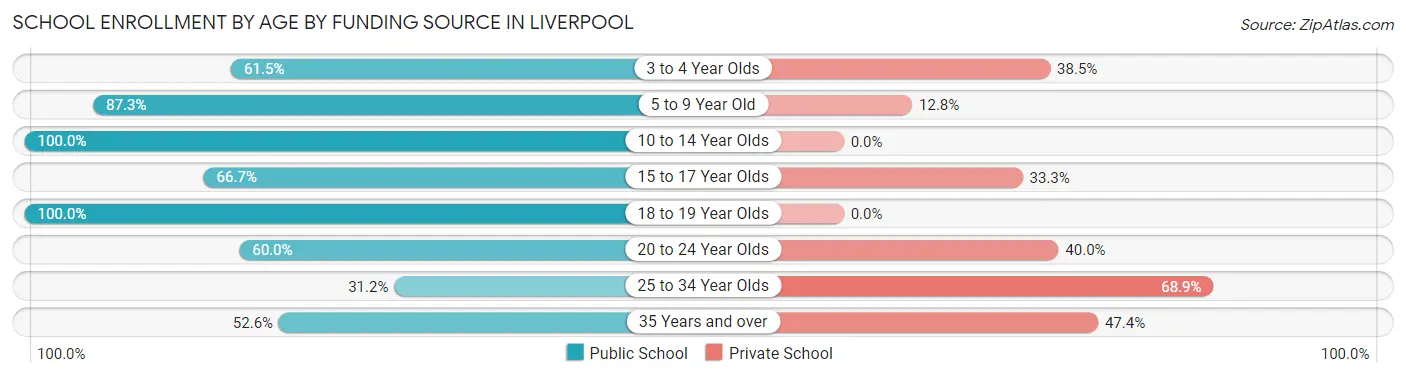
School Enrollment by Age by Funding Source in Liverpool
Out of a total of 426 students who are enrolled in schools in Liverpool, 124 (29.1%) attend a private institution, while the remaining 302 (70.9%) are enrolled in public schools. The age group of 25 to 34 year olds has the highest likelihood of being enrolled in private schools, with 42 (68.9% in the age bracket) enrolled. Conversely, the age group of 10 to 14 year olds has the lowest likelihood of being enrolled in a private school, with 73 (100.0% in the age bracket) attending a public institution.
| Age Bracket | Public School | Private School |
| 3 to 4 Year Olds | 24 (61.5%) | 15 (38.5%) |
| 5 to 9 Year Old | 89 (87.3%) | 13 (12.8%) |
| 10 to 14 Year Olds | 73 (100.0%) | 0 (0.0%) |
| 15 to 17 Year Olds | 44 (66.7%) | 22 (33.3%) |
| 18 to 19 Year Olds | 12 (100.0%) | 0 (0.0%) |
| 20 to 24 Year Olds | 21 (60.0%) | 14 (40.0%) |
| 25 to 34 Year Olds | 19 (31.1%) | 42 (68.9%) |
| 35 Years and over | 20 (52.6%) | 18 (47.4%) |
| Total | 302 (70.9%) | 124 (29.1%) |
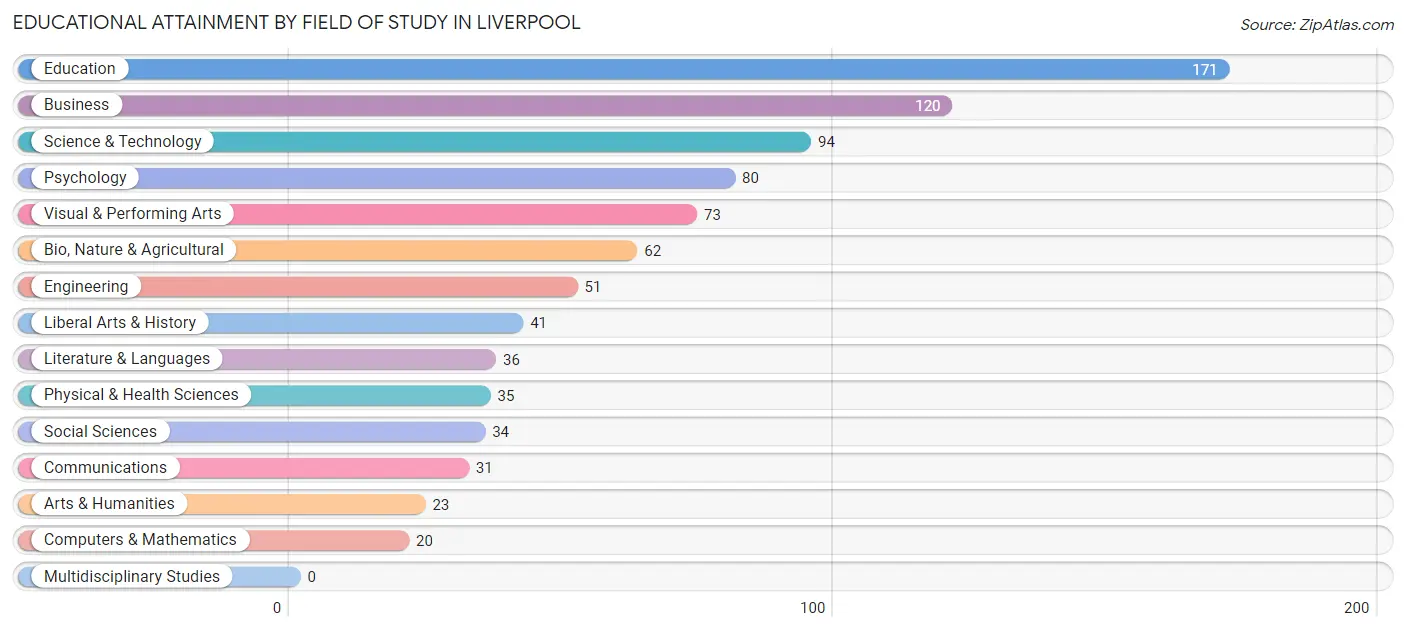
Educational Attainment by Field of Study in Liverpool
Education (171 | 19.6%), business (120 | 13.8%), science & technology (94 | 10.8%), psychology (80 | 9.2%), and visual & performing arts (73 | 8.4%) are the most common fields of study among 871 individuals in Liverpool who have obtained a bachelor's degree or higher.
| Field of Study | # Graduates | % Graduates |
| Computers & Mathematics | 20 | 2.3% |
| Bio, Nature & Agricultural | 62 | 7.1% |
| Physical & Health Sciences | 35 | 4.0% |
| Psychology | 80 | 9.2% |
| Social Sciences | 34 | 3.9% |
| Engineering | 51 | 5.9% |
| Multidisciplinary Studies | 0 | 0.0% |
| Science & Technology | 94 | 10.8% |
| Business | 120 | 13.8% |
| Education | 171 | 19.6% |
| Literature & Languages | 36 | 4.1% |
| Liberal Arts & History | 41 | 4.7% |
| Visual & Performing Arts | 73 | 8.4% |
| Communications | 31 | 3.6% |
| Arts & Humanities | 23 | 2.6% |
| Total | 871 | 100.0% |
Transportation & Commute in Liverpool
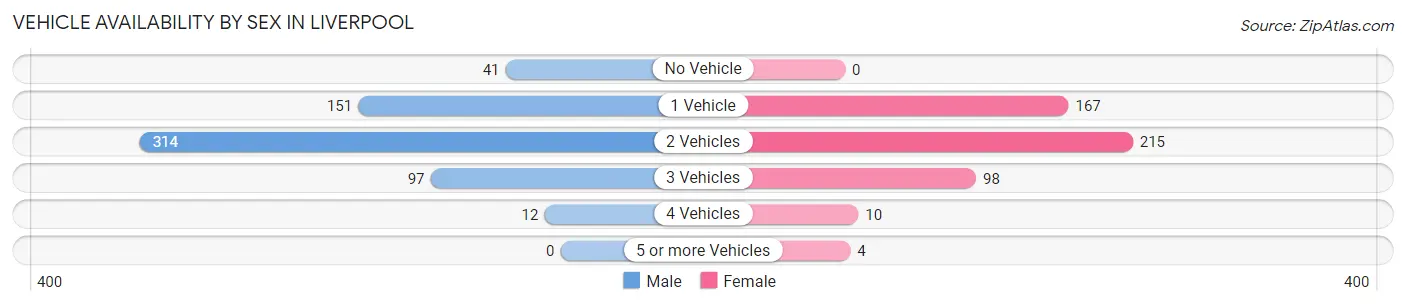
Vehicle Availability by Sex in Liverpool
The most prevalent vehicle ownership categories in Liverpool are males with 2 vehicles (314, accounting for 51.1%) and females with 2 vehicles (215, making up 63.6%).
| Vehicles Available | Male | Female |
| No Vehicle | 41 (6.7%) | 0 (0.0%) |
| 1 Vehicle | 151 (24.5%) | 167 (33.8%) |
| 2 Vehicles | 314 (51.1%) | 215 (43.5%) |
| 3 Vehicles | 97 (15.8%) | 98 (19.8%) |
| 4 Vehicles | 12 (1.9%) | 10 (2.0%) |
| 5 or more Vehicles | 0 (0.0%) | 4 (0.8%) |
| Total | 615 (100.0%) | 494 (100.0%) |
Commute Time in Liverpool
The most frequently occuring commute durations in Liverpool are 15 to 19 minutes (334 commuters, 35.3%), 10 to 14 minutes (203 commuters, 21.5%), and 20 to 24 minutes (143 commuters, 15.1%).
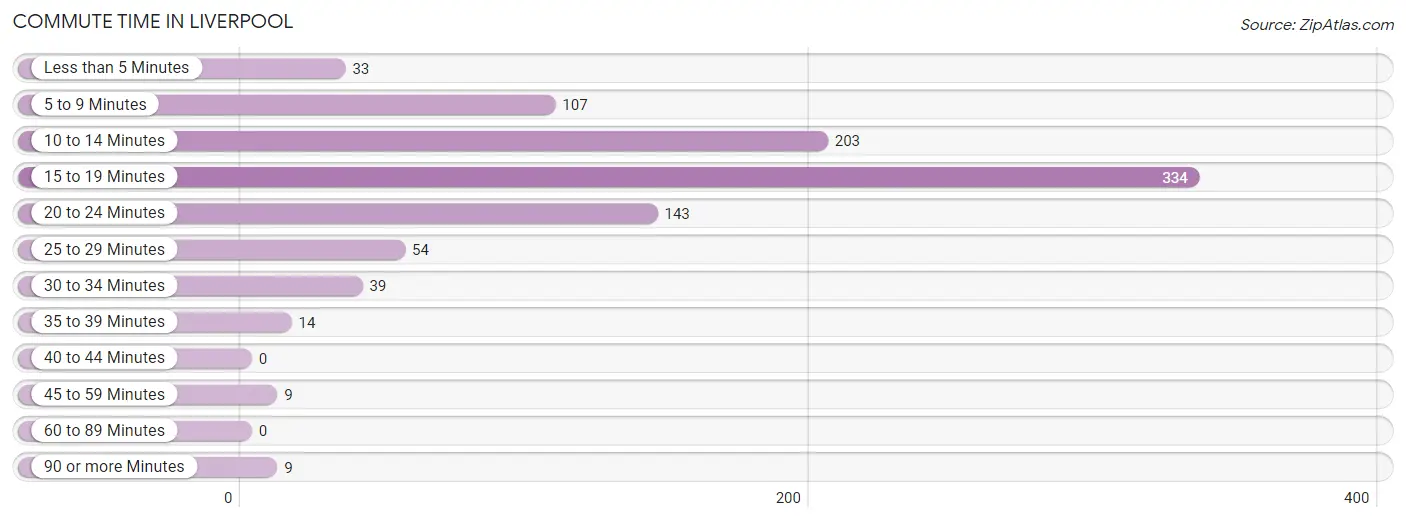
| Commute Time | # Commuters | % Commuters |
| Less than 5 Minutes | 33 | 3.5% |
| 5 to 9 Minutes | 107 | 11.3% |
| 10 to 14 Minutes | 203 | 21.5% |
| 15 to 19 Minutes | 334 | 35.3% |
| 20 to 24 Minutes | 143 | 15.1% |
| 25 to 29 Minutes | 54 | 5.7% |
| 30 to 34 Minutes | 39 | 4.1% |
| 35 to 39 Minutes | 14 | 1.5% |
| 40 to 44 Minutes | 0 | 0.0% |
| 45 to 59 Minutes | 9 | 0.9% |
| 60 to 89 Minutes | 0 | 0.0% |
| 90 or more Minutes | 9 | 0.9% |
Commute Time by Sex in Liverpool
The most common commute times in Liverpool are 15 to 19 minutes (190 commuters, 36.5%) for males and 15 to 19 minutes (144 commuters, 33.9%) for females.
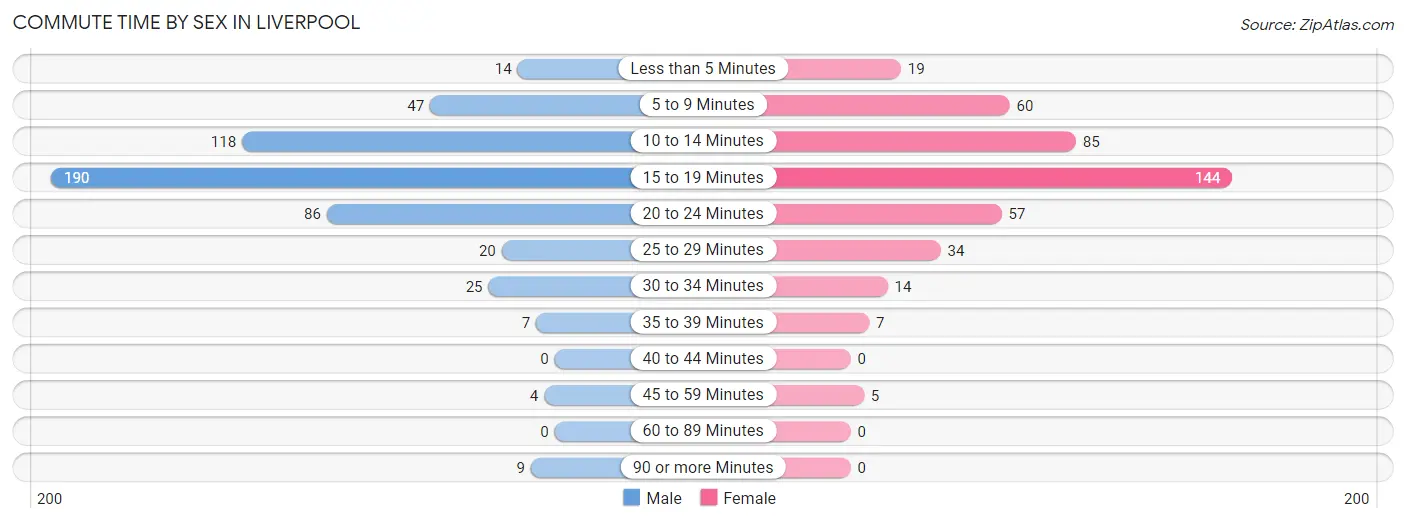
| Commute Time | Male | Female |
| Less than 5 Minutes | 14 (2.7%) | 19 (4.5%) |
| 5 to 9 Minutes | 47 (9.0%) | 60 (14.1%) |
| 10 to 14 Minutes | 118 (22.7%) | 85 (20.0%) |
| 15 to 19 Minutes | 190 (36.5%) | 144 (33.9%) |
| 20 to 24 Minutes | 86 (16.5%) | 57 (13.4%) |
| 25 to 29 Minutes | 20 (3.8%) | 34 (8.0%) |
| 30 to 34 Minutes | 25 (4.8%) | 14 (3.3%) |
| 35 to 39 Minutes | 7 (1.3%) | 7 (1.7%) |
| 40 to 44 Minutes | 0 (0.0%) | 0 (0.0%) |
| 45 to 59 Minutes | 4 (0.8%) | 5 (1.2%) |
| 60 to 89 Minutes | 0 (0.0%) | 0 (0.0%) |
| 90 or more Minutes | 9 (1.7%) | 0 (0.0%) |
Time of Departure to Work by Sex in Liverpool
The most frequent times of departure to work in Liverpool are 8:00 AM to 8:29 AM (84, 16.2%) for males and 7:00 AM to 7:29 AM (99, 23.3%) for females.
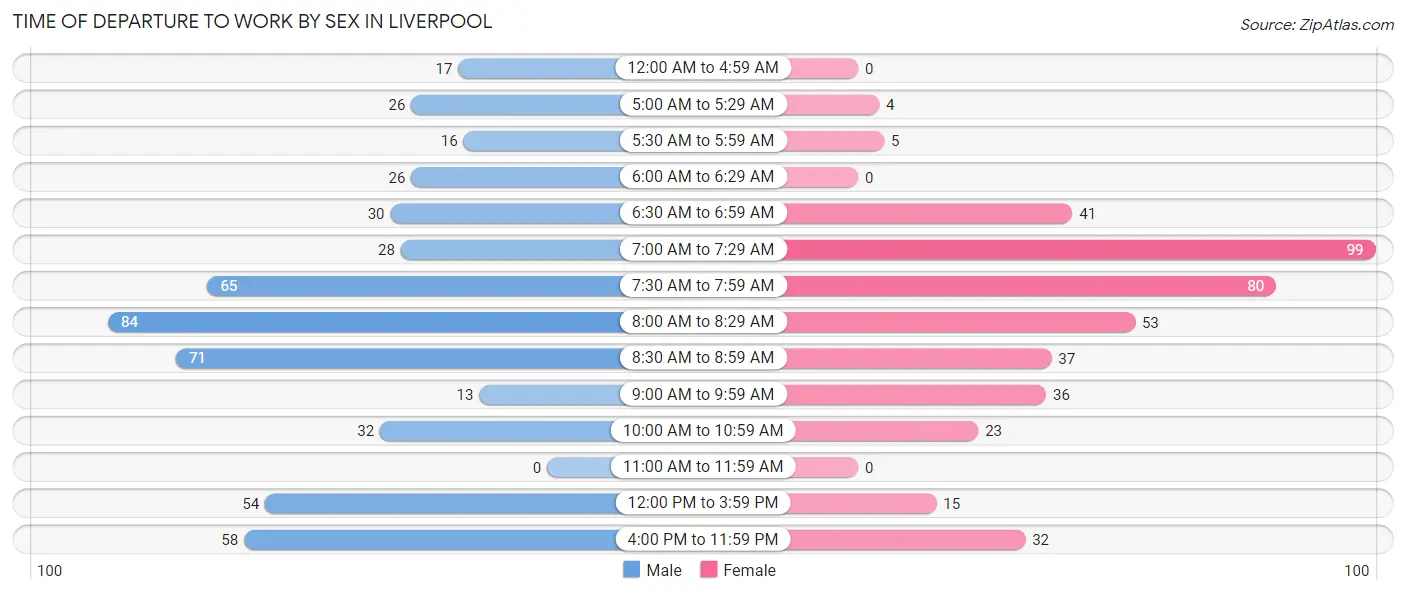
| Time of Departure | Male | Female |
| 12:00 AM to 4:59 AM | 17 (3.3%) | 0 (0.0%) |
| 5:00 AM to 5:29 AM | 26 (5.0%) | 4 (0.9%) |
| 5:30 AM to 5:59 AM | 16 (3.1%) | 5 (1.2%) |
| 6:00 AM to 6:29 AM | 26 (5.0%) | 0 (0.0%) |
| 6:30 AM to 6:59 AM | 30 (5.8%) | 41 (9.7%) |
| 7:00 AM to 7:29 AM | 28 (5.4%) | 99 (23.3%) |
| 7:30 AM to 7:59 AM | 65 (12.5%) | 80 (18.8%) |
| 8:00 AM to 8:29 AM | 84 (16.2%) | 53 (12.5%) |
| 8:30 AM to 8:59 AM | 71 (13.7%) | 37 (8.7%) |
| 9:00 AM to 9:59 AM | 13 (2.5%) | 36 (8.5%) |
| 10:00 AM to 10:59 AM | 32 (6.1%) | 23 (5.4%) |
| 11:00 AM to 11:59 AM | 0 (0.0%) | 0 (0.0%) |
| 12:00 PM to 3:59 PM | 54 (10.4%) | 15 (3.5%) |
| 4:00 PM to 11:59 PM | 58 (11.2%) | 32 (7.5%) |
| Total | 520 (100.0%) | 425 (100.0%) |
Housing Occupancy in Liverpool
Occupancy by Ownership in Liverpool
Of the total 1,118 dwellings in Liverpool, owner-occupied units account for 712 (63.7%), while renter-occupied units make up 406 (36.3%).
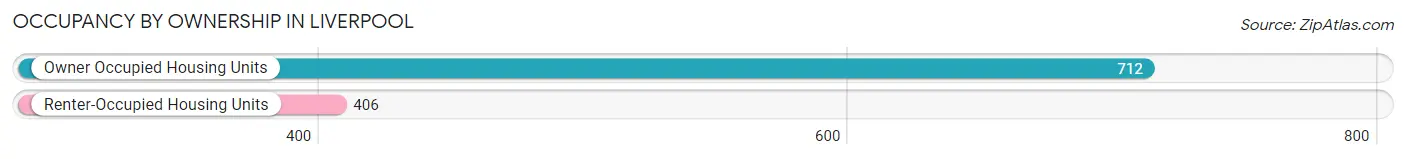
| Occupancy | # Housing Units | % Housing Units |
| Owner Occupied Housing Units | 712 | 63.7% |
| Renter-Occupied Housing Units | 406 | 36.3% |
| Total Occupied Housing Units | 1,118 | 100.0% |
Occupancy by Household Size in Liverpool
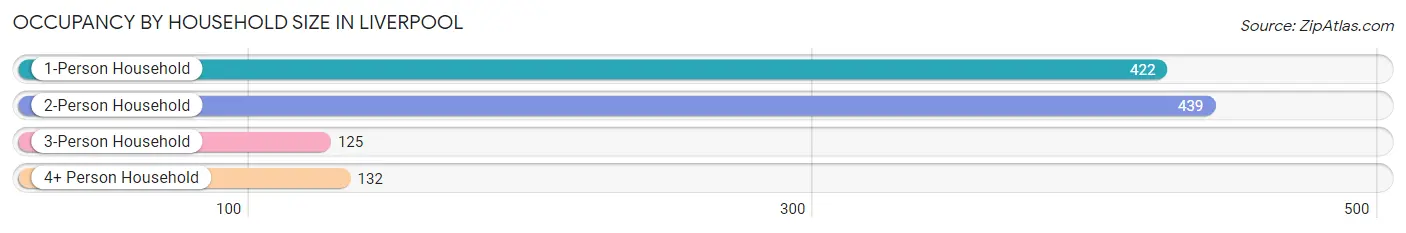
| Household Size | # Housing Units | % Housing Units |
| 1-Person Household | 422 | 37.8% |
| 2-Person Household | 439 | 39.3% |
| 3-Person Household | 125 | 11.2% |
| 4+ Person Household | 132 | 11.8% |
| Total Housing Units | 1,118 | 100.0% |
Occupancy by Ownership by Household Size in Liverpool
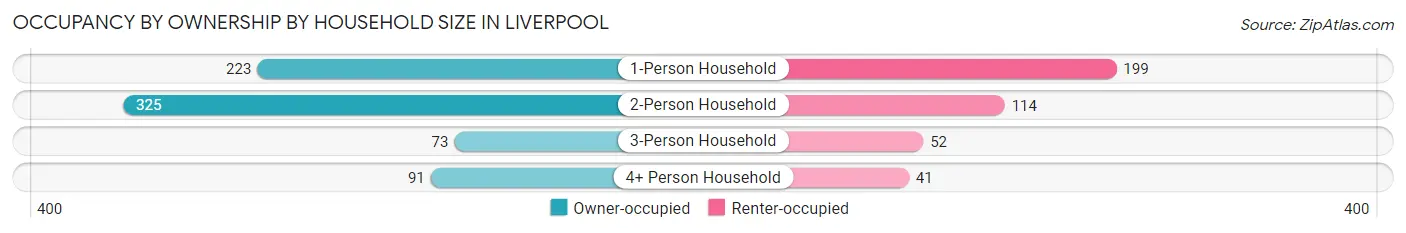
| Household Size | Owner-occupied | Renter-occupied |
| 1-Person Household | 223 (52.8%) | 199 (47.2%) |
| 2-Person Household | 325 (74.0%) | 114 (26.0%) |
| 3-Person Household | 73 (58.4%) | 52 (41.6%) |
| 4+ Person Household | 91 (68.9%) | 41 (31.1%) |
| Total Housing Units | 712 (63.7%) | 406 (36.3%) |
Occupancy by Educational Attainment in Liverpool
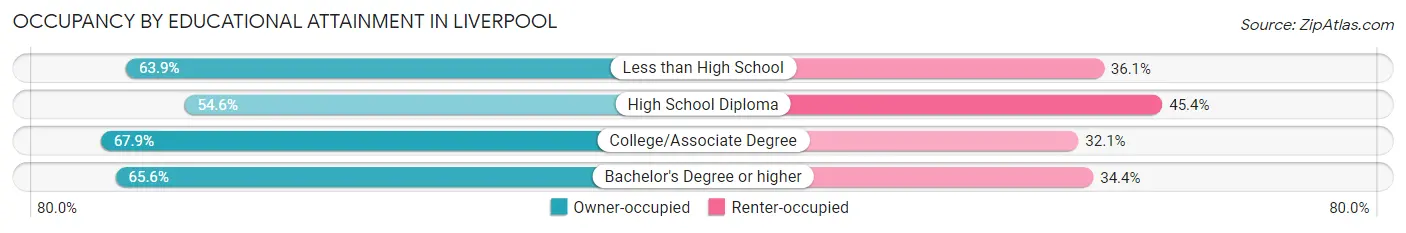
| Household Size | Owner-occupied | Renter-occupied |
| Less than High School | 23 (63.9%) | 13 (36.1%) |
| High School Diploma | 136 (54.6%) | 113 (45.4%) |
| College/Associate Degree | 199 (67.9%) | 94 (32.1%) |
| Bachelor's Degree or higher | 354 (65.6%) | 186 (34.4%) |
Occupancy by Age of Householder in Liverpool
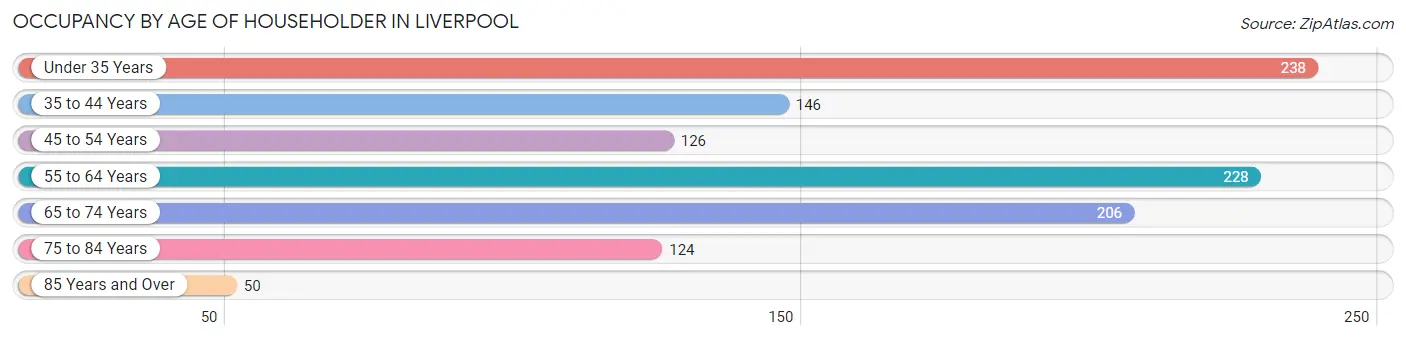
| Age Bracket | # Households | % Households |
| Under 35 Years | 238 | 21.3% |
| 35 to 44 Years | 146 | 13.1% |
| 45 to 54 Years | 126 | 11.3% |
| 55 to 64 Years | 228 | 20.4% |
| 65 to 74 Years | 206 | 18.4% |
| 75 to 84 Years | 124 | 11.1% |
| 85 Years and Over | 50 | 4.5% |
| Total | 1,118 | 100.0% |
Housing Finances in Liverpool
Median Income by Occupancy in Liverpool
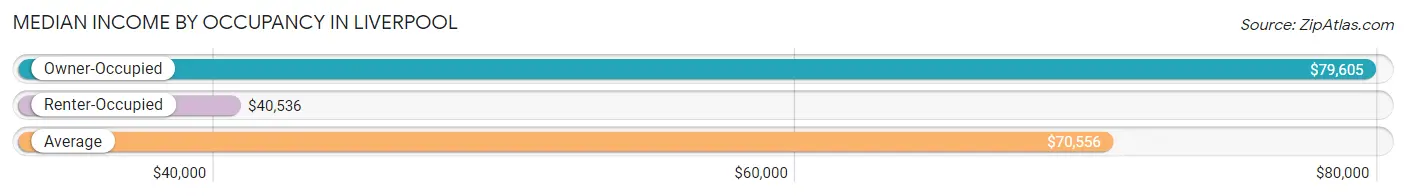
| Occupancy Type | # Households | Median Income |
| Owner-Occupied | 712 (63.7%) | $79,605 |
| Renter-Occupied | 406 (36.3%) | $40,536 |
| Average | 1,118 (100.0%) | $70,556 |
Occupancy by Householder Income Bracket in Liverpool
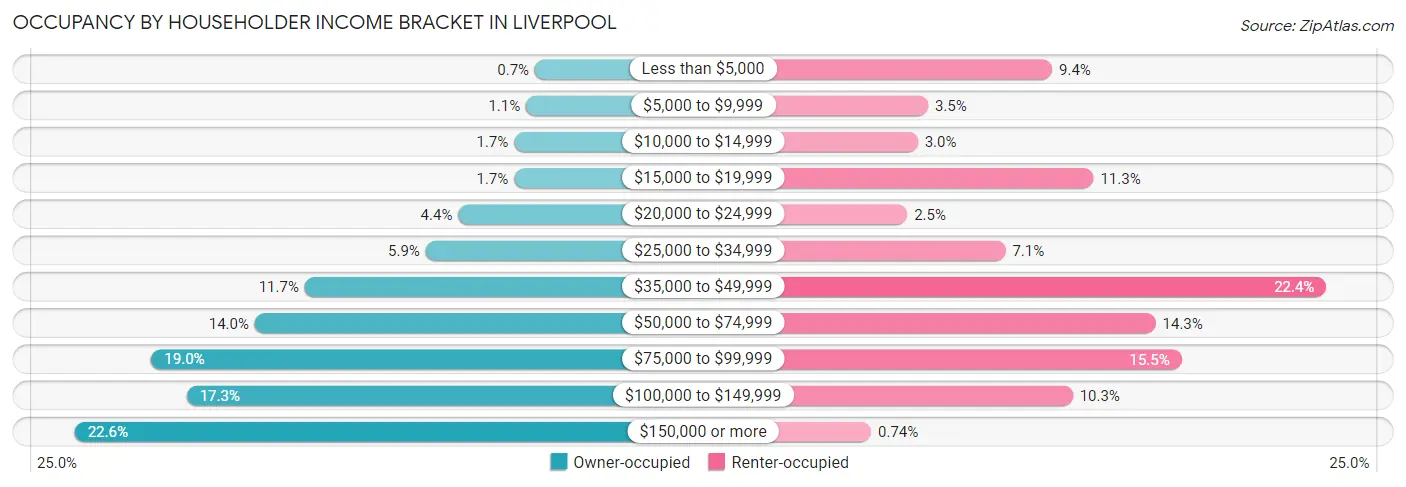
| Income Bracket | Owner-occupied | Renter-occupied |
| Less than $5,000 | 5 (0.7%) | 38 (9.4%) |
| $5,000 to $9,999 | 8 (1.1%) | 14 (3.5%) |
| $10,000 to $14,999 | 12 (1.7%) | 12 (3.0%) |
| $15,000 to $19,999 | 12 (1.7%) | 46 (11.3%) |
| $20,000 to $24,999 | 31 (4.3%) | 10 (2.5%) |
| $25,000 to $34,999 | 42 (5.9%) | 29 (7.1%) |
| $35,000 to $49,999 | 83 (11.7%) | 91 (22.4%) |
| $50,000 to $74,999 | 100 (14.0%) | 58 (14.3%) |
| $75,000 to $99,999 | 135 (19.0%) | 63 (15.5%) |
| $100,000 to $149,999 | 123 (17.3%) | 42 (10.3%) |
| $150,000 or more | 161 (22.6%) | 3 (0.7%) |
| Total | 712 (100.0%) | 406 (100.0%) |
Monthly Housing Cost Tiers in Liverpool
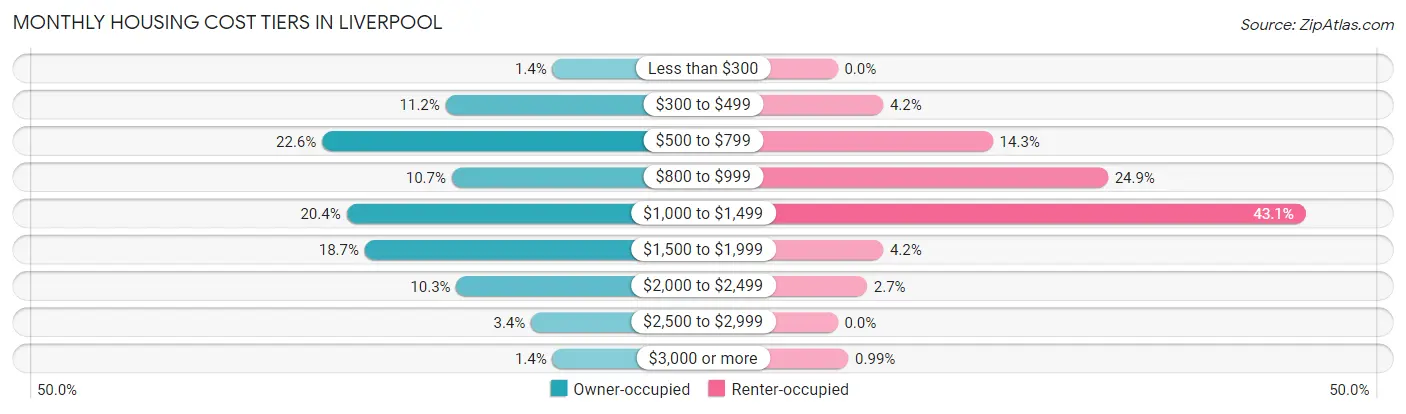
| Monthly Cost | Owner-occupied | Renter-occupied |
| Less than $300 | 10 (1.4%) | 0 (0.0%) |
| $300 to $499 | 80 (11.2%) | 17 (4.2%) |
| $500 to $799 | 161 (22.6%) | 58 (14.3%) |
| $800 to $999 | 76 (10.7%) | 101 (24.9%) |
| $1,000 to $1,499 | 145 (20.4%) | 175 (43.1%) |
| $1,500 to $1,999 | 133 (18.7%) | 17 (4.2%) |
| $2,000 to $2,499 | 73 (10.2%) | 11 (2.7%) |
| $2,500 to $2,999 | 24 (3.4%) | 0 (0.0%) |
| $3,000 or more | 10 (1.4%) | 4 (1.0%) |
| Total | 712 (100.0%) | 406 (100.0%) |
Physical Housing Characteristics in Liverpool
Housing Structures in Liverpool
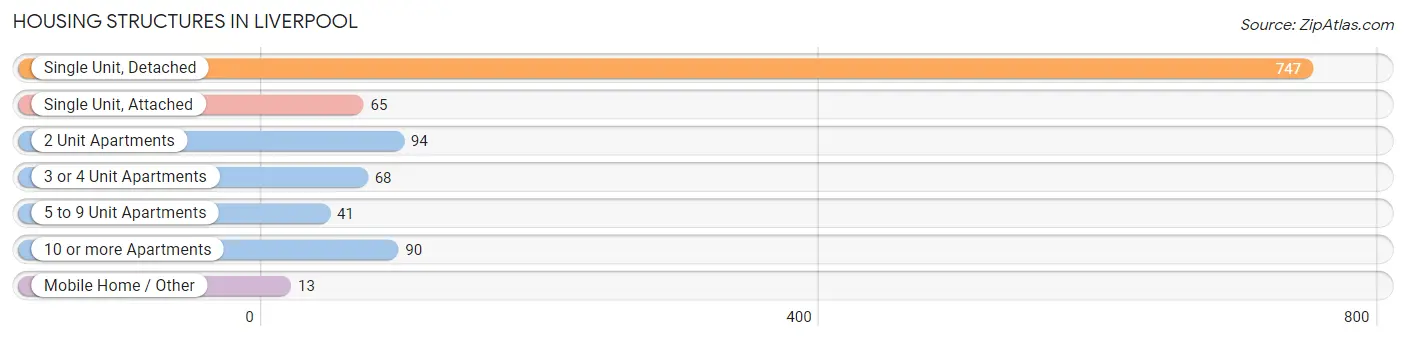
| Structure Type | # Housing Units | % Housing Units |
| Single Unit, Detached | 747 | 66.8% |
| Single Unit, Attached | 65 | 5.8% |
| 2 Unit Apartments | 94 | 8.4% |
| 3 or 4 Unit Apartments | 68 | 6.1% |
| 5 to 9 Unit Apartments | 41 | 3.7% |
| 10 or more Apartments | 90 | 8.1% |
| Mobile Home / Other | 13 | 1.2% |
| Total | 1,118 | 100.0% |
Housing Structures by Occupancy in Liverpool
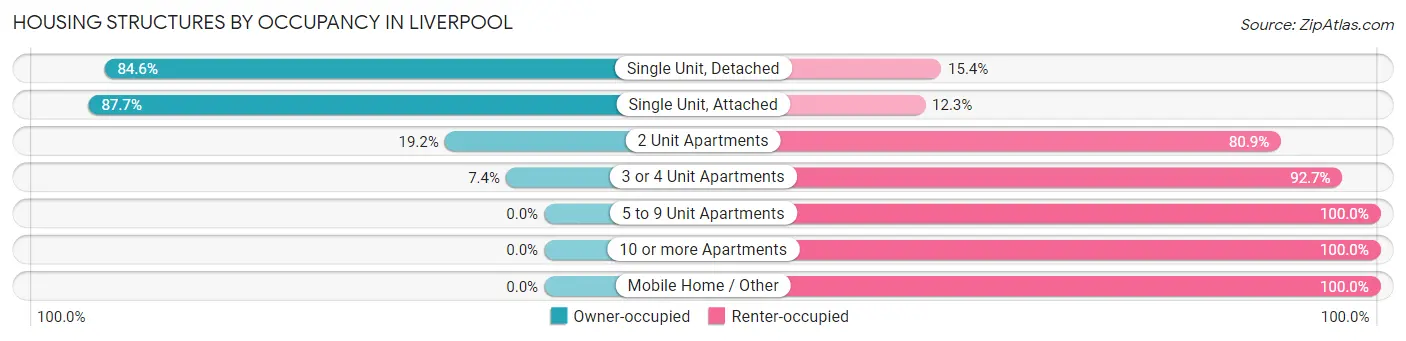
| Structure Type | Owner-occupied | Renter-occupied |
| Single Unit, Detached | 632 (84.6%) | 115 (15.4%) |
| Single Unit, Attached | 57 (87.7%) | 8 (12.3%) |
| 2 Unit Apartments | 18 (19.2%) | 76 (80.8%) |
| 3 or 4 Unit Apartments | 5 (7.3%) | 63 (92.6%) |
| 5 to 9 Unit Apartments | 0 (0.0%) | 41 (100.0%) |
| 10 or more Apartments | 0 (0.0%) | 90 (100.0%) |
| Mobile Home / Other | 0 (0.0%) | 13 (100.0%) |
| Total | 712 (63.7%) | 406 (36.3%) |
Housing Structures by Number of Rooms in Liverpool
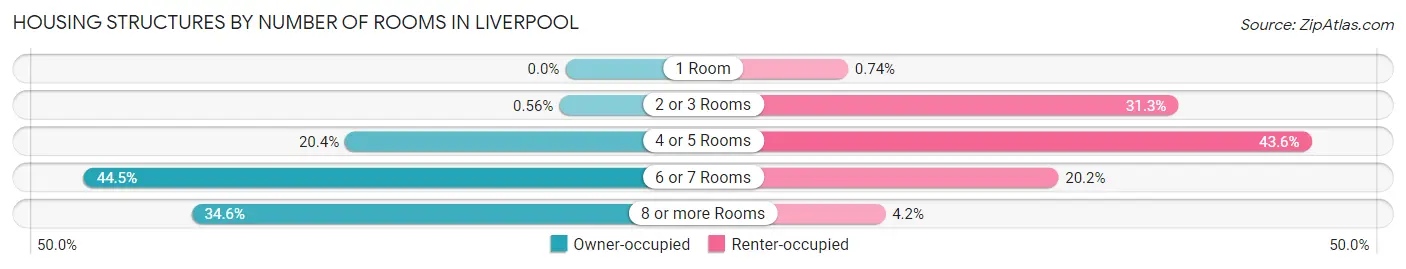
| Number of Rooms | Owner-occupied | Renter-occupied |
| 1 Room | 0 (0.0%) | 3 (0.7%) |
| 2 or 3 Rooms | 4 (0.6%) | 127 (31.3%) |
| 4 or 5 Rooms | 145 (20.4%) | 177 (43.6%) |
| 6 or 7 Rooms | 317 (44.5%) | 82 (20.2%) |
| 8 or more Rooms | 246 (34.5%) | 17 (4.2%) |
| Total | 712 (100.0%) | 406 (100.0%) |
Housing Structure by Heating Type in Liverpool
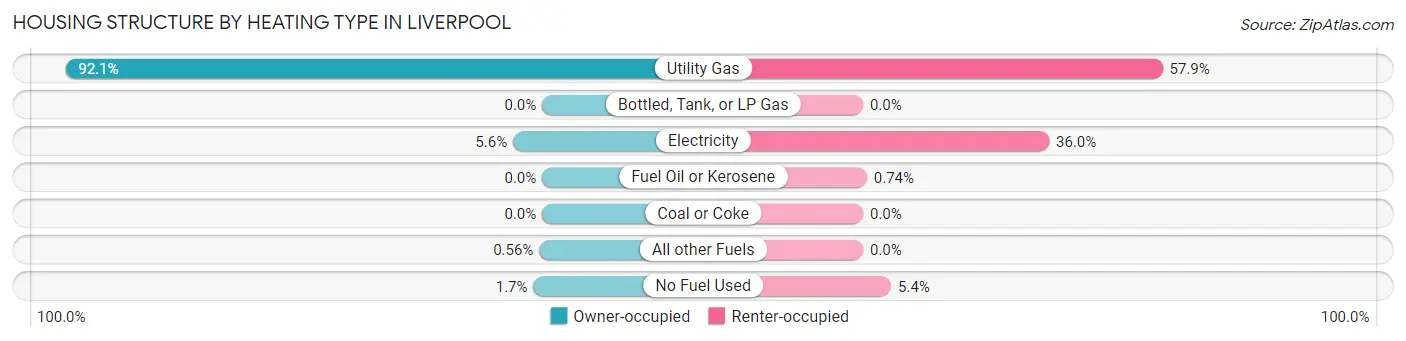
| Heating Type | Owner-occupied | Renter-occupied |
| Utility Gas | 656 (92.1%) | 235 (57.9%) |
| Bottled, Tank, or LP Gas | 0 (0.0%) | 0 (0.0%) |
| Electricity | 40 (5.6%) | 146 (36.0%) |
| Fuel Oil or Kerosene | 0 (0.0%) | 3 (0.7%) |
| Coal or Coke | 0 (0.0%) | 0 (0.0%) |
| All other Fuels | 4 (0.6%) | 0 (0.0%) |
| No Fuel Used | 12 (1.7%) | 22 (5.4%) |
| Total | 712 (100.0%) | 406 (100.0%) |
Household Vehicle Usage in Liverpool
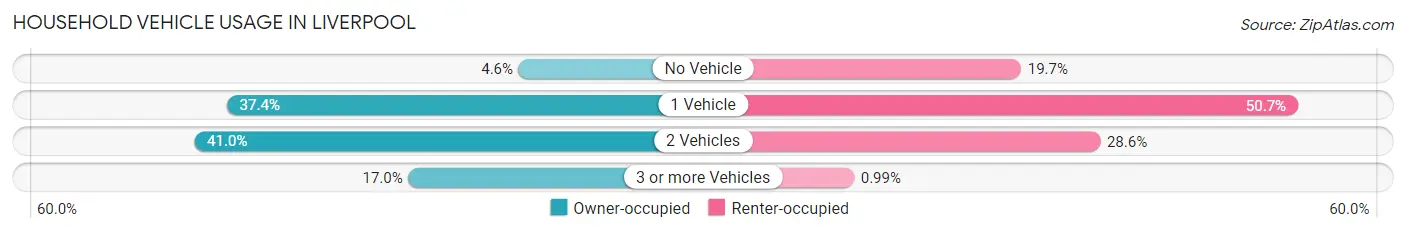
| Vehicles per Household | Owner-occupied | Renter-occupied |
| No Vehicle | 33 (4.6%) | 80 (19.7%) |
| 1 Vehicle | 266 (37.4%) | 206 (50.7%) |
| 2 Vehicles | 292 (41.0%) | 116 (28.6%) |
| 3 or more Vehicles | 121 (17.0%) | 4 (1.0%) |
| Total | 712 (100.0%) | 406 (100.0%) |
Real Estate & Mortgages in Liverpool
Real Estate and Mortgage Overview in Liverpool
| Characteristic | Without Mortgage | With Mortgage |
| Housing Units | 361 | 351 |
| Median Property Value | $146,500 | $170,700 |
| Median Household Income | $71,250 | $109 |
| Monthly Housing Costs | $683 | $10 |
| Real Estate Taxes | $5,121 | $4 |
Property Value by Mortgage Status in Liverpool
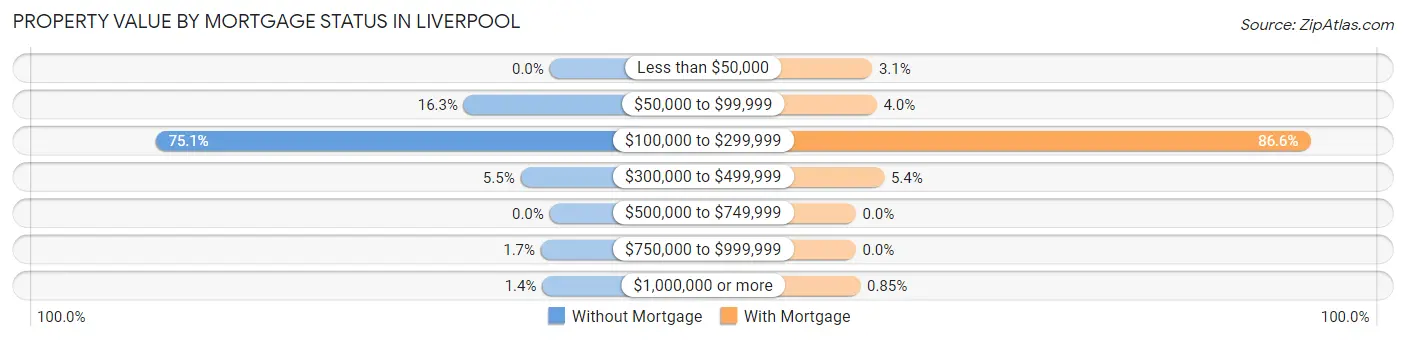
| Property Value | Without Mortgage | With Mortgage |
| Less than $50,000 | 0 (0.0%) | 11 (3.1%) |
| $50,000 to $99,999 | 59 (16.3%) | 14 (4.0%) |
| $100,000 to $299,999 | 271 (75.1%) | 304 (86.6%) |
| $300,000 to $499,999 | 20 (5.5%) | 19 (5.4%) |
| $500,000 to $749,999 | 0 (0.0%) | 0 (0.0%) |
| $750,000 to $999,999 | 6 (1.7%) | 0 (0.0%) |
| $1,000,000 or more | 5 (1.4%) | 3 (0.9%) |
| Total | 361 (100.0%) | 351 (100.0%) |
Household Income by Mortgage Status in Liverpool
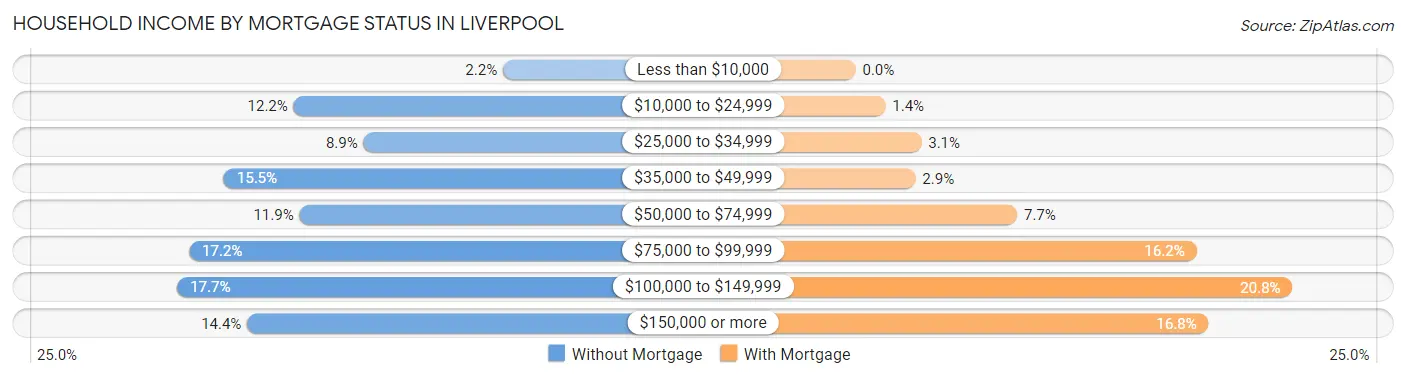
| Household Income | Without Mortgage | With Mortgage |
| Less than $10,000 | 8 (2.2%) | 0 (0.0%) |
| $10,000 to $24,999 | 44 (12.2%) | 5 (1.4%) |
| $25,000 to $34,999 | 32 (8.9%) | 11 (3.1%) |
| $35,000 to $49,999 | 56 (15.5%) | 10 (2.9%) |
| $50,000 to $74,999 | 43 (11.9%) | 27 (7.7%) |
| $75,000 to $99,999 | 62 (17.2%) | 57 (16.2%) |
| $100,000 to $149,999 | 64 (17.7%) | 73 (20.8%) |
| $150,000 or more | 52 (14.4%) | 59 (16.8%) |
| Total | 361 (100.0%) | 351 (100.0%) |
Property Value to Household Income Ratio in Liverpool
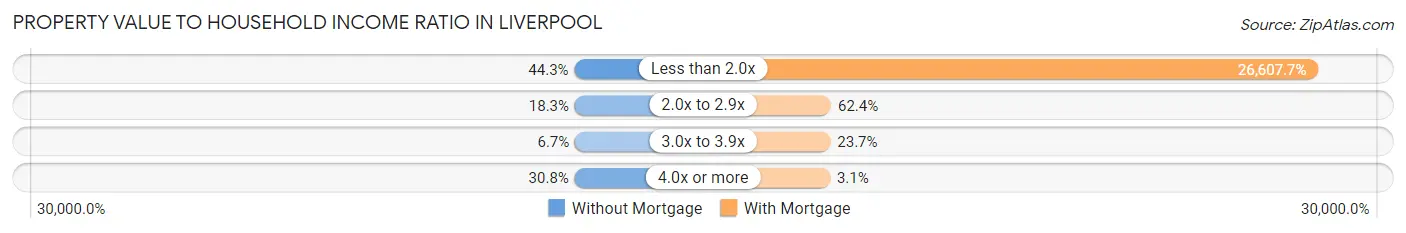
| Value-to-Income Ratio | Without Mortgage | With Mortgage |
| Less than 2.0x | 160 (44.3%) | 93,393 (26,607.7%) |
| 2.0x to 2.9x | 66 (18.3%) | 219 (62.4%) |
| 3.0x to 3.9x | 24 (6.7%) | 83 (23.6%) |
| 4.0x or more | 111 (30.7%) | 11 (3.1%) |
| Total | 361 (100.0%) | 351 (100.0%) |
Real Estate Taxes by Mortgage Status in Liverpool
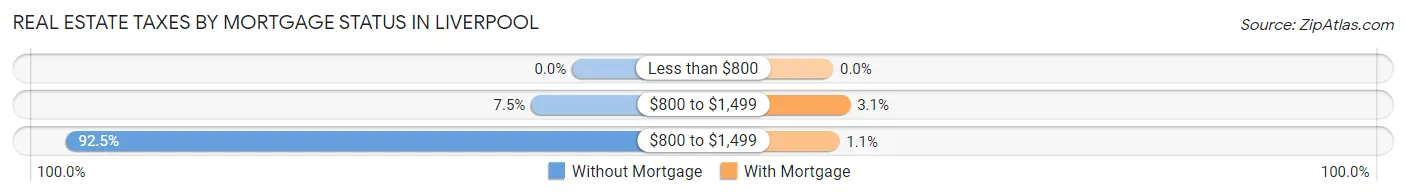
| Property Taxes | Without Mortgage | With Mortgage |
| Less than $800 | 0 (0.0%) | 0 (0.0%) |
| $800 to $1,499 | 27 (7.5%) | 11 (3.1%) |
| $800 to $1,499 | 334 (92.5%) | 4 (1.1%) |
| Total | 361 (100.0%) | 351 (100.0%) |
Health & Disability in Liverpool
Health Insurance Coverage by Age in Liverpool
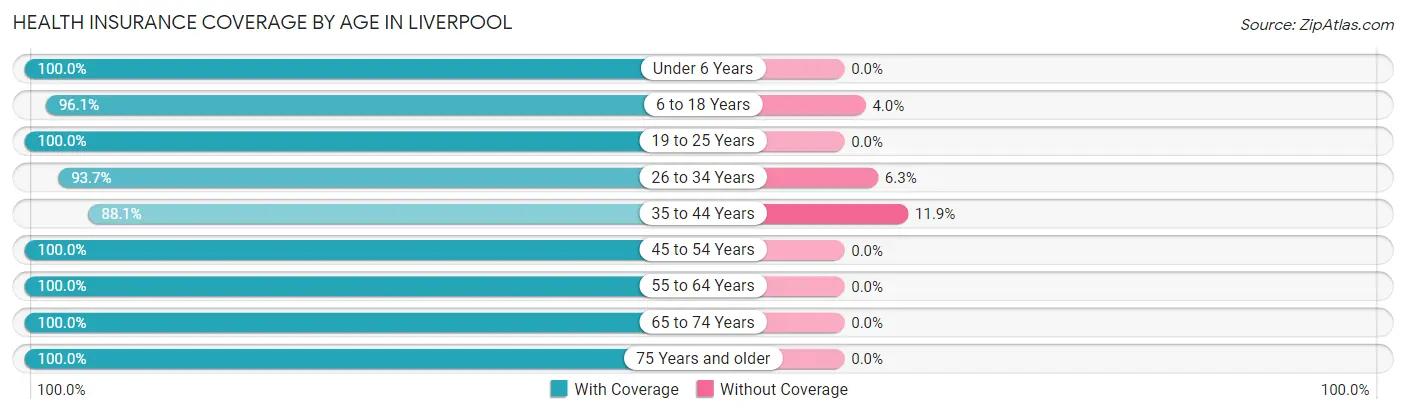
| Age Bracket | With Coverage | Without Coverage |
| Under 6 Years | 168 (100.0%) | 0 (0.0%) |
| 6 to 18 Years | 219 (96.1%) | 9 (4.0%) |
| 19 to 25 Years | 184 (100.0%) | 0 (0.0%) |
| 26 to 34 Years | 329 (93.7%) | 22 (6.3%) |
| 35 to 44 Years | 222 (88.1%) | 30 (11.9%) |
| 45 to 54 Years | 173 (100.0%) | 0 (0.0%) |
| 55 to 64 Years | 384 (100.0%) | 0 (0.0%) |
| 65 to 74 Years | 335 (100.0%) | 0 (0.0%) |
| 75 Years and older | 253 (100.0%) | 0 (0.0%) |
| Total | 2,267 (97.4%) | 61 (2.6%) |
Health Insurance Coverage by Citizenship Status in Liverpool
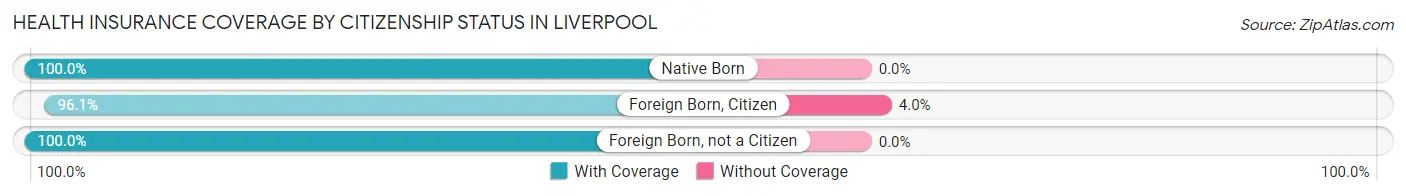
| Citizenship Status | With Coverage | Without Coverage |
| Native Born | 168 (100.0%) | 0 (0.0%) |
| Foreign Born, Citizen | 219 (96.1%) | 9 (4.0%) |
| Foreign Born, not a Citizen | 184 (100.0%) | 0 (0.0%) |
Health Insurance Coverage by Household Income in Liverpool
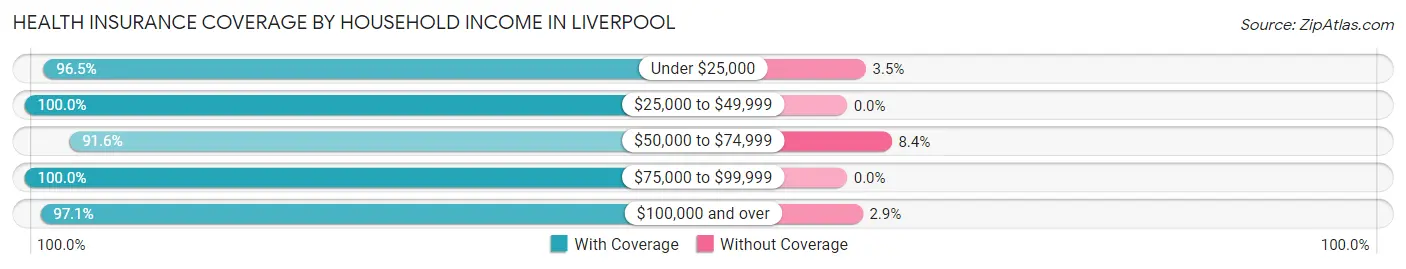
| Household Income | With Coverage | Without Coverage |
| Under $25,000 | 329 (96.5%) | 12 (3.5%) |
| $25,000 to $49,999 | 423 (100.0%) | 0 (0.0%) |
| $50,000 to $74,999 | 241 (91.6%) | 22 (8.4%) |
| $75,000 to $99,999 | 350 (100.0%) | 0 (0.0%) |
| $100,000 and over | 890 (97.1%) | 27 (2.9%) |
Public vs Private Health Insurance Coverage by Age in Liverpool
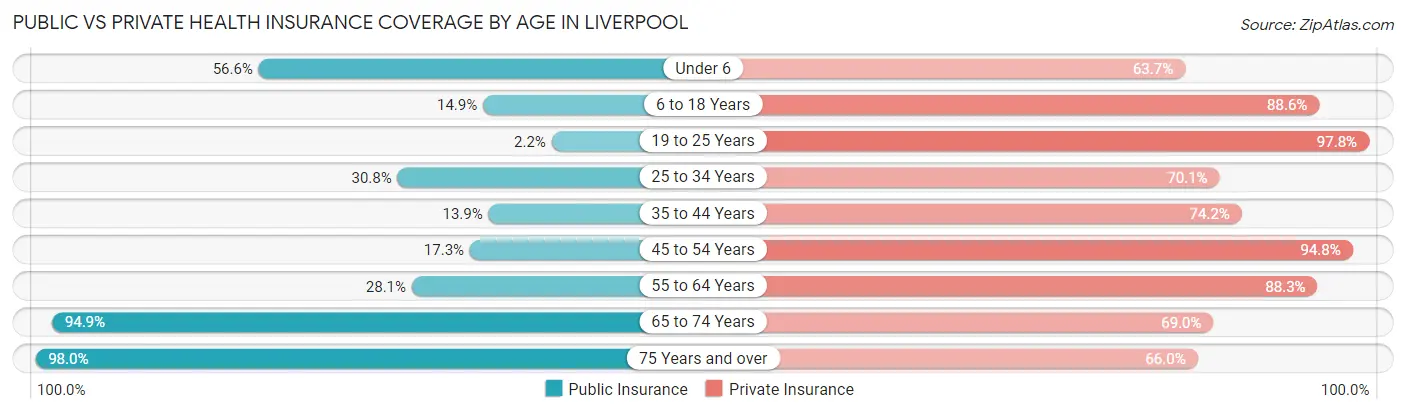
| Age Bracket | Public Insurance | Private Insurance |
| Under 6 | 95 (56.6%) | 107 (63.7%) |
| 6 to 18 Years | 34 (14.9%) | 202 (88.6%) |
| 19 to 25 Years | 4 (2.2%) | 180 (97.8%) |
| 25 to 34 Years | 108 (30.8%) | 246 (70.1%) |
| 35 to 44 Years | 35 (13.9%) | 187 (74.2%) |
| 45 to 54 Years | 30 (17.3%) | 164 (94.8%) |
| 55 to 64 Years | 108 (28.1%) | 339 (88.3%) |
| 65 to 74 Years | 318 (94.9%) | 231 (69.0%) |
| 75 Years and over | 248 (98.0%) | 167 (66.0%) |
| Total | 980 (42.1%) | 1,823 (78.3%) |
Disability Status by Sex by Age in Liverpool
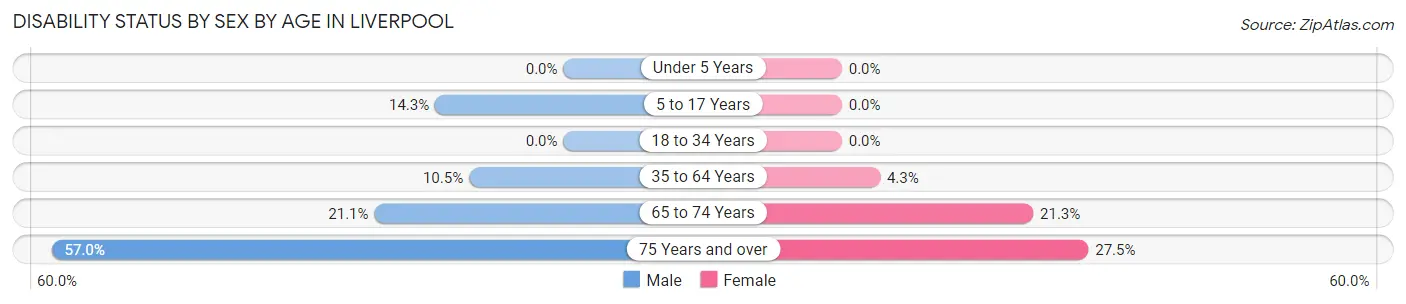
| Age Bracket | Male | Female |
| Under 5 Years | 0 (0.0%) | 0 (0.0%) |
| 5 to 17 Years | 17 (14.3%) | 0 (0.0%) |
| 18 to 34 Years | 0 (0.0%) | 0 (0.0%) |
| 35 to 64 Years | 43 (10.5%) | 17 (4.3%) |
| 65 to 74 Years | 32 (21.0%) | 39 (21.3%) |
| 75 Years and over | 57 (57.0%) | 42 (27.5%) |
Disability Class by Sex by Age in Liverpool
Disability Class: Hearing Difficulty
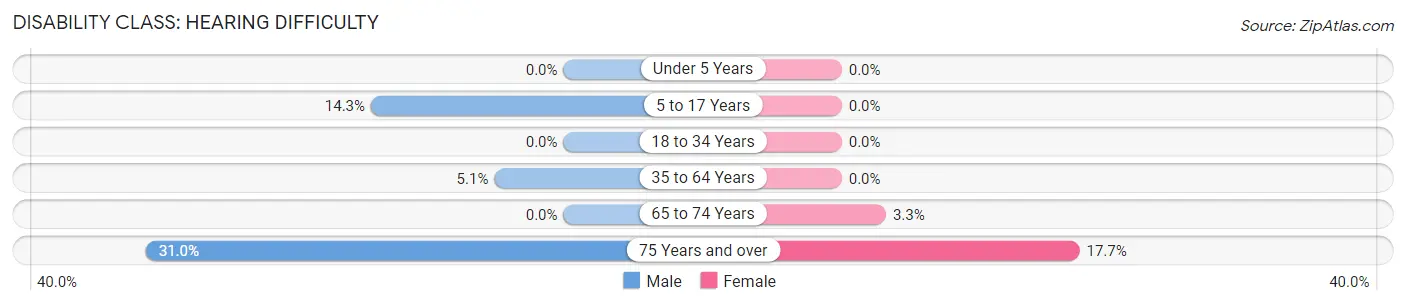
| Age Bracket | Male | Female |
| Under 5 Years | 0 (0.0%) | 0 (0.0%) |
| 5 to 17 Years | 17 (14.3%) | 0 (0.0%) |
| 18 to 34 Years | 0 (0.0%) | 0 (0.0%) |
| 35 to 64 Years | 21 (5.1%) | 0 (0.0%) |
| 65 to 74 Years | 0 (0.0%) | 6 (3.3%) |
| 75 Years and over | 31 (31.0%) | 27 (17.6%) |
Disability Class: Vision Difficulty
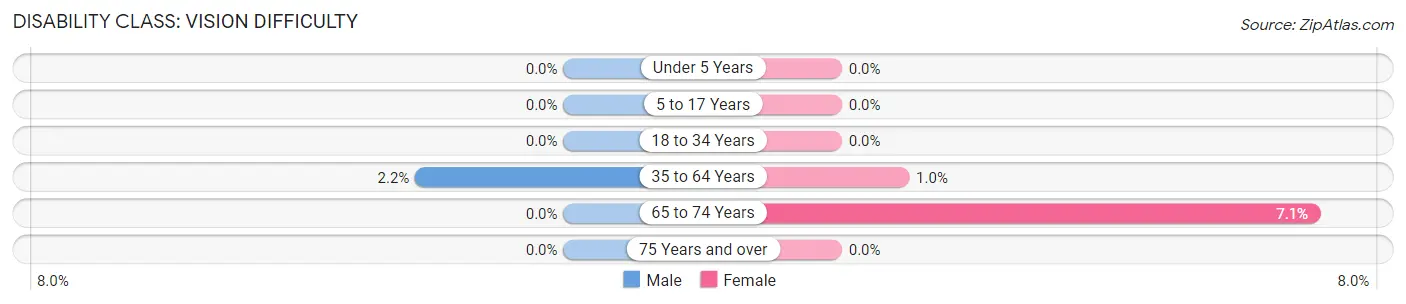
| Age Bracket | Male | Female |
| Under 5 Years | 0 (0.0%) | 0 (0.0%) |
| 5 to 17 Years | 0 (0.0%) | 0 (0.0%) |
| 18 to 34 Years | 0 (0.0%) | 0 (0.0%) |
| 35 to 64 Years | 9 (2.2%) | 4 (1.0%) |
| 65 to 74 Years | 0 (0.0%) | 13 (7.1%) |
| 75 Years and over | 0 (0.0%) | 0 (0.0%) |
Disability Class: Cognitive Difficulty
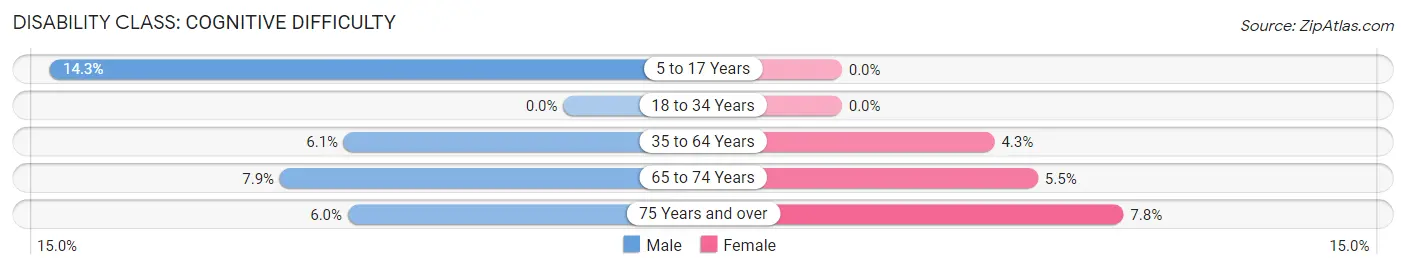
| Age Bracket | Male | Female |
| 5 to 17 Years | 17 (14.3%) | 0 (0.0%) |
| 18 to 34 Years | 0 (0.0%) | 0 (0.0%) |
| 35 to 64 Years | 25 (6.1%) | 17 (4.3%) |
| 65 to 74 Years | 12 (7.9%) | 10 (5.5%) |
| 75 Years and over | 6 (6.0%) | 12 (7.8%) |
Disability Class: Ambulatory Difficulty
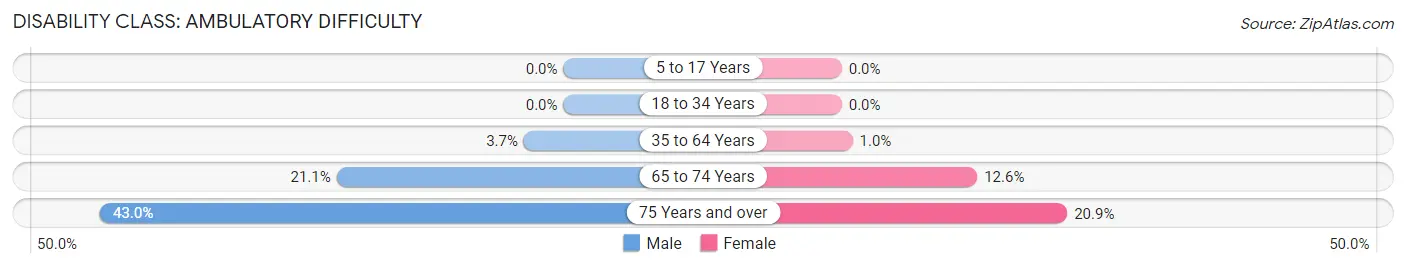
| Age Bracket | Male | Female |
| 5 to 17 Years | 0 (0.0%) | 0 (0.0%) |
| 18 to 34 Years | 0 (0.0%) | 0 (0.0%) |
| 35 to 64 Years | 15 (3.7%) | 4 (1.0%) |
| 65 to 74 Years | 32 (21.0%) | 23 (12.6%) |
| 75 Years and over | 43 (43.0%) | 32 (20.9%) |
Disability Class: Self-Care Difficulty
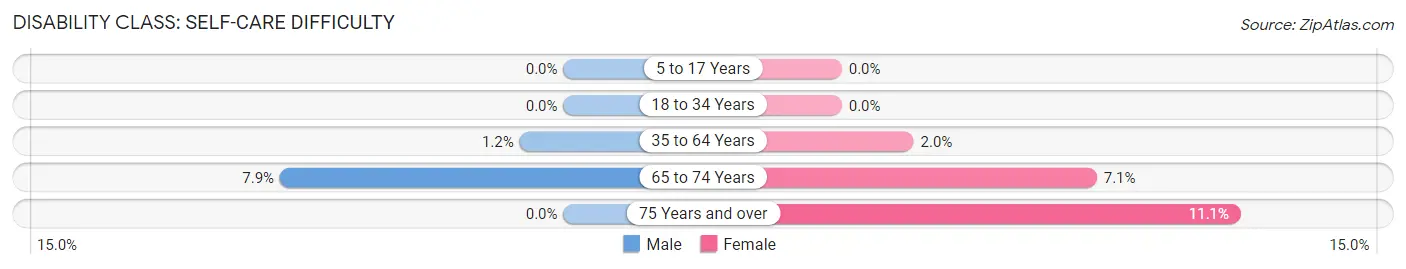
| Age Bracket | Male | Female |
| 5 to 17 Years | 0 (0.0%) | 0 (0.0%) |
| 18 to 34 Years | 0 (0.0%) | 0 (0.0%) |
| 35 to 64 Years | 5 (1.2%) | 8 (2.0%) |
| 65 to 74 Years | 12 (7.9%) | 13 (7.1%) |
| 75 Years and over | 0 (0.0%) | 17 (11.1%) |
Technology Access in Liverpool
Computing Device Access in Liverpool
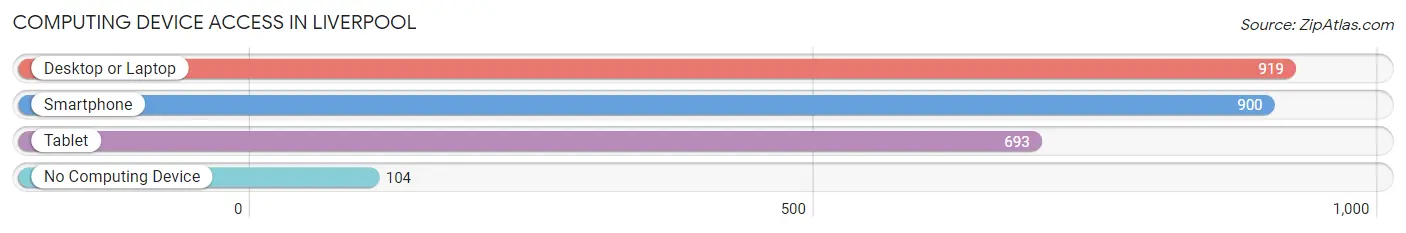
| Device Type | # Households | % Households |
| Desktop or Laptop | 919 | 82.2% |
| Smartphone | 900 | 80.5% |
| Tablet | 693 | 62.0% |
| No Computing Device | 104 | 9.3% |
| Total | 1,118 | 100.0% |
Internet Access in Liverpool
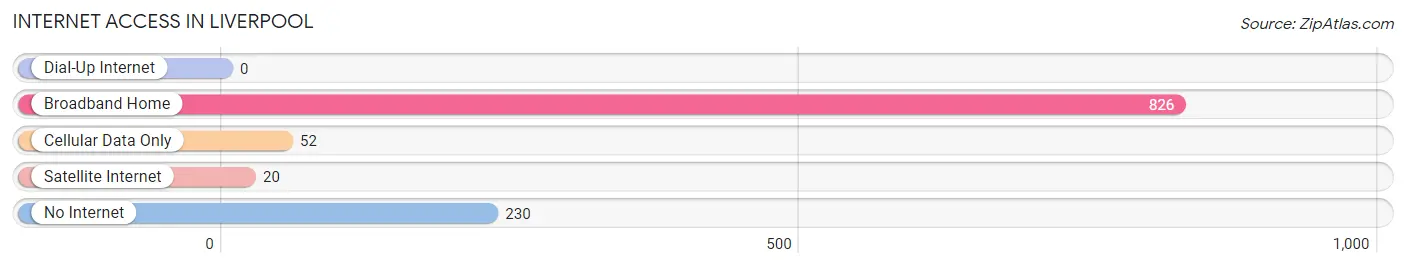
| Internet Type | # Households | % Households |
| Dial-Up Internet | 0 | 0.0% |
| Broadband Home | 826 | 73.9% |
| Cellular Data Only | 52 | 4.6% |
| Satellite Internet | 20 | 1.8% |
| No Internet | 230 | 20.6% |
| Total | 1,118 | 100.0% |
Liverpool Summary
Liverpool, New York is a town located in Onondaga County, New York, United States. The population was 2,347 at the 2010 census. It is part of the Syracuse Metropolitan Statistical Area.
History
The area that is now Liverpool was first settled in 1794 by a group of settlers from Massachusetts. The town was originally known as "Little Ireland" due to the large number of Irish immigrants who settled there. The town was officially incorporated in 1810 and was named after the port city of Liverpool, England.
In the early 19th century, Liverpool was a major port on the Erie Canal. The canal was a major transportation route for goods and people, and Liverpool was a major stop along the route. The town was also home to several mills and factories, including a paper mill, a flour mill, and a woolen mill.
Geography
Liverpool is located in the northwest corner of Onondaga County, New York. It is bordered by the towns of Clay to the north, Salina to the east, and Cicero to the south. The town is located on the eastern shore of Onondaga Lake, and is part of the Syracuse Metropolitan Statistical Area.
The total area of the town is 4.2 square miles, of which 0.1 square miles is water. The terrain is generally flat, with some rolling hills in the northern part of the town.
Economy
The economy of Liverpool is largely based on manufacturing and retail. The town is home to several large manufacturing companies, including Carrier Corporation, which produces air conditioners and other heating and cooling products. Other major employers in the town include the Liverpool Central School District, the Liverpool Public Library, and the Liverpool YMCA.
The town is also home to several retail stores, including Walmart, Target, and Lowe's. There are also several restaurants and bars in the town, as well as a movie theater.
Demographics
As of the 2010 census, there were 2,347 people, 945 households, and 602 families residing in the town. The population density was 562.3 people per square mile. The racial makeup of the town was 94.2% White, 2.2% African American, 0.3% Native American, 1.2% Asian, 0.1% Pacific Islander, 0.7% from other races, and 1.4% from two or more races. Hispanic or Latino of any race were 2.7% of the population.
The median income for a household in the town was $50,938, and the median income for a family was $62,917. The per capita income for the town was $25,845. About 4.2% of families and 6.2% of the population were below the poverty line, including 8.2% of those under age 18 and 4.2% of those age 65 or over.
Common Questions
What is the Total Population of Liverpool?
Total Population of Liverpool is 2,331.
What is the Total Male Population of Liverpool?
Total Male Population of Liverpool is 1,156.
What is the Total Female Population of Liverpool?
Total Female Population of Liverpool is 1,175.
What is the Ratio of Males per 100 Females in Liverpool?
There are 98.38 Males per 100 Females in Liverpool.
What is the Ratio of Females per 100 Males in Liverpool?
There are 101.64 Females per 100 Males in Liverpool.
What is the Median Population Age in Liverpool?
Median Population Age in Liverpool is 44.2 Years.
What is the Average Family Size in Liverpool
Average Family Size in Liverpool is 2.7 People.
What is the Average Household Size in Liverpool
Average Household Size in Liverpool is 2.0 People.
What is Per Capita Income in Liverpool?
Per Capita income in Liverpool is $43,730.
What is the Median Family Income in Liverpool?
Median Family Income in Liverpool is $79,758.
What is the Median Household income in Liverpool?
Median Household Income in Liverpool is $70,556.
What is Income or Wage Gap in Liverpool?
Income or Wage Gap in Liverpool is 15.6%.
Women in Liverpool earn 84.4 cents for every dollar earned by a man.
What is Inequality or Gini Index in Liverpool?
Inequality or Gini Index in Liverpool is 0.47.
How Large is the Labor Force in Liverpool?
There are 1,157 People in the Labor Forcein in Liverpool.
What is the Percentage of People in the Labor Force in Liverpool?
59.1% of People are in the Labor Force in Liverpool.
What is the Unemployment Rate in Liverpool?
Unemployment Rate in Liverpool is 2.9%.