Mineville, NY
Mineville Map
Mineville Overview
1,246
TOTAL POPULATION
593
MALE POPULATION
653
FEMALE POPULATION
90.81
MALES / 100 FEMALES
110.12
FEMALES / 100 MALES
44.9
MEDIAN AGE
2.5
AVG FAMILY SIZE
2.3
AVG HOUSEHOLD SIZE
$26,767
PER CAPITA INCOME
$73,995
AVG FAMILY INCOME
$56,892
AVG HOUSEHOLD INCOME
0.41
INEQUALITY / GINI INDEX
574
LABOR FORCE [ PEOPLE ]
52.3%
PERCENT IN LABOR FORCE
Mineville Zip Codes
Mineville Area Codes
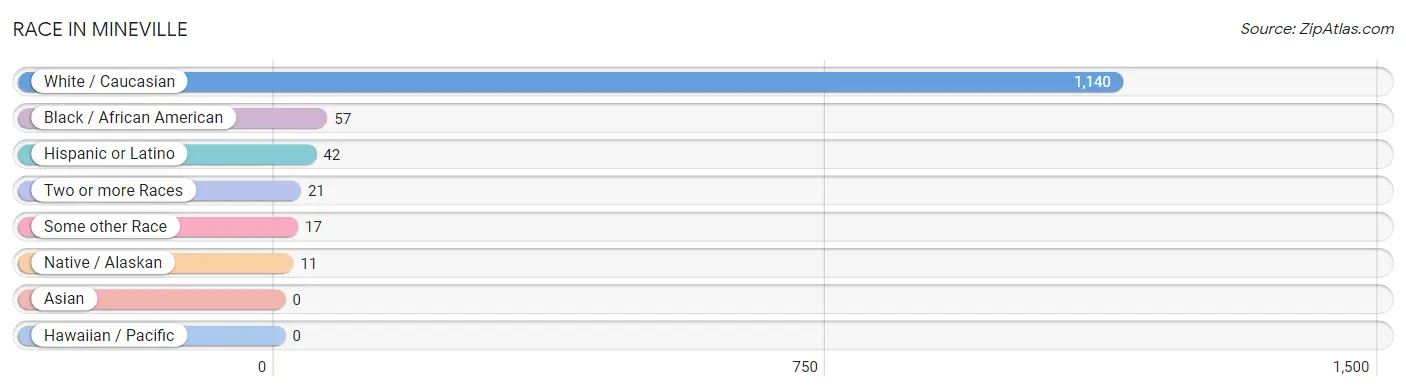
Race in Mineville
The most populous races in Mineville are White / Caucasian (1,140 | 91.5%), Black / African American (57 | 4.6%), and Hispanic or Latino (42 | 3.4%).
| Race | # Population | % Population |
| Asian | 0 | 0.0% |
| Black / African American | 57 | 4.6% |
| Hawaiian / Pacific | 0 | 0.0% |
| Hispanic or Latino | 42 | 3.4% |
| Native / Alaskan | 11 | 0.9% |
| White / Caucasian | 1,140 | 91.5% |
| Two or more Races | 21 | 1.7% |
| Some other Race | 17 | 1.4% |
| Total | 1,246 | 100.0% |
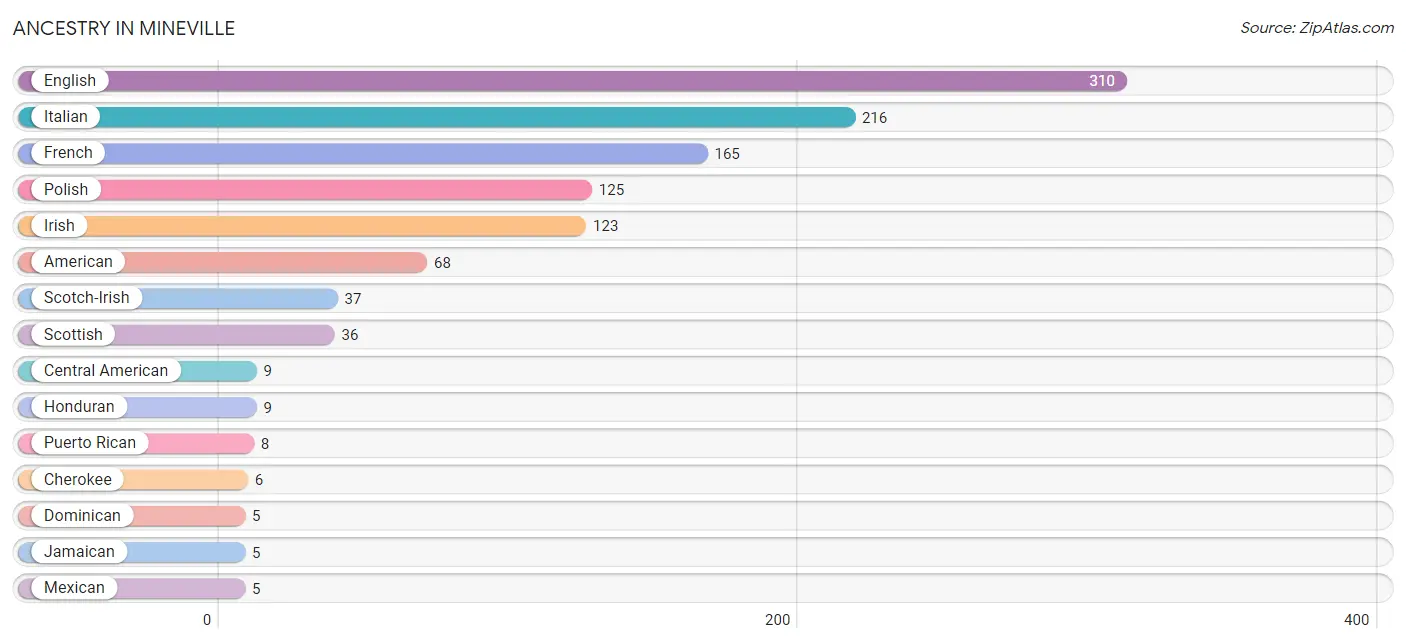
Ancestry in Mineville
The most populous ancestries reported in Mineville are English (310 | 24.9%), Italian (216 | 17.3%), French (165 | 13.2%), Polish (125 | 10.0%), and Irish (123 | 9.9%), together accounting for 75.4% of all Mineville residents.
| Ancestry | # Population | % Population |
| American | 68 | 5.5% |
| Central American | 9 | 0.7% |
| Cherokee | 6 | 0.5% |
| Dominican | 5 | 0.4% |
| English | 310 | 24.9% |
| French | 165 | 13.2% |
| French Canadian | 3 | 0.2% |
| Honduran | 9 | 0.7% |
| Irish | 123 | 9.9% |
| Italian | 216 | 17.3% |
| Jamaican | 5 | 0.4% |
| Mexican | 5 | 0.4% |
| Polish | 125 | 10.0% |
| Puerto Rican | 8 | 0.6% |
| Scotch-Irish | 37 | 3.0% |
| Scottish | 36 | 2.9% |
| Spanish | 5 | 0.4% | View All 17 Rows |
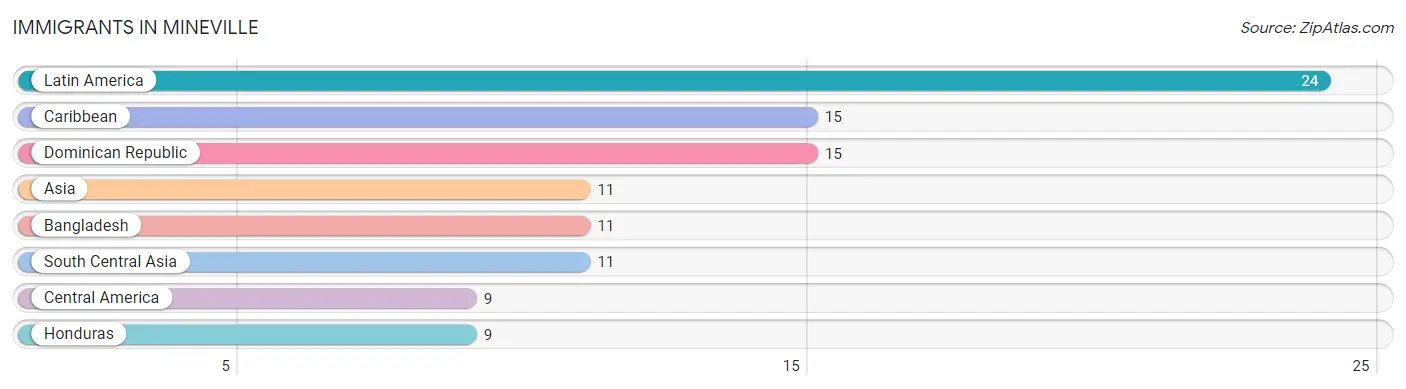
Immigrants in Mineville
The most numerous immigrant groups reported in Mineville came from Latin America (24 | 1.9%), Caribbean (15 | 1.2%), Dominican Republic (15 | 1.2%), Asia (11 | 0.9%), and Bangladesh (11 | 0.9%), together accounting for 6.1% of all Mineville residents.
| Immigration Origin | # Population | % Population |
| Asia | 11 | 0.9% |
| Bangladesh | 11 | 0.9% |
| Caribbean | 15 | 1.2% |
| Central America | 9 | 0.7% |
| Dominican Republic | 15 | 1.2% |
| Honduras | 9 | 0.7% |
| Latin America | 24 | 1.9% |
| South Central Asia | 11 | 0.9% | View All 8 Rows |
Sex and Age in Mineville
Sex and Age in Mineville
The most populous age groups in Mineville are 25 to 29 Years (111 | 18.7%) for men and 80 to 84 Years (103 | 15.8%) for women.
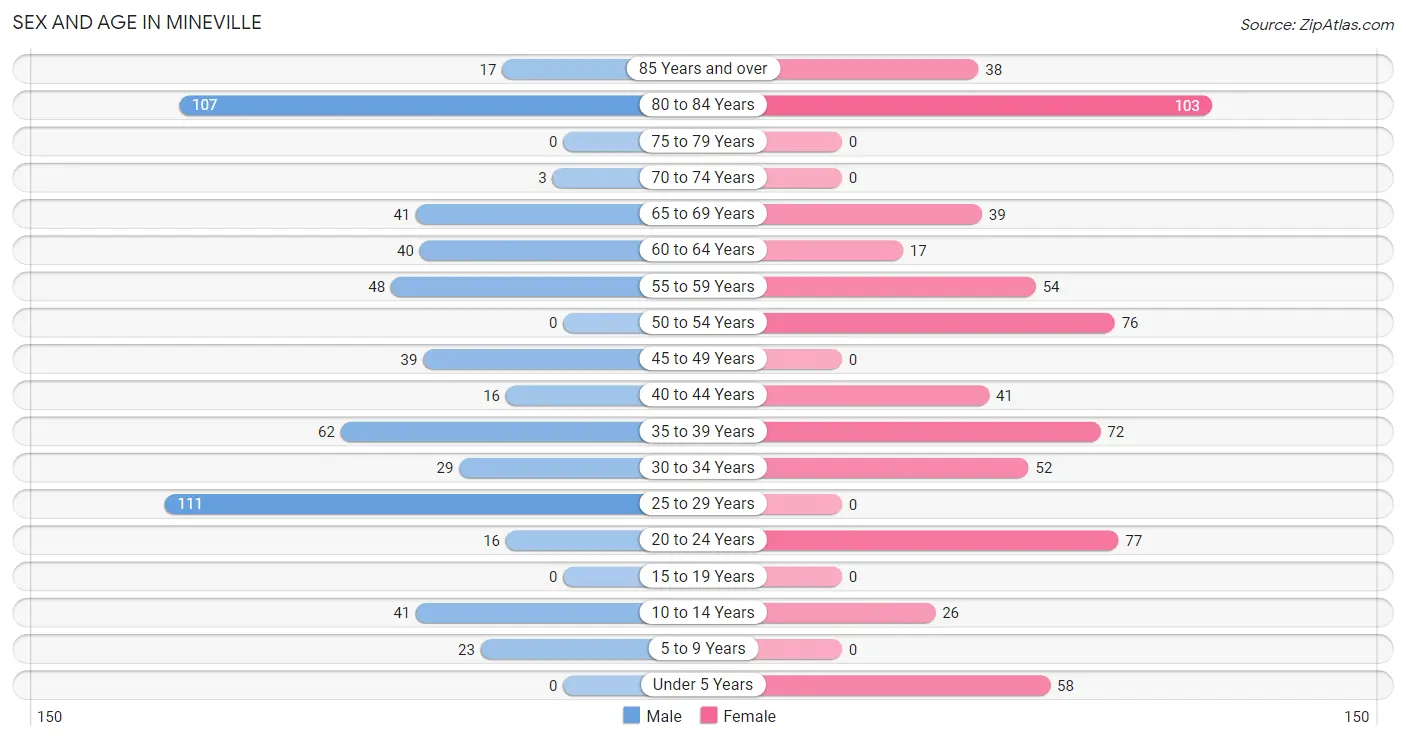
| Age Bracket | Male | Female |
| Under 5 Years | 0 (0.0%) | 58 (8.9%) |
| 5 to 9 Years | 23 (3.9%) | 0 (0.0%) |
| 10 to 14 Years | 41 (6.9%) | 26 (4.0%) |
| 15 to 19 Years | 0 (0.0%) | 0 (0.0%) |
| 20 to 24 Years | 16 (2.7%) | 77 (11.8%) |
| 25 to 29 Years | 111 (18.7%) | 0 (0.0%) |
| 30 to 34 Years | 29 (4.9%) | 52 (8.0%) |
| 35 to 39 Years | 62 (10.5%) | 72 (11.0%) |
| 40 to 44 Years | 16 (2.7%) | 41 (6.3%) |
| 45 to 49 Years | 39 (6.6%) | 0 (0.0%) |
| 50 to 54 Years | 0 (0.0%) | 76 (11.6%) |
| 55 to 59 Years | 48 (8.1%) | 54 (8.3%) |
| 60 to 64 Years | 40 (6.8%) | 17 (2.6%) |
| 65 to 69 Years | 41 (6.9%) | 39 (6.0%) |
| 70 to 74 Years | 3 (0.5%) | 0 (0.0%) |
| 75 to 79 Years | 0 (0.0%) | 0 (0.0%) |
| 80 to 84 Years | 107 (18.0%) | 103 (15.8%) |
| 85 Years and over | 17 (2.9%) | 38 (5.8%) |
| Total | 593 (100.0%) | 653 (100.0%) |
Families and Households in Mineville
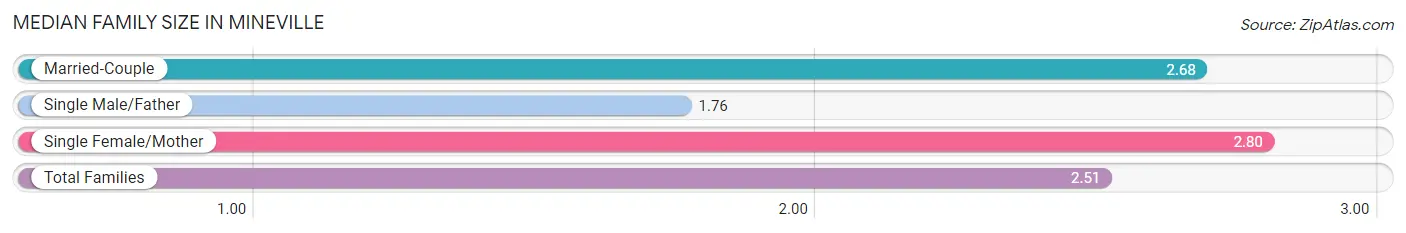
Median Family Size in Mineville
The median family size in Mineville is 2.51 persons per family, with single female/mother families (79 | 22.3%) accounting for the largest median family size of 2.8 persons per family. On the other hand, single male/father families (76 | 21.4%) represent the smallest median family size with 1.76 persons per family.
| Family Type | # Families | Family Size |
| Married-Couple | 200 (56.3%) | 2.68 |
| Single Male/Father | 76 (21.4%) | 1.76 |
| Single Female/Mother | 79 (22.3%) | 2.80 |
| Total Families | 355 (100.0%) | 2.51 |
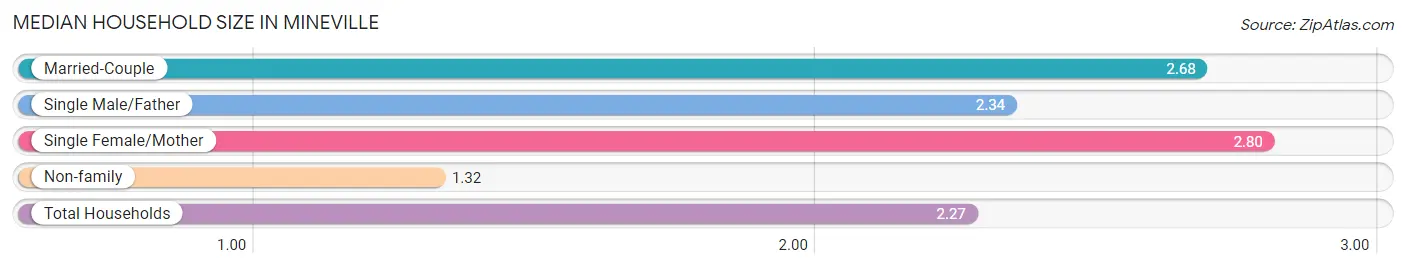
Median Household Size in Mineville
The median household size in Mineville is 2.27 persons per household, with single female/mother households (79 | 16.2%) accounting for the largest median household size of 2.8 persons per household. non-family households (133 | 27.3%) represent the smallest median household size with 1.32 persons per household.
| Household Type | # Households | Household Size |
| Married-Couple | 200 (41.0%) | 2.68 |
| Single Male/Father | 76 (15.6%) | 2.34 |
| Single Female/Mother | 79 (16.2%) | 2.80 |
| Non-family | 133 (27.3%) | 1.32 |
| Total Households | 488 (100.0%) | 2.27 |
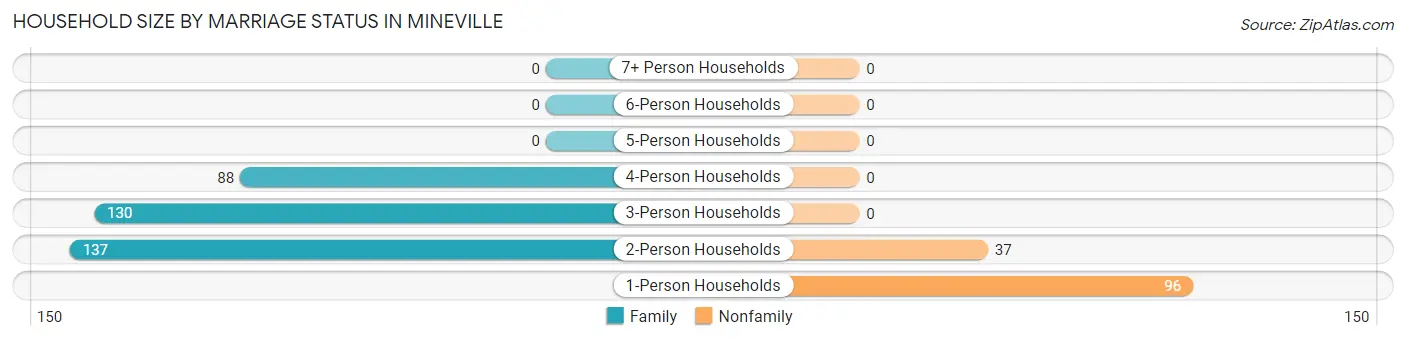
Household Size by Marriage Status in Mineville
Out of a total of 488 households in Mineville, 355 (72.8%) are family households, while 133 (27.3%) are nonfamily households. The most numerous type of family households are 2-person households, comprising 137, and the most common type of nonfamily households are 1-person households, comprising 96.
| Household Size | Family Households | Nonfamily Households |
| 1-Person Households | - | 96 (19.7%) |
| 2-Person Households | 137 (28.1%) | 37 (7.6%) |
| 3-Person Households | 130 (26.6%) | 0 (0.0%) |
| 4-Person Households | 88 (18.0%) | 0 (0.0%) |
| 5-Person Households | 0 (0.0%) | 0 (0.0%) |
| 6-Person Households | 0 (0.0%) | 0 (0.0%) |
| 7+ Person Households | 0 (0.0%) | 0 (0.0%) |
| Total | 355 (72.8%) | 133 (27.3%) |
Female Fertility in Mineville
Fertility by Age in Mineville
| Age Bracket | Women with Births | Births / 1,000 Women |
| 15 to 19 years | 0 (0.0%) | 0.0 |
| 20 to 34 years | 0 (0.0%) | 0.0 |
| 35 to 50 years | 0 (0.0%) | 0.0 |
| Total | 0 (0.0%) | 0.0 |
Fertility by Age by Marriage Status in Mineville
| Age Bracket | Married | Unmarried |
| 15 to 19 years | 0 (0.0%) | 0 (0.0%) |
| 20 to 34 years | 0 (0.0%) | 0 (0.0%) |
| 35 to 50 years | 0 (0.0%) | 0 (0.0%) |
| Total | 0 (0.0%) | 0 (0.0%) |
Fertility by Education in Mineville
| Educational Attainment | Women with Births | Births / 1,000 Women |
| Less than High School | 0 (0.0%) | 0.0 |
| High School Diploma | 0 (0.0%) | 0.0 |
| College or Associate's Degree | 0 (0.0%) | 0.0 |
| Bachelor's Degree | 0 (0.0%) | 0.0 |
| Graduate Degree | 0 (0.0%) | 0.0 |
| Total | 0 (0.0%) | 0.0 |
Fertility by Education by Marriage Status in Mineville
| Educational Attainment | Married | Unmarried |
| Less than High School | 0 (0.0%) | 0 (0.0%) |
| High School Diploma | 0 (0.0%) | 0 (0.0%) |
| College or Associate's Degree | 0 (0.0%) | 0 (0.0%) |
| Bachelor's Degree | 0 (0.0%) | 0 (0.0%) |
| Graduate Degree | 0 (0.0%) | 0 (0.0%) |
| Total | 0 (0.0%) | 0 (0.0%) |
Income in Mineville
Income Overview in Mineville
Per Capita Income in Mineville is $26,767, while median incomes of families and households are $73,995 and $56,892 respectively.
| Characteristic | Number | Measure |
| Per Capita Income | 1,246 | $26,767 |
| Median Family Income | 355 | $73,995 |
| Mean Family Income | 355 | $77,212 |
| Median Household Income | 488 | $56,892 |
| Mean Household Income | 488 | $70,664 |
| Income Deficit | 355 | $0 |
| Wage / Income Gap (%) | 1,246 | 0.00% |
| Wage / Income Gap ($) | 1,246 | 100.00¢ per $1 |
| Gini / Inequality Index | 1,246 | 0.41 |
Earnings by Sex in Mineville
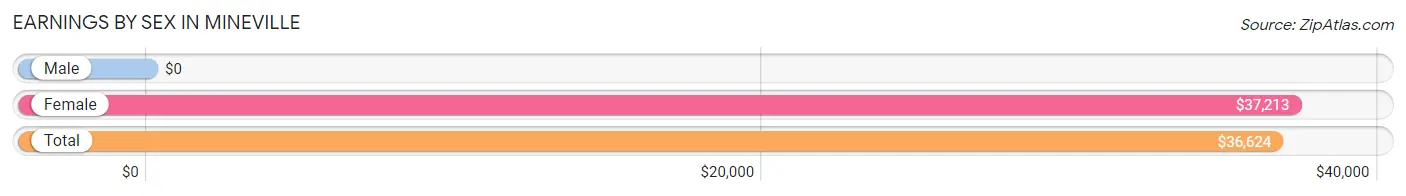
| Sex | Number | Average Earnings |
| Male | 213 (35.2%) | $0 |
| Female | 392 (64.8%) | $37,213 |
| Total | 605 (100.0%) | $36,624 |
Earnings by Sex by Income Bracket in Mineville
The most common earnings brackets in Mineville are $10,000 to $12,499 for men (66 | 31.0%) and $35,000 to $39,999 for women (91 | 23.2%).
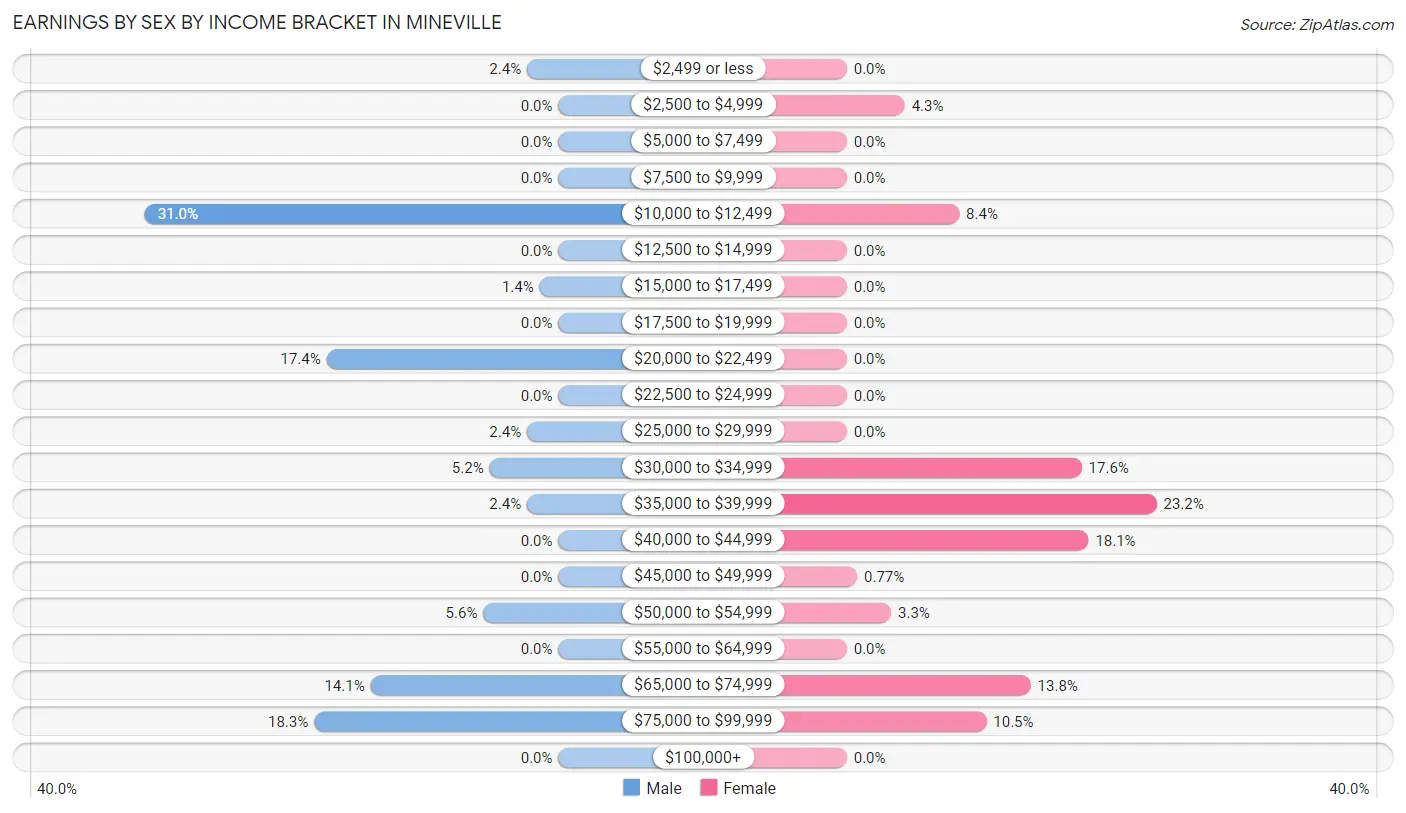
| Income | Male | Female |
| $2,499 or less | 5 (2.4%) | 0 (0.0%) |
| $2,500 to $4,999 | 0 (0.0%) | 17 (4.3%) |
| $5,000 to $7,499 | 0 (0.0%) | 0 (0.0%) |
| $7,500 to $9,999 | 0 (0.0%) | 0 (0.0%) |
| $10,000 to $12,499 | 66 (31.0%) | 33 (8.4%) |
| $12,500 to $14,999 | 0 (0.0%) | 0 (0.0%) |
| $15,000 to $17,499 | 3 (1.4%) | 0 (0.0%) |
| $17,500 to $19,999 | 0 (0.0%) | 0 (0.0%) |
| $20,000 to $22,499 | 37 (17.4%) | 0 (0.0%) |
| $22,500 to $24,999 | 0 (0.0%) | 0 (0.0%) |
| $25,000 to $29,999 | 5 (2.4%) | 0 (0.0%) |
| $30,000 to $34,999 | 11 (5.2%) | 69 (17.6%) |
| $35,000 to $39,999 | 5 (2.4%) | 91 (23.2%) |
| $40,000 to $44,999 | 0 (0.0%) | 71 (18.1%) |
| $45,000 to $49,999 | 0 (0.0%) | 3 (0.8%) |
| $50,000 to $54,999 | 12 (5.6%) | 13 (3.3%) |
| $55,000 to $64,999 | 0 (0.0%) | 0 (0.0%) |
| $65,000 to $74,999 | 30 (14.1%) | 54 (13.8%) |
| $75,000 to $99,999 | 39 (18.3%) | 41 (10.5%) |
| $100,000+ | 0 (0.0%) | 0 (0.0%) |
| Total | 213 (100.0%) | 392 (100.0%) |
Earnings by Sex by Educational Attainment in Mineville
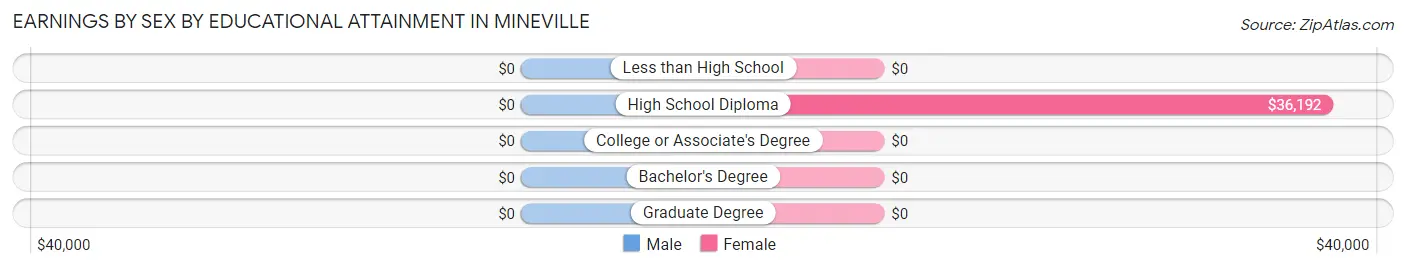
| Educational Attainment | Male Income | Female Income |
| Less than High School | - | - |
| High School Diploma | - | - |
| College or Associate's Degree | - | - |
| Bachelor's Degree | - | - |
| Graduate Degree | - | - |
| Total | - | - |
Family Income in Mineville
Family Income Brackets in Mineville
According to the Mineville family income data, there are 88 families falling into the $150,000 to $199,999 income range, which is the most common income bracket and makes up 24.8% of all families.
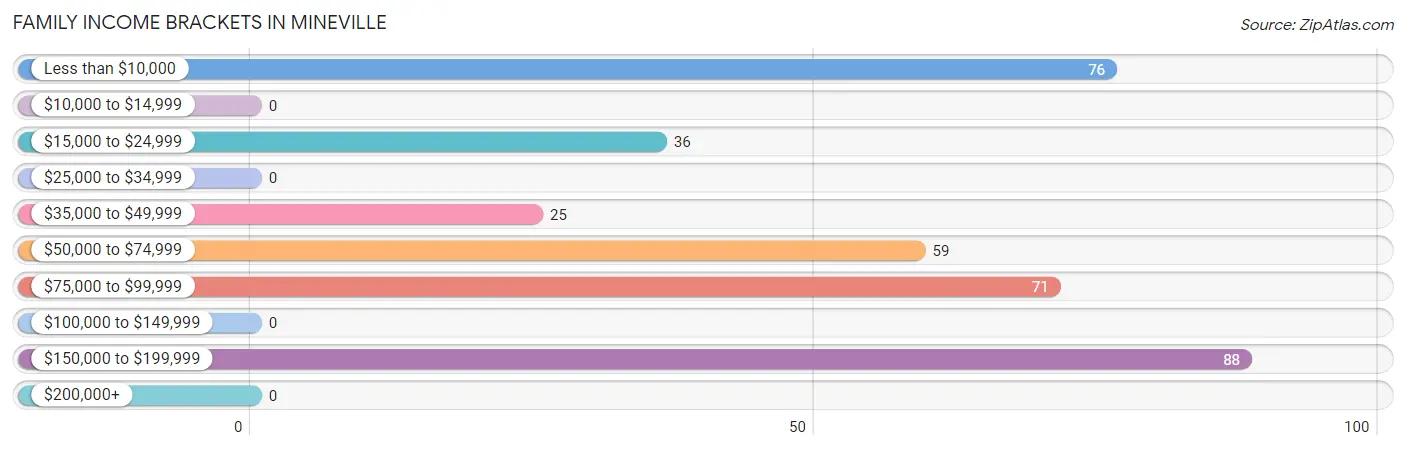
| Income Bracket | # Families | % Families |
| Less than $10,000 | 76 | 21.4% |
| $10,000 to $14,999 | 0 | 0.0% |
| $15,000 to $24,999 | 36 | 10.1% |
| $25,000 to $34,999 | 0 | 0.0% |
| $35,000 to $49,999 | 25 | 7.0% |
| $50,000 to $74,999 | 59 | 16.6% |
| $75,000 to $99,999 | 71 | 20.0% |
| $100,000 to $149,999 | 0 | 0.0% |
| $150,000 to $199,999 | 88 | 24.8% |
| $200,000+ | 0 | 0.0% |
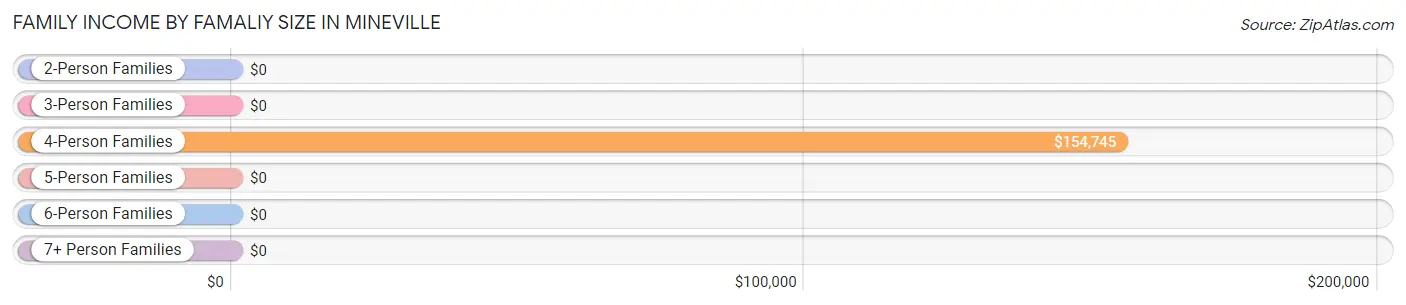
Family Income by Famaliy Size in Mineville
4-person families (88 | 24.8%) account for the highest median family income in Mineville with $154,745 per family, while 4-person families (88 | 24.8%) have the highest median income of $38,686 per family member.
| Income Bracket | # Families | Median Income |
| 2-Person Families | 213 (60.0%) | $0 |
| 3-Person Families | 54 (15.2%) | $0 |
| 4-Person Families | 88 (24.8%) | $154,745 |
| 5-Person Families | 0 (0.0%) | $0 |
| 6-Person Families | 0 (0.0%) | $0 |
| 7+ Person Families | 0 (0.0%) | $0 |
| Total | 355 (100.0%) | $73,995 |
Family Income by Number of Earners in Mineville
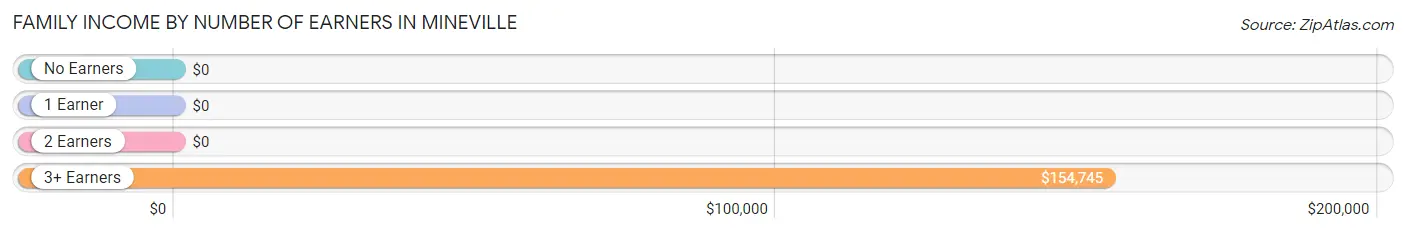
| Number of Earners | # Families | Median Income |
| No Earners | 158 (44.5%) | $0 |
| 1 Earner | 38 (10.7%) | $0 |
| 2 Earners | 71 (20.0%) | $0 |
| 3+ Earners | 88 (24.8%) | $154,745 |
| Total | 355 (100.0%) | $73,995 |
Household Income in Mineville
Household Income Brackets in Mineville
With 113 households falling in the category, the $50,000 to $74,999 income range is the most frequent in Mineville, accounting for 23.2% of all households.
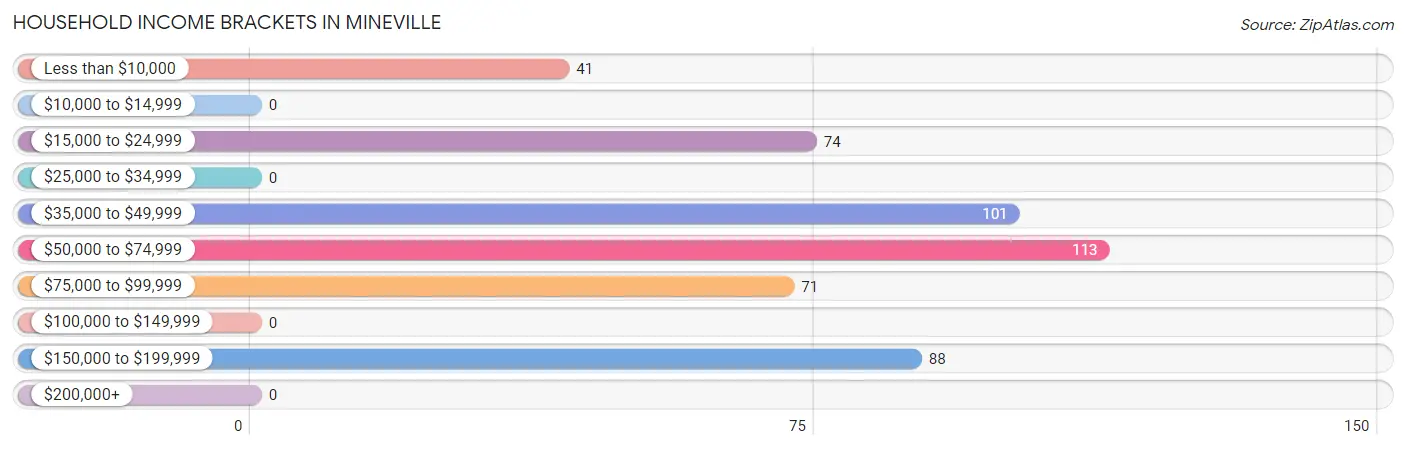
| Income Bracket | # Households | % Households |
| Less than $10,000 | 41 | 8.4% |
| $10,000 to $14,999 | 0 | 0.0% |
| $15,000 to $24,999 | 74 | 15.2% |
| $25,000 to $34,999 | 0 | 0.0% |
| $35,000 to $49,999 | 101 | 20.7% |
| $50,000 to $74,999 | 113 | 23.2% |
| $75,000 to $99,999 | 71 | 14.5% |
| $100,000 to $149,999 | 0 | 0.0% |
| $150,000 to $199,999 | 88 | 18.0% |
| $200,000+ | 0 | 0.0% |
Household Income by Householder Age in Mineville
The median household income in Mineville is $56,892, with the highest median household income of $99,074 found in the 45 to 64 years age bracket for the primary householder. A total of 210 households (43.0%) fall into this category.
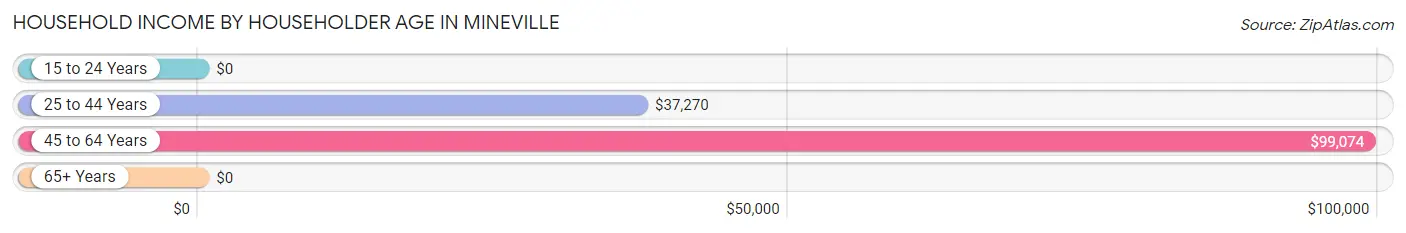
| Income Bracket | # Households | Median Income |
| 15 to 24 Years | 0 (0.0%) | $0 |
| 25 to 44 Years | 138 (28.3%) | $37,270 |
| 45 to 64 Years | 210 (43.0%) | $99,074 |
| 65+ Years | 140 (28.7%) | $0 |
| Total | 488 (100.0%) | $56,892 |
Poverty in Mineville
Income Below Poverty by Sex and Age in Mineville
With 21.9% poverty level for males and 11.5% for females among the residents of Mineville, 25 to 34 year old males and under 5 year old females are the most vulnerable to poverty, with 76 males (100.0%) and 58 females (100.0%) in their respective age groups living below the poverty level.
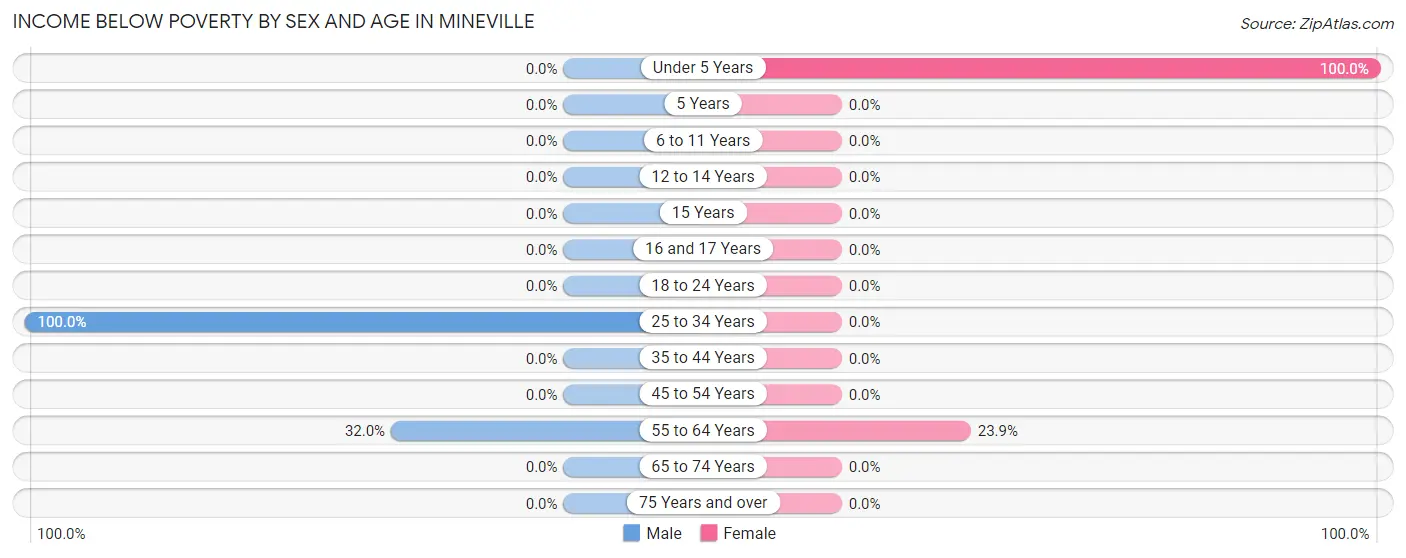
| Age Bracket | Male | Female |
| Under 5 Years | 0 (0.0%) | 58 (100.0%) |
| 5 Years | 0 (0.0%) | 0 (0.0%) |
| 6 to 11 Years | 0 (0.0%) | 0 (0.0%) |
| 12 to 14 Years | 0 (0.0%) | 0 (0.0%) |
| 15 Years | 0 (0.0%) | 0 (0.0%) |
| 16 and 17 Years | 0 (0.0%) | 0 (0.0%) |
| 18 to 24 Years | 0 (0.0%) | 0 (0.0%) |
| 25 to 34 Years | 76 (100.0%) | 0 (0.0%) |
| 35 to 44 Years | 0 (0.0%) | 0 (0.0%) |
| 45 to 54 Years | 0 (0.0%) | 0 (0.0%) |
| 55 to 64 Years | 24 (32.0%) | 17 (23.9%) |
| 65 to 74 Years | 0 (0.0%) | 0 (0.0%) |
| 75 Years and over | 0 (0.0%) | 0 (0.0%) |
| Total | 100 (21.9%) | 75 (11.5%) |
Income Above Poverty by Sex and Age in Mineville
According to the poverty statistics in Mineville, males aged 6 to 11 years and females aged 12 to 14 years are the age groups that are most secure financially, with 100.0% of males and 100.0% of females in these age groups living above the poverty line.
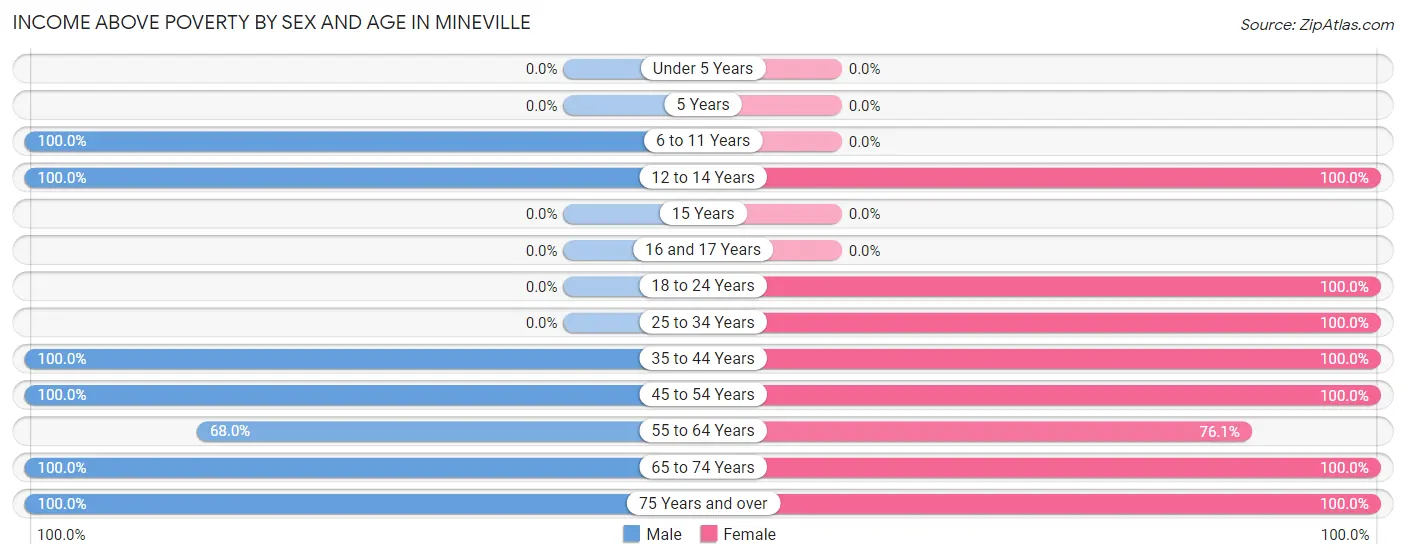
| Age Bracket | Male | Female |
| Under 5 Years | 0 (0.0%) | 0 (0.0%) |
| 5 Years | 0 (0.0%) | 0 (0.0%) |
| 6 to 11 Years | 23 (100.0%) | 0 (0.0%) |
| 12 to 14 Years | 41 (100.0%) | 26 (100.0%) |
| 15 Years | 0 (0.0%) | 0 (0.0%) |
| 16 and 17 Years | 0 (0.0%) | 0 (0.0%) |
| 18 to 24 Years | 0 (0.0%) | 77 (100.0%) |
| 25 to 34 Years | 0 (0.0%) | 52 (100.0%) |
| 35 to 44 Years | 40 (100.0%) | 113 (100.0%) |
| 45 to 54 Years | 39 (100.0%) | 76 (100.0%) |
| 55 to 64 Years | 51 (68.0%) | 54 (76.1%) |
| 65 to 74 Years | 39 (100.0%) | 39 (100.0%) |
| 75 Years and over | 124 (100.0%) | 141 (100.0%) |
| Total | 357 (78.1%) | 578 (88.5%) |
Income Below Poverty Among Married-Couple Families in Mineville
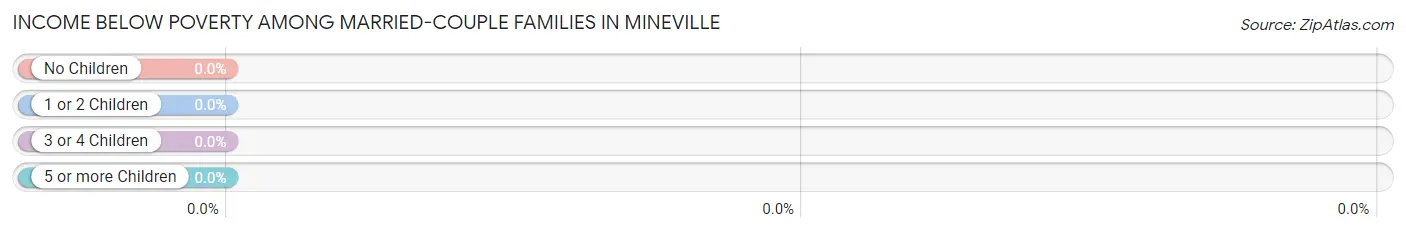
| Children | Above Poverty | Below Poverty |
| No Children | 115 (100.0%) | 0 (0.0%) |
| 1 or 2 Children | 85 (100.0%) | 0 (0.0%) |
| 3 or 4 Children | 0 (0.0%) | 0 (0.0%) |
| 5 or more Children | 0 (0.0%) | 0 (0.0%) |
| Total | 200 (100.0%) | 0 (0.0%) |
Income Below Poverty Among Single-Parent Households in Mineville
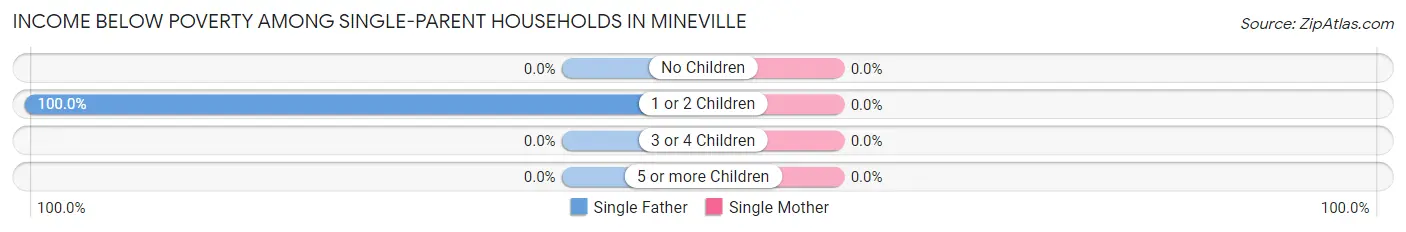
| Children | Single Father | Single Mother |
| No Children | 0 (0.0%) | 0 (0.0%) |
| 1 or 2 Children | 76 (100.0%) | 0 (0.0%) |
| 3 or 4 Children | 0 (0.0%) | 0 (0.0%) |
| 5 or more Children | 0 (0.0%) | 0 (0.0%) |
| Total | 76 (100.0%) | 0 (0.0%) |
Income Below Poverty Among Married-Couple vs Single-Parent Households in Mineville
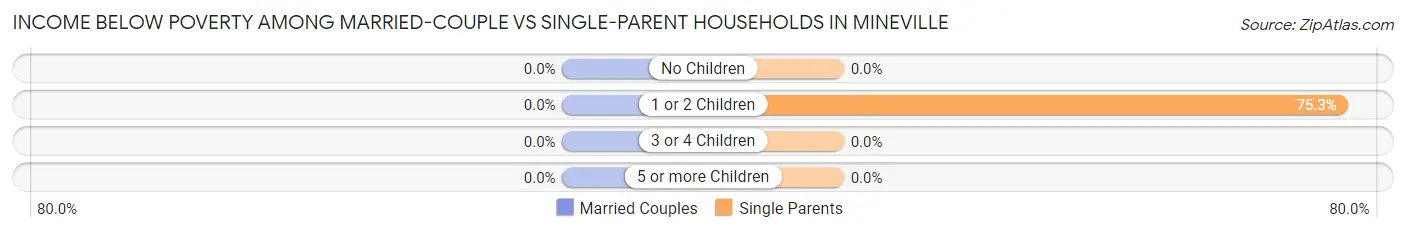
| Children | Married-Couple Families | Single-Parent Households |
| No Children | 0 (0.0%) | 0 (0.0%) |
| 1 or 2 Children | 0 (0.0%) | 76 (75.2%) |
| 3 or 4 Children | 0 (0.0%) | 0 (0.0%) |
| 5 or more Children | 0 (0.0%) | 0 (0.0%) |
| Total | 0 (0.0%) | 76 (49.0%) |
Employment Characteristics in Mineville
Employment by Class of Employer in Mineville
Among the 518 employed individuals in Mineville, private company employees (433 | 83.6%), and not-for-profit organizations (85 | 16.4%) make up the most common classes of employment.
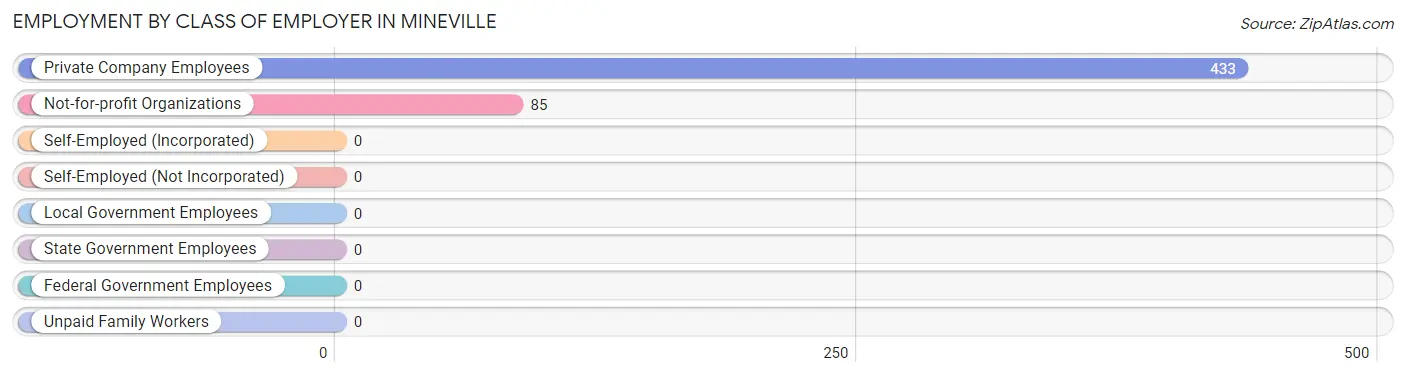
| Employer Class | # Employees | % Employees |
| Private Company Employees | 433 | 83.6% |
| Self-Employed (Incorporated) | 0 | 0.0% |
| Self-Employed (Not Incorporated) | 0 | 0.0% |
| Not-for-profit Organizations | 85 | 16.4% |
| Local Government Employees | 0 | 0.0% |
| State Government Employees | 0 | 0.0% |
| Federal Government Employees | 0 | 0.0% |
| Unpaid Family Workers | 0 | 0.0% |
| Total | 518 | 100.0% |
Employment Status by Age in Mineville
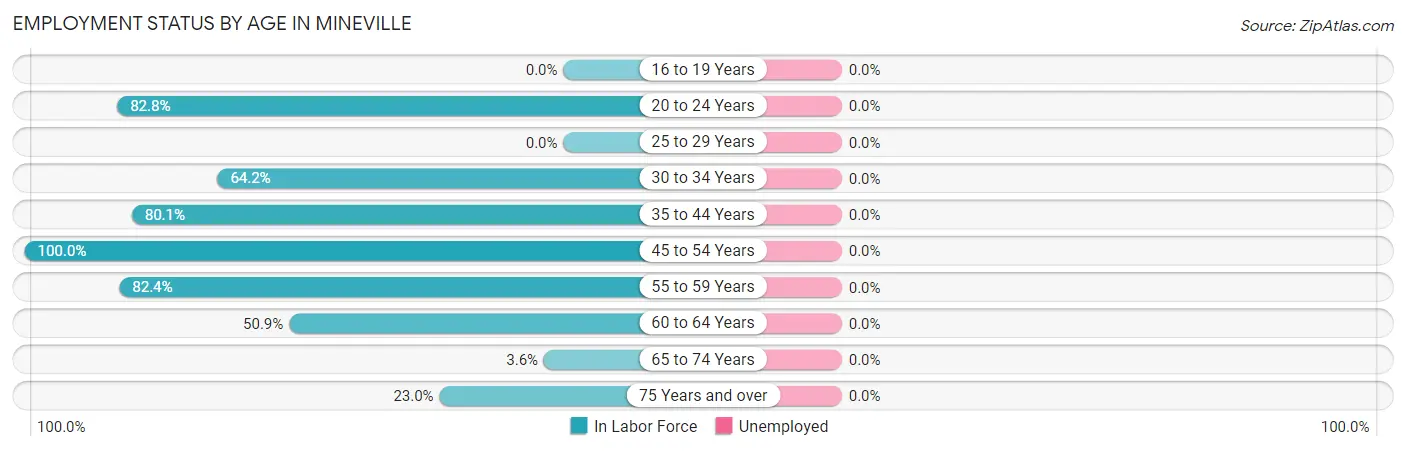
| Age Bracket | In Labor Force | Unemployed |
| 16 to 19 Years | 0 (0.0%) | 0 (0.0%) |
| 20 to 24 Years | 77 (82.8%) | 0 (0.0%) |
| 25 to 29 Years | 0 (0.0%) | 0 (0.0%) |
| 30 to 34 Years | 52 (64.2%) | 0 (0.0%) |
| 35 to 44 Years | 153 (80.1%) | 0 (0.0%) |
| 45 to 54 Years | 115 (100.0%) | 0 (0.0%) |
| 55 to 59 Years | 84 (82.4%) | 0 (0.0%) |
| 60 to 64 Years | 29 (50.9%) | 0 (0.0%) |
| 65 to 74 Years | 3 (3.6%) | 0 (0.0%) |
| 75 Years and over | 61 (23.0%) | 0 (0.0%) |
| Total | 574 (52.3%) | 0 (0.0%) |
Employment Status by Educational Attainment in Mineville
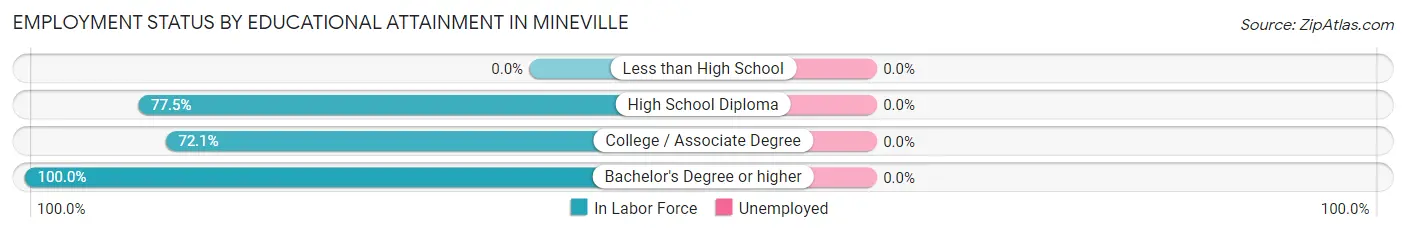
| Educational Attainment | In Labor Force | Unemployed |
| Less than High School | 0 (0.0%) | 0 (0.0%) |
| High School Diploma | 227 (77.5%) | 0 (0.0%) |
| College / Associate Degree | 88 (72.1%) | 0 (0.0%) |
| Bachelor's Degree or higher | 118 (100.0%) | 0 (0.0%) |
| Total | 433 (65.9%) | 0 (0.0%) |
Employment Occupations by Sex in Mineville
Management, Business, Science and Arts Occupations
The most common Management, Business, Science and Arts occupations in Mineville are Management (80 | 13.9%), Business & Financial (54 | 9.4%), and Health Diagnosing & Treating (13 | 2.3%).
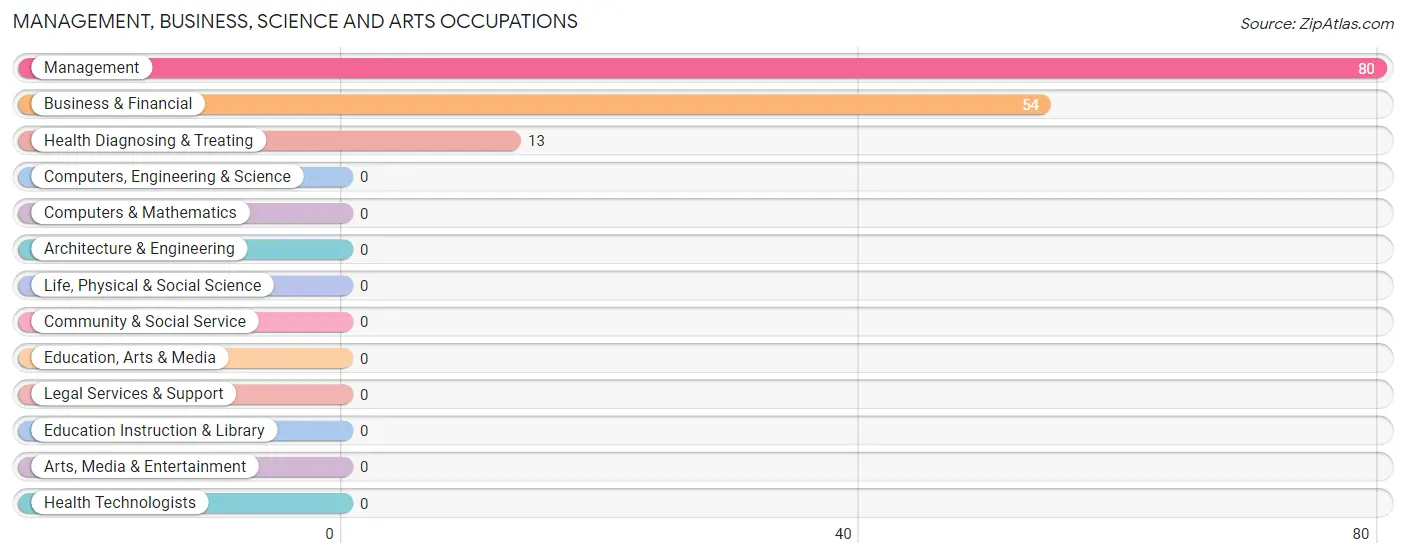
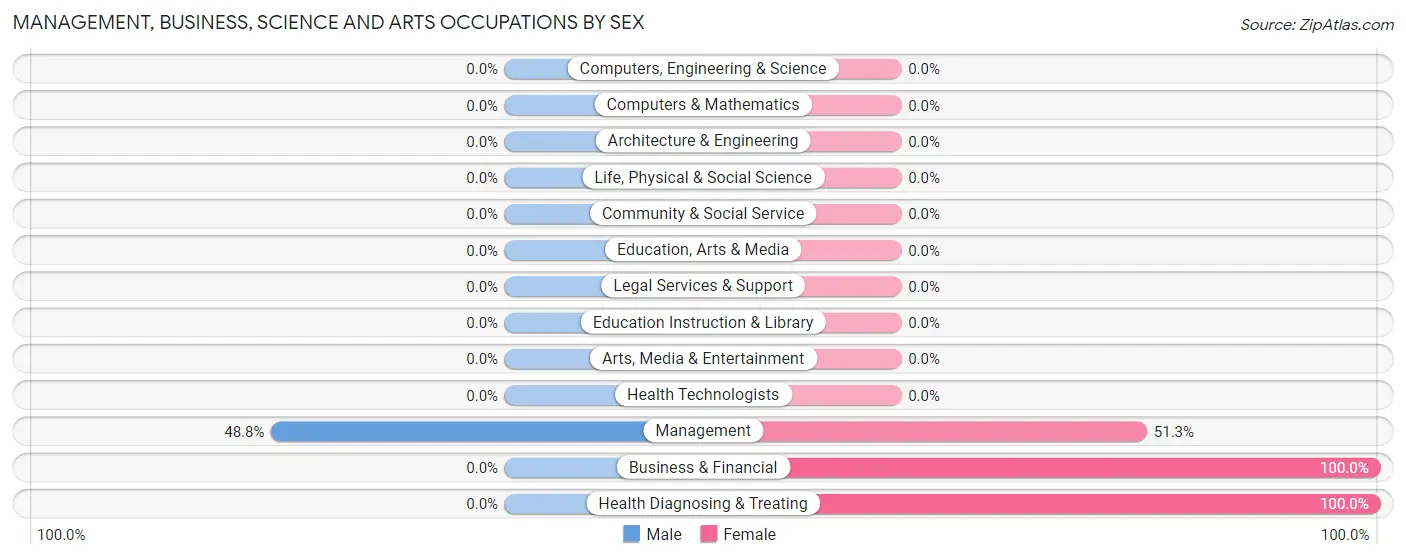
Management, Business, Science and Arts Occupations by Sex
| Occupation | Male | Female |
| Management | 39 (48.7%) | 41 (51.2%) |
| Business & Financial | 0 (0.0%) | 54 (100.0%) |
| Computers, Engineering & Science | 0 (0.0%) | 0 (0.0%) |
| Computers & Mathematics | 0 (0.0%) | 0 (0.0%) |
| Architecture & Engineering | 0 (0.0%) | 0 (0.0%) |
| Life, Physical & Social Science | 0 (0.0%) | 0 (0.0%) |
| Community & Social Service | 0 (0.0%) | 0 (0.0%) |
| Education, Arts & Media | 0 (0.0%) | 0 (0.0%) |
| Legal Services & Support | 0 (0.0%) | 0 (0.0%) |
| Education Instruction & Library | 0 (0.0%) | 0 (0.0%) |
| Arts, Media & Entertainment | 0 (0.0%) | 0 (0.0%) |
| Health Diagnosing & Treating | 0 (0.0%) | 13 (100.0%) |
| Health Technologists | 0 (0.0%) | 0 (0.0%) |
| Total (Category) | 39 (26.5%) | 108 (73.5%) |
| Total (Overall) | 182 (31.7%) | 392 (68.3%) |
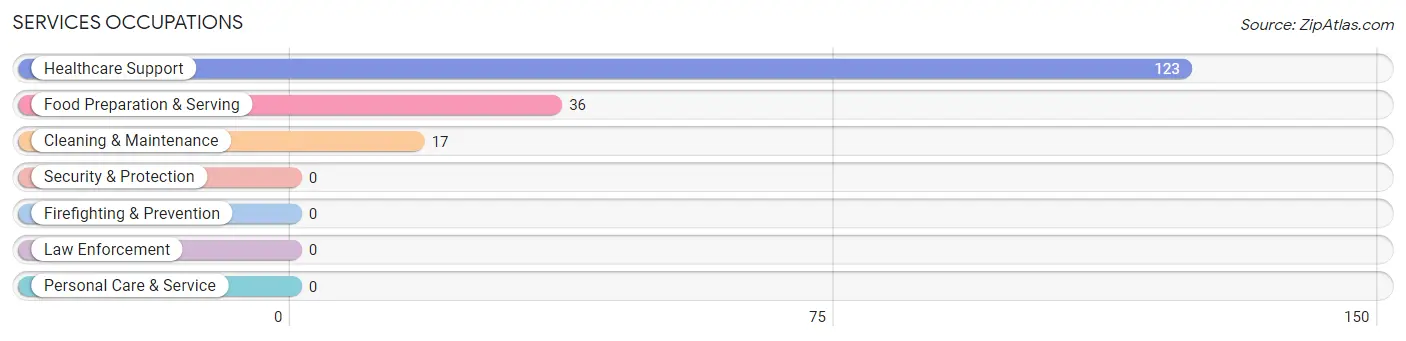
Services Occupations
The most common Services occupations in Mineville are Healthcare Support (123 | 21.4%), Food Preparation & Serving (36 | 6.3%), and Cleaning & Maintenance (17 | 3.0%).
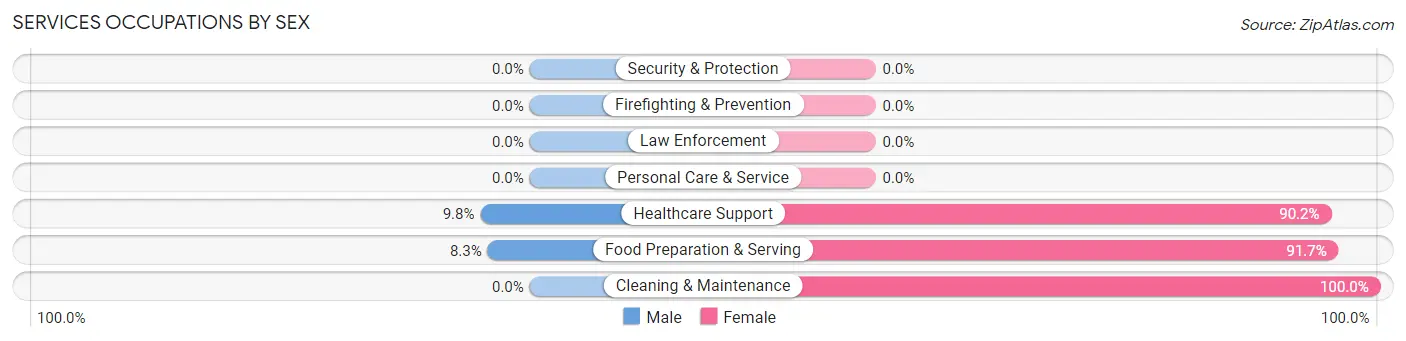
Services Occupations by Sex
Within the Services occupations in Mineville, the most male-oriented occupations are Healthcare Support (9.8%), and Food Preparation & Serving (8.3%), while the most female-oriented occupations are Cleaning & Maintenance (100.0%), Food Preparation & Serving (91.7%), and Healthcare Support (90.2%).
| Occupation | Male | Female |
| Healthcare Support | 12 (9.8%) | 111 (90.2%) |
| Security & Protection | 0 (0.0%) | 0 (0.0%) |
| Firefighting & Prevention | 0 (0.0%) | 0 (0.0%) |
| Law Enforcement | 0 (0.0%) | 0 (0.0%) |
| Food Preparation & Serving | 3 (8.3%) | 33 (91.7%) |
| Cleaning & Maintenance | 0 (0.0%) | 17 (100.0%) |
| Personal Care & Service | 0 (0.0%) | 0 (0.0%) |
| Total (Category) | 15 (8.5%) | 161 (91.5%) |
| Total (Overall) | 182 (31.7%) | 392 (68.3%) |
Sales and Office Occupations
The most common Sales and Office occupations in Mineville are , and Office & Administration (132 | 23.0%).
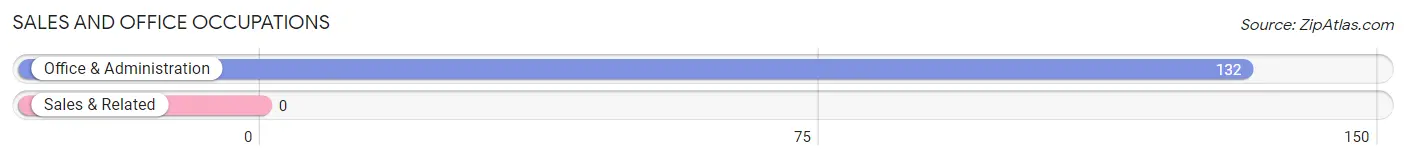
Sales and Office Occupations by Sex
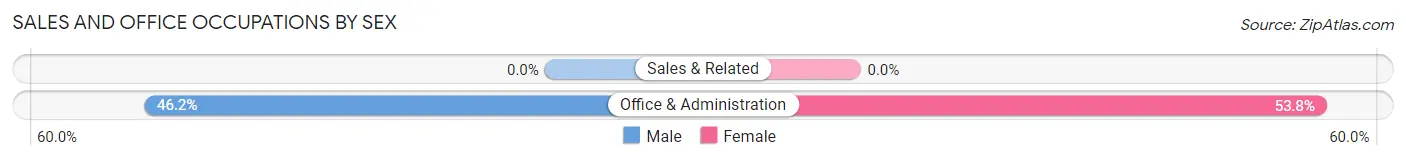
| Occupation | Male | Female |
| Sales & Related | 0 (0.0%) | 0 (0.0%) |
| Office & Administration | 61 (46.2%) | 71 (53.8%) |
| Total (Category) | 61 (46.2%) | 71 (53.8%) |
| Total (Overall) | 182 (31.7%) | 392 (68.3%) |
Natural Resources, Construction and Maintenance Occupations
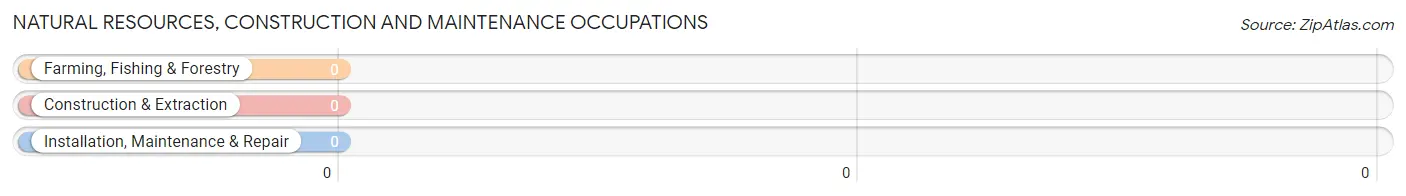
Natural Resources, Construction and Maintenance Occupations by Sex
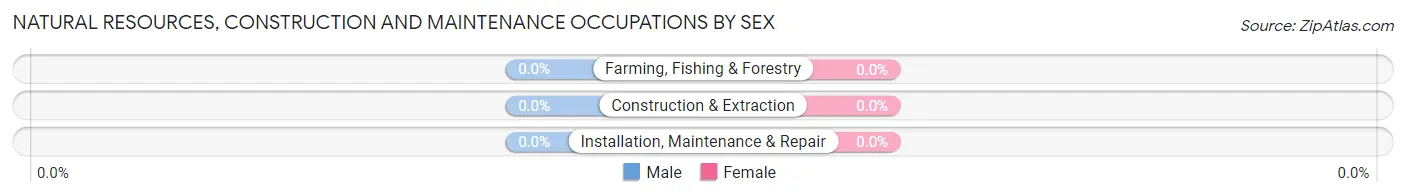
| Occupation | Male | Female |
| Farming, Fishing & Forestry | 0 (0.0%) | 0 (0.0%) |
| Construction & Extraction | 0 (0.0%) | 0 (0.0%) |
| Installation, Maintenance & Repair | 0 (0.0%) | 0 (0.0%) |
| Total (Category) | 0 (0.0%) | 0 (0.0%) |
| Total (Overall) | 182 (31.7%) | 392 (68.3%) |
Production, Transportation and Moving Occupations
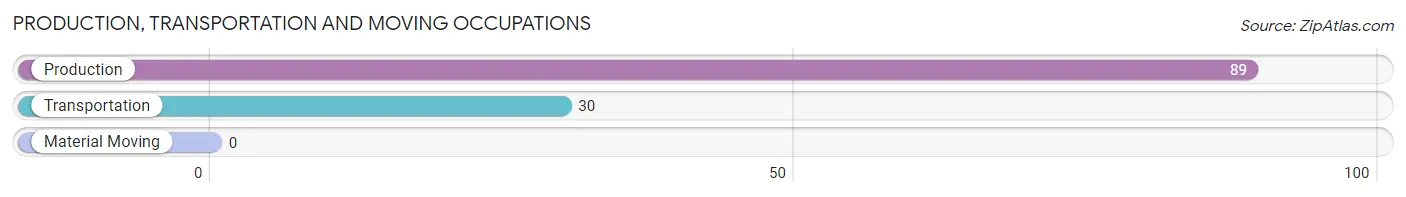
The most common Production, Transportation and Moving occupations in Mineville are Production (89 | 15.5%), and Transportation (30 | 5.2%).
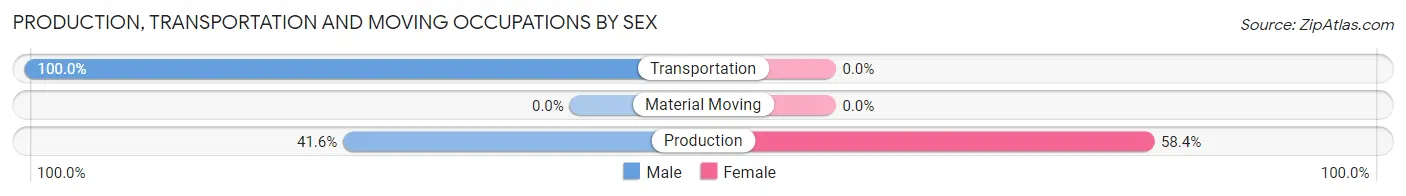
Production, Transportation and Moving Occupations by Sex
| Occupation | Male | Female |
| Production | 37 (41.6%) | 52 (58.4%) |
| Transportation | 30 (100.0%) | 0 (0.0%) |
| Material Moving | 0 (0.0%) | 0 (0.0%) |
| Total (Category) | 67 (56.3%) | 52 (43.7%) |
| Total (Overall) | 182 (31.7%) | 392 (68.3%) |
Employment Industries by Sex in Mineville
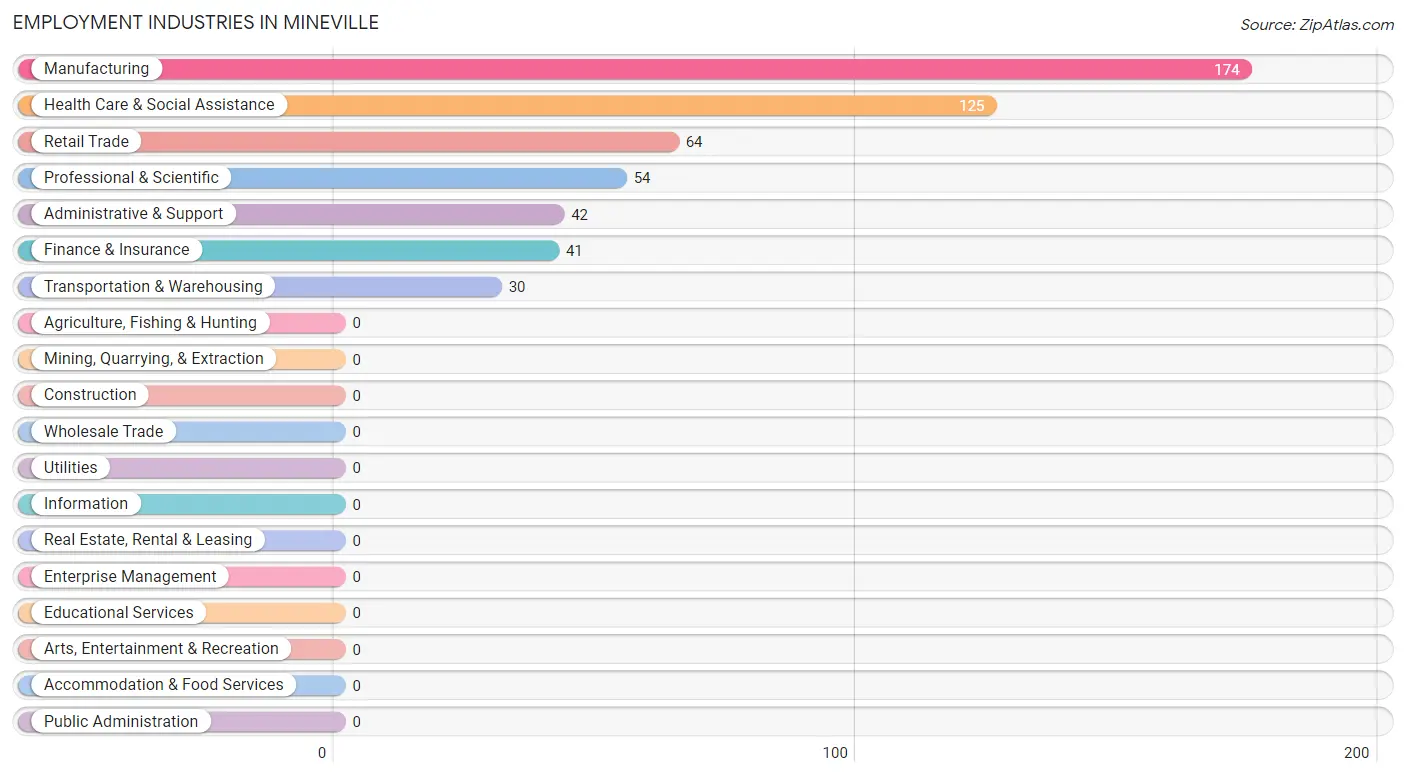
Employment Industries in Mineville
The major employment industries in Mineville include Manufacturing (174 | 30.3%), Health Care & Social Assistance (125 | 21.8%), Retail Trade (64 | 11.2%), Professional & Scientific (54 | 9.4%), and Administrative & Support (42 | 7.3%).
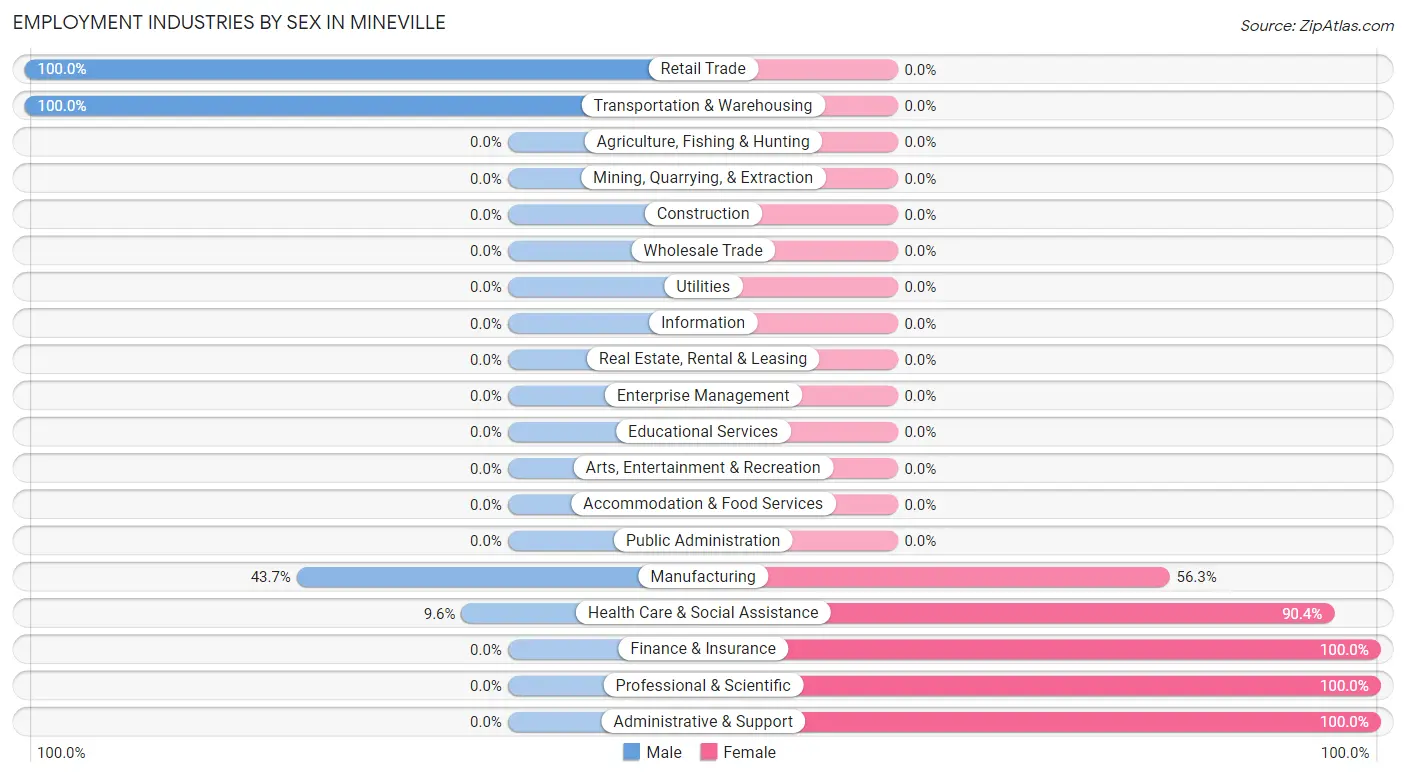
Employment Industries by Sex in Mineville
The Mineville industries that see more men than women are Retail Trade (100.0%), Transportation & Warehousing (100.0%), and Manufacturing (43.7%), whereas the industries that tend to have a higher number of women are Finance & Insurance (100.0%), Professional & Scientific (100.0%), and Administrative & Support (100.0%).
| Industry | Male | Female |
| Agriculture, Fishing & Hunting | 0 (0.0%) | 0 (0.0%) |
| Mining, Quarrying, & Extraction | 0 (0.0%) | 0 (0.0%) |
| Construction | 0 (0.0%) | 0 (0.0%) |
| Manufacturing | 76 (43.7%) | 98 (56.3%) |
| Wholesale Trade | 0 (0.0%) | 0 (0.0%) |
| Retail Trade | 64 (100.0%) | 0 (0.0%) |
| Transportation & Warehousing | 30 (100.0%) | 0 (0.0%) |
| Utilities | 0 (0.0%) | 0 (0.0%) |
| Information | 0 (0.0%) | 0 (0.0%) |
| Finance & Insurance | 0 (0.0%) | 41 (100.0%) |
| Real Estate, Rental & Leasing | 0 (0.0%) | 0 (0.0%) |
| Professional & Scientific | 0 (0.0%) | 54 (100.0%) |
| Enterprise Management | 0 (0.0%) | 0 (0.0%) |
| Administrative & Support | 0 (0.0%) | 42 (100.0%) |
| Educational Services | 0 (0.0%) | 0 (0.0%) |
| Health Care & Social Assistance | 12 (9.6%) | 113 (90.4%) |
| Arts, Entertainment & Recreation | 0 (0.0%) | 0 (0.0%) |
| Accommodation & Food Services | 0 (0.0%) | 0 (0.0%) |
| Public Administration | 0 (0.0%) | 0 (0.0%) |
| Total | 182 (31.7%) | 392 (68.3%) |
Education in Mineville
School Enrollment in Mineville
The most common levels of schooling among the 202 students in Mineville are nursery / preschool (58 | 28.7%), high school (52 | 25.7%), and college / undergraduate (43 | 21.3%).
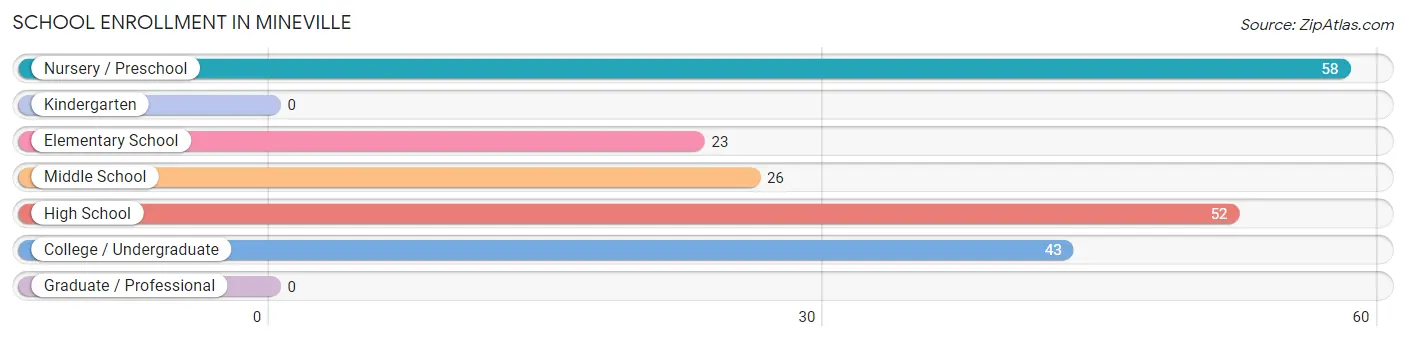
| School Level | # Students | % Students |
| Nursery / Preschool | 58 | 28.7% |
| Kindergarten | 0 | 0.0% |
| Elementary School | 23 | 11.4% |
| Middle School | 26 | 12.9% |
| High School | 52 | 25.7% |
| College / Undergraduate | 43 | 21.3% |
| Graduate / Professional | 0 | 0.0% |
| Total | 202 | 100.0% |
School Enrollment by Age by Funding Source in Mineville
Out of a total of 202 students who are enrolled in schools in Mineville, 16 (7.9%) attend a private institution, while the remaining 186 (92.1%) are enrolled in public schools. The age group of 35 years and over has the highest likelihood of being enrolled in private schools, with 5 (100.0% in the age bracket) enrolled. Conversely, the age group of 3 to 4 year olds has the lowest likelihood of being enrolled in a private school, with 58 (100.0% in the age bracket) attending a public institution.
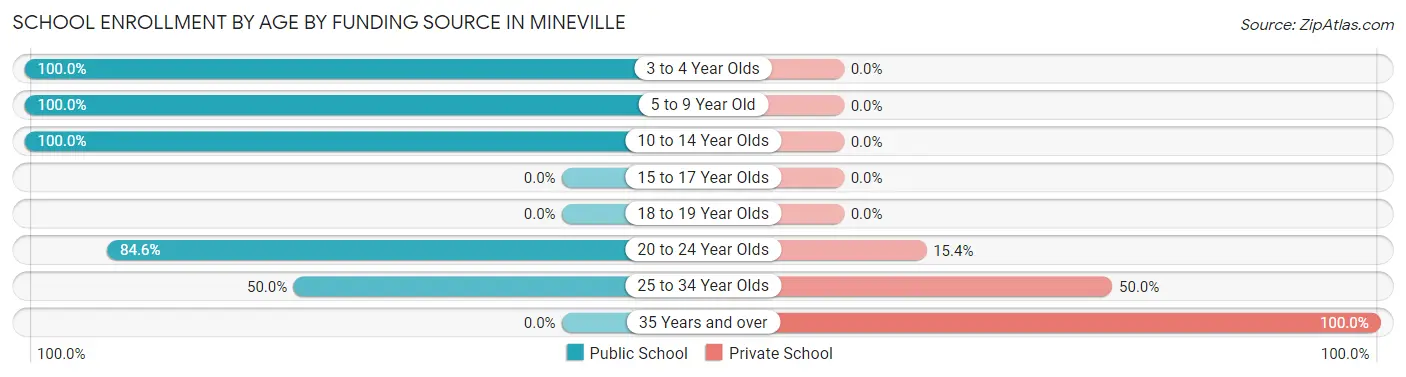
| Age Bracket | Public School | Private School |
| 3 to 4 Year Olds | 58 (100.0%) | 0 (0.0%) |
| 5 to 9 Year Old | 23 (100.0%) | 0 (0.0%) |
| 10 to 14 Year Olds | 67 (100.0%) | 0 (0.0%) |
| 15 to 17 Year Olds | 0 (0.0%) | 0 (0.0%) |
| 18 to 19 Year Olds | 0 (0.0%) | 0 (0.0%) |
| 20 to 24 Year Olds | 33 (84.6%) | 6 (15.4%) |
| 25 to 34 Year Olds | 5 (50.0%) | 5 (50.0%) |
| 35 Years and over | 0 (0.0%) | 5 (100.0%) |
| Total | 186 (92.1%) | 16 (7.9%) |
Educational Attainment by Field of Study in Mineville
Visual & performing arts (64 | 36.2%), business (57 | 32.2%), communications (39 | 22.0%), and engineering (17 | 9.6%) are the most common fields of study among 177 individuals in Mineville who have obtained a bachelor's degree or higher.
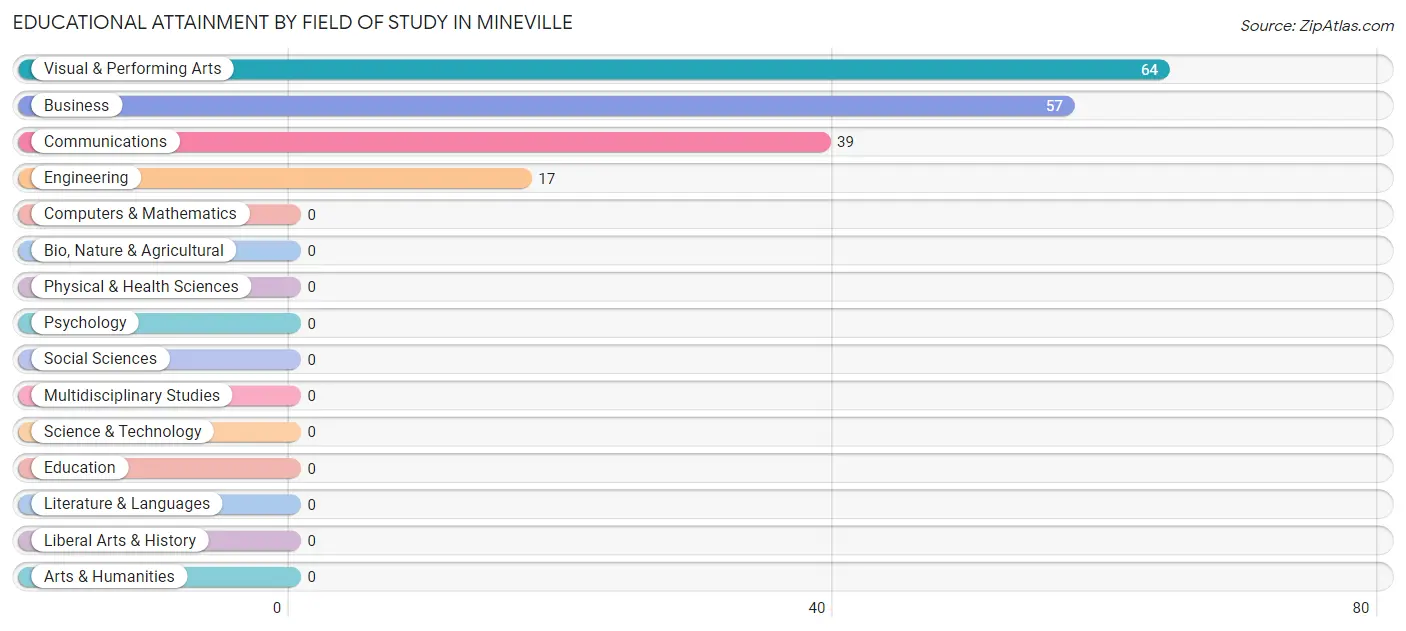
| Field of Study | # Graduates | % Graduates |
| Computers & Mathematics | 0 | 0.0% |
| Bio, Nature & Agricultural | 0 | 0.0% |
| Physical & Health Sciences | 0 | 0.0% |
| Psychology | 0 | 0.0% |
| Social Sciences | 0 | 0.0% |
| Engineering | 17 | 9.6% |
| Multidisciplinary Studies | 0 | 0.0% |
| Science & Technology | 0 | 0.0% |
| Business | 57 | 32.2% |
| Education | 0 | 0.0% |
| Literature & Languages | 0 | 0.0% |
| Liberal Arts & History | 0 | 0.0% |
| Visual & Performing Arts | 64 | 36.2% |
| Communications | 39 | 22.0% |
| Arts & Humanities | 0 | 0.0% |
| Total | 177 | 100.0% |
Transportation & Commute in Mineville
Vehicle Availability by Sex in Mineville
The most prevalent vehicle ownership categories in Mineville are males with 2 vehicles (137, accounting for 80.6%) and females with 2 vehicles (188, making up 39.4%).
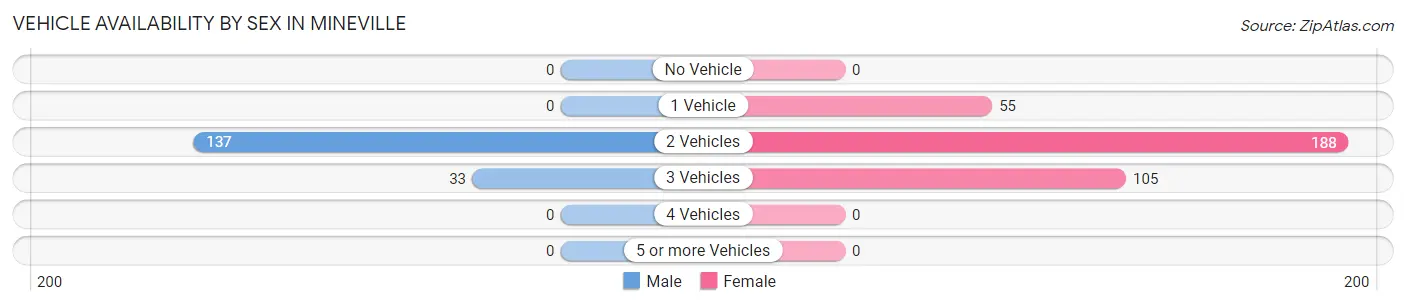
| Vehicles Available | Male | Female |
| No Vehicle | 0 (0.0%) | 0 (0.0%) |
| 1 Vehicle | 0 (0.0%) | 55 (15.8%) |
| 2 Vehicles | 137 (80.6%) | 188 (54.0%) |
| 3 Vehicles | 33 (19.4%) | 105 (30.2%) |
| 4 Vehicles | 0 (0.0%) | 0 (0.0%) |
| 5 or more Vehicles | 0 (0.0%) | 0 (0.0%) |
| Total | 170 (100.0%) | 348 (100.0%) |
Commute Time in Mineville
The most frequently occuring commute durations in Mineville are 10 to 14 minutes (106 commuters, 21.7%), 60 to 89 minutes (101 commuters, 20.7%), and 5 to 9 minutes (85 commuters, 17.4%).
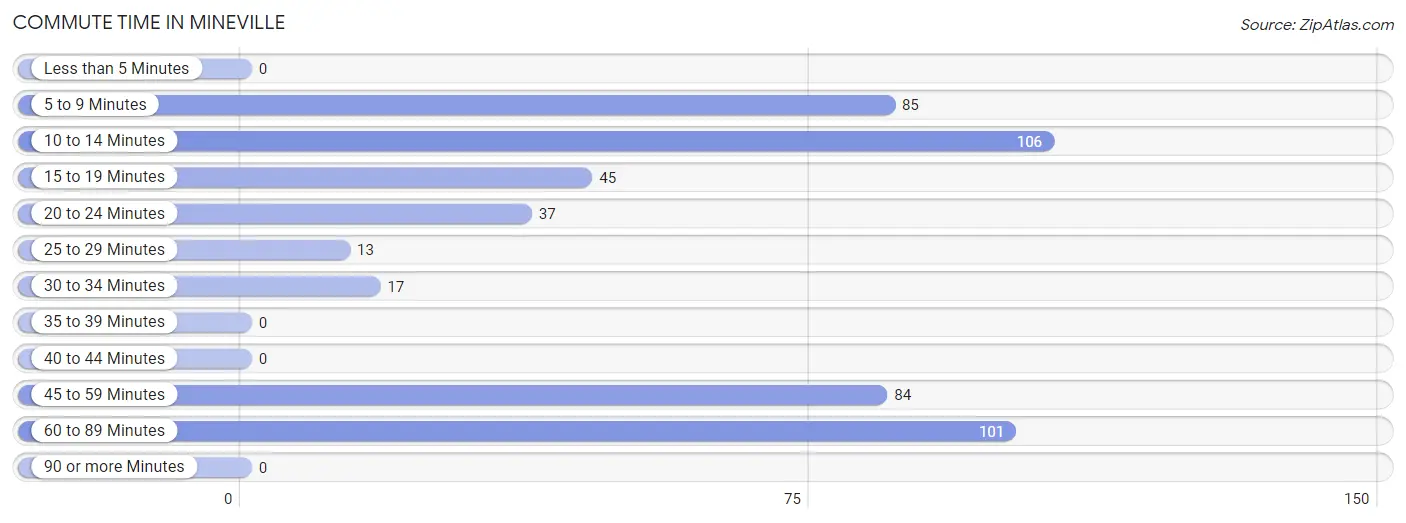
| Commute Time | # Commuters | % Commuters |
| Less than 5 Minutes | 0 | 0.0% |
| 5 to 9 Minutes | 85 | 17.4% |
| 10 to 14 Minutes | 106 | 21.7% |
| 15 to 19 Minutes | 45 | 9.2% |
| 20 to 24 Minutes | 37 | 7.6% |
| 25 to 29 Minutes | 13 | 2.7% |
| 30 to 34 Minutes | 17 | 3.5% |
| 35 to 39 Minutes | 0 | 0.0% |
| 40 to 44 Minutes | 0 | 0.0% |
| 45 to 59 Minutes | 84 | 17.2% |
| 60 to 89 Minutes | 101 | 20.7% |
| 90 or more Minutes | 0 | 0.0% |
Commute Time by Sex in Mineville
The most common commute times in Mineville are 60 to 89 minutes (101 commuters, 72.1%) for males and 10 to 14 minutes (106 commuters, 30.5%) for females.
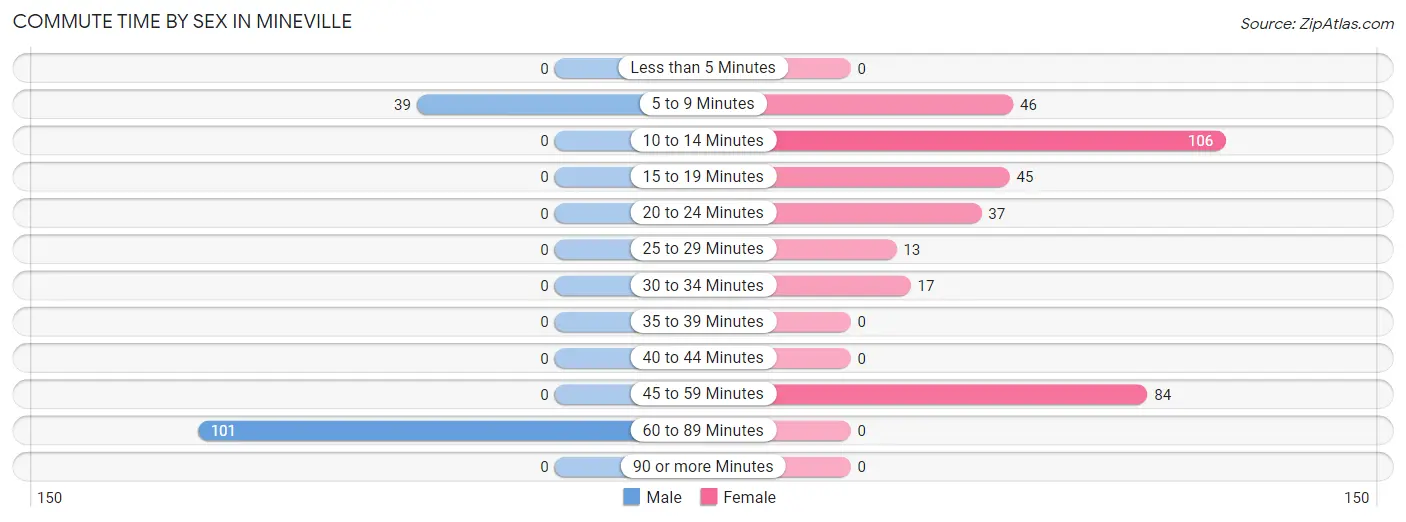
| Commute Time | Male | Female |
| Less than 5 Minutes | 0 (0.0%) | 0 (0.0%) |
| 5 to 9 Minutes | 39 (27.9%) | 46 (13.2%) |
| 10 to 14 Minutes | 0 (0.0%) | 106 (30.5%) |
| 15 to 19 Minutes | 0 (0.0%) | 45 (12.9%) |
| 20 to 24 Minutes | 0 (0.0%) | 37 (10.6%) |
| 25 to 29 Minutes | 0 (0.0%) | 13 (3.7%) |
| 30 to 34 Minutes | 0 (0.0%) | 17 (4.9%) |
| 35 to 39 Minutes | 0 (0.0%) | 0 (0.0%) |
| 40 to 44 Minutes | 0 (0.0%) | 0 (0.0%) |
| 45 to 59 Minutes | 0 (0.0%) | 84 (24.1%) |
| 60 to 89 Minutes | 101 (72.1%) | 0 (0.0%) |
| 90 or more Minutes | 0 (0.0%) | 0 (0.0%) |
Time of Departure to Work by Sex in Mineville
The most frequent times of departure to work in Mineville are 10:00 AM to 10:59 AM (61, 43.6%) for males and 7:30 AM to 7:59 AM (123, 35.3%) for females.
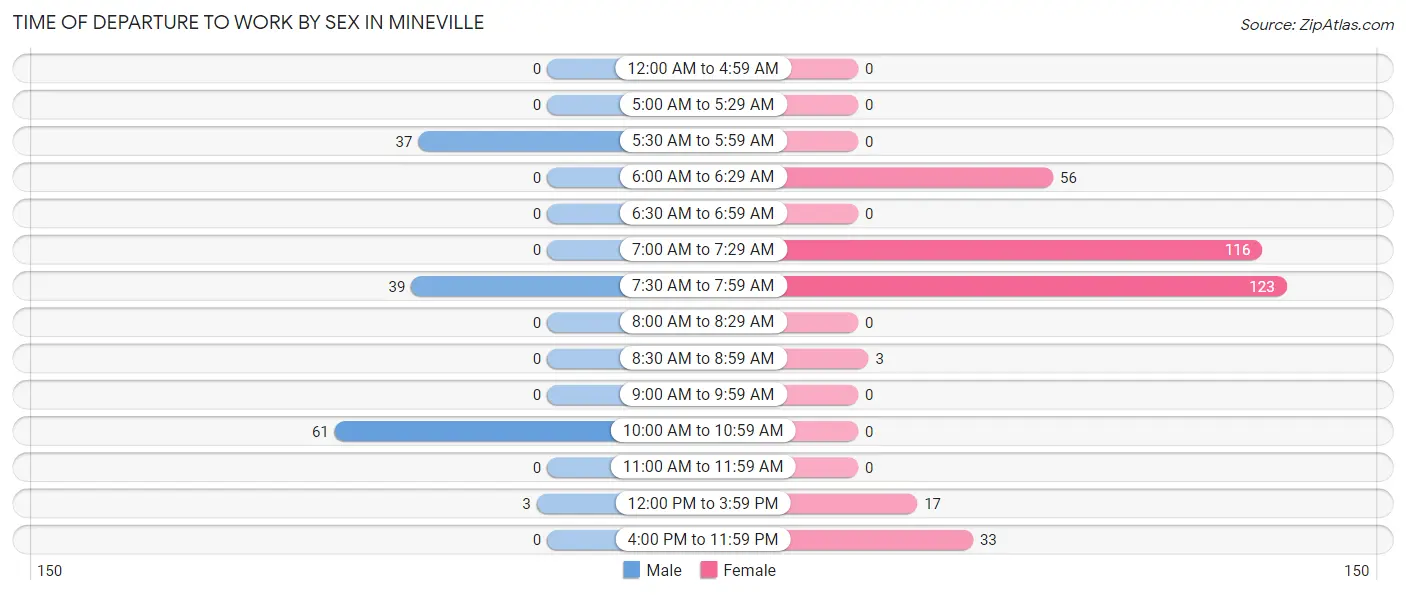
| Time of Departure | Male | Female |
| 12:00 AM to 4:59 AM | 0 (0.0%) | 0 (0.0%) |
| 5:00 AM to 5:29 AM | 0 (0.0%) | 0 (0.0%) |
| 5:30 AM to 5:59 AM | 37 (26.4%) | 0 (0.0%) |
| 6:00 AM to 6:29 AM | 0 (0.0%) | 56 (16.1%) |
| 6:30 AM to 6:59 AM | 0 (0.0%) | 0 (0.0%) |
| 7:00 AM to 7:29 AM | 0 (0.0%) | 116 (33.3%) |
| 7:30 AM to 7:59 AM | 39 (27.9%) | 123 (35.3%) |
| 8:00 AM to 8:29 AM | 0 (0.0%) | 0 (0.0%) |
| 8:30 AM to 8:59 AM | 0 (0.0%) | 3 (0.9%) |
| 9:00 AM to 9:59 AM | 0 (0.0%) | 0 (0.0%) |
| 10:00 AM to 10:59 AM | 61 (43.6%) | 0 (0.0%) |
| 11:00 AM to 11:59 AM | 0 (0.0%) | 0 (0.0%) |
| 12:00 PM to 3:59 PM | 3 (2.1%) | 17 (4.9%) |
| 4:00 PM to 11:59 PM | 0 (0.0%) | 33 (9.5%) |
| Total | 140 (100.0%) | 348 (100.0%) |
Housing Occupancy in Mineville
Occupancy by Ownership in Mineville
Of the total 488 dwellings in Mineville, owner-occupied units account for 375 (76.8%), while renter-occupied units make up 113 (23.2%).
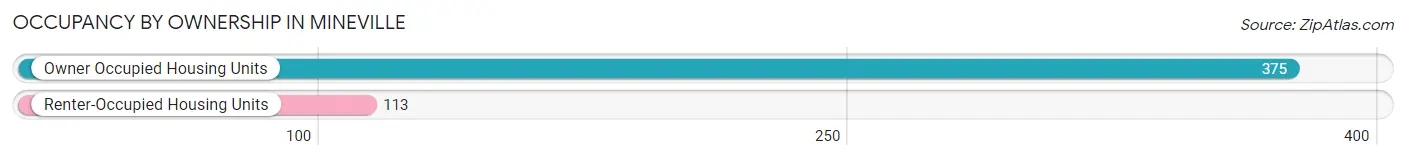
| Occupancy | # Housing Units | % Housing Units |
| Owner Occupied Housing Units | 375 | 76.8% |
| Renter-Occupied Housing Units | 113 | 23.2% |
| Total Occupied Housing Units | 488 | 100.0% |
Occupancy by Household Size in Mineville
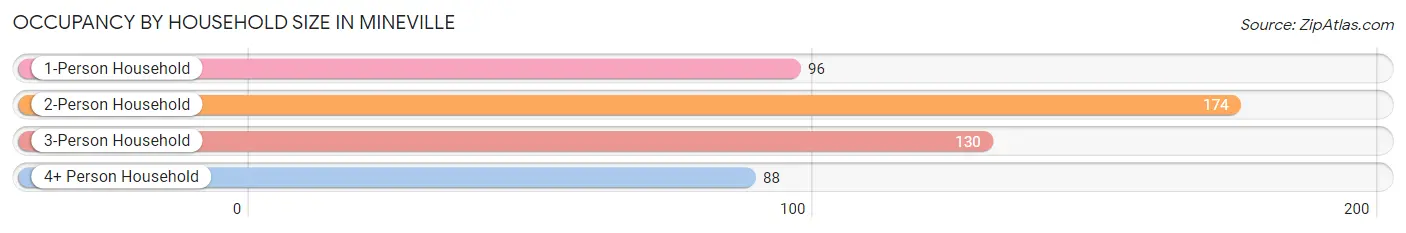
| Household Size | # Housing Units | % Housing Units |
| 1-Person Household | 96 | 19.7% |
| 2-Person Household | 174 | 35.7% |
| 3-Person Household | 130 | 26.6% |
| 4+ Person Household | 88 | 18.0% |
| Total Housing Units | 488 | 100.0% |
Occupancy by Ownership by Household Size in Mineville
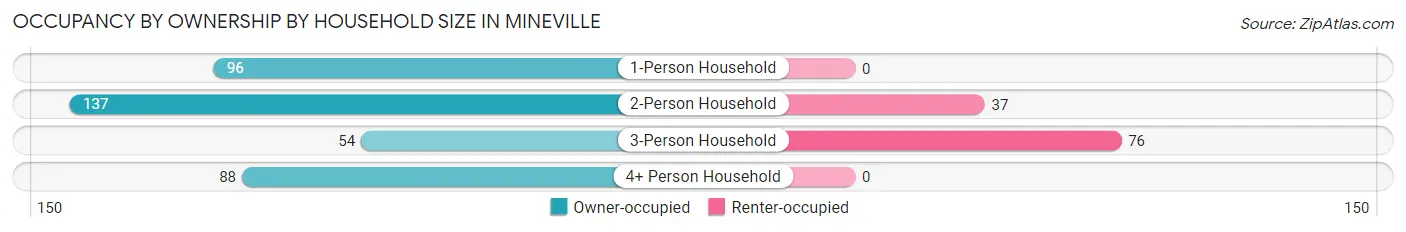
| Household Size | Owner-occupied | Renter-occupied |
| 1-Person Household | 96 (100.0%) | 0 (0.0%) |
| 2-Person Household | 137 (78.7%) | 37 (21.3%) |
| 3-Person Household | 54 (41.5%) | 76 (58.5%) |
| 4+ Person Household | 88 (100.0%) | 0 (0.0%) |
| Total Housing Units | 375 (76.8%) | 113 (23.2%) |
Occupancy by Educational Attainment in Mineville
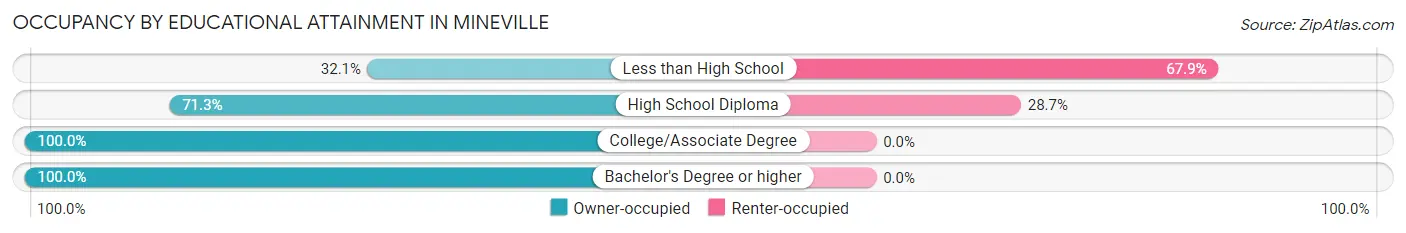
| Household Size | Owner-occupied | Renter-occupied |
| Less than High School | 36 (32.1%) | 76 (67.9%) |
| High School Diploma | 92 (71.3%) | 37 (28.7%) |
| College/Associate Degree | 112 (100.0%) | 0 (0.0%) |
| Bachelor's Degree or higher | 135 (100.0%) | 0 (0.0%) |
Occupancy by Age of Householder in Mineville
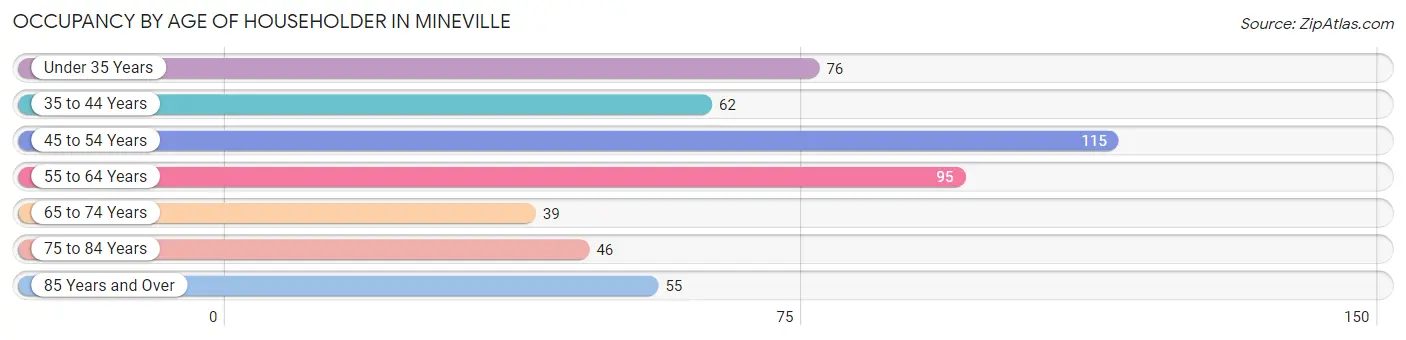
| Age Bracket | # Households | % Households |
| Under 35 Years | 76 | 15.6% |
| 35 to 44 Years | 62 | 12.7% |
| 45 to 54 Years | 115 | 23.6% |
| 55 to 64 Years | 95 | 19.5% |
| 65 to 74 Years | 39 | 8.0% |
| 75 to 84 Years | 46 | 9.4% |
| 85 Years and Over | 55 | 11.3% |
| Total | 488 | 100.0% |
Housing Finances in Mineville
Median Income by Occupancy in Mineville
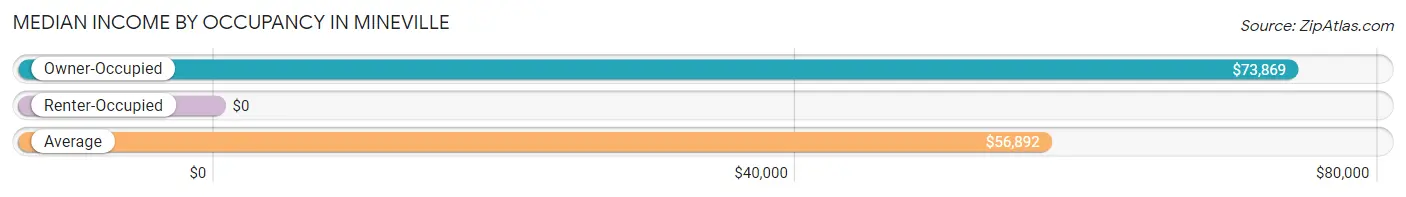
| Occupancy Type | # Households | Median Income |
| Owner-Occupied | 375 (76.8%) | $73,869 |
| Renter-Occupied | 113 (23.2%) | $0 |
| Average | 488 (100.0%) | $56,892 |
Occupancy by Householder Income Bracket in Mineville
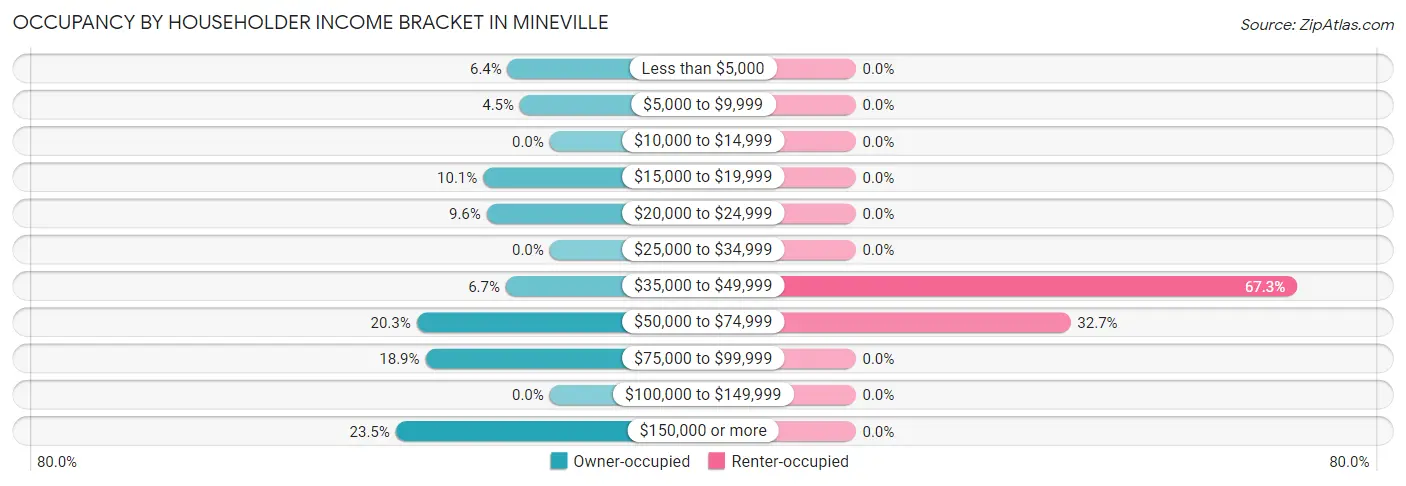
| Income Bracket | Owner-occupied | Renter-occupied |
| Less than $5,000 | 24 (6.4%) | 0 (0.0%) |
| $5,000 to $9,999 | 17 (4.5%) | 0 (0.0%) |
| $10,000 to $14,999 | 0 (0.0%) | 0 (0.0%) |
| $15,000 to $19,999 | 38 (10.1%) | 0 (0.0%) |
| $20,000 to $24,999 | 36 (9.6%) | 0 (0.0%) |
| $25,000 to $34,999 | 0 (0.0%) | 0 (0.0%) |
| $35,000 to $49,999 | 25 (6.7%) | 76 (67.3%) |
| $50,000 to $74,999 | 76 (20.3%) | 37 (32.7%) |
| $75,000 to $99,999 | 71 (18.9%) | 0 (0.0%) |
| $100,000 to $149,999 | 0 (0.0%) | 0 (0.0%) |
| $150,000 or more | 88 (23.5%) | 0 (0.0%) |
| Total | 375 (100.0%) | 113 (100.0%) |
Monthly Housing Cost Tiers in Mineville
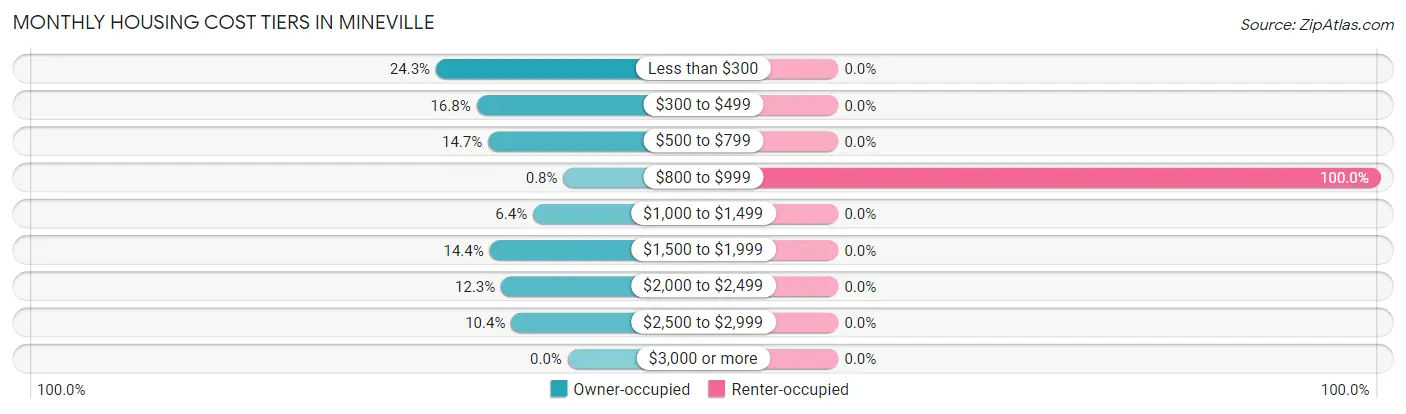
| Monthly Cost | Owner-occupied | Renter-occupied |
| Less than $300 | 91 (24.3%) | 0 (0.0%) |
| $300 to $499 | 63 (16.8%) | 0 (0.0%) |
| $500 to $799 | 55 (14.7%) | 0 (0.0%) |
| $800 to $999 | 3 (0.8%) | 113 (100.0%) |
| $1,000 to $1,499 | 24 (6.4%) | 0 (0.0%) |
| $1,500 to $1,999 | 54 (14.4%) | 0 (0.0%) |
| $2,000 to $2,499 | 46 (12.3%) | 0 (0.0%) |
| $2,500 to $2,999 | 39 (10.4%) | 0 (0.0%) |
| $3,000 or more | 0 (0.0%) | 0 (0.0%) |
| Total | 375 (100.0%) | 113 (100.0%) |
Physical Housing Characteristics in Mineville
Housing Structures in Mineville
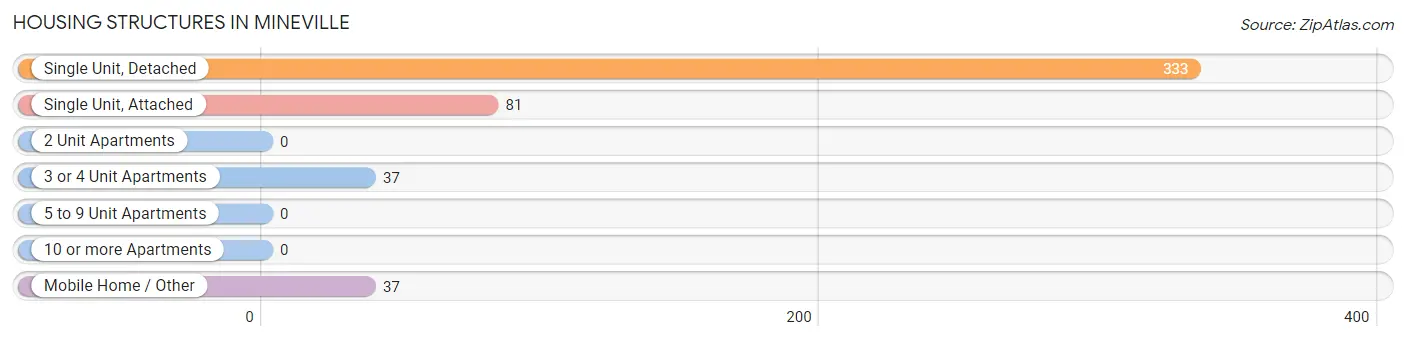
| Structure Type | # Housing Units | % Housing Units |
| Single Unit, Detached | 333 | 68.2% |
| Single Unit, Attached | 81 | 16.6% |
| 2 Unit Apartments | 0 | 0.0% |
| 3 or 4 Unit Apartments | 37 | 7.6% |
| 5 to 9 Unit Apartments | 0 | 0.0% |
| 10 or more Apartments | 0 | 0.0% |
| Mobile Home / Other | 37 | 7.6% |
| Total | 488 | 100.0% |
Housing Structures by Occupancy in Mineville
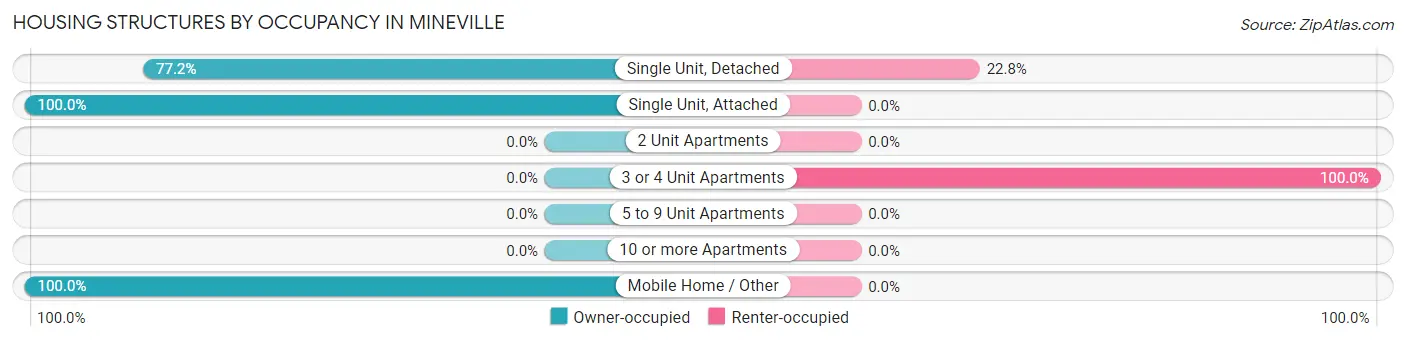
| Structure Type | Owner-occupied | Renter-occupied |
| Single Unit, Detached | 257 (77.2%) | 76 (22.8%) |
| Single Unit, Attached | 81 (100.0%) | 0 (0.0%) |
| 2 Unit Apartments | 0 (0.0%) | 0 (0.0%) |
| 3 or 4 Unit Apartments | 0 (0.0%) | 37 (100.0%) |
| 5 to 9 Unit Apartments | 0 (0.0%) | 0 (0.0%) |
| 10 or more Apartments | 0 (0.0%) | 0 (0.0%) |
| Mobile Home / Other | 37 (100.0%) | 0 (0.0%) |
| Total | 375 (76.8%) | 113 (23.2%) |
Housing Structures by Number of Rooms in Mineville
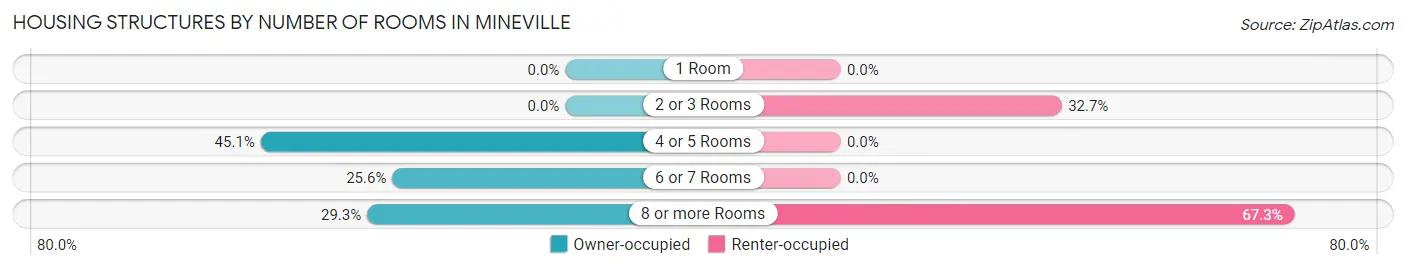
| Number of Rooms | Owner-occupied | Renter-occupied |
| 1 Room | 0 (0.0%) | 0 (0.0%) |
| 2 or 3 Rooms | 0 (0.0%) | 37 (32.7%) |
| 4 or 5 Rooms | 169 (45.1%) | 0 (0.0%) |
| 6 or 7 Rooms | 96 (25.6%) | 0 (0.0%) |
| 8 or more Rooms | 110 (29.3%) | 76 (67.3%) |
| Total | 375 (100.0%) | 113 (100.0%) |
Housing Structure by Heating Type in Mineville
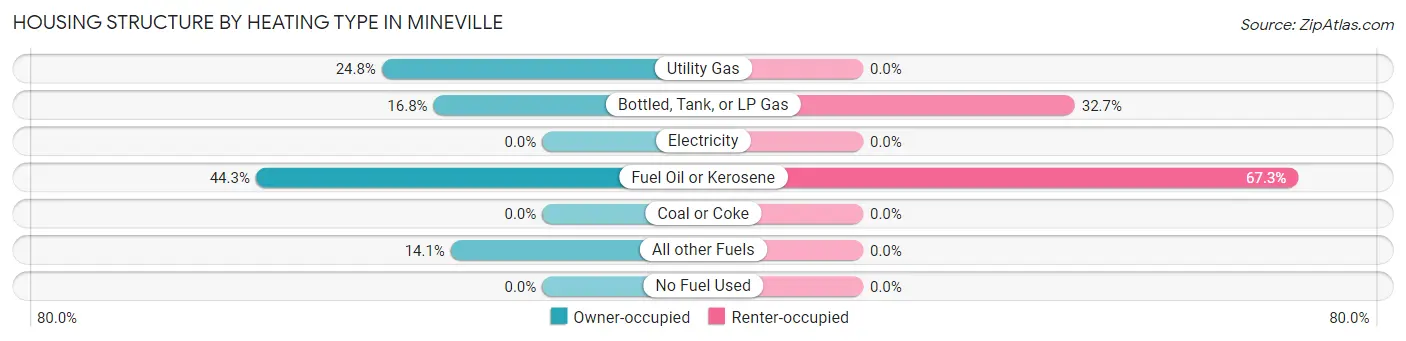
| Heating Type | Owner-occupied | Renter-occupied |
| Utility Gas | 93 (24.8%) | 0 (0.0%) |
| Bottled, Tank, or LP Gas | 63 (16.8%) | 37 (32.7%) |
| Electricity | 0 (0.0%) | 0 (0.0%) |
| Fuel Oil or Kerosene | 166 (44.3%) | 76 (67.3%) |
| Coal or Coke | 0 (0.0%) | 0 (0.0%) |
| All other Fuels | 53 (14.1%) | 0 (0.0%) |
| No Fuel Used | 0 (0.0%) | 0 (0.0%) |
| Total | 375 (100.0%) | 113 (100.0%) |
Household Vehicle Usage in Mineville
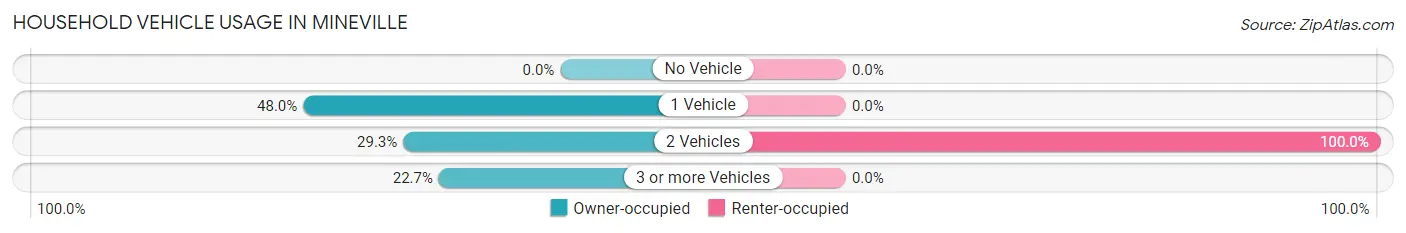
| Vehicles per Household | Owner-occupied | Renter-occupied |
| No Vehicle | 0 (0.0%) | 0 (0.0%) |
| 1 Vehicle | 180 (48.0%) | 0 (0.0%) |
| 2 Vehicles | 110 (29.3%) | 113 (100.0%) |
| 3 or more Vehicles | 85 (22.7%) | 0 (0.0%) |
| Total | 375 (100.0%) | 113 (100.0%) |
Real Estate & Mortgages in Mineville
Real Estate and Mortgage Overview in Mineville
| Characteristic | Without Mortgage | With Mortgage |
| Housing Units | 184 | 191 |
| Median Property Value | $82,000 | $0 |
| Median Household Income | - | - |
| Monthly Housing Costs | $303 | $0 |
| Real Estate Taxes | $1,240 | $0 |
Property Value by Mortgage Status in Mineville
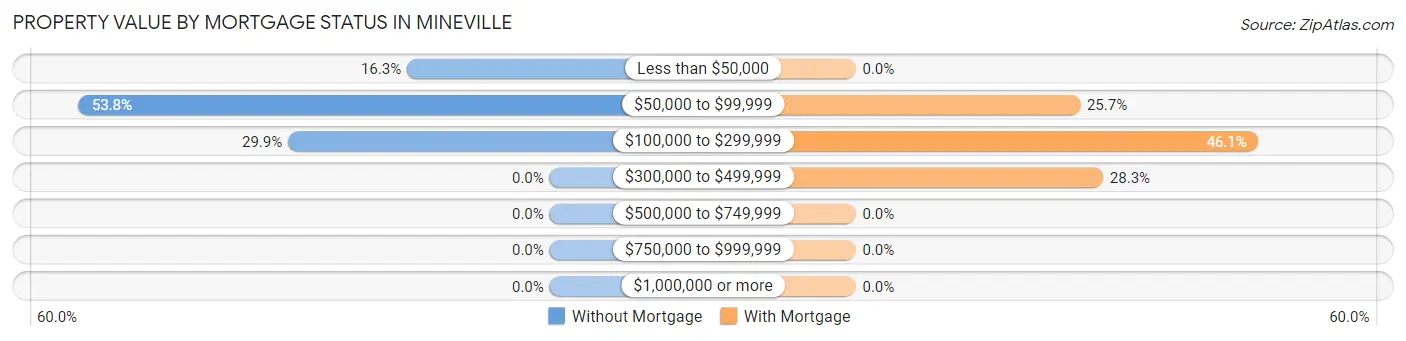
| Property Value | Without Mortgage | With Mortgage |
| Less than $50,000 | 30 (16.3%) | 0 (0.0%) |
| $50,000 to $99,999 | 99 (53.8%) | 49 (25.7%) |
| $100,000 to $299,999 | 55 (29.9%) | 88 (46.1%) |
| $300,000 to $499,999 | 0 (0.0%) | 54 (28.3%) |
| $500,000 to $749,999 | 0 (0.0%) | 0 (0.0%) |
| $750,000 to $999,999 | 0 (0.0%) | 0 (0.0%) |
| $1,000,000 or more | 0 (0.0%) | 0 (0.0%) |
| Total | 184 (100.0%) | 191 (100.0%) |
Household Income by Mortgage Status in Mineville
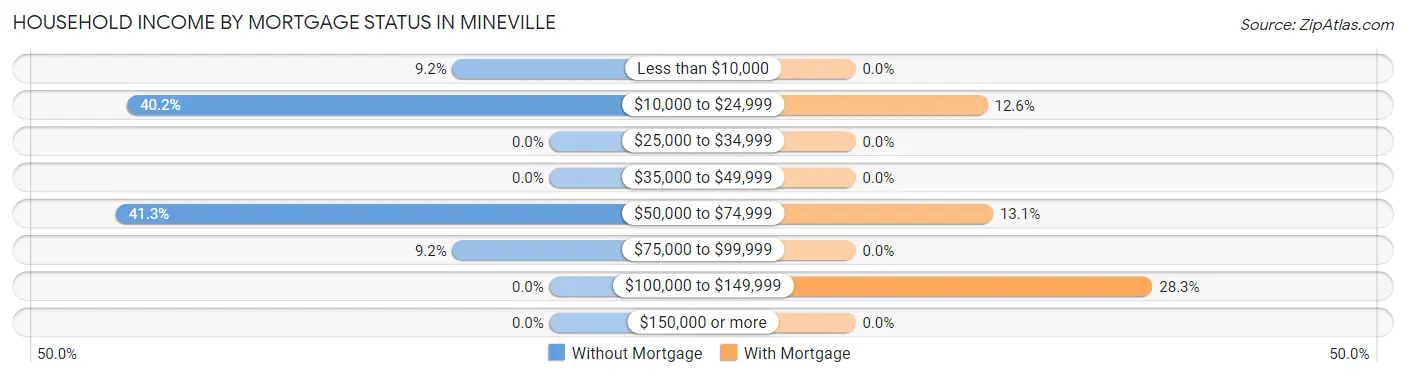
| Household Income | Without Mortgage | With Mortgage |
| Less than $10,000 | 17 (9.2%) | 0 (0.0%) |
| $10,000 to $24,999 | 74 (40.2%) | 24 (12.6%) |
| $25,000 to $34,999 | 0 (0.0%) | 0 (0.0%) |
| $35,000 to $49,999 | 0 (0.0%) | 0 (0.0%) |
| $50,000 to $74,999 | 76 (41.3%) | 25 (13.1%) |
| $75,000 to $99,999 | 17 (9.2%) | 0 (0.0%) |
| $100,000 to $149,999 | 0 (0.0%) | 54 (28.3%) |
| $150,000 or more | 0 (0.0%) | 0 (0.0%) |
| Total | 184 (100.0%) | 191 (100.0%) |
Property Value to Household Income Ratio in Mineville
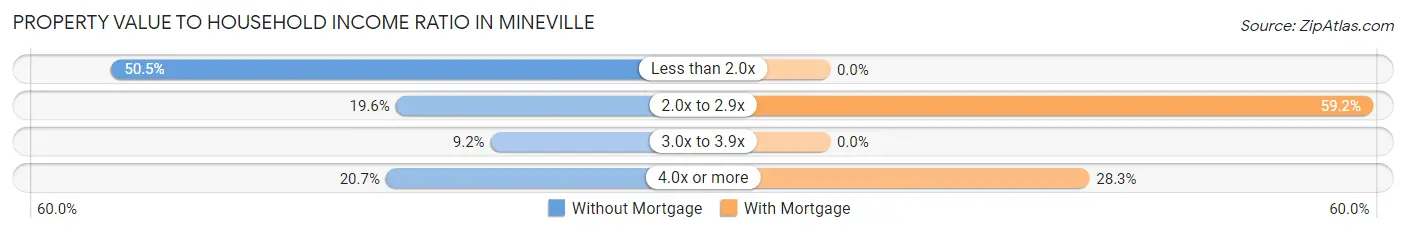
| Value-to-Income Ratio | Without Mortgage | With Mortgage |
| Less than 2.0x | 93 (50.5%) | 0 (0.0%) |
| 2.0x to 2.9x | 36 (19.6%) | 113 (59.2%) |
| 3.0x to 3.9x | 17 (9.2%) | 0 (0.0%) |
| 4.0x or more | 38 (20.6%) | 54 (28.3%) |
| Total | 184 (100.0%) | 191 (100.0%) |
Real Estate Taxes by Mortgage Status in Mineville
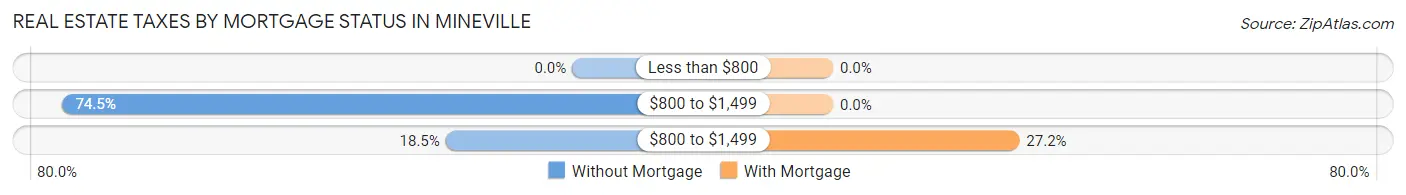
| Property Taxes | Without Mortgage | With Mortgage |
| Less than $800 | 0 (0.0%) | 0 (0.0%) |
| $800 to $1,499 | 137 (74.5%) | 0 (0.0%) |
| $800 to $1,499 | 34 (18.5%) | 52 (27.2%) |
| Total | 184 (100.0%) | 191 (100.0%) |
Health & Disability in Mineville
Health Insurance Coverage by Age in Mineville
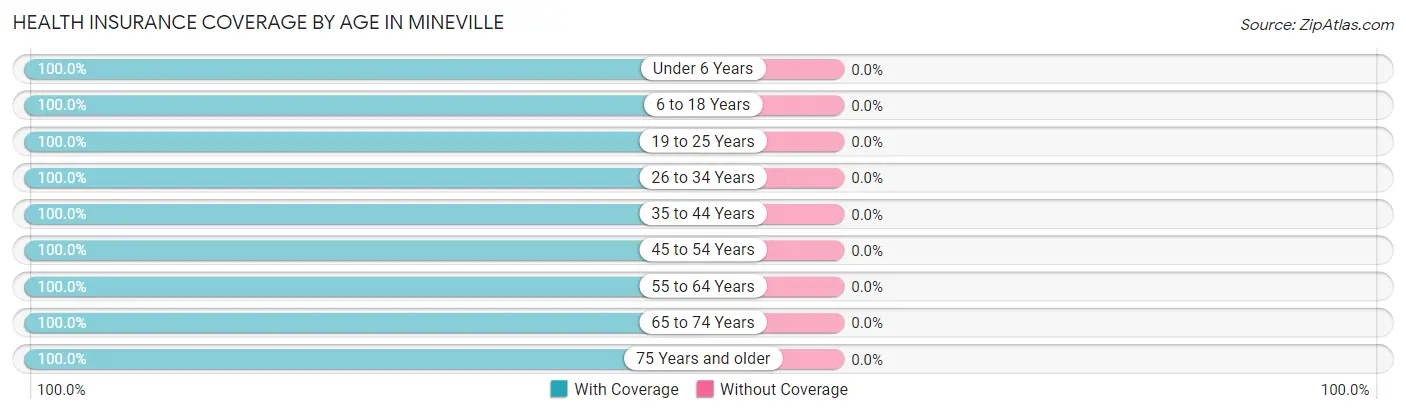
| Age Bracket | With Coverage | Without Coverage |
| Under 6 Years | 58 (100.0%) | 0 (0.0%) |
| 6 to 18 Years | 90 (100.0%) | 0 (0.0%) |
| 19 to 25 Years | 77 (100.0%) | 0 (0.0%) |
| 26 to 34 Years | 128 (100.0%) | 0 (0.0%) |
| 35 to 44 Years | 153 (100.0%) | 0 (0.0%) |
| 45 to 54 Years | 115 (100.0%) | 0 (0.0%) |
| 55 to 64 Years | 146 (100.0%) | 0 (0.0%) |
| 65 to 74 Years | 78 (100.0%) | 0 (0.0%) |
| 75 Years and older | 265 (100.0%) | 0 (0.0%) |
| Total | 1,110 (100.0%) | 0 (0.0%) |
Health Insurance Coverage by Citizenship Status in Mineville
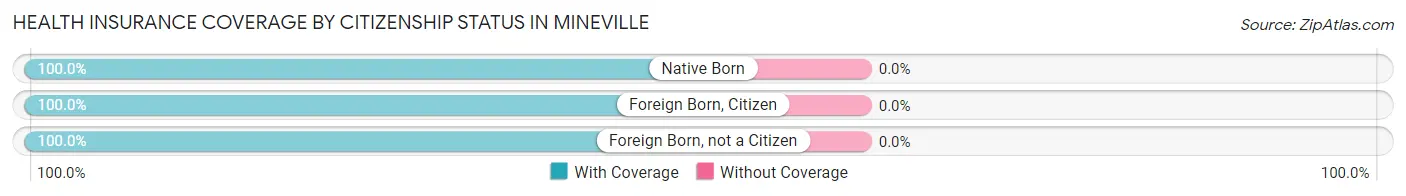
| Citizenship Status | With Coverage | Without Coverage |
| Native Born | 58 (100.0%) | 0 (0.0%) |
| Foreign Born, Citizen | 90 (100.0%) | 0 (0.0%) |
| Foreign Born, not a Citizen | 77 (100.0%) | 0 (0.0%) |
Health Insurance Coverage by Household Income in Mineville
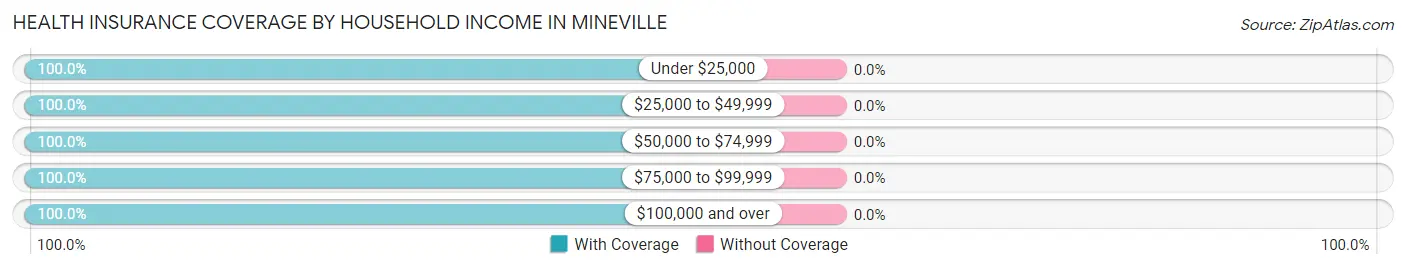
| Household Income | With Coverage | Without Coverage |
| Under $25,000 | 151 (100.0%) | 0 (0.0%) |
| $25,000 to $49,999 | 226 (100.0%) | 0 (0.0%) |
| $50,000 to $74,999 | 210 (100.0%) | 0 (0.0%) |
| $75,000 to $99,999 | 202 (100.0%) | 0 (0.0%) |
| $100,000 and over | 321 (100.0%) | 0 (0.0%) |
Public vs Private Health Insurance Coverage by Age in Mineville
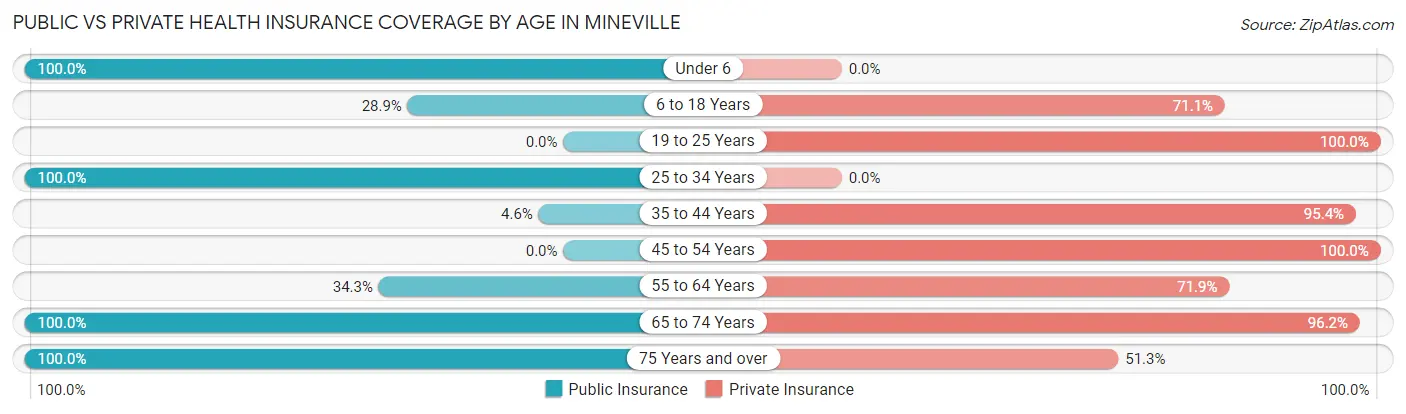
| Age Bracket | Public Insurance | Private Insurance |
| Under 6 | 58 (100.0%) | 0 (0.0%) |
| 6 to 18 Years | 26 (28.9%) | 64 (71.1%) |
| 19 to 25 Years | 0 (0.0%) | 77 (100.0%) |
| 25 to 34 Years | 128 (100.0%) | 0 (0.0%) |
| 35 to 44 Years | 7 (4.6%) | 146 (95.4%) |
| 45 to 54 Years | 0 (0.0%) | 115 (100.0%) |
| 55 to 64 Years | 50 (34.3%) | 105 (71.9%) |
| 65 to 74 Years | 78 (100.0%) | 75 (96.2%) |
| 75 Years and over | 265 (100.0%) | 136 (51.3%) |
| Total | 612 (55.1%) | 718 (64.7%) |
Disability Status by Sex by Age in Mineville
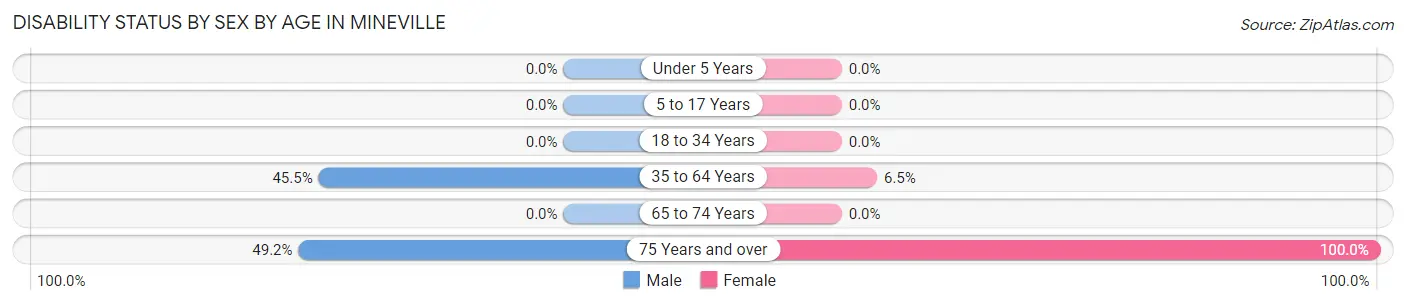
| Age Bracket | Male | Female |
| Under 5 Years | 0 (0.0%) | 0 (0.0%) |
| 5 to 17 Years | 0 (0.0%) | 0 (0.0%) |
| 18 to 34 Years | 0 (0.0%) | 0 (0.0%) |
| 35 to 64 Years | 70 (45.5%) | 17 (6.5%) |
| 65 to 74 Years | 0 (0.0%) | 0 (0.0%) |
| 75 Years and over | 61 (49.2%) | 141 (100.0%) |
Disability Class by Sex by Age in Mineville
Disability Class: Hearing Difficulty
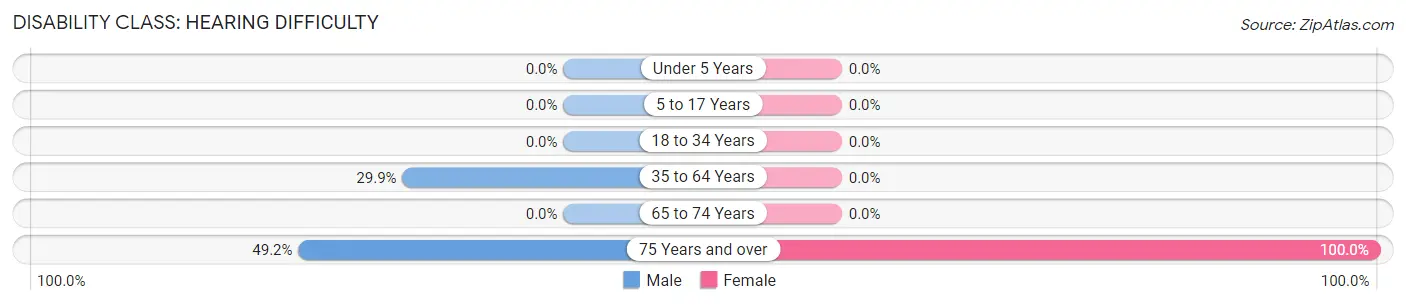
| Age Bracket | Male | Female |
| Under 5 Years | 0 (0.0%) | 0 (0.0%) |
| 5 to 17 Years | 0 (0.0%) | 0 (0.0%) |
| 18 to 34 Years | 0 (0.0%) | 0 (0.0%) |
| 35 to 64 Years | 46 (29.9%) | 0 (0.0%) |
| 65 to 74 Years | 0 (0.0%) | 0 (0.0%) |
| 75 Years and over | 61 (49.2%) | 141 (100.0%) |
Disability Class: Vision Difficulty
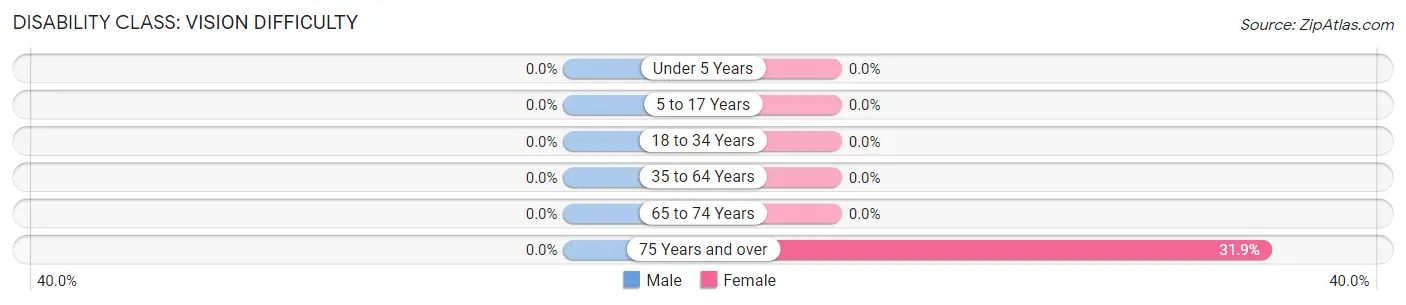
| Age Bracket | Male | Female |
| Under 5 Years | 0 (0.0%) | 0 (0.0%) |
| 5 to 17 Years | 0 (0.0%) | 0 (0.0%) |
| 18 to 34 Years | 0 (0.0%) | 0 (0.0%) |
| 35 to 64 Years | 0 (0.0%) | 0 (0.0%) |
| 65 to 74 Years | 0 (0.0%) | 0 (0.0%) |
| 75 Years and over | 0 (0.0%) | 45 (31.9%) |
Disability Class: Cognitive Difficulty
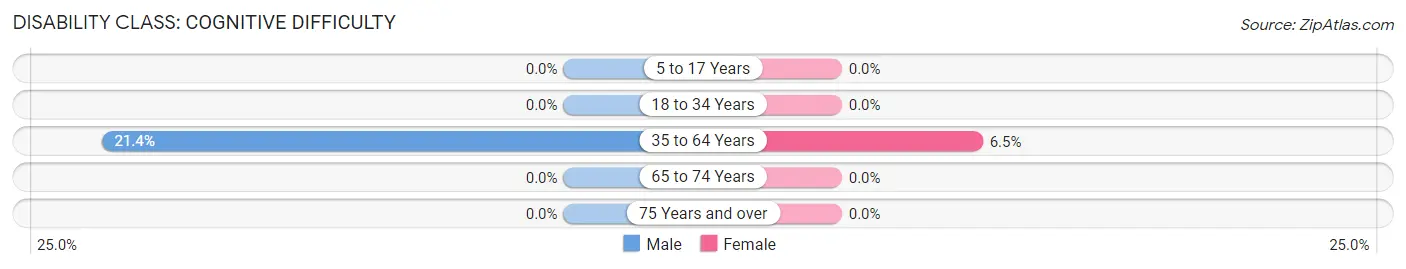
| Age Bracket | Male | Female |
| 5 to 17 Years | 0 (0.0%) | 0 (0.0%) |
| 18 to 34 Years | 0 (0.0%) | 0 (0.0%) |
| 35 to 64 Years | 33 (21.4%) | 17 (6.5%) |
| 65 to 74 Years | 0 (0.0%) | 0 (0.0%) |
| 75 Years and over | 0 (0.0%) | 0 (0.0%) |
Disability Class: Ambulatory Difficulty
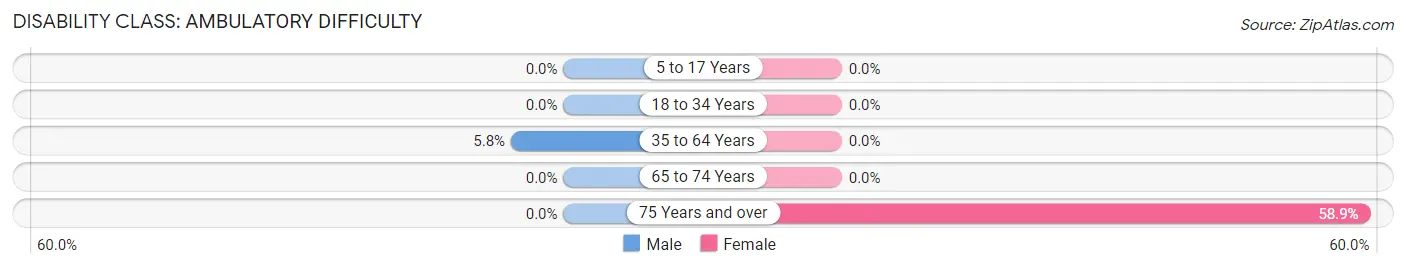
| Age Bracket | Male | Female |
| 5 to 17 Years | 0 (0.0%) | 0 (0.0%) |
| 18 to 34 Years | 0 (0.0%) | 0 (0.0%) |
| 35 to 64 Years | 9 (5.8%) | 0 (0.0%) |
| 65 to 74 Years | 0 (0.0%) | 0 (0.0%) |
| 75 Years and over | 0 (0.0%) | 83 (58.9%) |
Disability Class: Self-Care Difficulty
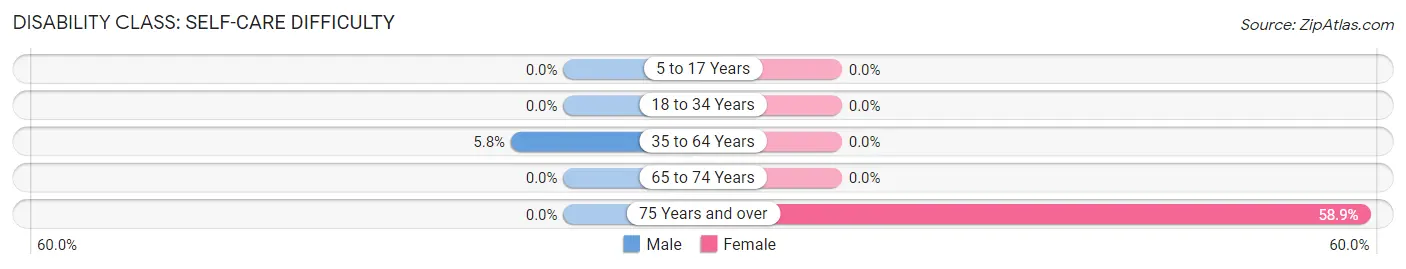
| Age Bracket | Male | Female |
| 5 to 17 Years | 0 (0.0%) | 0 (0.0%) |
| 18 to 34 Years | 0 (0.0%) | 0 (0.0%) |
| 35 to 64 Years | 9 (5.8%) | 0 (0.0%) |
| 65 to 74 Years | 0 (0.0%) | 0 (0.0%) |
| 75 Years and over | 0 (0.0%) | 83 (58.9%) |
Technology Access in Mineville
Computing Device Access in Mineville
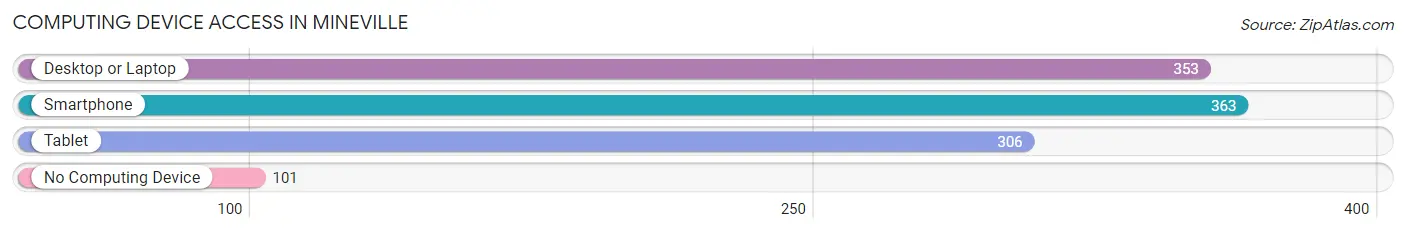
| Device Type | # Households | % Households |
| Desktop or Laptop | 353 | 72.3% |
| Smartphone | 363 | 74.4% |
| Tablet | 306 | 62.7% |
| No Computing Device | 101 | 20.7% |
| Total | 488 | 100.0% |
Internet Access in Mineville
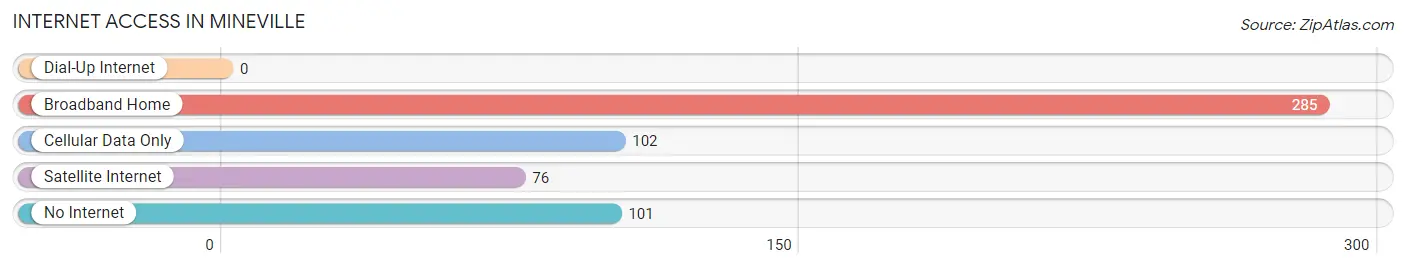
| Internet Type | # Households | % Households |
| Dial-Up Internet | 0 | 0.0% |
| Broadband Home | 285 | 58.4% |
| Cellular Data Only | 102 | 20.9% |
| Satellite Internet | 76 | 15.6% |
| No Internet | 101 | 20.7% |
| Total | 488 | 100.0% |
Mineville Summary
Mineville is a hamlet located in the town of Moriah in Essex County, New York. It is situated on the western shore of Lake Champlain, near the Vermont border. The hamlet is home to a population of approximately 1,000 people.
Geography
Mineville is located in the Adirondack Mountains region of New York. It is situated on the western shore of Lake Champlain, near the Vermont border. The hamlet is surrounded by the towns of Moriah, Crown Point, and Ticonderoga. The terrain is mostly hilly and wooded, with some open fields. The highest point in the area is Mount Moriah, which rises to an elevation of 2,890 feet.
The climate in Mineville is humid continental, with cold winters and warm summers. The average annual temperature is around 40°F, with an average high of around 70°F in the summer and an average low of around 20°F in the winter. The average annual precipitation is around 40 inches.
Economy
The economy of Mineville is largely based on tourism and recreation. The hamlet is home to several resorts and campgrounds, as well as a marina. There are also several restaurants and shops in the area.
The hamlet is also home to several small businesses, including a lumber mill, a sawmill, and a stone quarry. The lumber mill and sawmill are owned by the same company, and the stone quarry is owned by a local family.
Demographics
As of the 2010 census, the population of Mineville was 1,000. The racial makeup of the hamlet was 97.2% White, 0.7% African American, 0.3% Native American, 0.2% Asian, 0.1% Pacific Islander, and 1.5% from other races. Hispanic or Latino of any race were 1.2% of the population.
The median household income in Mineville was $41,250, and the median family income was $45,000. The per capita income was $19,000. About 10.3% of families and 13.2% of the population were below the poverty line, including 17.2% of those under age 18 and 8.3% of those age 65 or over.
The majority of the population of Mineville is employed in the service industry, with many working in the tourism and recreation sector. Other industries in the area include manufacturing, retail, and construction.
Conclusion
Mineville is a small hamlet located in the Adirondack Mountains region of New York. It is situated on the western shore of Lake Champlain, near the Vermont border. The hamlet is home to a population of approximately 1,000 people. The economy of Mineville is largely based on tourism and recreation, with several resorts and campgrounds, as well as a marina. The hamlet is also home to several small businesses, including a lumber mill, a sawmill, and a stone quarry. The majority of the population of Mineville is employed in the service industry, with many working in the tourism and recreation sector.
Common Questions
What is the Total Population of Mineville?
Total Population of Mineville is 1,246.
What is the Total Male Population of Mineville?
Total Male Population of Mineville is 593.
What is the Total Female Population of Mineville?
Total Female Population of Mineville is 653.
What is the Ratio of Males per 100 Females in Mineville?
There are 90.81 Males per 100 Females in Mineville.
What is the Ratio of Females per 100 Males in Mineville?
There are 110.12 Females per 100 Males in Mineville.
What is the Median Population Age in Mineville?
Median Population Age in Mineville is 44.9 Years.
What is the Average Family Size in Mineville
Average Family Size in Mineville is 2.5 People.
What is the Average Household Size in Mineville
Average Household Size in Mineville is 2.3 People.
What is Per Capita Income in Mineville?
Per Capita income in Mineville is $26,767.
What is the Median Family Income in Mineville?
Median Family Income in Mineville is $73,995.
What is the Median Household income in Mineville?
Median Household Income in Mineville is $56,892.
What is Inequality or Gini Index in Mineville?
Inequality or Gini Index in Mineville is 0.41.
How Large is the Labor Force in Mineville?
There are 574 People in the Labor Forcein in Mineville.
What is the Percentage of People in the Labor Force in Mineville?
52.3% of People are in the Labor Force in Mineville.