Hudson Lake, IN
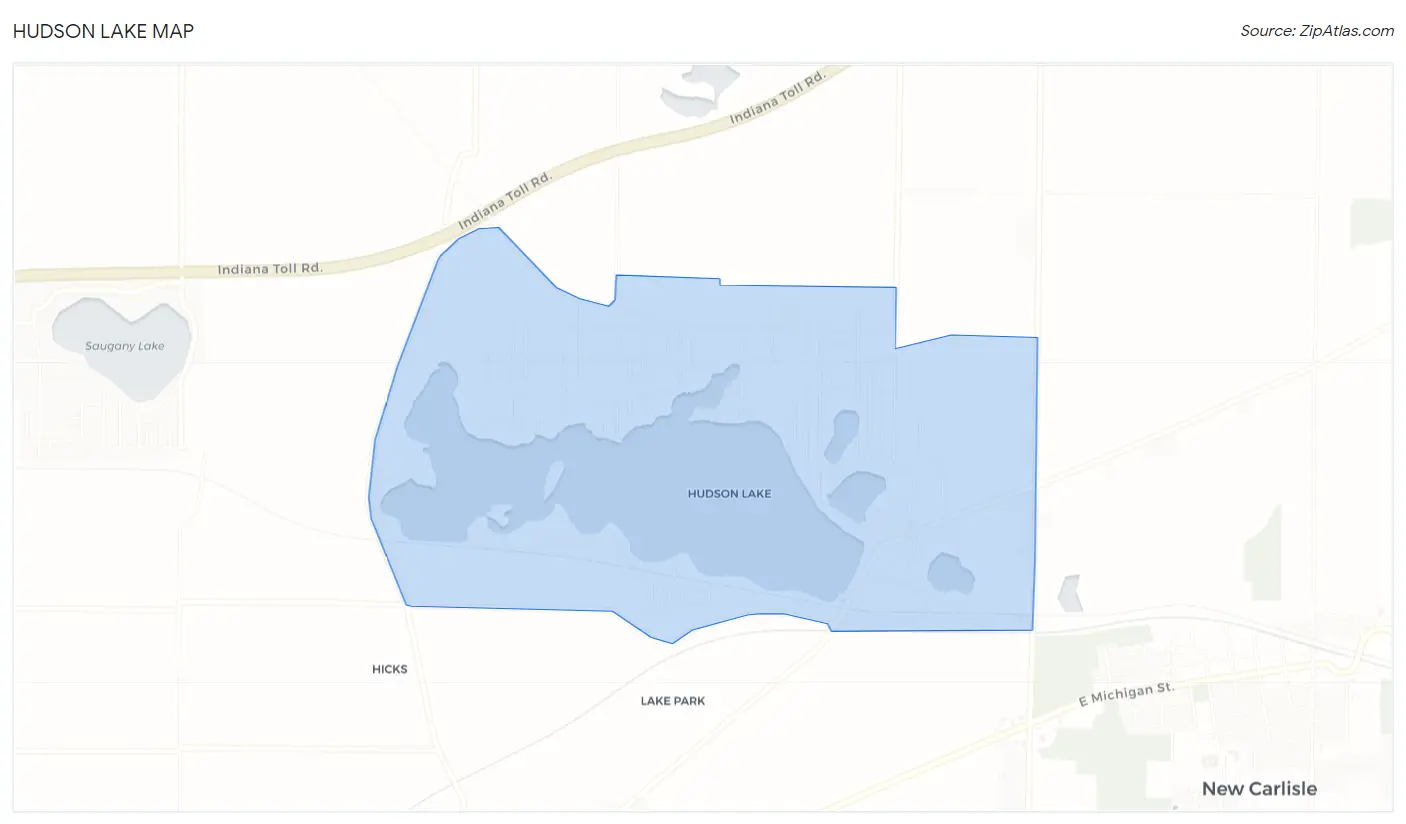
Hudson Lake Map
Hudson Lake Overview
1,370
TOTAL POPULATION
721
MALE POPULATION
649
FEMALE POPULATION
111.09
MALES / 100 FEMALES
90.01
FEMALES / 100 MALES
38.1
MEDIAN AGE
2.9
AVG FAMILY SIZE
2.9
AVG HOUSEHOLD SIZE
$31,173
PER CAPITA INCOME
$82,083
AVG FAMILY INCOME
$88,885
AVG HOUSEHOLD INCOME
0.29
INEQUALITY / GINI INDEX
535
LABOR FORCE [ PEOPLE ]
53.4%
PERCENT IN LABOR FORCE
3.4%
UNEMPLOYMENT RATE
Race in Hudson Lake
The most populous races in Hudson Lake are White / Caucasian (1,284 | 93.7%), Two or more Races (86 | 6.3%), and Hispanic or Latino (23 | 1.7%).
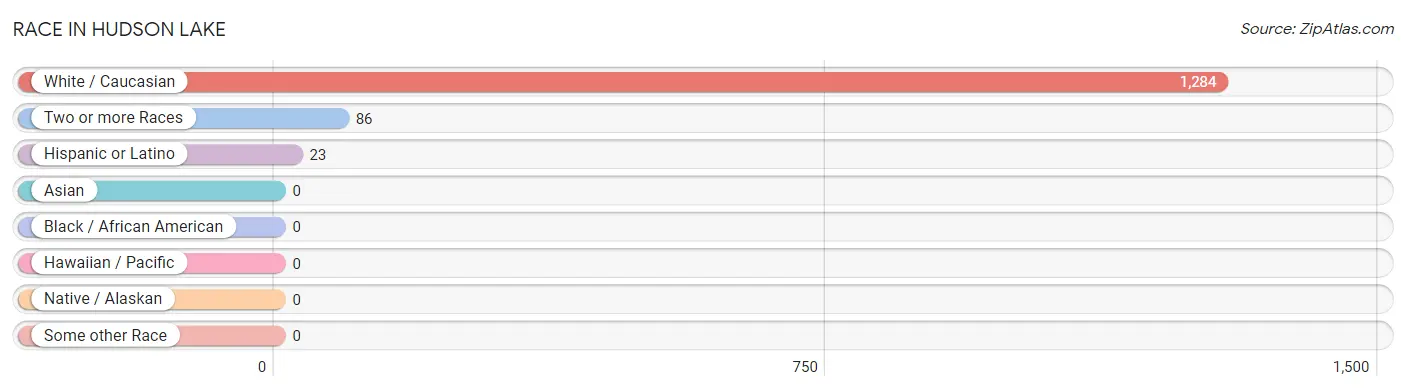
| Race | # Population | % Population |
| Asian | 0 | 0.0% |
| Black / African American | 0 | 0.0% |
| Hawaiian / Pacific | 0 | 0.0% |
| Hispanic or Latino | 23 | 1.7% |
| Native / Alaskan | 0 | 0.0% |
| White / Caucasian | 1,284 | 93.7% |
| Two or more Races | 86 | 6.3% |
| Some other Race | 0 | 0.0% |
| Total | 1,370 | 100.0% |
Ancestry in Hudson Lake
The most populous ancestries reported in Hudson Lake are German (244 | 17.8%), Irish (104 | 7.6%), Polish (98 | 7.1%), English (54 | 3.9%), and Bhutanese (49 | 3.6%), together accounting for 40.1% of all Hudson Lake residents.
| Ancestry | # Population | % Population |
| American | 4 | 0.3% |
| Bhutanese | 49 | 3.6% |
| English | 54 | 3.9% |
| German | 244 | 17.8% |
| Irish | 104 | 7.6% |
| Italian | 35 | 2.5% |
| Lithuanian | 17 | 1.2% |
| Mexican | 23 | 1.7% |
| Polish | 98 | 7.1% |
| Scottish | 17 | 1.2% |
| Swedish | 16 | 1.2% |
| Welsh | 17 | 1.2% | View All 12 Rows |
Immigrants in Hudson Lake
The most numerous immigrant groups reported in Hudson Lake came from Asia (22 | 1.6%), Philippines (22 | 1.6%), and South Eastern Asia (22 | 1.6%), together accounting for 4.8% of all Hudson Lake residents.

| Immigration Origin | # Population | % Population |
| Asia | 22 | 1.6% |
| Philippines | 22 | 1.6% |
| South Eastern Asia | 22 | 1.6% | View All 3 Rows |
Sex and Age in Hudson Lake
Sex and Age in Hudson Lake
The most populous age groups in Hudson Lake are 10 to 14 Years (129 | 17.9%) for men and 45 to 49 Years (78 | 12.0%) for women.

| Age Bracket | Male | Female |
| Under 5 Years | 42 (5.8%) | 0 (0.0%) |
| 5 to 9 Years | 28 (3.9%) | 76 (11.7%) |
| 10 to 14 Years | 129 (17.9%) | 39 (6.0%) |
| 15 to 19 Years | 86 (11.9%) | 48 (7.4%) |
| 20 to 24 Years | 0 (0.0%) | 35 (5.4%) |
| 25 to 29 Years | 35 (4.9%) | 0 (0.0%) |
| 30 to 34 Years | 35 (4.9%) | 42 (6.5%) |
| 35 to 39 Years | 89 (12.3%) | 49 (7.5%) |
| 40 to 44 Years | 33 (4.6%) | 51 (7.9%) |
| 45 to 49 Years | 48 (6.7%) | 78 (12.0%) |
| 50 to 54 Years | 4 (0.5%) | 11 (1.7%) |
| 55 to 59 Years | 12 (1.7%) | 42 (6.5%) |
| 60 to 64 Years | 69 (9.6%) | 17 (2.6%) |
| 65 to 69 Years | 28 (3.9%) | 60 (9.2%) |
| 70 to 74 Years | 33 (4.6%) | 65 (10.0%) |
| 75 to 79 Years | 50 (6.9%) | 36 (5.6%) |
| 80 to 84 Years | 0 (0.0%) | 0 (0.0%) |
| 85 Years and over | 0 (0.0%) | 0 (0.0%) |
| Total | 721 (100.0%) | 649 (100.0%) |
Families and Households in Hudson Lake
Median Family Size in Hudson Lake
The median family size in Hudson Lake is 2.88 persons per family, with single female/mother families (36 | 8.1%) accounting for the largest median family size of 4.03 persons per family. On the other hand, single male/father families (102 | 23.0%) represent the smallest median family size with 2.14 persons per family.
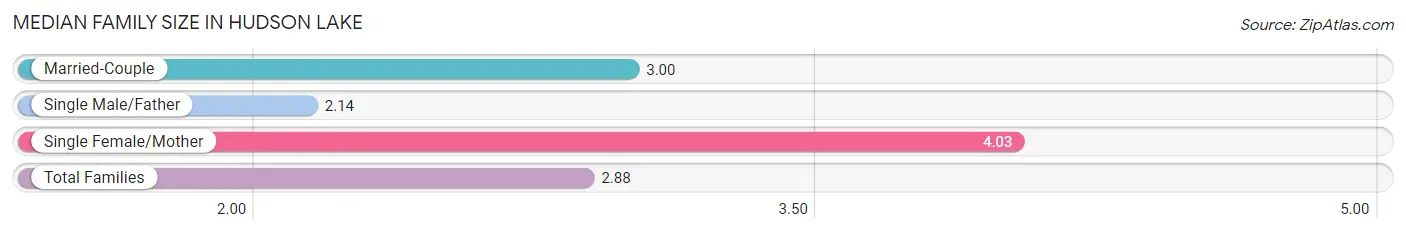
| Family Type | # Families | Family Size |
| Married-Couple | 306 (68.9%) | 3.00 |
| Single Male/Father | 102 (23.0%) | 2.14 |
| Single Female/Mother | 36 (8.1%) | 4.03 |
| Total Families | 444 (100.0%) | 2.88 |
Median Household Size in Hudson Lake
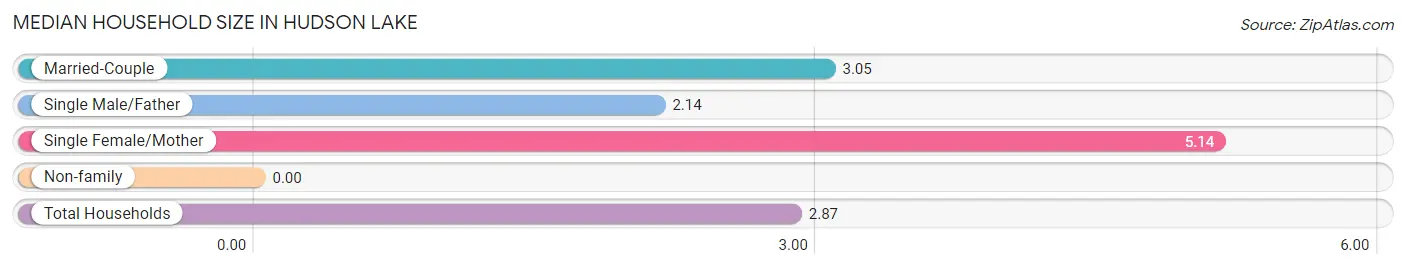
| Household Type | # Households | Household Size |
| Married-Couple | 306 (64.1%) | 3.05 |
| Single Male/Father | 102 (21.4%) | 2.14 |
| Single Female/Mother | 36 (7.5%) | 5.14 |
| Non-family | 33 (6.9%) | - |
| Total Households | 477 (100.0%) | 2.87 |
Household Size by Marriage Status in Hudson Lake
Out of a total of 477 households in Hudson Lake, 444 (93.1%) are family households, while 33 (6.9%) are nonfamily households. The most numerous type of family households are 2-person households, comprising 278, and the most common type of nonfamily households are 1-person households, comprising 33.
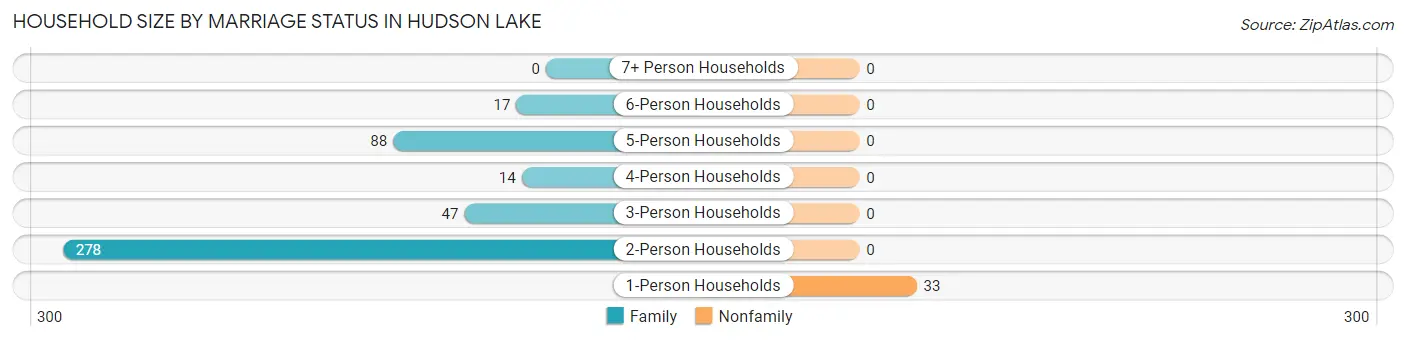
| Household Size | Family Households | Nonfamily Households |
| 1-Person Households | - | 33 (6.9%) |
| 2-Person Households | 278 (58.3%) | 0 (0.0%) |
| 3-Person Households | 47 (9.9%) | 0 (0.0%) |
| 4-Person Households | 14 (2.9%) | 0 (0.0%) |
| 5-Person Households | 88 (18.4%) | 0 (0.0%) |
| 6-Person Households | 17 (3.6%) | 0 (0.0%) |
| 7+ Person Households | 0 (0.0%) | 0 (0.0%) |
| Total | 444 (93.1%) | 33 (6.9%) |
Female Fertility in Hudson Lake
Fertility by Age in Hudson Lake
| Age Bracket | Women with Births | Births / 1,000 Women |
| 15 to 19 years | 0 (0.0%) | 0.0 |
| 20 to 34 years | 0 (0.0%) | 0.0 |
| 35 to 50 years | 0 (0.0%) | 0.0 |
| Total | 0 (0.0%) | 0.0 |
Fertility by Age by Marriage Status in Hudson Lake
| Age Bracket | Married | Unmarried |
| 15 to 19 years | 0 (0.0%) | 0 (0.0%) |
| 20 to 34 years | 0 (0.0%) | 0 (0.0%) |
| 35 to 50 years | 0 (0.0%) | 0 (0.0%) |
| Total | 0 (0.0%) | 0 (0.0%) |
Fertility by Education in Hudson Lake

| Educational Attainment | Women with Births | Births / 1,000 Women |
| Less than High School | 0 (0.0%) | 0.0 |
| High School Diploma | 0 (0.0%) | 0.0 |
| College or Associate's Degree | 0 (0.0%) | 0.0 |
| Bachelor's Degree | 0 (0.0%) | 0.0 |
| Graduate Degree | 0 (0.0%) | 0.0 |
| Total | 0 (0.0%) | 0.0 |
Fertility by Education by Marriage Status in Hudson Lake
| Educational Attainment | Married | Unmarried |
| Less than High School | 0 (0.0%) | 0 (0.0%) |
| High School Diploma | 0 (0.0%) | 0 (0.0%) |
| College or Associate's Degree | 0 (0.0%) | 0 (0.0%) |
| Bachelor's Degree | 0 (0.0%) | 0 (0.0%) |
| Graduate Degree | 0 (0.0%) | 0 (0.0%) |
| Total | 0 (0.0%) | 0 (0.0%) |
Income in Hudson Lake
Income Overview in Hudson Lake
Per Capita Income in Hudson Lake is $31,173, while median incomes of families and households are $82,083 and $88,885 respectively.
| Characteristic | Number | Measure |
| Per Capita Income | 1,370 | $31,173 |
| Median Family Income | 444 | $82,083 |
| Mean Family Income | 444 | $83,450 |
| Median Household Income | 477 | $88,885 |
| Mean Household Income | 477 | $87,080 |
| Income Deficit | 444 | $0 |
| Wage / Income Gap (%) | 1,370 | 0.00% |
| Wage / Income Gap ($) | 1,370 | 100.00¢ per $1 |
| Gini / Inequality Index | 1,370 | 0.29 |
Earnings by Sex in Hudson Lake

| Sex | Number | Average Earnings |
| Male | 341 (56.5%) | $73,162 |
| Female | 263 (43.5%) | $0 |
| Total | 604 (100.0%) | $66,087 |
Earnings by Sex by Income Bracket in Hudson Lake
The most common earnings brackets in Hudson Lake are $75,000 to $99,999 for men (93 | 27.3%) and $75,000 to $99,999 for women (57 | 21.7%).
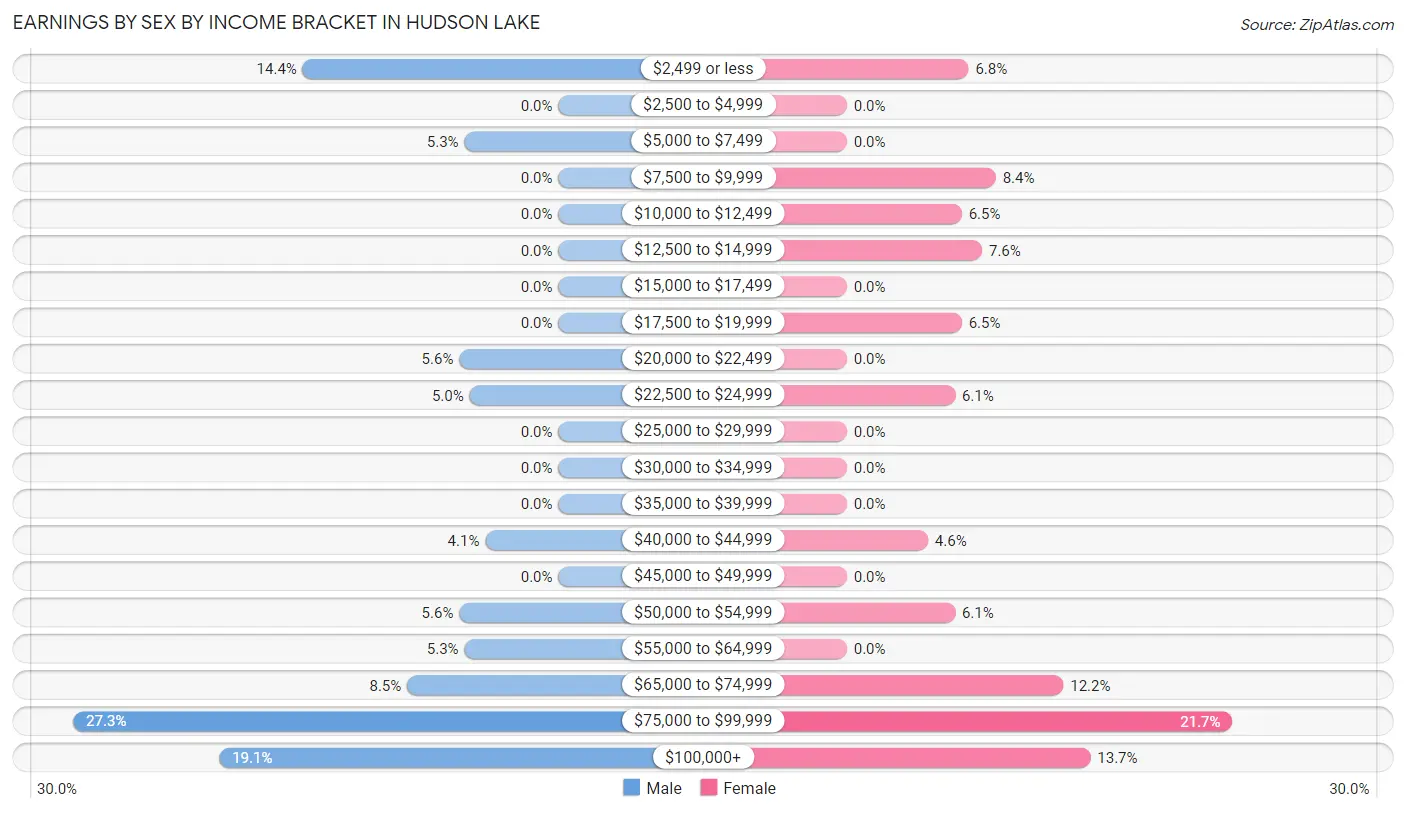
| Income | Male | Female |
| $2,499 or less | 49 (14.4%) | 18 (6.8%) |
| $2,500 to $4,999 | 0 (0.0%) | 0 (0.0%) |
| $5,000 to $7,499 | 18 (5.3%) | 0 (0.0%) |
| $7,500 to $9,999 | 0 (0.0%) | 22 (8.4%) |
| $10,000 to $12,499 | 0 (0.0%) | 17 (6.5%) |
| $12,500 to $14,999 | 0 (0.0%) | 20 (7.6%) |
| $15,000 to $17,499 | 0 (0.0%) | 0 (0.0%) |
| $17,500 to $19,999 | 0 (0.0%) | 17 (6.5%) |
| $20,000 to $22,499 | 19 (5.6%) | 0 (0.0%) |
| $22,500 to $24,999 | 17 (5.0%) | 16 (6.1%) |
| $25,000 to $29,999 | 0 (0.0%) | 0 (0.0%) |
| $30,000 to $34,999 | 0 (0.0%) | 0 (0.0%) |
| $35,000 to $39,999 | 0 (0.0%) | 0 (0.0%) |
| $40,000 to $44,999 | 14 (4.1%) | 12 (4.6%) |
| $45,000 to $49,999 | 0 (0.0%) | 0 (0.0%) |
| $50,000 to $54,999 | 19 (5.6%) | 16 (6.1%) |
| $55,000 to $64,999 | 18 (5.3%) | 0 (0.0%) |
| $65,000 to $74,999 | 29 (8.5%) | 32 (12.2%) |
| $75,000 to $99,999 | 93 (27.3%) | 57 (21.7%) |
| $100,000+ | 65 (19.1%) | 36 (13.7%) |
| Total | 341 (100.0%) | 263 (100.0%) |
Earnings by Sex by Educational Attainment in Hudson Lake
Average earnings in Hudson Lake are $88,250 for men and $67,500 for women, a difference of 23.5%. Men with an educational attainment of high school diploma enjoy the highest average annual earnings of $88,389, while those with high school diploma education earn the least with $88,389. Women with an educational attainment of high school diploma earn the most with the average annual earnings of $44,271, while those with high school diploma education have the smallest earnings of $44,271.
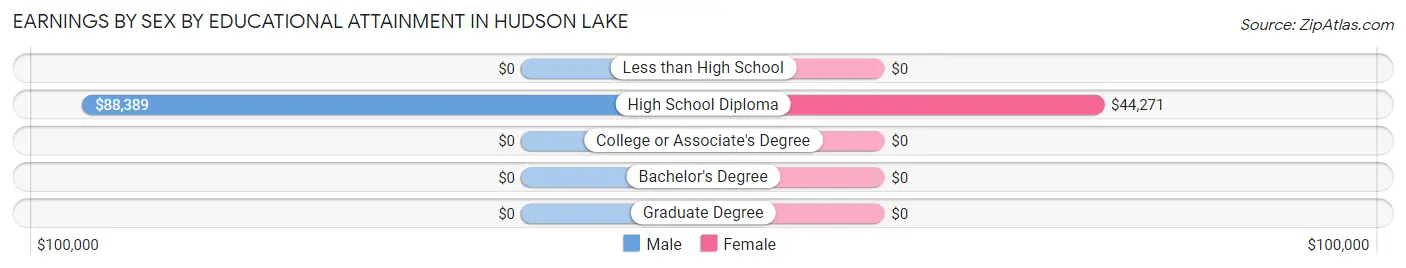
| Educational Attainment | Male Income | Female Income |
| Less than High School | - | - |
| High School Diploma | $88,389 | $44,271 |
| College or Associate's Degree | - | - |
| Bachelor's Degree | - | - |
| Graduate Degree | - | - |
| Total | $88,250 | $67,500 |
Family Income in Hudson Lake
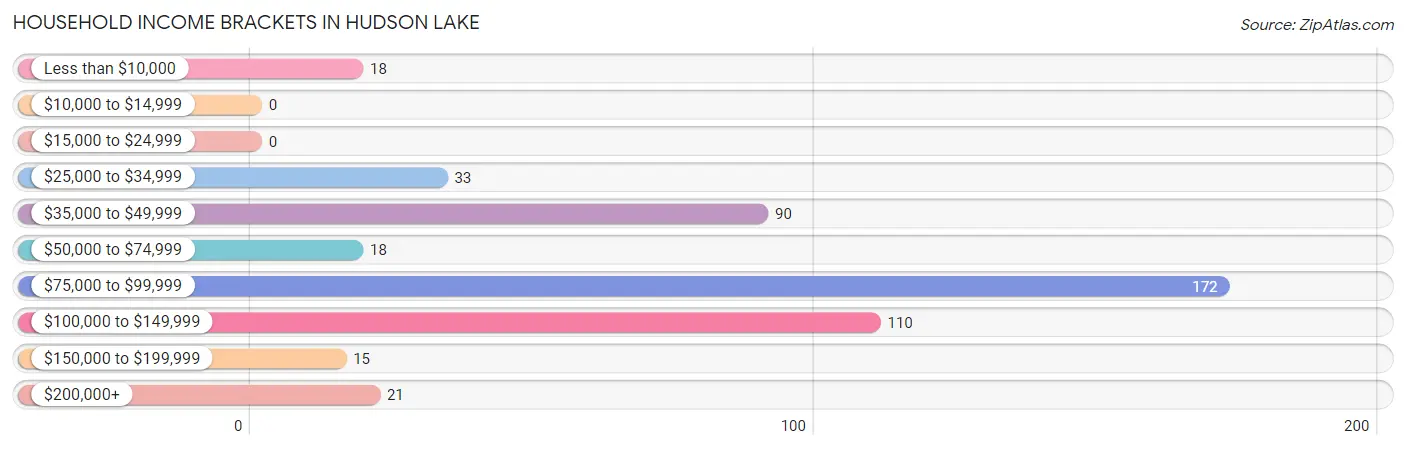
Family Income Brackets in Hudson Lake
According to the Hudson Lake family income data, there are 143 families falling into the $75,000 to $99,999 income range, which is the most common income bracket and makes up 32.2% of all families.

| Income Bracket | # Families | % Families |
| Less than $10,000 | 18 | 4.1% |
| $10,000 to $14,999 | 0 | 0.0% |
| $15,000 to $24,999 | 0 | 0.0% |
| $25,000 to $34,999 | 33 | 7.4% |
| $35,000 to $49,999 | 90 | 20.3% |
| $50,000 to $74,999 | 35 | 7.9% |
| $75,000 to $99,999 | 143 | 32.2% |
| $100,000 to $149,999 | 89 | 20.0% |
| $150,000 to $199,999 | 15 | 3.4% |
| $200,000+ | 21 | 4.7% |
Family Income by Famaliy Size in Hudson Lake
3-person families (47 | 10.6%) account for the highest median family income in Hudson Lake with $120,809 per family, while 3-person families (47 | 10.6%) have the highest median income of $40,270 per family member.
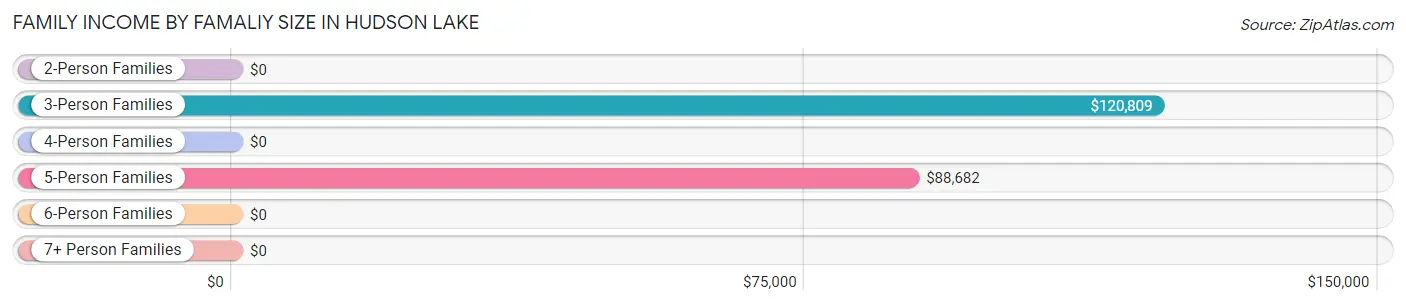
| Income Bracket | # Families | Median Income |
| 2-Person Families | 278 (62.6%) | $0 |
| 3-Person Families | 47 (10.6%) | $120,809 |
| 4-Person Families | 50 (11.3%) | $0 |
| 5-Person Families | 69 (15.5%) | $88,682 |
| 6-Person Families | 0 (0.0%) | $0 |
| 7+ Person Families | 0 (0.0%) | $0 |
| Total | 444 (100.0%) | $82,083 |
Family Income by Number of Earners in Hudson Lake
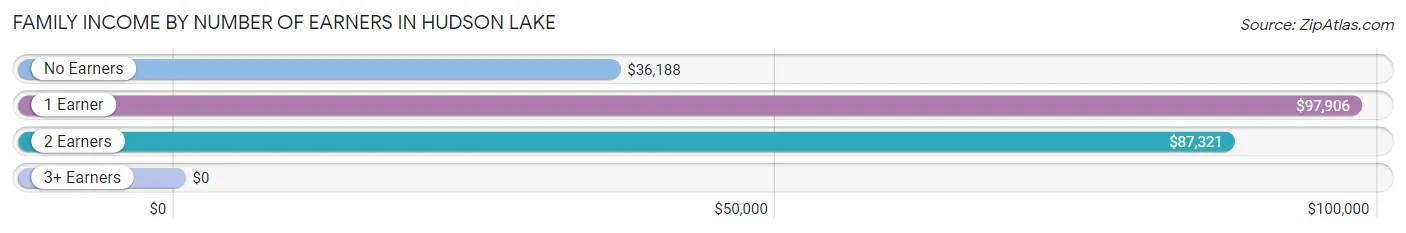
| Number of Earners | # Families | Median Income |
| No Earners | 123 (27.7%) | $36,188 |
| 1 Earner | 155 (34.9%) | $97,906 |
| 2 Earners | 134 (30.2%) | $87,321 |
| 3+ Earners | 32 (7.2%) | $0 |
| Total | 444 (100.0%) | $82,083 |
Household Income in Hudson Lake
Household Income Brackets in Hudson Lake
With 172 households falling in the category, the $75,000 to $99,999 income range is the most frequent in Hudson Lake, accounting for 36.1% of all households.
| Income Bracket | # Households | % Households |
| Less than $10,000 | 18 | 3.8% |
| $10,000 to $14,999 | 0 | 0.0% |
| $15,000 to $24,999 | 0 | 0.0% |
| $25,000 to $34,999 | 33 | 6.9% |
| $35,000 to $49,999 | 90 | 18.9% |
| $50,000 to $74,999 | 18 | 3.8% |
| $75,000 to $99,999 | 172 | 36.1% |
| $100,000 to $149,999 | 110 | 23.1% |
| $150,000 to $199,999 | 15 | 3.1% |
| $200,000+ | 21 | 4.4% |
Household Income by Householder Age in Hudson Lake
The median household income in Hudson Lake is $88,885, with the highest median household income of $99,531 found in the 45 to 64 years age bracket for the primary householder. A total of 123 households (25.8%) fall into this category. Meanwhile, the 15 to 24 years age bracket for the primary householder has the lowest median household income of $0, with 18 households (3.8%) in this group.
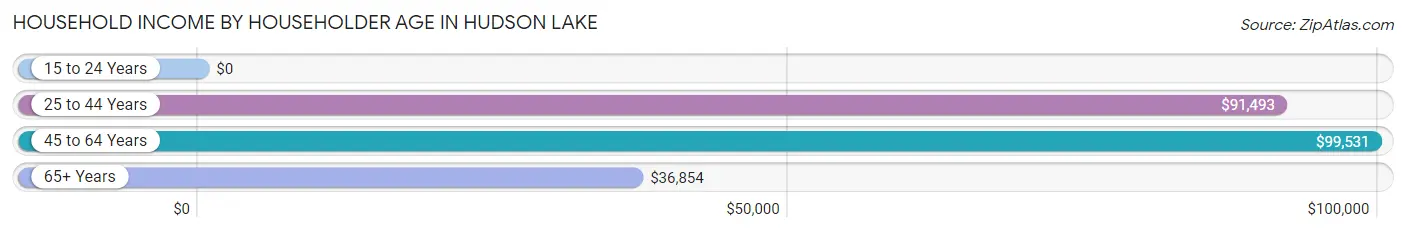
| Income Bracket | # Households | Median Income |
| 15 to 24 Years | 18 (3.8%) | $0 |
| 25 to 44 Years | 181 (38.0%) | $91,493 |
| 45 to 64 Years | 123 (25.8%) | $99,531 |
| 65+ Years | 155 (32.5%) | $36,854 |
| Total | 477 (100.0%) | $88,885 |
Poverty in Hudson Lake
Income Below Poverty by Sex and Age in Hudson Lake
With 2.5% poverty level for males and 8.9% for females among the residents of Hudson Lake, 25 to 34 year old males and 45 to 54 year old females are the most vulnerable to poverty, with 18 males (25.7%) and 40 females (44.9%) in their respective age groups living below the poverty level.
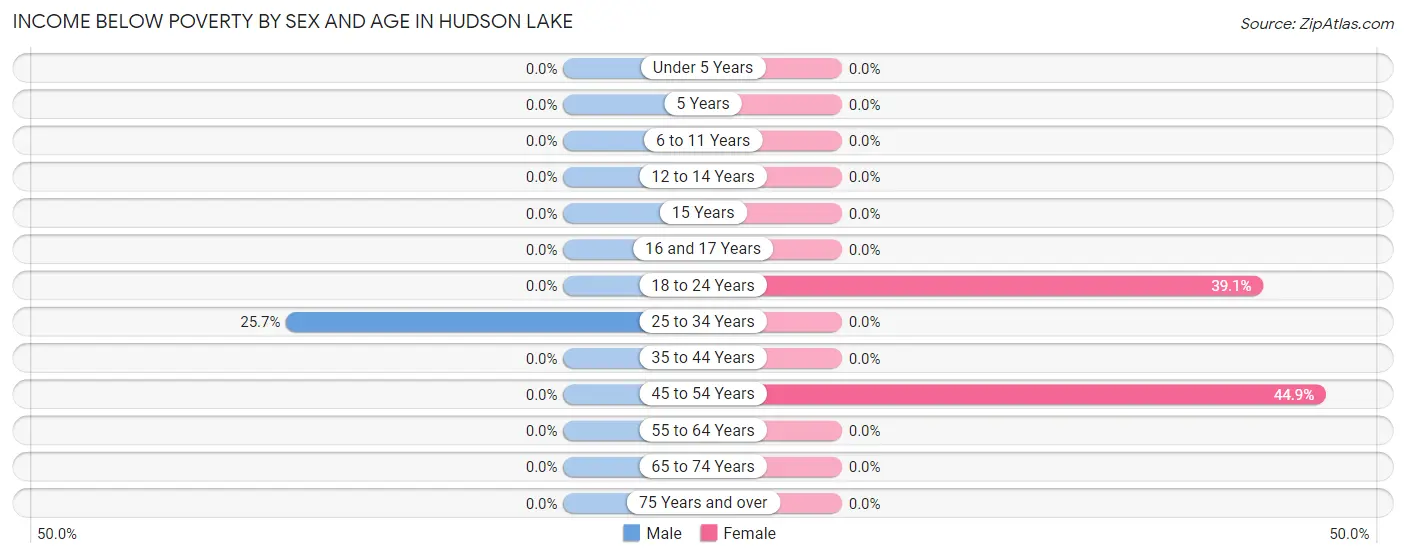
| Age Bracket | Male | Female |
| Under 5 Years | 0 (0.0%) | 0 (0.0%) |
| 5 Years | 0 (0.0%) | 0 (0.0%) |
| 6 to 11 Years | 0 (0.0%) | 0 (0.0%) |
| 12 to 14 Years | 0 (0.0%) | 0 (0.0%) |
| 15 Years | 0 (0.0%) | 0 (0.0%) |
| 16 and 17 Years | 0 (0.0%) | 0 (0.0%) |
| 18 to 24 Years | 0 (0.0%) | 18 (39.1%) |
| 25 to 34 Years | 18 (25.7%) | 0 (0.0%) |
| 35 to 44 Years | 0 (0.0%) | 0 (0.0%) |
| 45 to 54 Years | 0 (0.0%) | 40 (44.9%) |
| 55 to 64 Years | 0 (0.0%) | 0 (0.0%) |
| 65 to 74 Years | 0 (0.0%) | 0 (0.0%) |
| 75 Years and over | 0 (0.0%) | 0 (0.0%) |
| Total | 18 (2.5%) | 58 (8.9%) |
Income Above Poverty by Sex and Age in Hudson Lake
According to the poverty statistics in Hudson Lake, males aged under 5 years and females aged 6 to 11 years are the age groups that are most secure financially, with 100.0% of males and 100.0% of females in these age groups living above the poverty line.
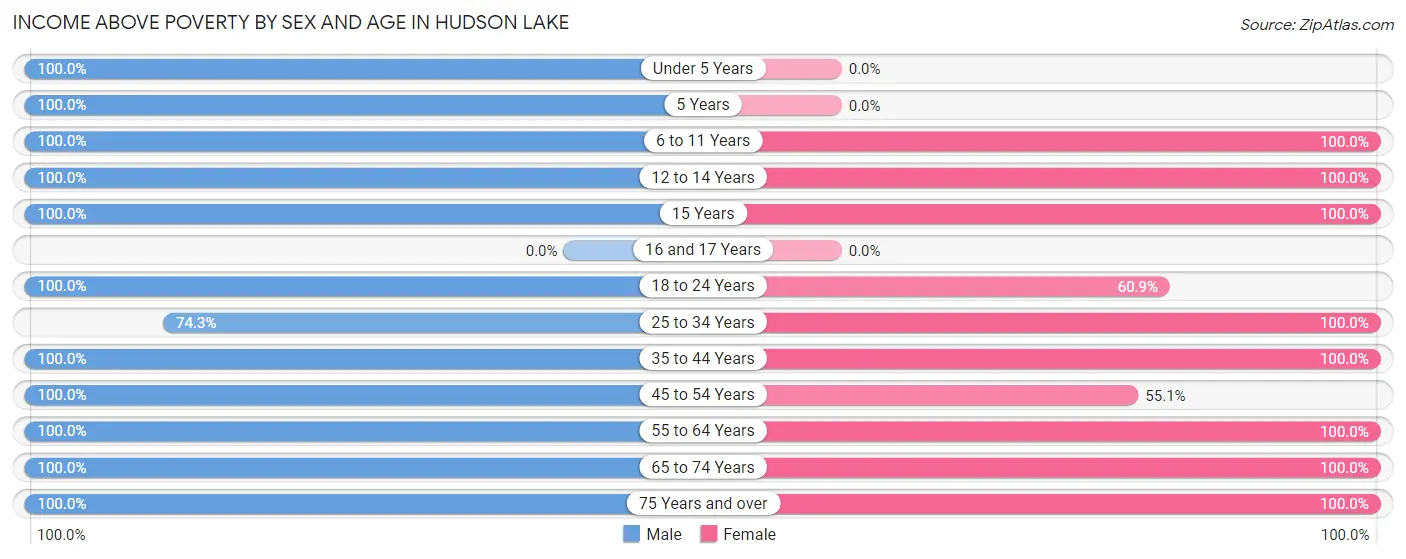
| Age Bracket | Male | Female |
| Under 5 Years | 42 (100.0%) | 0 (0.0%) |
| 5 Years | 28 (100.0%) | 0 (0.0%) |
| 6 to 11 Years | 37 (100.0%) | 76 (100.0%) |
| 12 to 14 Years | 92 (100.0%) | 39 (100.0%) |
| 15 Years | 18 (100.0%) | 37 (100.0%) |
| 16 and 17 Years | 0 (0.0%) | 0 (0.0%) |
| 18 to 24 Years | 68 (100.0%) | 28 (60.9%) |
| 25 to 34 Years | 52 (74.3%) | 42 (100.0%) |
| 35 to 44 Years | 122 (100.0%) | 100 (100.0%) |
| 45 to 54 Years | 52 (100.0%) | 49 (55.1%) |
| 55 to 64 Years | 81 (100.0%) | 59 (100.0%) |
| 65 to 74 Years | 61 (100.0%) | 125 (100.0%) |
| 75 Years and over | 50 (100.0%) | 36 (100.0%) |
| Total | 703 (97.5%) | 591 (91.1%) |
Income Below Poverty Among Married-Couple Families in Hudson Lake
The poverty statistics for married-couple families in Hudson Lake show that 5.9% or 18 of the total 306 families live below the poverty line. Families with no children have the highest poverty rate of 8.5%, comprising of 18 families. On the other hand, families with 1 or 2 children have the lowest poverty rate of 0.0%, which includes 0 families.
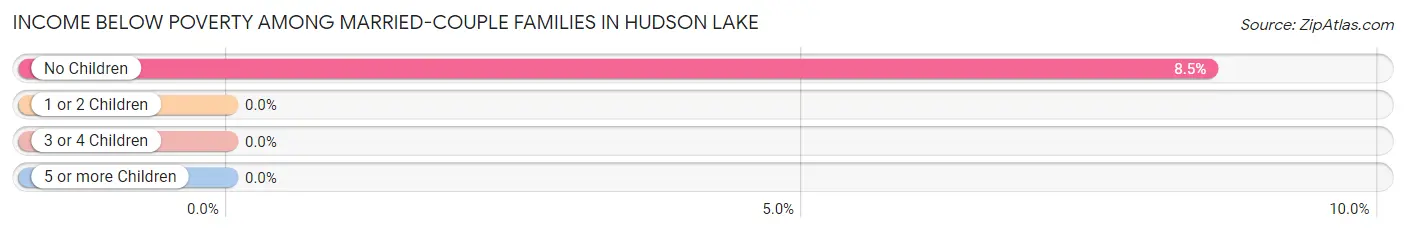
| Children | Above Poverty | Below Poverty |
| No Children | 193 (91.5%) | 18 (8.5%) |
| 1 or 2 Children | 58 (100.0%) | 0 (0.0%) |
| 3 or 4 Children | 37 (100.0%) | 0 (0.0%) |
| 5 or more Children | 0 (0.0%) | 0 (0.0%) |
| Total | 288 (94.1%) | 18 (5.9%) |
Income Below Poverty Among Single-Parent Households in Hudson Lake
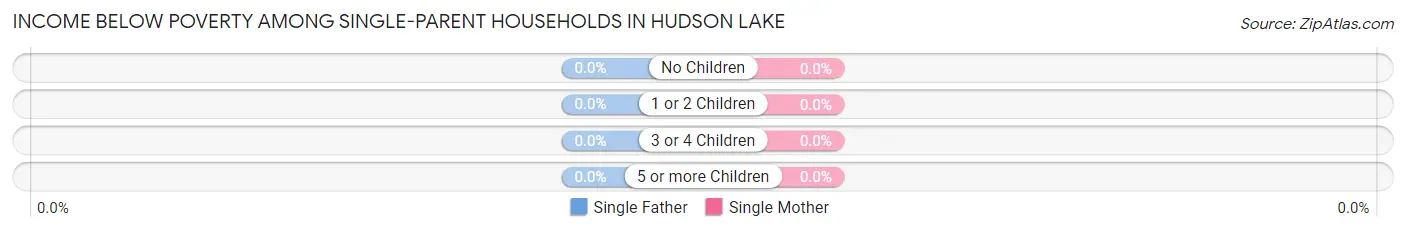
| Children | Single Father | Single Mother |
| No Children | 0 (0.0%) | 0 (0.0%) |
| 1 or 2 Children | 0 (0.0%) | 0 (0.0%) |
| 3 or 4 Children | 0 (0.0%) | 0 (0.0%) |
| 5 or more Children | 0 (0.0%) | 0 (0.0%) |
| Total | 0 (0.0%) | 0 (0.0%) |
Income Below Poverty Among Married-Couple vs Single-Parent Households in Hudson Lake
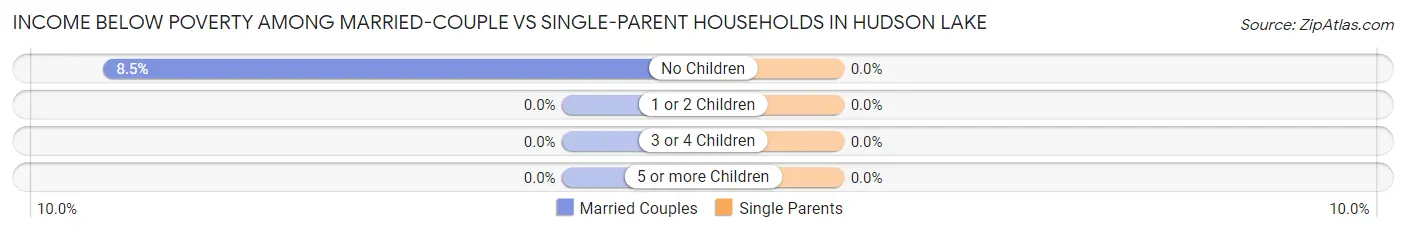
| Children | Married-Couple Families | Single-Parent Households |
| No Children | 18 (8.5%) | 0 (0.0%) |
| 1 or 2 Children | 0 (0.0%) | 0 (0.0%) |
| 3 or 4 Children | 0 (0.0%) | 0 (0.0%) |
| 5 or more Children | 0 (0.0%) | 0 (0.0%) |
| Total | 18 (5.9%) | 0 (0.0%) |
Employment Characteristics in Hudson Lake
Employment by Class of Employer in Hudson Lake
Among the 517 employed individuals in Hudson Lake, private company employees (332 | 64.2%), self-employed (not incorporated) (97 | 18.8%), and local government employees (34 | 6.6%) make up the most common classes of employment.
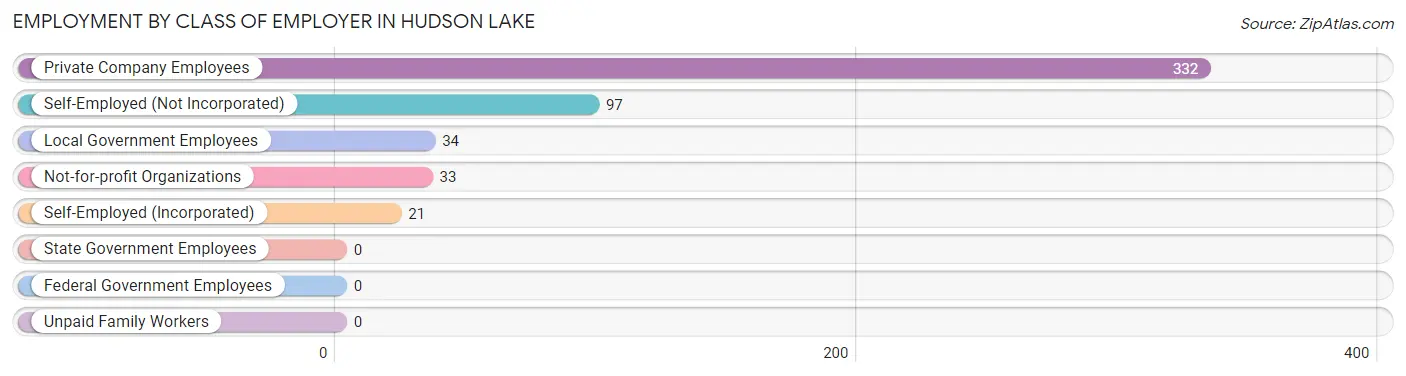
| Employer Class | # Employees | % Employees |
| Private Company Employees | 332 | 64.2% |
| Self-Employed (Incorporated) | 21 | 4.1% |
| Self-Employed (Not Incorporated) | 97 | 18.8% |
| Not-for-profit Organizations | 33 | 6.4% |
| Local Government Employees | 34 | 6.6% |
| State Government Employees | 0 | 0.0% |
| Federal Government Employees | 0 | 0.0% |
| Unpaid Family Workers | 0 | 0.0% |
| Total | 517 | 100.0% |
Employment Status by Age in Hudson Lake
According to the labor force statistics for Hudson Lake, out of the total population over 16 years of age (1,001), 53.4% or 535 individuals are in the labor force, with 3.4% or 18 of them unemployed. The age group with the highest labor force participation rate is 20 to 24 years, with 100.0% or 35 individuals in the labor force. Within the labor force, the 20 to 24 years age range has the highest percentage of unemployed individuals, with 51.4% or 18 of them being unemployed.
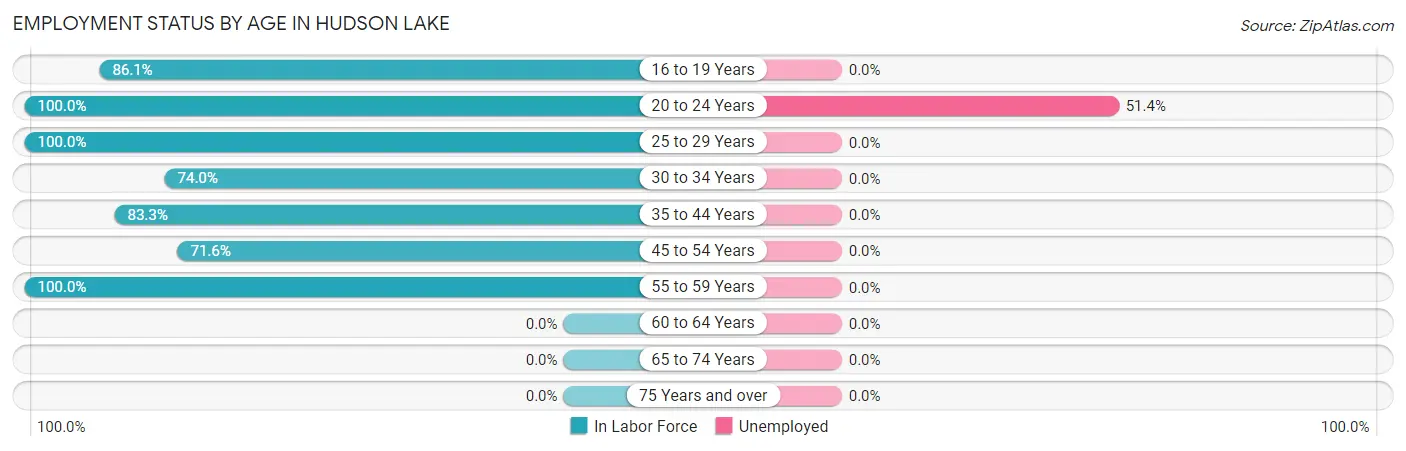
| Age Bracket | In Labor Force | Unemployed |
| 16 to 19 Years | 68 (86.1%) | 0 (0.0%) |
| 20 to 24 Years | 35 (100.0%) | 18 (51.4%) |
| 25 to 29 Years | 35 (100.0%) | 0 (0.0%) |
| 30 to 34 Years | 57 (74.0%) | 0 (0.0%) |
| 35 to 44 Years | 185 (83.3%) | 0 (0.0%) |
| 45 to 54 Years | 101 (71.6%) | 0 (0.0%) |
| 55 to 59 Years | 54 (100.0%) | 0 (0.0%) |
| 60 to 64 Years | 0 (0.0%) | 0 (0.0%) |
| 65 to 74 Years | 0 (0.0%) | 0 (0.0%) |
| 75 Years and over | 0 (0.0%) | 0 (0.0%) |
| Total | 535 (53.4%) | 18 (3.4%) |
Employment Status by Educational Attainment in Hudson Lake
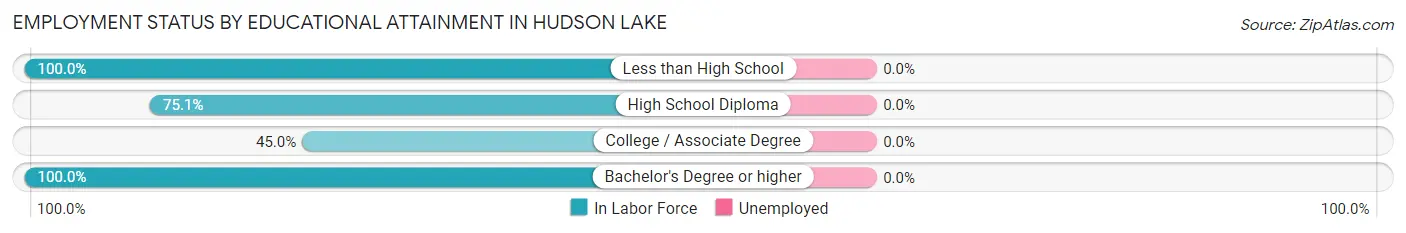
| Educational Attainment | In Labor Force | Unemployed |
| Less than High School | 44 (100.0%) | 0 (0.0%) |
| High School Diploma | 217 (75.1%) | 0 (0.0%) |
| College / Associate Degree | 91 (45.0%) | 0 (0.0%) |
| Bachelor's Degree or higher | 80 (100.0%) | 0 (0.0%) |
| Total | 432 (70.2%) | 0 (0.0%) |
Employment Occupations by Sex in Hudson Lake
Management, Business, Science and Arts Occupations
The most common Management, Business, Science and Arts occupations in Hudson Lake are Community & Social Service (76 | 14.7%), Education Instruction & Library (40 | 7.7%), Arts, Media & Entertainment (36 | 7.0%), Management (21 | 4.1%), and Business & Financial (21 | 4.1%).
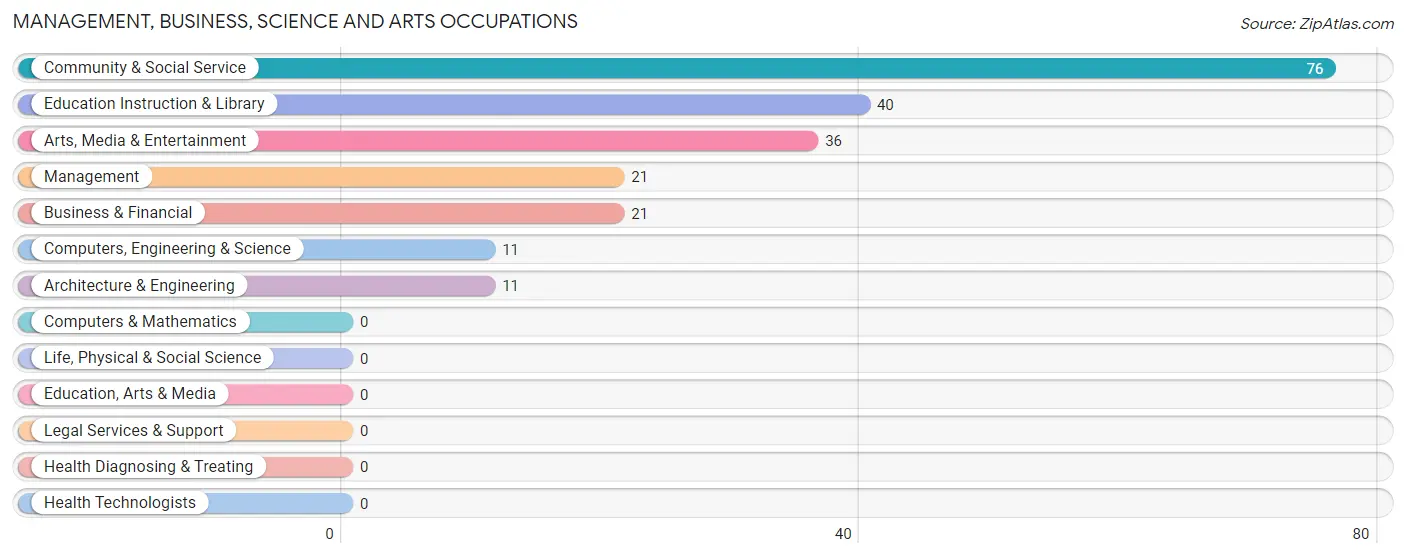
Management, Business, Science and Arts Occupations by Sex
Within the Management, Business, Science and Arts occupations in Hudson Lake, the most male-oriented occupations are Education Instruction & Library (47.5%), and Community & Social Service (25.0%), while the most female-oriented occupations are Management (100.0%), Business & Financial (100.0%), and Computers, Engineering & Science (100.0%).
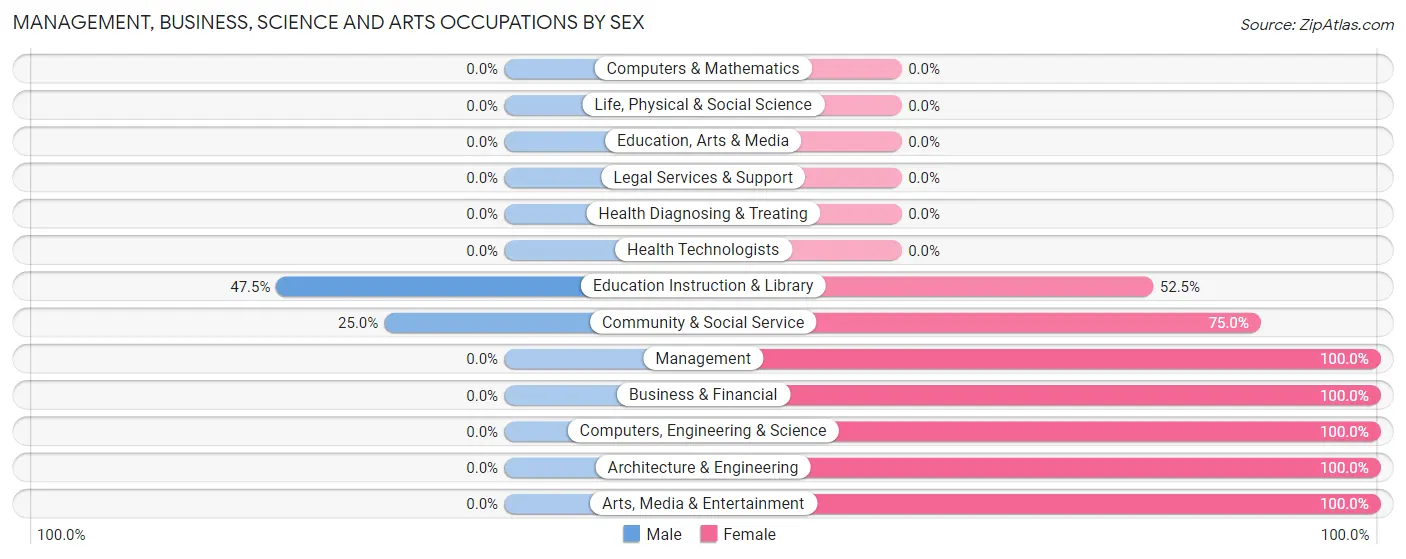
| Occupation | Male | Female |
| Management | 0 (0.0%) | 21 (100.0%) |
| Business & Financial | 0 (0.0%) | 21 (100.0%) |
| Computers, Engineering & Science | 0 (0.0%) | 11 (100.0%) |
| Computers & Mathematics | 0 (0.0%) | 0 (0.0%) |
| Architecture & Engineering | 0 (0.0%) | 11 (100.0%) |
| Life, Physical & Social Science | 0 (0.0%) | 0 (0.0%) |
| Community & Social Service | 19 (25.0%) | 57 (75.0%) |
| Education, Arts & Media | 0 (0.0%) | 0 (0.0%) |
| Legal Services & Support | 0 (0.0%) | 0 (0.0%) |
| Education Instruction & Library | 19 (47.5%) | 21 (52.5%) |
| Arts, Media & Entertainment | 0 (0.0%) | 36 (100.0%) |
| Health Diagnosing & Treating | 0 (0.0%) | 0 (0.0%) |
| Health Technologists | 0 (0.0%) | 0 (0.0%) |
| Total (Category) | 19 (14.7%) | 110 (85.3%) |
| Total (Overall) | 324 (62.7%) | 193 (37.3%) |
Services Occupations
The most common Services occupations in Hudson Lake are Personal Care & Service (22 | 4.3%), Food Preparation & Serving (18 | 3.5%), Security & Protection (17 | 3.3%), and Firefighting & Prevention (17 | 3.3%).

Services Occupations by Sex
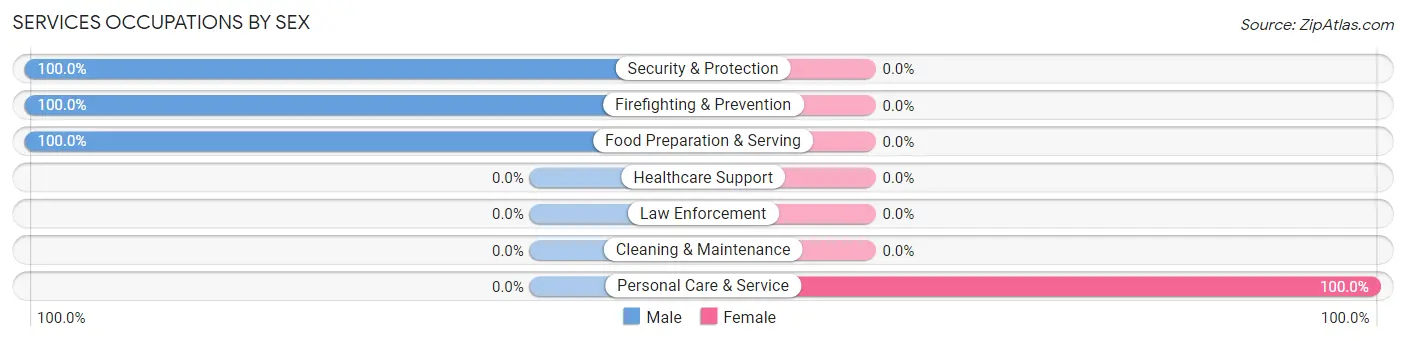
| Occupation | Male | Female |
| Healthcare Support | 0 (0.0%) | 0 (0.0%) |
| Security & Protection | 17 (100.0%) | 0 (0.0%) |
| Firefighting & Prevention | 17 (100.0%) | 0 (0.0%) |
| Law Enforcement | 0 (0.0%) | 0 (0.0%) |
| Food Preparation & Serving | 18 (100.0%) | 0 (0.0%) |
| Cleaning & Maintenance | 0 (0.0%) | 0 (0.0%) |
| Personal Care & Service | 0 (0.0%) | 22 (100.0%) |
| Total (Category) | 35 (61.4%) | 22 (38.6%) |
| Total (Overall) | 324 (62.7%) | 193 (37.3%) |
Sales and Office Occupations
The most common Sales and Office occupations in Hudson Lake are Office & Administration (49 | 9.5%), and Sales & Related (4 | 0.8%).
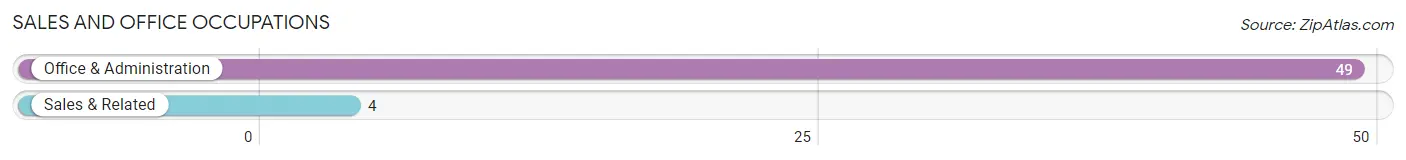
Sales and Office Occupations by Sex
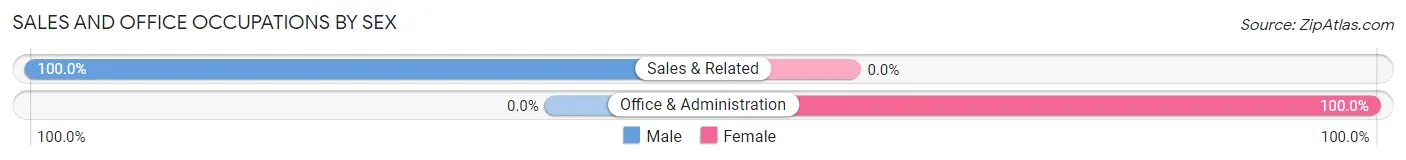
| Occupation | Male | Female |
| Sales & Related | 4 (100.0%) | 0 (0.0%) |
| Office & Administration | 0 (0.0%) | 49 (100.0%) |
| Total (Category) | 4 (7.5%) | 49 (92.4%) |
| Total (Overall) | 324 (62.7%) | 193 (37.3%) |
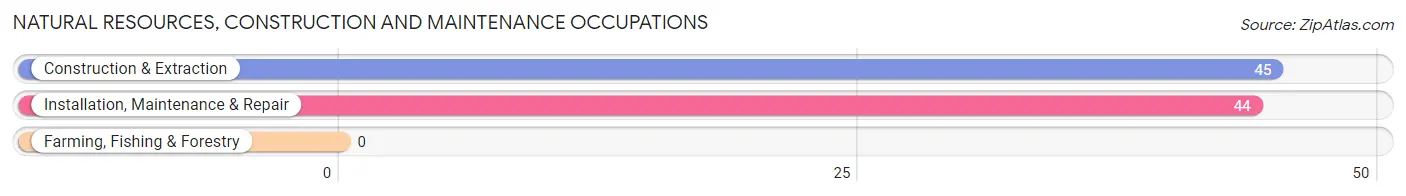
Natural Resources, Construction and Maintenance Occupations
The most common Natural Resources, Construction and Maintenance occupations in Hudson Lake are Construction & Extraction (45 | 8.7%), and Installation, Maintenance & Repair (44 | 8.5%).
Natural Resources, Construction and Maintenance Occupations by Sex
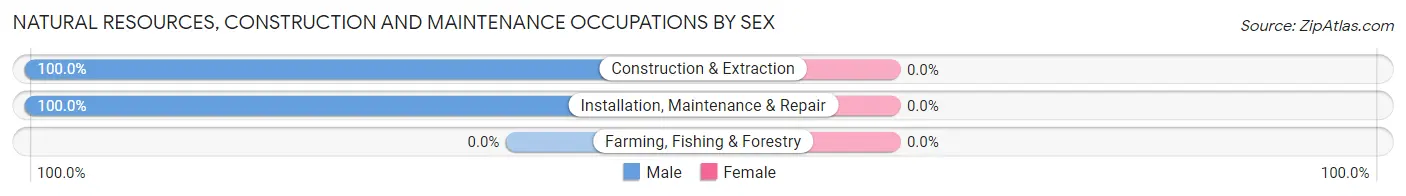
| Occupation | Male | Female |
| Farming, Fishing & Forestry | 0 (0.0%) | 0 (0.0%) |
| Construction & Extraction | 45 (100.0%) | 0 (0.0%) |
| Installation, Maintenance & Repair | 44 (100.0%) | 0 (0.0%) |
| Total (Category) | 89 (100.0%) | 0 (0.0%) |
| Total (Overall) | 324 (62.7%) | 193 (37.3%) |
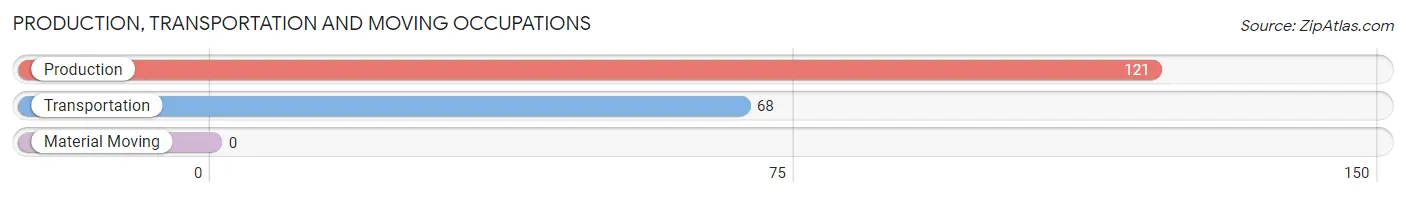
Production, Transportation and Moving Occupations
The most common Production, Transportation and Moving occupations in Hudson Lake are Production (121 | 23.4%), and Transportation (68 | 13.2%).
Production, Transportation and Moving Occupations by Sex
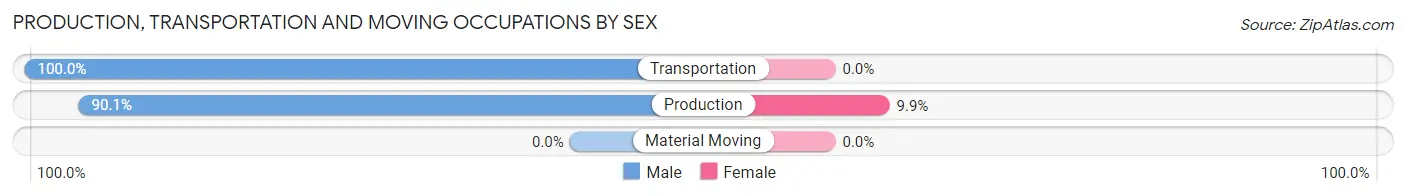
| Occupation | Male | Female |
| Production | 109 (90.1%) | 12 (9.9%) |
| Transportation | 68 (100.0%) | 0 (0.0%) |
| Material Moving | 0 (0.0%) | 0 (0.0%) |
| Total (Category) | 177 (93.6%) | 12 (6.4%) |
| Total (Overall) | 324 (62.7%) | 193 (37.3%) |
Employment Industries by Sex in Hudson Lake
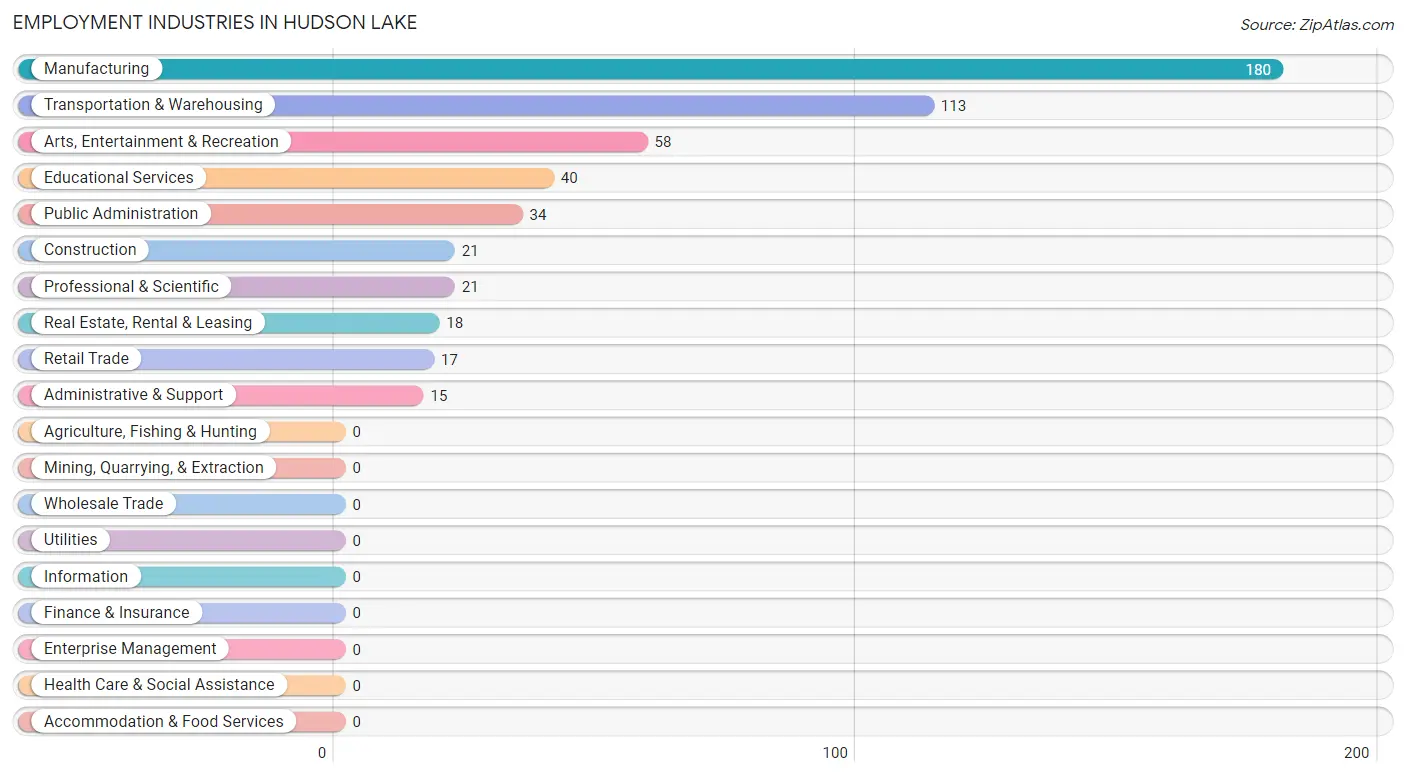
Employment Industries in Hudson Lake
The major employment industries in Hudson Lake include Manufacturing (180 | 34.8%), Transportation & Warehousing (113 | 21.9%), Arts, Entertainment & Recreation (58 | 11.2%), Educational Services (40 | 7.7%), and Public Administration (34 | 6.6%).
Employment Industries by Sex in Hudson Lake
The Hudson Lake industries that see more men than women are Transportation & Warehousing (100.0%), Real Estate, Rental & Leasing (100.0%), and Manufacturing (87.2%), whereas the industries that tend to have a higher number of women are Construction (100.0%), Retail Trade (100.0%), and Professional & Scientific (100.0%).

| Industry | Male | Female |
| Agriculture, Fishing & Hunting | 0 (0.0%) | 0 (0.0%) |
| Mining, Quarrying, & Extraction | 0 (0.0%) | 0 (0.0%) |
| Construction | 0 (0.0%) | 21 (100.0%) |
| Manufacturing | 157 (87.2%) | 23 (12.8%) |
| Wholesale Trade | 0 (0.0%) | 0 (0.0%) |
| Retail Trade | 0 (0.0%) | 17 (100.0%) |
| Transportation & Warehousing | 113 (100.0%) | 0 (0.0%) |
| Utilities | 0 (0.0%) | 0 (0.0%) |
| Information | 0 (0.0%) | 0 (0.0%) |
| Finance & Insurance | 0 (0.0%) | 0 (0.0%) |
| Real Estate, Rental & Leasing | 18 (100.0%) | 0 (0.0%) |
| Professional & Scientific | 0 (0.0%) | 21 (100.0%) |
| Enterprise Management | 0 (0.0%) | 0 (0.0%) |
| Administrative & Support | 0 (0.0%) | 15 (100.0%) |
| Educational Services | 19 (47.5%) | 21 (52.5%) |
| Health Care & Social Assistance | 0 (0.0%) | 0 (0.0%) |
| Arts, Entertainment & Recreation | 0 (0.0%) | 58 (100.0%) |
| Accommodation & Food Services | 0 (0.0%) | 0 (0.0%) |
| Public Administration | 17 (50.0%) | 17 (50.0%) |
| Total | 324 (62.7%) | 193 (37.3%) |
Education in Hudson Lake
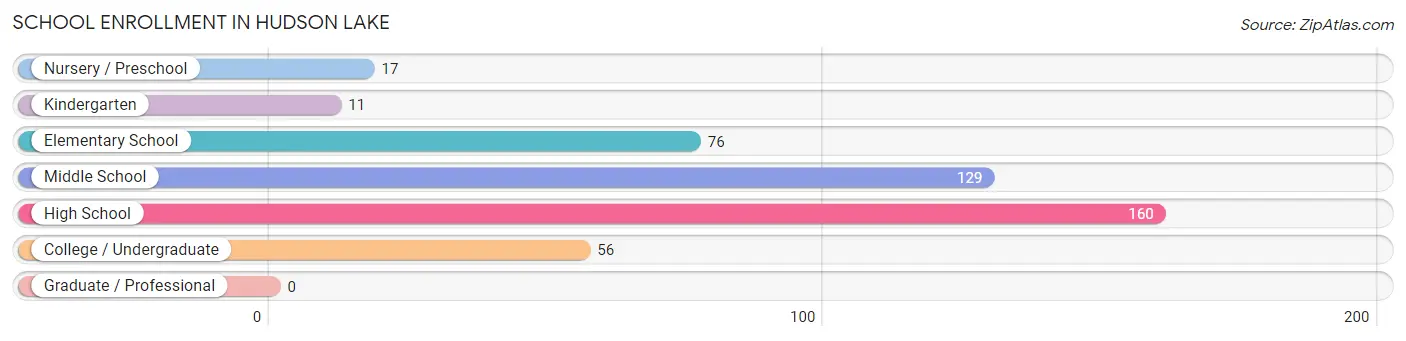
School Enrollment in Hudson Lake
The most common levels of schooling among the 449 students in Hudson Lake are high school (160 | 35.6%), middle school (129 | 28.7%), and elementary school (76 | 16.9%).
| School Level | # Students | % Students |
| Nursery / Preschool | 17 | 3.8% |
| Kindergarten | 11 | 2.5% |
| Elementary School | 76 | 16.9% |
| Middle School | 129 | 28.7% |
| High School | 160 | 35.6% |
| College / Undergraduate | 56 | 12.5% |
| Graduate / Professional | 0 | 0.0% |
| Total | 449 | 100.0% |
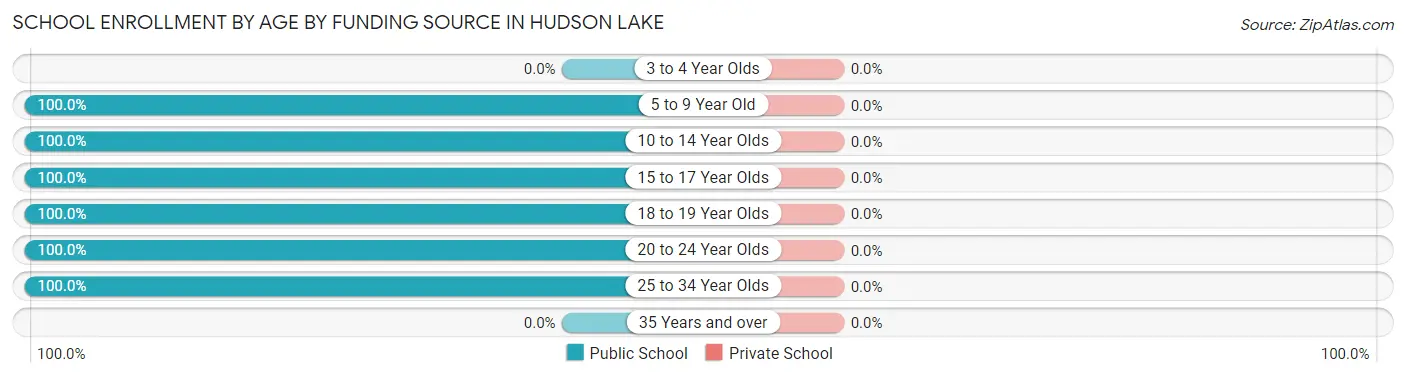
School Enrollment by Age by Funding Source in Hudson Lake
| Age Bracket | Public School | Private School |
| 3 to 4 Year Olds | 0 (0.0%) | 0 (0.0%) |
| 5 to 9 Year Old | 104 (100.0%) | 0 (0.0%) |
| 10 to 14 Year Olds | 168 (100.0%) | 0 (0.0%) |
| 15 to 17 Year Olds | 55 (100.0%) | 0 (0.0%) |
| 18 to 19 Year Olds | 68 (100.0%) | 0 (0.0%) |
| 20 to 24 Year Olds | 17 (100.0%) | 0 (0.0%) |
| 25 to 34 Year Olds | 37 (100.0%) | 0 (0.0%) |
| 35 Years and over | 0 (0.0%) | 0 (0.0%) |
| Total | 449 (100.0%) | 0 (0.0%) |
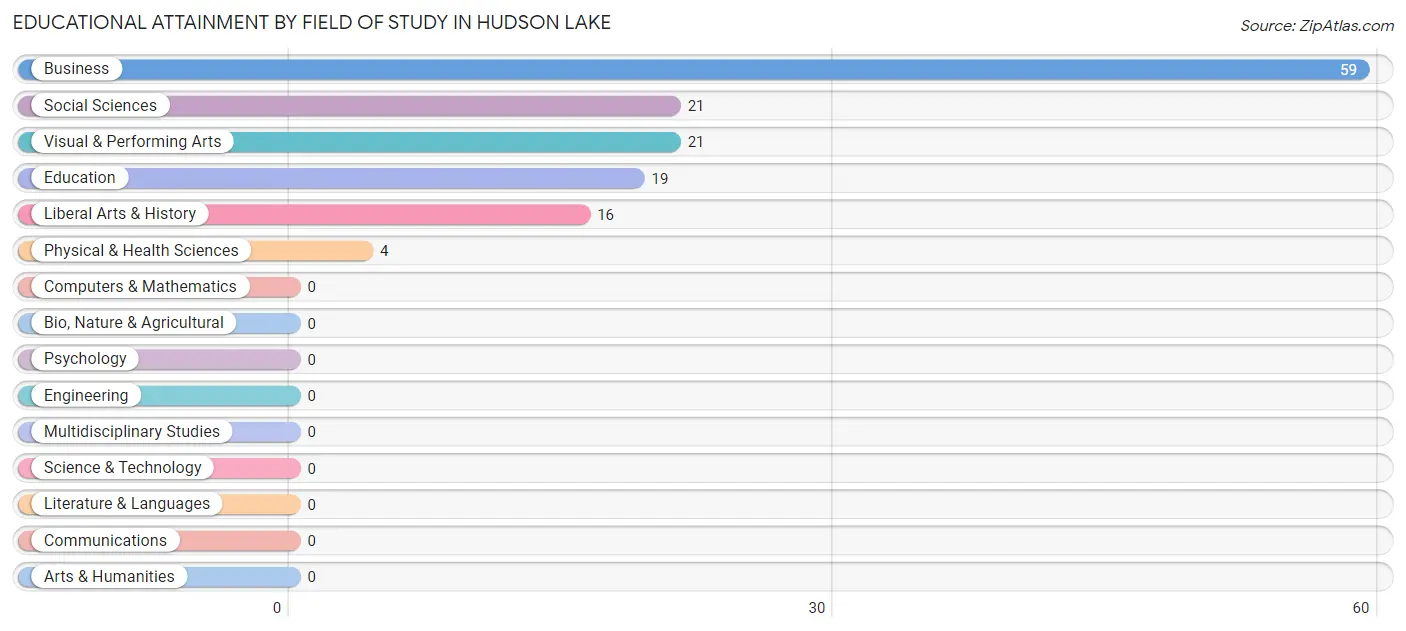
Educational Attainment by Field of Study in Hudson Lake
Business (59 | 42.1%), social sciences (21 | 15.0%), visual & performing arts (21 | 15.0%), education (19 | 13.6%), and liberal arts & history (16 | 11.4%) are the most common fields of study among 140 individuals in Hudson Lake who have obtained a bachelor's degree or higher.
| Field of Study | # Graduates | % Graduates |
| Computers & Mathematics | 0 | 0.0% |
| Bio, Nature & Agricultural | 0 | 0.0% |
| Physical & Health Sciences | 4 | 2.9% |
| Psychology | 0 | 0.0% |
| Social Sciences | 21 | 15.0% |
| Engineering | 0 | 0.0% |
| Multidisciplinary Studies | 0 | 0.0% |
| Science & Technology | 0 | 0.0% |
| Business | 59 | 42.1% |
| Education | 19 | 13.6% |
| Literature & Languages | 0 | 0.0% |
| Liberal Arts & History | 16 | 11.4% |
| Visual & Performing Arts | 21 | 15.0% |
| Communications | 0 | 0.0% |
| Arts & Humanities | 0 | 0.0% |
| Total | 140 | 100.0% |
Transportation & Commute in Hudson Lake
Vehicle Availability by Sex in Hudson Lake
The most prevalent vehicle ownership categories in Hudson Lake are males with 4 vehicles (144, accounting for 44.4%) and females with 4 vehicles (73, making up 74.6%).
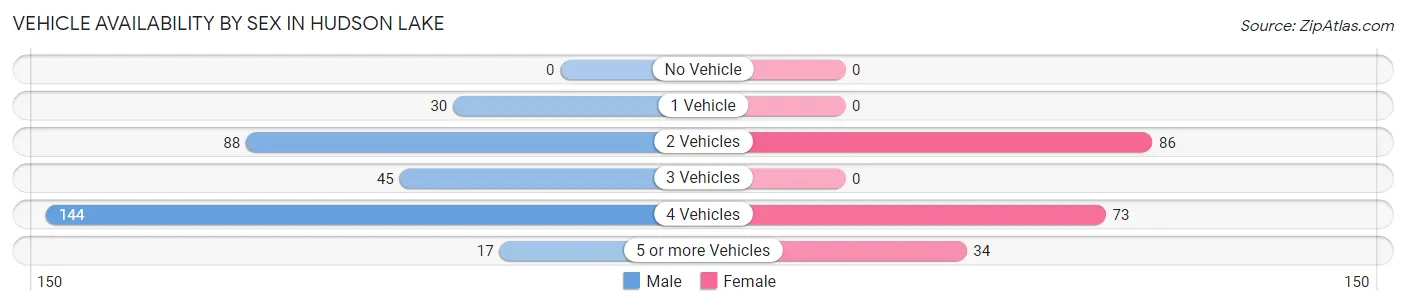
| Vehicles Available | Male | Female |
| No Vehicle | 0 (0.0%) | 0 (0.0%) |
| 1 Vehicle | 30 (9.3%) | 0 (0.0%) |
| 2 Vehicles | 88 (27.2%) | 86 (44.6%) |
| 3 Vehicles | 45 (13.9%) | 0 (0.0%) |
| 4 Vehicles | 144 (44.4%) | 73 (37.8%) |
| 5 or more Vehicles | 17 (5.2%) | 34 (17.6%) |
| Total | 324 (100.0%) | 193 (100.0%) |
Commute Time in Hudson Lake
The most frequently occuring commute durations in Hudson Lake are 10 to 14 minutes (188 commuters, 36.4%), 90 or more minutes (86 commuters, 16.6%), and 45 to 59 minutes (61 commuters, 11.8%).
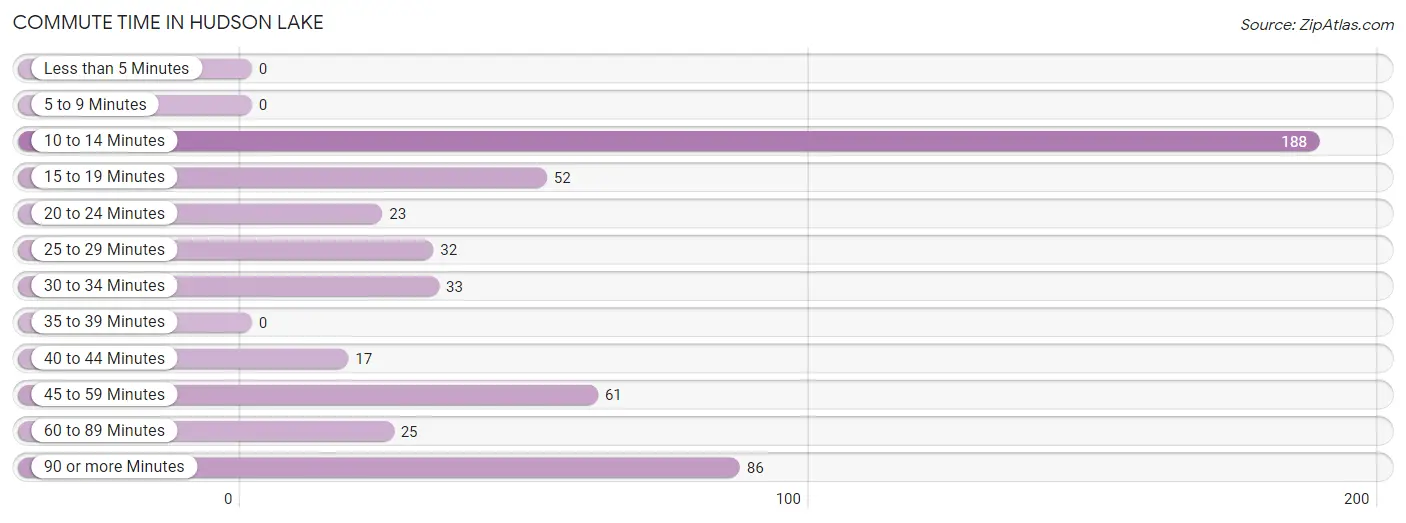
| Commute Time | # Commuters | % Commuters |
| Less than 5 Minutes | 0 | 0.0% |
| 5 to 9 Minutes | 0 | 0.0% |
| 10 to 14 Minutes | 188 | 36.4% |
| 15 to 19 Minutes | 52 | 10.1% |
| 20 to 24 Minutes | 23 | 4.4% |
| 25 to 29 Minutes | 32 | 6.2% |
| 30 to 34 Minutes | 33 | 6.4% |
| 35 to 39 Minutes | 0 | 0.0% |
| 40 to 44 Minutes | 17 | 3.3% |
| 45 to 59 Minutes | 61 | 11.8% |
| 60 to 89 Minutes | 25 | 4.8% |
| 90 or more Minutes | 86 | 16.6% |
Commute Time by Sex in Hudson Lake
The most common commute times in Hudson Lake are 10 to 14 minutes (171 commuters, 52.8%) for males and 90 or more minutes (74 commuters, 38.3%) for females.
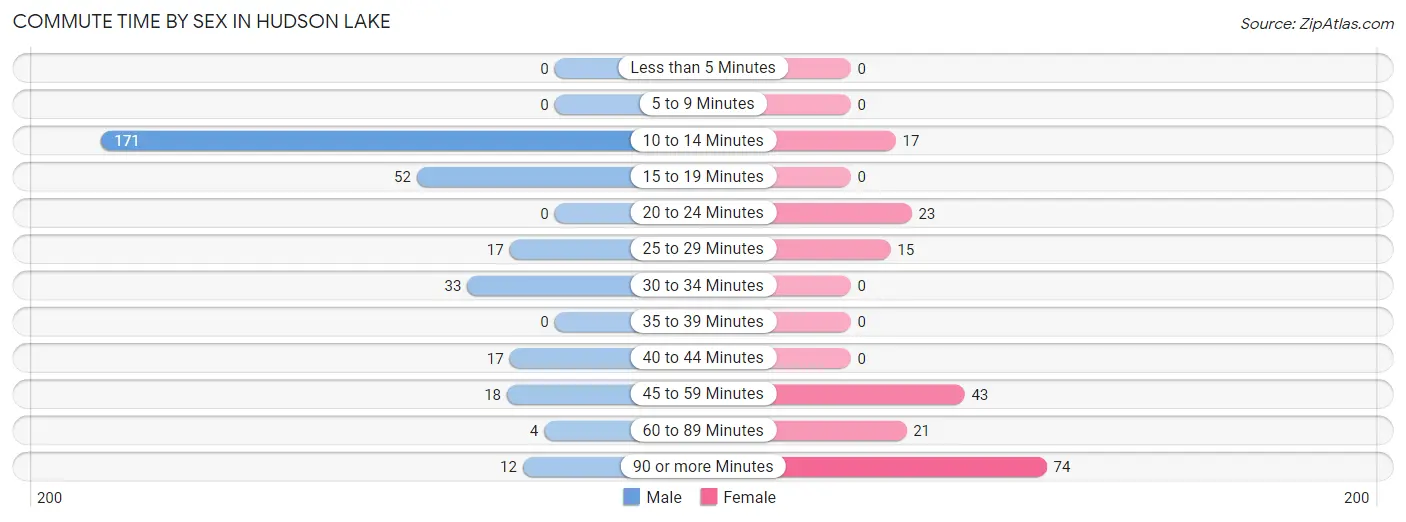
| Commute Time | Male | Female |
| Less than 5 Minutes | 0 (0.0%) | 0 (0.0%) |
| 5 to 9 Minutes | 0 (0.0%) | 0 (0.0%) |
| 10 to 14 Minutes | 171 (52.8%) | 17 (8.8%) |
| 15 to 19 Minutes | 52 (16.1%) | 0 (0.0%) |
| 20 to 24 Minutes | 0 (0.0%) | 23 (11.9%) |
| 25 to 29 Minutes | 17 (5.2%) | 15 (7.8%) |
| 30 to 34 Minutes | 33 (10.2%) | 0 (0.0%) |
| 35 to 39 Minutes | 0 (0.0%) | 0 (0.0%) |
| 40 to 44 Minutes | 17 (5.2%) | 0 (0.0%) |
| 45 to 59 Minutes | 18 (5.6%) | 43 (22.3%) |
| 60 to 89 Minutes | 4 (1.2%) | 21 (10.9%) |
| 90 or more Minutes | 12 (3.7%) | 74 (38.3%) |
Time of Departure to Work by Sex in Hudson Lake
The most frequent times of departure to work in Hudson Lake are 4:00 PM to 11:59 PM (113, 34.9%) for males and 7:00 AM to 7:29 AM (87, 45.1%) for females.
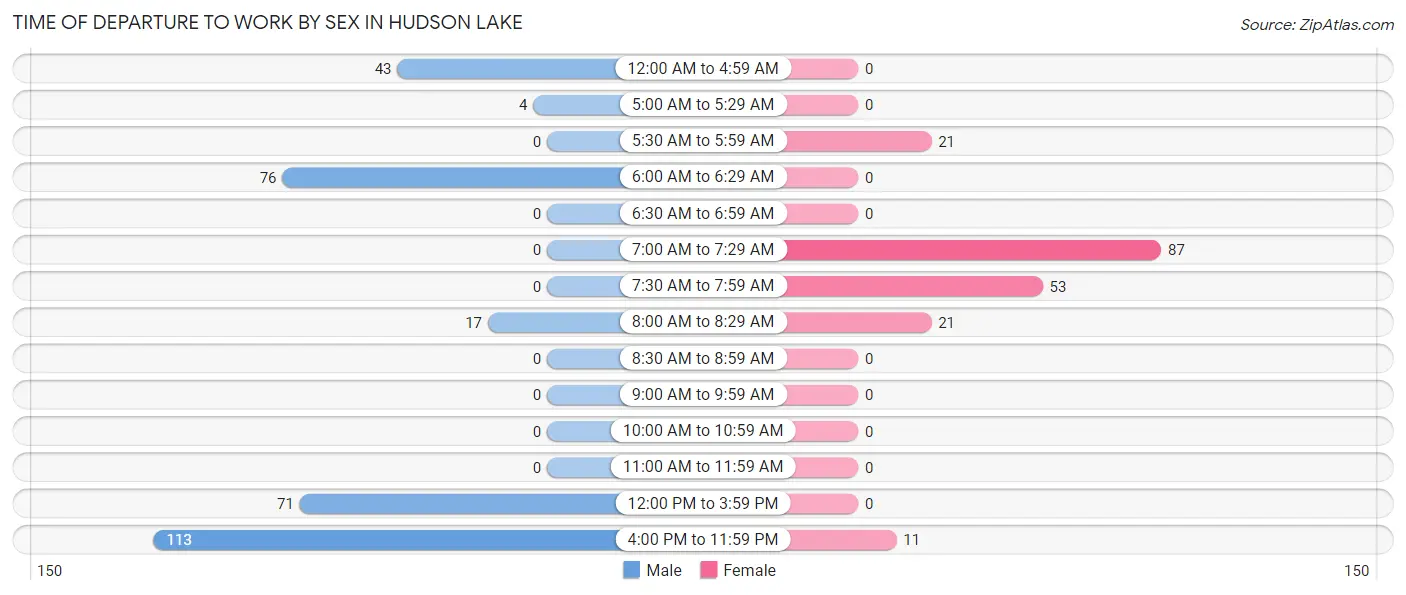
| Time of Departure | Male | Female |
| 12:00 AM to 4:59 AM | 43 (13.3%) | 0 (0.0%) |
| 5:00 AM to 5:29 AM | 4 (1.2%) | 0 (0.0%) |
| 5:30 AM to 5:59 AM | 0 (0.0%) | 21 (10.9%) |
| 6:00 AM to 6:29 AM | 76 (23.5%) | 0 (0.0%) |
| 6:30 AM to 6:59 AM | 0 (0.0%) | 0 (0.0%) |
| 7:00 AM to 7:29 AM | 0 (0.0%) | 87 (45.1%) |
| 7:30 AM to 7:59 AM | 0 (0.0%) | 53 (27.5%) |
| 8:00 AM to 8:29 AM | 17 (5.2%) | 21 (10.9%) |
| 8:30 AM to 8:59 AM | 0 (0.0%) | 0 (0.0%) |
| 9:00 AM to 9:59 AM | 0 (0.0%) | 0 (0.0%) |
| 10:00 AM to 10:59 AM | 0 (0.0%) | 0 (0.0%) |
| 11:00 AM to 11:59 AM | 0 (0.0%) | 0 (0.0%) |
| 12:00 PM to 3:59 PM | 71 (21.9%) | 0 (0.0%) |
| 4:00 PM to 11:59 PM | 113 (34.9%) | 11 (5.7%) |
| Total | 324 (100.0%) | 193 (100.0%) |
Housing Occupancy in Hudson Lake
Occupancy by Ownership in Hudson Lake
Of the total 477 dwellings in Hudson Lake, owner-occupied units account for 459 (96.2%), while renter-occupied units make up 18 (3.8%).
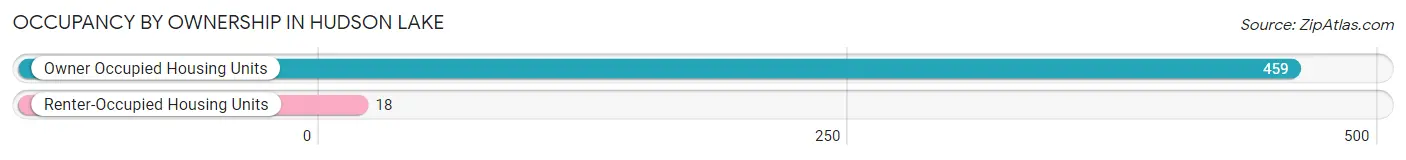
| Occupancy | # Housing Units | % Housing Units |
| Owner Occupied Housing Units | 459 | 96.2% |
| Renter-Occupied Housing Units | 18 | 3.8% |
| Total Occupied Housing Units | 477 | 100.0% |
Occupancy by Household Size in Hudson Lake
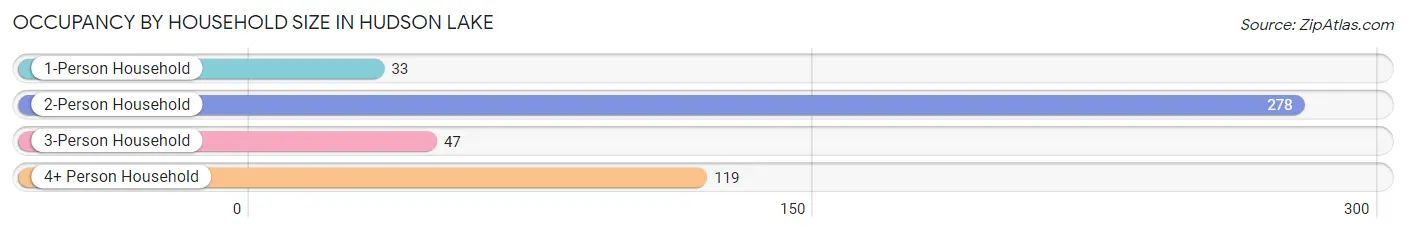
| Household Size | # Housing Units | % Housing Units |
| 1-Person Household | 33 | 6.9% |
| 2-Person Household | 278 | 58.3% |
| 3-Person Household | 47 | 9.9% |
| 4+ Person Household | 119 | 24.9% |
| Total Housing Units | 477 | 100.0% |
Occupancy by Ownership by Household Size in Hudson Lake
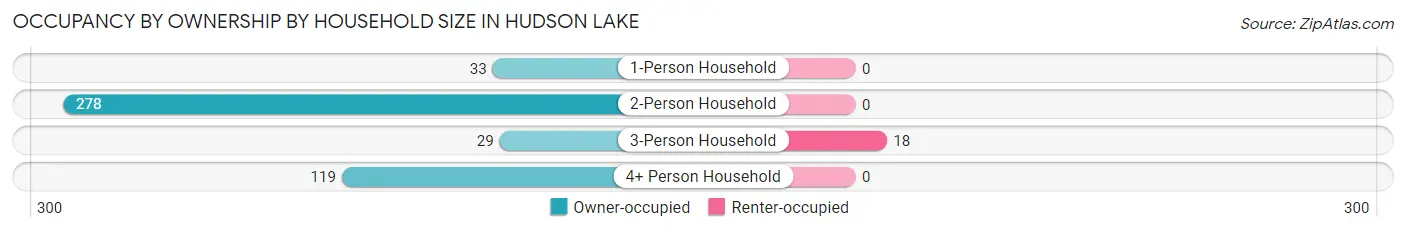
| Household Size | Owner-occupied | Renter-occupied |
| 1-Person Household | 33 (100.0%) | 0 (0.0%) |
| 2-Person Household | 278 (100.0%) | 0 (0.0%) |
| 3-Person Household | 29 (61.7%) | 18 (38.3%) |
| 4+ Person Household | 119 (100.0%) | 0 (0.0%) |
| Total Housing Units | 459 (96.2%) | 18 (3.8%) |
Occupancy by Educational Attainment in Hudson Lake
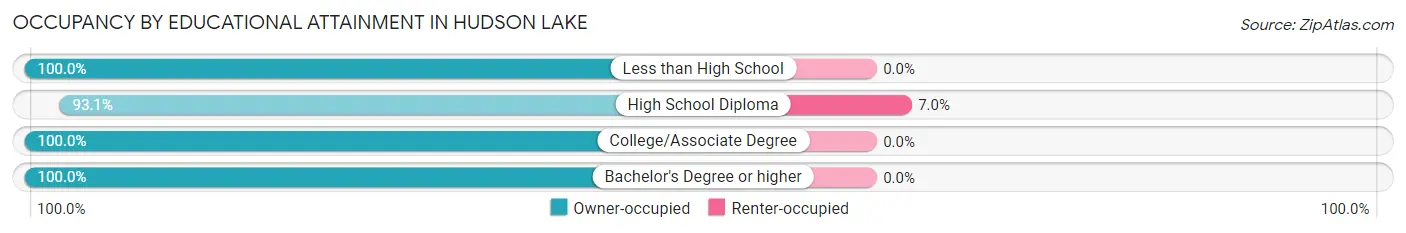
| Household Size | Owner-occupied | Renter-occupied |
| Less than High School | 44 (100.0%) | 0 (0.0%) |
| High School Diploma | 241 (93.0%) | 18 (7.0%) |
| College/Associate Degree | 74 (100.0%) | 0 (0.0%) |
| Bachelor's Degree or higher | 100 (100.0%) | 0 (0.0%) |
Occupancy by Age of Householder in Hudson Lake
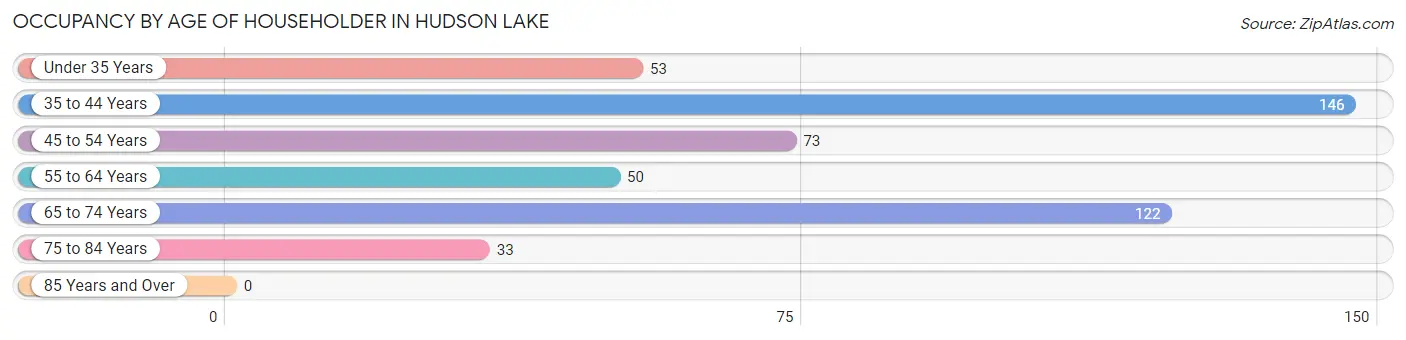
| Age Bracket | # Households | % Households |
| Under 35 Years | 53 | 11.1% |
| 35 to 44 Years | 146 | 30.6% |
| 45 to 54 Years | 73 | 15.3% |
| 55 to 64 Years | 50 | 10.5% |
| 65 to 74 Years | 122 | 25.6% |
| 75 to 84 Years | 33 | 6.9% |
| 85 Years and Over | 0 | 0.0% |
| Total | 477 | 100.0% |
Housing Finances in Hudson Lake
Median Income by Occupancy in Hudson Lake
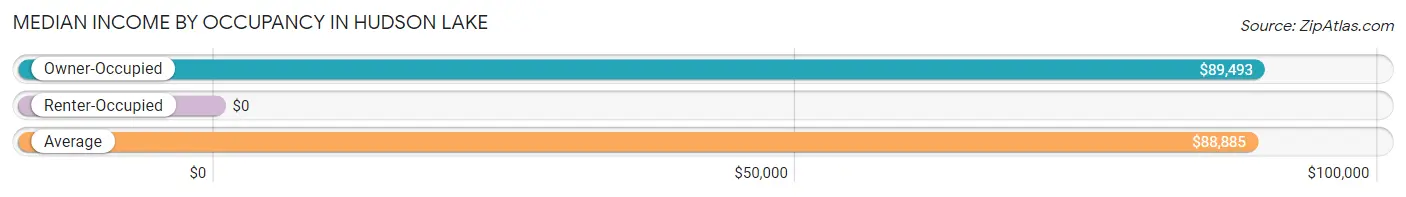
| Occupancy Type | # Households | Median Income |
| Owner-Occupied | 459 (96.2%) | $89,493 |
| Renter-Occupied | 18 (3.8%) | $0 |
| Average | 477 (100.0%) | $88,885 |
Occupancy by Householder Income Bracket in Hudson Lake
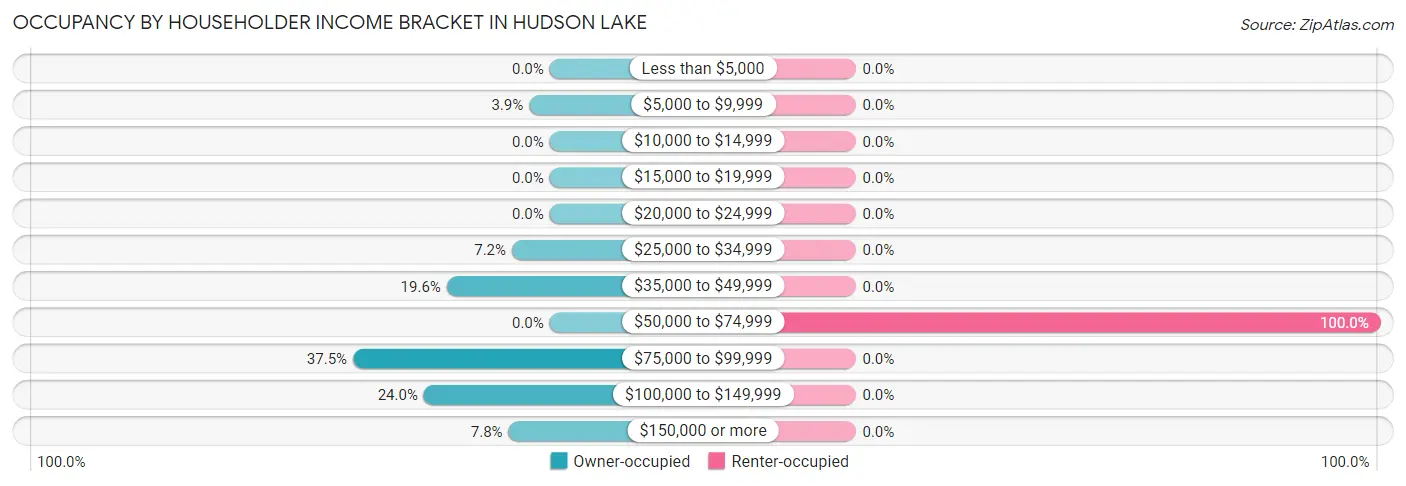
| Income Bracket | Owner-occupied | Renter-occupied |
| Less than $5,000 | 0 (0.0%) | 0 (0.0%) |
| $5,000 to $9,999 | 18 (3.9%) | 0 (0.0%) |
| $10,000 to $14,999 | 0 (0.0%) | 0 (0.0%) |
| $15,000 to $19,999 | 0 (0.0%) | 0 (0.0%) |
| $20,000 to $24,999 | 0 (0.0%) | 0 (0.0%) |
| $25,000 to $34,999 | 33 (7.2%) | 0 (0.0%) |
| $35,000 to $49,999 | 90 (19.6%) | 0 (0.0%) |
| $50,000 to $74,999 | 0 (0.0%) | 18 (100.0%) |
| $75,000 to $99,999 | 172 (37.5%) | 0 (0.0%) |
| $100,000 to $149,999 | 110 (24.0%) | 0 (0.0%) |
| $150,000 or more | 36 (7.8%) | 0 (0.0%) |
| Total | 459 (100.0%) | 18 (100.0%) |
Monthly Housing Cost Tiers in Hudson Lake
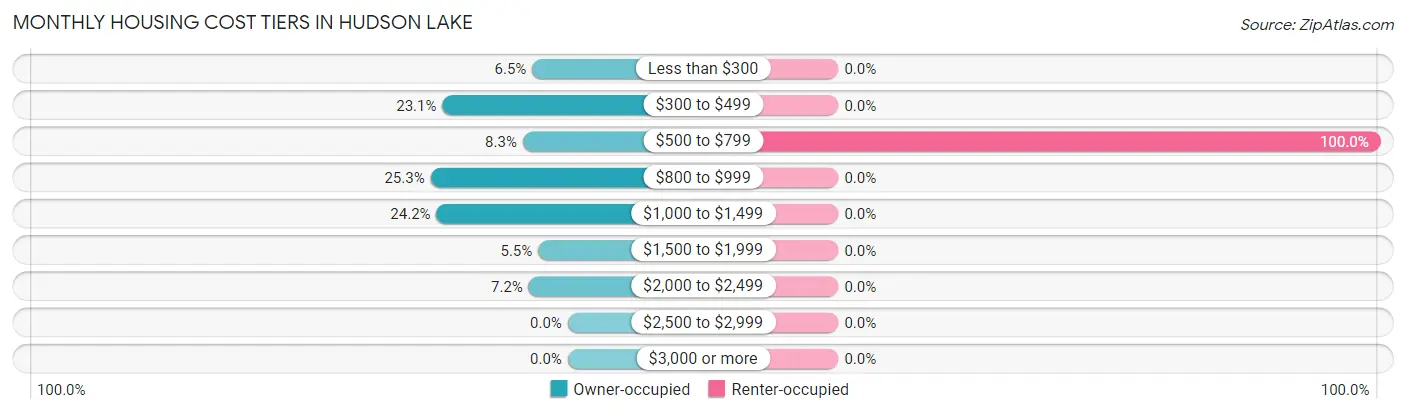
| Monthly Cost | Owner-occupied | Renter-occupied |
| Less than $300 | 30 (6.5%) | 0 (0.0%) |
| $300 to $499 | 106 (23.1%) | 0 (0.0%) |
| $500 to $799 | 38 (8.3%) | 18 (100.0%) |
| $800 to $999 | 116 (25.3%) | 0 (0.0%) |
| $1,000 to $1,499 | 111 (24.2%) | 0 (0.0%) |
| $1,500 to $1,999 | 25 (5.4%) | 0 (0.0%) |
| $2,000 to $2,499 | 33 (7.2%) | 0 (0.0%) |
| $2,500 to $2,999 | 0 (0.0%) | 0 (0.0%) |
| $3,000 or more | 0 (0.0%) | 0 (0.0%) |
| Total | 459 (100.0%) | 18 (100.0%) |
Physical Housing Characteristics in Hudson Lake
Housing Structures in Hudson Lake
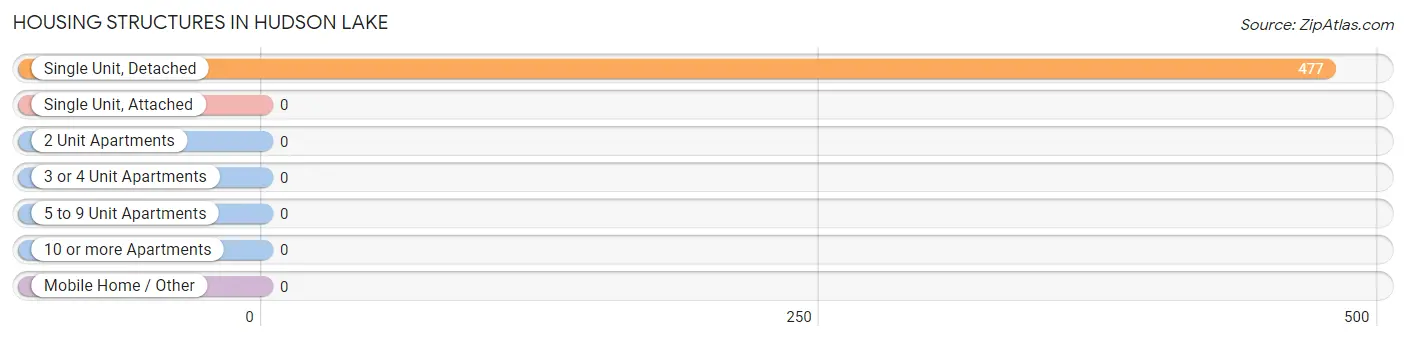
| Structure Type | # Housing Units | % Housing Units |
| Single Unit, Detached | 477 | 100.0% |
| Single Unit, Attached | 0 | 0.0% |
| 2 Unit Apartments | 0 | 0.0% |
| 3 or 4 Unit Apartments | 0 | 0.0% |
| 5 to 9 Unit Apartments | 0 | 0.0% |
| 10 or more Apartments | 0 | 0.0% |
| Mobile Home / Other | 0 | 0.0% |
| Total | 477 | 100.0% |
Housing Structures by Occupancy in Hudson Lake
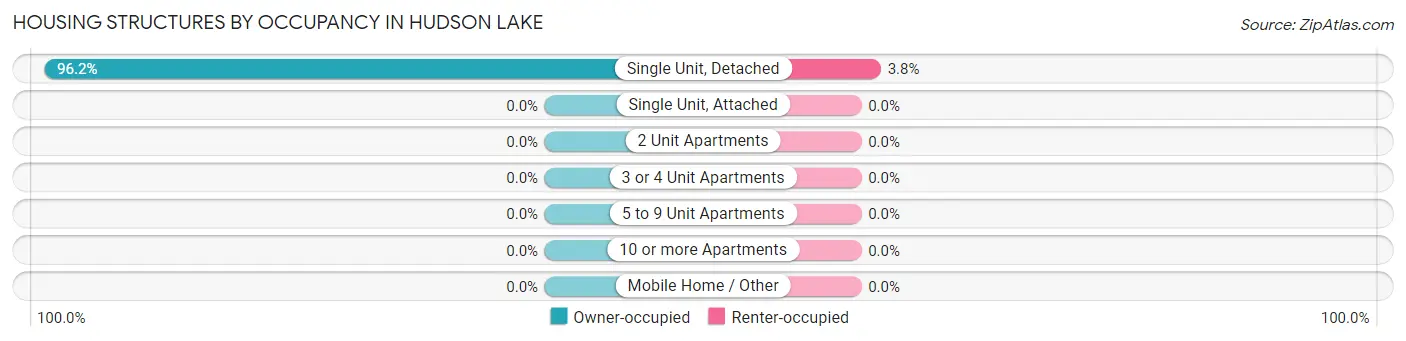
| Structure Type | Owner-occupied | Renter-occupied |
| Single Unit, Detached | 459 (96.2%) | 18 (3.8%) |
| Single Unit, Attached | 0 (0.0%) | 0 (0.0%) |
| 2 Unit Apartments | 0 (0.0%) | 0 (0.0%) |
| 3 or 4 Unit Apartments | 0 (0.0%) | 0 (0.0%) |
| 5 to 9 Unit Apartments | 0 (0.0%) | 0 (0.0%) |
| 10 or more Apartments | 0 (0.0%) | 0 (0.0%) |
| Mobile Home / Other | 0 (0.0%) | 0 (0.0%) |
| Total | 459 (96.2%) | 18 (3.8%) |
Housing Structures by Number of Rooms in Hudson Lake
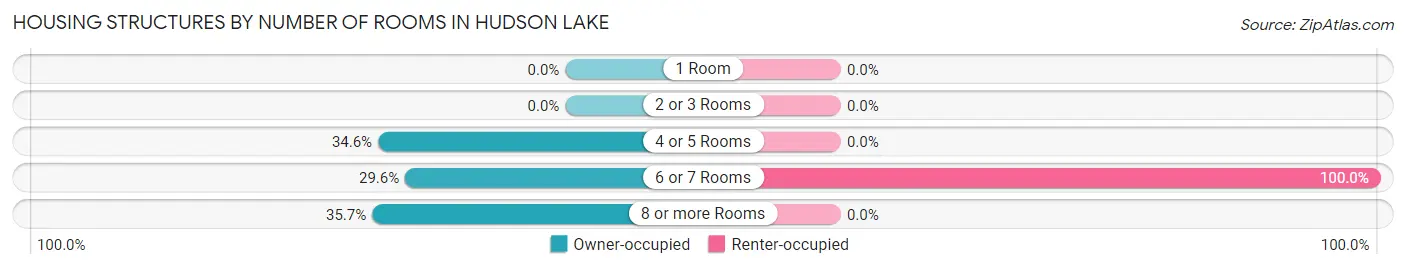
| Number of Rooms | Owner-occupied | Renter-occupied |
| 1 Room | 0 (0.0%) | 0 (0.0%) |
| 2 or 3 Rooms | 0 (0.0%) | 0 (0.0%) |
| 4 or 5 Rooms | 159 (34.6%) | 0 (0.0%) |
| 6 or 7 Rooms | 136 (29.6%) | 18 (100.0%) |
| 8 or more Rooms | 164 (35.7%) | 0 (0.0%) |
| Total | 459 (100.0%) | 18 (100.0%) |
Housing Structure by Heating Type in Hudson Lake
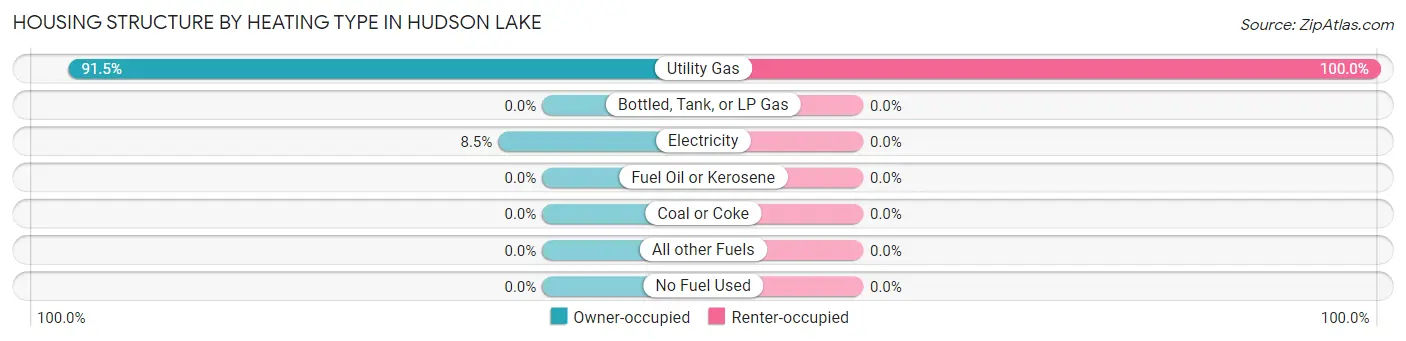
| Heating Type | Owner-occupied | Renter-occupied |
| Utility Gas | 420 (91.5%) | 18 (100.0%) |
| Bottled, Tank, or LP Gas | 0 (0.0%) | 0 (0.0%) |
| Electricity | 39 (8.5%) | 0 (0.0%) |
| Fuel Oil or Kerosene | 0 (0.0%) | 0 (0.0%) |
| Coal or Coke | 0 (0.0%) | 0 (0.0%) |
| All other Fuels | 0 (0.0%) | 0 (0.0%) |
| No Fuel Used | 0 (0.0%) | 0 (0.0%) |
| Total | 459 (100.0%) | 18 (100.0%) |
Household Vehicle Usage in Hudson Lake
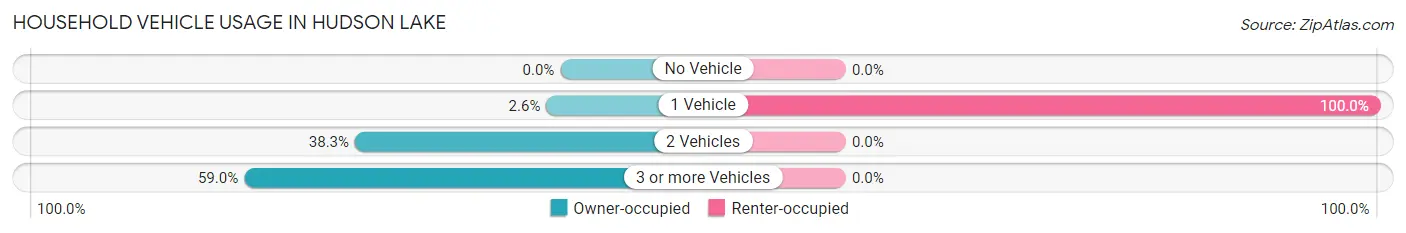
| Vehicles per Household | Owner-occupied | Renter-occupied |
| No Vehicle | 0 (0.0%) | 0 (0.0%) |
| 1 Vehicle | 12 (2.6%) | 18 (100.0%) |
| 2 Vehicles | 176 (38.3%) | 0 (0.0%) |
| 3 or more Vehicles | 271 (59.0%) | 0 (0.0%) |
| Total | 459 (100.0%) | 18 (100.0%) |
Real Estate & Mortgages in Hudson Lake
Real Estate and Mortgage Overview in Hudson Lake
| Characteristic | Without Mortgage | With Mortgage |
| Housing Units | 136 | 323 |
| Median Property Value | $117,800 | $127,200 |
| Median Household Income | $36,458 | $36 |
| Monthly Housing Costs | $436 | $0 |
| Real Estate Taxes | $1,567 | $0 |
Property Value by Mortgage Status in Hudson Lake
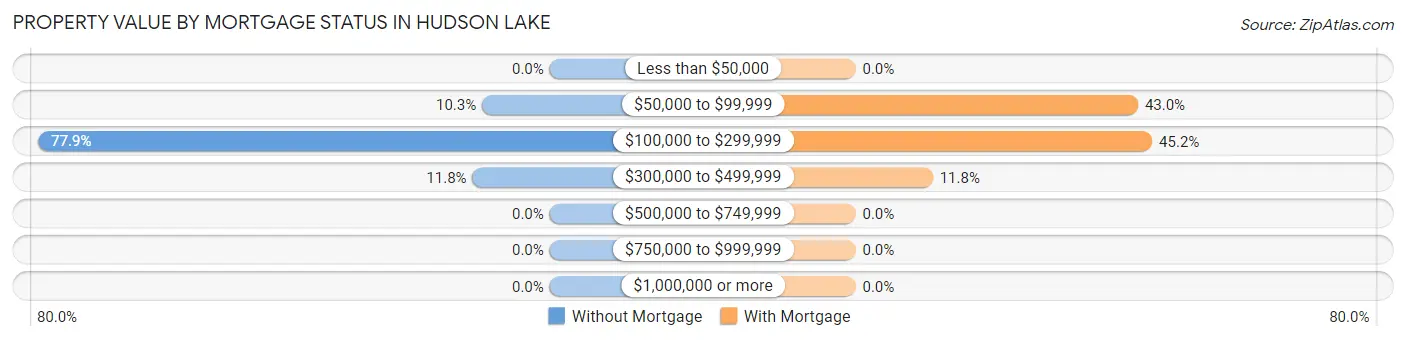
| Property Value | Without Mortgage | With Mortgage |
| Less than $50,000 | 0 (0.0%) | 0 (0.0%) |
| $50,000 to $99,999 | 14 (10.3%) | 139 (43.0%) |
| $100,000 to $299,999 | 106 (77.9%) | 146 (45.2%) |
| $300,000 to $499,999 | 16 (11.8%) | 38 (11.8%) |
| $500,000 to $749,999 | 0 (0.0%) | 0 (0.0%) |
| $750,000 to $999,999 | 0 (0.0%) | 0 (0.0%) |
| $1,000,000 or more | 0 (0.0%) | 0 (0.0%) |
| Total | 136 (100.0%) | 323 (100.0%) |
Household Income by Mortgage Status in Hudson Lake
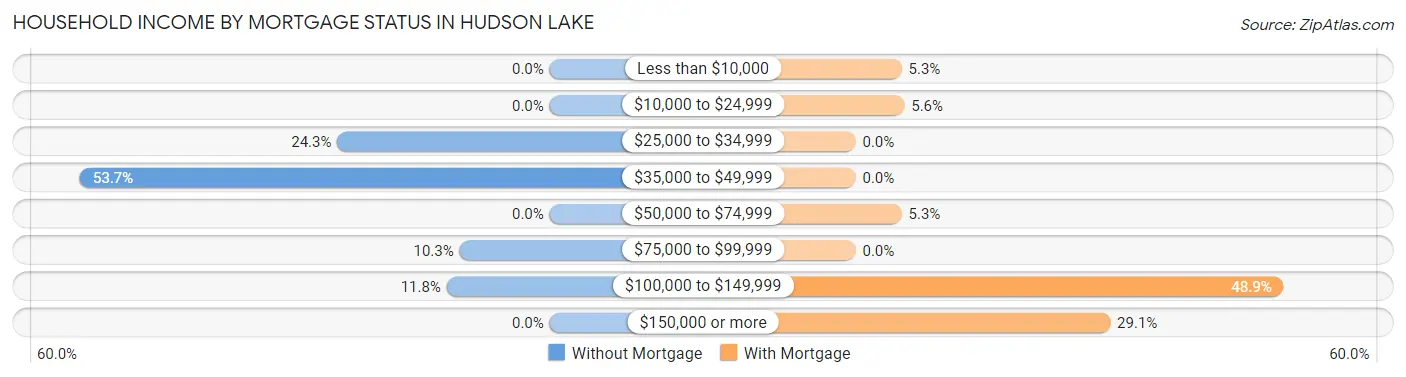
| Household Income | Without Mortgage | With Mortgage |
| Less than $10,000 | 0 (0.0%) | 17 (5.3%) |
| $10,000 to $24,999 | 0 (0.0%) | 18 (5.6%) |
| $25,000 to $34,999 | 33 (24.3%) | 0 (0.0%) |
| $35,000 to $49,999 | 73 (53.7%) | 0 (0.0%) |
| $50,000 to $74,999 | 0 (0.0%) | 17 (5.3%) |
| $75,000 to $99,999 | 14 (10.3%) | 0 (0.0%) |
| $100,000 to $149,999 | 16 (11.8%) | 158 (48.9%) |
| $150,000 or more | 0 (0.0%) | 94 (29.1%) |
| Total | 136 (100.0%) | 323 (100.0%) |
Property Value to Household Income Ratio in Hudson Lake
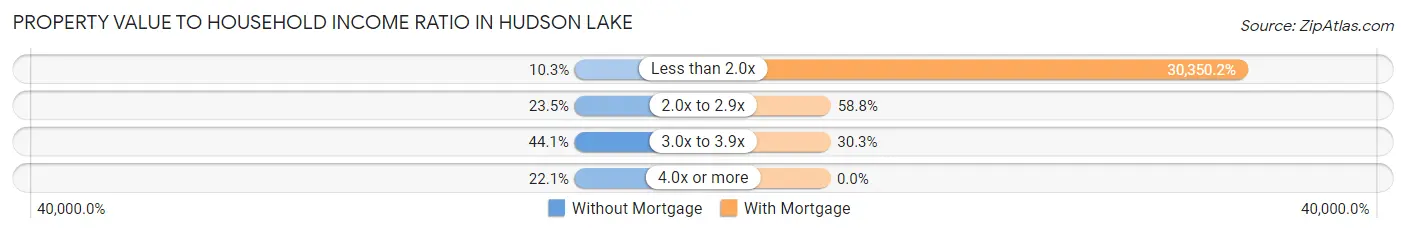
| Value-to-Income Ratio | Without Mortgage | With Mortgage |
| Less than 2.0x | 14 (10.3%) | 98,031 (30,350.2%) |
| 2.0x to 2.9x | 32 (23.5%) | 190 (58.8%) |
| 3.0x to 3.9x | 60 (44.1%) | 98 (30.3%) |
| 4.0x or more | 30 (22.1%) | 0 (0.0%) |
| Total | 136 (100.0%) | 323 (100.0%) |
Real Estate Taxes by Mortgage Status in Hudson Lake
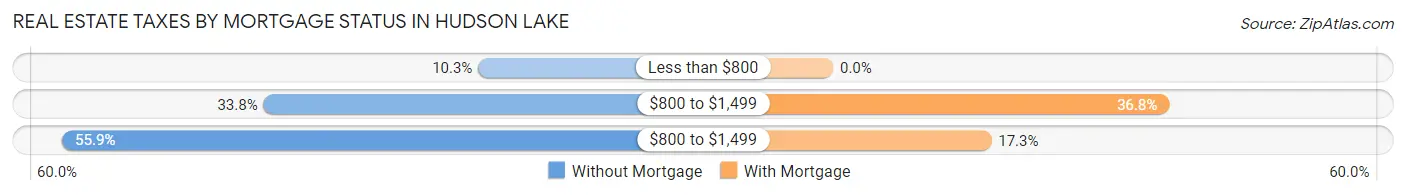
| Property Taxes | Without Mortgage | With Mortgage |
| Less than $800 | 14 (10.3%) | 0 (0.0%) |
| $800 to $1,499 | 46 (33.8%) | 119 (36.8%) |
| $800 to $1,499 | 76 (55.9%) | 56 (17.3%) |
| Total | 136 (100.0%) | 323 (100.0%) |
Health & Disability in Hudson Lake
Health Insurance Coverage by Age in Hudson Lake
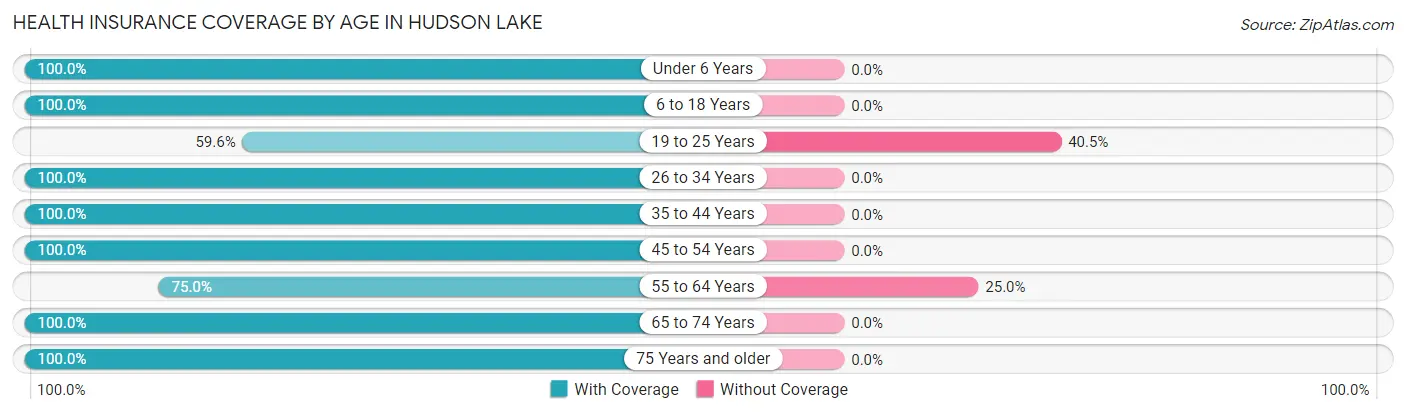
| Age Bracket | With Coverage | Without Coverage |
| Under 6 Years | 70 (100.0%) | 0 (0.0%) |
| 6 to 18 Years | 359 (100.0%) | 0 (0.0%) |
| 19 to 25 Years | 53 (59.6%) | 36 (40.5%) |
| 26 to 34 Years | 77 (100.0%) | 0 (0.0%) |
| 35 to 44 Years | 222 (100.0%) | 0 (0.0%) |
| 45 to 54 Years | 141 (100.0%) | 0 (0.0%) |
| 55 to 64 Years | 105 (75.0%) | 35 (25.0%) |
| 65 to 74 Years | 186 (100.0%) | 0 (0.0%) |
| 75 Years and older | 86 (100.0%) | 0 (0.0%) |
| Total | 1,299 (94.8%) | 71 (5.2%) |
Health Insurance Coverage by Citizenship Status in Hudson Lake
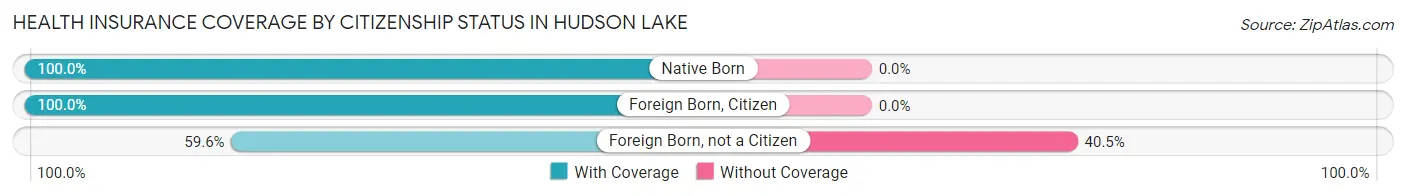
| Citizenship Status | With Coverage | Without Coverage |
| Native Born | 70 (100.0%) | 0 (0.0%) |
| Foreign Born, Citizen | 359 (100.0%) | 0 (0.0%) |
| Foreign Born, not a Citizen | 53 (59.6%) | 36 (40.5%) |
Health Insurance Coverage by Household Income in Hudson Lake
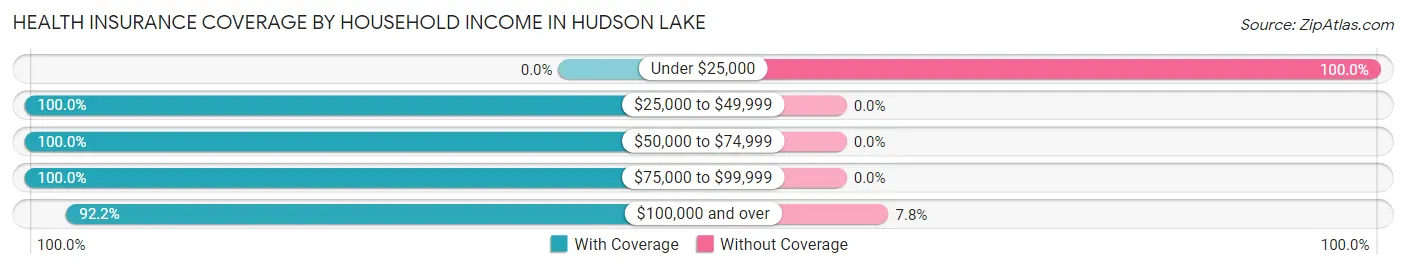
| Household Income | With Coverage | Without Coverage |
| Under $25,000 | 0 (0.0%) | 36 (100.0%) |
| $25,000 to $49,999 | 259 (100.0%) | 0 (0.0%) |
| $50,000 to $74,999 | 55 (100.0%) | 0 (0.0%) |
| $75,000 to $99,999 | 573 (100.0%) | 0 (0.0%) |
| $100,000 and over | 412 (92.2%) | 35 (7.8%) |
Public vs Private Health Insurance Coverage by Age in Hudson Lake
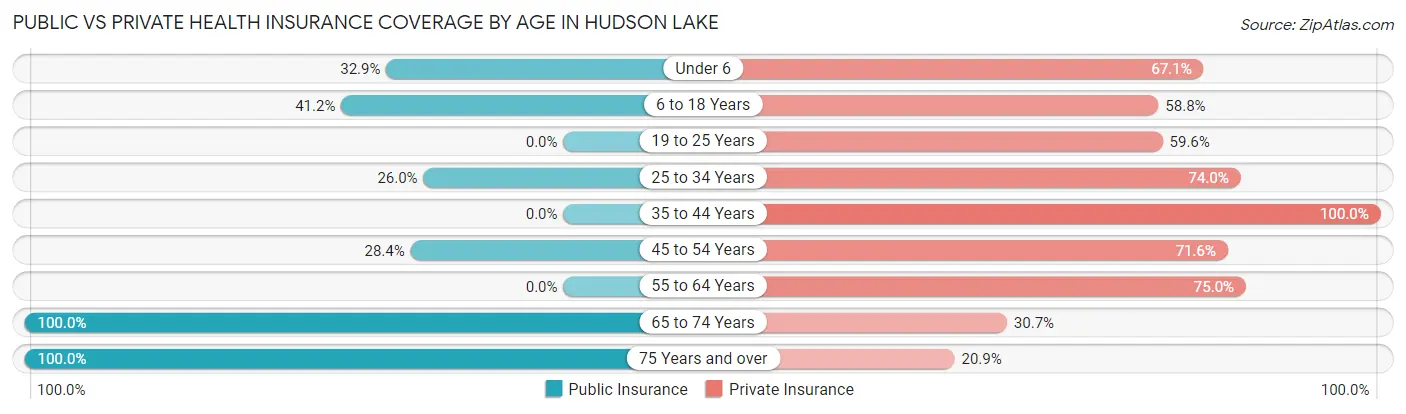
| Age Bracket | Public Insurance | Private Insurance |
| Under 6 | 23 (32.9%) | 47 (67.1%) |
| 6 to 18 Years | 148 (41.2%) | 211 (58.8%) |
| 19 to 25 Years | 0 (0.0%) | 53 (59.6%) |
| 25 to 34 Years | 20 (26.0%) | 57 (74.0%) |
| 35 to 44 Years | 0 (0.0%) | 222 (100.0%) |
| 45 to 54 Years | 40 (28.4%) | 101 (71.6%) |
| 55 to 64 Years | 0 (0.0%) | 105 (75.0%) |
| 65 to 74 Years | 186 (100.0%) | 57 (30.6%) |
| 75 Years and over | 86 (100.0%) | 18 (20.9%) |
| Total | 503 (36.7%) | 871 (63.6%) |
Disability Status by Sex by Age in Hudson Lake
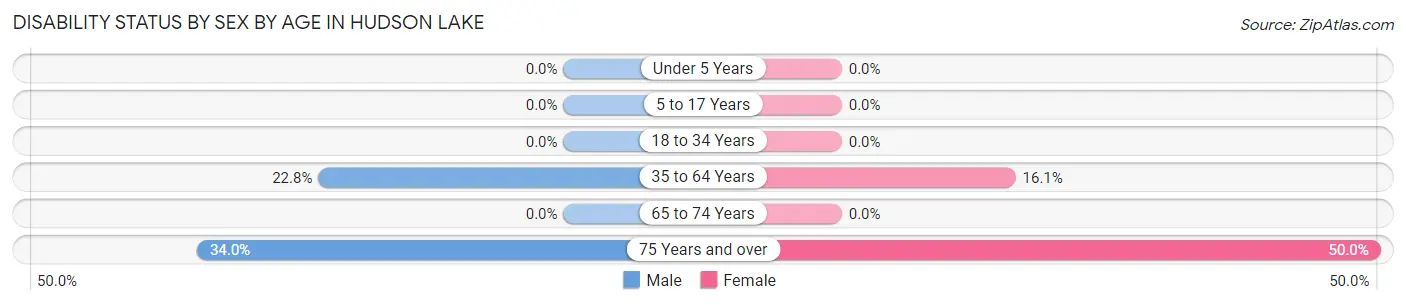
| Age Bracket | Male | Female |
| Under 5 Years | 0 (0.0%) | 0 (0.0%) |
| 5 to 17 Years | 0 (0.0%) | 0 (0.0%) |
| 18 to 34 Years | 0 (0.0%) | 0 (0.0%) |
| 35 to 64 Years | 58 (22.8%) | 40 (16.1%) |
| 65 to 74 Years | 0 (0.0%) | 0 (0.0%) |
| 75 Years and over | 17 (34.0%) | 18 (50.0%) |
Disability Class by Sex by Age in Hudson Lake
Disability Class: Hearing Difficulty
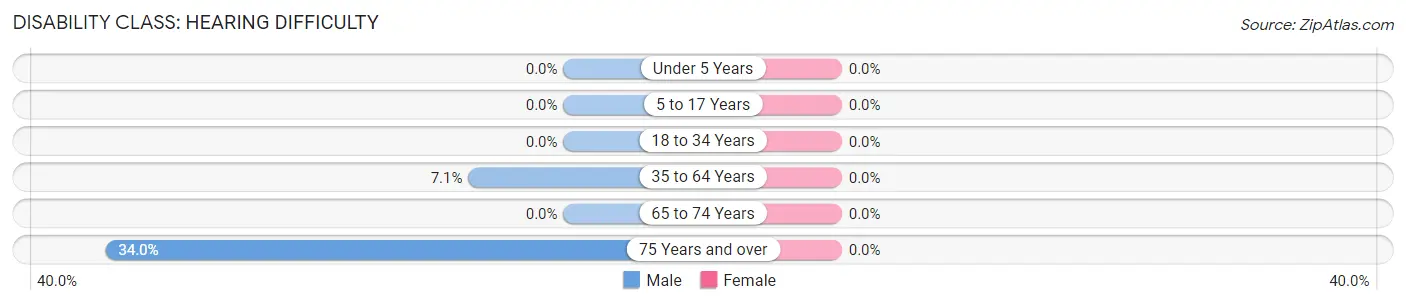
| Age Bracket | Male | Female |
| Under 5 Years | 0 (0.0%) | 0 (0.0%) |
| 5 to 17 Years | 0 (0.0%) | 0 (0.0%) |
| 18 to 34 Years | 0 (0.0%) | 0 (0.0%) |
| 35 to 64 Years | 18 (7.1%) | 0 (0.0%) |
| 65 to 74 Years | 0 (0.0%) | 0 (0.0%) |
| 75 Years and over | 17 (34.0%) | 0 (0.0%) |
Disability Class: Vision Difficulty
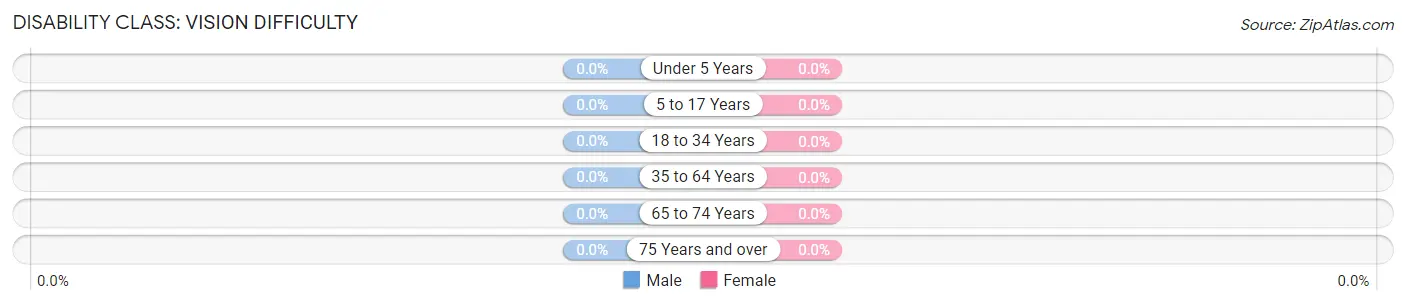
| Age Bracket | Male | Female |
| Under 5 Years | 0 (0.0%) | 0 (0.0%) |
| 5 to 17 Years | 0 (0.0%) | 0 (0.0%) |
| 18 to 34 Years | 0 (0.0%) | 0 (0.0%) |
| 35 to 64 Years | 0 (0.0%) | 0 (0.0%) |
| 65 to 74 Years | 0 (0.0%) | 0 (0.0%) |
| 75 Years and over | 0 (0.0%) | 0 (0.0%) |
Disability Class: Cognitive Difficulty
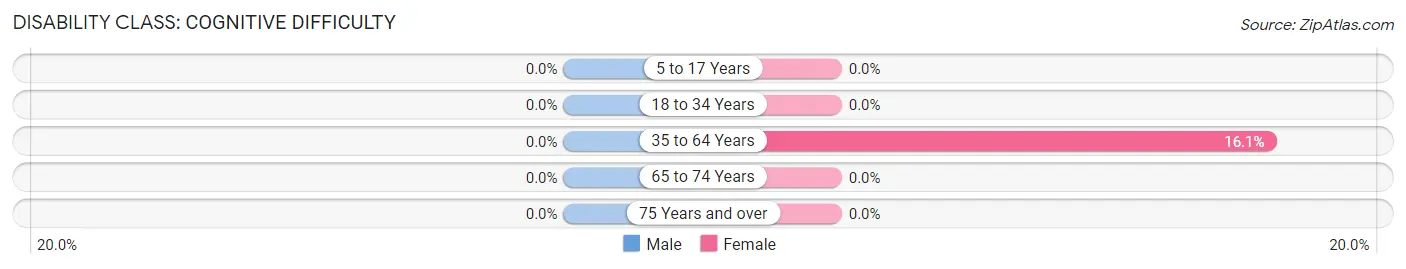
| Age Bracket | Male | Female |
| 5 to 17 Years | 0 (0.0%) | 0 (0.0%) |
| 18 to 34 Years | 0 (0.0%) | 0 (0.0%) |
| 35 to 64 Years | 0 (0.0%) | 40 (16.1%) |
| 65 to 74 Years | 0 (0.0%) | 0 (0.0%) |
| 75 Years and over | 0 (0.0%) | 0 (0.0%) |
Disability Class: Ambulatory Difficulty
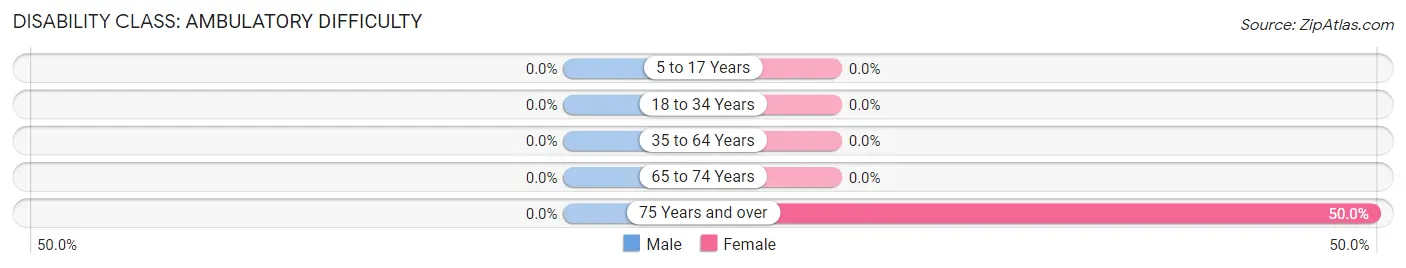
| Age Bracket | Male | Female |
| 5 to 17 Years | 0 (0.0%) | 0 (0.0%) |
| 18 to 34 Years | 0 (0.0%) | 0 (0.0%) |
| 35 to 64 Years | 0 (0.0%) | 0 (0.0%) |
| 65 to 74 Years | 0 (0.0%) | 0 (0.0%) |
| 75 Years and over | 0 (0.0%) | 18 (50.0%) |
Disability Class: Self-Care Difficulty
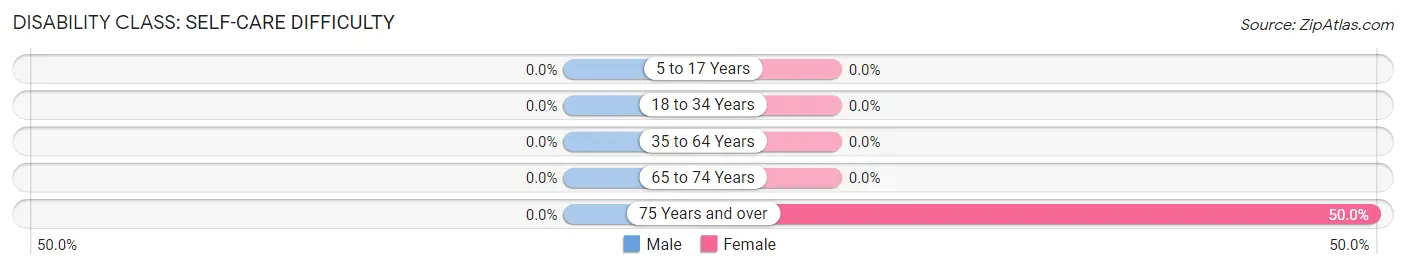
| Age Bracket | Male | Female |
| 5 to 17 Years | 0 (0.0%) | 0 (0.0%) |
| 18 to 34 Years | 0 (0.0%) | 0 (0.0%) |
| 35 to 64 Years | 0 (0.0%) | 0 (0.0%) |
| 65 to 74 Years | 0 (0.0%) | 0 (0.0%) |
| 75 Years and over | 0 (0.0%) | 18 (50.0%) |
Technology Access in Hudson Lake
Computing Device Access in Hudson Lake
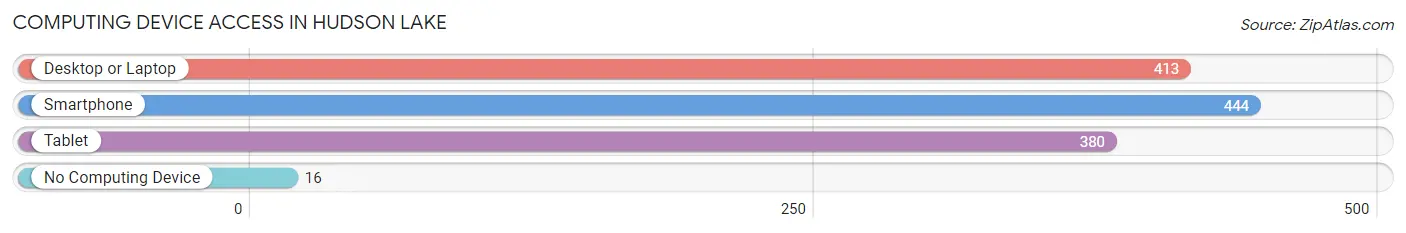
| Device Type | # Households | % Households |
| Desktop or Laptop | 413 | 86.6% |
| Smartphone | 444 | 93.1% |
| Tablet | 380 | 79.7% |
| No Computing Device | 16 | 3.4% |
| Total | 477 | 100.0% |
Internet Access in Hudson Lake
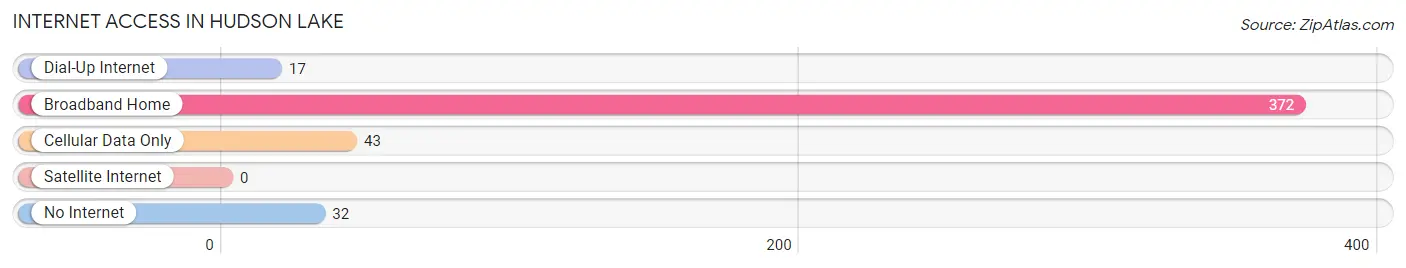
| Internet Type | # Households | % Households |
| Dial-Up Internet | 17 | 3.6% |
| Broadband Home | 372 | 78.0% |
| Cellular Data Only | 43 | 9.0% |
| Satellite Internet | 0 | 0.0% |
| No Internet | 32 | 6.7% |
| Total | 477 | 100.0% |
Hudson Lake Summary
Hudson Lake is a small unincorporated community located in LaPorte County, Indiana. It is situated on the western shore of Hudson Lake, a natural lake that is part of the Kankakee River watershed. The lake is approximately 1,000 acres in size and is a popular destination for fishing, boating, and other recreational activities. The community is located approximately 10 miles south of LaPorte and 25 miles east of South Bend.
History
Hudson Lake was first settled in the early 1800s by a group of settlers from New York. The settlers were attracted to the area by the abundance of natural resources, including the lake and the surrounding forests. The settlers built a small village on the lake's shore and named it after the lake. The village grew slowly over the years and by the early 1900s, it had become a popular summer destination for vacationers from Chicago and other nearby cities.
In the early 1900s, the village was incorporated as the Town of Hudson Lake. The town was home to a variety of businesses, including a general store, a hotel, and a post office. The town also had a school, a church, and a few other small businesses.
In the 1950s, the town began to decline as the popularity of the lake as a vacation destination began to wane. By the 1970s, the town had become a virtual ghost town, with only a few residents remaining. In the 1980s, the town was reincorporated as an unincorporated community.
Geography
Hudson Lake is located in LaPorte County, Indiana. It is situated on the western shore of Hudson Lake, a natural lake that is part of the Kankakee River watershed. The lake is approximately 1,000 acres in size and is a popular destination for fishing, boating, and other recreational activities. The community is located approximately 10 miles south of LaPorte and 25 miles east of South Bend.
The terrain around Hudson Lake is mostly flat, with some rolling hills. The area is heavily forested, with a mix of deciduous and coniferous trees. The lake is fed by several small streams and is surrounded by marshland.
Economy
Hudson Lake is an unincorporated community and does not have its own economy. The majority of the residents are employed in nearby towns and cities, such as LaPorte and South Bend. The lake is a popular destination for fishing, boating, and other recreational activities, and there are several businesses in the area that cater to these activities.
Demographics
As of the 2010 census, the population of Hudson Lake was 1,072. The racial makeup of the community was 97.3% White, 0.7% African American, 0.3% Native American, 0.2% Asian, and 1.5% from other races. The median household income was $45,000, and the median age was 44.
Conclusion
Hudson Lake is a small unincorporated community located in LaPorte County, Indiana. It is situated on the western shore of Hudson Lake, a natural lake that is part of the Kankakee River watershed. The lake is a popular destination for fishing, boating, and other recreational activities, and the surrounding area is heavily forested. The community is home to a population of 1,072, and the median household income is $45,000. The majority of the residents are employed in nearby towns and cities, such as LaPorte and South Bend.
Common Questions
What is the Total Population of Hudson Lake?
Total Population of Hudson Lake is 1,370.
What is the Total Male Population of Hudson Lake?
Total Male Population of Hudson Lake is 721.
What is the Total Female Population of Hudson Lake?
Total Female Population of Hudson Lake is 649.
What is the Ratio of Males per 100 Females in Hudson Lake?
There are 111.09 Males per 100 Females in Hudson Lake.
What is the Ratio of Females per 100 Males in Hudson Lake?
There are 90.01 Females per 100 Males in Hudson Lake.
What is the Median Population Age in Hudson Lake?
Median Population Age in Hudson Lake is 38.1 Years.
What is the Average Family Size in Hudson Lake
Average Family Size in Hudson Lake is 2.9 People.
What is the Average Household Size in Hudson Lake
Average Household Size in Hudson Lake is 2.9 People.
What is Per Capita Income in Hudson Lake?
Per Capita income in Hudson Lake is $31,173.
What is the Median Family Income in Hudson Lake?
Median Family Income in Hudson Lake is $82,083.
What is the Median Household income in Hudson Lake?
Median Household Income in Hudson Lake is $88,885.
What is Inequality or Gini Index in Hudson Lake?
Inequality or Gini Index in Hudson Lake is 0.29.
How Large is the Labor Force in Hudson Lake?
There are 535 People in the Labor Forcein in Hudson Lake.
What is the Percentage of People in the Labor Force in Hudson Lake?
53.4% of People are in the Labor Force in Hudson Lake.
What is the Unemployment Rate in Hudson Lake?
Unemployment Rate in Hudson Lake is 3.4%.