Greensburg, IN
Greensburg Map
Greensburg Overview
11,431
TOTAL POPULATION
5,592
MALE POPULATION
5,839
FEMALE POPULATION
95.77
MALES / 100 FEMALES
104.42
FEMALES / 100 MALES
40.0
MEDIAN AGE
2.9
AVG FAMILY SIZE
2.2
AVG HOUSEHOLD SIZE
$31,666
PER CAPITA INCOME
$69,808
AVG FAMILY INCOME
$61,864
AVG HOUSEHOLD INCOME
36.5%
WAGE / INCOME GAP [ % ]
63.5¢/ $1
WAGE / INCOME GAP [ $ ]
$11,310
FAMILY INCOME DEFICIT
0.40
INEQUALITY / GINI INDEX
6,013
LABOR FORCE [ PEOPLE ]
64.8%
PERCENT IN LABOR FORCE
3.4%
UNEMPLOYMENT RATE
Greensburg Zip Codes
Greensburg Area Codes
Race in Greensburg
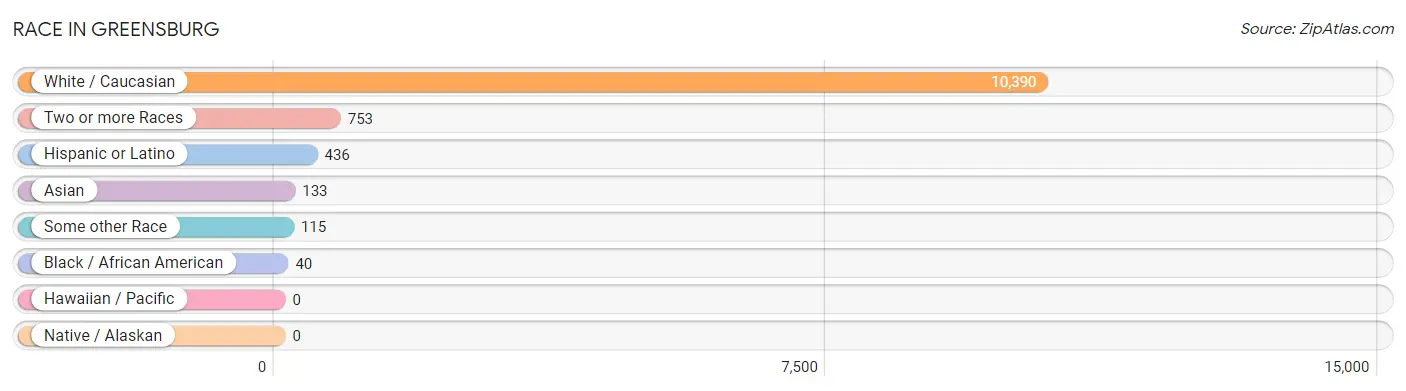
The most populous races in Greensburg are White / Caucasian (10,390 | 90.9%), Two or more Races (753 | 6.6%), and Hispanic or Latino (436 | 3.8%).
| Race | # Population | % Population |
| Asian | 133 | 1.2% |
| Black / African American | 40 | 0.4% |
| Hawaiian / Pacific | 0 | 0.0% |
| Hispanic or Latino | 436 | 3.8% |
| Native / Alaskan | 0 | 0.0% |
| White / Caucasian | 10,390 | 90.9% |
| Two or more Races | 753 | 6.6% |
| Some other Race | 115 | 1.0% |
| Total | 11,431 | 100.0% |
Ancestry in Greensburg
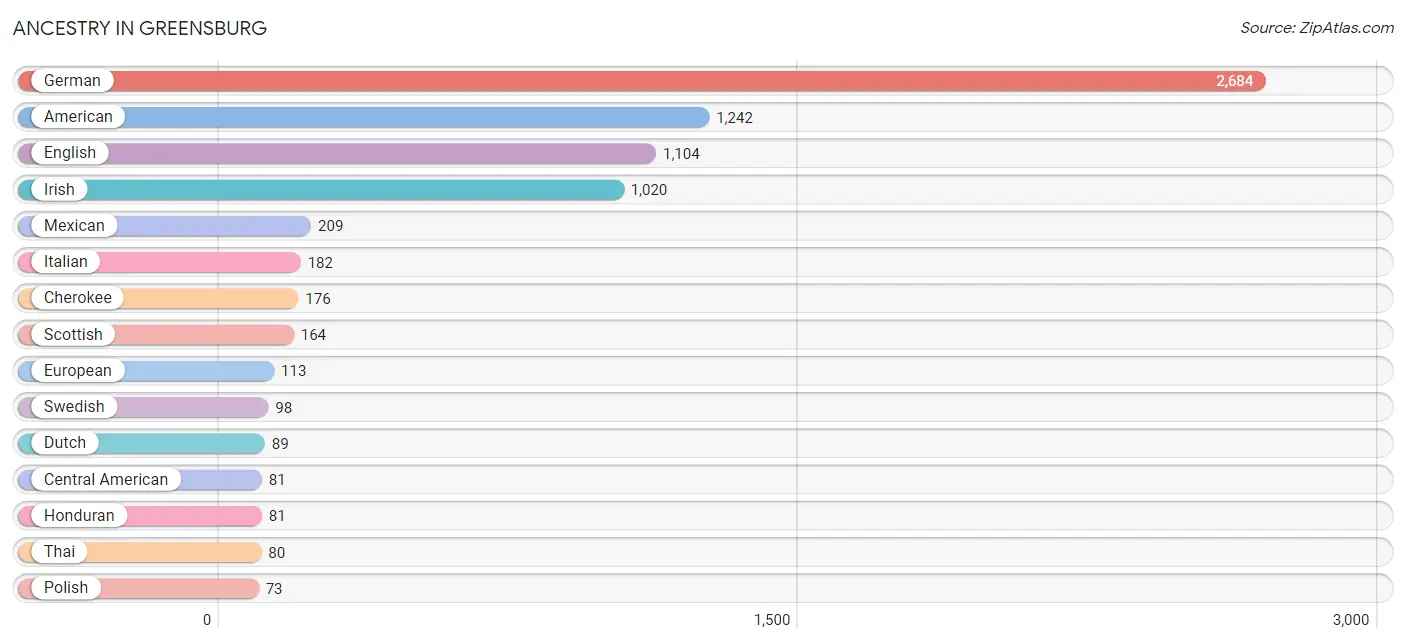
The most populous ancestries reported in Greensburg are German (2,684 | 23.5%), American (1,242 | 10.9%), English (1,104 | 9.7%), Irish (1,020 | 8.9%), and Mexican (209 | 1.8%), together accounting for 54.8% of all Greensburg residents.
| Ancestry | # Population | % Population |
| African | 23 | 0.2% |
| American | 1,242 | 10.9% |
| Bhutanese | 52 | 0.4% |
| British | 24 | 0.2% |
| Burmese | 25 | 0.2% |
| Canadian | 32 | 0.3% |
| Central American | 81 | 0.7% |
| Cherokee | 176 | 1.5% |
| Choctaw | 14 | 0.1% |
| Colombian | 52 | 0.4% |
| Dutch | 89 | 0.8% |
| English | 1,104 | 9.7% |
| European | 113 | 1.0% |
| French | 43 | 0.4% |
| German | 2,684 | 23.5% |
| Honduran | 81 | 0.7% |
| Indian (Asian) | 1 | 0.0% |
| Irish | 1,020 | 8.9% |
| Italian | 182 | 1.6% |
| Korean | 14 | 0.1% |
| Mexican | 209 | 1.8% |
| Norwegian | 19 | 0.2% |
| Polish | 73 | 0.6% |
| Puerto Rican | 25 | 0.2% |
| Scotch-Irish | 64 | 0.6% |
| Scottish | 164 | 1.4% |
| South American | 52 | 0.4% |
| Spaniard | 69 | 0.6% |
| Subsaharan African | 23 | 0.2% |
| Swedish | 98 | 0.9% |
| Swiss | 5 | 0.0% |
| Thai | 80 | 0.7% |
| Welsh | 13 | 0.1% | View All 33 Rows |
Immigrants in Greensburg
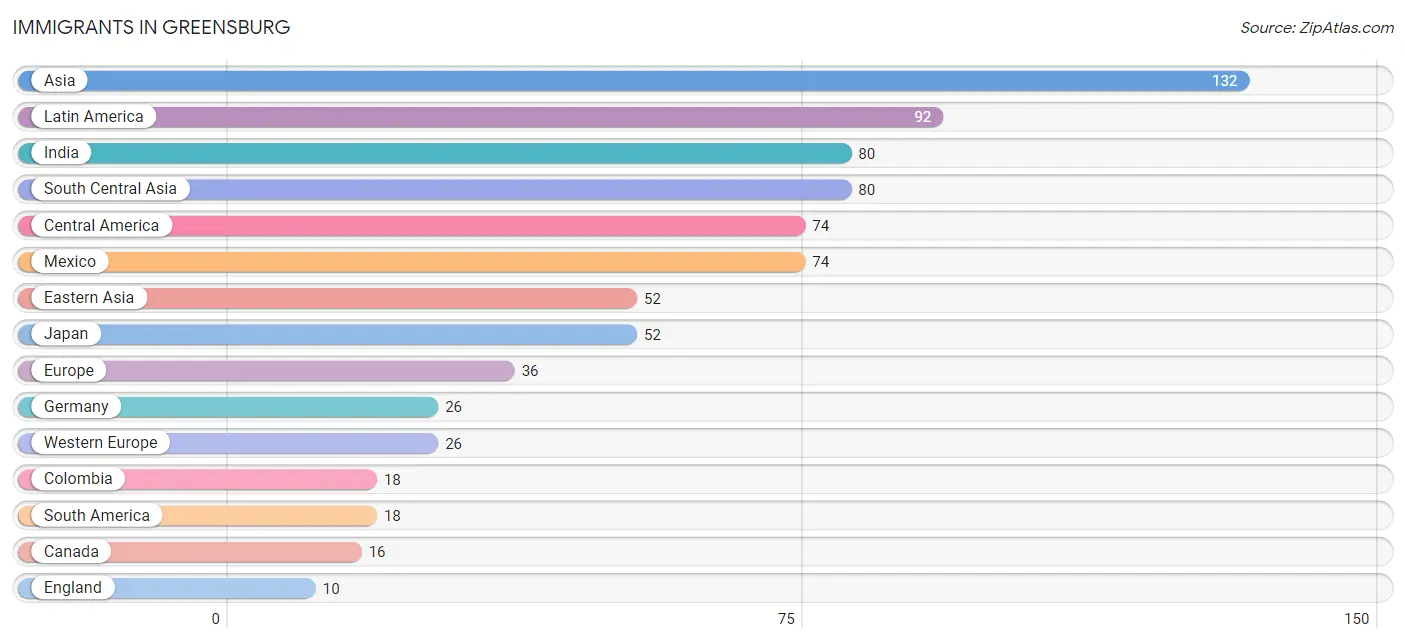
The most numerous immigrant groups reported in Greensburg came from Asia (132 | 1.1%), Latin America (92 | 0.8%), India (80 | 0.7%), South Central Asia (80 | 0.7%), and Central America (74 | 0.6%), together accounting for 4.0% of all Greensburg residents.
| Immigration Origin | # Population | % Population |
| Asia | 132 | 1.1% |
| Canada | 16 | 0.1% |
| Central America | 74 | 0.6% |
| Colombia | 18 | 0.2% |
| Eastern Asia | 52 | 0.4% |
| England | 10 | 0.1% |
| Europe | 36 | 0.3% |
| Germany | 26 | 0.2% |
| India | 80 | 0.7% |
| Japan | 52 | 0.4% |
| Latin America | 92 | 0.8% |
| Mexico | 74 | 0.6% |
| Northern Europe | 10 | 0.1% |
| South America | 18 | 0.2% |
| South Central Asia | 80 | 0.7% |
| Western Europe | 26 | 0.2% | View All 16 Rows |
Sex and Age in Greensburg
Sex and Age in Greensburg
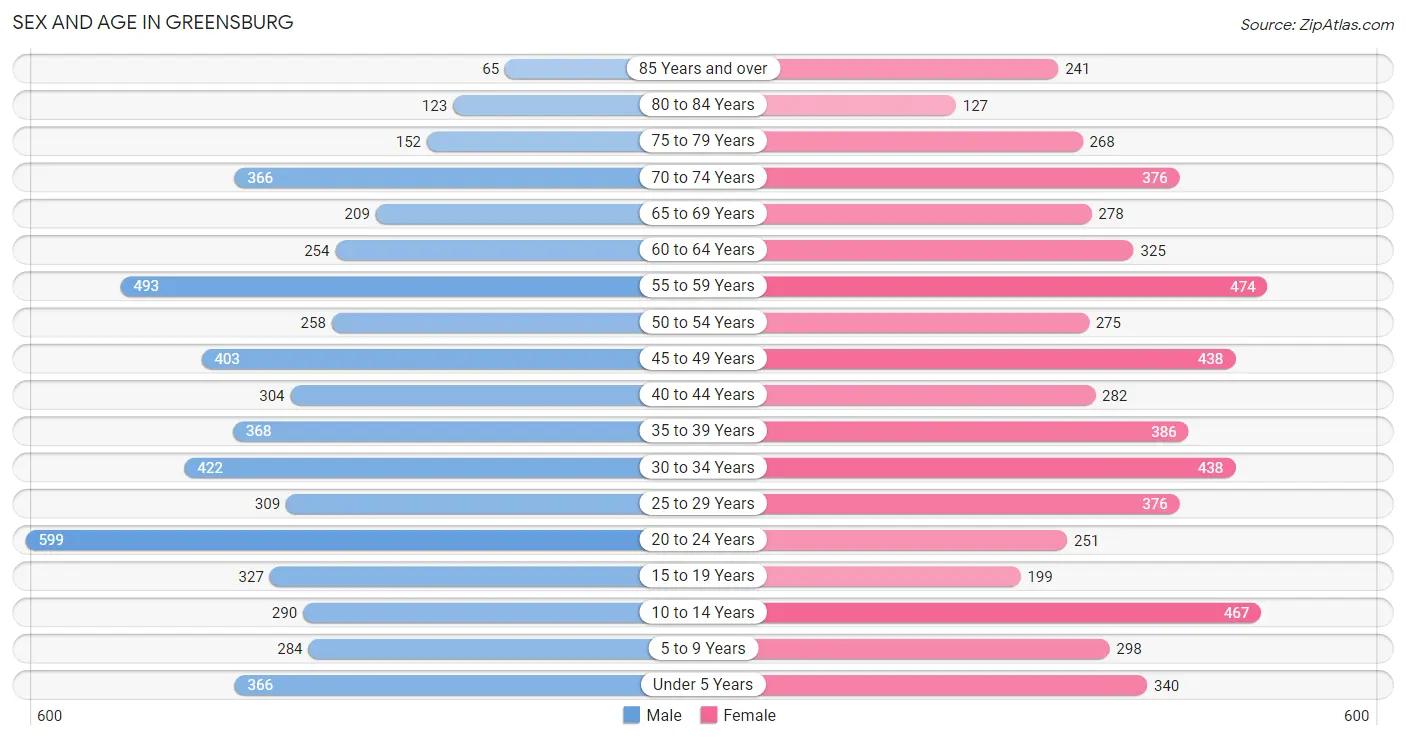
The most populous age groups in Greensburg are 20 to 24 Years (599 | 10.7%) for men and 55 to 59 Years (474 | 8.1%) for women.
| Age Bracket | Male | Female |
| Under 5 Years | 366 (6.6%) | 340 (5.8%) |
| 5 to 9 Years | 284 (5.1%) | 298 (5.1%) |
| 10 to 14 Years | 290 (5.2%) | 467 (8.0%) |
| 15 to 19 Years | 327 (5.9%) | 199 (3.4%) |
| 20 to 24 Years | 599 (10.7%) | 251 (4.3%) |
| 25 to 29 Years | 309 (5.5%) | 376 (6.4%) |
| 30 to 34 Years | 422 (7.5%) | 438 (7.5%) |
| 35 to 39 Years | 368 (6.6%) | 386 (6.6%) |
| 40 to 44 Years | 304 (5.4%) | 282 (4.8%) |
| 45 to 49 Years | 403 (7.2%) | 438 (7.5%) |
| 50 to 54 Years | 258 (4.6%) | 275 (4.7%) |
| 55 to 59 Years | 493 (8.8%) | 474 (8.1%) |
| 60 to 64 Years | 254 (4.5%) | 325 (5.6%) |
| 65 to 69 Years | 209 (3.7%) | 278 (4.8%) |
| 70 to 74 Years | 366 (6.6%) | 376 (6.4%) |
| 75 to 79 Years | 152 (2.7%) | 268 (4.6%) |
| 80 to 84 Years | 123 (2.2%) | 127 (2.2%) |
| 85 Years and over | 65 (1.2%) | 241 (4.1%) |
| Total | 5,592 (100.0%) | 5,839 (100.0%) |
Families and Households in Greensburg
Median Family Size in Greensburg
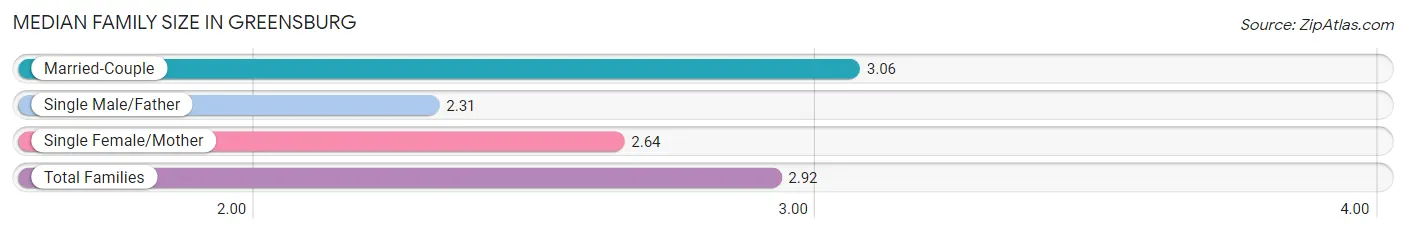
The median family size in Greensburg is 2.92 persons per family, with married-couple families (2,119 | 74.6%) accounting for the largest median family size of 3.06 persons per family. On the other hand, single male/father families (248 | 8.7%) represent the smallest median family size with 2.31 persons per family.
| Family Type | # Families | Family Size |
| Married-Couple | 2,119 (74.6%) | 3.06 |
| Single Male/Father | 248 (8.7%) | 2.31 |
| Single Female/Mother | 475 (16.7%) | 2.64 |
| Total Families | 2,842 (100.0%) | 2.92 |
Median Household Size in Greensburg
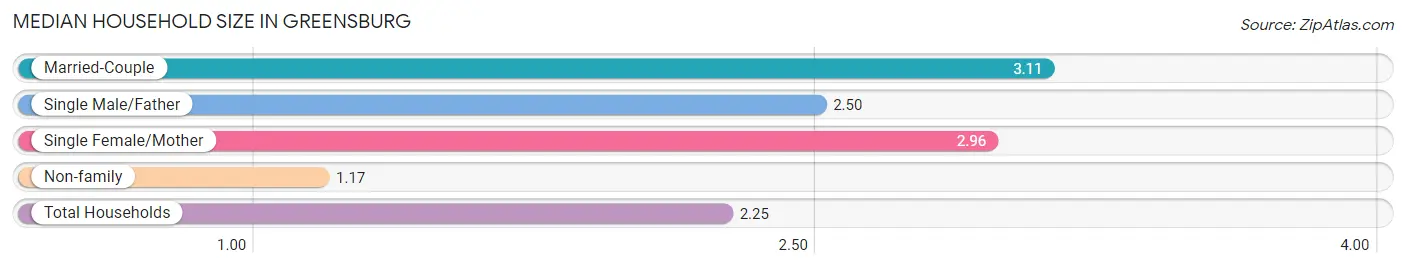
The median household size in Greensburg is 2.25 persons per household, with married-couple households (2,119 | 43.4%) accounting for the largest median household size of 3.11 persons per household. non-family households (2,042 | 41.8%) represent the smallest median household size with 1.17 persons per household.
| Household Type | # Households | Household Size |
| Married-Couple | 2,119 (43.4%) | 3.11 |
| Single Male/Father | 248 (5.1%) | 2.50 |
| Single Female/Mother | 475 (9.7%) | 2.96 |
| Non-family | 2,042 (41.8%) | 1.17 |
| Total Households | 4,884 (100.0%) | 2.25 |
Household Size by Marriage Status in Greensburg
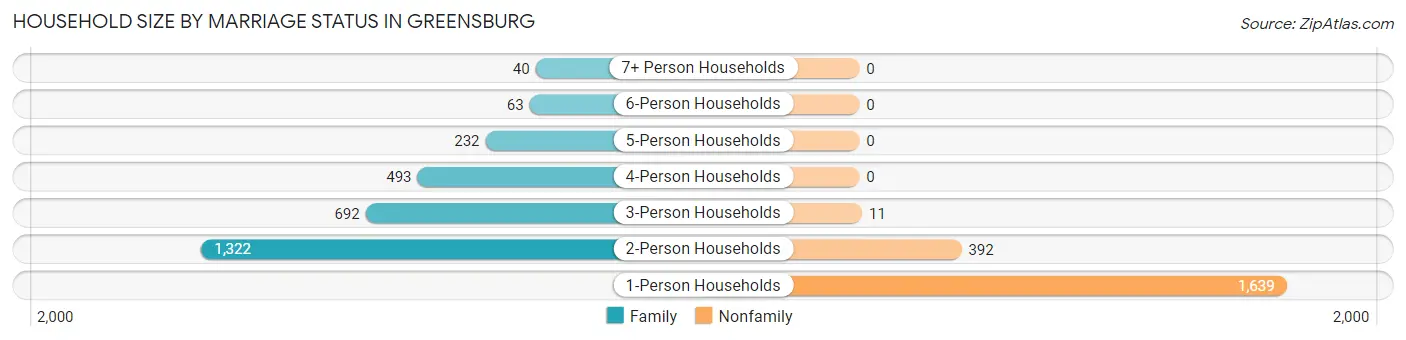
Out of a total of 4,884 households in Greensburg, 2,842 (58.2%) are family households, while 2,042 (41.8%) are nonfamily households. The most numerous type of family households are 2-person households, comprising 1,322, and the most common type of nonfamily households are 1-person households, comprising 1,639.
| Household Size | Family Households | Nonfamily Households |
| 1-Person Households | - | 1,639 (33.6%) |
| 2-Person Households | 1,322 (27.1%) | 392 (8.0%) |
| 3-Person Households | 692 (14.2%) | 11 (0.2%) |
| 4-Person Households | 493 (10.1%) | 0 (0.0%) |
| 5-Person Households | 232 (4.8%) | 0 (0.0%) |
| 6-Person Households | 63 (1.3%) | 0 (0.0%) |
| 7+ Person Households | 40 (0.8%) | 0 (0.0%) |
| Total | 2,842 (58.2%) | 2,042 (41.8%) |
Female Fertility in Greensburg
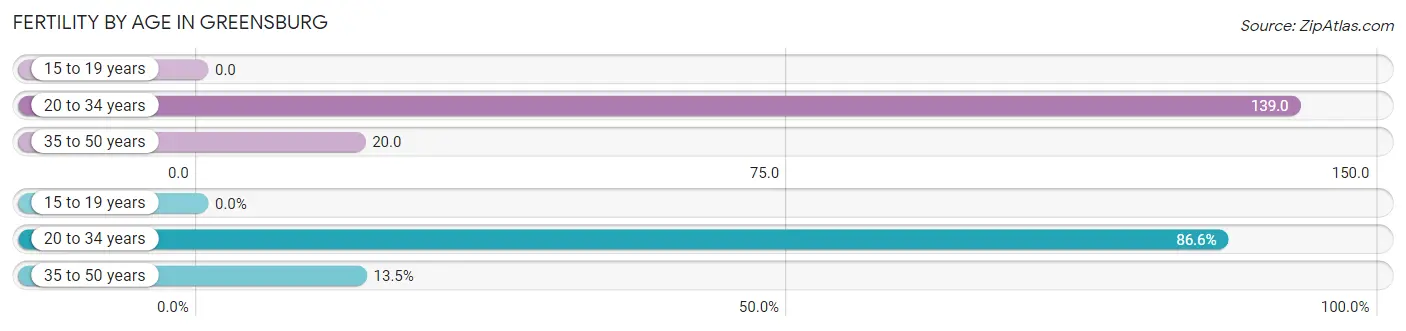
Fertility by Age in Greensburg
Average fertility rate in Greensburg is 70.0 births per 1,000 women. Women in the age bracket of 20 to 34 years have the highest fertility rate with 139.0 births per 1,000 women. Women in the age bracket of 20 to 34 years acount for 86.6% of all women with births.
| Age Bracket | Women with Births | Births / 1,000 Women |
| 15 to 19 years | 0 (0.0%) | 0.0 |
| 20 to 34 years | 148 (86.6%) | 139.0 |
| 35 to 50 years | 23 (13.5%) | 20.0 |
| Total | 171 (100.0%) | 70.0 |
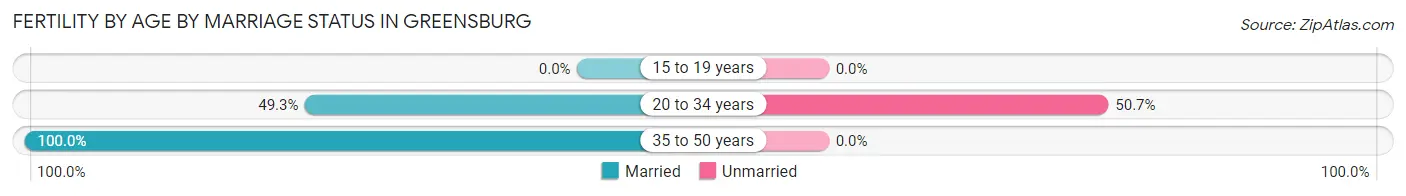
Fertility by Age by Marriage Status in Greensburg
56.1% of women with births (171) in Greensburg are married. The highest percentage of unmarried women with births falls into 20 to 34 years age bracket with 50.7% of them unmarried at the time of birth, while the lowest percentage of unmarried women with births belong to 35 to 50 years age bracket with 0.0% of them unmarried.
| Age Bracket | Married | Unmarried |
| 15 to 19 years | 0 (0.0%) | 0 (0.0%) |
| 20 to 34 years | 73 (49.3%) | 75 (50.7%) |
| 35 to 50 years | 23 (100.0%) | 0 (0.0%) |
| Total | 96 (56.1%) | 75 (43.9%) |
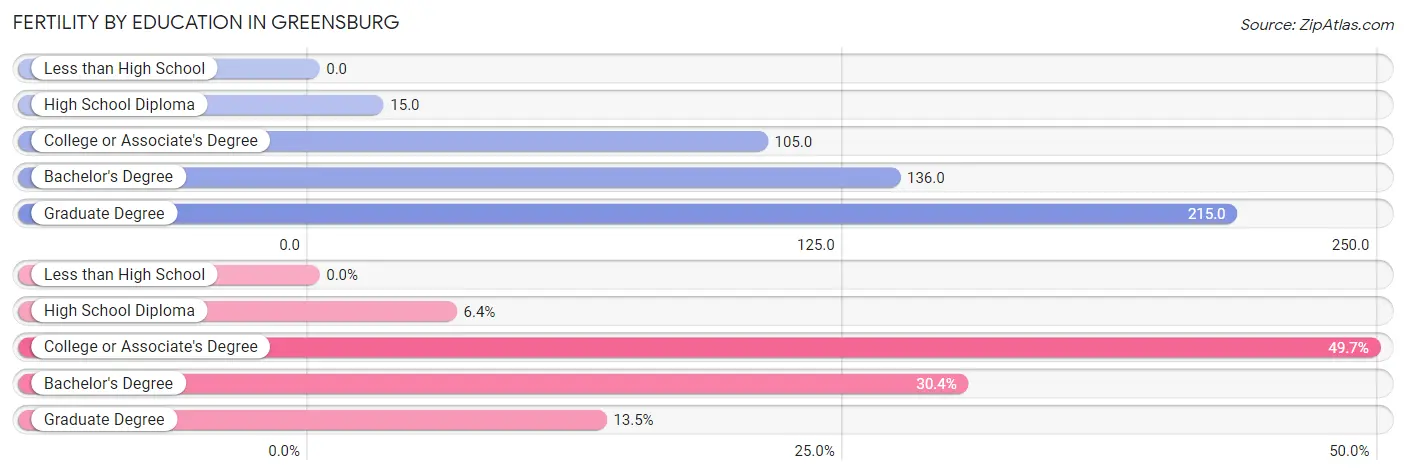
Fertility by Education in Greensburg
| Educational Attainment | Women with Births | Births / 1,000 Women |
| Less than High School | 0 (0.0%) | 0.0 |
| High School Diploma | 11 (6.4%) | 15.0 |
| College or Associate's Degree | 85 (49.7%) | 105.0 |
| Bachelor's Degree | 52 (30.4%) | 136.0 |
| Graduate Degree | 23 (13.5%) | 215.0 |
| Total | 171 (100.0%) | 70.0 |
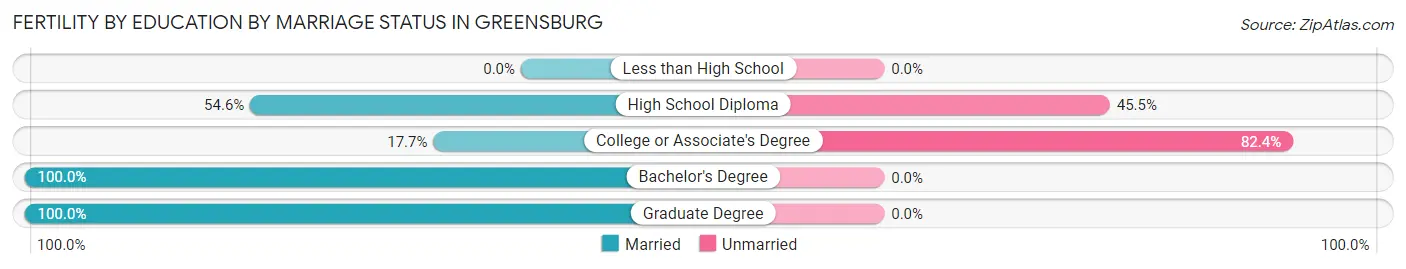
Fertility by Education by Marriage Status in Greensburg
43.9% of women with births in Greensburg are unmarried. Women with the educational attainment of bachelor's degree are most likely to be married with 100.0% of them married at childbirth, while women with the educational attainment of college or associate's degree are least likely to be married with 82.4% of them unmarried at childbirth.
| Educational Attainment | Married | Unmarried |
| Less than High School | 0 (0.0%) | 0 (0.0%) |
| High School Diploma | 6 (54.5%) | 5 (45.5%) |
| College or Associate's Degree | 15 (17.6%) | 70 (82.4%) |
| Bachelor's Degree | 52 (100.0%) | 0 (0.0%) |
| Graduate Degree | 23 (100.0%) | 0 (0.0%) |
| Total | 96 (56.1%) | 75 (43.9%) |
Income in Greensburg
Income Overview in Greensburg
Per Capita Income in Greensburg is $31,666, while median incomes of families and households are $69,808 and $61,864 respectively.
| Characteristic | Number | Measure |
| Per Capita Income | 11,431 | $31,666 |
| Median Family Income | 2,842 | $69,808 |
| Mean Family Income | 2,842 | $87,084 |
| Median Household Income | 4,884 | $61,864 |
| Mean Household Income | 4,884 | $73,036 |
| Income Deficit | 2,842 | $11,310 |
| Wage / Income Gap (%) | 11,431 | 36.55% |
| Wage / Income Gap ($) | 11,431 | 63.45¢ per $1 |
| Gini / Inequality Index | 11,431 | 0.40 |
Earnings by Sex in Greensburg
Average Earnings in Greensburg are $45,393, $53,292 for men and $33,816 for women, a difference of 36.5%.
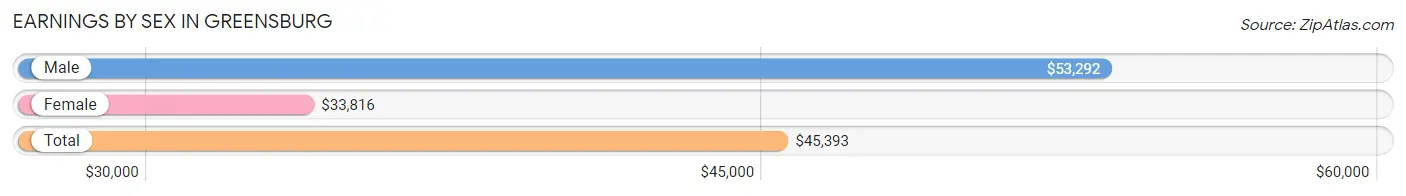
| Sex | Number | Average Earnings |
| Male | 3,309 (54.1%) | $53,292 |
| Female | 2,810 (45.9%) | $33,816 |
| Total | 6,119 (100.0%) | $45,393 |
Earnings by Sex by Income Bracket in Greensburg
The most common earnings brackets in Greensburg are $55,000 to $64,999 for men (614 | 18.6%) and $65,000 to $74,999 for women (372 | 13.2%).
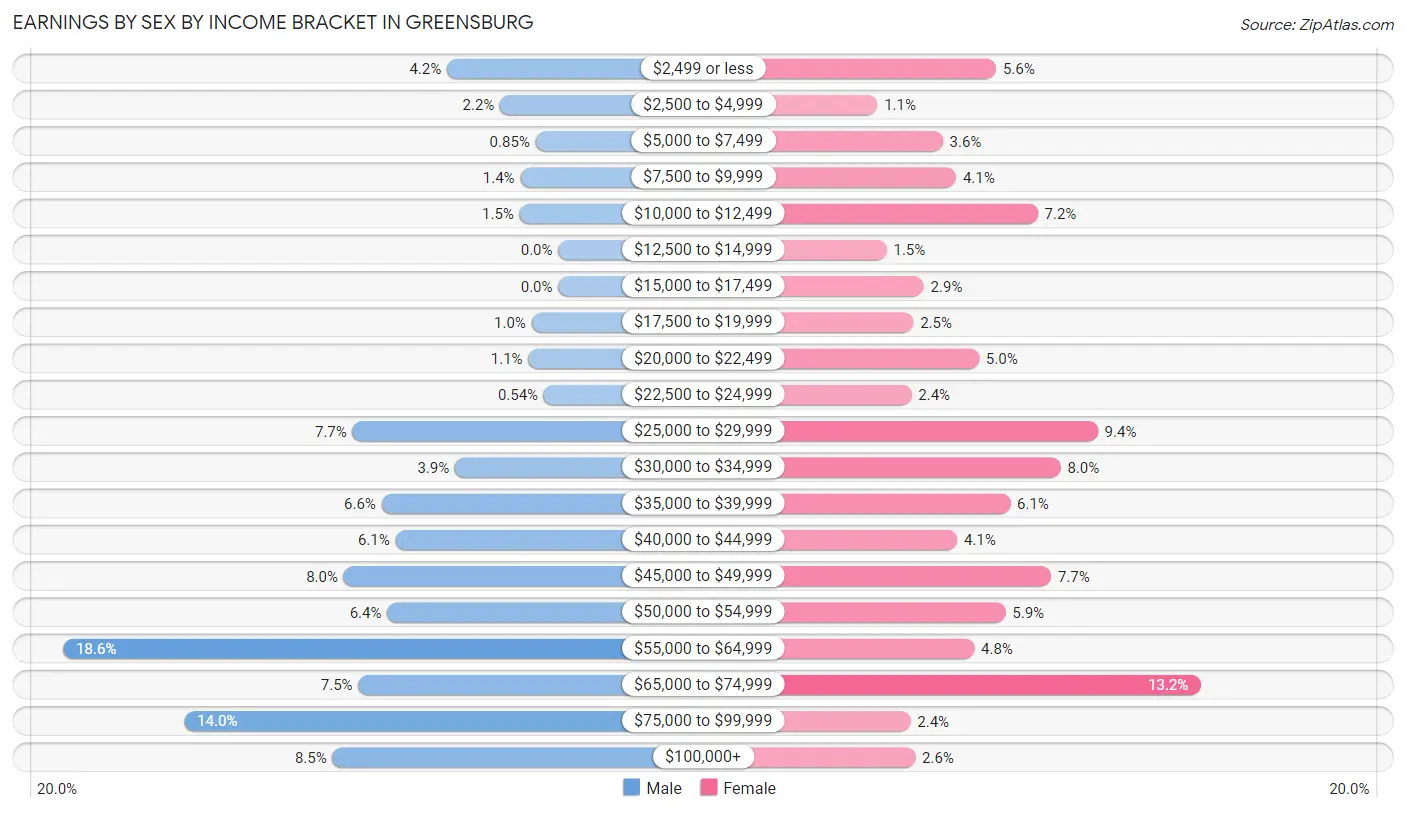
| Income | Male | Female |
| $2,499 or less | 138 (4.2%) | 157 (5.6%) |
| $2,500 to $4,999 | 72 (2.2%) | 32 (1.1%) |
| $5,000 to $7,499 | 28 (0.9%) | 101 (3.6%) |
| $7,500 to $9,999 | 47 (1.4%) | 115 (4.1%) |
| $10,000 to $12,499 | 48 (1.5%) | 201 (7.1%) |
| $12,500 to $14,999 | 0 (0.0%) | 42 (1.5%) |
| $15,000 to $17,499 | 0 (0.0%) | 81 (2.9%) |
| $17,500 to $19,999 | 33 (1.0%) | 70 (2.5%) |
| $20,000 to $22,499 | 37 (1.1%) | 139 (5.0%) |
| $22,500 to $24,999 | 18 (0.5%) | 68 (2.4%) |
| $25,000 to $29,999 | 255 (7.7%) | 264 (9.4%) |
| $30,000 to $34,999 | 128 (3.9%) | 225 (8.0%) |
| $35,000 to $39,999 | 219 (6.6%) | 172 (6.1%) |
| $40,000 to $44,999 | 202 (6.1%) | 116 (4.1%) |
| $45,000 to $49,999 | 266 (8.0%) | 215 (7.6%) |
| $50,000 to $54,999 | 212 (6.4%) | 167 (5.9%) |
| $55,000 to $64,999 | 614 (18.6%) | 134 (4.8%) |
| $65,000 to $74,999 | 248 (7.5%) | 372 (13.2%) |
| $75,000 to $99,999 | 464 (14.0%) | 67 (2.4%) |
| $100,000+ | 280 (8.5%) | 72 (2.6%) |
| Total | 3,309 (100.0%) | 2,810 (100.0%) |
Earnings by Sex by Educational Attainment in Greensburg
Average earnings in Greensburg are $59,694 for men and $36,993 for women, a difference of 38.0%. Men with an educational attainment of graduate degree enjoy the highest average annual earnings of $120,150, while those with less than high school education earn the least with $38,682. Women with an educational attainment of graduate degree earn the most with the average annual earnings of $65,347, while those with less than high school education have the smallest earnings of $10,500.
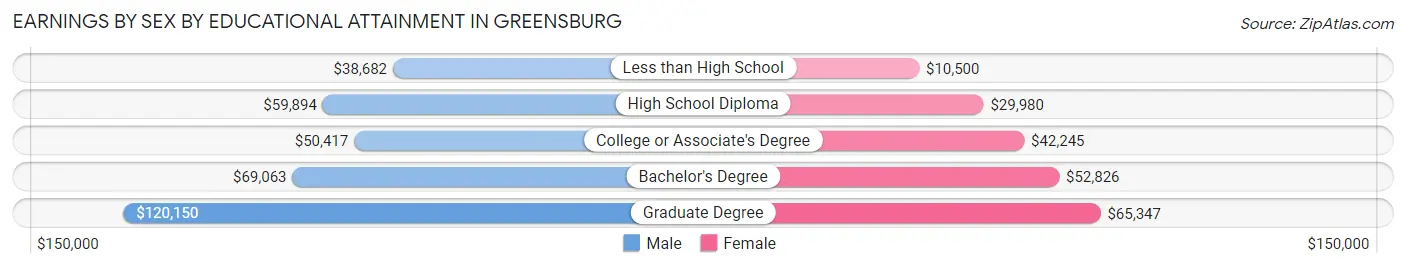
| Educational Attainment | Male Income | Female Income |
| Less than High School | $38,682 | $10,500 |
| High School Diploma | $59,894 | $29,980 |
| College or Associate's Degree | $50,417 | $42,245 |
| Bachelor's Degree | $69,063 | $52,826 |
| Graduate Degree | $120,150 | $65,347 |
| Total | $59,694 | $36,993 |
Family Income in Greensburg
Family Income Brackets in Greensburg
According to the Greensburg family income data, there are 890 families falling into the $50,000 to $74,999 income range, which is the most common income bracket and makes up 31.3% of all families. Conversely, the $10,000 to $14,999 income bracket is the least frequent group with only 65 families (2.3%) belonging to this category.
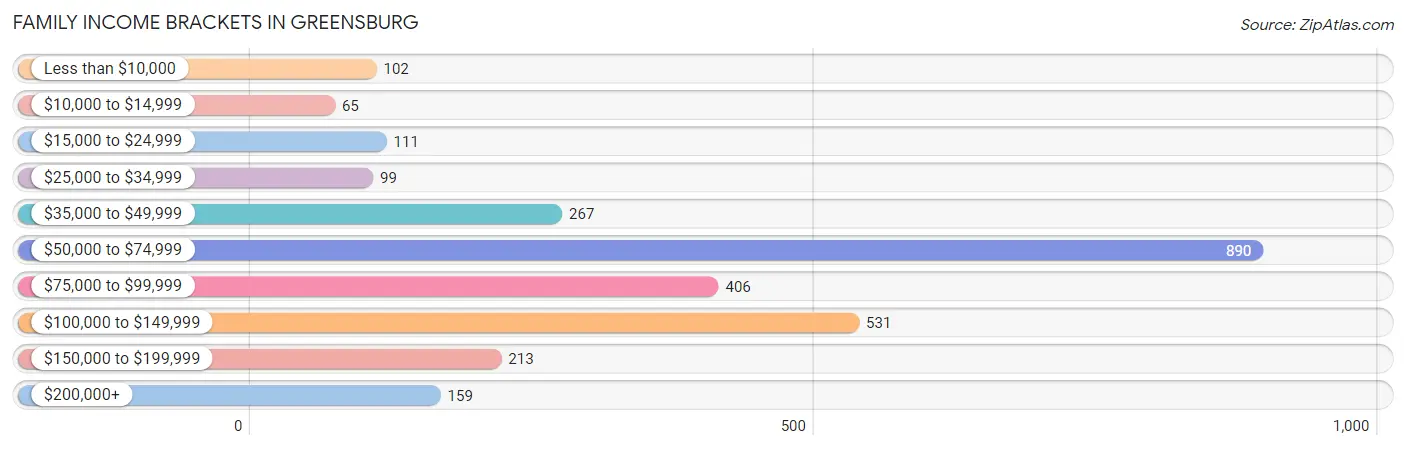
| Income Bracket | # Families | % Families |
| Less than $10,000 | 102 | 3.6% |
| $10,000 to $14,999 | 65 | 2.3% |
| $15,000 to $24,999 | 111 | 3.9% |
| $25,000 to $34,999 | 99 | 3.5% |
| $35,000 to $49,999 | 267 | 9.4% |
| $50,000 to $74,999 | 890 | 31.3% |
| $75,000 to $99,999 | 406 | 14.3% |
| $100,000 to $149,999 | 531 | 18.7% |
| $150,000 to $199,999 | 213 | 7.5% |
| $200,000+ | 159 | 5.6% |
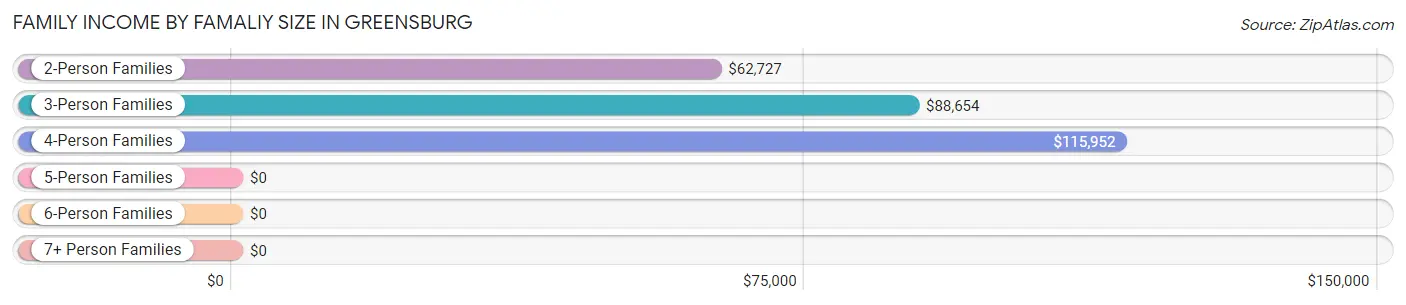
Family Income by Famaliy Size in Greensburg
4-person families (468 | 16.5%) account for the highest median family income in Greensburg with $115,952 per family, while 2-person families (1,422 | 50.0%) have the highest median income of $31,364 per family member.
| Income Bracket | # Families | Median Income |
| 2-Person Families | 1,422 (50.0%) | $62,727 |
| 3-Person Families | 676 (23.8%) | $88,654 |
| 4-Person Families | 468 (16.5%) | $115,952 |
| 5-Person Families | 213 (7.5%) | $0 |
| 6-Person Families | 23 (0.8%) | $0 |
| 7+ Person Families | 40 (1.4%) | $0 |
| Total | 2,842 (100.0%) | $69,808 |
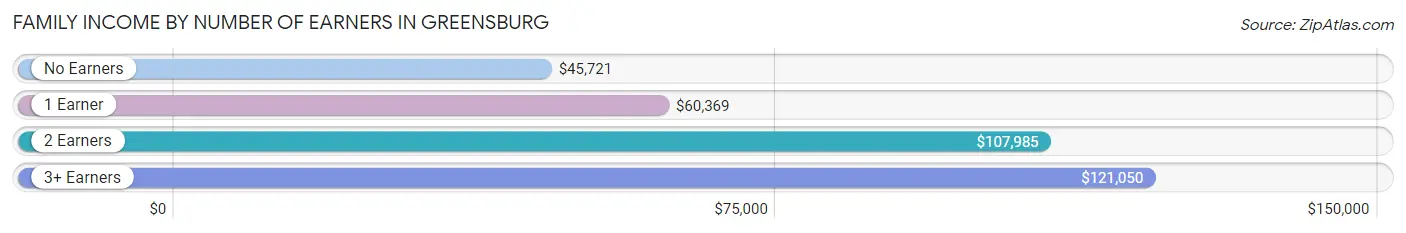
Family Income by Number of Earners in Greensburg
The median family income in Greensburg is $69,808, with families comprising 3+ earners (349) having the highest median family income of $121,050, while families with no earners (409) have the lowest median family income of $45,721, accounting for 12.3% and 14.4% of families, respectively.
| Number of Earners | # Families | Median Income |
| No Earners | 409 (14.4%) | $45,721 |
| 1 Earner | 1,015 (35.7%) | $60,369 |
| 2 Earners | 1,069 (37.6%) | $107,985 |
| 3+ Earners | 349 (12.3%) | $121,050 |
| Total | 2,842 (100.0%) | $69,808 |
Household Income in Greensburg
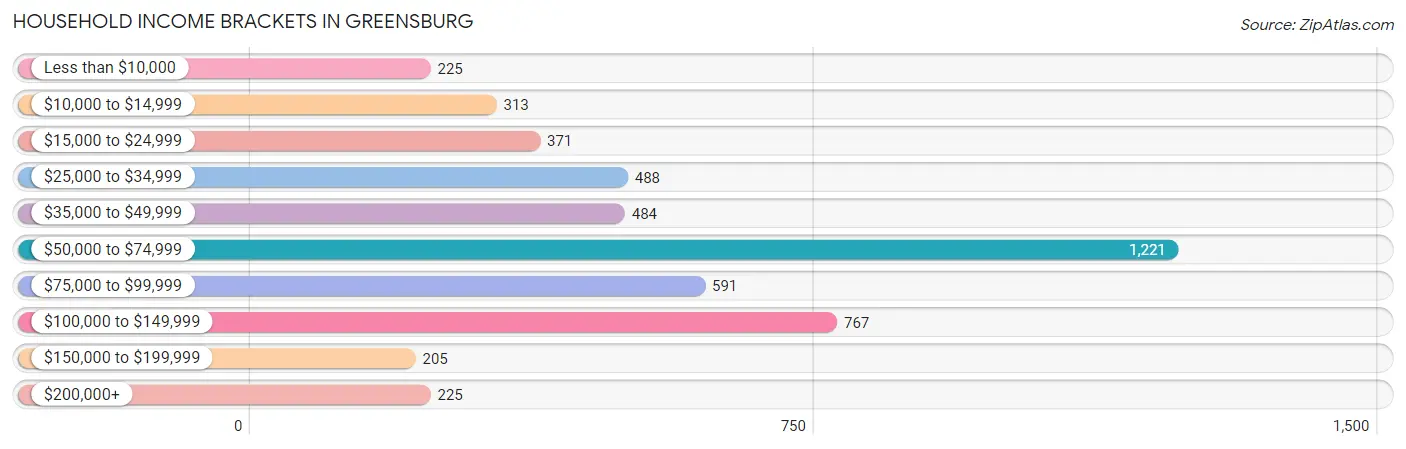
Household Income Brackets in Greensburg
With 1,221 households falling in the category, the $50,000 to $74,999 income range is the most frequent in Greensburg, accounting for 25.0% of all households. In contrast, only 205 households (4.2%) fall into the $150,000 to $199,999 income bracket, making it the least populous group.
| Income Bracket | # Households | % Households |
| Less than $10,000 | 225 | 4.6% |
| $10,000 to $14,999 | 313 | 6.4% |
| $15,000 to $24,999 | 371 | 7.6% |
| $25,000 to $34,999 | 488 | 10.0% |
| $35,000 to $49,999 | 484 | 9.9% |
| $50,000 to $74,999 | 1,221 | 25.0% |
| $75,000 to $99,999 | 591 | 12.1% |
| $100,000 to $149,999 | 767 | 15.7% |
| $150,000 to $199,999 | 205 | 4.2% |
| $200,000+ | 225 | 4.6% |
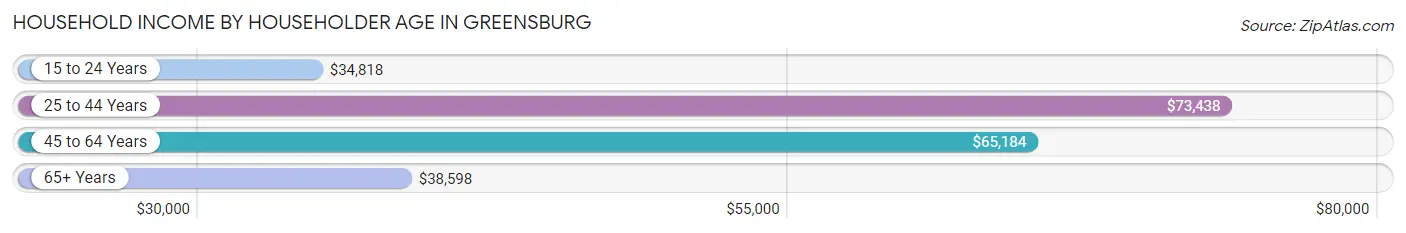
Household Income by Householder Age in Greensburg
The median household income in Greensburg is $61,864, with the highest median household income of $73,438 found in the 25 to 44 years age bracket for the primary householder. A total of 1,441 households (29.5%) fall into this category. Meanwhile, the 15 to 24 years age bracket for the primary householder has the lowest median household income of $34,818, with 343 households (7.0%) in this group.
| Income Bracket | # Households | Median Income |
| 15 to 24 Years | 343 (7.0%) | $34,818 |
| 25 to 44 Years | 1,441 (29.5%) | $73,438 |
| 45 to 64 Years | 1,749 (35.8%) | $65,184 |
| 65+ Years | 1,351 (27.7%) | $38,598 |
| Total | 4,884 (100.0%) | $61,864 |
Poverty in Greensburg
Income Below Poverty by Sex and Age in Greensburg
With 5.8% poverty level for males and 19.9% for females among the residents of Greensburg, 65 to 74 year old males and 6 to 11 year old females are the most vulnerable to poverty, with 113 males (21.2%) and 206 females (51.0%) in their respective age groups living below the poverty level.
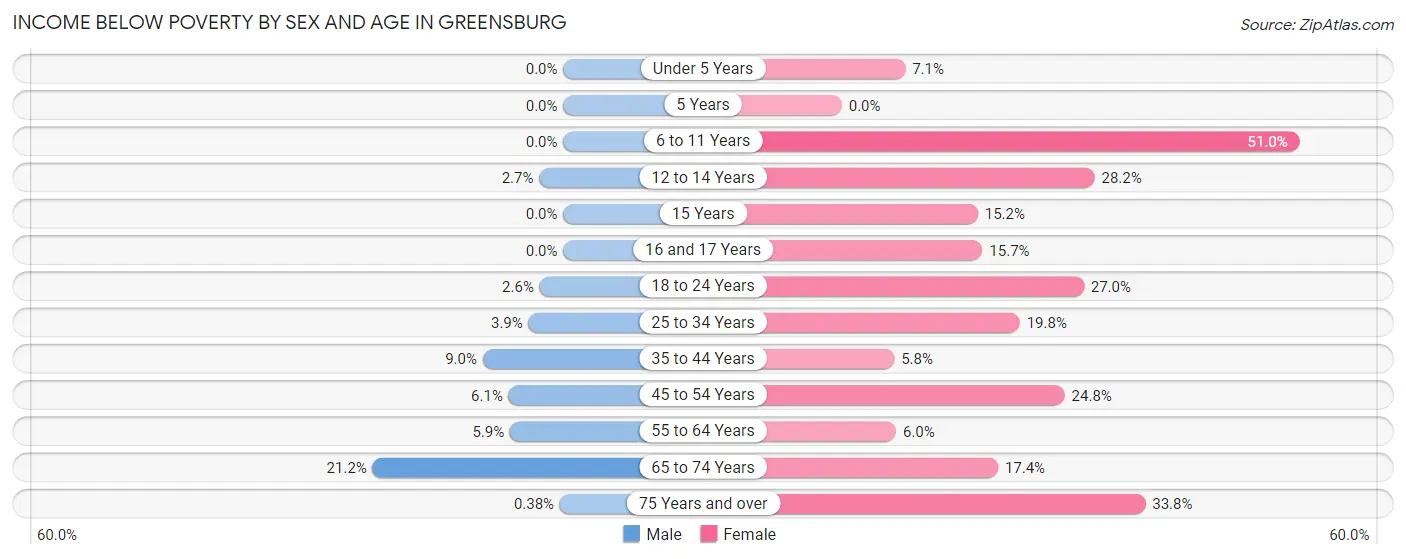
| Age Bracket | Male | Female |
| Under 5 Years | 0 (0.0%) | 24 (7.1%) |
| 5 Years | 0 (0.0%) | 0 (0.0%) |
| 6 to 11 Years | 0 (0.0%) | 206 (51.0%) |
| 12 to 14 Years | 4 (2.7%) | 85 (28.1%) |
| 15 Years | 0 (0.0%) | 5 (15.1%) |
| 16 and 17 Years | 0 (0.0%) | 13 (15.7%) |
| 18 to 24 Years | 20 (2.6%) | 90 (27.0%) |
| 25 to 34 Years | 28 (3.9%) | 157 (19.8%) |
| 35 to 44 Years | 59 (9.0%) | 39 (5.8%) |
| 45 to 54 Years | 39 (6.1%) | 177 (24.8%) |
| 55 to 64 Years | 44 (5.9%) | 48 (6.0%) |
| 65 to 74 Years | 113 (21.2%) | 112 (17.4%) |
| 75 Years and over | 1 (0.4%) | 169 (33.8%) |
| Total | 308 (5.8%) | 1,125 (19.9%) |
Income Above Poverty by Sex and Age in Greensburg
According to the poverty statistics in Greensburg, males aged under 5 years and females aged 5 years are the age groups that are most secure financially, with 100.0% of males and 100.0% of females in these age groups living above the poverty line.
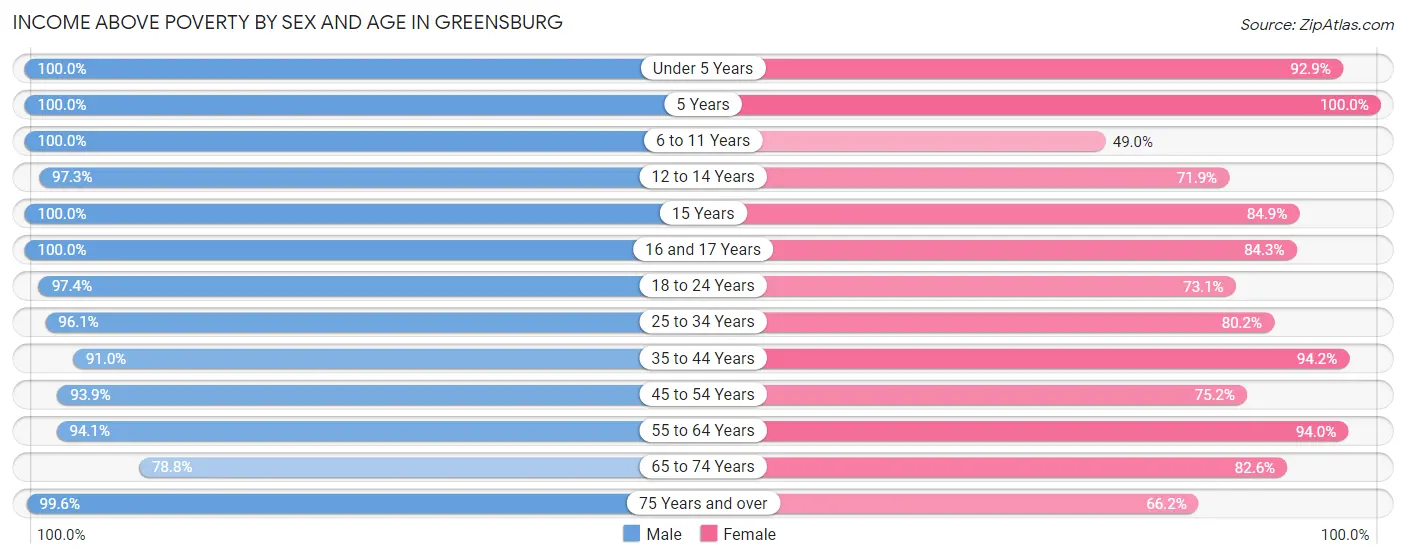
| Age Bracket | Male | Female |
| Under 5 Years | 338 (100.0%) | 316 (92.9%) |
| 5 Years | 47 (100.0%) | 59 (100.0%) |
| 6 to 11 Years | 378 (100.0%) | 198 (49.0%) |
| 12 to 14 Years | 145 (97.3%) | 217 (71.9%) |
| 15 Years | 73 (100.0%) | 28 (84.9%) |
| 16 and 17 Years | 56 (100.0%) | 70 (84.3%) |
| 18 to 24 Years | 741 (97.4%) | 244 (73.1%) |
| 25 to 34 Years | 696 (96.1%) | 635 (80.2%) |
| 35 to 44 Years | 599 (91.0%) | 629 (94.2%) |
| 45 to 54 Years | 602 (93.9%) | 536 (75.2%) |
| 55 to 64 Years | 697 (94.1%) | 747 (94.0%) |
| 65 to 74 Years | 419 (78.8%) | 532 (82.6%) |
| 75 Years and over | 260 (99.6%) | 331 (66.2%) |
| Total | 5,051 (94.3%) | 4,542 (80.1%) |
Income Below Poverty Among Married-Couple Families in Greensburg
The poverty statistics for married-couple families in Greensburg show that 7.5% or 160 of the total 2,119 families live below the poverty line. Families with 3 or 4 children have the highest poverty rate of 27.7%, comprising of 59 families. On the other hand, families with 1 or 2 children have the lowest poverty rate of 0.0%, which includes 0 families.
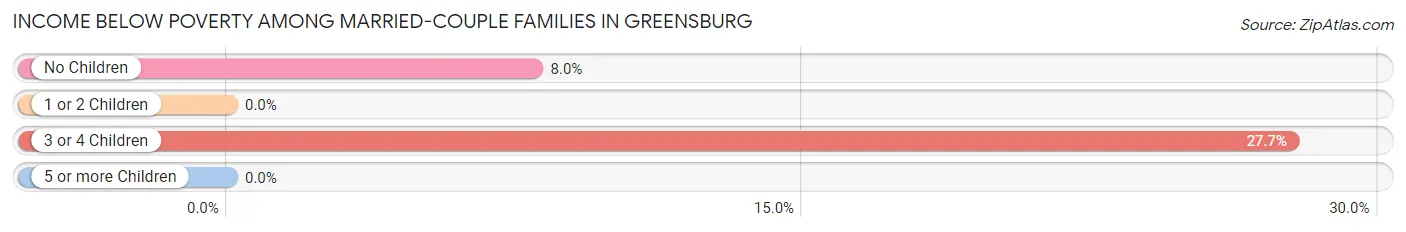
| Children | Above Poverty | Below Poverty |
| No Children | 1,164 (92.0%) | 101 (8.0%) |
| 1 or 2 Children | 641 (100.0%) | 0 (0.0%) |
| 3 or 4 Children | 154 (72.3%) | 59 (27.7%) |
| 5 or more Children | 0 (0.0%) | 0 (0.0%) |
| Total | 1,959 (92.4%) | 160 (7.5%) |
Income Below Poverty Among Single-Parent Households in Greensburg
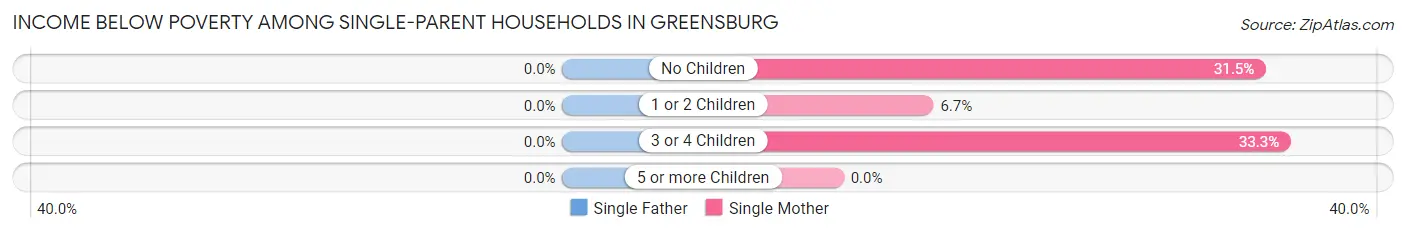
| Children | Single Father | Single Mother |
| No Children | 0 (0.0%) | 62 (31.5%) |
| 1 or 2 Children | 0 (0.0%) | 18 (6.7%) |
| 3 or 4 Children | 0 (0.0%) | 3 (33.3%) |
| 5 or more Children | 0 (0.0%) | 0 (0.0%) |
| Total | 0 (0.0%) | 83 (17.5%) |
Income Below Poverty Among Married-Couple vs Single-Parent Households in Greensburg
The poverty data for Greensburg shows that 160 of the married-couple family households (7.5%) and 83 of the single-parent households (11.5%) are living below the poverty level. Within the married-couple family households, those with 3 or 4 children have the highest poverty rate, with 59 households (27.7%) falling below the poverty line. Among the single-parent households, those with no children have the highest poverty rate, with 62 household (17.0%) living below poverty.
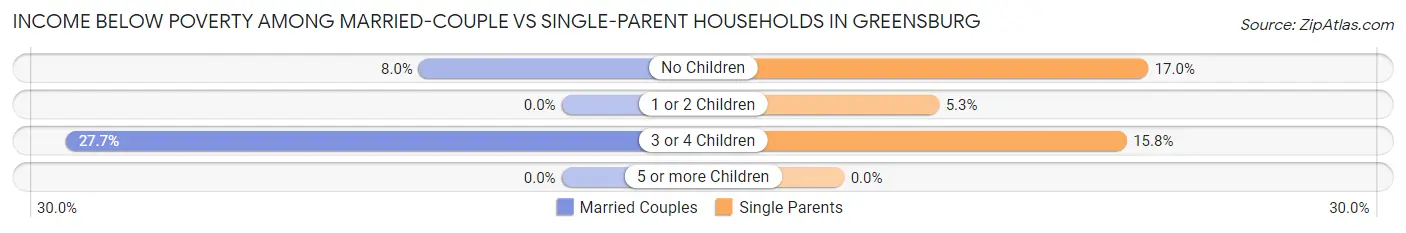
| Children | Married-Couple Families | Single-Parent Households |
| No Children | 101 (8.0%) | 62 (17.0%) |
| 1 or 2 Children | 0 (0.0%) | 18 (5.3%) |
| 3 or 4 Children | 59 (27.7%) | 3 (15.8%) |
| 5 or more Children | 0 (0.0%) | 0 (0.0%) |
| Total | 160 (7.5%) | 83 (11.5%) |
Employment Characteristics in Greensburg
Employment by Class of Employer in Greensburg
Among the 5,705 employed individuals in Greensburg, private company employees (4,386 | 76.9%), not-for-profit organizations (526 | 9.2%), and self-employed (incorporated) (296 | 5.2%) make up the most common classes of employment.
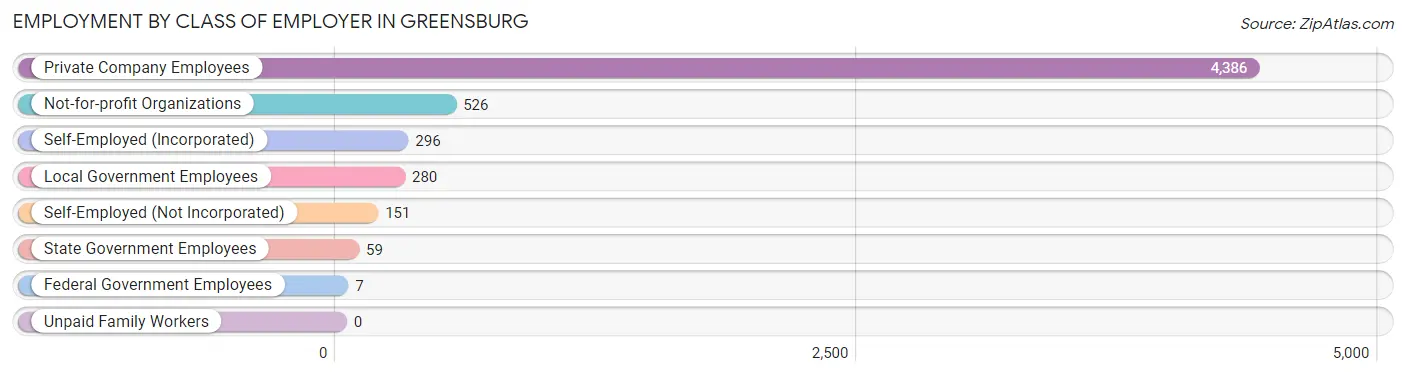
| Employer Class | # Employees | % Employees |
| Private Company Employees | 4,386 | 76.9% |
| Self-Employed (Incorporated) | 296 | 5.2% |
| Self-Employed (Not Incorporated) | 151 | 2.6% |
| Not-for-profit Organizations | 526 | 9.2% |
| Local Government Employees | 280 | 4.9% |
| State Government Employees | 59 | 1.0% |
| Federal Government Employees | 7 | 0.1% |
| Unpaid Family Workers | 0 | 0.0% |
| Total | 5,705 | 100.0% |
Employment Status by Age in Greensburg
According to the labor force statistics for Greensburg, out of the total population over 16 years of age (9,280), 64.8% or 6,013 individuals are in the labor force, with 3.4% or 204 of them unemployed. The age group with the highest labor force participation rate is 20 to 24 years, with 94.9% or 807 individuals in the labor force. Within the labor force, the 16 to 19 years age range has the highest percentage of unemployed individuals, with 47.3% or 125 of them being unemployed.
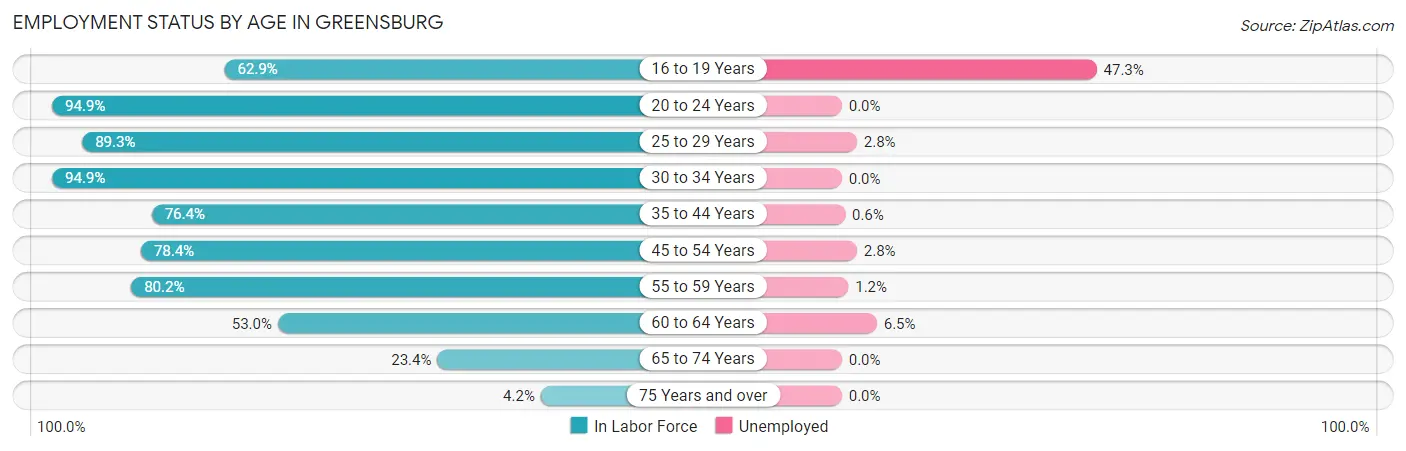
| Age Bracket | In Labor Force | Unemployed |
| 16 to 19 Years | 264 (62.9%) | 125 (47.3%) |
| 20 to 24 Years | 807 (94.9%) | 0 (0.0%) |
| 25 to 29 Years | 612 (89.3%) | 17 (2.8%) |
| 30 to 34 Years | 816 (94.9%) | 0 (0.0%) |
| 35 to 44 Years | 1,024 (76.4%) | 6 (0.6%) |
| 45 to 54 Years | 1,077 (78.4%) | 30 (2.8%) |
| 55 to 59 Years | 776 (80.2%) | 9 (1.2%) |
| 60 to 64 Years | 307 (53.0%) | 20 (6.5%) |
| 65 to 74 Years | 288 (23.4%) | 0 (0.0%) |
| 75 Years and over | 41 (4.2%) | 0 (0.0%) |
| Total | 6,013 (64.8%) | 204 (3.4%) |
Employment Status by Educational Attainment in Greensburg
According to labor force statistics for Greensburg, 79.4% of individuals (4,609) out of the total population between 25 and 64 years of age (5,805) are in the labor force, with 1.8% or 83 of them being unemployed. The group with the highest labor force participation rate are those with the educational attainment of college / associate degree, with 87.9% or 1,544 individuals in the labor force. Within the labor force, individuals with bachelor's degree or higher education have the highest percentage of unemployment, with 3.2% or 36 of them being unemployed.
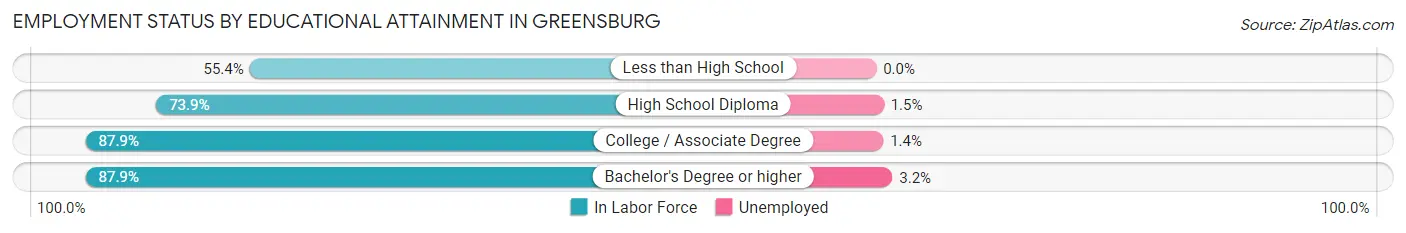
| Educational Attainment | In Labor Force | Unemployed |
| Less than High School | 310 (55.4%) | 0 (0.0%) |
| High School Diploma | 1,624 (73.9%) | 33 (1.5%) |
| College / Associate Degree | 1,544 (87.9%) | 25 (1.4%) |
| Bachelor's Degree or higher | 1,135 (87.9%) | 41 (3.2%) |
| Total | 4,609 (79.4%) | 104 (1.8%) |
Employment Occupations by Sex in Greensburg
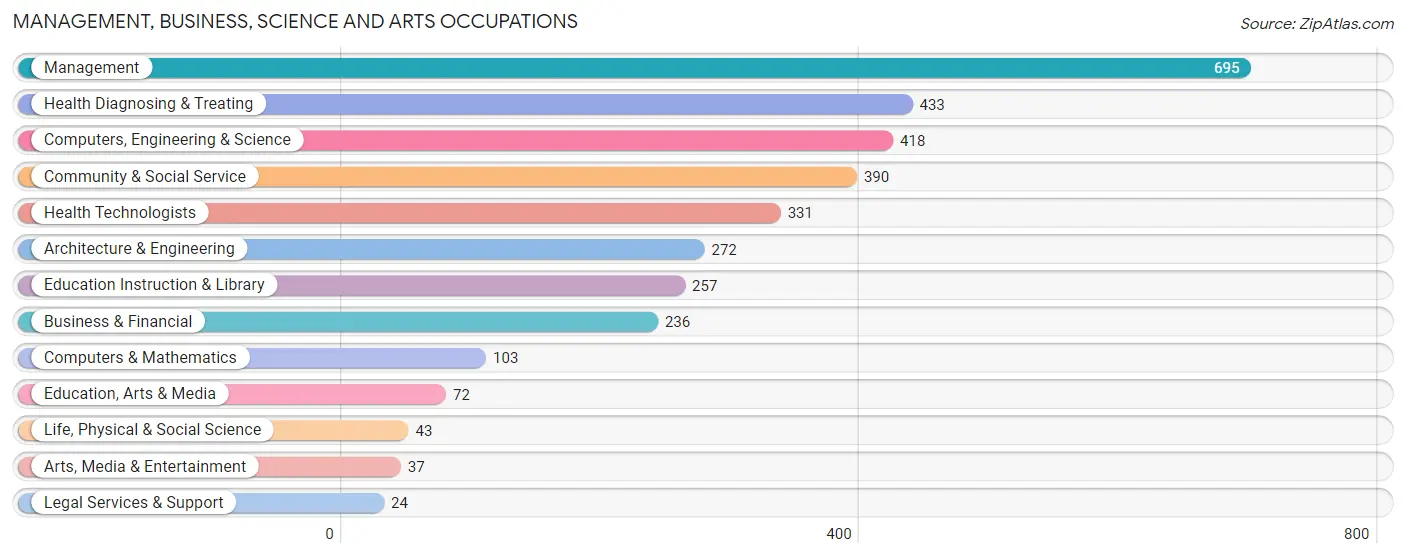
Management, Business, Science and Arts Occupations
The most common Management, Business, Science and Arts occupations in Greensburg are Management (695 | 12.0%), Health Diagnosing & Treating (433 | 7.5%), Computers, Engineering & Science (418 | 7.2%), Community & Social Service (390 | 6.7%), and Health Technologists (331 | 5.7%).
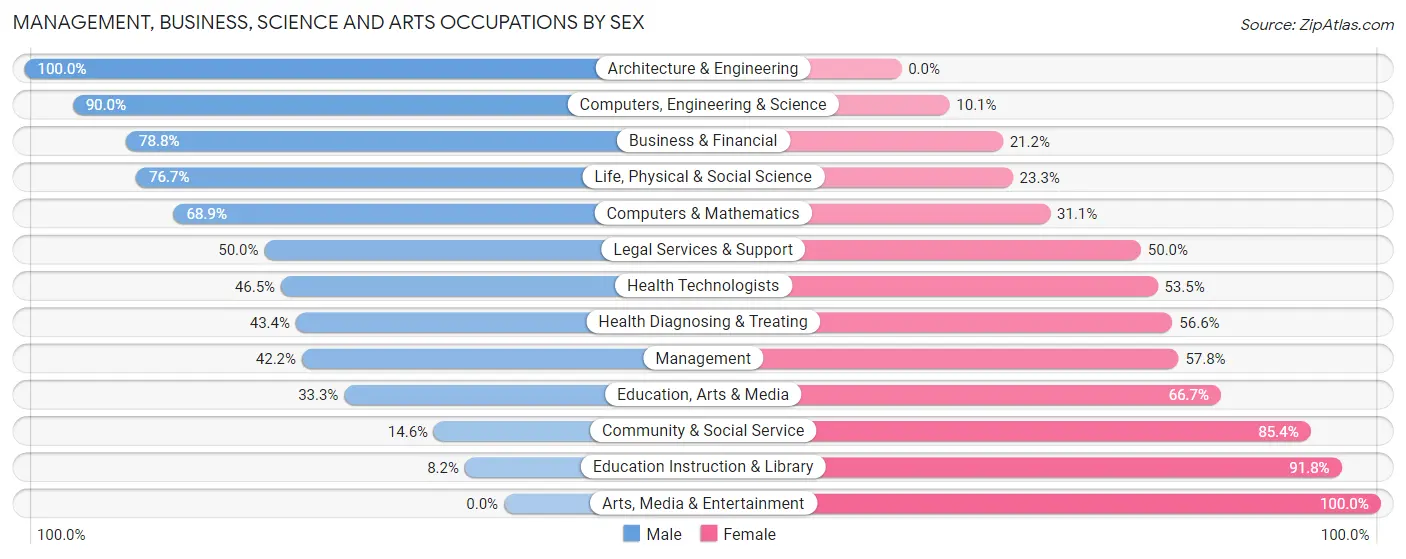
Management, Business, Science and Arts Occupations by Sex
Within the Management, Business, Science and Arts occupations in Greensburg, the most male-oriented occupations are Architecture & Engineering (100.0%), Computers, Engineering & Science (89.9%), and Business & Financial (78.8%), while the most female-oriented occupations are Arts, Media & Entertainment (100.0%), Education Instruction & Library (91.8%), and Community & Social Service (85.4%).
| Occupation | Male | Female |
| Management | 293 (42.2%) | 402 (57.8%) |
| Business & Financial | 186 (78.8%) | 50 (21.2%) |
| Computers, Engineering & Science | 376 (89.9%) | 42 (10.1%) |
| Computers & Mathematics | 71 (68.9%) | 32 (31.1%) |
| Architecture & Engineering | 272 (100.0%) | 0 (0.0%) |
| Life, Physical & Social Science | 33 (76.7%) | 10 (23.3%) |
| Community & Social Service | 57 (14.6%) | 333 (85.4%) |
| Education, Arts & Media | 24 (33.3%) | 48 (66.7%) |
| Legal Services & Support | 12 (50.0%) | 12 (50.0%) |
| Education Instruction & Library | 21 (8.2%) | 236 (91.8%) |
| Arts, Media & Entertainment | 0 (0.0%) | 37 (100.0%) |
| Health Diagnosing & Treating | 188 (43.4%) | 245 (56.6%) |
| Health Technologists | 154 (46.5%) | 177 (53.5%) |
| Total (Category) | 1,100 (50.6%) | 1,072 (49.4%) |
| Total (Overall) | 3,170 (54.6%) | 2,634 (45.4%) |
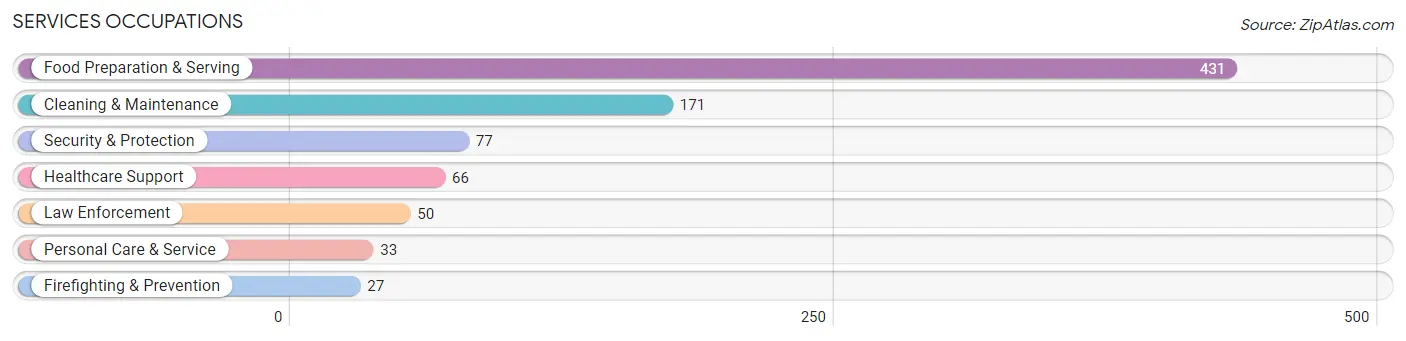
Services Occupations
The most common Services occupations in Greensburg are Food Preparation & Serving (431 | 7.4%), Cleaning & Maintenance (171 | 2.9%), Security & Protection (77 | 1.3%), Healthcare Support (66 | 1.1%), and Law Enforcement (50 | 0.9%).
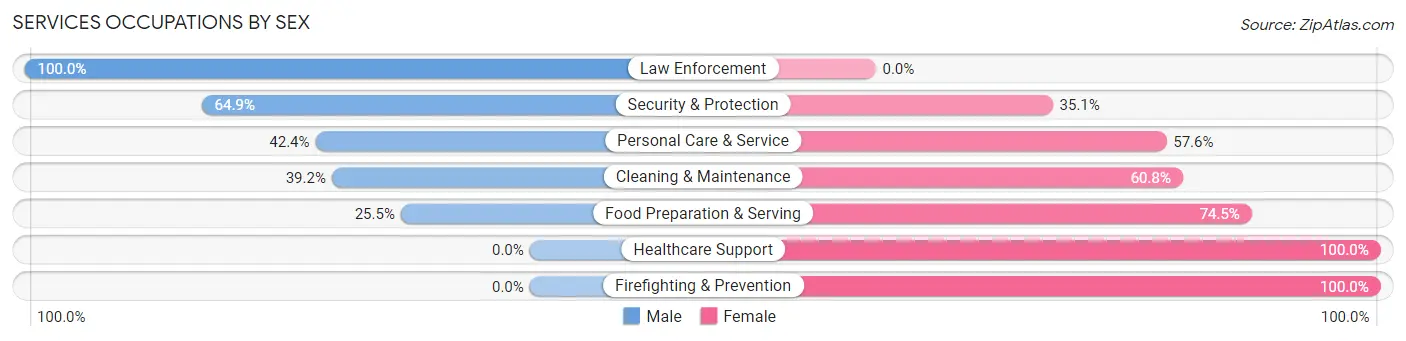
Services Occupations by Sex
Within the Services occupations in Greensburg, the most male-oriented occupations are Law Enforcement (100.0%), Security & Protection (64.9%), and Personal Care & Service (42.4%), while the most female-oriented occupations are Healthcare Support (100.0%), Firefighting & Prevention (100.0%), and Food Preparation & Serving (74.5%).
| Occupation | Male | Female |
| Healthcare Support | 0 (0.0%) | 66 (100.0%) |
| Security & Protection | 50 (64.9%) | 27 (35.1%) |
| Firefighting & Prevention | 0 (0.0%) | 27 (100.0%) |
| Law Enforcement | 50 (100.0%) | 0 (0.0%) |
| Food Preparation & Serving | 110 (25.5%) | 321 (74.5%) |
| Cleaning & Maintenance | 67 (39.2%) | 104 (60.8%) |
| Personal Care & Service | 14 (42.4%) | 19 (57.6%) |
| Total (Category) | 241 (31.0%) | 537 (69.0%) |
| Total (Overall) | 3,170 (54.6%) | 2,634 (45.4%) |
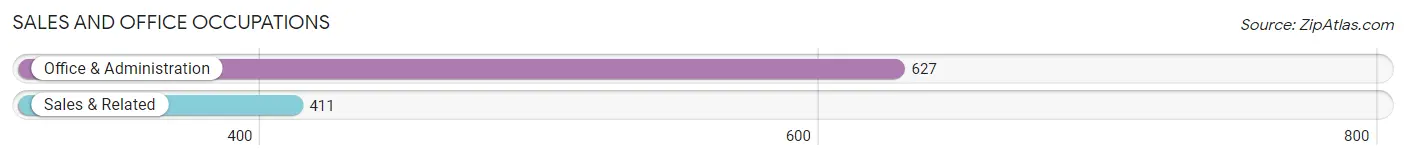
Sales and Office Occupations
The most common Sales and Office occupations in Greensburg are Office & Administration (627 | 10.8%), and Sales & Related (411 | 7.1%).
Sales and Office Occupations by Sex
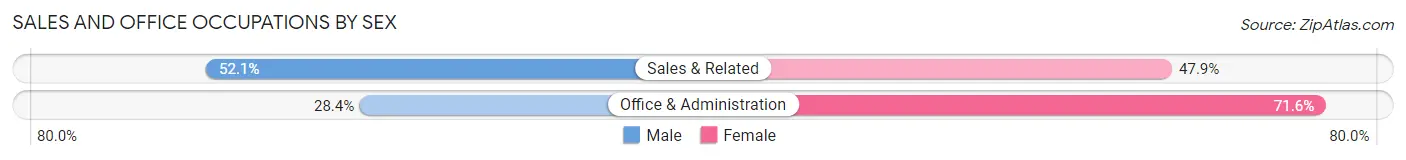
| Occupation | Male | Female |
| Sales & Related | 214 (52.1%) | 197 (47.9%) |
| Office & Administration | 178 (28.4%) | 449 (71.6%) |
| Total (Category) | 392 (37.8%) | 646 (62.2%) |
| Total (Overall) | 3,170 (54.6%) | 2,634 (45.4%) |
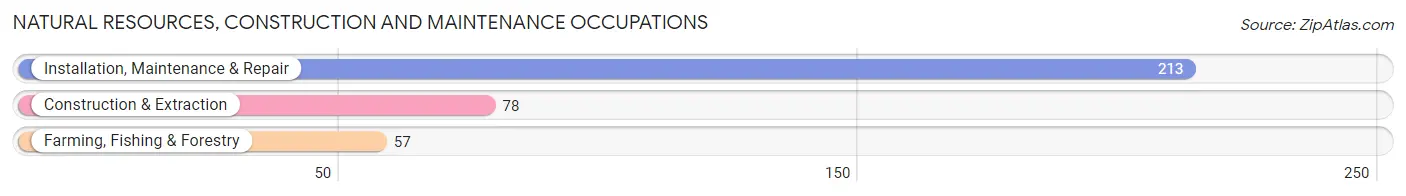
Natural Resources, Construction and Maintenance Occupations
The most common Natural Resources, Construction and Maintenance occupations in Greensburg are Installation, Maintenance & Repair (213 | 3.7%), Construction & Extraction (78 | 1.3%), and Farming, Fishing & Forestry (57 | 1.0%).
Natural Resources, Construction and Maintenance Occupations by Sex
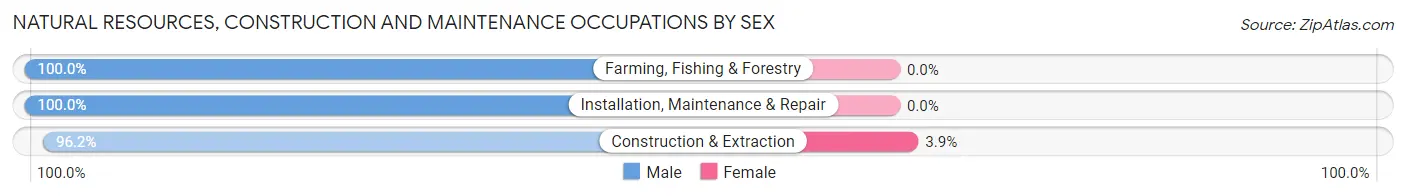
| Occupation | Male | Female |
| Farming, Fishing & Forestry | 57 (100.0%) | 0 (0.0%) |
| Construction & Extraction | 75 (96.2%) | 3 (3.8%) |
| Installation, Maintenance & Repair | 213 (100.0%) | 0 (0.0%) |
| Total (Category) | 345 (99.1%) | 3 (0.9%) |
| Total (Overall) | 3,170 (54.6%) | 2,634 (45.4%) |
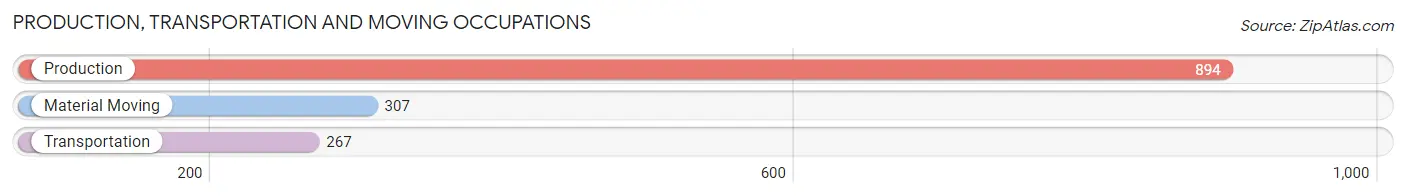
Production, Transportation and Moving Occupations
The most common Production, Transportation and Moving occupations in Greensburg are Production (894 | 15.4%), Material Moving (307 | 5.3%), and Transportation (267 | 4.6%).
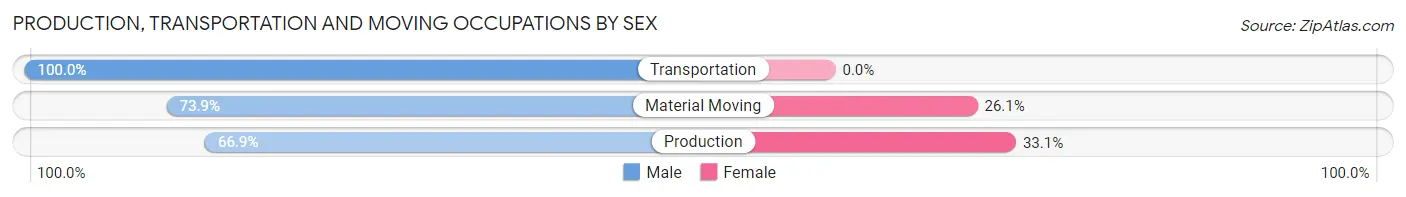
Production, Transportation and Moving Occupations by Sex
| Occupation | Male | Female |
| Production | 598 (66.9%) | 296 (33.1%) |
| Transportation | 267 (100.0%) | 0 (0.0%) |
| Material Moving | 227 (73.9%) | 80 (26.1%) |
| Total (Category) | 1,092 (74.4%) | 376 (25.6%) |
| Total (Overall) | 3,170 (54.6%) | 2,634 (45.4%) |
Employment Industries by Sex in Greensburg
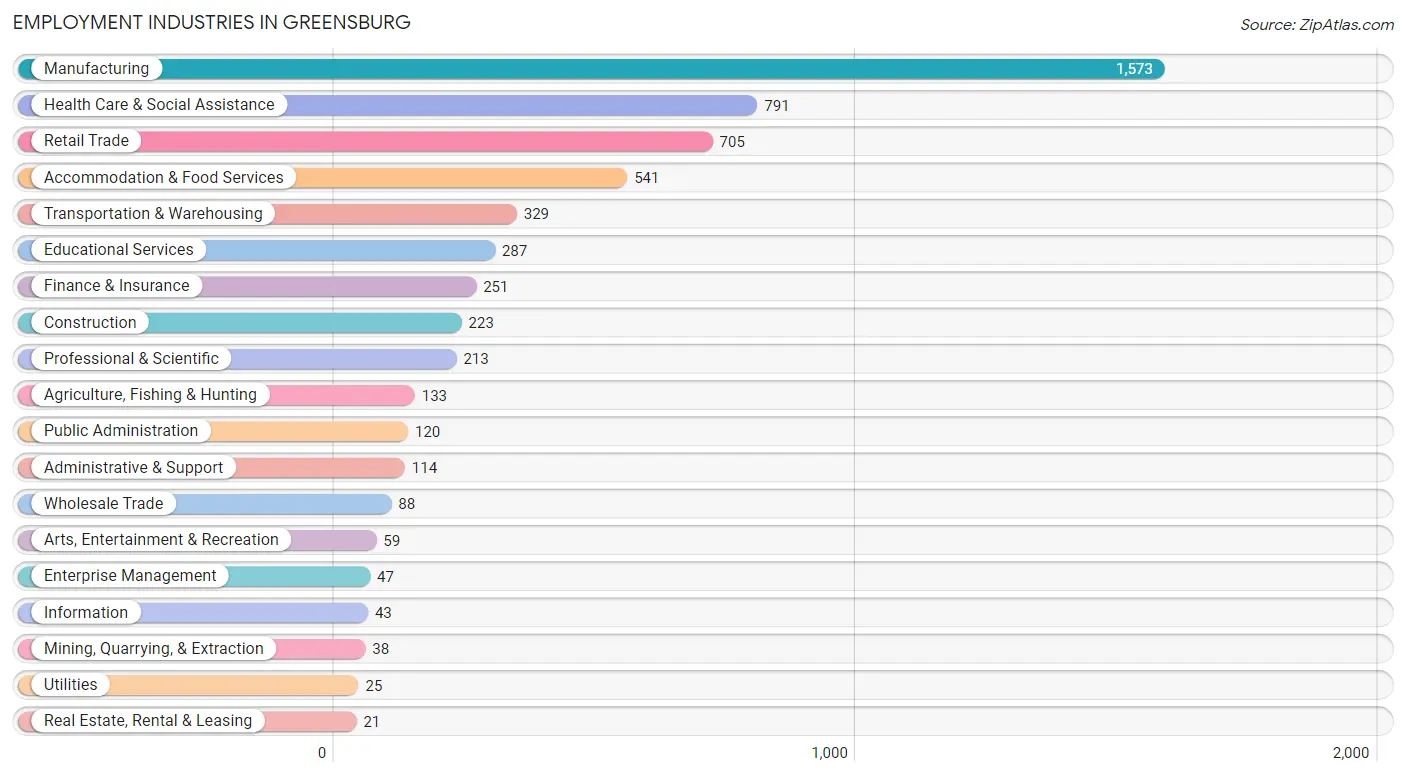
Employment Industries in Greensburg
The major employment industries in Greensburg include Manufacturing (1,573 | 27.1%), Health Care & Social Assistance (791 | 13.6%), Retail Trade (705 | 12.1%), Accommodation & Food Services (541 | 9.3%), and Transportation & Warehousing (329 | 5.7%).
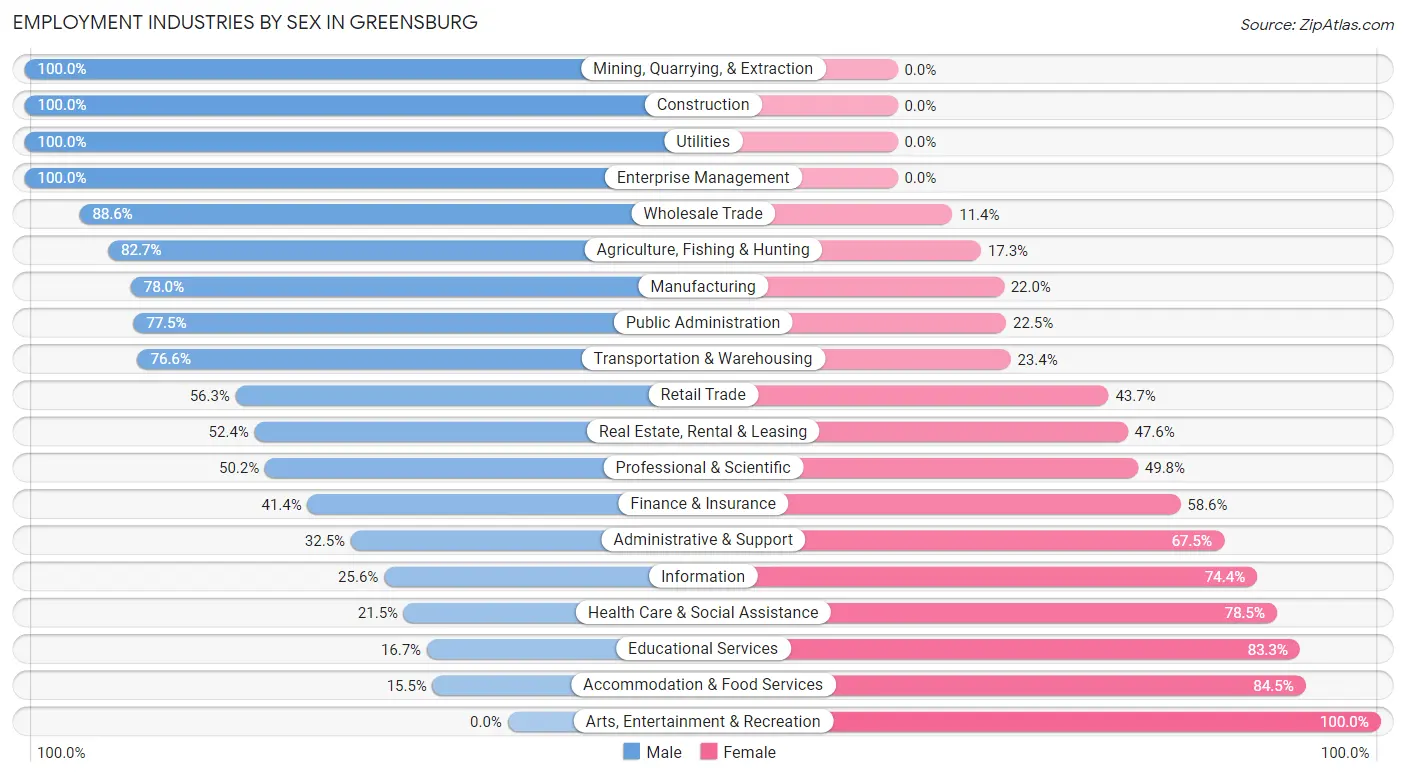
Employment Industries by Sex in Greensburg
The Greensburg industries that see more men than women are Mining, Quarrying, & Extraction (100.0%), Construction (100.0%), and Utilities (100.0%), whereas the industries that tend to have a higher number of women are Arts, Entertainment & Recreation (100.0%), Accommodation & Food Services (84.5%), and Educational Services (83.3%).
| Industry | Male | Female |
| Agriculture, Fishing & Hunting | 110 (82.7%) | 23 (17.3%) |
| Mining, Quarrying, & Extraction | 38 (100.0%) | 0 (0.0%) |
| Construction | 223 (100.0%) | 0 (0.0%) |
| Manufacturing | 1,227 (78.0%) | 346 (22.0%) |
| Wholesale Trade | 78 (88.6%) | 10 (11.4%) |
| Retail Trade | 397 (56.3%) | 308 (43.7%) |
| Transportation & Warehousing | 252 (76.6%) | 77 (23.4%) |
| Utilities | 25 (100.0%) | 0 (0.0%) |
| Information | 11 (25.6%) | 32 (74.4%) |
| Finance & Insurance | 104 (41.4%) | 147 (58.6%) |
| Real Estate, Rental & Leasing | 11 (52.4%) | 10 (47.6%) |
| Professional & Scientific | 107 (50.2%) | 106 (49.8%) |
| Enterprise Management | 47 (100.0%) | 0 (0.0%) |
| Administrative & Support | 37 (32.5%) | 77 (67.5%) |
| Educational Services | 48 (16.7%) | 239 (83.3%) |
| Health Care & Social Assistance | 170 (21.5%) | 621 (78.5%) |
| Arts, Entertainment & Recreation | 0 (0.0%) | 59 (100.0%) |
| Accommodation & Food Services | 84 (15.5%) | 457 (84.5%) |
| Public Administration | 93 (77.5%) | 27 (22.5%) |
| Total | 3,170 (54.6%) | 2,634 (45.4%) |
Education in Greensburg
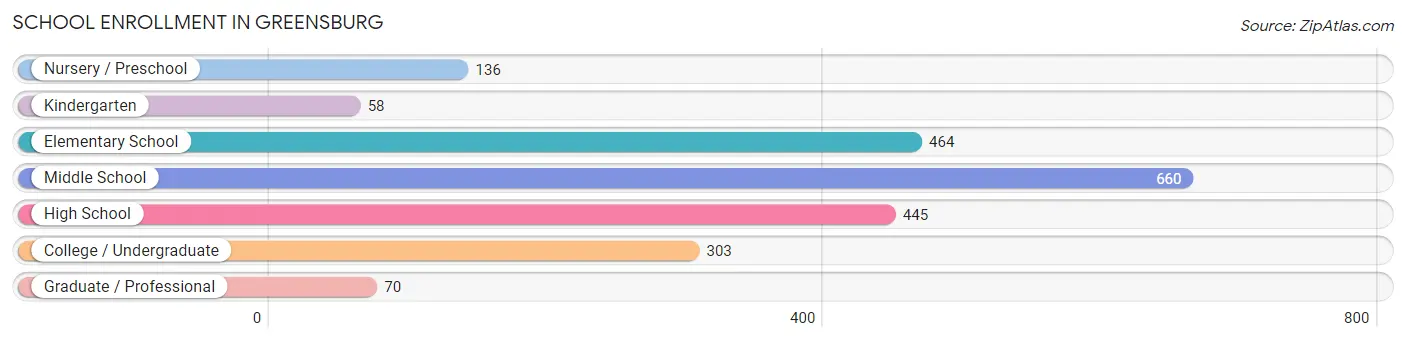
School Enrollment in Greensburg
The most common levels of schooling among the 2,136 students in Greensburg are middle school (660 | 30.9%), elementary school (464 | 21.7%), and high school (445 | 20.8%).
| School Level | # Students | % Students |
| Nursery / Preschool | 136 | 6.4% |
| Kindergarten | 58 | 2.7% |
| Elementary School | 464 | 21.7% |
| Middle School | 660 | 30.9% |
| High School | 445 | 20.8% |
| College / Undergraduate | 303 | 14.2% |
| Graduate / Professional | 70 | 3.3% |
| Total | 2,136 | 100.0% |
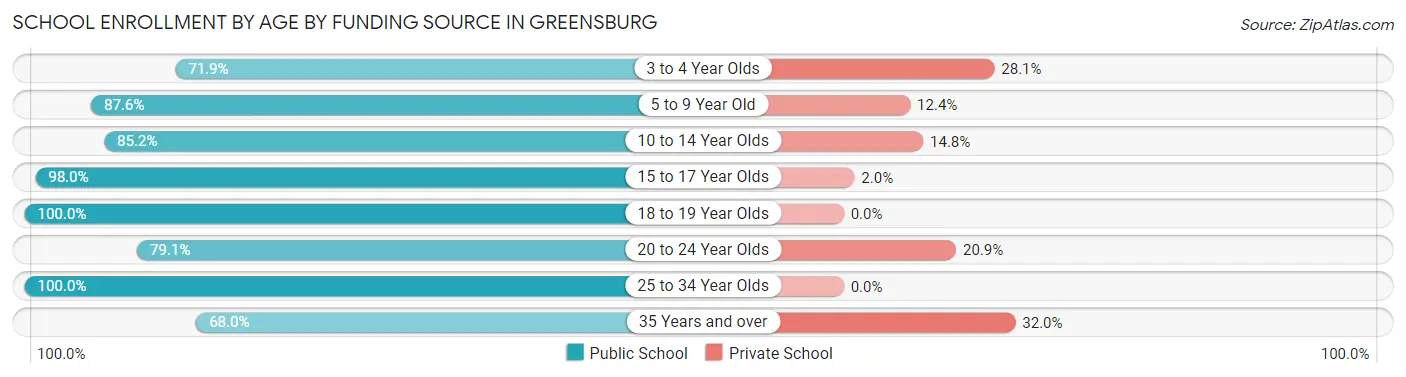
School Enrollment by Age by Funding Source in Greensburg
Out of a total of 2,136 students who are enrolled in schools in Greensburg, 314 (14.7%) attend a private institution, while the remaining 1,822 (85.3%) are enrolled in public schools. The age group of 35 years and over has the highest likelihood of being enrolled in private schools, with 63 (32.0% in the age bracket) enrolled. Conversely, the age group of 18 to 19 year olds has the lowest likelihood of being enrolled in a private school, with 98 (100.0% in the age bracket) attending a public institution.
| Age Bracket | Public School | Private School |
| 3 to 4 Year Olds | 82 (71.9%) | 32 (28.1%) |
| 5 to 9 Year Old | 439 (87.6%) | 62 (12.4%) |
| 10 to 14 Year Olds | 645 (85.2%) | 112 (14.8%) |
| 15 to 17 Year Olds | 245 (98.0%) | 5 (2.0%) |
| 18 to 19 Year Olds | 98 (100.0%) | 0 (0.0%) |
| 20 to 24 Year Olds | 151 (79.1%) | 40 (20.9%) |
| 25 to 34 Year Olds | 28 (100.0%) | 0 (0.0%) |
| 35 Years and over | 134 (68.0%) | 63 (32.0%) |
| Total | 1,822 (85.3%) | 314 (14.7%) |
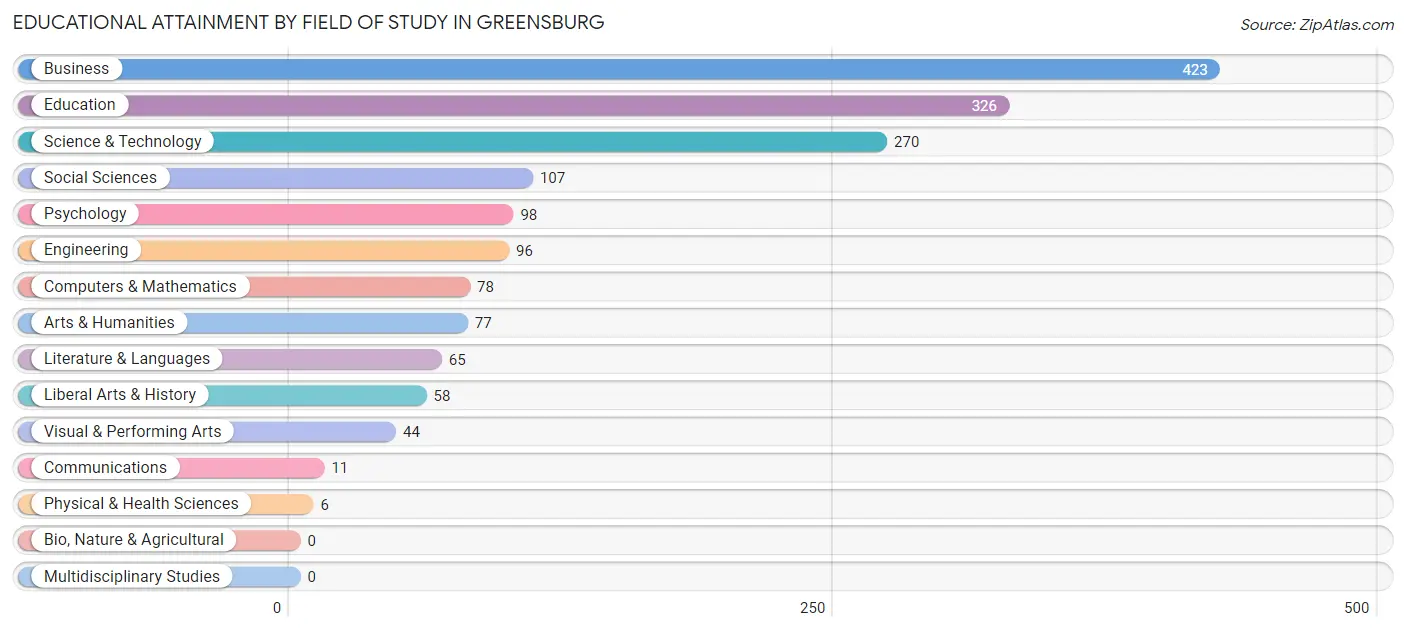
Educational Attainment by Field of Study in Greensburg
Business (423 | 25.5%), education (326 | 19.7%), science & technology (270 | 16.3%), social sciences (107 | 6.5%), and psychology (98 | 5.9%) are the most common fields of study among 1,659 individuals in Greensburg who have obtained a bachelor's degree or higher.
| Field of Study | # Graduates | % Graduates |
| Computers & Mathematics | 78 | 4.7% |
| Bio, Nature & Agricultural | 0 | 0.0% |
| Physical & Health Sciences | 6 | 0.4% |
| Psychology | 98 | 5.9% |
| Social Sciences | 107 | 6.5% |
| Engineering | 96 | 5.8% |
| Multidisciplinary Studies | 0 | 0.0% |
| Science & Technology | 270 | 16.3% |
| Business | 423 | 25.5% |
| Education | 326 | 19.7% |
| Literature & Languages | 65 | 3.9% |
| Liberal Arts & History | 58 | 3.5% |
| Visual & Performing Arts | 44 | 2.6% |
| Communications | 11 | 0.7% |
| Arts & Humanities | 77 | 4.6% |
| Total | 1,659 | 100.0% |
Transportation & Commute in Greensburg
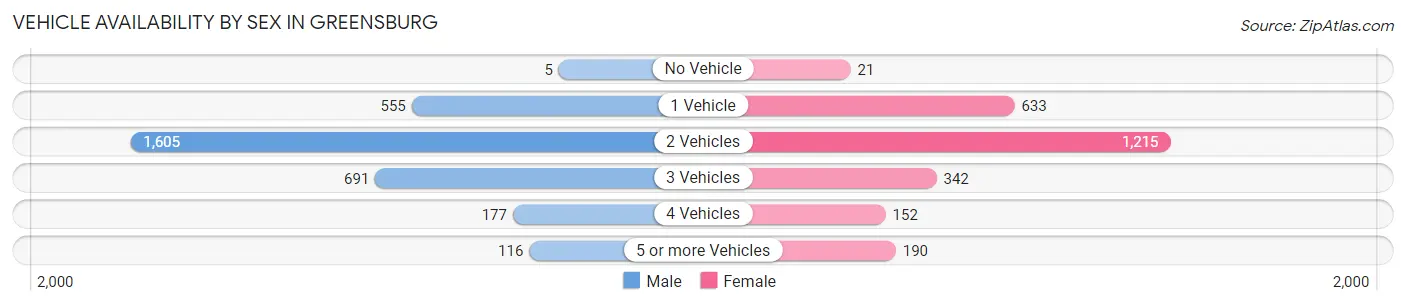
Vehicle Availability by Sex in Greensburg
The most prevalent vehicle ownership categories in Greensburg are males with 2 vehicles (1,605, accounting for 51.0%) and females with 2 vehicles (1,215, making up 62.9%).
| Vehicles Available | Male | Female |
| No Vehicle | 5 (0.2%) | 21 (0.8%) |
| 1 Vehicle | 555 (17.6%) | 633 (24.8%) |
| 2 Vehicles | 1,605 (51.0%) | 1,215 (47.6%) |
| 3 Vehicles | 691 (21.9%) | 342 (13.4%) |
| 4 Vehicles | 177 (5.6%) | 152 (5.9%) |
| 5 or more Vehicles | 116 (3.7%) | 190 (7.4%) |
| Total | 3,149 (100.0%) | 2,553 (100.0%) |
Commute Time in Greensburg
The most frequently occuring commute durations in Greensburg are 5 to 9 minutes (1,484 commuters, 28.6%), 10 to 14 minutes (779 commuters, 15.0%), and 15 to 19 minutes (647 commuters, 12.5%).
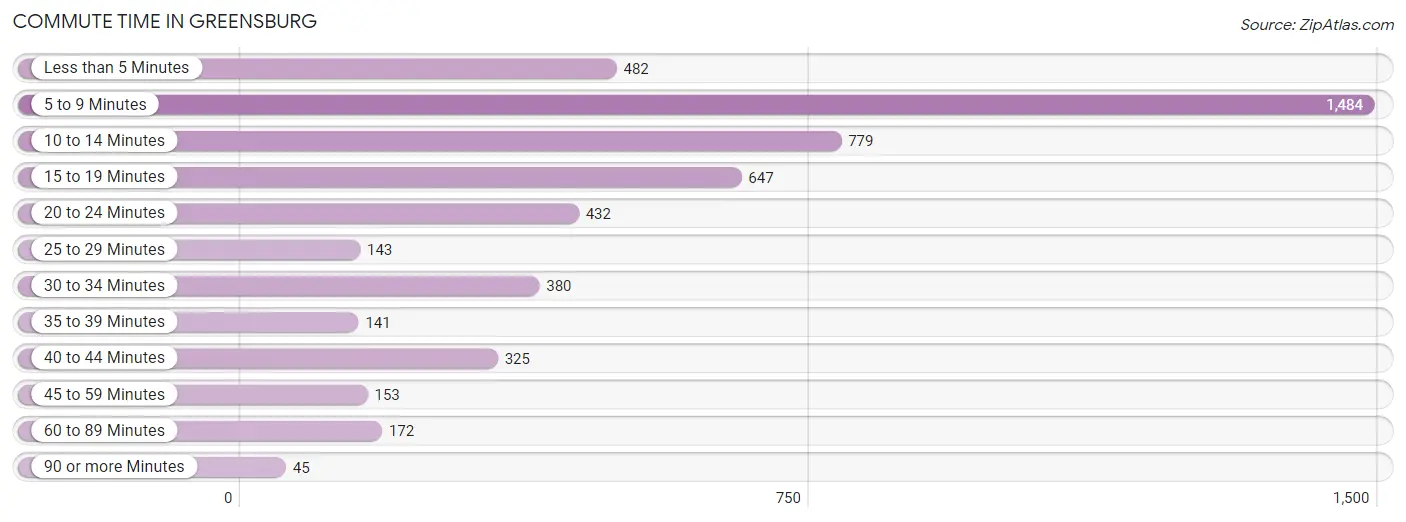
| Commute Time | # Commuters | % Commuters |
| Less than 5 Minutes | 482 | 9.3% |
| 5 to 9 Minutes | 1,484 | 28.6% |
| 10 to 14 Minutes | 779 | 15.0% |
| 15 to 19 Minutes | 647 | 12.5% |
| 20 to 24 Minutes | 432 | 8.3% |
| 25 to 29 Minutes | 143 | 2.8% |
| 30 to 34 Minutes | 380 | 7.3% |
| 35 to 39 Minutes | 141 | 2.7% |
| 40 to 44 Minutes | 325 | 6.3% |
| 45 to 59 Minutes | 153 | 2.9% |
| 60 to 89 Minutes | 172 | 3.3% |
| 90 or more Minutes | 45 | 0.9% |
Commute Time by Sex in Greensburg
The most common commute times in Greensburg are 5 to 9 minutes (914 commuters, 30.9%) for males and 5 to 9 minutes (570 commuters, 25.6%) for females.
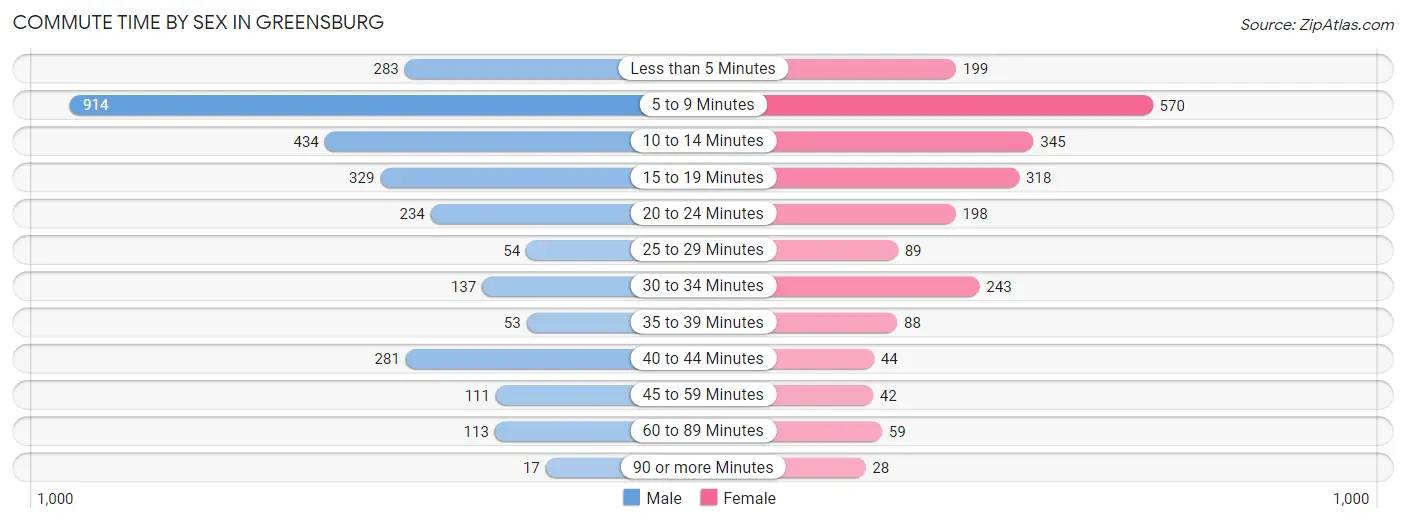
| Commute Time | Male | Female |
| Less than 5 Minutes | 283 (9.6%) | 199 (8.9%) |
| 5 to 9 Minutes | 914 (30.9%) | 570 (25.6%) |
| 10 to 14 Minutes | 434 (14.7%) | 345 (15.5%) |
| 15 to 19 Minutes | 329 (11.1%) | 318 (14.3%) |
| 20 to 24 Minutes | 234 (7.9%) | 198 (8.9%) |
| 25 to 29 Minutes | 54 (1.8%) | 89 (4.0%) |
| 30 to 34 Minutes | 137 (4.6%) | 243 (10.9%) |
| 35 to 39 Minutes | 53 (1.8%) | 88 (4.0%) |
| 40 to 44 Minutes | 281 (9.5%) | 44 (2.0%) |
| 45 to 59 Minutes | 111 (3.7%) | 42 (1.9%) |
| 60 to 89 Minutes | 113 (3.8%) | 59 (2.6%) |
| 90 or more Minutes | 17 (0.6%) | 28 (1.3%) |
Time of Departure to Work by Sex in Greensburg
The most frequent times of departure to work in Greensburg are 7:30 AM to 7:59 AM (480, 16.2%) for males and 12:00 PM to 3:59 PM (332, 14.9%) for females.
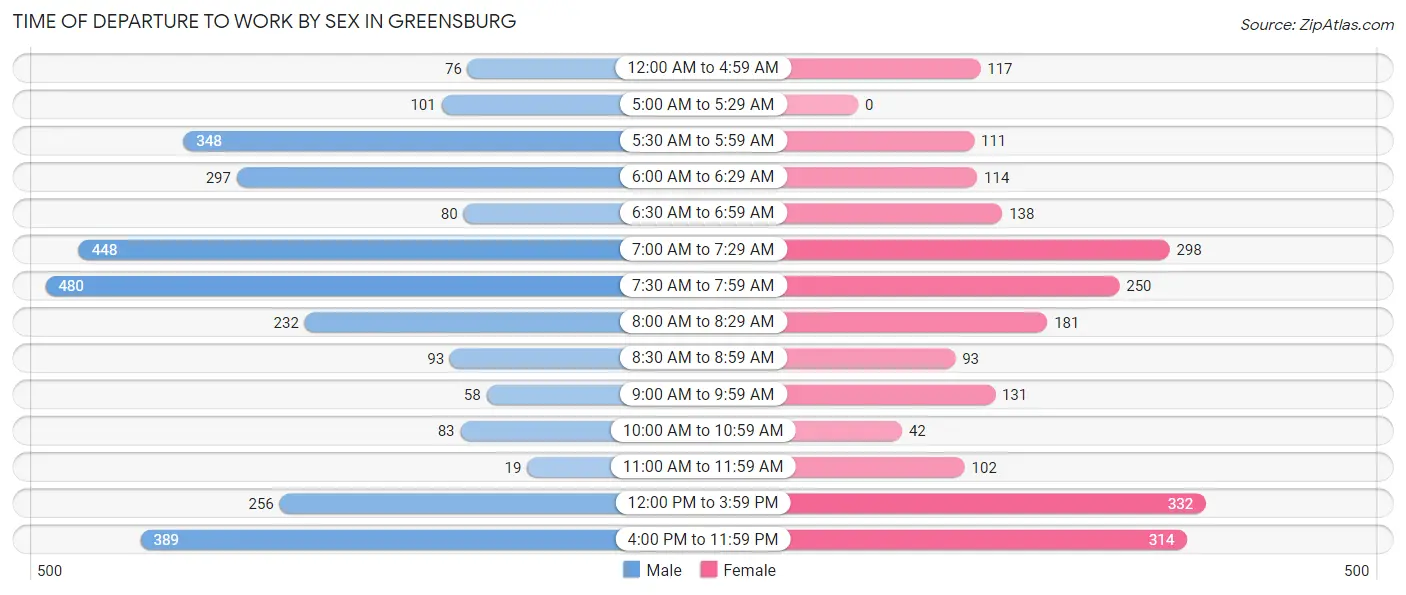
| Time of Departure | Male | Female |
| 12:00 AM to 4:59 AM | 76 (2.6%) | 117 (5.3%) |
| 5:00 AM to 5:29 AM | 101 (3.4%) | 0 (0.0%) |
| 5:30 AM to 5:59 AM | 348 (11.8%) | 111 (5.0%) |
| 6:00 AM to 6:29 AM | 297 (10.0%) | 114 (5.1%) |
| 6:30 AM to 6:59 AM | 80 (2.7%) | 138 (6.2%) |
| 7:00 AM to 7:29 AM | 448 (15.1%) | 298 (13.4%) |
| 7:30 AM to 7:59 AM | 480 (16.2%) | 250 (11.3%) |
| 8:00 AM to 8:29 AM | 232 (7.8%) | 181 (8.1%) |
| 8:30 AM to 8:59 AM | 93 (3.1%) | 93 (4.2%) |
| 9:00 AM to 9:59 AM | 58 (2.0%) | 131 (5.9%) |
| 10:00 AM to 10:59 AM | 83 (2.8%) | 42 (1.9%) |
| 11:00 AM to 11:59 AM | 19 (0.6%) | 102 (4.6%) |
| 12:00 PM to 3:59 PM | 256 (8.6%) | 332 (14.9%) |
| 4:00 PM to 11:59 PM | 389 (13.1%) | 314 (14.1%) |
| Total | 2,960 (100.0%) | 2,223 (100.0%) |
Housing Occupancy in Greensburg
Occupancy by Ownership in Greensburg
Of the total 4,884 dwellings in Greensburg, owner-occupied units account for 2,917 (59.7%), while renter-occupied units make up 1,967 (40.3%).
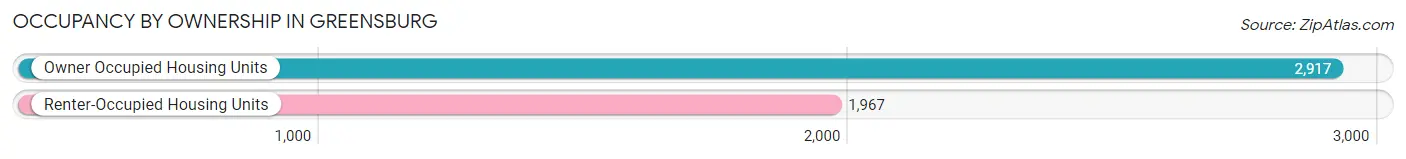
| Occupancy | # Housing Units | % Housing Units |
| Owner Occupied Housing Units | 2,917 | 59.7% |
| Renter-Occupied Housing Units | 1,967 | 40.3% |
| Total Occupied Housing Units | 4,884 | 100.0% |
Occupancy by Household Size in Greensburg
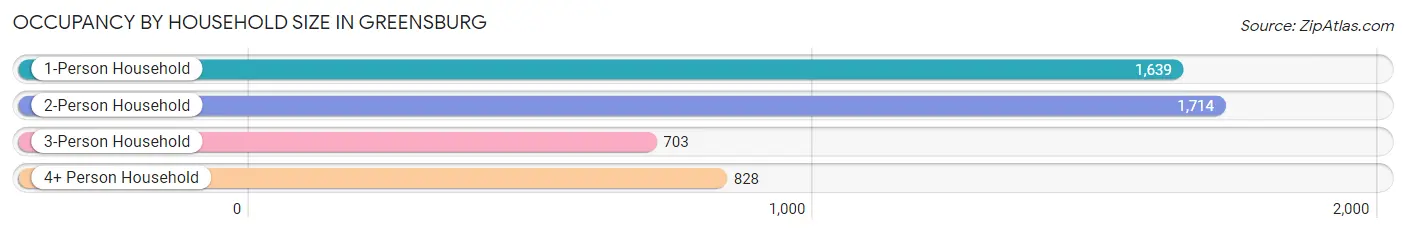
| Household Size | # Housing Units | % Housing Units |
| 1-Person Household | 1,639 | 33.6% |
| 2-Person Household | 1,714 | 35.1% |
| 3-Person Household | 703 | 14.4% |
| 4+ Person Household | 828 | 17.0% |
| Total Housing Units | 4,884 | 100.0% |
Occupancy by Ownership by Household Size in Greensburg
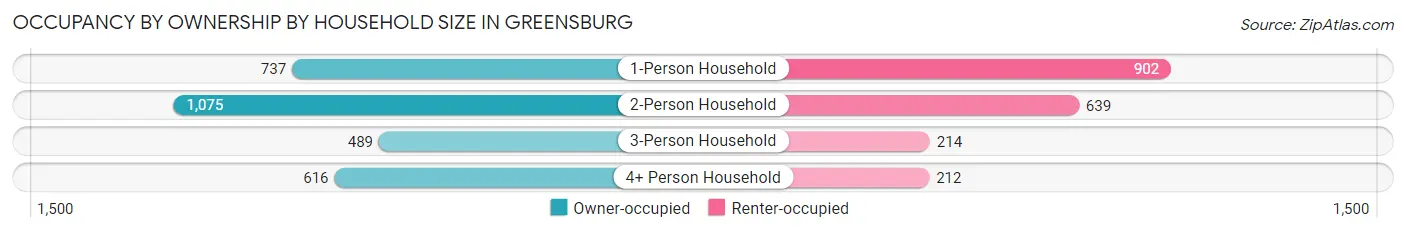
| Household Size | Owner-occupied | Renter-occupied |
| 1-Person Household | 737 (45.0%) | 902 (55.0%) |
| 2-Person Household | 1,075 (62.7%) | 639 (37.3%) |
| 3-Person Household | 489 (69.6%) | 214 (30.4%) |
| 4+ Person Household | 616 (74.4%) | 212 (25.6%) |
| Total Housing Units | 2,917 (59.7%) | 1,967 (40.3%) |
Occupancy by Educational Attainment in Greensburg
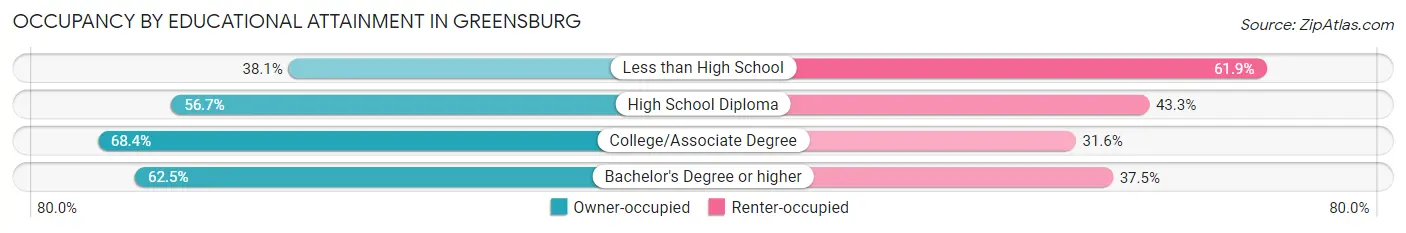
| Household Size | Owner-occupied | Renter-occupied |
| Less than High School | 148 (38.1%) | 240 (61.9%) |
| High School Diploma | 1,142 (56.7%) | 871 (43.3%) |
| College/Associate Degree | 876 (68.4%) | 405 (31.6%) |
| Bachelor's Degree or higher | 751 (62.5%) | 451 (37.5%) |
Occupancy by Age of Householder in Greensburg
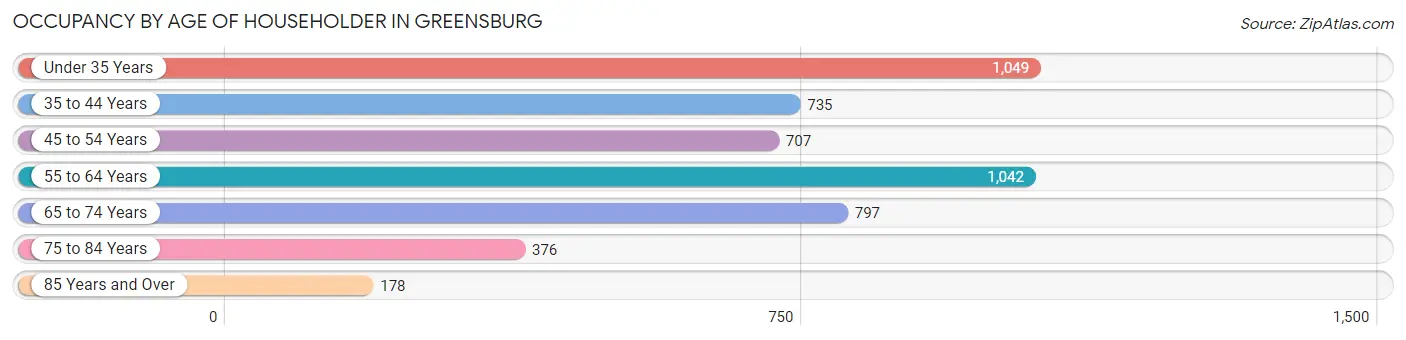
| Age Bracket | # Households | % Households |
| Under 35 Years | 1,049 | 21.5% |
| 35 to 44 Years | 735 | 15.0% |
| 45 to 54 Years | 707 | 14.5% |
| 55 to 64 Years | 1,042 | 21.3% |
| 65 to 74 Years | 797 | 16.3% |
| 75 to 84 Years | 376 | 7.7% |
| 85 Years and Over | 178 | 3.6% |
| Total | 4,884 | 100.0% |
Housing Finances in Greensburg
Median Income by Occupancy in Greensburg
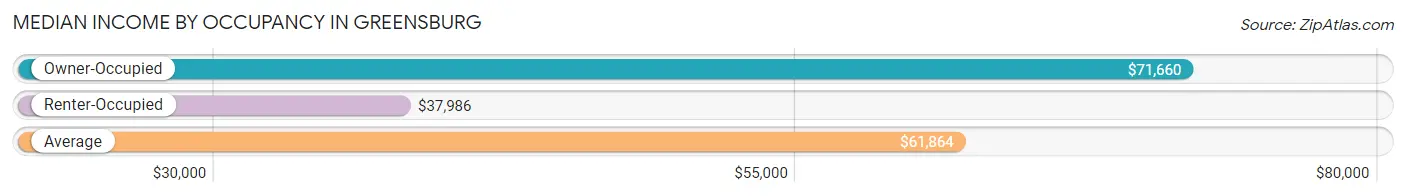
| Occupancy Type | # Households | Median Income |
| Owner-Occupied | 2,917 (59.7%) | $71,660 |
| Renter-Occupied | 1,967 (40.3%) | $37,986 |
| Average | 4,884 (100.0%) | $61,864 |
Occupancy by Householder Income Bracket in Greensburg
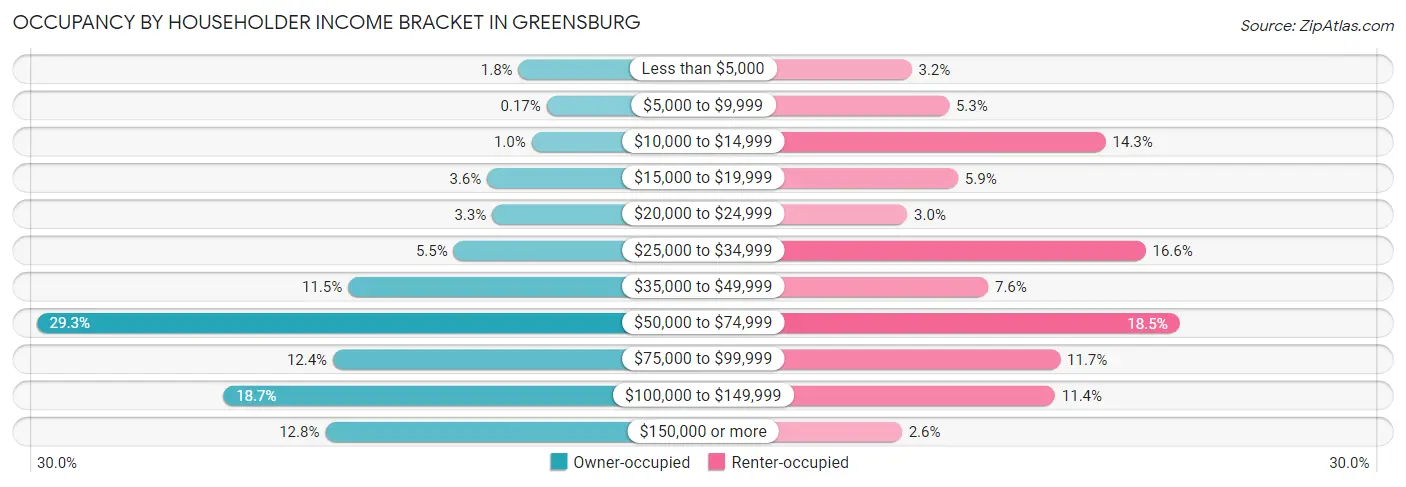
| Income Bracket | Owner-occupied | Renter-occupied |
| Less than $5,000 | 52 (1.8%) | 63 (3.2%) |
| $5,000 to $9,999 | 5 (0.2%) | 105 (5.3%) |
| $10,000 to $14,999 | 30 (1.0%) | 281 (14.3%) |
| $15,000 to $19,999 | 104 (3.6%) | 115 (5.9%) |
| $20,000 to $24,999 | 96 (3.3%) | 58 (2.9%) |
| $25,000 to $34,999 | 160 (5.5%) | 326 (16.6%) |
| $35,000 to $49,999 | 336 (11.5%) | 149 (7.6%) |
| $50,000 to $74,999 | 855 (29.3%) | 364 (18.5%) |
| $75,000 to $99,999 | 361 (12.4%) | 230 (11.7%) |
| $100,000 to $149,999 | 544 (18.6%) | 224 (11.4%) |
| $150,000 or more | 374 (12.8%) | 52 (2.6%) |
| Total | 2,917 (100.0%) | 1,967 (100.0%) |
Monthly Housing Cost Tiers in Greensburg
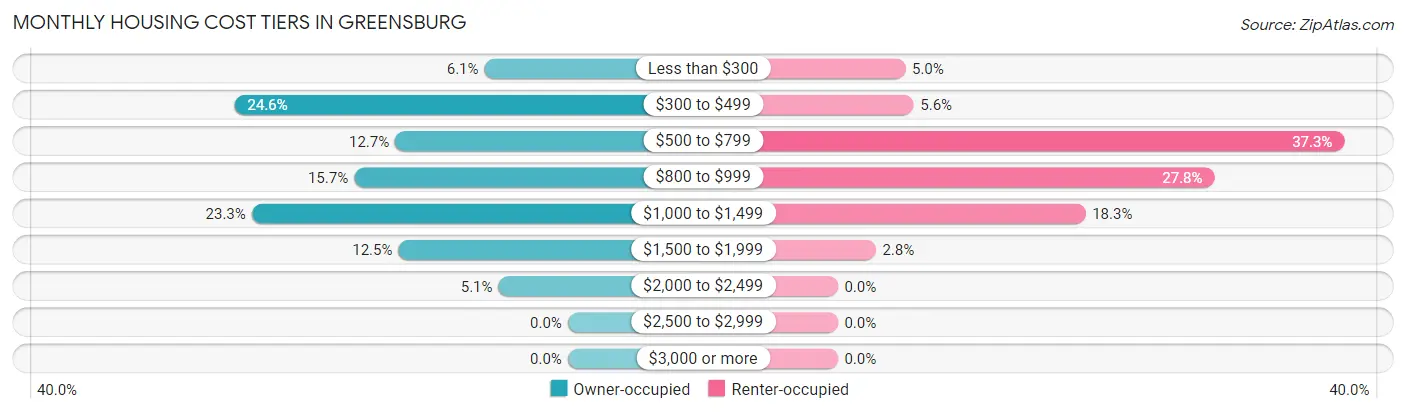
| Monthly Cost | Owner-occupied | Renter-occupied |
| Less than $300 | 179 (6.1%) | 98 (5.0%) |
| $300 to $499 | 716 (24.5%) | 110 (5.6%) |
| $500 to $799 | 371 (12.7%) | 734 (37.3%) |
| $800 to $999 | 459 (15.7%) | 546 (27.8%) |
| $1,000 to $1,499 | 679 (23.3%) | 359 (18.2%) |
| $1,500 to $1,999 | 364 (12.5%) | 55 (2.8%) |
| $2,000 to $2,499 | 149 (5.1%) | 0 (0.0%) |
| $2,500 to $2,999 | 0 (0.0%) | 0 (0.0%) |
| $3,000 or more | 0 (0.0%) | 0 (0.0%) |
| Total | 2,917 (100.0%) | 1,967 (100.0%) |
Physical Housing Characteristics in Greensburg
Housing Structures in Greensburg
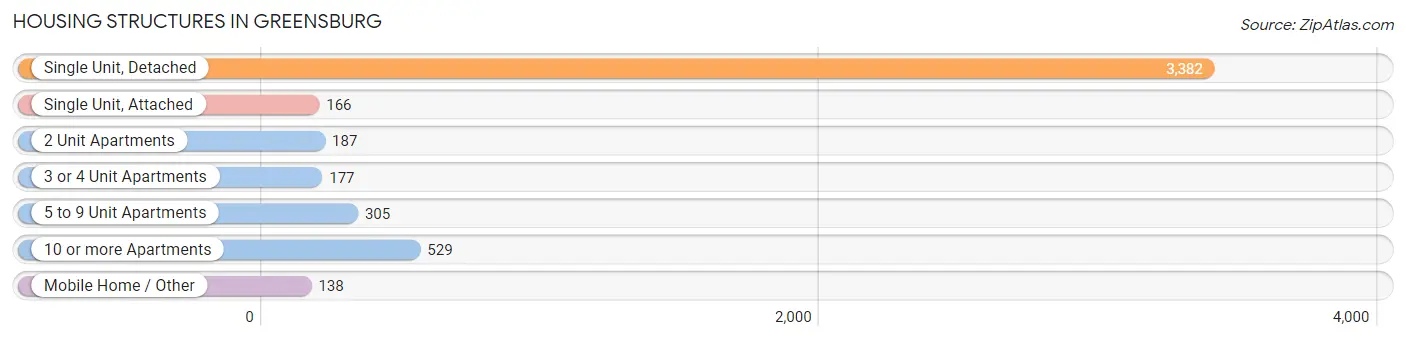
| Structure Type | # Housing Units | % Housing Units |
| Single Unit, Detached | 3,382 | 69.3% |
| Single Unit, Attached | 166 | 3.4% |
| 2 Unit Apartments | 187 | 3.8% |
| 3 or 4 Unit Apartments | 177 | 3.6% |
| 5 to 9 Unit Apartments | 305 | 6.2% |
| 10 or more Apartments | 529 | 10.8% |
| Mobile Home / Other | 138 | 2.8% |
| Total | 4,884 | 100.0% |
Housing Structures by Occupancy in Greensburg
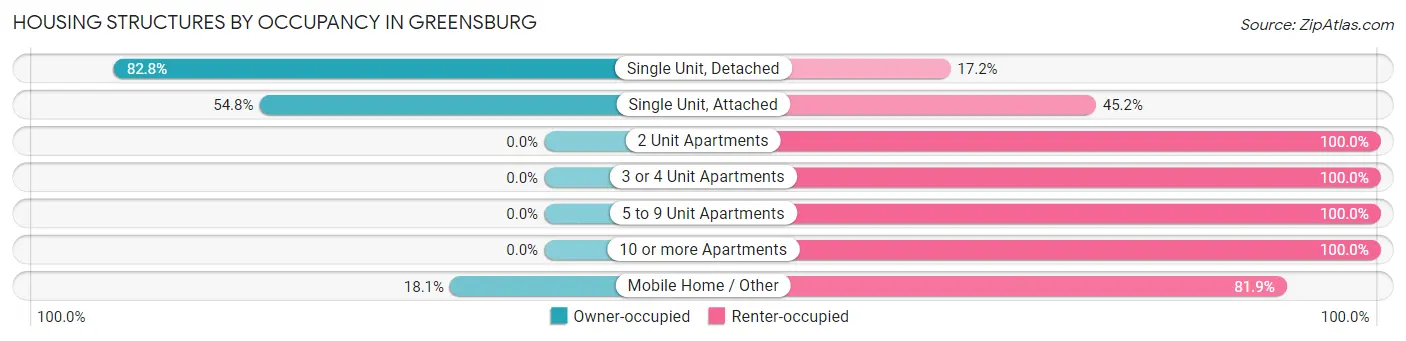
| Structure Type | Owner-occupied | Renter-occupied |
| Single Unit, Detached | 2,801 (82.8%) | 581 (17.2%) |
| Single Unit, Attached | 91 (54.8%) | 75 (45.2%) |
| 2 Unit Apartments | 0 (0.0%) | 187 (100.0%) |
| 3 or 4 Unit Apartments | 0 (0.0%) | 177 (100.0%) |
| 5 to 9 Unit Apartments | 0 (0.0%) | 305 (100.0%) |
| 10 or more Apartments | 0 (0.0%) | 529 (100.0%) |
| Mobile Home / Other | 25 (18.1%) | 113 (81.9%) |
| Total | 2,917 (59.7%) | 1,967 (40.3%) |
Housing Structures by Number of Rooms in Greensburg
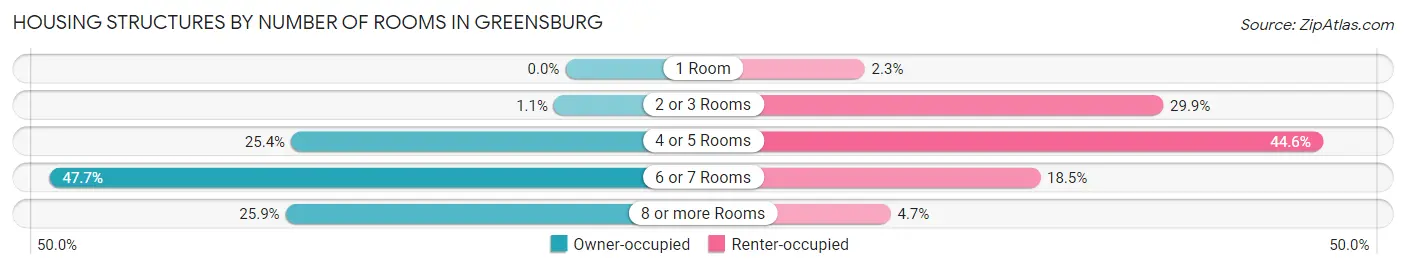
| Number of Rooms | Owner-occupied | Renter-occupied |
| 1 Room | 0 (0.0%) | 45 (2.3%) |
| 2 or 3 Rooms | 31 (1.1%) | 588 (29.9%) |
| 4 or 5 Rooms | 740 (25.4%) | 878 (44.6%) |
| 6 or 7 Rooms | 1,391 (47.7%) | 364 (18.5%) |
| 8 or more Rooms | 755 (25.9%) | 92 (4.7%) |
| Total | 2,917 (100.0%) | 1,967 (100.0%) |
Housing Structure by Heating Type in Greensburg
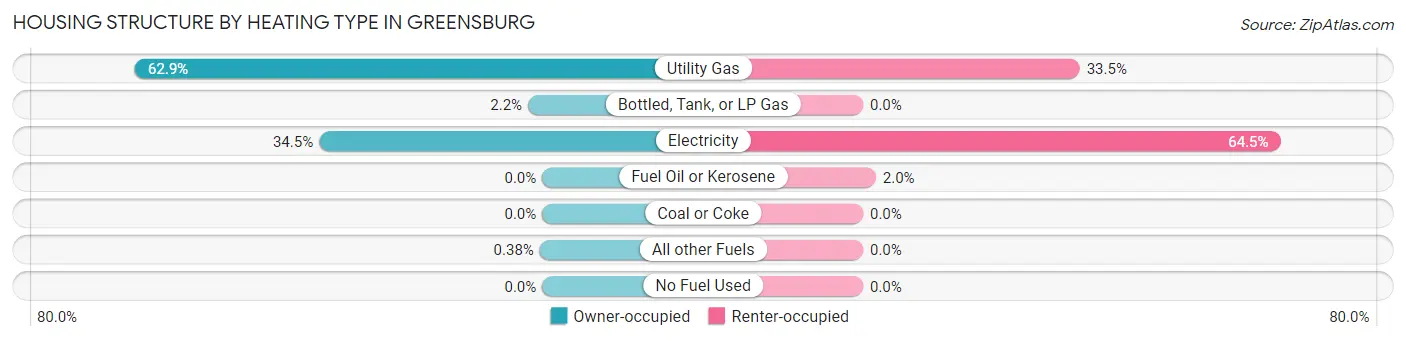
| Heating Type | Owner-occupied | Renter-occupied |
| Utility Gas | 1,836 (62.9%) | 659 (33.5%) |
| Bottled, Tank, or LP Gas | 64 (2.2%) | 0 (0.0%) |
| Electricity | 1,006 (34.5%) | 1,269 (64.5%) |
| Fuel Oil or Kerosene | 0 (0.0%) | 39 (2.0%) |
| Coal or Coke | 0 (0.0%) | 0 (0.0%) |
| All other Fuels | 11 (0.4%) | 0 (0.0%) |
| No Fuel Used | 0 (0.0%) | 0 (0.0%) |
| Total | 2,917 (100.0%) | 1,967 (100.0%) |
Household Vehicle Usage in Greensburg
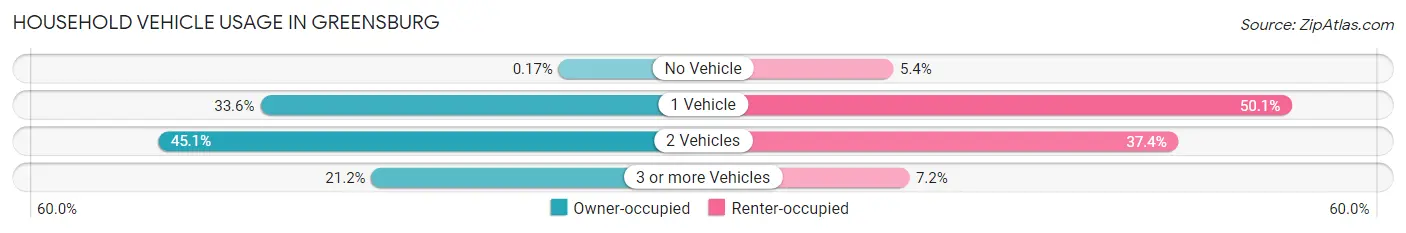
| Vehicles per Household | Owner-occupied | Renter-occupied |
| No Vehicle | 5 (0.2%) | 106 (5.4%) |
| 1 Vehicle | 980 (33.6%) | 985 (50.1%) |
| 2 Vehicles | 1,315 (45.1%) | 735 (37.4%) |
| 3 or more Vehicles | 617 (21.1%) | 141 (7.2%) |
| Total | 2,917 (100.0%) | 1,967 (100.0%) |
Real Estate & Mortgages in Greensburg
Real Estate and Mortgage Overview in Greensburg
| Characteristic | Without Mortgage | With Mortgage |
| Housing Units | 1,060 | 1,857 |
| Median Property Value | $153,000 | $162,700 |
| Median Household Income | $62,045 | $258 |
| Monthly Housing Costs | $424 | $0 |
| Real Estate Taxes | $1,025 | $45 |
Property Value by Mortgage Status in Greensburg
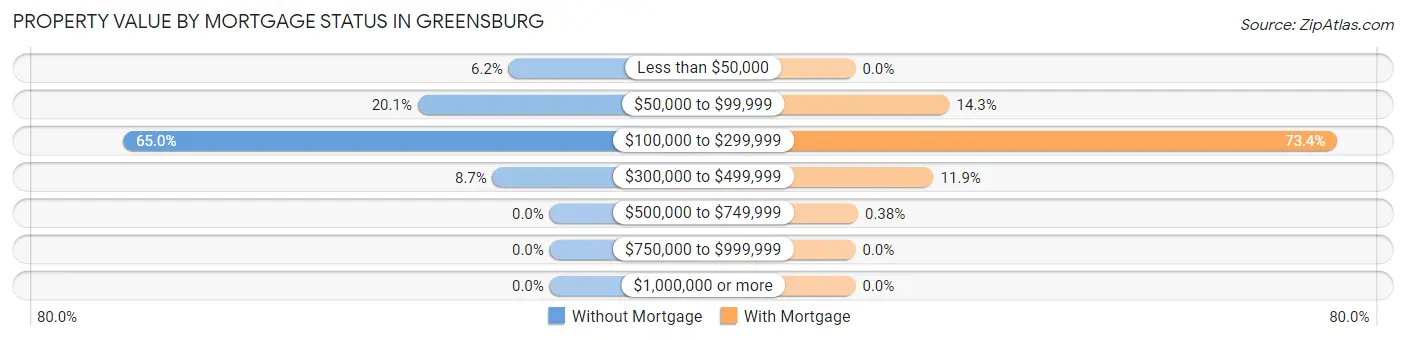
| Property Value | Without Mortgage | With Mortgage |
| Less than $50,000 | 66 (6.2%) | 0 (0.0%) |
| $50,000 to $99,999 | 213 (20.1%) | 266 (14.3%) |
| $100,000 to $299,999 | 689 (65.0%) | 1,363 (73.4%) |
| $300,000 to $499,999 | 92 (8.7%) | 221 (11.9%) |
| $500,000 to $749,999 | 0 (0.0%) | 7 (0.4%) |
| $750,000 to $999,999 | 0 (0.0%) | 0 (0.0%) |
| $1,000,000 or more | 0 (0.0%) | 0 (0.0%) |
| Total | 1,060 (100.0%) | 1,857 (100.0%) |
Household Income by Mortgage Status in Greensburg
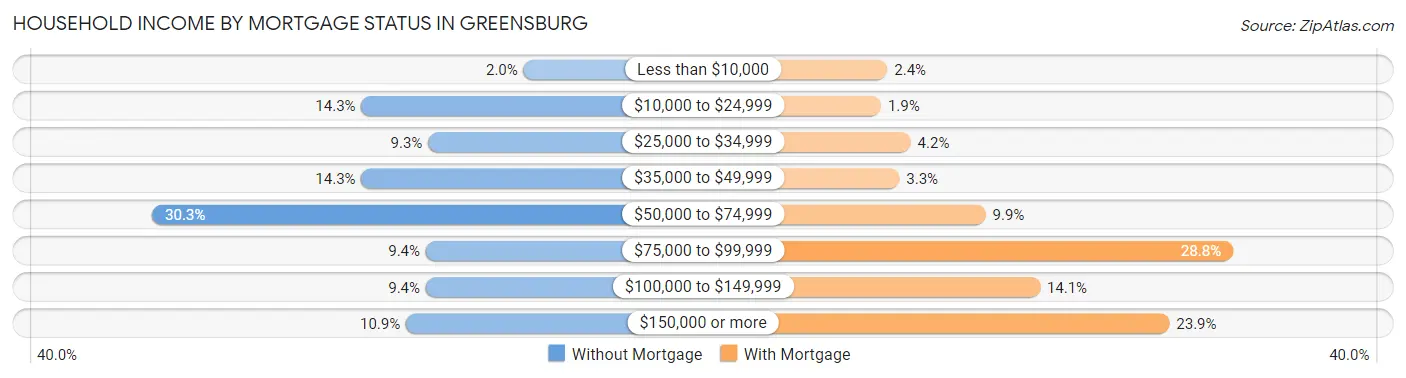
| Household Income | Without Mortgage | With Mortgage |
| Less than $10,000 | 21 (2.0%) | 45 (2.4%) |
| $10,000 to $24,999 | 152 (14.3%) | 36 (1.9%) |
| $25,000 to $34,999 | 98 (9.2%) | 78 (4.2%) |
| $35,000 to $49,999 | 152 (14.3%) | 62 (3.3%) |
| $50,000 to $74,999 | 321 (30.3%) | 184 (9.9%) |
| $75,000 to $99,999 | 100 (9.4%) | 534 (28.8%) |
| $100,000 to $149,999 | 100 (9.4%) | 261 (14.1%) |
| $150,000 or more | 116 (10.9%) | 444 (23.9%) |
| Total | 1,060 (100.0%) | 1,857 (100.0%) |
Property Value to Household Income Ratio in Greensburg
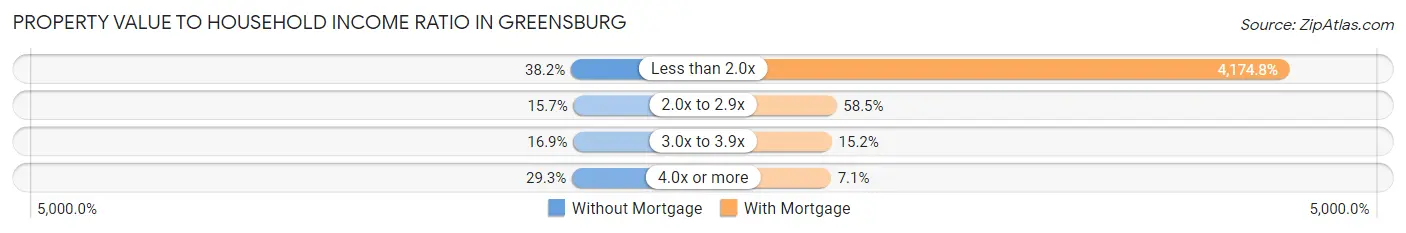
| Value-to-Income Ratio | Without Mortgage | With Mortgage |
| Less than 2.0x | 405 (38.2%) | 77,526 (4,174.8%) |
| 2.0x to 2.9x | 166 (15.7%) | 1,086 (58.5%) |
| 3.0x to 3.9x | 179 (16.9%) | 283 (15.2%) |
| 4.0x or more | 310 (29.2%) | 131 (7.0%) |
| Total | 1,060 (100.0%) | 1,857 (100.0%) |
Real Estate Taxes by Mortgage Status in Greensburg
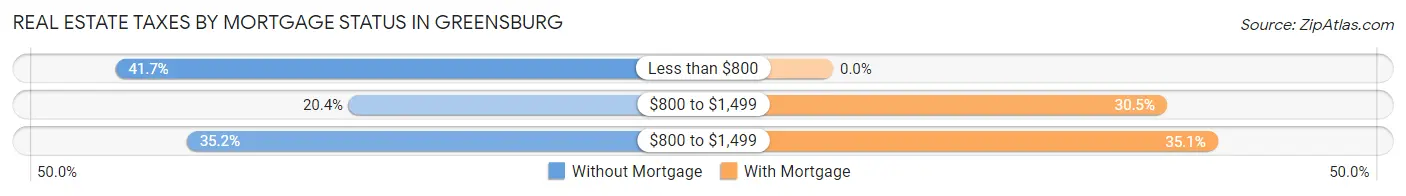
| Property Taxes | Without Mortgage | With Mortgage |
| Less than $800 | 442 (41.7%) | 0 (0.0%) |
| $800 to $1,499 | 216 (20.4%) | 566 (30.5%) |
| $800 to $1,499 | 373 (35.2%) | 652 (35.1%) |
| Total | 1,060 (100.0%) | 1,857 (100.0%) |
Health & Disability in Greensburg
Health Insurance Coverage by Age in Greensburg
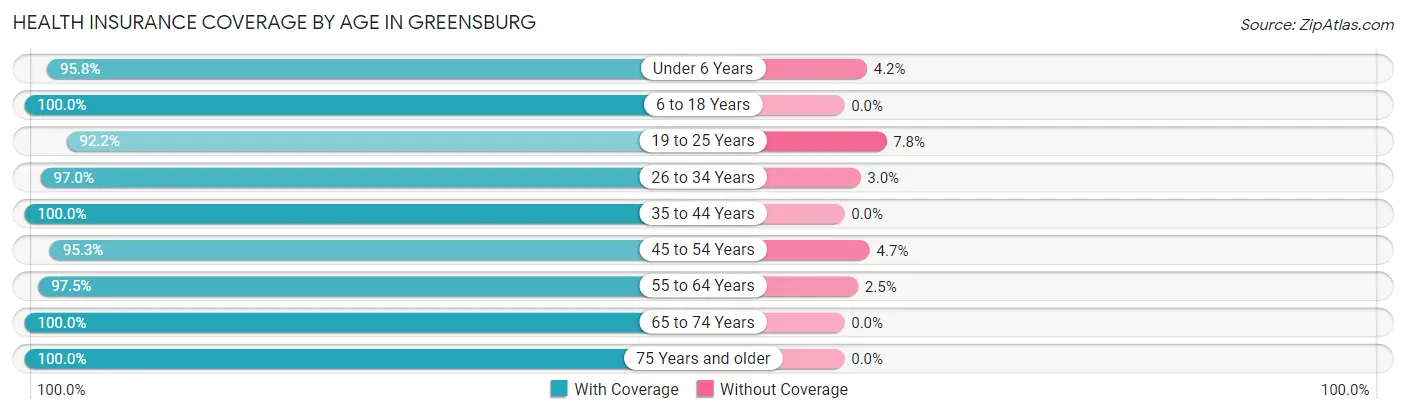
| Age Bracket | With Coverage | Without Coverage |
| Under 6 Years | 778 (95.8%) | 34 (4.2%) |
| 6 to 18 Years | 1,721 (100.0%) | 0 (0.0%) |
| 19 to 25 Years | 859 (92.2%) | 73 (7.8%) |
| 26 to 34 Years | 1,393 (97.0%) | 43 (3.0%) |
| 35 to 44 Years | 1,326 (100.0%) | 0 (0.0%) |
| 45 to 54 Years | 1,290 (95.3%) | 64 (4.7%) |
| 55 to 64 Years | 1,497 (97.5%) | 39 (2.5%) |
| 65 to 74 Years | 1,176 (100.0%) | 0 (0.0%) |
| 75 Years and older | 761 (100.0%) | 0 (0.0%) |
| Total | 10,801 (97.7%) | 253 (2.3%) |
Health Insurance Coverage by Citizenship Status in Greensburg
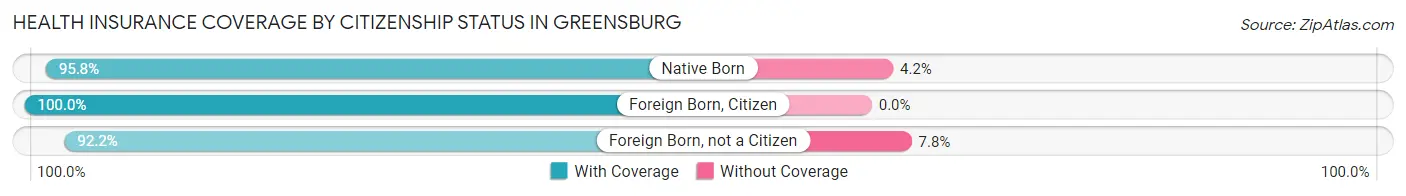
| Citizenship Status | With Coverage | Without Coverage |
| Native Born | 778 (95.8%) | 34 (4.2%) |
| Foreign Born, Citizen | 1,721 (100.0%) | 0 (0.0%) |
| Foreign Born, not a Citizen | 859 (92.2%) | 73 (7.8%) |
Health Insurance Coverage by Household Income in Greensburg
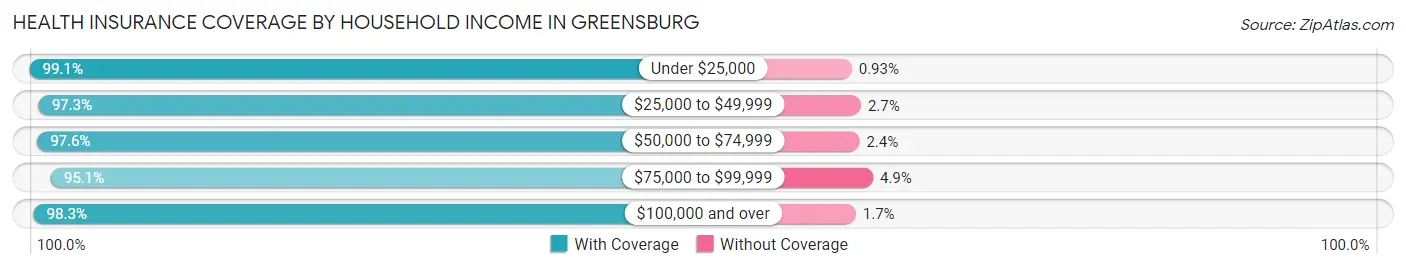
| Household Income | With Coverage | Without Coverage |
| Under $25,000 | 1,484 (99.1%) | 14 (0.9%) |
| $25,000 to $49,999 | 1,757 (97.3%) | 48 (2.7%) |
| $50,000 to $74,999 | 2,392 (97.6%) | 58 (2.4%) |
| $75,000 to $99,999 | 1,295 (95.1%) | 67 (4.9%) |
| $100,000 and over | 3,824 (98.3%) | 66 (1.7%) |
Public vs Private Health Insurance Coverage by Age in Greensburg
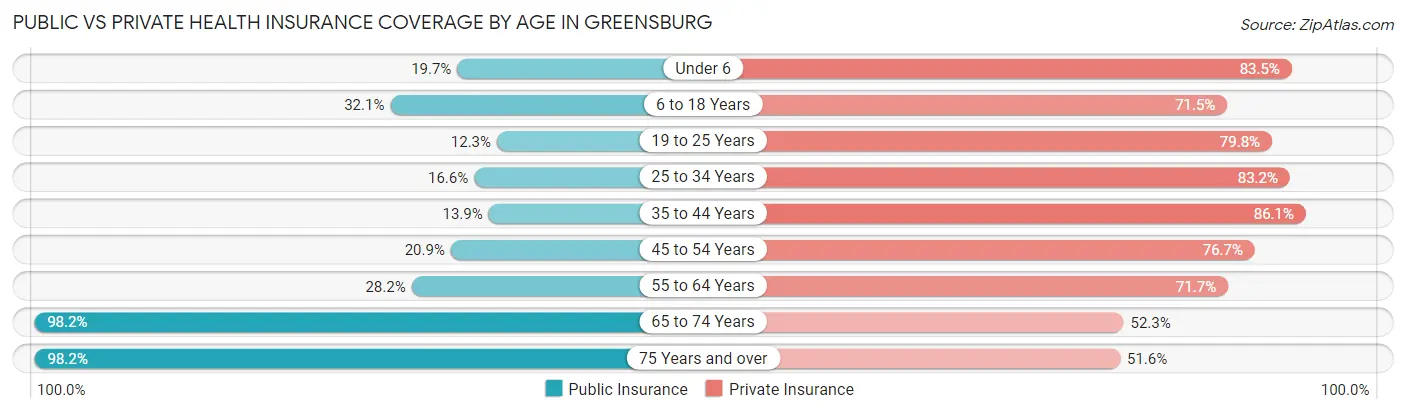
| Age Bracket | Public Insurance | Private Insurance |
| Under 6 | 160 (19.7%) | 678 (83.5%) |
| 6 to 18 Years | 553 (32.1%) | 1,231 (71.5%) |
| 19 to 25 Years | 115 (12.3%) | 744 (79.8%) |
| 25 to 34 Years | 238 (16.6%) | 1,194 (83.2%) |
| 35 to 44 Years | 184 (13.9%) | 1,142 (86.1%) |
| 45 to 54 Years | 283 (20.9%) | 1,038 (76.7%) |
| 55 to 64 Years | 433 (28.2%) | 1,101 (71.7%) |
| 65 to 74 Years | 1,155 (98.2%) | 615 (52.3%) |
| 75 Years and over | 747 (98.2%) | 393 (51.6%) |
| Total | 3,868 (35.0%) | 8,136 (73.6%) |
Disability Status by Sex by Age in Greensburg
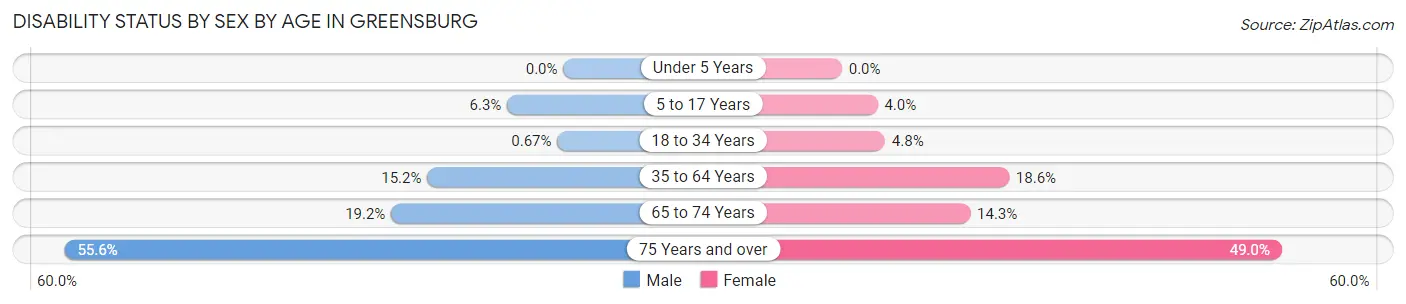
| Age Bracket | Male | Female |
| Under 5 Years | 0 (0.0%) | 0 (0.0%) |
| 5 to 17 Years | 44 (6.3%) | 35 (4.0%) |
| 18 to 34 Years | 10 (0.7%) | 54 (4.8%) |
| 35 to 64 Years | 309 (15.1%) | 405 (18.6%) |
| 65 to 74 Years | 102 (19.2%) | 92 (14.3%) |
| 75 Years and over | 145 (55.6%) | 245 (49.0%) |
Disability Class by Sex by Age in Greensburg
Disability Class: Hearing Difficulty
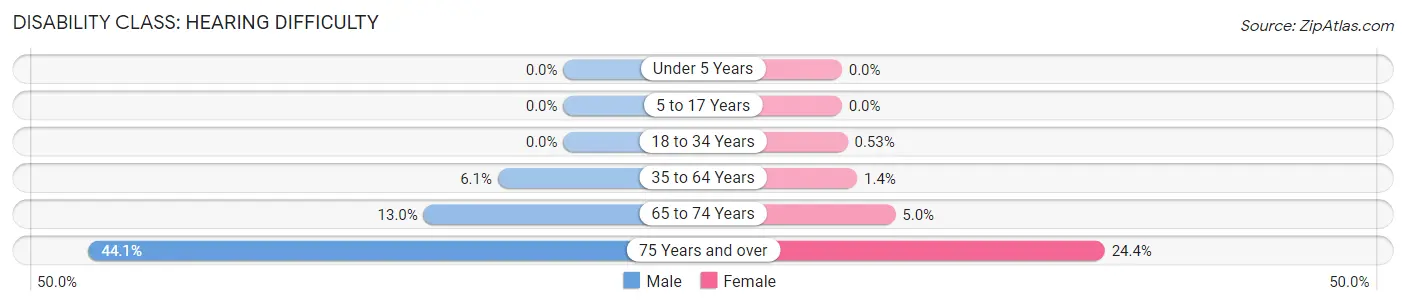
| Age Bracket | Male | Female |
| Under 5 Years | 0 (0.0%) | 0 (0.0%) |
| 5 to 17 Years | 0 (0.0%) | 0 (0.0%) |
| 18 to 34 Years | 0 (0.0%) | 6 (0.5%) |
| 35 to 64 Years | 124 (6.1%) | 31 (1.4%) |
| 65 to 74 Years | 69 (13.0%) | 32 (5.0%) |
| 75 Years and over | 115 (44.1%) | 122 (24.4%) |
Disability Class: Vision Difficulty
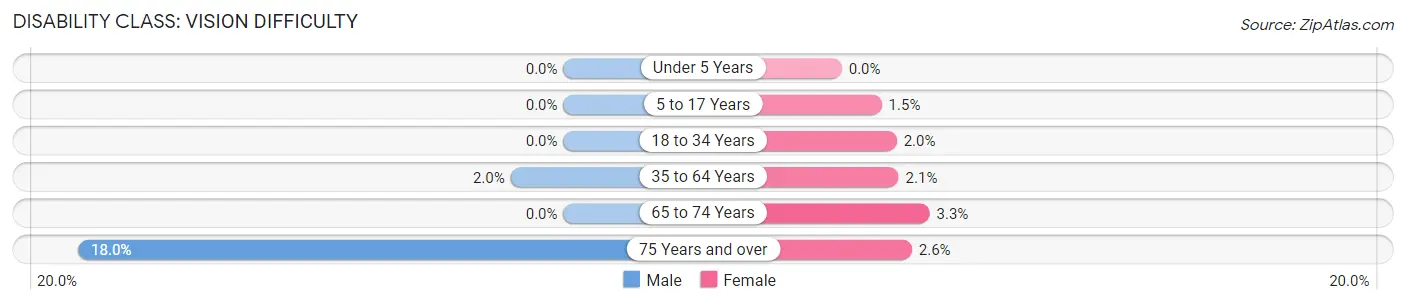
| Age Bracket | Male | Female |
| Under 5 Years | 0 (0.0%) | 0 (0.0%) |
| 5 to 17 Years | 0 (0.0%) | 13 (1.5%) |
| 18 to 34 Years | 0 (0.0%) | 23 (2.0%) |
| 35 to 64 Years | 40 (2.0%) | 46 (2.1%) |
| 65 to 74 Years | 0 (0.0%) | 21 (3.3%) |
| 75 Years and over | 47 (18.0%) | 13 (2.6%) |
Disability Class: Cognitive Difficulty
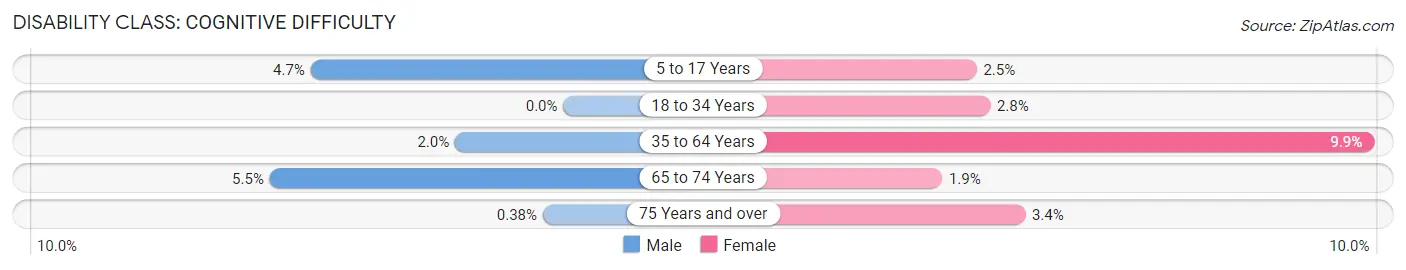
| Age Bracket | Male | Female |
| 5 to 17 Years | 33 (4.7%) | 22 (2.5%) |
| 18 to 34 Years | 0 (0.0%) | 31 (2.8%) |
| 35 to 64 Years | 41 (2.0%) | 215 (9.9%) |
| 65 to 74 Years | 29 (5.4%) | 12 (1.9%) |
| 75 Years and over | 1 (0.4%) | 17 (3.4%) |
Disability Class: Ambulatory Difficulty
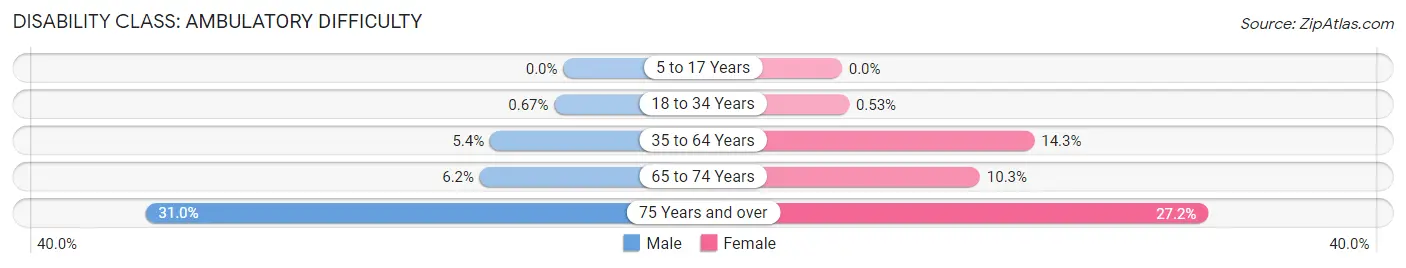
| Age Bracket | Male | Female |
| 5 to 17 Years | 0 (0.0%) | 0 (0.0%) |
| 18 to 34 Years | 10 (0.7%) | 6 (0.5%) |
| 35 to 64 Years | 111 (5.4%) | 311 (14.3%) |
| 65 to 74 Years | 33 (6.2%) | 66 (10.2%) |
| 75 Years and over | 81 (31.0%) | 136 (27.2%) |
Disability Class: Self-Care Difficulty
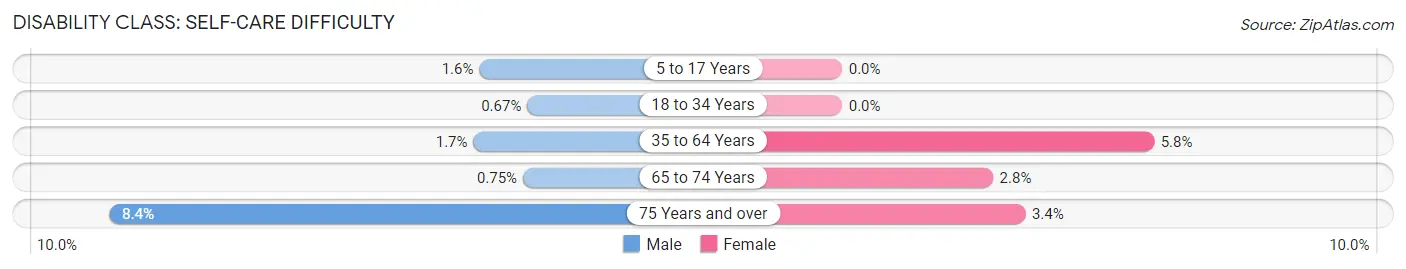
| Age Bracket | Male | Female |
| 5 to 17 Years | 11 (1.6%) | 0 (0.0%) |
| 18 to 34 Years | 10 (0.7%) | 0 (0.0%) |
| 35 to 64 Years | 34 (1.7%) | 126 (5.8%) |
| 65 to 74 Years | 4 (0.7%) | 18 (2.8%) |
| 75 Years and over | 22 (8.4%) | 17 (3.4%) |
Technology Access in Greensburg
Computing Device Access in Greensburg
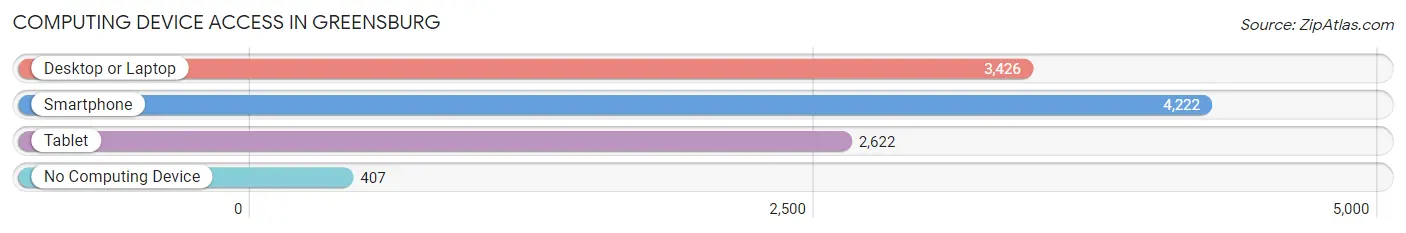
| Device Type | # Households | % Households |
| Desktop or Laptop | 3,426 | 70.2% |
| Smartphone | 4,222 | 86.5% |
| Tablet | 2,622 | 53.7% |
| No Computing Device | 407 | 8.3% |
| Total | 4,884 | 100.0% |
Internet Access in Greensburg
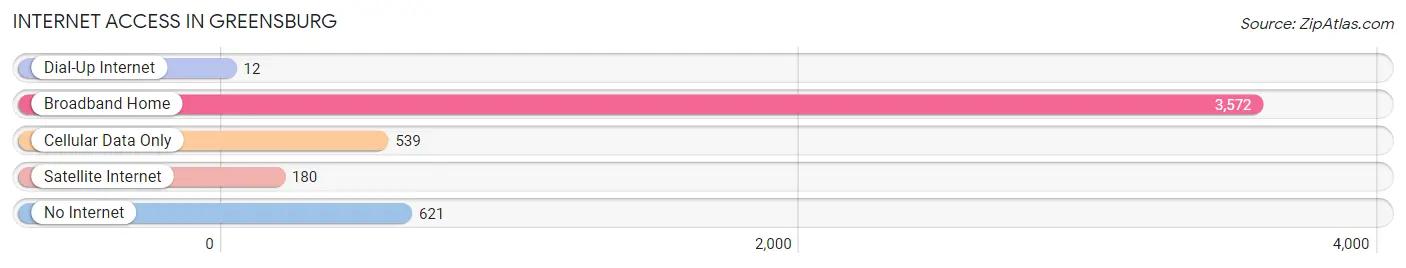
| Internet Type | # Households | % Households |
| Dial-Up Internet | 12 | 0.3% |
| Broadband Home | 3,572 | 73.1% |
| Cellular Data Only | 539 | 11.0% |
| Satellite Internet | 180 | 3.7% |
| No Internet | 621 | 12.7% |
| Total | 4,884 | 100.0% |
Greensburg Summary
Greensburg, Indiana is a city located in Decatur County, Indiana, United States. It is the county seat of Decatur County and is located in the southeastern part of the state. The population was counted at 11,492 at the 2010 census.
History
Greensburg was founded in 1822 by William Greensburg, a Revolutionary War veteran. The town was originally called Greensburgh, but the name was changed to Greensburg in 1837. The town was laid out in a grid pattern, with the courthouse at the center.
Greensburg was an important stop on the Underground Railroad, with many slaves escaping to freedom in Canada. The town was also a major center of the temperance movement in the late 19th century.
Greensburg was the site of a major battle during the Civil War. The Battle of Greensburg was fought on July 4, 1863, and resulted in a Confederate victory.
Geography
Greensburg is located at 39°20'N 85°25'W (39.33, -85.41). The city is situated in the rolling hills of southeastern Indiana, about 50 miles southeast of Indianapolis.
The city is located in the White River Valley, which is part of the Wabash River watershed. The White River flows through the city, and is a popular destination for fishing and boating.
Economy
Greensburg is a major center of manufacturing and industry in southeastern Indiana. The city is home to several large factories, including a General Motors plant, a Honda plant, and a Caterpillar plant.
The city is also home to several large employers, including Decatur County Memorial Hospital, Decatur County Community Schools, and the Decatur County Sheriff's Office.
Demographics
As of the 2010 census, the population of Greensburg was 11,492. The racial makeup of the city was 94.2% White, 2.3% African American, 0.3% Native American, 0.7% Asian, 0.1% Pacific Islander, 1.2% from other races, and 1.3% from two or more races. Hispanic or Latino of any race were 2.7% of the population.
The median household income in Greensburg was $41,945, and the median family income was $50,945. The per capita income for the city was $20,945. About 11.2% of families and 14.2% of the population were below the poverty line, including 19.2% of those under age 18 and 8.2% of those age 65 or over.
Conclusion
Greensburg, Indiana is a city located in Decatur County, Indiana, United States. It is the county seat of Decatur County and is located in the southeastern part of the state. The city has a long and rich history, and was an important stop on the Underground Railroad. The city is a major center of manufacturing and industry, and is home to several large employers. The population of Greensburg was 11,492 at the 2010 census, with a median household income of $41,945.
Common Questions
What is the Total Population of Greensburg?
Total Population of Greensburg is 11,431.
What is the Total Male Population of Greensburg?
Total Male Population of Greensburg is 5,592.
What is the Total Female Population of Greensburg?
Total Female Population of Greensburg is 5,839.
What is the Ratio of Males per 100 Females in Greensburg?
There are 95.77 Males per 100 Females in Greensburg.
What is the Ratio of Females per 100 Males in Greensburg?
There are 104.42 Females per 100 Males in Greensburg.
What is the Median Population Age in Greensburg?
Median Population Age in Greensburg is 40.0 Years.
What is the Average Family Size in Greensburg
Average Family Size in Greensburg is 2.9 People.
What is the Average Household Size in Greensburg
Average Household Size in Greensburg is 2.2 People.
What is Per Capita Income in Greensburg?
Per Capita income in Greensburg is $31,666.
What is the Median Family Income in Greensburg?
Median Family Income in Greensburg is $69,808.
What is the Median Household income in Greensburg?
Median Household Income in Greensburg is $61,864.
What is Income or Wage Gap in Greensburg?
Income or Wage Gap in Greensburg is 36.5%.
Women in Greensburg earn 63.5 cents for every dollar earned by a man.
What is Family Income Deficit in Greensburg?
Family Income Deficit in Greensburg is $11,310.
Families that are below poverty line in Greensburg earn $11,310 less on average than the poverty threshold level.
What is Inequality or Gini Index in Greensburg?
Inequality or Gini Index in Greensburg is 0.40.
How Large is the Labor Force in Greensburg?
There are 6,013 People in the Labor Forcein in Greensburg.
What is the Percentage of People in the Labor Force in Greensburg?
64.8% of People are in the Labor Force in Greensburg.
What is the Unemployment Rate in Greensburg?
Unemployment Rate in Greensburg is 3.4%.