Notre Dame, IN
Notre Dame Map
Notre Dame Overview
6,479
TOTAL POPULATION
3,394
MALE POPULATION
3,085
FEMALE POPULATION
110.02
MALES / 100 FEMALES
90.90
FEMALES / 100 MALES
20.1
MEDIAN AGE
1.8
AVG FAMILY SIZE
1.6
AVG HOUSEHOLD SIZE
$6,130
PER CAPITA INCOME
25.4%
WAGE / INCOME GAP [ % ]
74.6¢/ $1
WAGE / INCOME GAP [ $ ]
0.59
INEQUALITY / GINI INDEX
3,006
LABOR FORCE [ PEOPLE ]
46.4%
PERCENT IN LABOR FORCE
0.7%
UNEMPLOYMENT RATE
Notre Dame Zip Codes
Notre Dame Area Codes
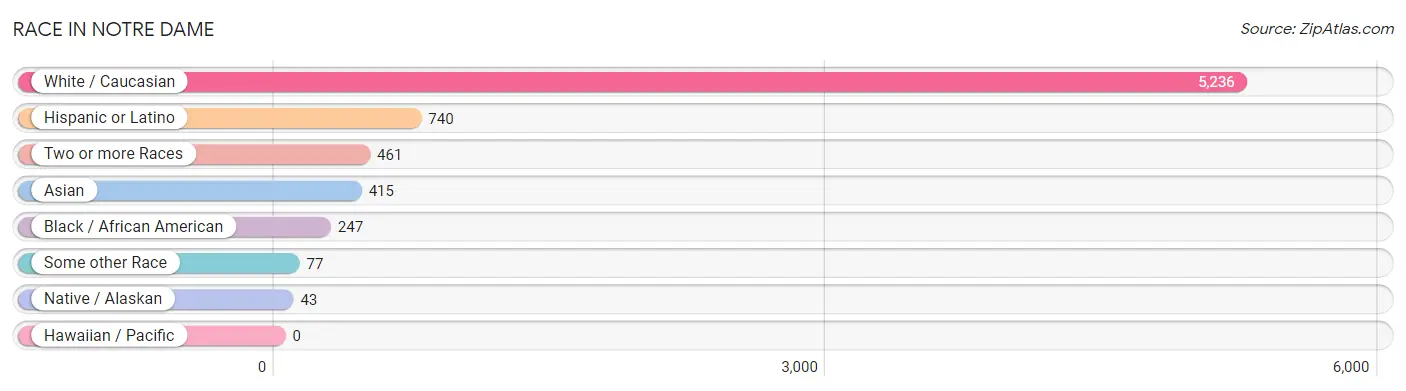
Race in Notre Dame
The most populous races in Notre Dame are White / Caucasian (5,236 | 80.8%), Hispanic or Latino (740 | 11.4%), and Two or more Races (461 | 7.1%).
| Race | # Population | % Population |
| Asian | 415 | 6.4% |
| Black / African American | 247 | 3.8% |
| Hawaiian / Pacific | 0 | 0.0% |
| Hispanic or Latino | 740 | 11.4% |
| Native / Alaskan | 43 | 0.7% |
| White / Caucasian | 5,236 | 80.8% |
| Two or more Races | 461 | 7.1% |
| Some other Race | 77 | 1.2% |
| Total | 6,479 | 100.0% |
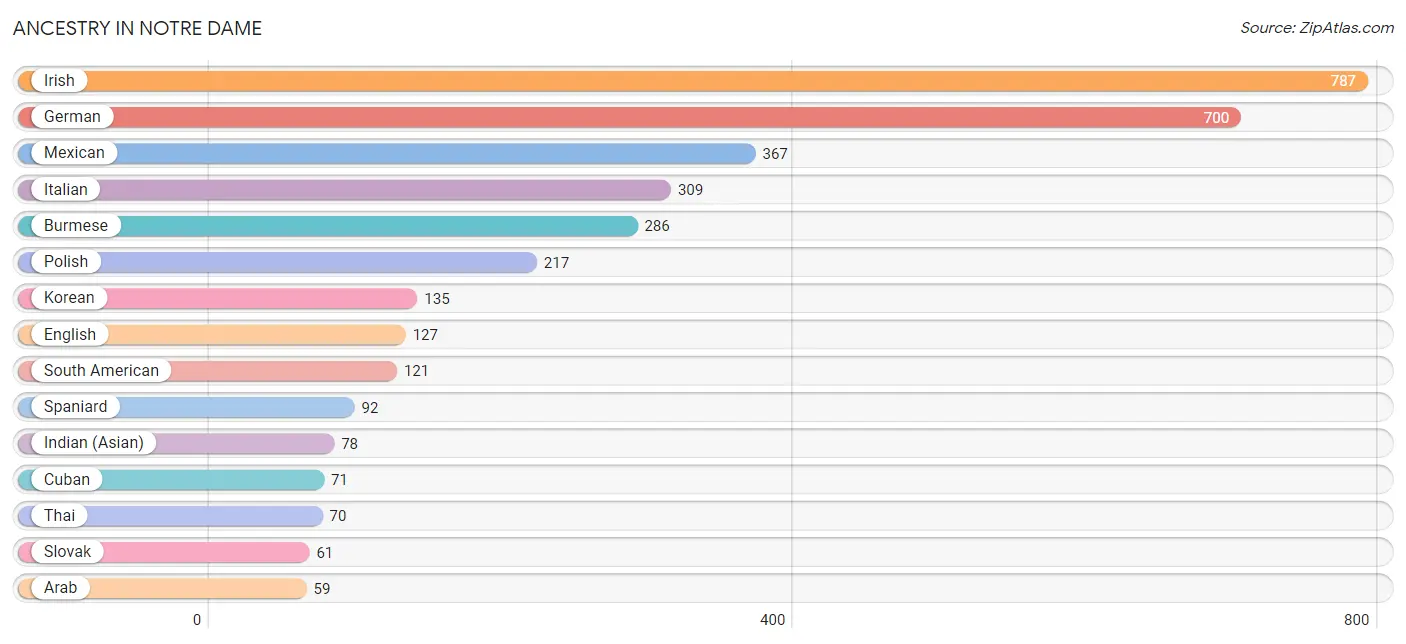
Ancestry in Notre Dame
The most populous ancestries reported in Notre Dame are Irish (787 | 12.1%), German (700 | 10.8%), Mexican (367 | 5.7%), Italian (309 | 4.8%), and Burmese (286 | 4.4%), together accounting for 37.8% of all Notre Dame residents.
| Ancestry | # Population | % Population |
| African | 13 | 0.2% |
| American | 43 | 0.7% |
| Arab | 59 | 0.9% |
| Armenian | 4 | 0.1% |
| Austrian | 5 | 0.1% |
| Belgian | 46 | 0.7% |
| Brazilian | 43 | 0.7% |
| British | 56 | 0.9% |
| British West Indian | 1 | 0.0% |
| Burmese | 286 | 4.4% |
| Central American | 10 | 0.2% |
| Chilean | 24 | 0.4% |
| Colombian | 21 | 0.3% |
| Costa Rican | 5 | 0.1% |
| Croatian | 16 | 0.3% |
| Cuban | 71 | 1.1% |
| Czech | 12 | 0.2% |
| Danish | 12 | 0.2% |
| Dutch | 56 | 0.9% |
| Ecuadorian | 15 | 0.2% |
| Egyptian | 5 | 0.1% |
| English | 127 | 2.0% |
| European | 32 | 0.5% |
| French | 29 | 0.4% |
| French Canadian | 8 | 0.1% |
| German | 700 | 10.8% |
| Greek | 20 | 0.3% |
| Haitian | 6 | 0.1% |
| Hungarian | 13 | 0.2% |
| Indian (Asian) | 78 | 1.2% |
| Indonesian | 4 | 0.1% |
| Iraqi | 11 | 0.2% |
| Irish | 787 | 12.1% |
| Italian | 309 | 4.8% |
| Jamaican | 4 | 0.1% |
| Jordanian | 8 | 0.1% |
| Korean | 135 | 2.1% |
| Lebanese | 27 | 0.4% |
| Lithuanian | 4 | 0.1% |
| Luxembourger | 5 | 0.1% |
| Macedonian | 19 | 0.3% |
| Mexican | 367 | 5.7% |
| Nicaraguan | 5 | 0.1% |
| Nigerian | 1 | 0.0% |
| Northern European | 1 | 0.0% |
| Norwegian | 11 | 0.2% |
| Palestinian | 4 | 0.1% |
| Peruvian | 12 | 0.2% |
| Polish | 217 | 3.4% |
| Puerto Rican | 26 | 0.4% |
| Russian | 30 | 0.5% |
| Scandinavian | 6 | 0.1% |
| Scotch-Irish | 12 | 0.2% |
| Scottish | 11 | 0.2% |
| Slovak | 61 | 0.9% |
| South American | 121 | 1.9% |
| Spaniard | 92 | 1.4% |
| Spanish | 5 | 0.1% |
| Sri Lankan | 11 | 0.2% |
| Subsaharan African | 14 | 0.2% |
| Swiss | 25 | 0.4% |
| Syrian | 4 | 0.1% |
| Thai | 70 | 1.1% |
| Ukrainian | 7 | 0.1% |
| Venezuelan | 49 | 0.8% |
| Vietnamese | 4 | 0.1% |
| Welsh | 6 | 0.1% | View All 67 Rows |
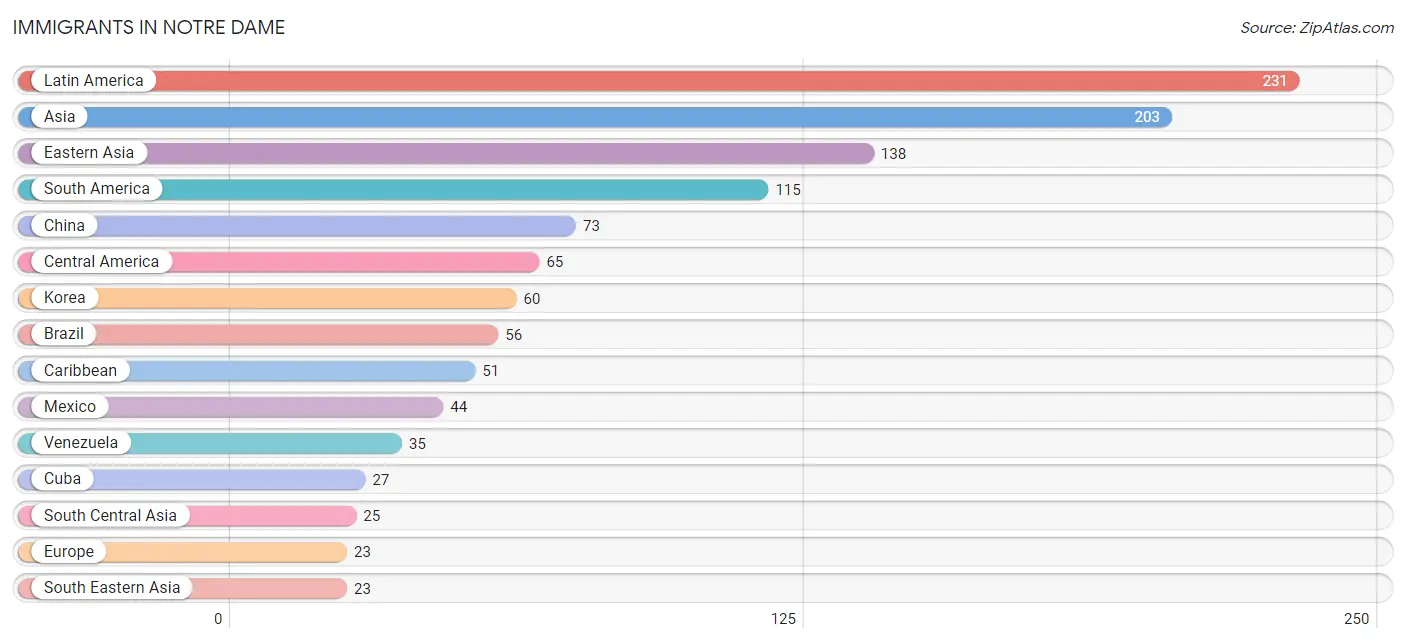
Immigrants in Notre Dame
The most numerous immigrant groups reported in Notre Dame came from Latin America (231 | 3.6%), Asia (203 | 3.1%), Eastern Asia (138 | 2.1%), South America (115 | 1.8%), and China (73 | 1.1%), together accounting for 11.7% of all Notre Dame residents.
| Immigration Origin | # Population | % Population |
| Africa | 7 | 0.1% |
| Asia | 203 | 3.1% |
| Bangladesh | 4 | 0.1% |
| Brazil | 56 | 0.9% |
| Caribbean | 51 | 0.8% |
| Central America | 65 | 1.0% |
| Chile | 20 | 0.3% |
| China | 73 | 1.1% |
| Costa Rica | 21 | 0.3% |
| Cuba | 27 | 0.4% |
| Eastern Asia | 138 | 2.1% |
| Eastern Europe | 7 | 0.1% |
| Europe | 23 | 0.4% |
| Germany | 15 | 0.2% |
| Haiti | 20 | 0.3% |
| India | 17 | 0.3% |
| Jamaica | 4 | 0.1% |
| Japan | 5 | 0.1% |
| Korea | 60 | 0.9% |
| Latin America | 231 | 3.6% |
| Mexico | 44 | 0.7% |
| Nigeria | 7 | 0.1% |
| Peru | 4 | 0.1% |
| Philippines | 19 | 0.3% |
| South America | 115 | 1.8% |
| South Central Asia | 25 | 0.4% |
| South Eastern Asia | 23 | 0.4% |
| Southern Europe | 1 | 0.0% |
| Spain | 1 | 0.0% |
| Ukraine | 7 | 0.1% |
| Uzbekistan | 4 | 0.1% |
| Venezuela | 35 | 0.5% |
| Western Africa | 7 | 0.1% |
| Western Asia | 17 | 0.3% |
| Western Europe | 15 | 0.2% | View All 35 Rows |
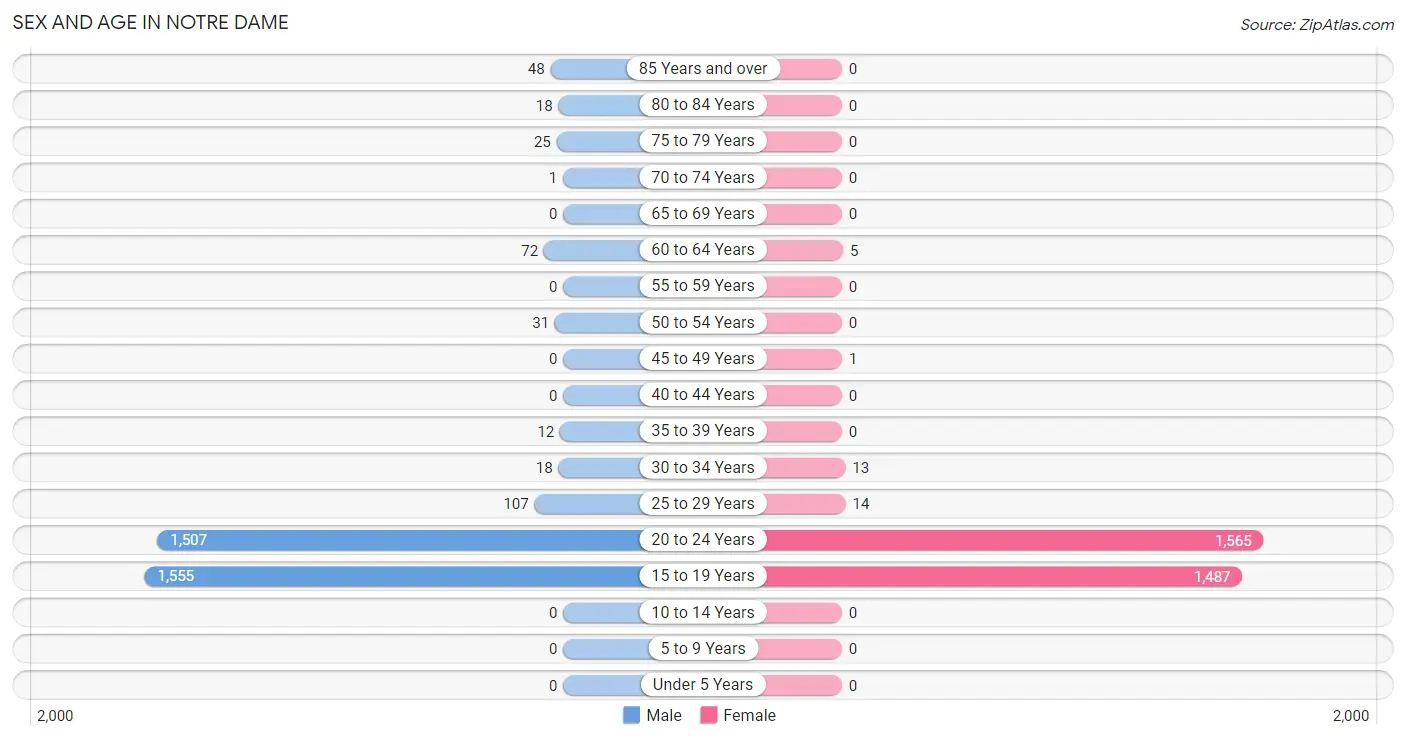
Sex and Age in Notre Dame
Sex and Age in Notre Dame
The most populous age groups in Notre Dame are 15 to 19 Years (1,555 | 45.8%) for men and 20 to 24 Years (1,565 | 50.7%) for women.
| Age Bracket | Male | Female |
| Under 5 Years | 0 (0.0%) | 0 (0.0%) |
| 5 to 9 Years | 0 (0.0%) | 0 (0.0%) |
| 10 to 14 Years | 0 (0.0%) | 0 (0.0%) |
| 15 to 19 Years | 1,555 (45.8%) | 1,487 (48.2%) |
| 20 to 24 Years | 1,507 (44.4%) | 1,565 (50.7%) |
| 25 to 29 Years | 107 (3.2%) | 14 (0.4%) |
| 30 to 34 Years | 18 (0.5%) | 13 (0.4%) |
| 35 to 39 Years | 12 (0.4%) | 0 (0.0%) |
| 40 to 44 Years | 0 (0.0%) | 0 (0.0%) |
| 45 to 49 Years | 0 (0.0%) | 1 (0.0%) |
| 50 to 54 Years | 31 (0.9%) | 0 (0.0%) |
| 55 to 59 Years | 0 (0.0%) | 0 (0.0%) |
| 60 to 64 Years | 72 (2.1%) | 5 (0.2%) |
| 65 to 69 Years | 0 (0.0%) | 0 (0.0%) |
| 70 to 74 Years | 1 (0.0%) | 0 (0.0%) |
| 75 to 79 Years | 25 (0.7%) | 0 (0.0%) |
| 80 to 84 Years | 18 (0.5%) | 0 (0.0%) |
| 85 Years and over | 48 (1.4%) | 0 (0.0%) |
| Total | 3,394 (100.0%) | 3,085 (100.0%) |
Families and Households in Notre Dame
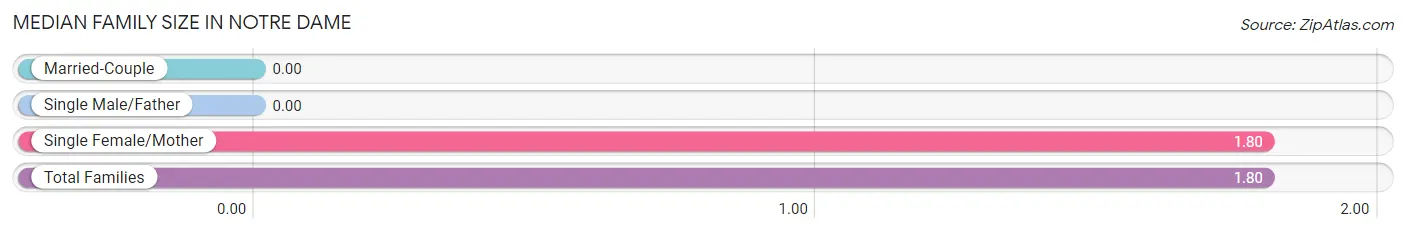
Median Family Size in Notre Dame
| Family Type | # Families | Family Size |
| Married-Couple | 0 (0.0%) | - |
| Single Male/Father | 0 (0.0%) | - |
| Single Female/Mother | 5 (100.0%) | 1.80 |
| Total Families | 5 (100.0%) | 1.80 |
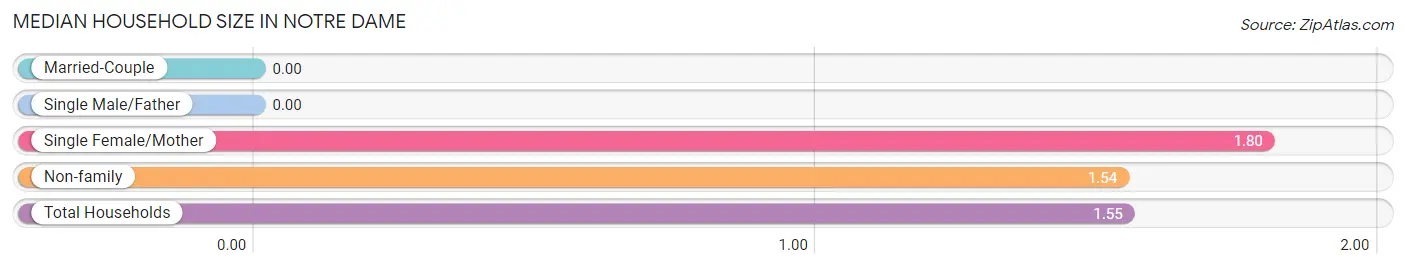
Median Household Size in Notre Dame
| Household Type | # Households | Household Size |
| Married-Couple | 0 (0.0%) | - |
| Single Male/Father | 0 (0.0%) | - |
| Single Female/Mother | 5 (2.8%) | 1.80 |
| Non-family | 171 (97.2%) | 1.54 |
| Total Households | 176 (100.0%) | 1.55 |
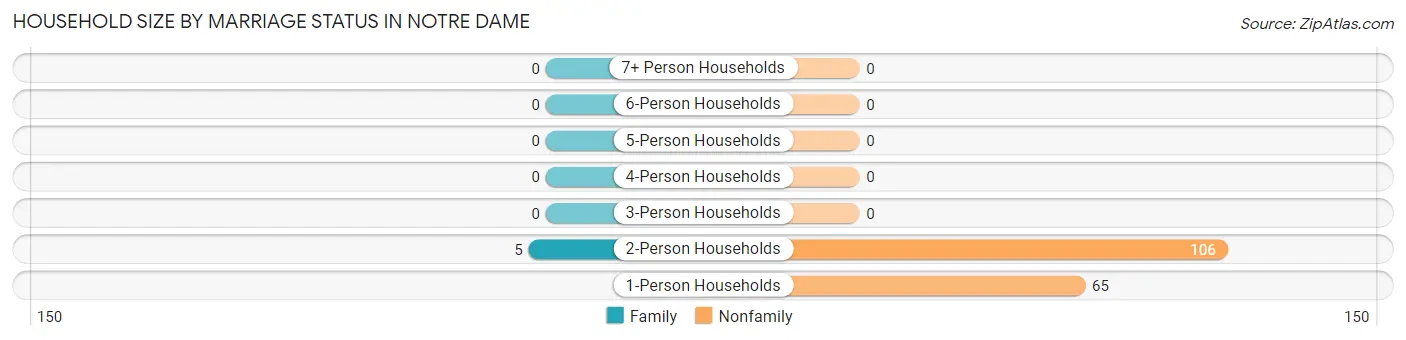
Household Size by Marriage Status in Notre Dame
Out of a total of 176 households in Notre Dame, 5 (2.8%) are family households, while 171 (97.2%) are nonfamily households. The most numerous type of family households are 2-person households, comprising 5, and the most common type of nonfamily households are 2-person households, comprising 106.
| Household Size | Family Households | Nonfamily Households |
| 1-Person Households | - | 65 (36.9%) |
| 2-Person Households | 5 (2.8%) | 106 (60.2%) |
| 3-Person Households | 0 (0.0%) | 0 (0.0%) |
| 4-Person Households | 0 (0.0%) | 0 (0.0%) |
| 5-Person Households | 0 (0.0%) | 0 (0.0%) |
| 6-Person Households | 0 (0.0%) | 0 (0.0%) |
| 7+ Person Households | 0 (0.0%) | 0 (0.0%) |
| Total | 5 (2.8%) | 171 (97.2%) |
Female Fertility in Notre Dame
Fertility by Age in Notre Dame
| Age Bracket | Women with Births | Births / 1,000 Women |
| 15 to 19 years | 0 (0.0%) | 0.0 |
| 20 to 34 years | 0 (0.0%) | 0.0 |
| 35 to 50 years | 0 (0.0%) | 0.0 |
| Total | 0 (0.0%) | 0.0 |
Fertility by Age by Marriage Status in Notre Dame
| Age Bracket | Married | Unmarried |
| 15 to 19 years | 0 (0.0%) | 0 (0.0%) |
| 20 to 34 years | 0 (0.0%) | 0 (0.0%) |
| 35 to 50 years | 0 (0.0%) | 0 (0.0%) |
| Total | 0 (0.0%) | 0 (0.0%) |
Fertility by Education in Notre Dame
| Educational Attainment | Women with Births | Births / 1,000 Women |
| Less than High School | 0 (0.0%) | 0.0 |
| High School Diploma | 0 (0.0%) | 0.0 |
| College or Associate's Degree | 0 (0.0%) | 0.0 |
| Bachelor's Degree | 0 (0.0%) | 0.0 |
| Graduate Degree | 0 (0.0%) | 0.0 |
| Total | 0 (0.0%) | 0.0 |
Fertility by Education by Marriage Status in Notre Dame
| Educational Attainment | Married | Unmarried |
| Less than High School | 0 (0.0%) | 0 (0.0%) |
| High School Diploma | 0 (0.0%) | 0 (0.0%) |
| College or Associate's Degree | 0 (0.0%) | 0 (0.0%) |
| Bachelor's Degree | 0 (0.0%) | 0 (0.0%) |
| Graduate Degree | 0 (0.0%) | 0 (0.0%) |
| Total | 0 (0.0%) | 0 (0.0%) |
Income in Notre Dame
Income Overview in Notre Dame
| Characteristic | Number | Measure |
| Per Capita Income | 6,479 | $6,130 |
| Median Family Income | 5 | $0 |
| Mean Family Income | 5 | $0 |
| Median Household Income | 176 | $0 |
| Mean Household Income | 176 | $26,052 |
| Income Deficit | 5 | $0 |
| Wage / Income Gap (%) | 6,479 | 25.38% |
| Wage / Income Gap ($) | 6,479 | 74.62¢ per $1 |
| Gini / Inequality Index | 6,479 | 0.59 |
Earnings by Sex in Notre Dame
Average Earnings in Notre Dame are $4,057, $4,733 for men and $3,532 for women, a difference of 25.4%.
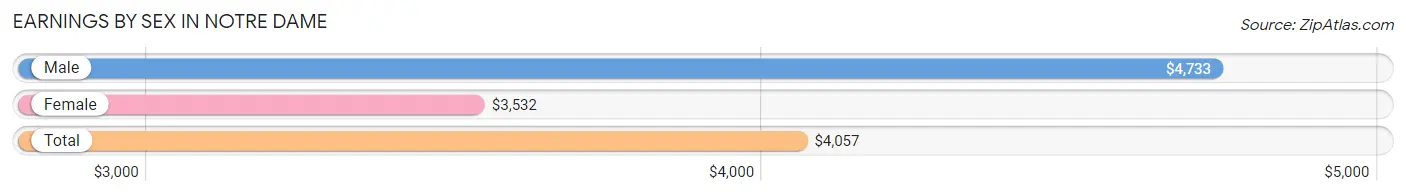
| Sex | Number | Average Earnings |
| Male | 2,762 (51.6%) | $4,733 |
| Female | 2,592 (48.4%) | $3,532 |
| Total | 5,354 (100.0%) | $4,057 |
Earnings by Sex by Income Bracket in Notre Dame
The most common earnings brackets in Notre Dame are $2,500 to $4,999 for men (739 | 26.8%) and $2,500 to $4,999 for women (950 | 36.6%).
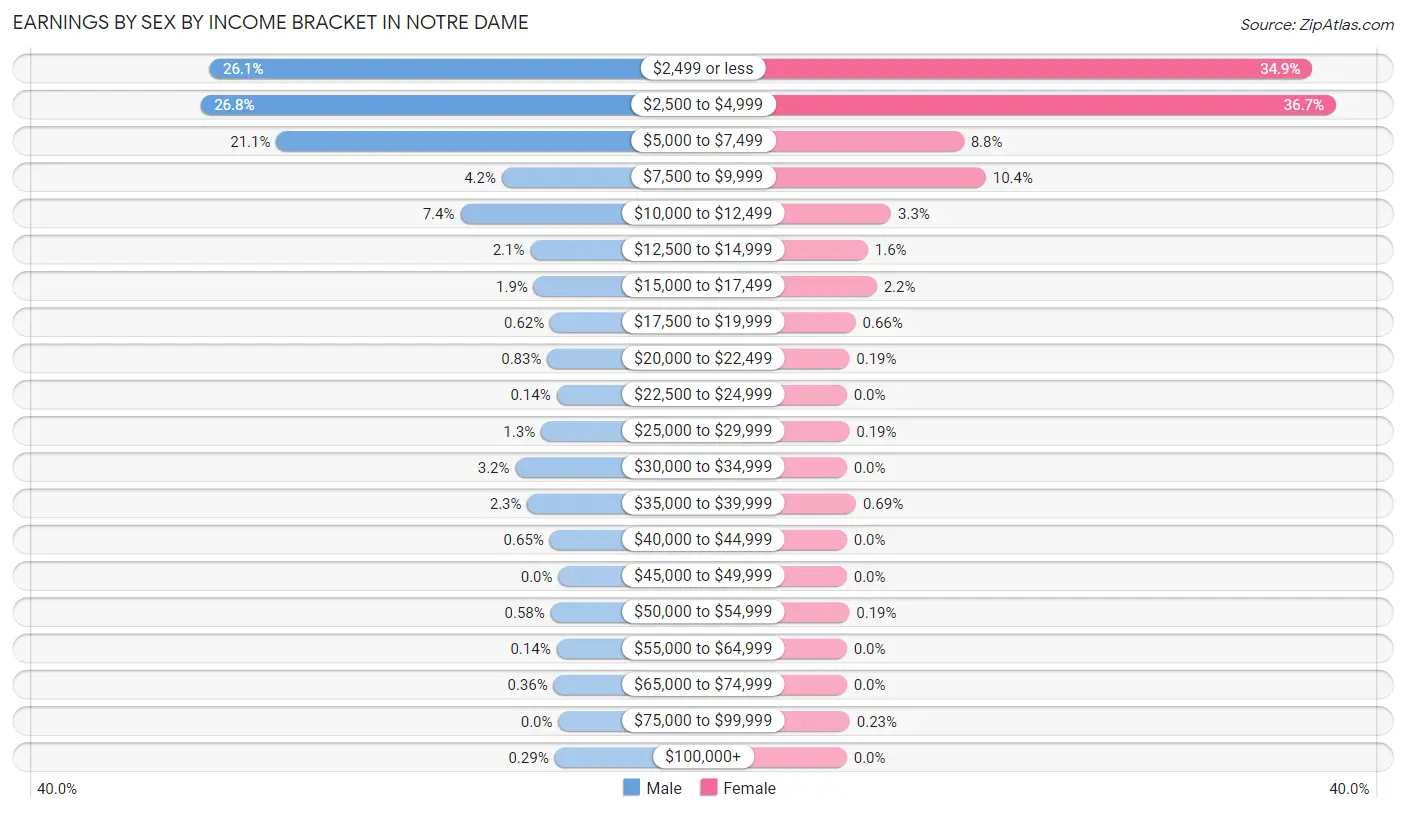
| Income | Male | Female |
| $2,499 or less | 721 (26.1%) | 904 (34.9%) |
| $2,500 to $4,999 | 739 (26.8%) | 950 (36.6%) |
| $5,000 to $7,499 | 584 (21.1%) | 227 (8.8%) |
| $7,500 to $9,999 | 117 (4.2%) | 270 (10.4%) |
| $10,000 to $12,499 | 203 (7.3%) | 86 (3.3%) |
| $12,500 to $14,999 | 58 (2.1%) | 41 (1.6%) |
| $15,000 to $17,499 | 51 (1.8%) | 58 (2.2%) |
| $17,500 to $19,999 | 17 (0.6%) | 17 (0.7%) |
| $20,000 to $22,499 | 23 (0.8%) | 5 (0.2%) |
| $22,500 to $24,999 | 4 (0.1%) | 0 (0.0%) |
| $25,000 to $29,999 | 36 (1.3%) | 5 (0.2%) |
| $30,000 to $34,999 | 89 (3.2%) | 0 (0.0%) |
| $35,000 to $39,999 | 64 (2.3%) | 18 (0.7%) |
| $40,000 to $44,999 | 18 (0.6%) | 0 (0.0%) |
| $45,000 to $49,999 | 0 (0.0%) | 0 (0.0%) |
| $50,000 to $54,999 | 16 (0.6%) | 5 (0.2%) |
| $55,000 to $64,999 | 4 (0.1%) | 0 (0.0%) |
| $65,000 to $74,999 | 10 (0.4%) | 0 (0.0%) |
| $75,000 to $99,999 | 0 (0.0%) | 6 (0.2%) |
| $100,000+ | 8 (0.3%) | 0 (0.0%) |
| Total | 2,762 (100.0%) | 2,592 (100.0%) |
Earnings by Sex by Educational Attainment in Notre Dame
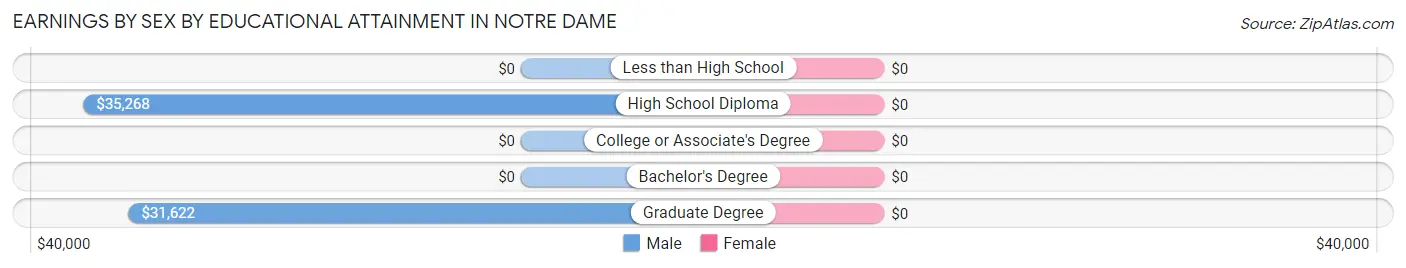
| Educational Attainment | Male Income | Female Income |
| Less than High School | - | - |
| High School Diploma | $35,268 | $0 |
| College or Associate's Degree | - | - |
| Bachelor's Degree | - | - |
| Graduate Degree | $31,622 | $0 |
| Total | $30,260 | $0 |
Family Income in Notre Dame
Family Income Brackets in Notre Dame
According to the Notre Dame family income data, there are 5 families falling into the $10,000 to $14,999 income range, which is the most common income bracket and makes up 100.0% of all families.
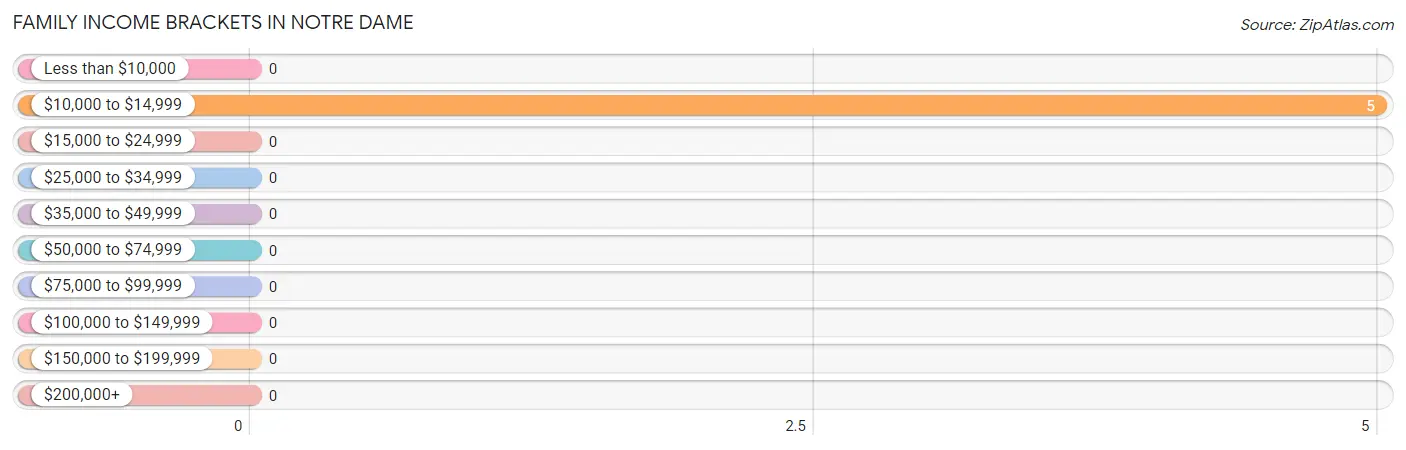
| Income Bracket | # Families | % Families |
| Less than $10,000 | 0 | 0.0% |
| $10,000 to $14,999 | 5 | 100.0% |
| $15,000 to $24,999 | 0 | 0.0% |
| $25,000 to $34,999 | 0 | 0.0% |
| $35,000 to $49,999 | 0 | 0.0% |
| $50,000 to $74,999 | 0 | 0.0% |
| $75,000 to $99,999 | 0 | 0.0% |
| $100,000 to $149,999 | 0 | 0.0% |
| $150,000 to $199,999 | 0 | 0.0% |
| $200,000+ | 0 | 0.0% |
Family Income by Famaliy Size in Notre Dame
| Income Bracket | # Families | Median Income |
| 2-Person Families | 5 (100.0%) | $0 |
| 3-Person Families | 0 (0.0%) | $0 |
| 4-Person Families | 0 (0.0%) | $0 |
| 5-Person Families | 0 (0.0%) | $0 |
| 6-Person Families | 0 (0.0%) | $0 |
| 7+ Person Families | 0 (0.0%) | $0 |
| Total | 5 (100.0%) | $0 |
Family Income by Number of Earners in Notre Dame
| Number of Earners | # Families | Median Income |
| No Earners | 5 (100.0%) | $0 |
| 1 Earner | 0 (0.0%) | $0 |
| 2 Earners | 0 (0.0%) | $0 |
| 3+ Earners | 0 (0.0%) | $0 |
| Total | 5 (100.0%) | $0 |
Household Income in Notre Dame
Household Income Brackets in Notre Dame
With 80 households falling in the category, the less than $10,000 income range is the most frequent in Notre Dame, accounting for 45.5% of all households.
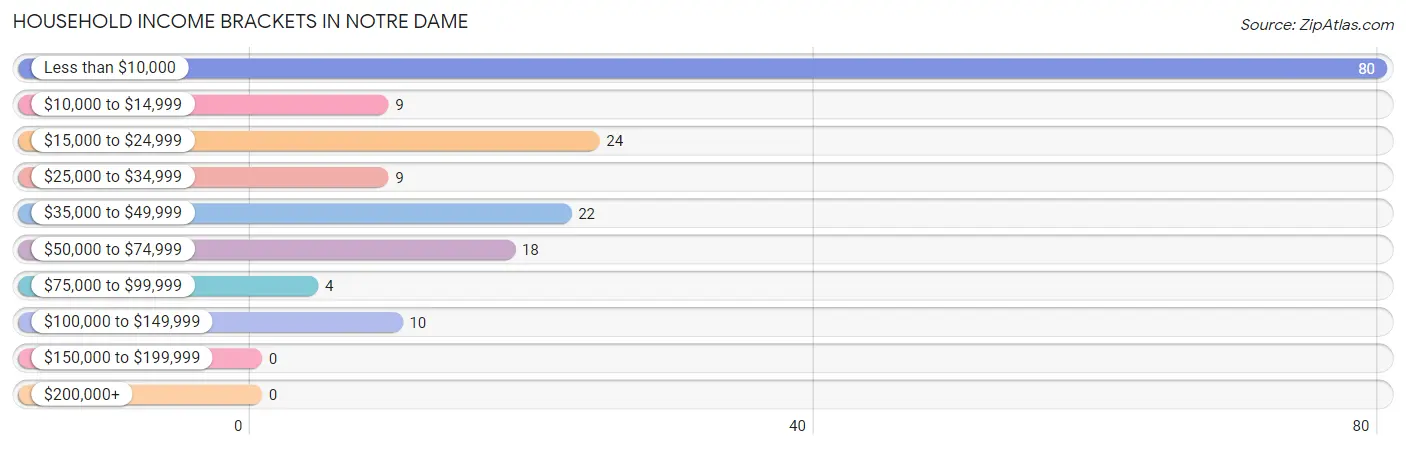
| Income Bracket | # Households | % Households |
| Less than $10,000 | 80 | 45.5% |
| $10,000 to $14,999 | 9 | 5.1% |
| $15,000 to $24,999 | 24 | 13.6% |
| $25,000 to $34,999 | 9 | 5.1% |
| $35,000 to $49,999 | 22 | 12.5% |
| $50,000 to $74,999 | 18 | 10.2% |
| $75,000 to $99,999 | 4 | 2.3% |
| $100,000 to $149,999 | 10 | 5.7% |
| $150,000 to $199,999 | 0 | 0.0% |
| $200,000+ | 0 | 0.0% |
Household Income by Householder Age in Notre Dame
The median household income in Notre Dame is $0, with the highest median household income of $18,088 found in the 25 to 44 years age bracket for the primary householder. A total of 64 households (36.4%) fall into this category. Meanwhile, the 15 to 24 years age bracket for the primary householder has the lowest median household income of $0, with 106 households (60.2%) in this group.
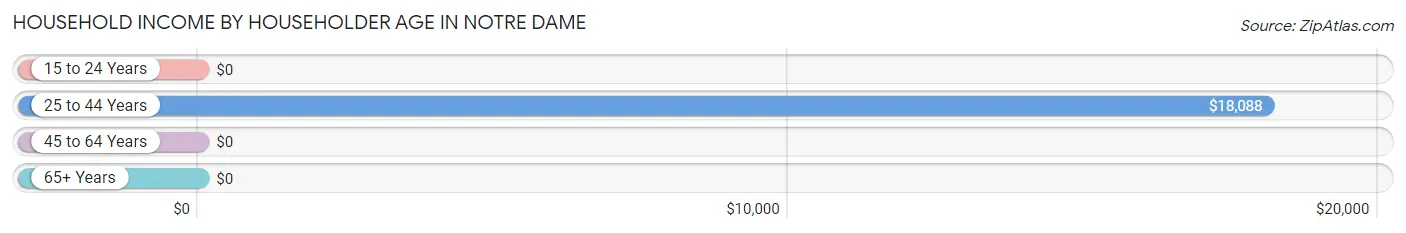
| Income Bracket | # Households | Median Income |
| 15 to 24 Years | 106 (60.2%) | $0 |
| 25 to 44 Years | 64 (36.4%) | $18,088 |
| 45 to 64 Years | 5 (2.8%) | $0 |
| 65+ Years | 1 (0.6%) | $0 |
| Total | 176 (100.0%) | $0 |
Poverty in Notre Dame
Income Below Poverty by Sex and Age in Notre Dame
With 56.7% poverty level for males and 86.7% for females among the residents of Notre Dame, 45 to 54 year old males and 16 and 17 year old females are the most vulnerable to poverty, with 26 males (83.9%) and 4 females (100.0%) in their respective age groups living below the poverty level.
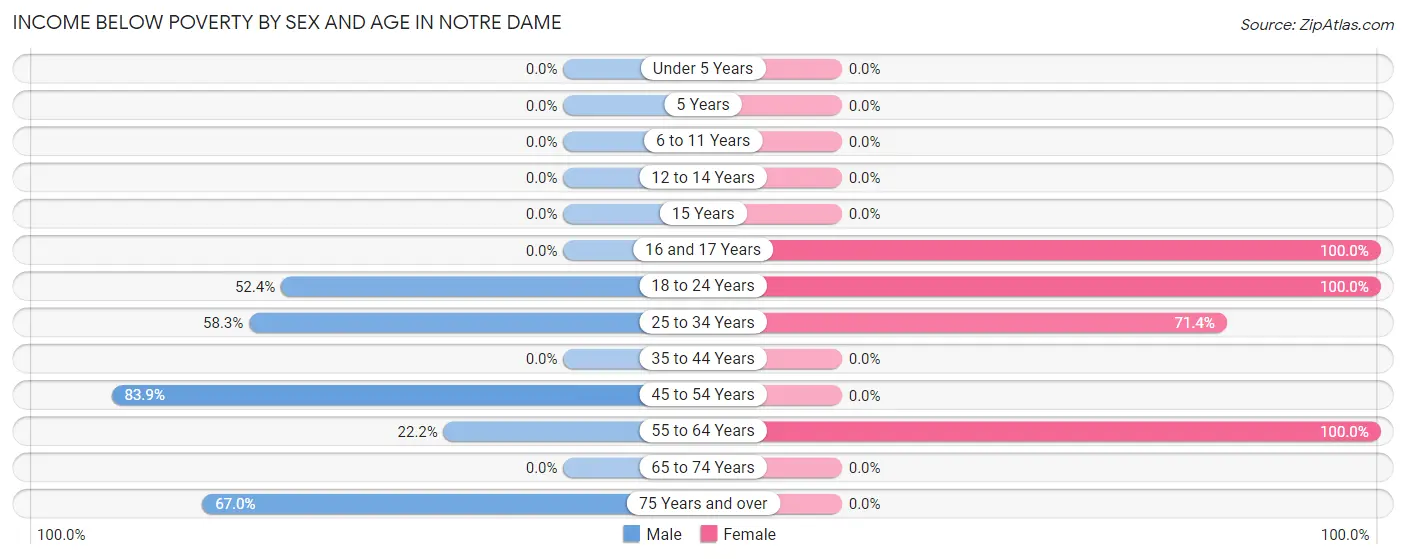
| Age Bracket | Male | Female |
| Under 5 Years | 0 (0.0%) | 0 (0.0%) |
| 5 Years | 0 (0.0%) | 0 (0.0%) |
| 6 to 11 Years | 0 (0.0%) | 0 (0.0%) |
| 12 to 14 Years | 0 (0.0%) | 0 (0.0%) |
| 15 Years | 0 (0.0%) | 0 (0.0%) |
| 16 and 17 Years | 0 (0.0%) | 4 (100.0%) |
| 18 to 24 Years | 76 (52.4%) | 15 (100.0%) |
| 25 to 34 Years | 56 (58.3%) | 15 (71.4%) |
| 35 to 44 Years | 0 (0.0%) | 0 (0.0%) |
| 45 to 54 Years | 26 (83.9%) | 0 (0.0%) |
| 55 to 64 Years | 4 (22.2%) | 5 (100.0%) |
| 65 to 74 Years | 0 (0.0%) | 0 (0.0%) |
| 75 Years and over | 61 (67.0%) | 0 (0.0%) |
| Total | 223 (56.7%) | 39 (86.7%) |
Income Above Poverty by Sex and Age in Notre Dame
According to the poverty statistics in Notre Dame, males aged 35 to 44 years and females aged 25 to 34 years are the age groups that are most secure financially, with 100.0% of males and 28.6% of females in these age groups living above the poverty line.
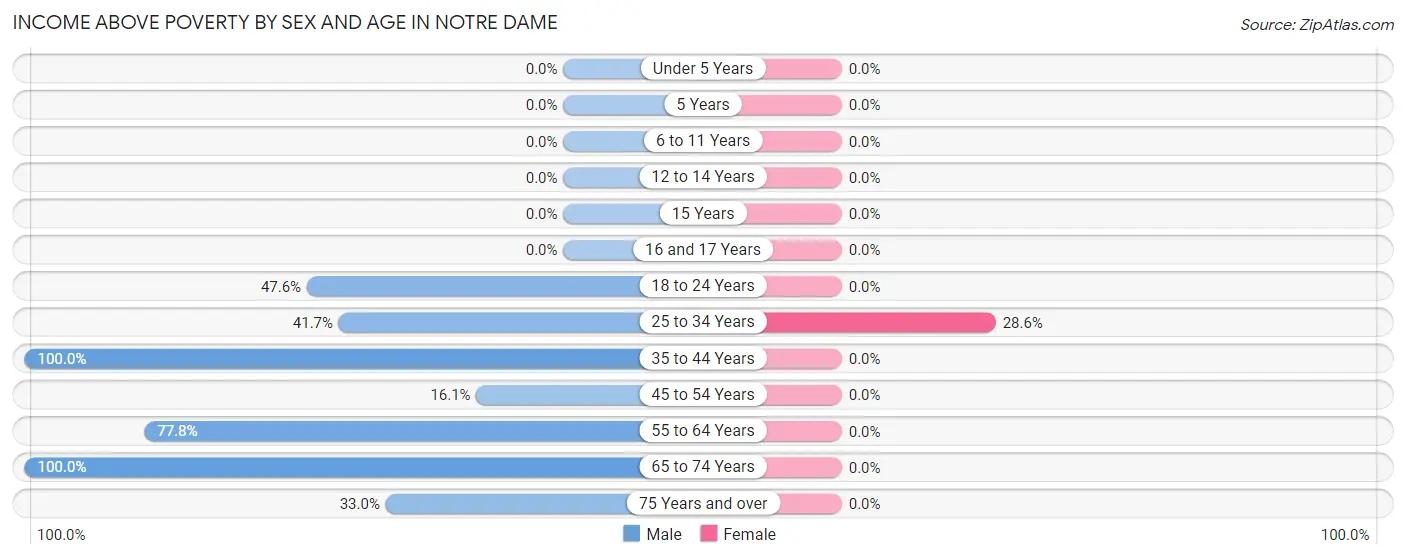
| Age Bracket | Male | Female |
| Under 5 Years | 0 (0.0%) | 0 (0.0%) |
| 5 Years | 0 (0.0%) | 0 (0.0%) |
| 6 to 11 Years | 0 (0.0%) | 0 (0.0%) |
| 12 to 14 Years | 0 (0.0%) | 0 (0.0%) |
| 15 Years | 0 (0.0%) | 0 (0.0%) |
| 16 and 17 Years | 0 (0.0%) | 0 (0.0%) |
| 18 to 24 Years | 69 (47.6%) | 0 (0.0%) |
| 25 to 34 Years | 40 (41.7%) | 6 (28.6%) |
| 35 to 44 Years | 11 (100.0%) | 0 (0.0%) |
| 45 to 54 Years | 5 (16.1%) | 0 (0.0%) |
| 55 to 64 Years | 14 (77.8%) | 0 (0.0%) |
| 65 to 74 Years | 1 (100.0%) | 0 (0.0%) |
| 75 Years and over | 30 (33.0%) | 0 (0.0%) |
| Total | 170 (43.3%) | 6 (13.3%) |
Income Below Poverty Among Married-Couple Families in Notre Dame
| Children | Above Poverty | Below Poverty |
| No Children | 0 (0.0%) | 0 (0.0%) |
| 1 or 2 Children | 0 (0.0%) | 0 (0.0%) |
| 3 or 4 Children | 0 (0.0%) | 0 (0.0%) |
| 5 or more Children | 0 (0.0%) | 0 (0.0%) |
| Total | 0 (0.0%) | 0 (0.0%) |
Income Below Poverty Among Single-Parent Households in Notre Dame
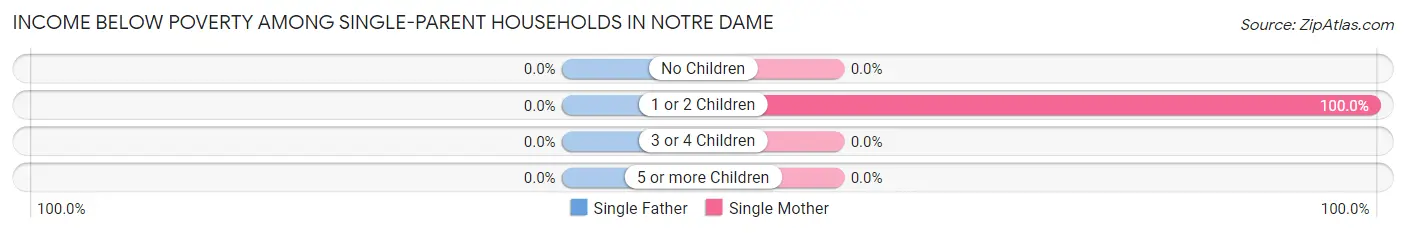
| Children | Single Father | Single Mother |
| No Children | 0 (0.0%) | 0 (0.0%) |
| 1 or 2 Children | 0 (0.0%) | 5 (100.0%) |
| 3 or 4 Children | 0 (0.0%) | 0 (0.0%) |
| 5 or more Children | 0 (0.0%) | 0 (0.0%) |
| Total | 0 (0.0%) | 5 (100.0%) |
Income Below Poverty Among Married-Couple vs Single-Parent Households in Notre Dame
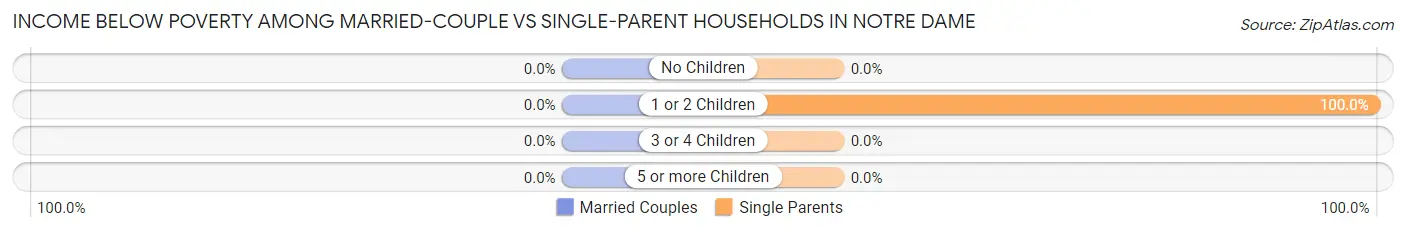
| Children | Married-Couple Families | Single-Parent Households |
| No Children | 0 (0.0%) | 0 (0.0%) |
| 1 or 2 Children | 0 (0.0%) | 5 (100.0%) |
| 3 or 4 Children | 0 (0.0%) | 0 (0.0%) |
| 5 or more Children | 0 (0.0%) | 0 (0.0%) |
| Total | 0 (0.0%) | 5 (100.0%) |
Employment Characteristics in Notre Dame
Employment by Class of Employer in Notre Dame
Among the 2,867 employed individuals in Notre Dame, private company employees (1,635 | 57.0%), not-for-profit organizations (984 | 34.3%), and state government employees (121 | 4.2%) make up the most common classes of employment.
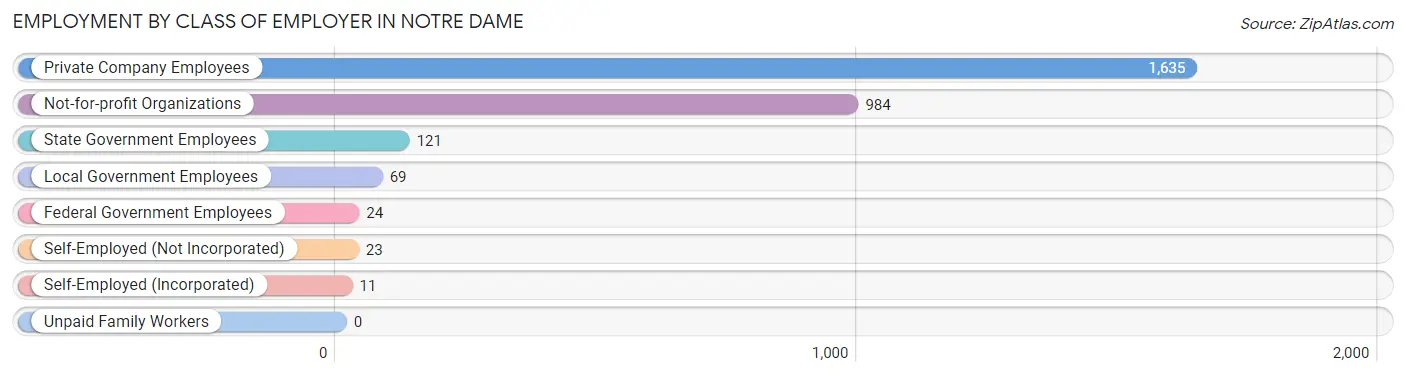
| Employer Class | # Employees | % Employees |
| Private Company Employees | 1,635 | 57.0% |
| Self-Employed (Incorporated) | 11 | 0.4% |
| Self-Employed (Not Incorporated) | 23 | 0.8% |
| Not-for-profit Organizations | 984 | 34.3% |
| Local Government Employees | 69 | 2.4% |
| State Government Employees | 121 | 4.2% |
| Federal Government Employees | 24 | 0.8% |
| Unpaid Family Workers | 0 | 0.0% |
| Total | 2,867 | 100.0% |
Employment Status by Age in Notre Dame
According to the labor force statistics for Notre Dame, out of the total population over 16 years of age (6,479), 46.4% or 3,006 individuals are in the labor force, with 0.7% or 21 of them unemployed. The age group with the highest labor force participation rate is 35 to 44 years, with 100.0% or 12 individuals in the labor force. Within the labor force, the 60 to 64 years age range has the highest percentage of unemployed individuals, with 6.2% or 4 of them being unemployed.
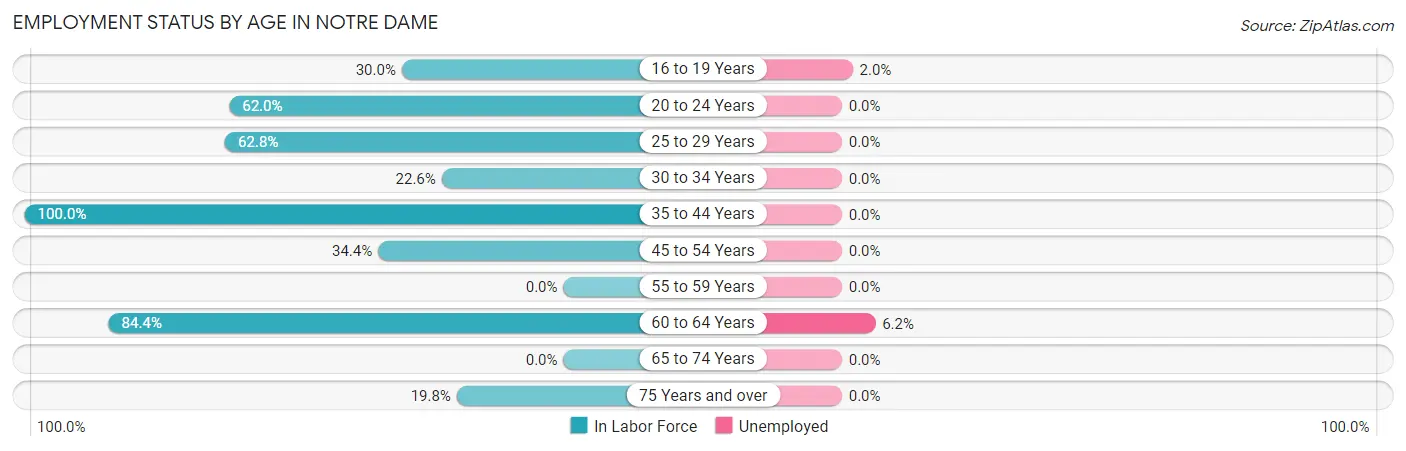
| Age Bracket | In Labor Force | Unemployed |
| 16 to 19 Years | 913 (30.0%) | 18 (2.0%) |
| 20 to 24 Years | 1,905 (62.0%) | 0 (0.0%) |
| 25 to 29 Years | 76 (62.8%) | 0 (0.0%) |
| 30 to 34 Years | 7 (22.6%) | 0 (0.0%) |
| 35 to 44 Years | 12 (100.0%) | 0 (0.0%) |
| 45 to 54 Years | 11 (34.4%) | 0 (0.0%) |
| 55 to 59 Years | 0 (0.0%) | 0 (0.0%) |
| 60 to 64 Years | 65 (84.4%) | 4 (6.2%) |
| 65 to 74 Years | 0 (0.0%) | 0 (0.0%) |
| 75 Years and over | 18 (19.8%) | 0 (0.0%) |
| Total | 3,006 (46.4%) | 21 (0.7%) |
Employment Status by Educational Attainment in Notre Dame
According to labor force statistics for Notre Dame, 62.6% of individuals (171) out of the total population between 25 and 64 years of age (273) are in the labor force, with 2.3% or 4 of them being unemployed. The group with the highest labor force participation rate are those with the educational attainment of less than high school, with 100.0% or 5 individuals in the labor force. Within the labor force, individuals with bachelor's degree or higher education have the highest percentage of unemployment, with 2.9% or 4 of them being unemployed.
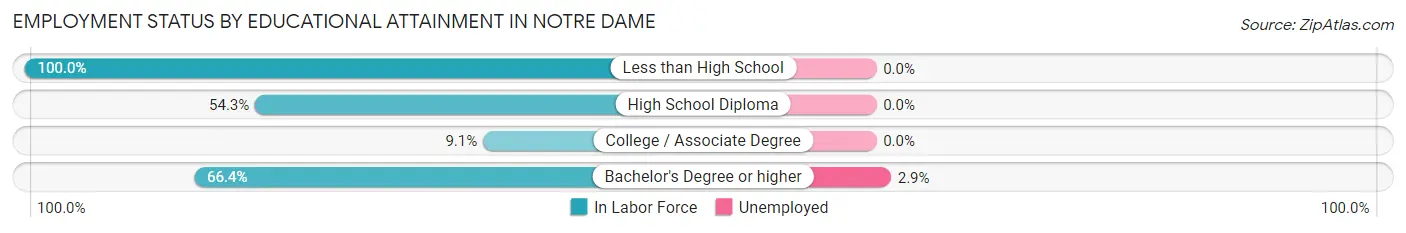
| Educational Attainment | In Labor Force | Unemployed |
| Less than High School | 5 (100.0%) | 0 (0.0%) |
| High School Diploma | 25 (54.3%) | 0 (0.0%) |
| College / Associate Degree | 1 (9.1%) | 0 (0.0%) |
| Bachelor's Degree or higher | 140 (66.4%) | 6 (2.9%) |
| Total | 171 (62.6%) | 6 (2.3%) |
Employment Occupations by Sex in Notre Dame
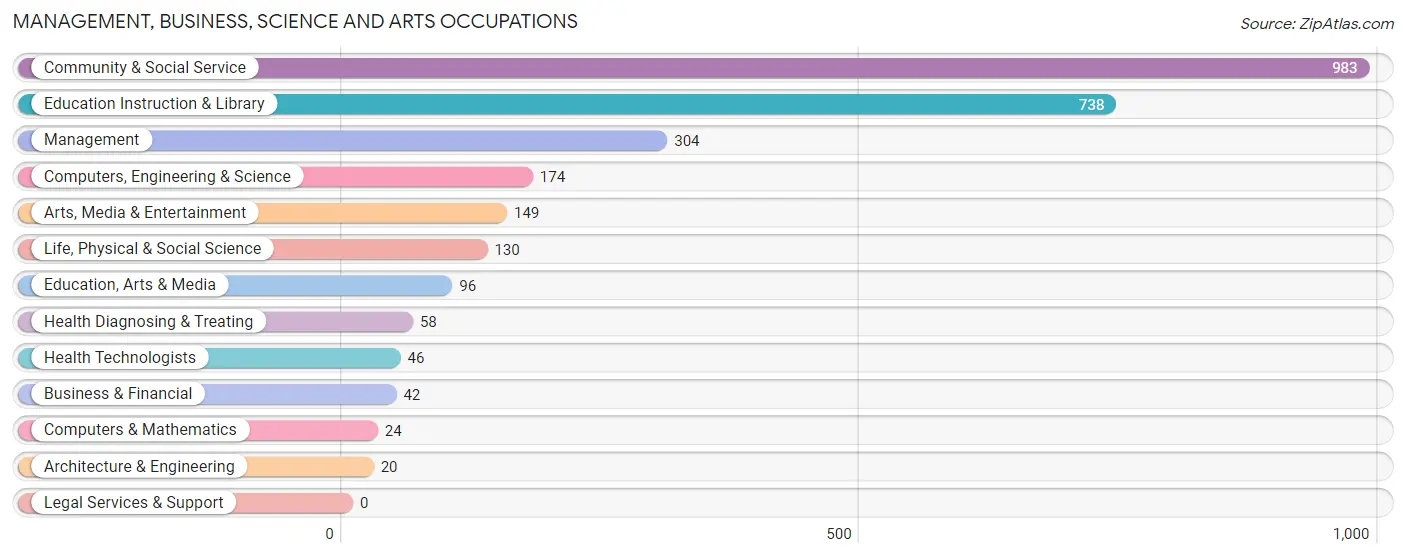
Management, Business, Science and Arts Occupations
The most common Management, Business, Science and Arts occupations in Notre Dame are Community & Social Service (983 | 33.2%), Education Instruction & Library (738 | 24.9%), Management (304 | 10.3%), Computers, Engineering & Science (174 | 5.9%), and Arts, Media & Entertainment (149 | 5.0%).
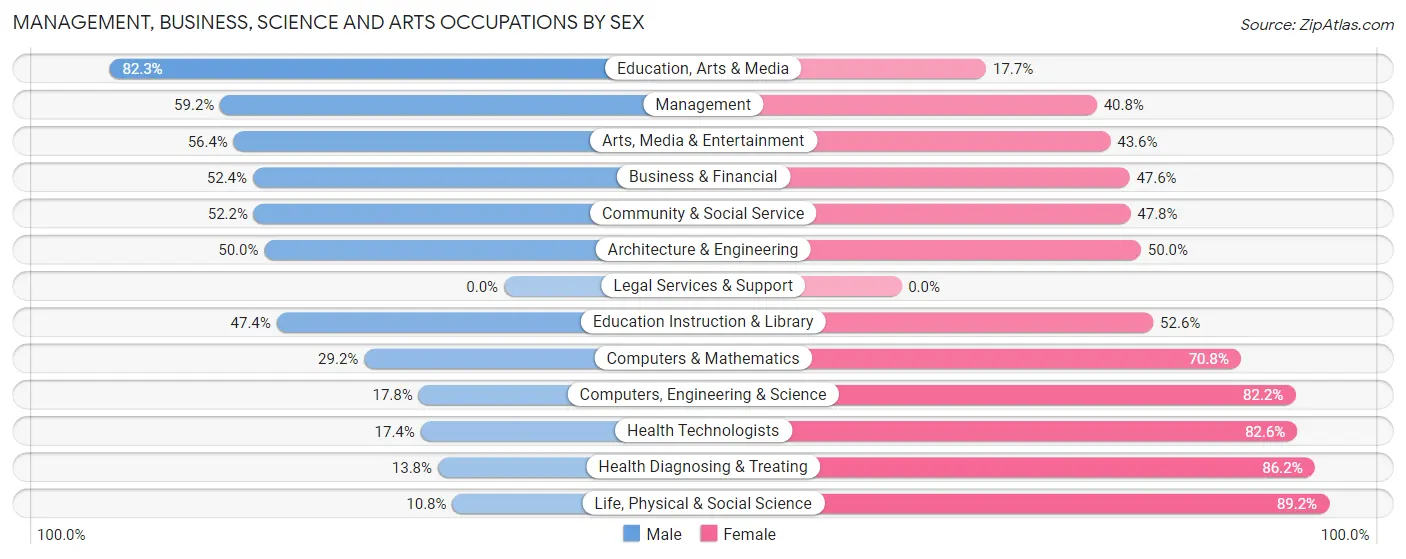
Management, Business, Science and Arts Occupations by Sex
Within the Management, Business, Science and Arts occupations in Notre Dame, the most male-oriented occupations are Education, Arts & Media (82.3%), Management (59.2%), and Arts, Media & Entertainment (56.4%), while the most female-oriented occupations are Life, Physical & Social Science (89.2%), Health Diagnosing & Treating (86.2%), and Health Technologists (82.6%).
| Occupation | Male | Female |
| Management | 180 (59.2%) | 124 (40.8%) |
| Business & Financial | 22 (52.4%) | 20 (47.6%) |
| Computers, Engineering & Science | 31 (17.8%) | 143 (82.2%) |
| Computers & Mathematics | 7 (29.2%) | 17 (70.8%) |
| Architecture & Engineering | 10 (50.0%) | 10 (50.0%) |
| Life, Physical & Social Science | 14 (10.8%) | 116 (89.2%) |
| Community & Social Service | 513 (52.2%) | 470 (47.8%) |
| Education, Arts & Media | 79 (82.3%) | 17 (17.7%) |
| Legal Services & Support | 0 (0.0%) | 0 (0.0%) |
| Education Instruction & Library | 350 (47.4%) | 388 (52.6%) |
| Arts, Media & Entertainment | 84 (56.4%) | 65 (43.6%) |
| Health Diagnosing & Treating | 8 (13.8%) | 50 (86.2%) |
| Health Technologists | 8 (17.4%) | 38 (82.6%) |
| Total (Category) | 754 (48.3%) | 807 (51.7%) |
| Total (Overall) | 1,472 (49.7%) | 1,488 (50.3%) |
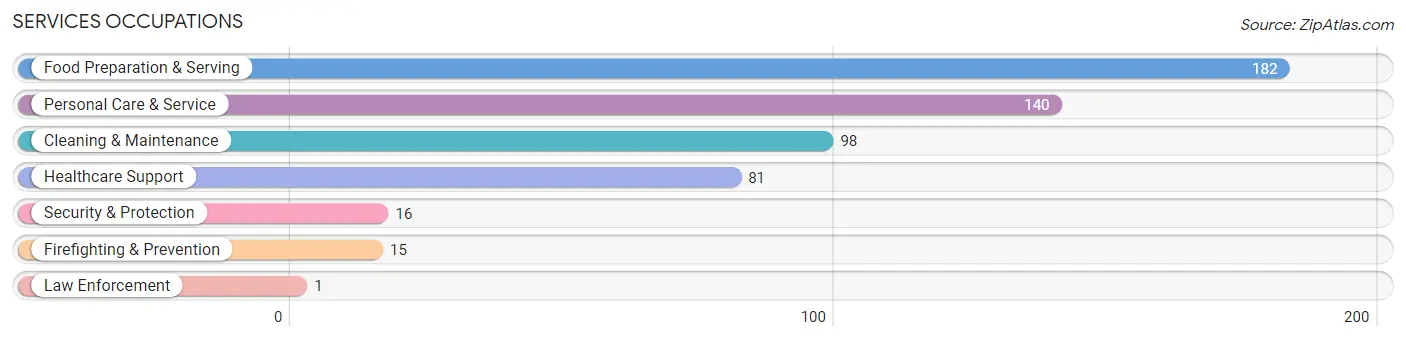
Services Occupations
The most common Services occupations in Notre Dame are Food Preparation & Serving (182 | 6.1%), Personal Care & Service (140 | 4.7%), Cleaning & Maintenance (98 | 3.3%), Healthcare Support (81 | 2.7%), and Security & Protection (16 | 0.5%).
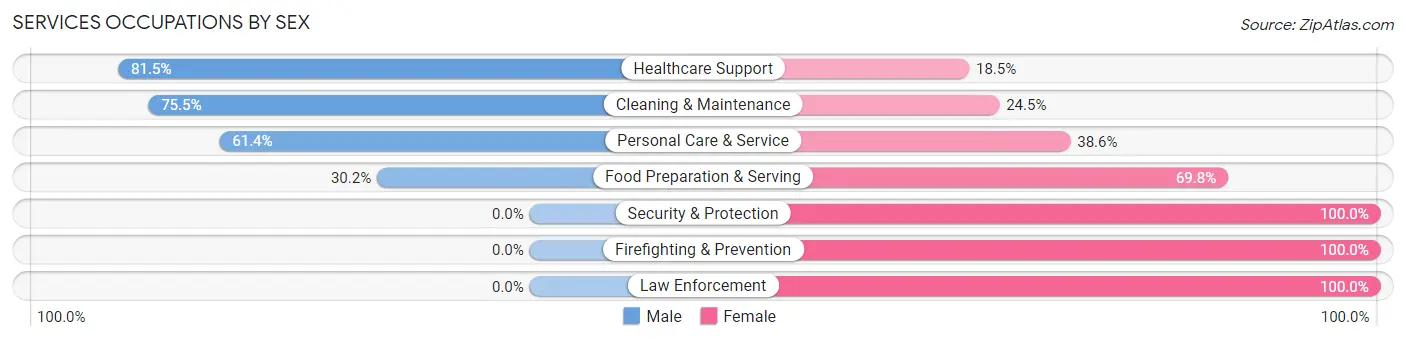
Services Occupations by Sex
Within the Services occupations in Notre Dame, the most male-oriented occupations are Healthcare Support (81.5%), Cleaning & Maintenance (75.5%), and Personal Care & Service (61.4%), while the most female-oriented occupations are Security & Protection (100.0%), Firefighting & Prevention (100.0%), and Law Enforcement (100.0%).
| Occupation | Male | Female |
| Healthcare Support | 66 (81.5%) | 15 (18.5%) |
| Security & Protection | 0 (0.0%) | 16 (100.0%) |
| Firefighting & Prevention | 0 (0.0%) | 15 (100.0%) |
| Law Enforcement | 0 (0.0%) | 1 (100.0%) |
| Food Preparation & Serving | 55 (30.2%) | 127 (69.8%) |
| Cleaning & Maintenance | 74 (75.5%) | 24 (24.5%) |
| Personal Care & Service | 86 (61.4%) | 54 (38.6%) |
| Total (Category) | 281 (54.3%) | 236 (45.7%) |
| Total (Overall) | 1,472 (49.7%) | 1,488 (50.3%) |
Sales and Office Occupations
The most common Sales and Office occupations in Notre Dame are Office & Administration (500 | 16.9%), and Sales & Related (218 | 7.4%).
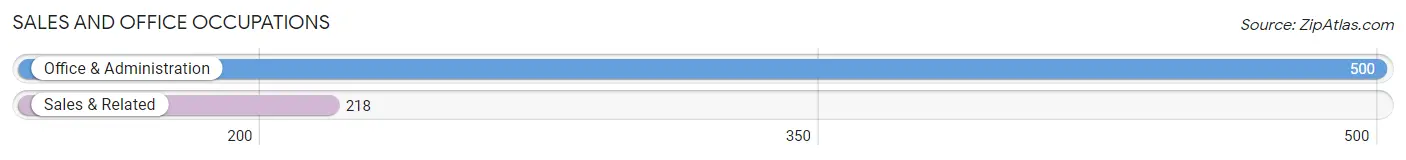
Sales and Office Occupations by Sex
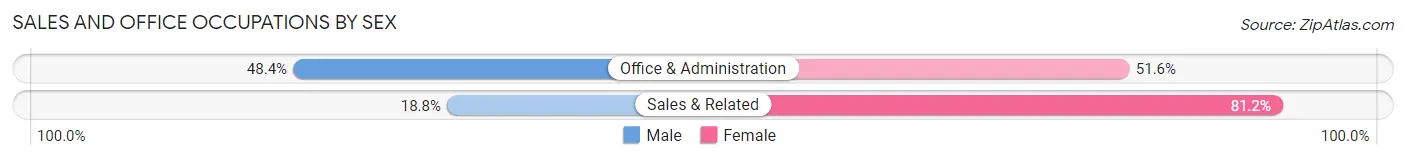
| Occupation | Male | Female |
| Sales & Related | 41 (18.8%) | 177 (81.2%) |
| Office & Administration | 242 (48.4%) | 258 (51.6%) |
| Total (Category) | 283 (39.4%) | 435 (60.6%) |
| Total (Overall) | 1,472 (49.7%) | 1,488 (50.3%) |
Natural Resources, Construction and Maintenance Occupations
The most common Natural Resources, Construction and Maintenance occupations in Notre Dame are Farming, Fishing & Forestry (38 | 1.3%), and Installation, Maintenance & Repair (10 | 0.3%).
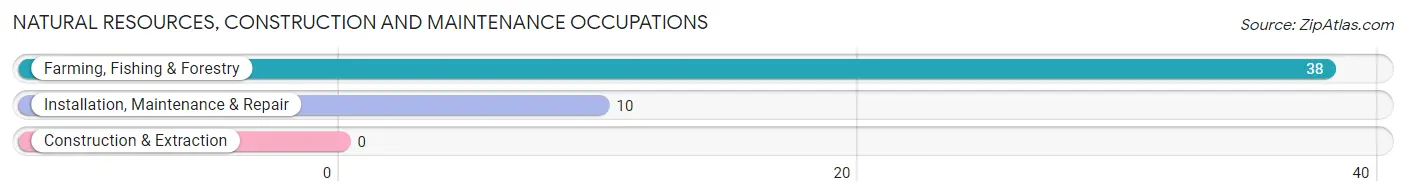
Natural Resources, Construction and Maintenance Occupations by Sex
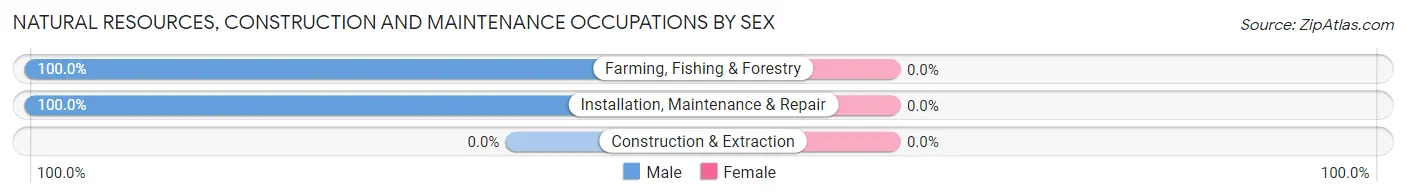
| Occupation | Male | Female |
| Farming, Fishing & Forestry | 38 (100.0%) | 0 (0.0%) |
| Construction & Extraction | 0 (0.0%) | 0 (0.0%) |
| Installation, Maintenance & Repair | 10 (100.0%) | 0 (0.0%) |
| Total (Category) | 48 (100.0%) | 0 (0.0%) |
| Total (Overall) | 1,472 (49.7%) | 1,488 (50.3%) |
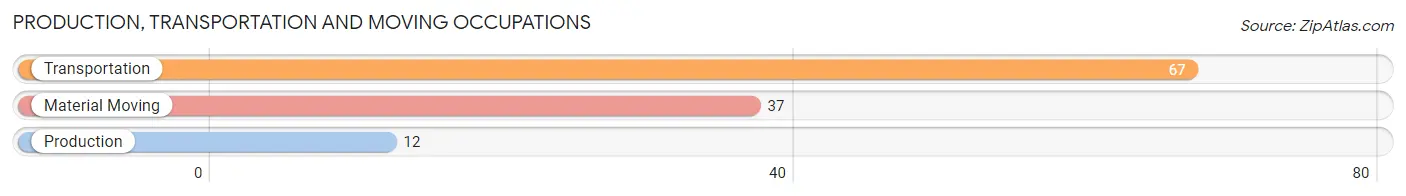
Production, Transportation and Moving Occupations
The most common Production, Transportation and Moving occupations in Notre Dame are Transportation (67 | 2.3%), Material Moving (37 | 1.3%), and Production (12 | 0.4%).
Production, Transportation and Moving Occupations by Sex
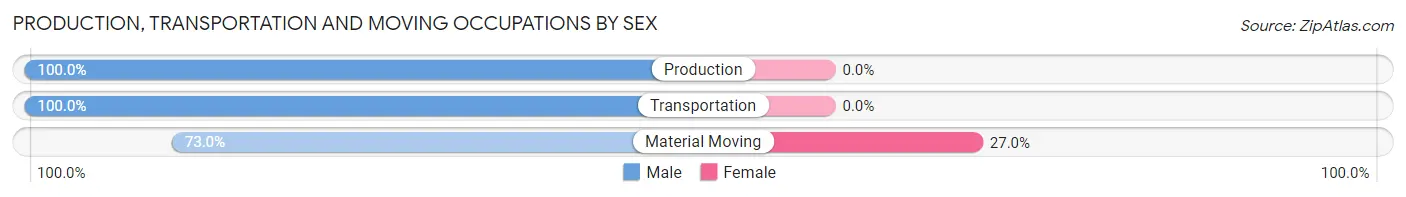
| Occupation | Male | Female |
| Production | 12 (100.0%) | 0 (0.0%) |
| Transportation | 67 (100.0%) | 0 (0.0%) |
| Material Moving | 27 (73.0%) | 10 (27.0%) |
| Total (Category) | 106 (91.4%) | 10 (8.6%) |
| Total (Overall) | 1,472 (49.7%) | 1,488 (50.3%) |
Employment Industries by Sex in Notre Dame
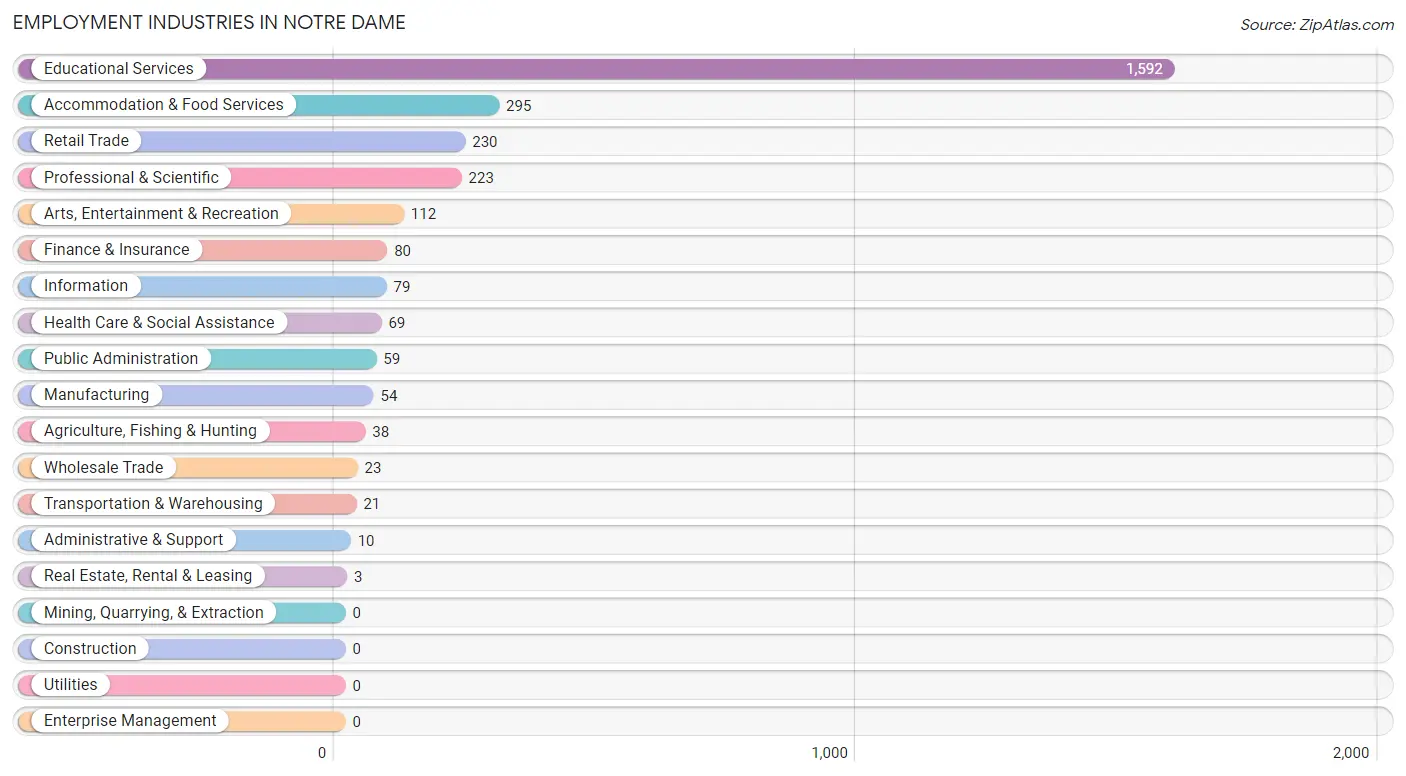
Employment Industries in Notre Dame
The major employment industries in Notre Dame include Educational Services (1,592 | 53.8%), Accommodation & Food Services (295 | 10.0%), Retail Trade (230 | 7.8%), Professional & Scientific (223 | 7.5%), and Arts, Entertainment & Recreation (112 | 3.8%).
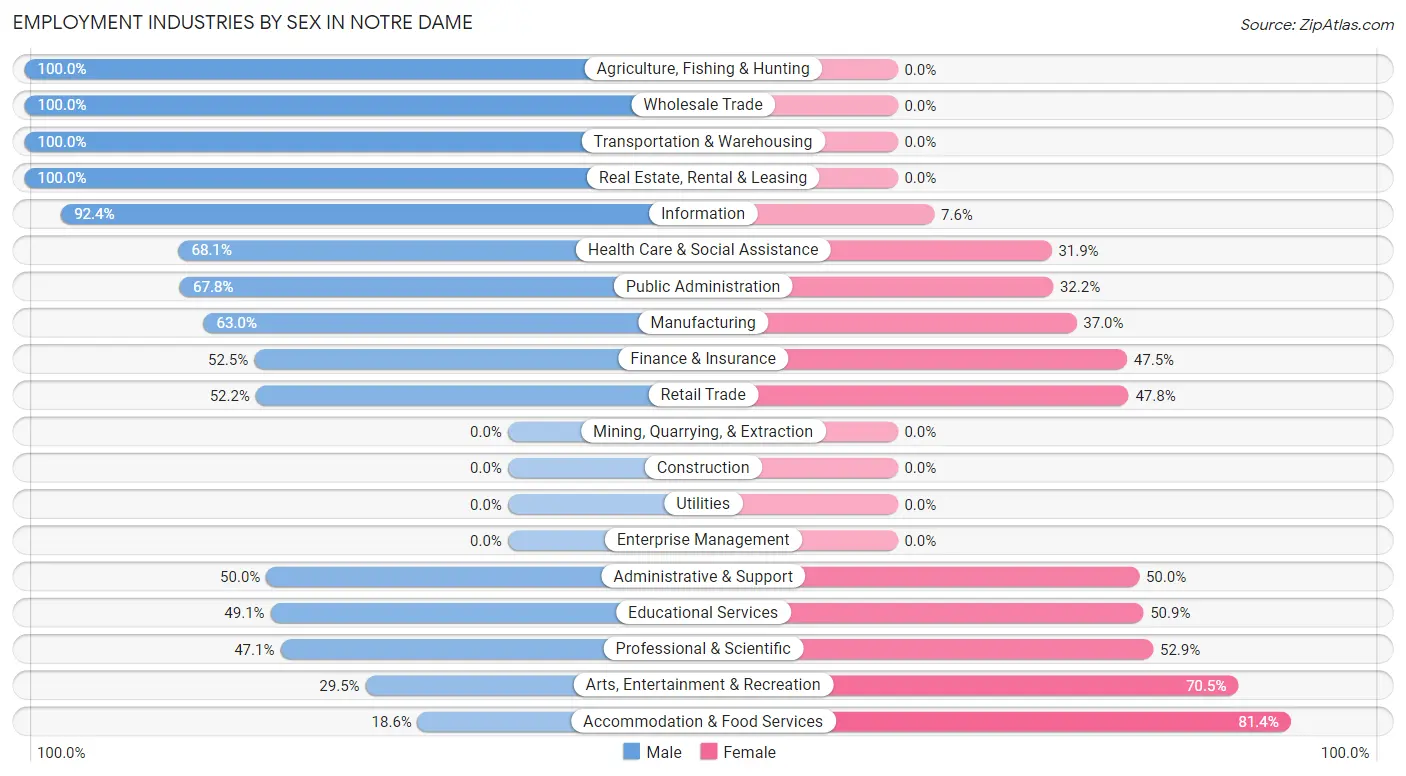
Employment Industries by Sex in Notre Dame
The Notre Dame industries that see more men than women are Agriculture, Fishing & Hunting (100.0%), Wholesale Trade (100.0%), and Transportation & Warehousing (100.0%), whereas the industries that tend to have a higher number of women are Accommodation & Food Services (81.4%), Arts, Entertainment & Recreation (70.5%), and Professional & Scientific (52.9%).
| Industry | Male | Female |
| Agriculture, Fishing & Hunting | 38 (100.0%) | 0 (0.0%) |
| Mining, Quarrying, & Extraction | 0 (0.0%) | 0 (0.0%) |
| Construction | 0 (0.0%) | 0 (0.0%) |
| Manufacturing | 34 (63.0%) | 20 (37.0%) |
| Wholesale Trade | 23 (100.0%) | 0 (0.0%) |
| Retail Trade | 120 (52.2%) | 110 (47.8%) |
| Transportation & Warehousing | 21 (100.0%) | 0 (0.0%) |
| Utilities | 0 (0.0%) | 0 (0.0%) |
| Information | 73 (92.4%) | 6 (7.6%) |
| Finance & Insurance | 42 (52.5%) | 38 (47.5%) |
| Real Estate, Rental & Leasing | 3 (100.0%) | 0 (0.0%) |
| Professional & Scientific | 105 (47.1%) | 118 (52.9%) |
| Enterprise Management | 0 (0.0%) | 0 (0.0%) |
| Administrative & Support | 5 (50.0%) | 5 (50.0%) |
| Educational Services | 782 (49.1%) | 810 (50.9%) |
| Health Care & Social Assistance | 47 (68.1%) | 22 (31.9%) |
| Arts, Entertainment & Recreation | 33 (29.5%) | 79 (70.5%) |
| Accommodation & Food Services | 55 (18.6%) | 240 (81.4%) |
| Public Administration | 40 (67.8%) | 19 (32.2%) |
| Total | 1,472 (49.7%) | 1,488 (50.3%) |
Education in Notre Dame
School Enrollment in Notre Dame
The most common levels of schooling among the 6,199 students in Notre Dame are college / undergraduate (5,907 | 95.3%), graduate / professional (281 | 4.5%), and high school (11 | 0.2%).
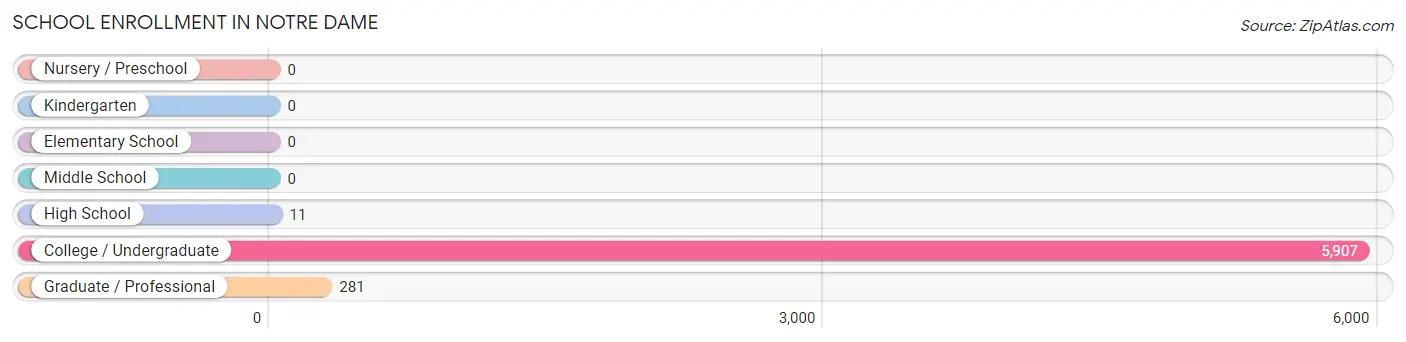
| School Level | # Students | % Students |
| Nursery / Preschool | 0 | 0.0% |
| Kindergarten | 0 | 0.0% |
| Elementary School | 0 | 0.0% |
| Middle School | 0 | 0.0% |
| High School | 11 | 0.2% |
| College / Undergraduate | 5,907 | 95.3% |
| Graduate / Professional | 281 | 4.5% |
| Total | 6,199 | 100.0% |
School Enrollment by Age by Funding Source in Notre Dame
Out of a total of 6,199 students who are enrolled in schools in Notre Dame, 6,007 (96.9%) attend a private institution, while the remaining 192 (3.1%) are enrolled in public schools. The age group of 25 to 34 year olds has the highest likelihood of being enrolled in private schools, with 118 (100.0% in the age bracket) enrolled. Conversely, the age group of 35 years and over has the lowest likelihood of being enrolled in a private school, with 9 (90.0% in the age bracket) attending a public institution.
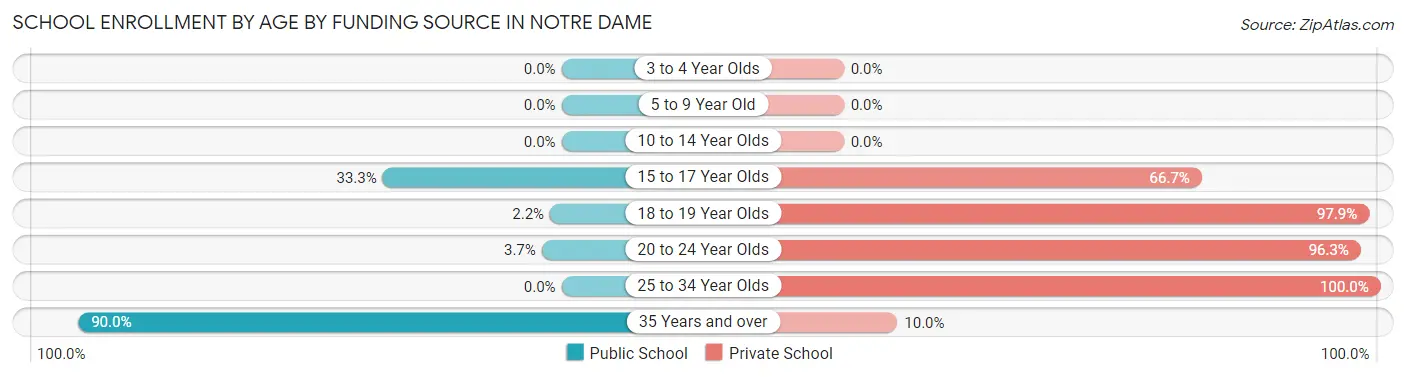
| Age Bracket | Public School | Private School |
| 3 to 4 Year Olds | 0 (0.0%) | 0 (0.0%) |
| 5 to 9 Year Old | 0 (0.0%) | 0 (0.0%) |
| 10 to 14 Year Olds | 0 (0.0%) | 0 (0.0%) |
| 15 to 17 Year Olds | 4 (33.3%) | 8 (66.7%) |
| 18 to 19 Year Olds | 65 (2.1%) | 2,965 (97.9%) |
| 20 to 24 Year Olds | 112 (3.7%) | 2,917 (96.3%) |
| 25 to 34 Year Olds | 0 (0.0%) | 118 (100.0%) |
| 35 Years and over | 9 (90.0%) | 1 (10.0%) |
| Total | 192 (3.1%) | 6,007 (96.9%) |
Educational Attainment by Field of Study in Notre Dame
Liberal arts & history (78 | 26.0%), engineering (75 | 25.0%), literature & languages (56 | 18.7%), business (22 | 7.3%), and visual & performing arts (17 | 5.7%) are the most common fields of study among 300 individuals in Notre Dame who have obtained a bachelor's degree or higher.
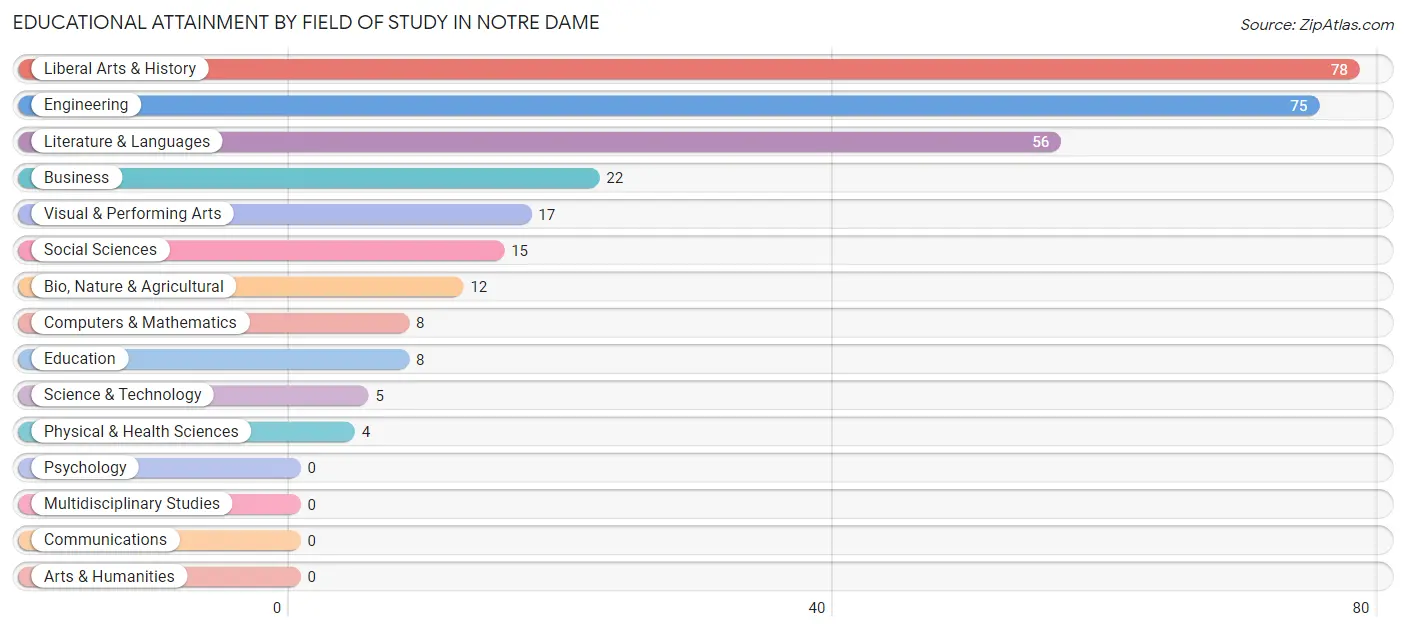
| Field of Study | # Graduates | % Graduates |
| Computers & Mathematics | 8 | 2.7% |
| Bio, Nature & Agricultural | 12 | 4.0% |
| Physical & Health Sciences | 4 | 1.3% |
| Psychology | 0 | 0.0% |
| Social Sciences | 15 | 5.0% |
| Engineering | 75 | 25.0% |
| Multidisciplinary Studies | 0 | 0.0% |
| Science & Technology | 5 | 1.7% |
| Business | 22 | 7.3% |
| Education | 8 | 2.7% |
| Literature & Languages | 56 | 18.7% |
| Liberal Arts & History | 78 | 26.0% |
| Visual & Performing Arts | 17 | 5.7% |
| Communications | 0 | 0.0% |
| Arts & Humanities | 0 | 0.0% |
| Total | 300 | 100.0% |
Transportation & Commute in Notre Dame
Vehicle Availability by Sex in Notre Dame
The most prevalent vehicle ownership categories in Notre Dame are males with 1 vehicle (87, accounting for 82.9%) and females with 1 vehicle (0, making up 580.0%).
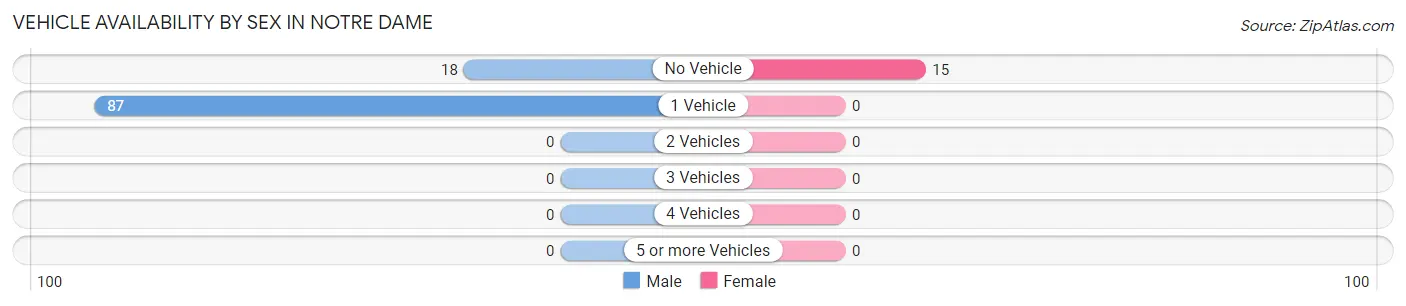
| Vehicles Available | Male | Female |
| No Vehicle | 18 (17.1%) | 15 (100.0%) |
| 1 Vehicle | 87 (82.9%) | 0 (0.0%) |
| 2 Vehicles | 0 (0.0%) | 0 (0.0%) |
| 3 Vehicles | 0 (0.0%) | 0 (0.0%) |
| 4 Vehicles | 0 (0.0%) | 0 (0.0%) |
| 5 or more Vehicles | 0 (0.0%) | 0 (0.0%) |
| Total | 105 (100.0%) | 15 (100.0%) |
Commute Time in Notre Dame
The most frequently occuring commute durations in Notre Dame are 10 to 14 minutes (698 commuters, 31.6%), 5 to 9 minutes (627 commuters, 28.4%), and 15 to 19 minutes (493 commuters, 22.3%).
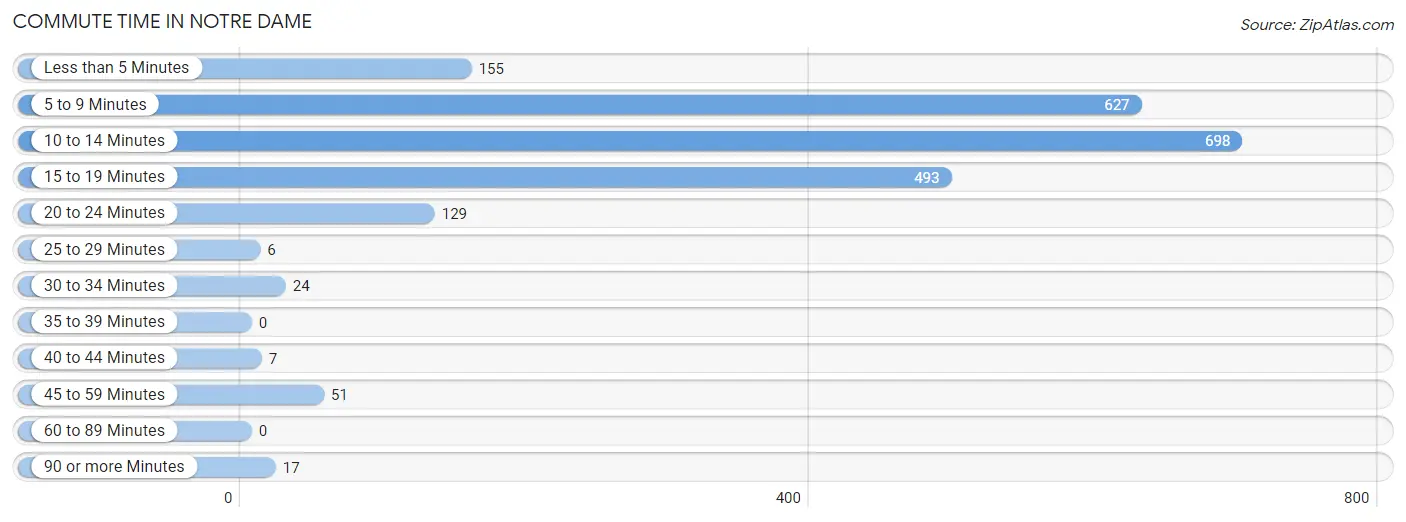
| Commute Time | # Commuters | % Commuters |
| Less than 5 Minutes | 155 | 7.0% |
| 5 to 9 Minutes | 627 | 28.4% |
| 10 to 14 Minutes | 698 | 31.6% |
| 15 to 19 Minutes | 493 | 22.3% |
| 20 to 24 Minutes | 129 | 5.9% |
| 25 to 29 Minutes | 6 | 0.3% |
| 30 to 34 Minutes | 24 | 1.1% |
| 35 to 39 Minutes | 0 | 0.0% |
| 40 to 44 Minutes | 7 | 0.3% |
| 45 to 59 Minutes | 51 | 2.3% |
| 60 to 89 Minutes | 0 | 0.0% |
| 90 or more Minutes | 17 | 0.8% |
Commute Time by Sex in Notre Dame
The most common commute times in Notre Dame are 5 to 9 minutes (357 commuters, 32.1%) for males and 10 to 14 minutes (390 commuters, 35.7%) for females.
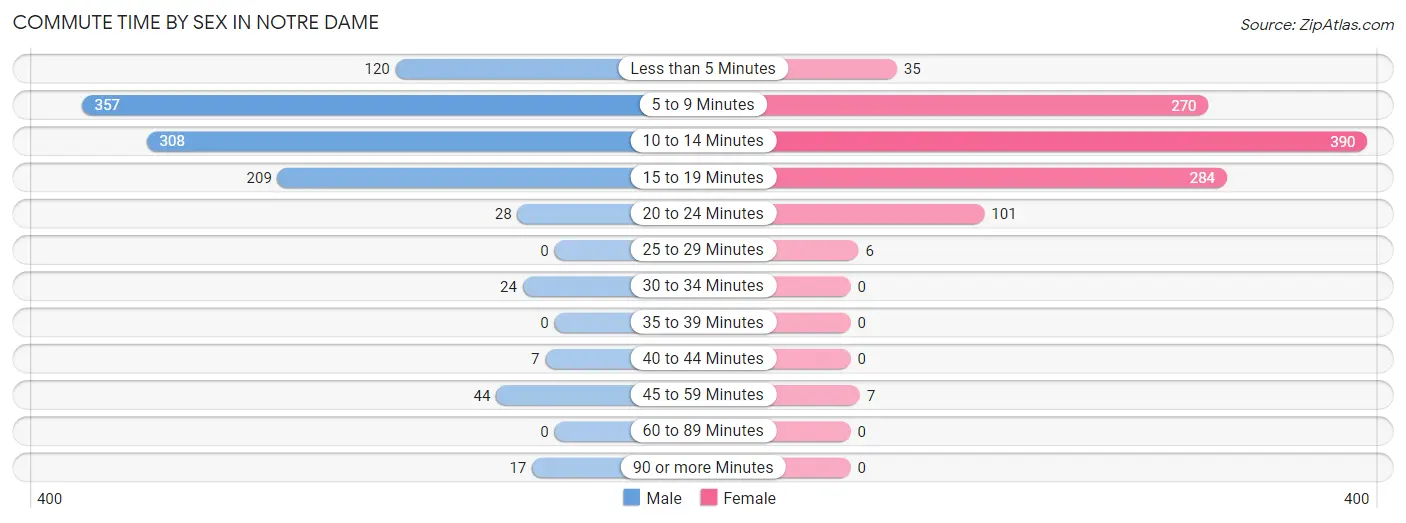
| Commute Time | Male | Female |
| Less than 5 Minutes | 120 (10.8%) | 35 (3.2%) |
| 5 to 9 Minutes | 357 (32.1%) | 270 (24.7%) |
| 10 to 14 Minutes | 308 (27.7%) | 390 (35.7%) |
| 15 to 19 Minutes | 209 (18.8%) | 284 (26.0%) |
| 20 to 24 Minutes | 28 (2.5%) | 101 (9.2%) |
| 25 to 29 Minutes | 0 (0.0%) | 6 (0.5%) |
| 30 to 34 Minutes | 24 (2.1%) | 0 (0.0%) |
| 35 to 39 Minutes | 0 (0.0%) | 0 (0.0%) |
| 40 to 44 Minutes | 7 (0.6%) | 0 (0.0%) |
| 45 to 59 Minutes | 44 (4.0%) | 7 (0.6%) |
| 60 to 89 Minutes | 0 (0.0%) | 0 (0.0%) |
| 90 or more Minutes | 17 (1.5%) | 0 (0.0%) |
Time of Departure to Work by Sex in Notre Dame
The most frequent times of departure to work in Notre Dame are 4:00 PM to 11:59 PM (334, 30.0%) for males and 4:00 PM to 11:59 PM (319, 29.2%) for females.
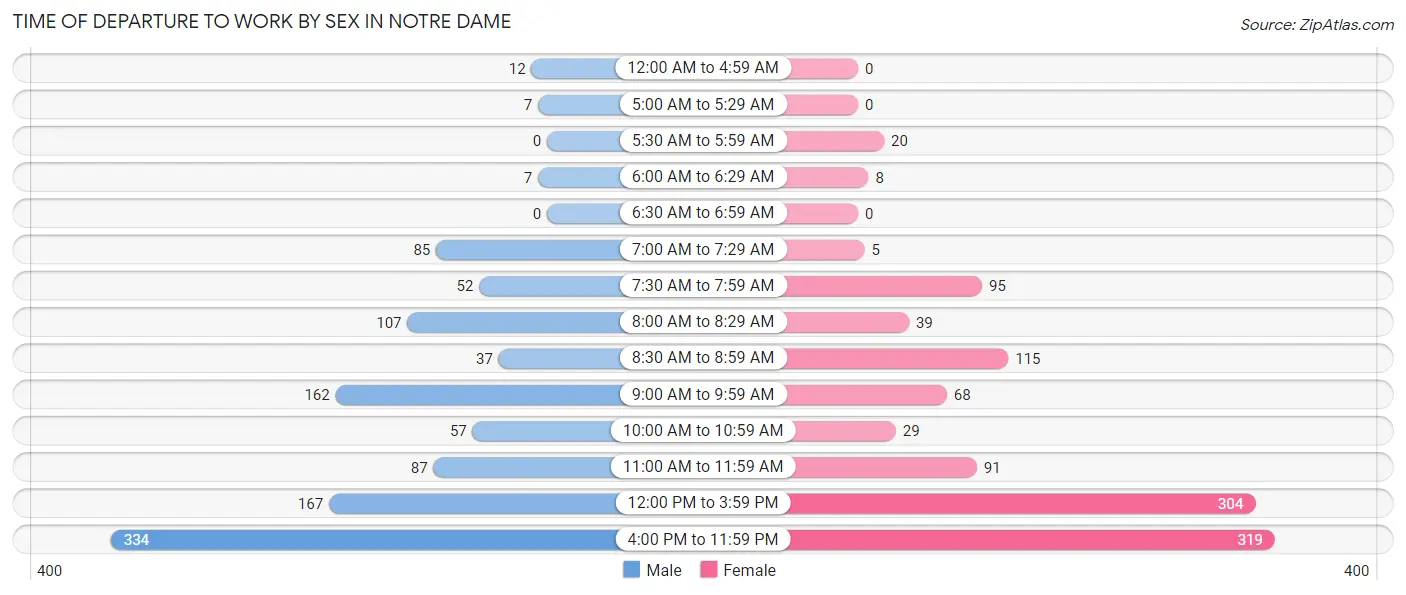
| Time of Departure | Male | Female |
| 12:00 AM to 4:59 AM | 12 (1.1%) | 0 (0.0%) |
| 5:00 AM to 5:29 AM | 7 (0.6%) | 0 (0.0%) |
| 5:30 AM to 5:59 AM | 0 (0.0%) | 20 (1.8%) |
| 6:00 AM to 6:29 AM | 7 (0.6%) | 8 (0.7%) |
| 6:30 AM to 6:59 AM | 0 (0.0%) | 0 (0.0%) |
| 7:00 AM to 7:29 AM | 85 (7.6%) | 5 (0.5%) |
| 7:30 AM to 7:59 AM | 52 (4.7%) | 95 (8.7%) |
| 8:00 AM to 8:29 AM | 107 (9.6%) | 39 (3.6%) |
| 8:30 AM to 8:59 AM | 37 (3.3%) | 115 (10.5%) |
| 9:00 AM to 9:59 AM | 162 (14.5%) | 68 (6.2%) |
| 10:00 AM to 10:59 AM | 57 (5.1%) | 29 (2.6%) |
| 11:00 AM to 11:59 AM | 87 (7.8%) | 91 (8.3%) |
| 12:00 PM to 3:59 PM | 167 (15.0%) | 304 (27.8%) |
| 4:00 PM to 11:59 PM | 334 (30.0%) | 319 (29.2%) |
| Total | 1,114 (100.0%) | 1,093 (100.0%) |
Housing Occupancy in Notre Dame
Occupancy by Ownership in Notre Dame
Of the total 176 dwellings in Notre Dame, owner-occupied units account for 10 (5.7%), while renter-occupied units make up 166 (94.3%).
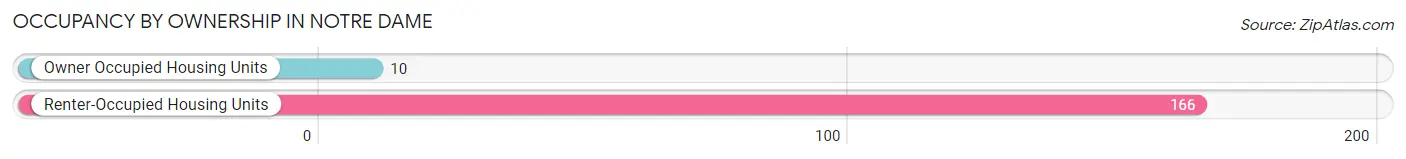
| Occupancy | # Housing Units | % Housing Units |
| Owner Occupied Housing Units | 10 | 5.7% |
| Renter-Occupied Housing Units | 166 | 94.3% |
| Total Occupied Housing Units | 176 | 100.0% |
Occupancy by Household Size in Notre Dame
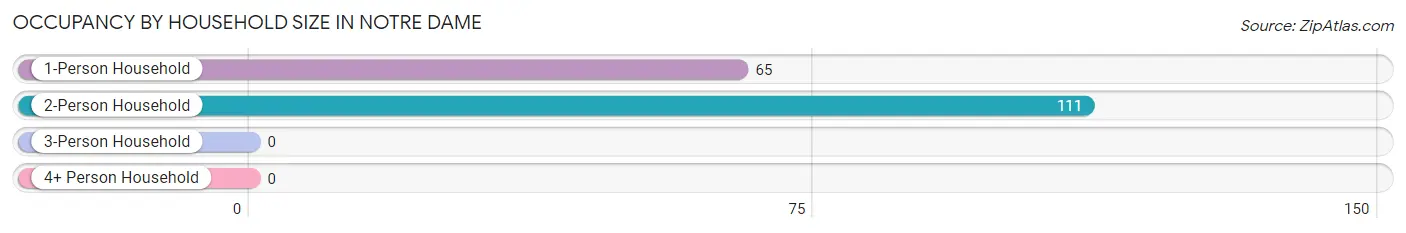
| Household Size | # Housing Units | % Housing Units |
| 1-Person Household | 65 | 36.9% |
| 2-Person Household | 111 | 63.1% |
| 3-Person Household | 0 | 0.0% |
| 4+ Person Household | 0 | 0.0% |
| Total Housing Units | 176 | 100.0% |
Occupancy by Ownership by Household Size in Notre Dame
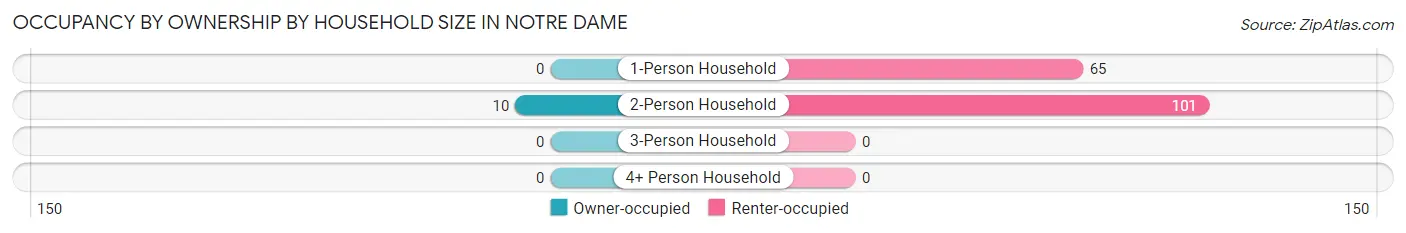
| Household Size | Owner-occupied | Renter-occupied |
| 1-Person Household | 0 (0.0%) | 65 (100.0%) |
| 2-Person Household | 10 (9.0%) | 101 (91.0%) |
| 3-Person Household | 0 (0.0%) | 0 (0.0%) |
| 4+ Person Household | 0 (0.0%) | 0 (0.0%) |
| Total Housing Units | 10 (5.7%) | 166 (94.3%) |
Occupancy by Educational Attainment in Notre Dame
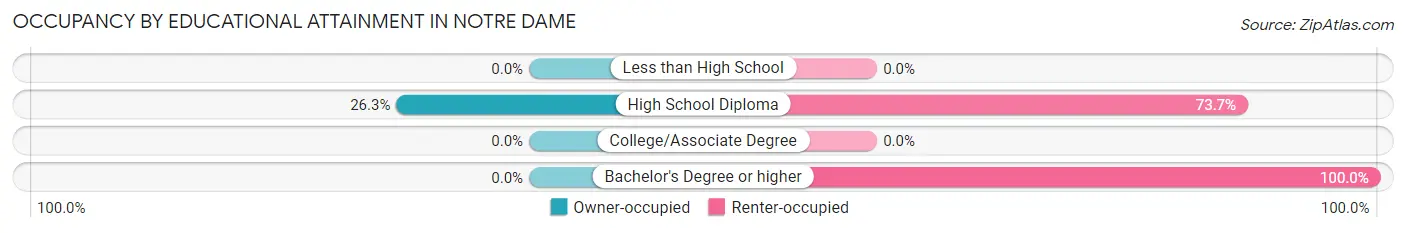
| Household Size | Owner-occupied | Renter-occupied |
| Less than High School | 0 (0.0%) | 0 (0.0%) |
| High School Diploma | 10 (26.3%) | 28 (73.7%) |
| College/Associate Degree | 0 (0.0%) | 0 (0.0%) |
| Bachelor's Degree or higher | 0 (0.0%) | 138 (100.0%) |
Occupancy by Age of Householder in Notre Dame
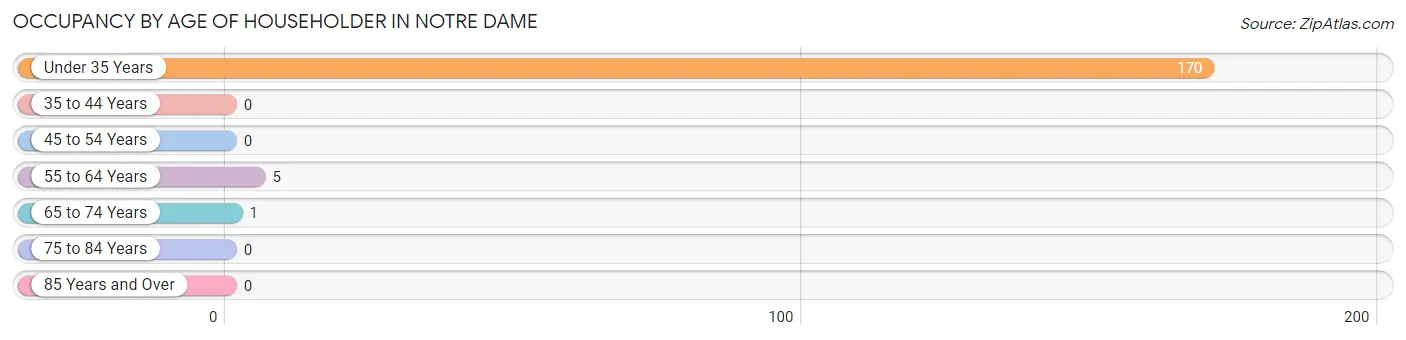
| Age Bracket | # Households | % Households |
| Under 35 Years | 170 | 96.6% |
| 35 to 44 Years | 0 | 0.0% |
| 45 to 54 Years | 0 | 0.0% |
| 55 to 64 Years | 5 | 2.8% |
| 65 to 74 Years | 1 | 0.6% |
| 75 to 84 Years | 0 | 0.0% |
| 85 Years and Over | 0 | 0.0% |
| Total | 176 | 100.0% |
Housing Finances in Notre Dame
Median Income by Occupancy in Notre Dame
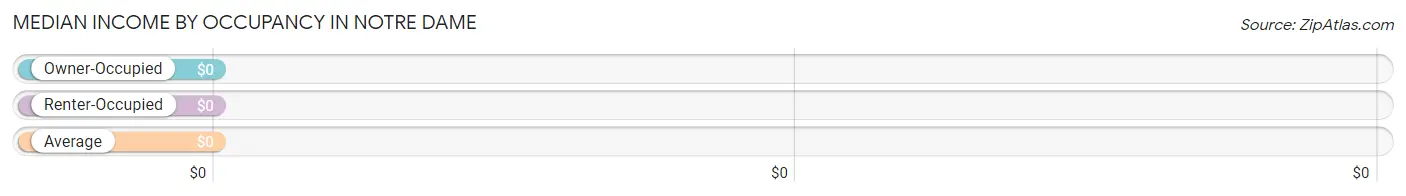
| Occupancy Type | # Households | Median Income |
| Owner-Occupied | 10 (5.7%) | $0 |
| Renter-Occupied | 166 (94.3%) | $0 |
| Average | 176 (100.0%) | $0 |
Occupancy by Householder Income Bracket in Notre Dame
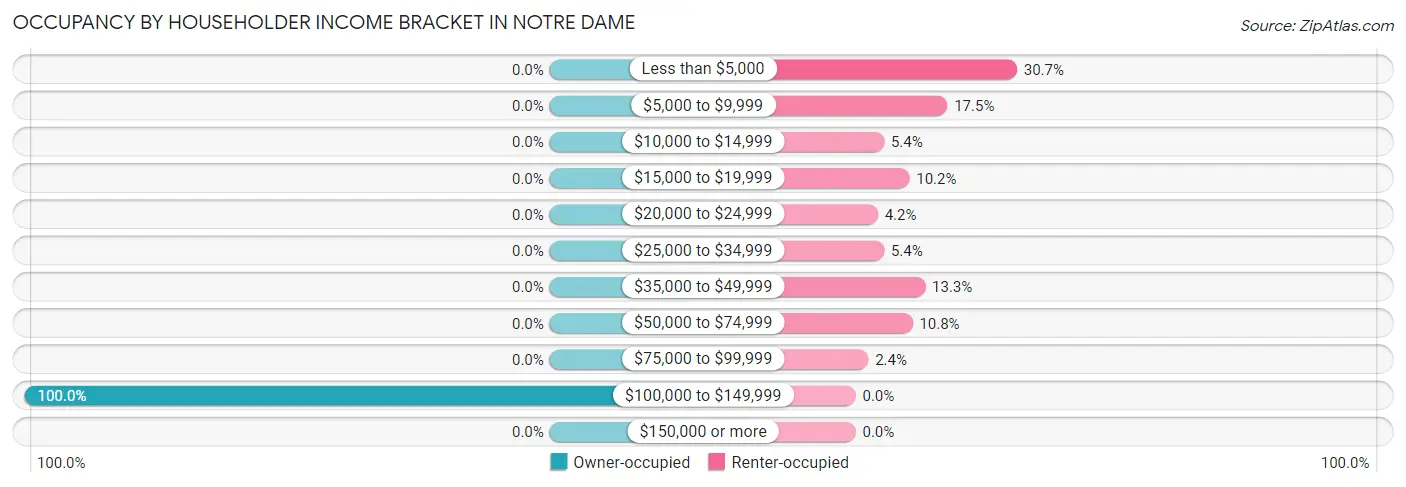
| Income Bracket | Owner-occupied | Renter-occupied |
| Less than $5,000 | 0 (0.0%) | 51 (30.7%) |
| $5,000 to $9,999 | 0 (0.0%) | 29 (17.5%) |
| $10,000 to $14,999 | 0 (0.0%) | 9 (5.4%) |
| $15,000 to $19,999 | 0 (0.0%) | 17 (10.2%) |
| $20,000 to $24,999 | 0 (0.0%) | 7 (4.2%) |
| $25,000 to $34,999 | 0 (0.0%) | 9 (5.4%) |
| $35,000 to $49,999 | 0 (0.0%) | 22 (13.3%) |
| $50,000 to $74,999 | 0 (0.0%) | 18 (10.8%) |
| $75,000 to $99,999 | 0 (0.0%) | 4 (2.4%) |
| $100,000 to $149,999 | 10 (100.0%) | 0 (0.0%) |
| $150,000 or more | 0 (0.0%) | 0 (0.0%) |
| Total | 10 (100.0%) | 166 (100.0%) |
Monthly Housing Cost Tiers in Notre Dame
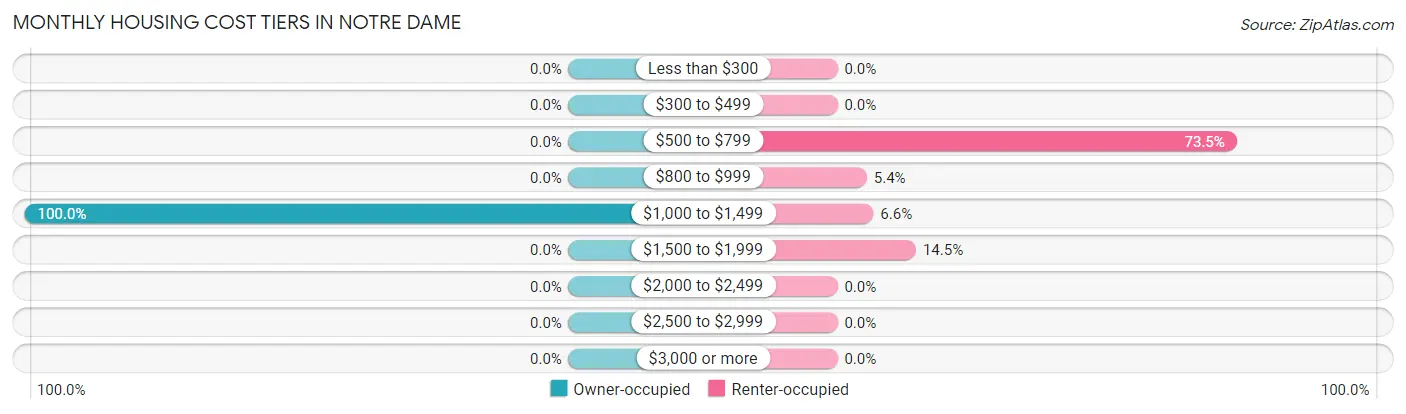
| Monthly Cost | Owner-occupied | Renter-occupied |
| Less than $300 | 0 (0.0%) | 0 (0.0%) |
| $300 to $499 | 0 (0.0%) | 0 (0.0%) |
| $500 to $799 | 0 (0.0%) | 122 (73.5%) |
| $800 to $999 | 0 (0.0%) | 9 (5.4%) |
| $1,000 to $1,499 | 10 (100.0%) | 11 (6.6%) |
| $1,500 to $1,999 | 0 (0.0%) | 24 (14.5%) |
| $2,000 to $2,499 | 0 (0.0%) | 0 (0.0%) |
| $2,500 to $2,999 | 0 (0.0%) | 0 (0.0%) |
| $3,000 or more | 0 (0.0%) | 0 (0.0%) |
| Total | 10 (100.0%) | 166 (100.0%) |
Physical Housing Characteristics in Notre Dame
Housing Structures in Notre Dame
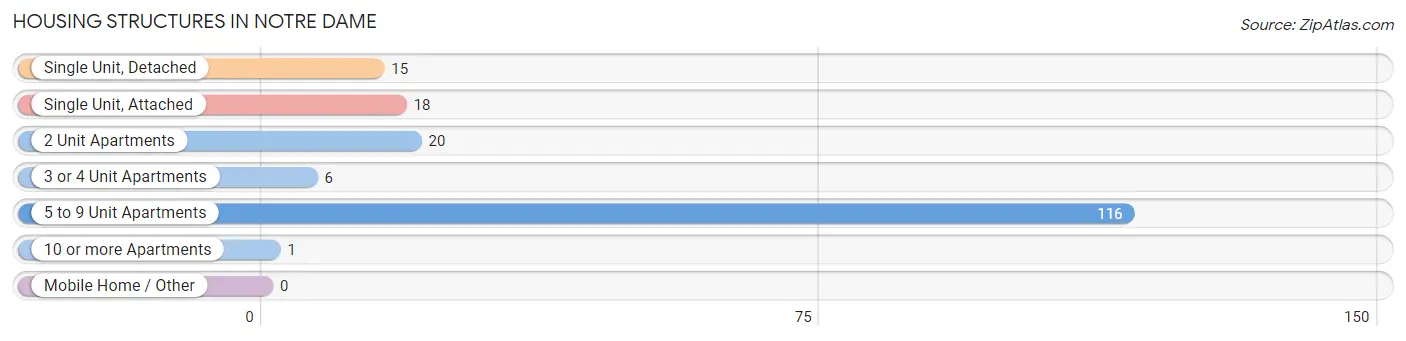
| Structure Type | # Housing Units | % Housing Units |
| Single Unit, Detached | 15 | 8.5% |
| Single Unit, Attached | 18 | 10.2% |
| 2 Unit Apartments | 20 | 11.4% |
| 3 or 4 Unit Apartments | 6 | 3.4% |
| 5 to 9 Unit Apartments | 116 | 65.9% |
| 10 or more Apartments | 1 | 0.6% |
| Mobile Home / Other | 0 | 0.0% |
| Total | 176 | 100.0% |
Housing Structures by Occupancy in Notre Dame
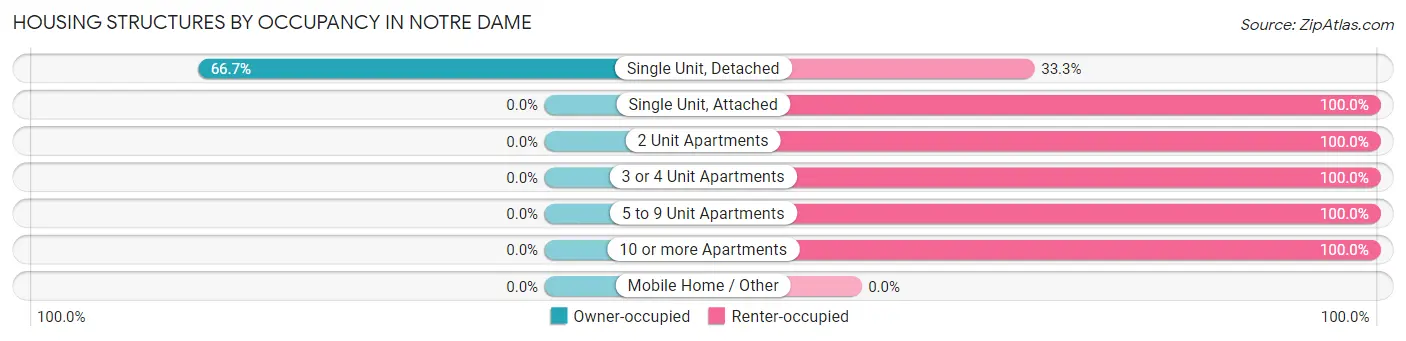
| Structure Type | Owner-occupied | Renter-occupied |
| Single Unit, Detached | 10 (66.7%) | 5 (33.3%) |
| Single Unit, Attached | 0 (0.0%) | 18 (100.0%) |
| 2 Unit Apartments | 0 (0.0%) | 20 (100.0%) |
| 3 or 4 Unit Apartments | 0 (0.0%) | 6 (100.0%) |
| 5 to 9 Unit Apartments | 0 (0.0%) | 116 (100.0%) |
| 10 or more Apartments | 0 (0.0%) | 1 (100.0%) |
| Mobile Home / Other | 0 (0.0%) | 0 (0.0%) |
| Total | 10 (5.7%) | 166 (94.3%) |
Housing Structures by Number of Rooms in Notre Dame
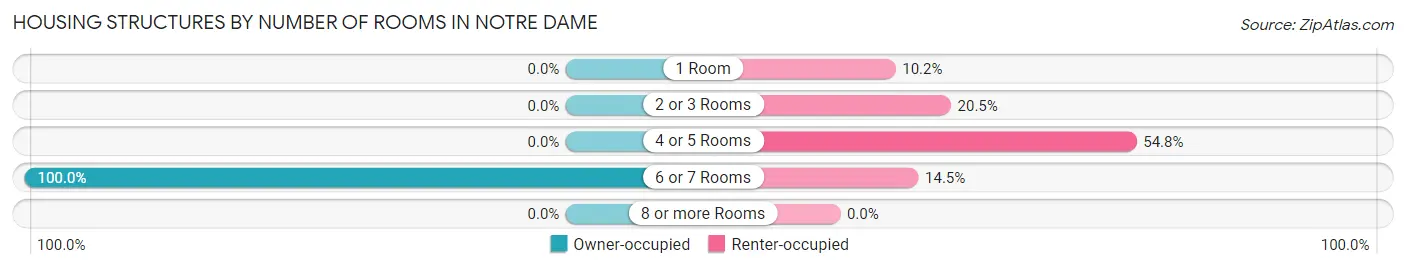
| Number of Rooms | Owner-occupied | Renter-occupied |
| 1 Room | 0 (0.0%) | 17 (10.2%) |
| 2 or 3 Rooms | 0 (0.0%) | 34 (20.5%) |
| 4 or 5 Rooms | 0 (0.0%) | 91 (54.8%) |
| 6 or 7 Rooms | 10 (100.0%) | 24 (14.5%) |
| 8 or more Rooms | 0 (0.0%) | 0 (0.0%) |
| Total | 10 (100.0%) | 166 (100.0%) |
Housing Structure by Heating Type in Notre Dame
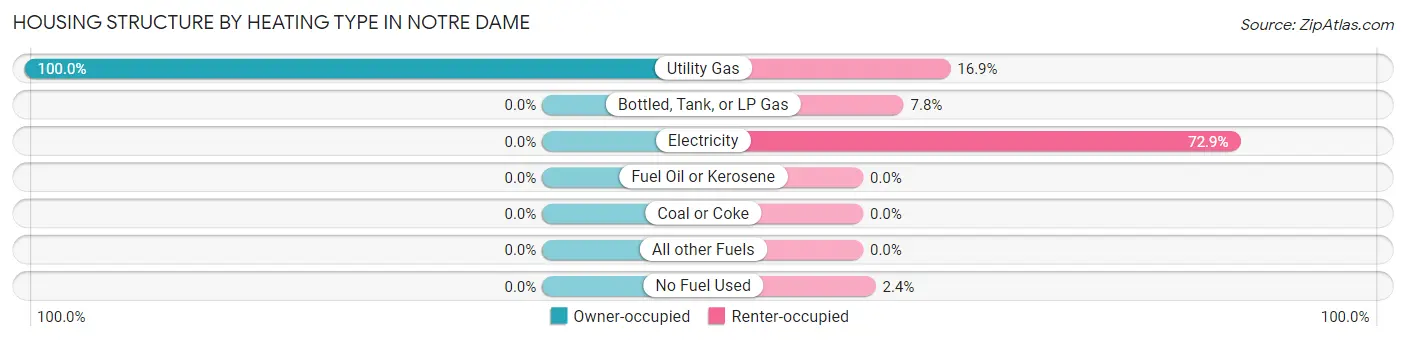
| Heating Type | Owner-occupied | Renter-occupied |
| Utility Gas | 10 (100.0%) | 28 (16.9%) |
| Bottled, Tank, or LP Gas | 0 (0.0%) | 13 (7.8%) |
| Electricity | 0 (0.0%) | 121 (72.9%) |
| Fuel Oil or Kerosene | 0 (0.0%) | 0 (0.0%) |
| Coal or Coke | 0 (0.0%) | 0 (0.0%) |
| All other Fuels | 0 (0.0%) | 0 (0.0%) |
| No Fuel Used | 0 (0.0%) | 4 (2.4%) |
| Total | 10 (100.0%) | 166 (100.0%) |
Household Vehicle Usage in Notre Dame
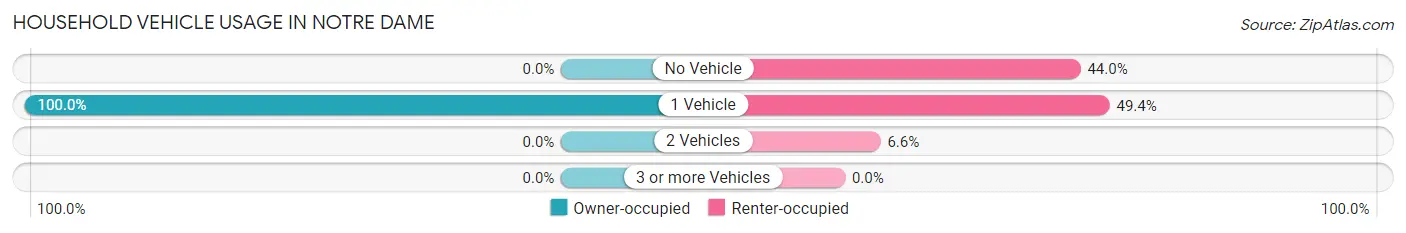
| Vehicles per Household | Owner-occupied | Renter-occupied |
| No Vehicle | 0 (0.0%) | 73 (44.0%) |
| 1 Vehicle | 10 (100.0%) | 82 (49.4%) |
| 2 Vehicles | 0 (0.0%) | 11 (6.6%) |
| 3 or more Vehicles | 0 (0.0%) | 0 (0.0%) |
| Total | 10 (100.0%) | 166 (100.0%) |
Real Estate & Mortgages in Notre Dame
Real Estate and Mortgage Overview in Notre Dame
| Characteristic | Without Mortgage | With Mortgage |
| Housing Units | 0 | 10 |
| Median Property Value | - | - |
| Median Household Income | - | - |
| Monthly Housing Costs | - | - |
| Real Estate Taxes | - | - |
Property Value by Mortgage Status in Notre Dame
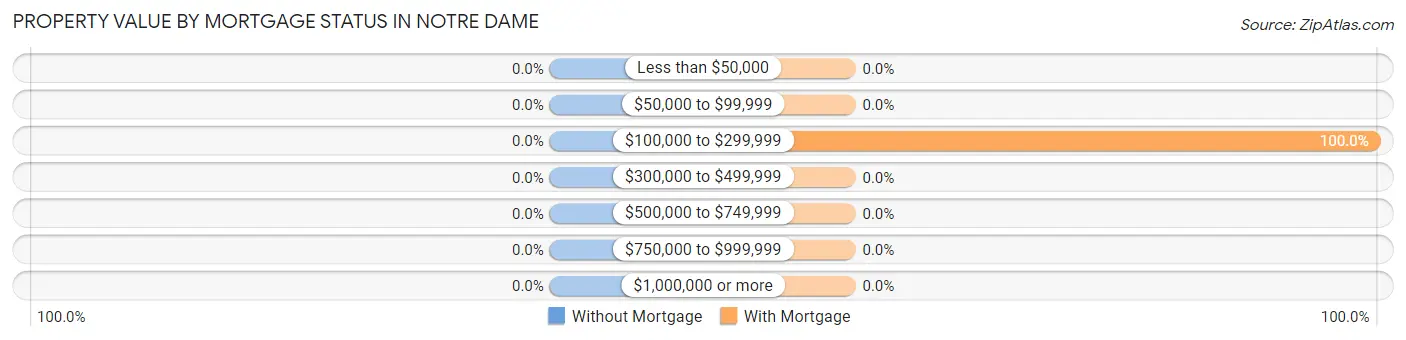
| Property Value | Without Mortgage | With Mortgage |
| Less than $50,000 | 0 (0.0%) | 0 (0.0%) |
| $50,000 to $99,999 | 0 (0.0%) | 0 (0.0%) |
| $100,000 to $299,999 | 0 (0.0%) | 10 (100.0%) |
| $300,000 to $499,999 | 0 (0.0%) | 0 (0.0%) |
| $500,000 to $749,999 | 0 (0.0%) | 0 (0.0%) |
| $750,000 to $999,999 | 0 (0.0%) | 0 (0.0%) |
| $1,000,000 or more | 0 (0.0%) | 0 (0.0%) |
| Total | 0 (0.0%) | 10 (100.0%) |
Household Income by Mortgage Status in Notre Dame
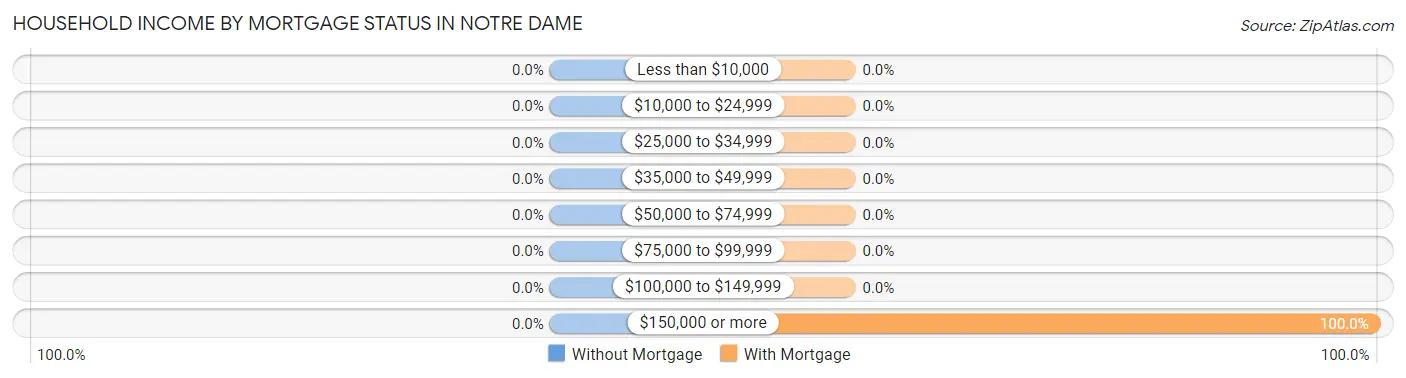
| Household Income | Without Mortgage | With Mortgage |
| Less than $10,000 | 0 (0.0%) | 0 (0.0%) |
| $10,000 to $24,999 | 0 (0.0%) | 0 (0.0%) |
| $25,000 to $34,999 | 0 (0.0%) | 0 (0.0%) |
| $35,000 to $49,999 | 0 (0.0%) | 0 (0.0%) |
| $50,000 to $74,999 | 0 (0.0%) | 0 (0.0%) |
| $75,000 to $99,999 | 0 (0.0%) | 0 (0.0%) |
| $100,000 to $149,999 | 0 (0.0%) | 0 (0.0%) |
| $150,000 or more | 0 (0.0%) | 10 (100.0%) |
| Total | 0 (0.0%) | 10 (100.0%) |
Property Value to Household Income Ratio in Notre Dame
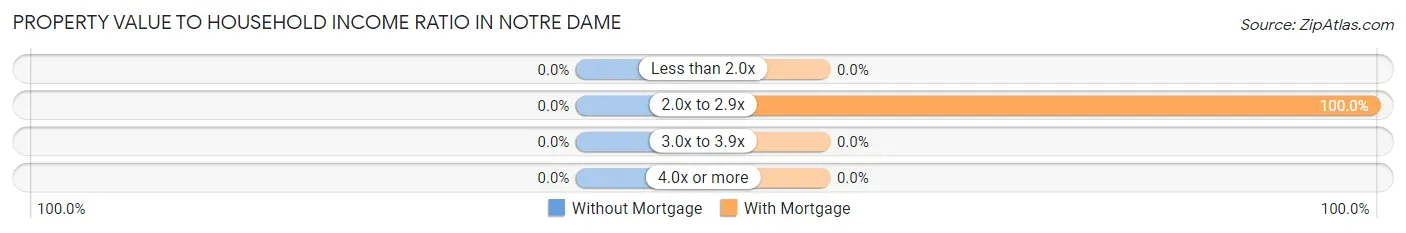
| Value-to-Income Ratio | Without Mortgage | With Mortgage |
| Less than 2.0x | 0 (0.0%) | 0 (0.0%) |
| 2.0x to 2.9x | 0 (0.0%) | 10 (100.0%) |
| 3.0x to 3.9x | 0 (0.0%) | 0 (0.0%) |
| 4.0x or more | 0 (0.0%) | 0 (0.0%) |
| Total | 0 (0.0%) | 10 (100.0%) |
Real Estate Taxes by Mortgage Status in Notre Dame
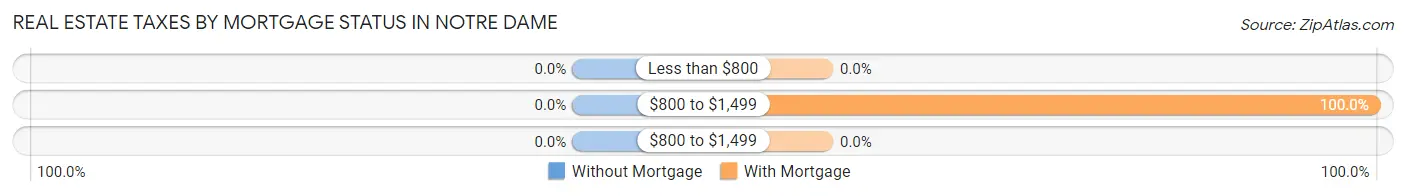
| Property Taxes | Without Mortgage | With Mortgage |
| Less than $800 | 0 (0.0%) | 0 (0.0%) |
| $800 to $1,499 | 0 (0.0%) | 10 (100.0%) |
| $800 to $1,499 | 0 (0.0%) | 0 (0.0%) |
| Total | 0 (0.0%) | 10 (100.0%) |
Health & Disability in Notre Dame
Health Insurance Coverage by Age in Notre Dame
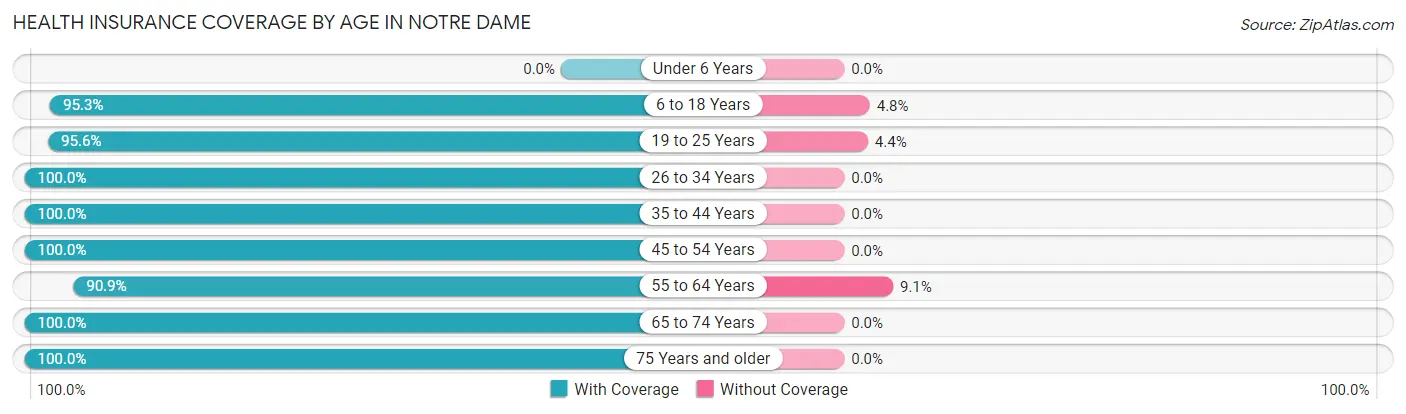
| Age Bracket | With Coverage | Without Coverage |
| Under 6 Years | 0 (0.0%) | 0 (0.0%) |
| 6 to 18 Years | 1,183 (95.3%) | 59 (4.8%) |
| 19 to 25 Years | 4,674 (95.6%) | 215 (4.4%) |
| 26 to 34 Years | 111 (100.0%) | 0 (0.0%) |
| 35 to 44 Years | 12 (100.0%) | 0 (0.0%) |
| 45 to 54 Years | 32 (100.0%) | 0 (0.0%) |
| 55 to 64 Years | 70 (90.9%) | 7 (9.1%) |
| 65 to 74 Years | 1 (100.0%) | 0 (0.0%) |
| 75 Years and older | 91 (100.0%) | 0 (0.0%) |
| Total | 6,174 (95.7%) | 281 (4.3%) |
Health Insurance Coverage by Citizenship Status in Notre Dame
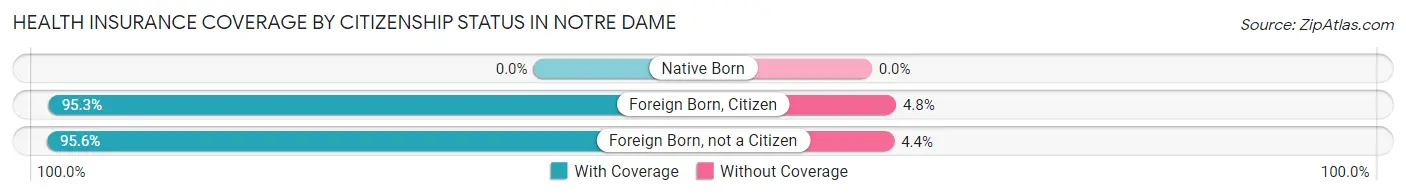
| Citizenship Status | With Coverage | Without Coverage |
| Native Born | 0 (0.0%) | 0 (0.0%) |
| Foreign Born, Citizen | 1,183 (95.3%) | 59 (4.8%) |
| Foreign Born, not a Citizen | 4,674 (95.6%) | 215 (4.4%) |
Health Insurance Coverage by Household Income in Notre Dame
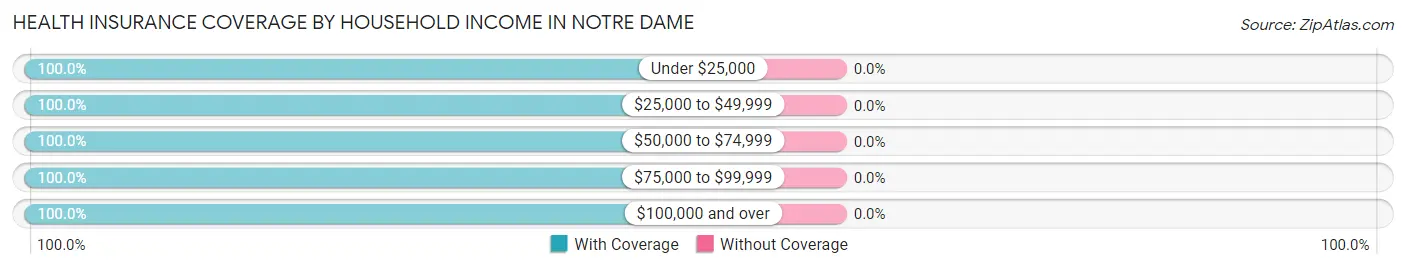
| Household Income | With Coverage | Without Coverage |
| Under $25,000 | 158 (100.0%) | 0 (0.0%) |
| $25,000 to $49,999 | 57 (100.0%) | 0 (0.0%) |
| $50,000 to $74,999 | 35 (100.0%) | 0 (0.0%) |
| $75,000 to $99,999 | 10 (100.0%) | 0 (0.0%) |
| $100,000 and over | 13 (100.0%) | 0 (0.0%) |
Public vs Private Health Insurance Coverage by Age in Notre Dame
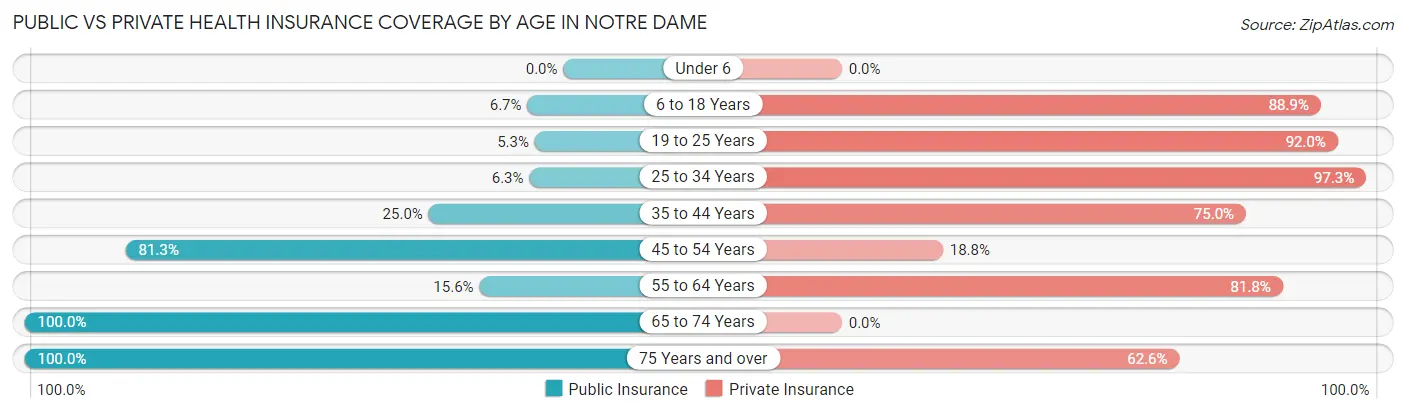
| Age Bracket | Public Insurance | Private Insurance |
| Under 6 | 0 (0.0%) | 0 (0.0%) |
| 6 to 18 Years | 83 (6.7%) | 1,104 (88.9%) |
| 19 to 25 Years | 259 (5.3%) | 4,500 (92.0%) |
| 25 to 34 Years | 7 (6.3%) | 108 (97.3%) |
| 35 to 44 Years | 3 (25.0%) | 9 (75.0%) |
| 45 to 54 Years | 26 (81.2%) | 6 (18.8%) |
| 55 to 64 Years | 12 (15.6%) | 63 (81.8%) |
| 65 to 74 Years | 1 (100.0%) | 0 (0.0%) |
| 75 Years and over | 91 (100.0%) | 57 (62.6%) |
| Total | 482 (7.5%) | 5,847 (90.6%) |
Disability Status by Sex by Age in Notre Dame
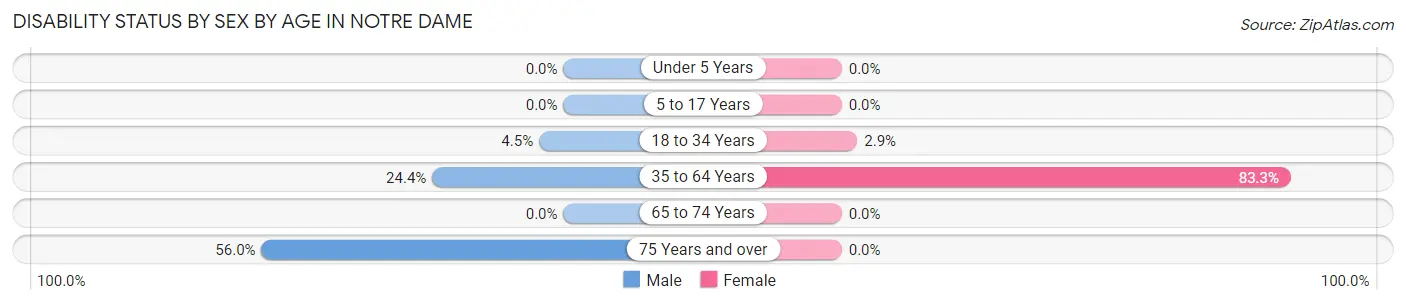
| Age Bracket | Male | Female |
| Under 5 Years | 0 (0.0%) | 0 (0.0%) |
| 5 to 17 Years | 0 (0.0%) | 0 (0.0%) |
| 18 to 34 Years | 144 (4.5%) | 88 (2.9%) |
| 35 to 64 Years | 28 (24.3%) | 5 (83.3%) |
| 65 to 74 Years | 0 (0.0%) | 0 (0.0%) |
| 75 Years and over | 51 (56.0%) | 0 (0.0%) |
Disability Class by Sex by Age in Notre Dame
Disability Class: Hearing Difficulty
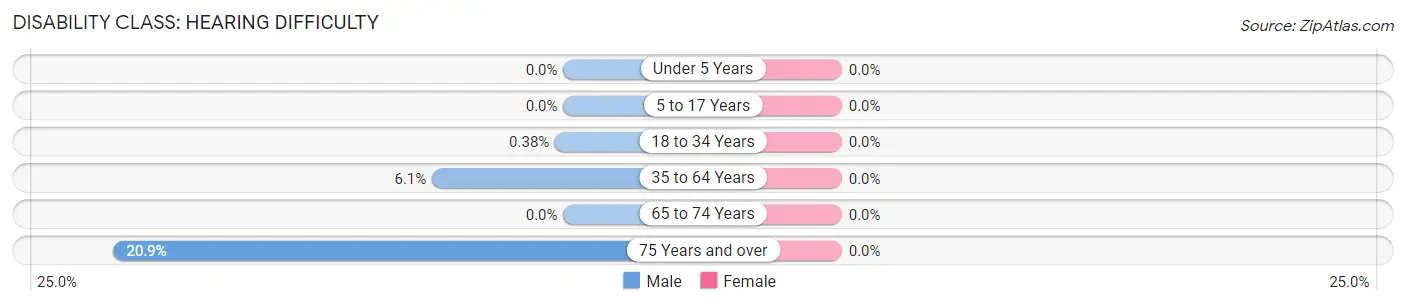
| Age Bracket | Male | Female |
| Under 5 Years | 0 (0.0%) | 0 (0.0%) |
| 5 to 17 Years | 0 (0.0%) | 0 (0.0%) |
| 18 to 34 Years | 12 (0.4%) | 0 (0.0%) |
| 35 to 64 Years | 7 (6.1%) | 0 (0.0%) |
| 65 to 74 Years | 0 (0.0%) | 0 (0.0%) |
| 75 Years and over | 19 (20.9%) | 0 (0.0%) |
Disability Class: Vision Difficulty
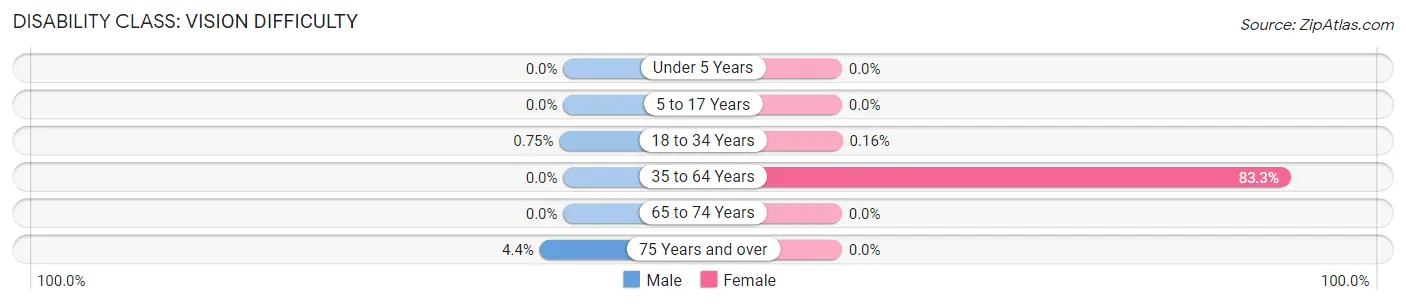
| Age Bracket | Male | Female |
| Under 5 Years | 0 (0.0%) | 0 (0.0%) |
| 5 to 17 Years | 0 (0.0%) | 0 (0.0%) |
| 18 to 34 Years | 24 (0.7%) | 5 (0.2%) |
| 35 to 64 Years | 0 (0.0%) | 5 (83.3%) |
| 65 to 74 Years | 0 (0.0%) | 0 (0.0%) |
| 75 Years and over | 4 (4.4%) | 0 (0.0%) |
Disability Class: Cognitive Difficulty
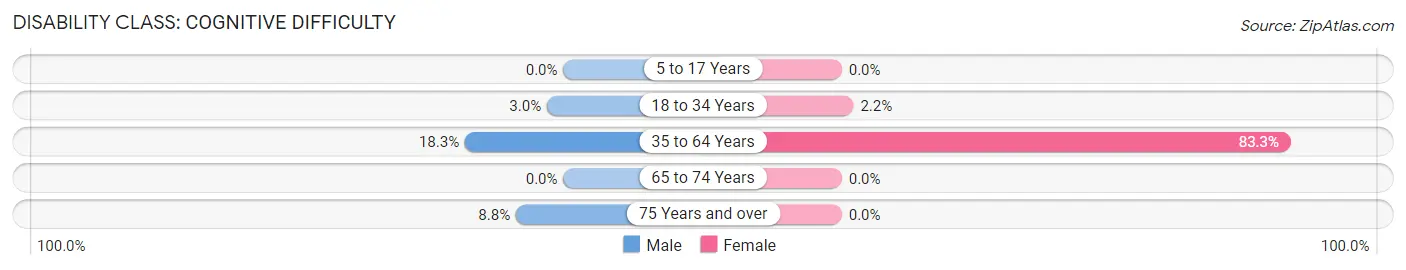
| Age Bracket | Male | Female |
| 5 to 17 Years | 0 (0.0%) | 0 (0.0%) |
| 18 to 34 Years | 97 (3.0%) | 66 (2.2%) |
| 35 to 64 Years | 21 (18.3%) | 5 (83.3%) |
| 65 to 74 Years | 0 (0.0%) | 0 (0.0%) |
| 75 Years and over | 8 (8.8%) | 0 (0.0%) |
Disability Class: Ambulatory Difficulty
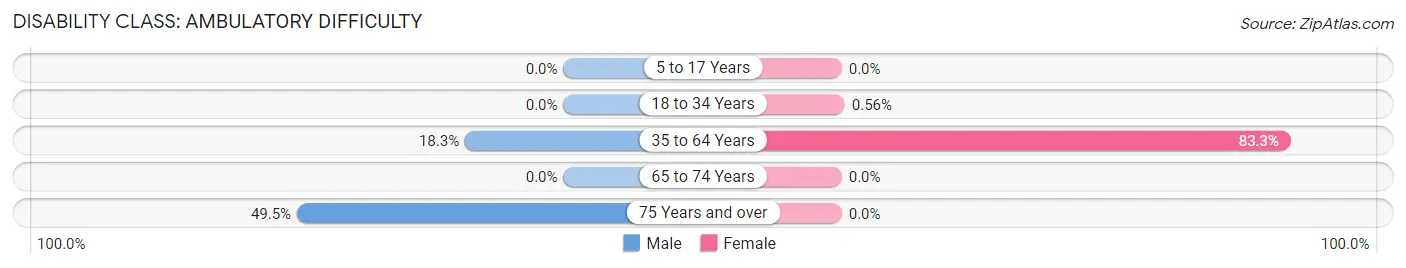
| Age Bracket | Male | Female |
| 5 to 17 Years | 0 (0.0%) | 0 (0.0%) |
| 18 to 34 Years | 0 (0.0%) | 17 (0.6%) |
| 35 to 64 Years | 21 (18.3%) | 5 (83.3%) |
| 65 to 74 Years | 0 (0.0%) | 0 (0.0%) |
| 75 Years and over | 45 (49.4%) | 0 (0.0%) |
Disability Class: Self-Care Difficulty
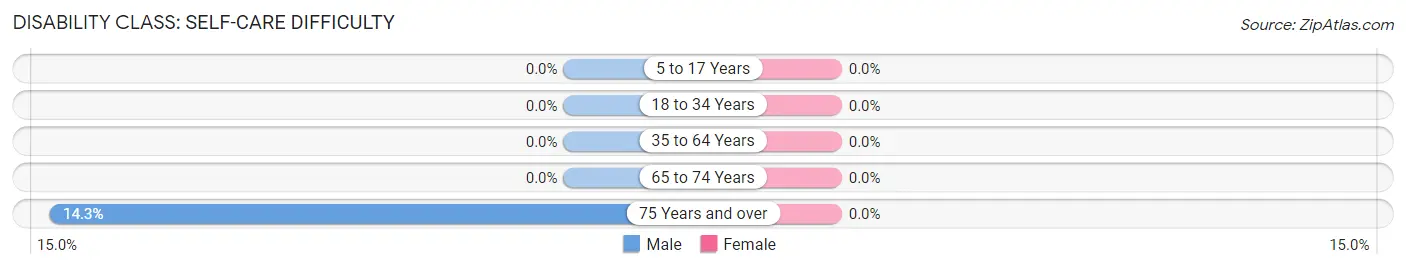
| Age Bracket | Male | Female |
| 5 to 17 Years | 0 (0.0%) | 0 (0.0%) |
| 18 to 34 Years | 0 (0.0%) | 0 (0.0%) |
| 35 to 64 Years | 0 (0.0%) | 0 (0.0%) |
| 65 to 74 Years | 0 (0.0%) | 0 (0.0%) |
| 75 Years and over | 13 (14.3%) | 0 (0.0%) |
Technology Access in Notre Dame
Computing Device Access in Notre Dame
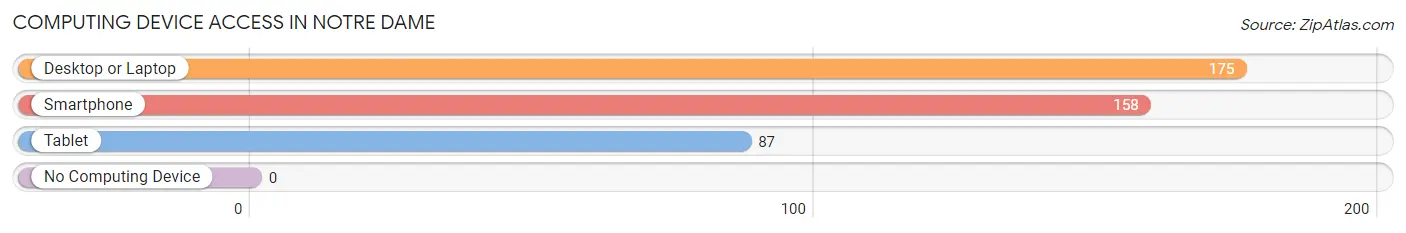
| Device Type | # Households | % Households |
| Desktop or Laptop | 175 | 99.4% |
| Smartphone | 158 | 89.8% |
| Tablet | 87 | 49.4% |
| No Computing Device | 0 | 0.0% |
| Total | 176 | 100.0% |
Internet Access in Notre Dame
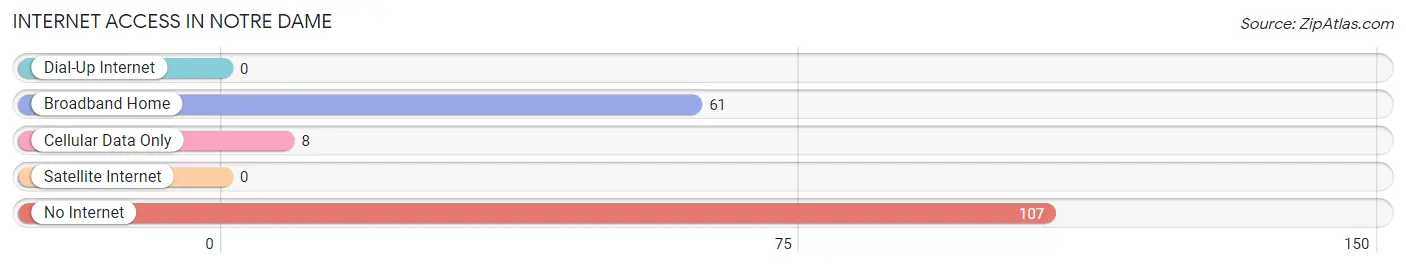
| Internet Type | # Households | % Households |
| Dial-Up Internet | 0 | 0.0% |
| Broadband Home | 61 | 34.7% |
| Cellular Data Only | 8 | 4.5% |
| Satellite Internet | 0 | 0.0% |
| No Internet | 107 | 60.8% |
| Total | 176 | 100.0% |
Notre Dame Summary
Notre Dame, Indiana is a small town located in St. Joseph County, in the northern part of the state. It is home to the University of Notre Dame, one of the most prestigious universities in the United States. The town has a population of about 5,000 people and is located about 90 miles east of Chicago.
Geography
Notre Dame is located in the northern part of Indiana, in St. Joseph County. It is situated on the St. Joseph River, which flows through the town. The town is surrounded by farmland and is located about 90 miles east of Chicago. The town is located in the Central Lowland region of the United States, which is characterized by flat terrain and fertile soil. The climate in Notre Dame is humid continental, with hot summers and cold winters.
History
Notre Dame was founded in 1842 by Father Edward Sorin, a French priest who was sent to the area by the Congregation of Holy Cross. He established the University of Notre Dame, which has since become one of the most prestigious universities in the United States. The town was named after the university, which was named after the Blessed Virgin Mary.
In the late 19th century, Notre Dame became a popular tourist destination, as people from all over the country came to visit the university. The town also became a center for Catholic education, with several Catholic schools and colleges being established in the area.
Economy
Notre Dame’s economy is largely based on the University of Notre Dame. The university is the largest employer in the town, providing jobs for thousands of people. The university also provides a large number of services to the town, such as health care, education, and recreation.
In addition to the university, the town also has a number of small businesses, including restaurants, shops, and other services. The town also has a number of manufacturing companies, which produce a variety of products, including furniture, clothing, and electronics.
Demographics
As of the 2010 census, the population of Notre Dame was 5,039. The racial makeup of the town was 94.3% White, 1.3% African American, 0.3% Native American, 1.7% Asian, 0.1% Pacific Islander, and 2.3% from two or more races. The median household income was $50,977, and the median family income was $64,917.
Notre Dame is a predominantly Catholic town, with over 90% of the population identifying as Catholic. The town is also home to a large number of international students, as the university attracts students from all over the world.
Conclusion
Notre Dame, Indiana is a small town located in St. Joseph County, in the northern part of the state. It is home to the University of Notre Dame, one of the most prestigious universities in the United States. The town has a population of about 5,000 people and is located about 90 miles east of Chicago. The town’s economy is largely based on the university, which provides jobs for thousands of people. The town is also home to a large number of international students, as the university attracts students from all over the world. The town is predominantly Catholic, with over 90% of the population identifying as Catholic.
Common Questions
What is the Total Population of Notre Dame?
Total Population of Notre Dame is 6,479.
What is the Total Male Population of Notre Dame?
Total Male Population of Notre Dame is 3,394.
What is the Total Female Population of Notre Dame?
Total Female Population of Notre Dame is 3,085.
What is the Ratio of Males per 100 Females in Notre Dame?
There are 110.02 Males per 100 Females in Notre Dame.
What is the Ratio of Females per 100 Males in Notre Dame?
There are 90.90 Females per 100 Males in Notre Dame.
What is the Median Population Age in Notre Dame?
Median Population Age in Notre Dame is 20.1 Years.
What is the Average Family Size in Notre Dame
Average Family Size in Notre Dame is 1.8 People.
What is the Average Household Size in Notre Dame
Average Household Size in Notre Dame is 1.6 People.
What is Per Capita Income in Notre Dame?
Per Capita income in Notre Dame is $6,130.
What is Income or Wage Gap in Notre Dame?
Income or Wage Gap in Notre Dame is 25.4%.
Women in Notre Dame earn 74.6 cents for every dollar earned by a man.
What is Inequality or Gini Index in Notre Dame?
Inequality or Gini Index in Notre Dame is 0.59.
How Large is the Labor Force in Notre Dame?
There are 3,006 People in the Labor Forcein in Notre Dame.
What is the Percentage of People in the Labor Force in Notre Dame?
46.4% of People are in the Labor Force in Notre Dame.
What is the Unemployment Rate in Notre Dame?
Unemployment Rate in Notre Dame is 0.7%.