Cities with the Highest Percentage of Peruvian Population in Washington
RELATED REPORTS & OPTIONS
Peruvian
Washington
Compare Cities
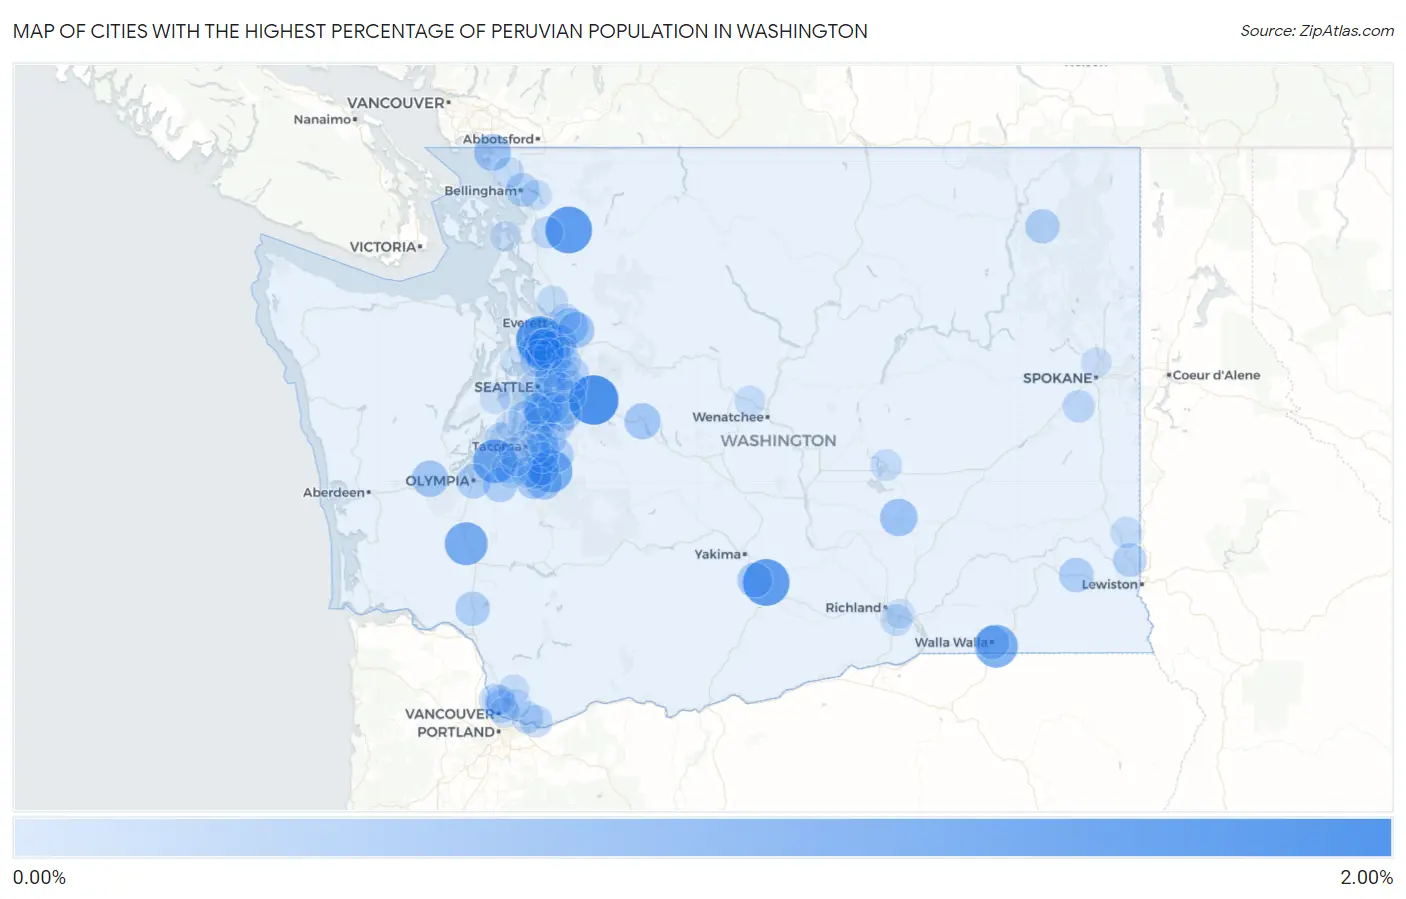
Map of Cities with the Highest Percentage of Peruvian Population in Washington
0.00%
2.00%
Cities with the Highest Percentage of Peruvian Population in Washington
| City | Peruvian | vs State | vs National | |
| 1. | Snoqualmie | 1.51% | 0.11%(+1.40)#1 | 0.22%(+1.30)#444 |
| 2. | Picnic Point | 1.37% | 0.11%(+1.25)#2 | 0.22%(+1.15)#505 |
| 3. | Lyman | 1.30% | 0.11%(+1.18)#3 | 0.22%(+1.08)#534 |
| 4. | Buena | 1.29% | 0.11%(+1.18)#4 | 0.22%(+1.07)#540 |
| 5. | Anderson Island | 1.05% | 0.11%(+0.936)#5 | 0.22%(+0.833)#666 |
| 6. | Chehalis | 1.00% | 0.11%(+0.885)#6 | 0.22%(+0.783)#692 |
| 7. | Walla Walla East | 0.99% | 0.11%(+0.873)#7 | 0.22%(+0.770)#701 |
| 8. | Orting | 0.96% | 0.11%(+0.842)#8 | 0.22%(+0.740)#730 |
| 9. | Alderwood Manor | 0.72% | 0.11%(+0.609)#9 | 0.22%(+0.507)#929 |
| 10. | Tukwila | 0.61% | 0.11%(+0.499)#10 | 0.22%(+0.397)#1,074 |
| 11. | Lynnwood | 0.61% | 0.11%(+0.496)#11 | 0.22%(+0.394)#1,080 |
| 12. | Othello | 0.57% | 0.11%(+0.458)#12 | 0.22%(+0.356)#1,144 |
| 13. | Graham | 0.53% | 0.11%(+0.416)#13 | 0.22%(+0.314)#1,227 |
| 14. | Blaine | 0.53% | 0.11%(+0.416)#14 | 0.22%(+0.313)#1,228 |
| 15. | Bothell | 0.52% | 0.11%(+0.405)#15 | 0.22%(+0.302)#1,252 |
| 16. | Mccleary | 0.49% | 0.11%(+0.382)#16 | 0.22%(+0.279)#1,299 |
| 17. | Everett | 0.49% | 0.11%(+0.372)#17 | 0.22%(+0.270)#1,333 |
| 18. | Silver Firs | 0.48% | 0.11%(+0.364)#18 | 0.22%(+0.262)#1,355 |
| 19. | Snoqualmie Pass | 0.48% | 0.11%(+0.363)#19 | 0.22%(+0.261)#1,356 |
| 20. | Three Lakes | 0.48% | 0.11%(+0.363)#20 | 0.22%(+0.261)#1,357 |
| 21. | Larch Way | 0.45% | 0.11%(+0.342)#21 | 0.22%(+0.239)#1,409 |
| 22. | Elk Plain | 0.43% | 0.11%(+0.316)#22 | 0.22%(+0.214)#1,463 |
| 23. | Maple Heights Lake Desire | 0.41% | 0.11%(+0.294)#23 | 0.22%(+0.192)#1,514 |
| 24. | Seatac | 0.41% | 0.11%(+0.294)#24 | 0.22%(+0.192)#1,515 |
| 25. | Frederickson | 0.40% | 0.11%(+0.283)#25 | 0.22%(+0.181)#1,555 |
| 26. | Wapato | 0.39% | 0.11%(+0.278)#26 | 0.22%(+0.176)#1,567 |
| 27. | Bonney Lake | 0.37% | 0.11%(+0.259)#27 | 0.22%(+0.157)#1,618 |
| 28. | Pomeroy | 0.36% | 0.11%(+0.245)#28 | 0.22%(+0.143)#1,654 |
| 29. | Olympia | 0.36% | 0.11%(+0.242)#29 | 0.22%(+0.140)#1,660 |
| 30. | Mercer Island | 0.35% | 0.11%(+0.233)#30 | 0.22%(+0.130)#1,686 |
| 31. | Colville | 0.35% | 0.11%(+0.232)#31 | 0.22%(+0.130)#1,691 |
| 32. | Castle Rock | 0.34% | 0.11%(+0.230)#32 | 0.22%(+0.128)#1,699 |
| 33. | Edgewood | 0.34% | 0.11%(+0.226)#33 | 0.22%(+0.124)#1,715 |
| 34. | Nisqually Indian Community | 0.34% | 0.11%(+0.224)#34 | 0.22%(+0.122)#1,719 |
| 35. | Walla Walla | 0.33% | 0.11%(+0.215)#35 | 0.22%(+0.113)#1,740 |
| 36. | Colton | 0.29% | 0.11%(+0.181)#36 | 0.22%(+0.079)#1,841 |
| 37. | Bellingham | 0.29% | 0.11%(+0.176)#37 | 0.22%(+0.074)#1,868 |
| 38. | Fairwood Cdp King County | 0.28% | 0.11%(+0.166)#38 | 0.22%(+0.064)#1,906 |
| 39. | Mill Creek East | 0.27% | 0.11%(+0.156)#39 | 0.22%(+0.053)#1,951 |
| 40. | South Hill | 0.26% | 0.11%(+0.145)#40 | 0.22%(+0.043)#2,009 |
| 41. | Hazel Dell | 0.25% | 0.11%(+0.138)#41 | 0.22%(+0.036)#2,045 |
| 42. | Union Hill Novelty Hill | 0.25% | 0.11%(+0.137)#42 | 0.22%(+0.035)#2,049 |
| 43. | Vashon | 0.25% | 0.11%(+0.134)#43 | 0.22%(+0.032)#2,074 |
| 44. | Kent | 0.24% | 0.11%(+0.132)#44 | 0.22%(+0.030)#2,080 |
| 45. | Edmonds | 0.23% | 0.11%(+0.121)#45 | 0.22%(+0.019)#2,122 |
| 46. | Artondale | 0.22% | 0.11%(+0.111)#46 | 0.22%(+0.008)#2,161 |
| 47. | Seattle | 0.21% | 0.11%(+0.098)#47 | 0.22%(-0.005)#2,222 |
| 48. | Mukilteo | 0.21% | 0.11%(+0.098)#48 | 0.22%(-0.005)#2,223 |
| 49. | Felida | 0.21% | 0.11%(+0.096)#49 | 0.22%(-0.006)#2,237 |
| 50. | Cheney | 0.20% | 0.11%(+0.089)#50 | 0.22%(-0.013)#2,273 |
| 51. | Des Moines | 0.19% | 0.11%(+0.080)#51 | 0.22%(-0.022)#2,326 |
| 52. | Washougal | 0.19% | 0.11%(+0.077)#52 | 0.22%(-0.025)#2,346 |
| 53. | Camas | 0.18% | 0.11%(+0.069)#53 | 0.22%(-0.033)#2,393 |
| 54. | Kirkland | 0.18% | 0.11%(+0.065)#54 | 0.22%(-0.037)#2,406 |
| 55. | Lake Forest Park | 0.17% | 0.11%(+0.058)#55 | 0.22%(-0.044)#2,447 |
| 56. | Sedro Woolley | 0.17% | 0.11%(+0.055)#56 | 0.22%(-0.047)#2,462 |
| 57. | Yarrow Point | 0.16% | 0.11%(+0.043)#57 | 0.22%(-0.059)#2,530 |
| 58. | Sammamish | 0.15% | 0.11%(+0.042)#58 | 0.22%(-0.061)#2,550 |
| 59. | Kennewick | 0.15% | 0.11%(+0.037)#59 | 0.22%(-0.065)#2,576 |
| 60. | Shoreline | 0.15% | 0.11%(+0.035)#60 | 0.22%(-0.067)#2,587 |
| 61. | Moses Lake | 0.14% | 0.11%(+0.022)#61 | 0.22%(-0.080)#2,661 |
| 62. | Pullman | 0.13% | 0.11%(+0.021)#62 | 0.22%(-0.081)#2,667 |
| 63. | North Lynnwood | 0.13% | 0.11%(+0.019)#63 | 0.22%(-0.083)#2,680 |
| 64. | Issaquah | 0.13% | 0.11%(+0.019)#64 | 0.22%(-0.083)#2,681 |
| 65. | Marysville | 0.13% | 0.11%(+0.017)#65 | 0.22%(-0.085)#2,697 |
| 66. | Federal Way | 0.13% | 0.11%(+0.013)#66 | 0.22%(-0.089)#2,719 |
| 67. | North Fort Lewis | 0.12% | 0.11%(+0.003)#67 | 0.22%(-0.099)#2,790 |
| 68. | Maltby | 0.11% | 0.11%(+0.002)#68 | 0.22%(-0.101)#2,803 |
| 69. | Ferndale | 0.11% | 0.11%(-0.001)#69 | 0.22%(-0.103)#2,816 |
| 70. | Fort Lewis | 0.10% | 0.11%(-0.009)#70 | 0.22%(-0.111)#2,867 |
| 71. | Burien | 0.10% | 0.11%(-0.012)#71 | 0.22%(-0.114)#2,891 |
| 72. | Manchester | 0.099% | 0.11%(-0.014)#72 | 0.22%(-0.116)#2,902 |
| 73. | East Renton Highlands | 0.099% | 0.11%(-0.014)#73 | 0.22%(-0.116)#2,904 |
| 74. | Lakeland South | 0.095% | 0.11%(-0.018)#74 | 0.22%(-0.120)#2,939 |
| 75. | Auburn | 0.093% | 0.11%(-0.020)#75 | 0.22%(-0.122)#2,955 |
| 76. | Cashmere | 0.092% | 0.11%(-0.021)#76 | 0.22%(-0.123)#2,961 |
| 77. | Battle Ground | 0.091% | 0.11%(-0.022)#77 | 0.22%(-0.124)#2,975 |
| 78. | Maplewood | 0.091% | 0.11%(-0.022)#78 | 0.22%(-0.125)#2,977 |
| 79. | Puyallup | 0.089% | 0.11%(-0.024)#79 | 0.22%(-0.126)#2,988 |
| 80. | Redmond | 0.085% | 0.11%(-0.028)#80 | 0.22%(-0.130)#3,015 |
| 81. | Vancouver | 0.080% | 0.11%(-0.033)#81 | 0.22%(-0.135)#3,056 |
| 82. | Cottage Lake | 0.077% | 0.11%(-0.036)#82 | 0.22%(-0.138)#3,075 |
| 83. | Lake Stevens | 0.077% | 0.11%(-0.036)#83 | 0.22%(-0.138)#3,078 |
| 84. | Renton | 0.076% | 0.11%(-0.037)#84 | 0.22%(-0.139)#3,092 |
| 85. | Fife | 0.073% | 0.11%(-0.040)#85 | 0.22%(-0.142)#3,117 |
| 86. | Sudden Valley | 0.070% | 0.11%(-0.043)#86 | 0.22%(-0.145)#3,147 |
| 87. | Tacoma | 0.069% | 0.11%(-0.044)#87 | 0.22%(-0.146)#3,158 |
| 88. | University Place | 0.069% | 0.11%(-0.044)#88 | 0.22%(-0.146)#3,160 |
| 89. | Bremerton | 0.068% | 0.11%(-0.045)#89 | 0.22%(-0.147)#3,173 |
| 90. | Country Homes | 0.064% | 0.11%(-0.049)#90 | 0.22%(-0.151)#3,206 |
| 91. | Mountlake Terrace | 0.061% | 0.11%(-0.052)#91 | 0.22%(-0.154)#3,235 |
| 92. | Bothell West | 0.058% | 0.11%(-0.055)#92 | 0.22%(-0.157)#3,255 |
| 93. | Salmon Creek | 0.054% | 0.11%(-0.059)#93 | 0.22%(-0.161)#3,303 |
| 94. | Spanaway | 0.053% | 0.11%(-0.060)#94 | 0.22%(-0.162)#3,316 |
| 95. | Bellevue | 0.052% | 0.11%(-0.061)#95 | 0.22%(-0.163)#3,323 |
| 96. | Anacortes | 0.045% | 0.11%(-0.068)#96 | 0.22%(-0.170)#3,377 |
| 97. | Lakewood | 0.029% | 0.11%(-0.085)#97 | 0.22%(-0.187)#3,531 |
| 98. | Indianola | 0.028% | 0.11%(-0.085)#98 | 0.22%(-0.187)#3,533 |
| 99. | Orchards | 0.027% | 0.11%(-0.086)#99 | 0.22%(-0.188)#3,544 |
| 100. | Pasco | 0.027% | 0.11%(-0.086)#100 | 0.22%(-0.188)#3,548 |
Common Questions
What are the Top 10 Cities with the Highest Percentage of Peruvian Population in Washington?
Top 10 Cities with the Highest Percentage of Peruvian Population in Washington are:
#1
1.51%
#2
1.37%
#3
1.30%
#4
1.29%
#5
1.05%
#6
1.00%
#7
0.99%
#8
0.96%
#9
0.72%
#10
0.61%
What city has the Highest Percentage of Peruvian Population in Washington?
Snoqualmie has the Highest Percentage of Peruvian Population in Washington with 1.51%.
What is the Percentage of Peruvian Population in the State of Washington?
Percentage of Peruvian Population in Washington is 0.11%.
What is the Percentage of Peruvian Population in the United States?
Percentage of Peruvian Population in the United States is 0.22%.