Cities with the Highest Percentage of Immigrants from Pakistan in Washington
RELATED REPORTS & OPTIONS
Pakistan
Washington
Compare Cities
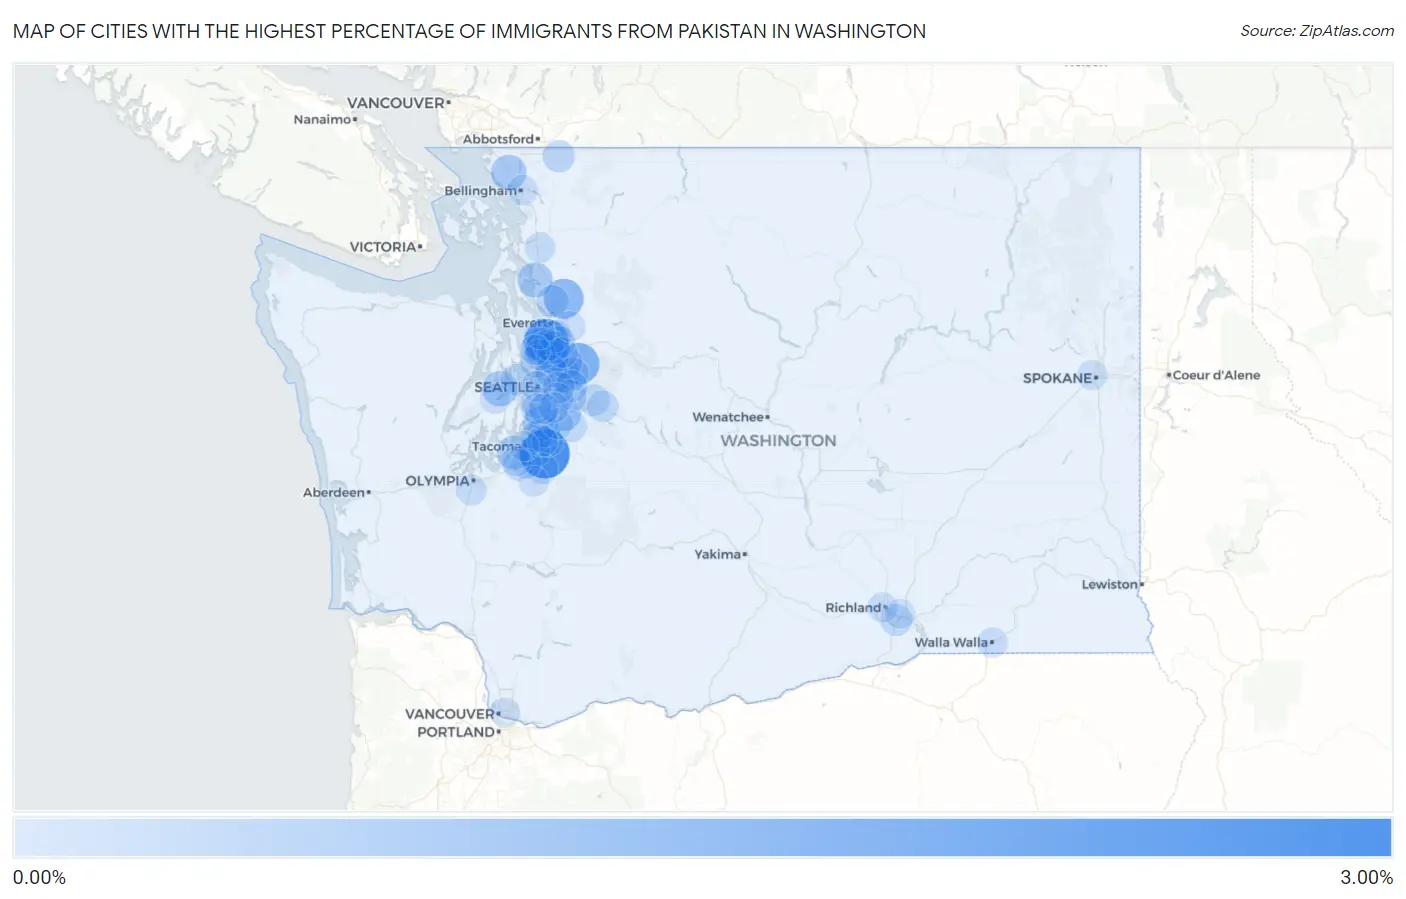
Map of Cities with the Highest Percentage of Immigrants from Pakistan in Washington
0.00%
3.00%
Cities with the Highest Percentage of Immigrants from Pakistan in Washington
| City | Pakistan | vs State | vs National | |
| 1. | North Puyallup | 2.91% | 0.082%(+2.83)#-1 | 0.12%(+2.80)#0 |
| 2. | Lake Stickney | 2.11% | 0.082%(+2.02)#15 | 0.12%(+1.99)#511 |
| 3. | Duvall | 1.67% | 0.082%(+1.59)#16 | 0.12%(+1.55)#512 |
| 4. | Sisco Heights | 1.41% | 0.082%(+1.33)#17 | 0.12%(+1.29)#513 |
| 5. | Ferndale | 0.79% | 0.082%(+0.705)#18 | 0.12%(+0.668)#514 |
| 6. | Rocky Point | 0.78% | 0.082%(+0.694)#19 | 0.12%(+0.657)#515 |
| 7. | Medina | 0.75% | 0.082%(+0.671)#20 | 0.12%(+0.634)#621 |
| 8. | Stanwood | 0.73% | 0.082%(+0.651)#21 | 0.12%(+0.614)#622 |
| 9. | North Lynnwood | 0.70% | 0.082%(+0.620)#23 | 0.12%(+0.583)#850 |
| 10. | Des Moines | 0.65% | 0.082%(+0.570)#24 | 0.12%(+0.533)#851 |
| 11. | Bothell East | 0.65% | 0.082%(+0.563)#25 | 0.12%(+0.526)#852 |
| 12. | Maple Heights Lake Desire | 0.64% | 0.082%(+0.558)#26 | 0.12%(+0.521)#853 |
| 13. | University Place | 0.54% | 0.082%(+0.460)#27 | 0.12%(+0.423)#854 |
| 14. | Redmond | 0.48% | 0.082%(+0.397)#28 | 0.12%(+0.360)#862 |
| 15. | Meadowdale | 0.47% | 0.082%(+0.386)#29 | 0.12%(+0.348)#863 |
| 16. | Lynnwood | 0.43% | 0.082%(+0.352)#30 | 0.12%(+0.315)#864 |
| 17. | Union Hill Novelty Hill | 0.39% | 0.082%(+0.311)#34 | 0.12%(+0.274)#988 |
| 18. | Shoreline | 0.39% | 0.082%(+0.303)#41 | 0.12%(+0.266)#1,169 |
| 19. | Issaquah | 0.38% | 0.082%(+0.294)#42 | 0.12%(+0.257)#1,170 |
| 20. | Cottage Lake | 0.34% | 0.082%(+0.262)#43 | 0.12%(+0.225)#1,171 |
| 21. | Seatac | 0.34% | 0.082%(+0.254)#44 | 0.12%(+0.217)#1,172 |
| 22. | Bothell | 0.33% | 0.082%(+0.252)#45 | 0.12%(+0.215)#1,173 |
| 23. | Silver Firs | 0.33% | 0.082%(+0.251)#46 | 0.12%(+0.214)#1,174 |
| 24. | Waller | 0.33% | 0.082%(+0.244)#47 | 0.12%(+0.206)#1,175 |
| 25. | Mill Creek East | 0.32% | 0.082%(+0.238)#48 | 0.12%(+0.201)#1,176 |
| 26. | Kirkland | 0.32% | 0.082%(+0.234)#49 | 0.12%(+0.197)#1,177 |
| 27. | Marysville | 0.31% | 0.082%(+0.231)#50 | 0.12%(+0.194)#1,178 |
| 28. | Sammamish | 0.30% | 0.082%(+0.215)#51 | 0.12%(+0.178)#1,179 |
| 29. | Peaceful Valley | 0.29% | 0.082%(+0.213)#52 | 0.12%(+0.176)#1,180 |
| 30. | Lakeland North | 0.27% | 0.082%(+0.192)#53 | 0.12%(+0.155)#1,181 |
| 31. | Eastmont | 0.27% | 0.082%(+0.186)#54 | 0.12%(+0.149)#1,182 |
| 32. | Kennewick | 0.26% | 0.082%(+0.183)#55 | 0.12%(+0.146)#1,183 |
| 33. | Newcastle | 0.25% | 0.082%(+0.166)#56 | 0.12%(+0.129)#1,184 |
| 34. | Snoqualmie | 0.24% | 0.082%(+0.158)#57 | 0.12%(+0.121)#1,185 |
| 35. | White Center | 0.24% | 0.082%(+0.157)#58 | 0.12%(+0.120)#1,186 |
| 36. | Bellevue | 0.23% | 0.082%(+0.149)#59 | 0.12%(+0.112)#1,187 |
| 37. | North Bend | 0.21% | 0.082%(+0.130)#60 | 0.12%(+0.093)#1,188 |
| 38. | Bainbridge Island | 0.21% | 0.082%(+0.129)#61 | 0.12%(+0.092)#1,189 |
| 39. | Maple Valley | 0.21% | 0.082%(+0.126)#62 | 0.12%(+0.089)#1,190 |
| 40. | Federal Way | 0.19% | 0.082%(+0.108)#63 | 0.12%(+0.071)#1,191 |
| 41. | Mcchord Afb | 0.17% | 0.082%(+0.091)#64 | 0.12%(+0.054)#1,192 |
| 42. | Mountlake Terrace | 0.17% | 0.082%(+0.087)#65 | 0.12%(+0.050)#1,193 |
| 43. | Algona | 0.15% | 0.082%(+0.071)#66 | 0.12%(+0.034)#1,194 |
| 44. | Kent | 0.15% | 0.082%(+0.068)#67 | 0.12%(+0.030)#1,195 |
| 45. | Martha Lake | 0.14% | 0.082%(+0.060)#68 | 0.12%(+0.023)#1,196 |
| 46. | Mukilteo | 0.11% | 0.082%(+0.030)#69 | 0.12%(-0.007)#1,197 |
| 47. | South Hill | 0.11% | 0.082%(+0.026)#70 | 0.12%(-0.011)#1,198 |
| 48. | Lakeland South | 0.095% | 0.082%(+0.013)#71 | 0.12%(-0.024)#1,199 |
| 49. | Mount Vernon | 0.091% | 0.082%(+0.009)#72 | 0.12%(-0.028)#1,200 |
| 50. | Tumwater | 0.090% | 0.082%(+0.008)#73 | 0.12%(-0.029)#1,201 |
| 51. | Seattle | 0.088% | 0.082%(+0.006)#74 | 0.12%(-0.031)#1,202 |
| 52. | Maltby | 0.079% | 0.082%(-0.003)#75 | 0.12%(-0.040)#1,203 |
| 53. | Bremerton | 0.066% | 0.082%(-0.016)#76 | 0.12%(-0.053)#1,204 |
| 54. | Burien | 0.064% | 0.082%(-0.018)#77 | 0.12%(-0.055)#1,205 |
| 55. | Everett | 0.061% | 0.082%(-0.021)#78 | 0.12%(-0.058)#1,206 |
| 56. | Elk Plain | 0.056% | 0.082%(-0.026)#79 | 0.12%(-0.063)#1,207 |
| 57. | Bellingham | 0.046% | 0.082%(-0.036)#80 | 0.12%(-0.073)#1,208 |
| 58. | Renton | 0.039% | 0.082%(-0.043)#81 | 0.12%(-0.080)#1,209 |
| 59. | Richland | 0.036% | 0.082%(-0.046)#82 | 0.12%(-0.083)#1,210 |
| 60. | Edmonds | 0.033% | 0.082%(-0.049)#83 | 0.12%(-0.086)#1,211 |
| 61. | Tukwila | 0.032% | 0.082%(-0.049)#84 | 0.12%(-0.087)#1,212 |
| 62. | Walla Walla | 0.030% | 0.082%(-0.052)#85 | 0.12%(-0.089)#1,221 |
| 63. | Spokane | 0.017% | 0.082%(-0.065)#86 | 0.12%(-0.102)#1,222 |
| 64. | Pasco | 0.016% | 0.082%(-0.066)#87 | 0.12%(-0.103)#1,223 |
| 65. | Parkland | 0.015% | 0.082%(-0.067)#88 | 0.12%(-0.104)#1,224 |
| 66. | Lakewood | 0.011% | 0.082%(-0.071)#89 | 0.12%(-0.108)#1,225 |
| 67. | Tacoma | 0.0091% | 0.082%(-0.073)#90 | 0.12%(-0.110)#1,226 |
| 68. | Vancouver | 0.0037% | 0.082%(-0.078)#91 | 0.12%(-0.115)#1,258 |
Common Questions
What are the Top 10 Cities with the Highest Percentage of Immigrants from Pakistan in Washington?
Top 10 Cities with the Highest Percentage of Immigrants from Pakistan in Washington are:
#1
2.91%
#2
2.11%
#3
1.67%
#4
1.41%
#5
0.79%
#6
0.78%
#7
0.75%
#8
0.73%
#9
0.70%
#10
0.65%
What city has the Highest Percentage of Immigrants from Pakistan in Washington?
North Puyallup has the Highest Percentage of Immigrants from Pakistan in Washington with 2.91%.
What is the Percentage of Immigrants from Pakistan in the State of Washington?
Percentage of Immigrants from Pakistan in Washington is 0.082%.
What is the Percentage of Immigrants from Pakistan in the United States?
Percentage of Immigrants from Pakistan in the United States is 0.12%.