Sandy Point, TX
Sandy Point Map
Sandy Point Overview
179
TOTAL POPULATION
87
MALE POPULATION
92
FEMALE POPULATION
94.57
MALES / 100 FEMALES
105.75
FEMALES / 100 MALES
49.2
MEDIAN AGE
3.3
AVG FAMILY SIZE
2.7
AVG HOUSEHOLD SIZE
$40,898
PER CAPITA INCOME
$88,036
AVG FAMILY INCOME
$80,625
AVG HOUSEHOLD INCOME
15.2%
WAGE / INCOME GAP [ % ]
84.8¢/ $1
WAGE / INCOME GAP [ $ ]
0.56
INEQUALITY / GINI INDEX
83
LABOR FORCE [ PEOPLE ]
51.2%
PERCENT IN LABOR FORCE
1.2%
UNEMPLOYMENT RATE
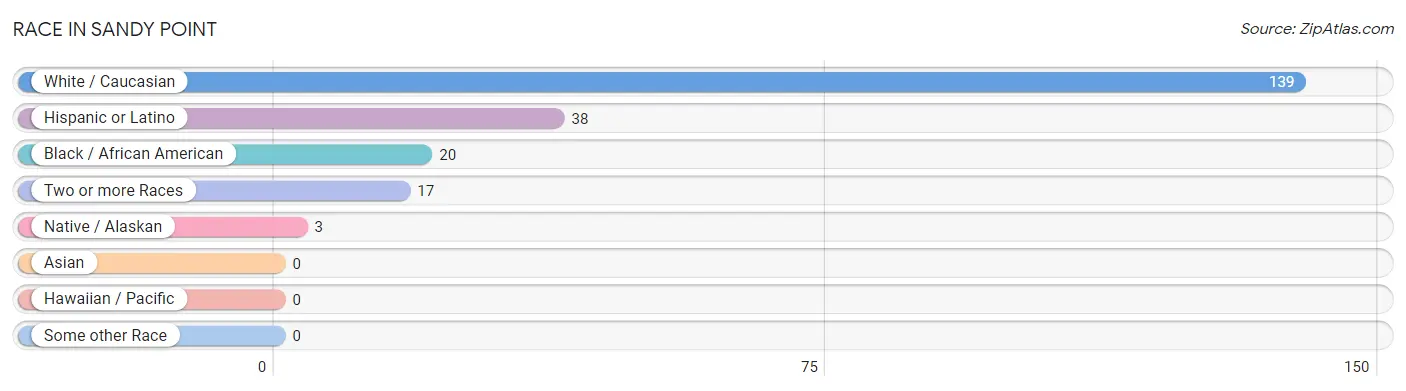
Race in Sandy Point
The most populous races in Sandy Point are White / Caucasian (139 | 77.6%), Hispanic or Latino (38 | 21.2%), and Black / African American (20 | 11.2%).
| Race | # Population | % Population |
| Asian | 0 | 0.0% |
| Black / African American | 20 | 11.2% |
| Hawaiian / Pacific | 0 | 0.0% |
| Hispanic or Latino | 38 | 21.2% |
| Native / Alaskan | 3 | 1.7% |
| White / Caucasian | 139 | 77.6% |
| Two or more Races | 17 | 9.5% |
| Some other Race | 0 | 0.0% |
| Total | 179 | 100.0% |
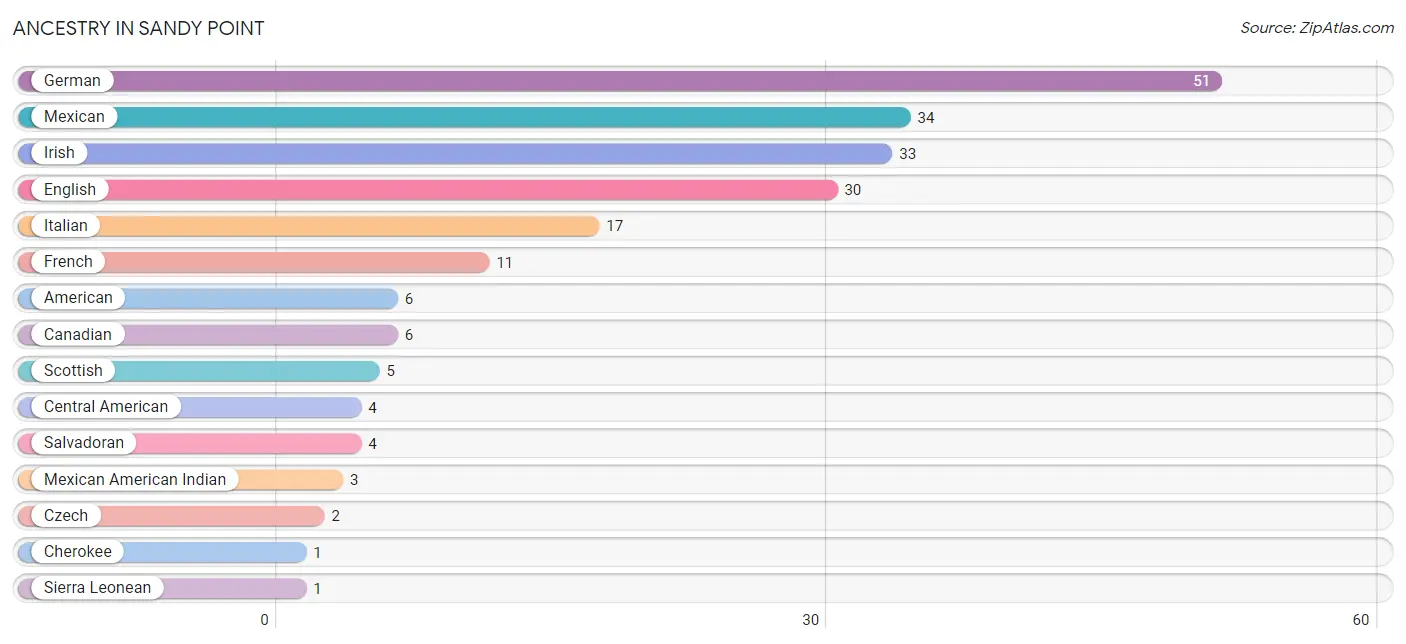
Ancestry in Sandy Point
The most populous ancestries reported in Sandy Point are German (51 | 28.5%), Mexican (34 | 19.0%), Irish (33 | 18.4%), English (30 | 16.8%), and Italian (17 | 9.5%), together accounting for 92.2% of all Sandy Point residents.
| Ancestry | # Population | % Population |
| American | 6 | 3.4% |
| Canadian | 6 | 3.4% |
| Central American | 4 | 2.2% |
| Cherokee | 1 | 0.6% |
| Czech | 2 | 1.1% |
| English | 30 | 16.8% |
| French | 11 | 6.1% |
| German | 51 | 28.5% |
| Irish | 33 | 18.4% |
| Italian | 17 | 9.5% |
| Mexican | 34 | 19.0% |
| Mexican American Indian | 3 | 1.7% |
| Salvadoran | 4 | 2.2% |
| Scottish | 5 | 2.8% |
| Sierra Leonean | 1 | 0.6% |
| Subsaharan African | 1 | 0.6% | View All 16 Rows |
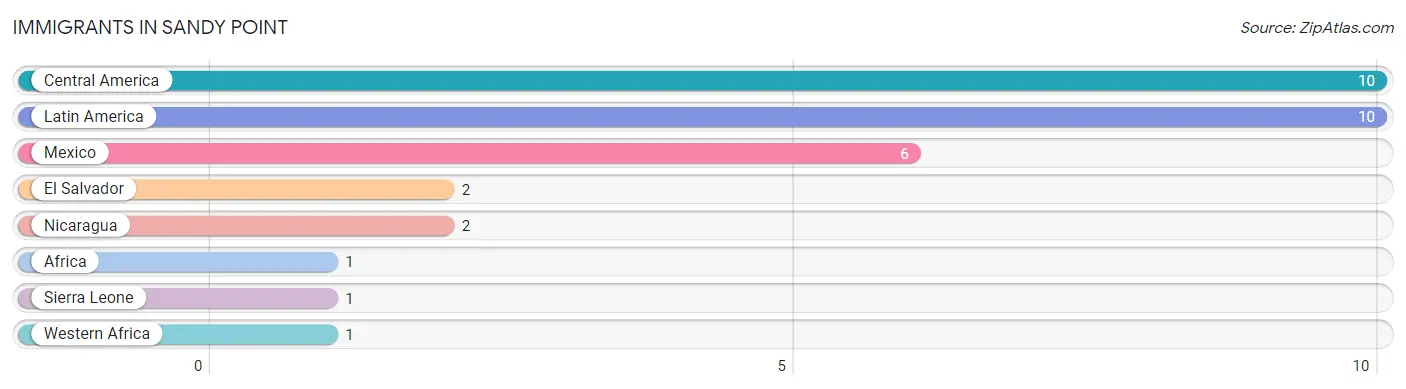
Immigrants in Sandy Point
The most numerous immigrant groups reported in Sandy Point came from Central America (10 | 5.6%), Latin America (10 | 5.6%), Mexico (6 | 3.4%), El Salvador (2 | 1.1%), and Nicaragua (2 | 1.1%), together accounting for 16.8% of all Sandy Point residents.
| Immigration Origin | # Population | % Population |
| Africa | 1 | 0.6% |
| Central America | 10 | 5.6% |
| El Salvador | 2 | 1.1% |
| Latin America | 10 | 5.6% |
| Mexico | 6 | 3.4% |
| Nicaragua | 2 | 1.1% |
| Sierra Leone | 1 | 0.6% |
| Western Africa | 1 | 0.6% | View All 8 Rows |
Sex and Age in Sandy Point
Sex and Age in Sandy Point
The most populous age groups in Sandy Point are 20 to 24 Years (11 | 12.6%) for men and 55 to 59 Years (15 | 16.3%) for women.
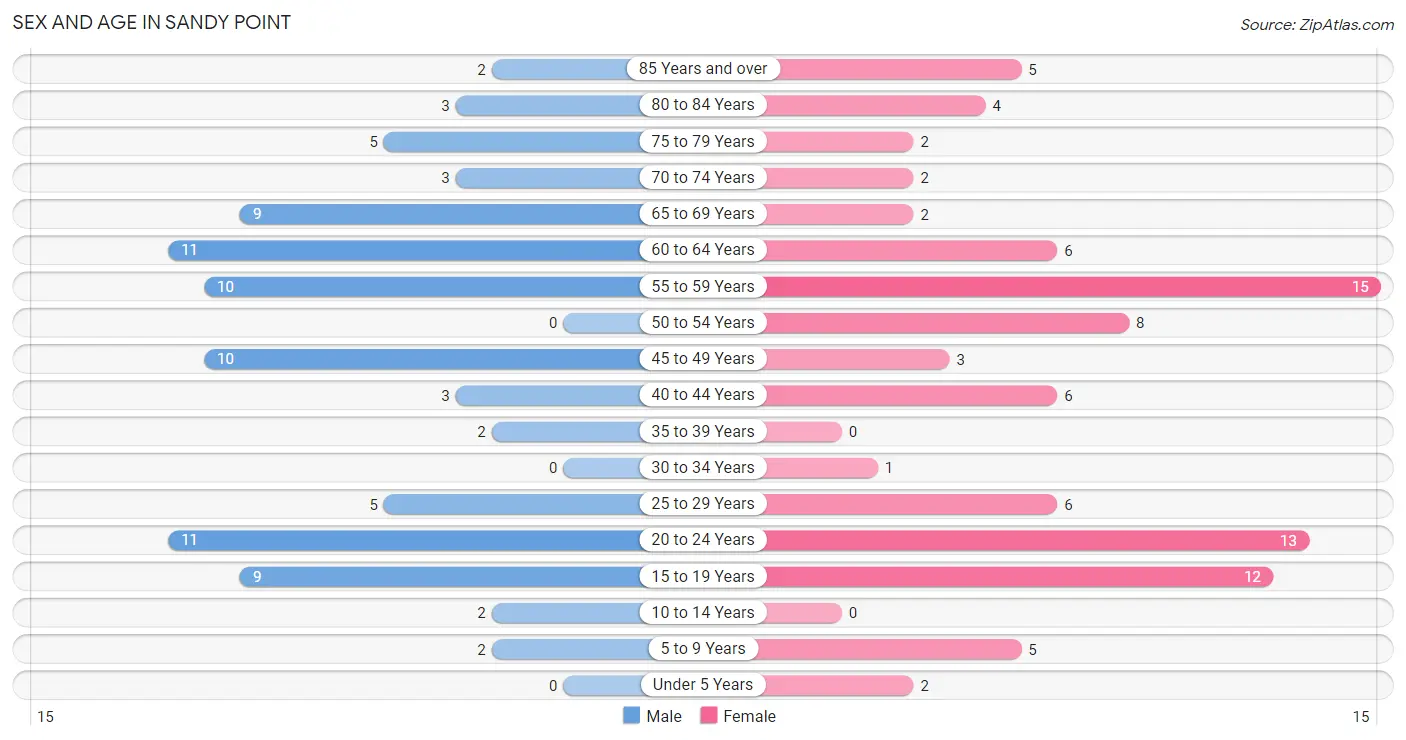
| Age Bracket | Male | Female |
| Under 5 Years | 0 (0.0%) | 2 (2.2%) |
| 5 to 9 Years | 2 (2.3%) | 5 (5.4%) |
| 10 to 14 Years | 2 (2.3%) | 0 (0.0%) |
| 15 to 19 Years | 9 (10.3%) | 12 (13.0%) |
| 20 to 24 Years | 11 (12.6%) | 13 (14.1%) |
| 25 to 29 Years | 5 (5.8%) | 6 (6.5%) |
| 30 to 34 Years | 0 (0.0%) | 1 (1.1%) |
| 35 to 39 Years | 2 (2.3%) | 0 (0.0%) |
| 40 to 44 Years | 3 (3.5%) | 6 (6.5%) |
| 45 to 49 Years | 10 (11.5%) | 3 (3.3%) |
| 50 to 54 Years | 0 (0.0%) | 8 (8.7%) |
| 55 to 59 Years | 10 (11.5%) | 15 (16.3%) |
| 60 to 64 Years | 11 (12.6%) | 6 (6.5%) |
| 65 to 69 Years | 9 (10.3%) | 2 (2.2%) |
| 70 to 74 Years | 3 (3.5%) | 2 (2.2%) |
| 75 to 79 Years | 5 (5.8%) | 2 (2.2%) |
| 80 to 84 Years | 3 (3.5%) | 4 (4.3%) |
| 85 Years and over | 2 (2.3%) | 5 (5.4%) |
| Total | 87 (100.0%) | 92 (100.0%) |
Families and Households in Sandy Point
Median Family Size in Sandy Point
The median family size in Sandy Point is 3.34 persons per family, with married-couple families (37 | 78.7%) accounting for the largest median family size of 3.59 persons per family. On the other hand, single male/father families (1 | 2.1%) represent the smallest median family size with 2.00 persons per family.
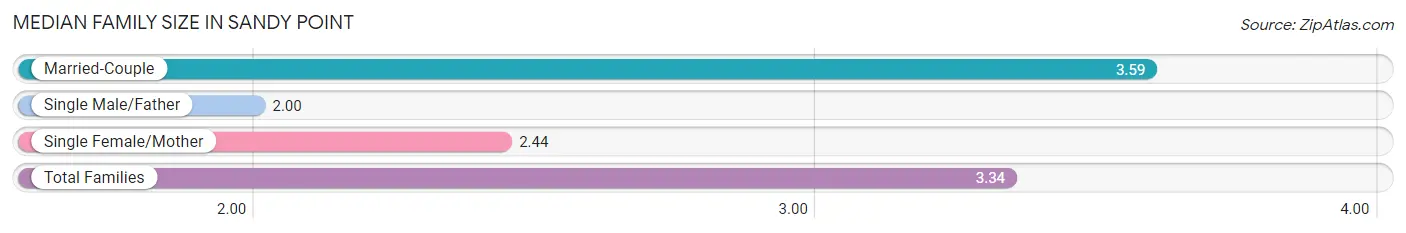
| Family Type | # Families | Family Size |
| Married-Couple | 37 (78.7%) | 3.59 |
| Single Male/Father | 1 (2.1%) | 2.00 |
| Single Female/Mother | 9 (19.2%) | 2.44 |
| Total Families | 47 (100.0%) | 3.34 |
Median Household Size in Sandy Point
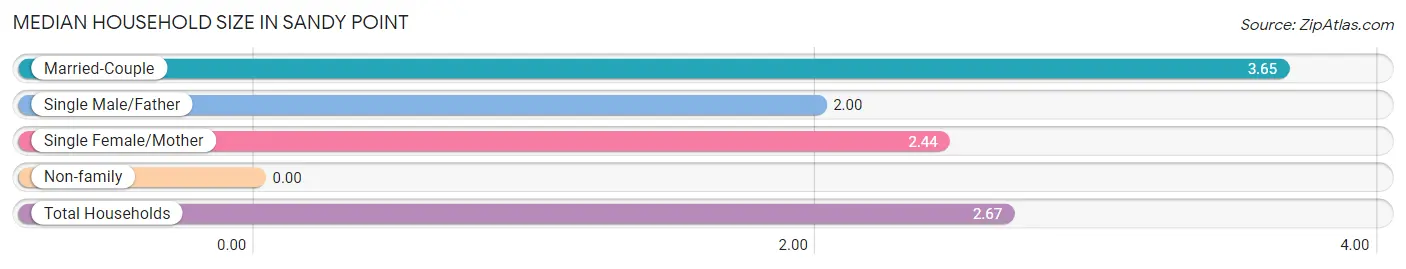
| Household Type | # Households | Household Size |
| Married-Couple | 37 (55.2%) | 3.65 |
| Single Male/Father | 1 (1.5%) | 2.00 |
| Single Female/Mother | 9 (13.4%) | 2.44 |
| Non-family | 20 (29.8%) | - |
| Total Households | 67 (100.0%) | 2.67 |
Household Size by Marriage Status in Sandy Point
Out of a total of 67 households in Sandy Point, 47 (70.2%) are family households, while 20 (29.8%) are nonfamily households. The most numerous type of family households are 2-person households, comprising 29, and the most common type of nonfamily households are 1-person households, comprising 20.
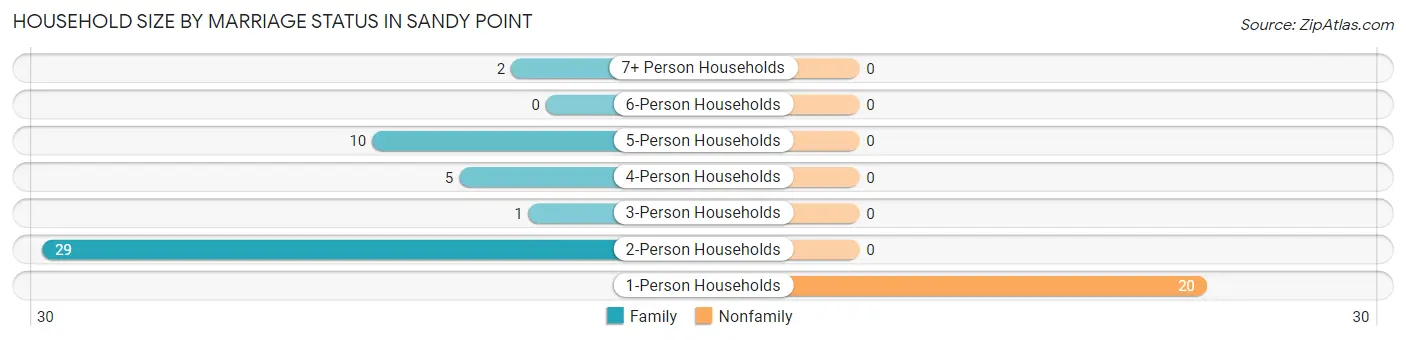
| Household Size | Family Households | Nonfamily Households |
| 1-Person Households | - | 20 (29.8%) |
| 2-Person Households | 29 (43.3%) | 0 (0.0%) |
| 3-Person Households | 1 (1.5%) | 0 (0.0%) |
| 4-Person Households | 5 (7.5%) | 0 (0.0%) |
| 5-Person Households | 10 (14.9%) | 0 (0.0%) |
| 6-Person Households | 0 (0.0%) | 0 (0.0%) |
| 7+ Person Households | 2 (3.0%) | 0 (0.0%) |
| Total | 47 (70.2%) | 20 (29.8%) |
Female Fertility in Sandy Point
Fertility by Age in Sandy Point
Average fertility rate in Sandy Point is 73.0 births per 1,000 women. Women in the age bracket of 20 to 34 years have the highest fertility rate with 150.0 births per 1,000 women. Women in the age bracket of 20 to 34 years acount for 100.0% of all women with births.
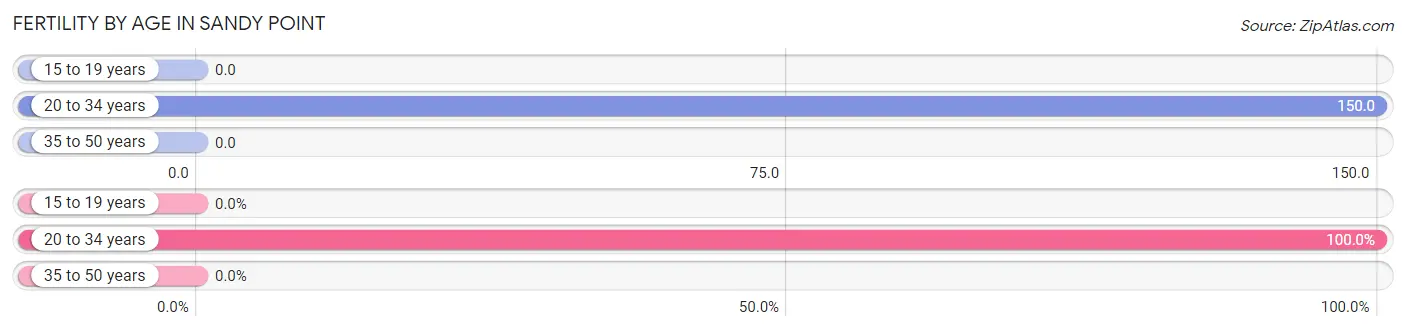
| Age Bracket | Women with Births | Births / 1,000 Women |
| 15 to 19 years | 0 (0.0%) | 0.0 |
| 20 to 34 years | 3 (100.0%) | 150.0 |
| 35 to 50 years | 0 (0.0%) | 0.0 |
| Total | 3 (100.0%) | 73.0 |
Fertility by Age by Marriage Status in Sandy Point
66.7% of women with births (3) in Sandy Point are married. The highest percentage of unmarried women with births falls into 20 to 34 years age bracket with 33.3% of them unmarried at the time of birth, while the lowest percentage of unmarried women with births belong to 20 to 34 years age bracket with 33.3% of them unmarried.
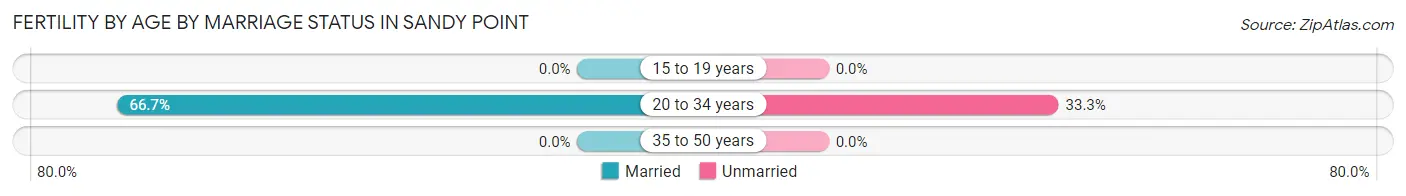
| Age Bracket | Married | Unmarried |
| 15 to 19 years | 0 (0.0%) | 0 (0.0%) |
| 20 to 34 years | 2 (66.7%) | 1 (33.3%) |
| 35 to 50 years | 0 (0.0%) | 0 (0.0%) |
| Total | 2 (66.7%) | 1 (33.3%) |
Fertility by Education in Sandy Point
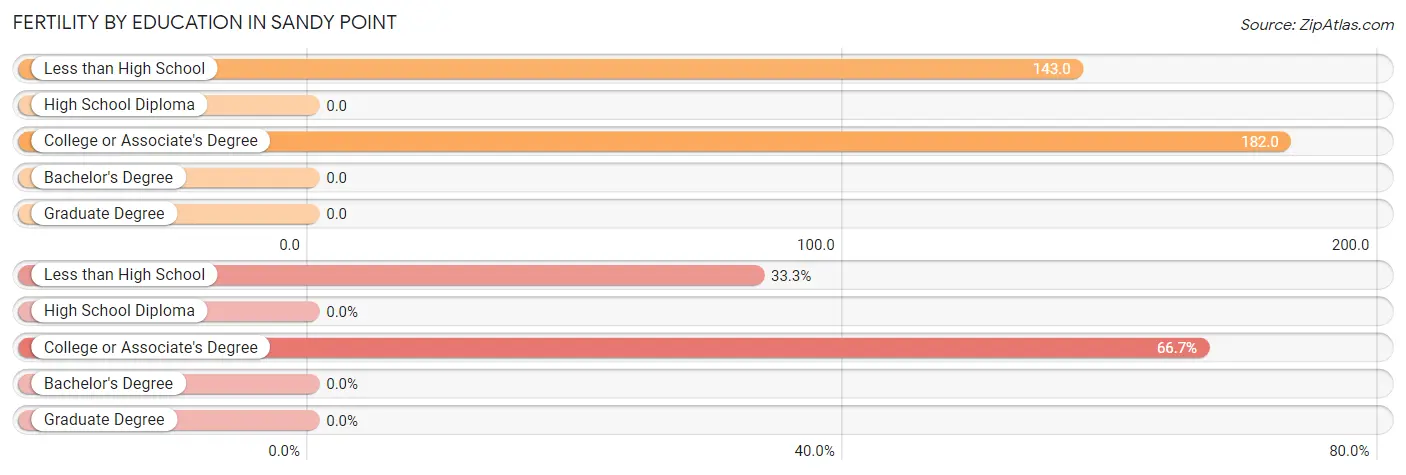
| Educational Attainment | Women with Births | Births / 1,000 Women |
| Less than High School | 1 (33.3%) | 143.0 |
| High School Diploma | 0 (0.0%) | 0.0 |
| College or Associate's Degree | 2 (66.7%) | 182.0 |
| Bachelor's Degree | 0 (0.0%) | 0.0 |
| Graduate Degree | 0 (0.0%) | 0.0 |
| Total | 3 (100.0%) | 73.0 |
Fertility by Education by Marriage Status in Sandy Point
33.3% of women with births in Sandy Point are unmarried. Women with the educational attainment of college or associate's degree are most likely to be married with 100.0% of them married at childbirth, while women with the educational attainment of less than high school are least likely to be married with 100.0% of them unmarried at childbirth.
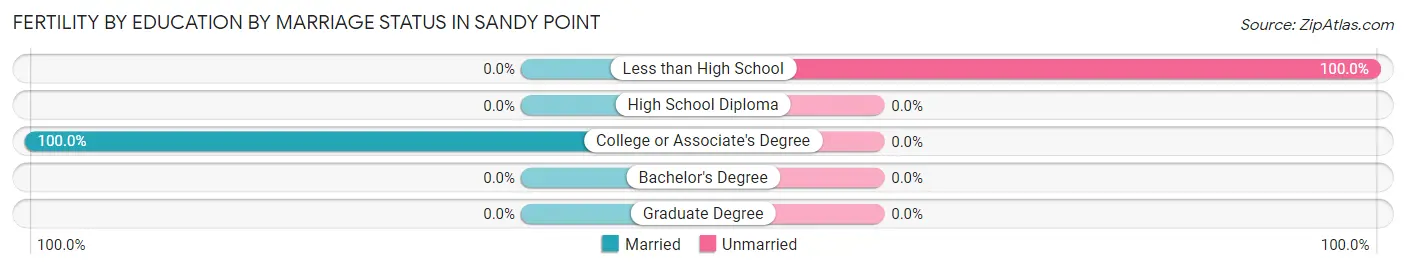
| Educational Attainment | Married | Unmarried |
| Less than High School | 0 (0.0%) | 1 (100.0%) |
| High School Diploma | 0 (0.0%) | 0 (0.0%) |
| College or Associate's Degree | 2 (100.0%) | 0 (0.0%) |
| Bachelor's Degree | 0 (0.0%) | 0 (0.0%) |
| Graduate Degree | 0 (0.0%) | 0 (0.0%) |
| Total | 2 (66.7%) | 1 (33.3%) |
Income in Sandy Point
Income Overview in Sandy Point
Per Capita Income in Sandy Point is $40,898, while median incomes of families and households are $88,036 and $80,625 respectively.
| Characteristic | Number | Measure |
| Per Capita Income | 179 | $40,898 |
| Median Family Income | 47 | $88,036 |
| Mean Family Income | 47 | $139,923 |
| Median Household Income | 67 | $80,625 |
| Mean Household Income | 67 | $106,627 |
| Income Deficit | 47 | $0 |
| Wage / Income Gap (%) | 179 | 15.20% |
| Wage / Income Gap ($) | 179 | 84.80¢ per $1 |
| Gini / Inequality Index | 179 | 0.56 |
Earnings by Sex in Sandy Point
Average Earnings in Sandy Point are $45,781, $45,313 for men and $53,438 for women, a difference of 15.2%.
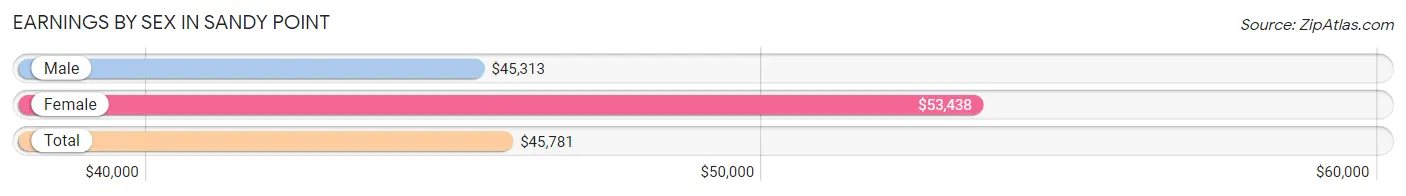
| Sex | Number | Average Earnings |
| Male | 50 (57.5%) | $45,313 |
| Female | 37 (42.5%) | $53,438 |
| Total | 87 (100.0%) | $45,781 |
Earnings by Sex by Income Bracket in Sandy Point
The most common earnings brackets in Sandy Point are $25,000 to $29,999 for men (13 | 26.0%) and $55,000 to $64,999 for women (15 | 40.5%).
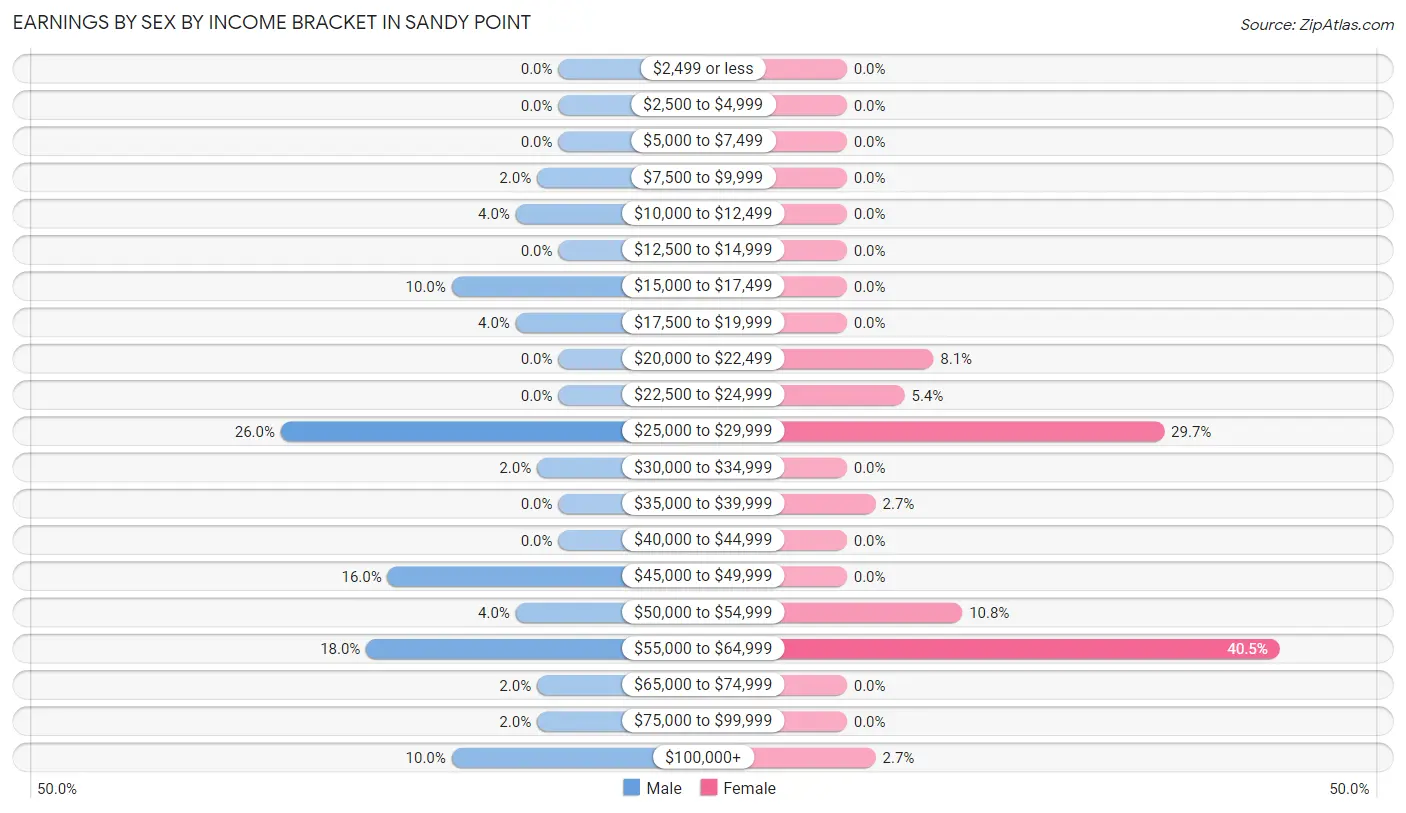
| Income | Male | Female |
| $2,499 or less | 0 (0.0%) | 0 (0.0%) |
| $2,500 to $4,999 | 0 (0.0%) | 0 (0.0%) |
| $5,000 to $7,499 | 0 (0.0%) | 0 (0.0%) |
| $7,500 to $9,999 | 1 (2.0%) | 0 (0.0%) |
| $10,000 to $12,499 | 2 (4.0%) | 0 (0.0%) |
| $12,500 to $14,999 | 0 (0.0%) | 0 (0.0%) |
| $15,000 to $17,499 | 5 (10.0%) | 0 (0.0%) |
| $17,500 to $19,999 | 2 (4.0%) | 0 (0.0%) |
| $20,000 to $22,499 | 0 (0.0%) | 3 (8.1%) |
| $22,500 to $24,999 | 0 (0.0%) | 2 (5.4%) |
| $25,000 to $29,999 | 13 (26.0%) | 11 (29.7%) |
| $30,000 to $34,999 | 1 (2.0%) | 0 (0.0%) |
| $35,000 to $39,999 | 0 (0.0%) | 1 (2.7%) |
| $40,000 to $44,999 | 0 (0.0%) | 0 (0.0%) |
| $45,000 to $49,999 | 8 (16.0%) | 0 (0.0%) |
| $50,000 to $54,999 | 2 (4.0%) | 4 (10.8%) |
| $55,000 to $64,999 | 9 (18.0%) | 15 (40.5%) |
| $65,000 to $74,999 | 1 (2.0%) | 0 (0.0%) |
| $75,000 to $99,999 | 1 (2.0%) | 0 (0.0%) |
| $100,000+ | 5 (10.0%) | 1 (2.7%) |
| Total | 50 (100.0%) | 37 (100.0%) |
Earnings by Sex by Educational Attainment in Sandy Point
Average earnings in Sandy Point are $46,094 for men and $55,250 for women, a difference of 16.6%. Men with an educational attainment of bachelor's degree enjoy the highest average annual earnings of $250,001, while those with high school diploma education earn the least with $29,583. Women with an educational attainment of high school diploma earn the most with the average annual earnings of $56,667, while those with bachelor's degree education have the smallest earnings of $54,375.
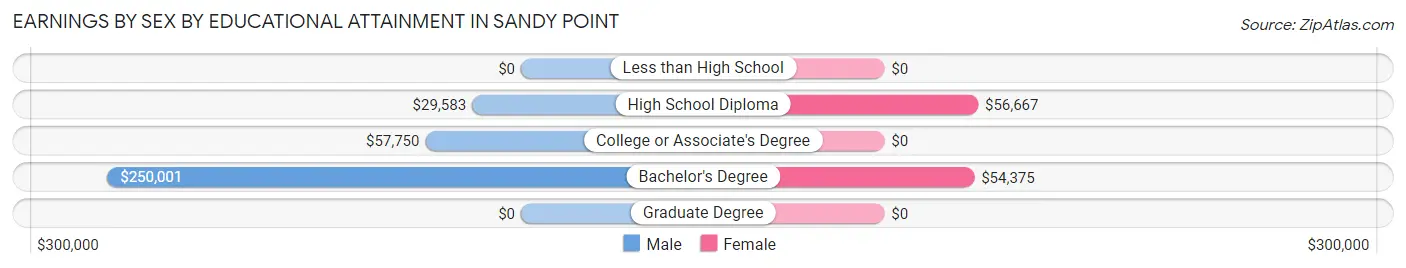
| Educational Attainment | Male Income | Female Income |
| Less than High School | - | - |
| High School Diploma | $29,583 | $56,667 |
| College or Associate's Degree | $57,750 | $0 |
| Bachelor's Degree | $250,001 | $54,375 |
| Graduate Degree | - | - |
| Total | $46,094 | $55,250 |
Family Income in Sandy Point
Family Income Brackets in Sandy Point
According to the Sandy Point family income data, there are 15 families falling into the $75,000 to $99,999 income range, which is the most common income bracket and makes up 31.9% of all families.
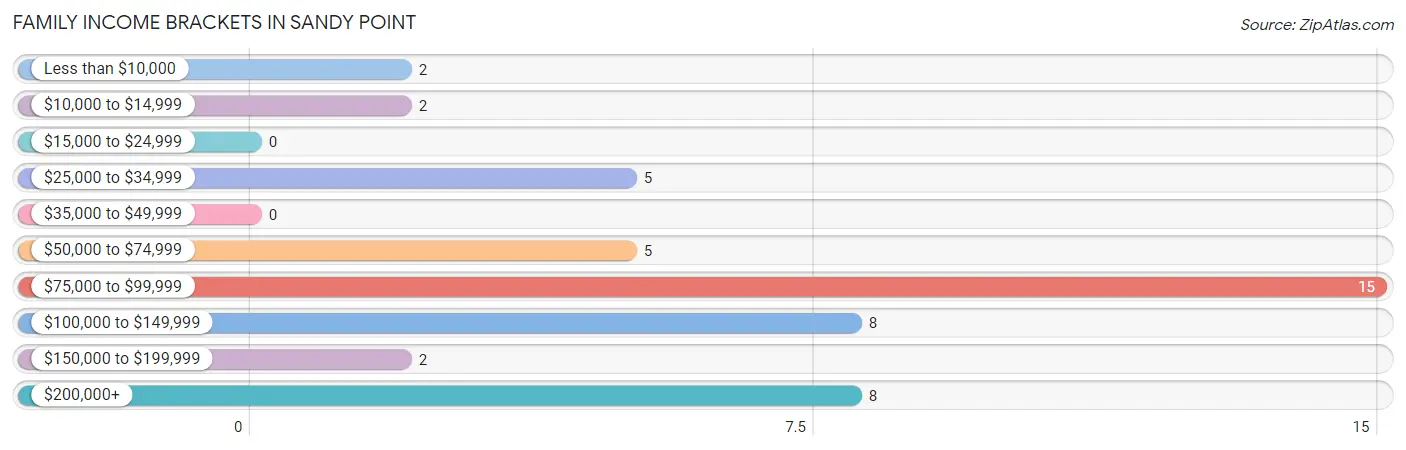
| Income Bracket | # Families | % Families |
| Less than $10,000 | 2 | 4.3% |
| $10,000 to $14,999 | 2 | 4.3% |
| $15,000 to $24,999 | 0 | 0.0% |
| $25,000 to $34,999 | 5 | 10.6% |
| $35,000 to $49,999 | 0 | 0.0% |
| $50,000 to $74,999 | 5 | 10.6% |
| $75,000 to $99,999 | 15 | 31.9% |
| $100,000 to $149,999 | 8 | 17.0% |
| $150,000 to $199,999 | 2 | 4.3% |
| $200,000+ | 8 | 17.0% |
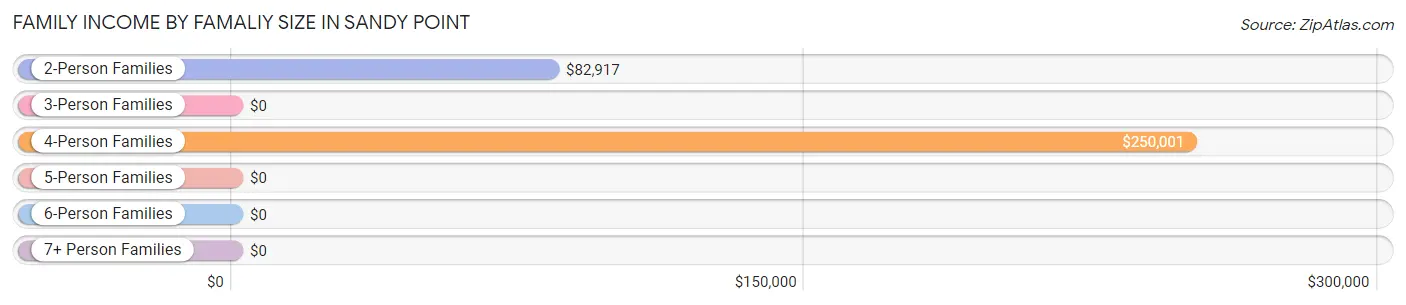
Family Income by Famaliy Size in Sandy Point
4-person families (5 | 10.6%) account for the highest median family income in Sandy Point with $250,001 per family, while 4-person families (5 | 10.6%) have the highest median income of $62,500 per family member.
| Income Bracket | # Families | Median Income |
| 2-Person Families | 30 (63.8%) | $82,917 |
| 3-Person Families | 0 (0.0%) | $0 |
| 4-Person Families | 5 (10.6%) | $250,001 |
| 5-Person Families | 10 (21.3%) | $0 |
| 6-Person Families | 0 (0.0%) | $0 |
| 7+ Person Families | 2 (4.3%) | $0 |
| Total | 47 (100.0%) | $88,036 |
Family Income by Number of Earners in Sandy Point
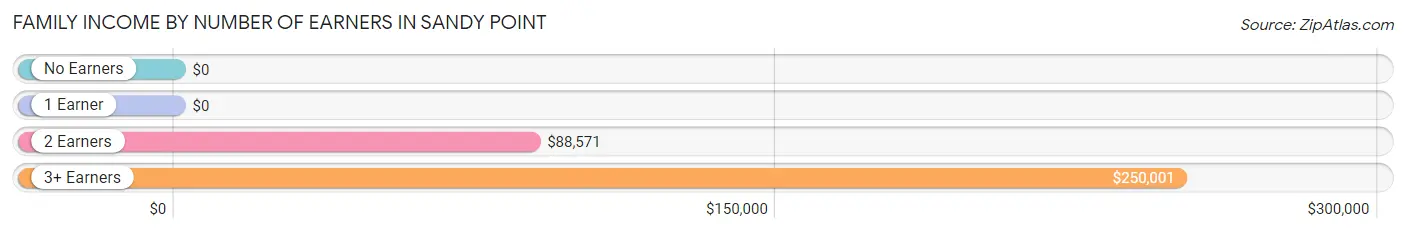
| Number of Earners | # Families | Median Income |
| No Earners | 4 (8.5%) | $0 |
| 1 Earner | 16 (34.0%) | $0 |
| 2 Earners | 22 (46.8%) | $88,571 |
| 3+ Earners | 5 (10.6%) | $250,001 |
| Total | 47 (100.0%) | $88,036 |
Household Income in Sandy Point
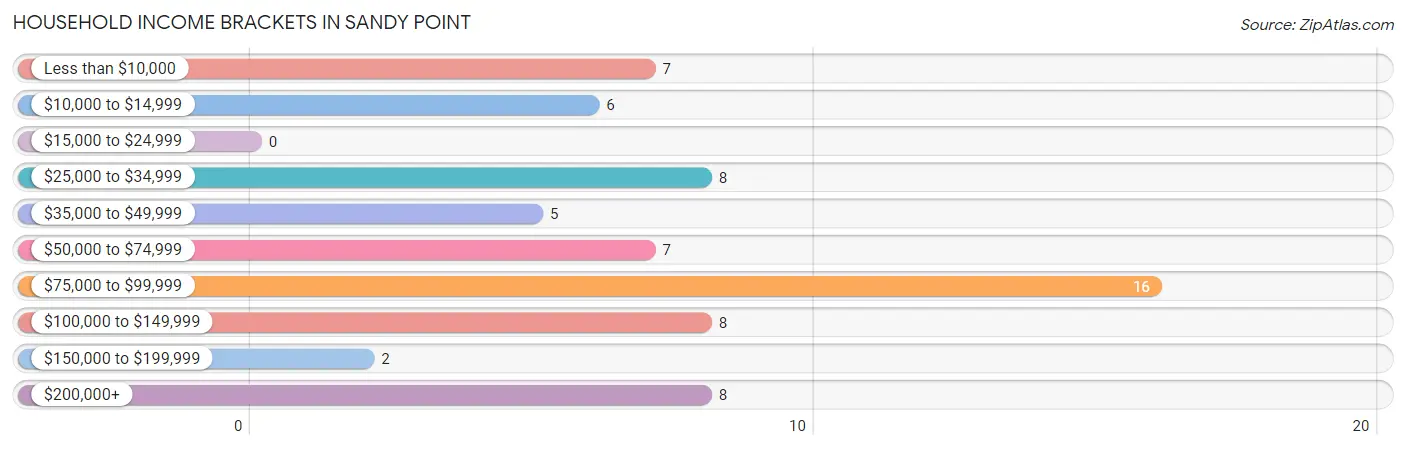
Household Income Brackets in Sandy Point
With 16 households falling in the category, the $75,000 to $99,999 income range is the most frequent in Sandy Point, accounting for 23.9% of all households.
| Income Bracket | # Households | % Households |
| Less than $10,000 | 7 | 10.4% |
| $10,000 to $14,999 | 6 | 9.0% |
| $15,000 to $24,999 | 0 | 0.0% |
| $25,000 to $34,999 | 8 | 11.9% |
| $35,000 to $49,999 | 5 | 7.5% |
| $50,000 to $74,999 | 7 | 10.4% |
| $75,000 to $99,999 | 16 | 23.9% |
| $100,000 to $149,999 | 8 | 11.9% |
| $150,000 to $199,999 | 2 | 3.0% |
| $200,000+ | 8 | 11.9% |
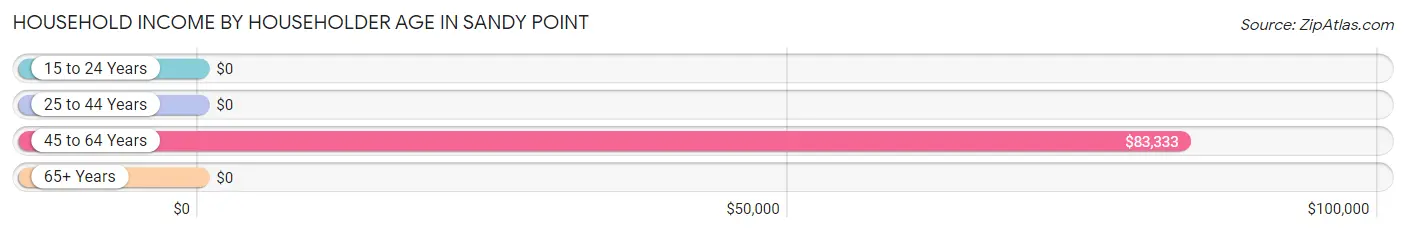
Household Income by Householder Age in Sandy Point
The median household income in Sandy Point is $80,625, with the highest median household income of $83,333 found in the 45 to 64 years age bracket for the primary householder. A total of 36 households (53.7%) fall into this category. Meanwhile, the 15 to 24 years age bracket for the primary householder has the lowest median household income of $0, with 5 households (7.5%) in this group.
| Income Bracket | # Households | Median Income |
| 15 to 24 Years | 5 (7.5%) | $0 |
| 25 to 44 Years | 5 (7.5%) | $0 |
| 45 to 64 Years | 36 (53.7%) | $83,333 |
| 65+ Years | 21 (31.3%) | $0 |
| Total | 67 (100.0%) | $80,625 |
Poverty in Sandy Point
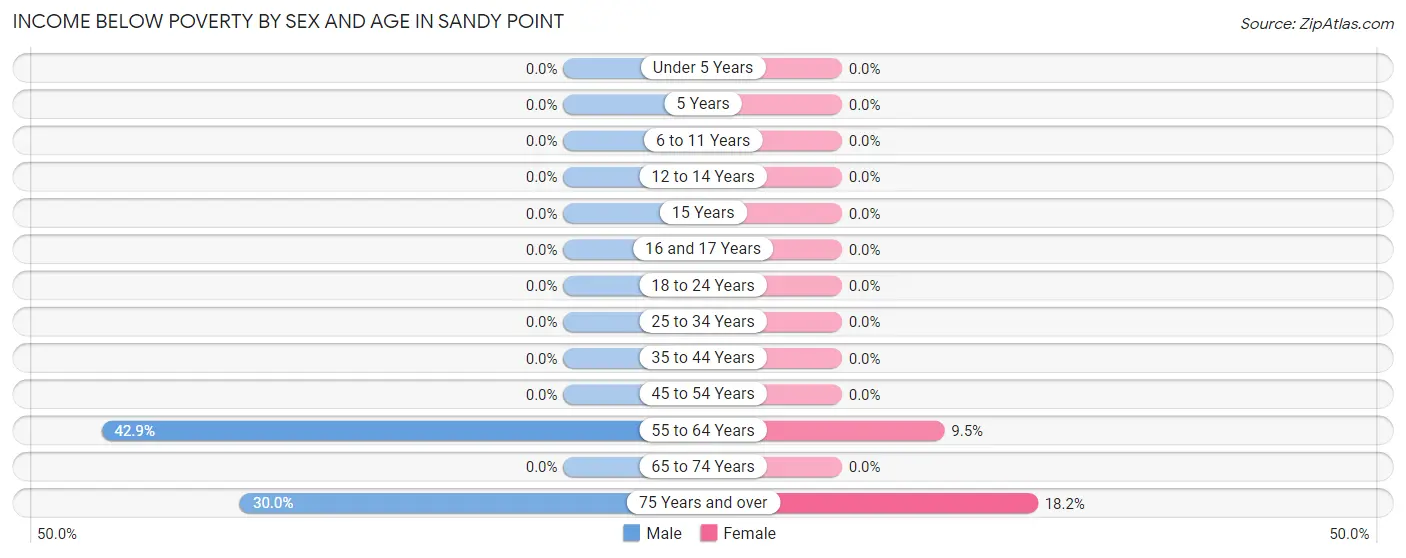
Income Below Poverty by Sex and Age in Sandy Point
With 13.8% poverty level for males and 4.3% for females among the residents of Sandy Point, 55 to 64 year old males and 75 year old and over females are the most vulnerable to poverty, with 9 males (42.9%) and 2 females (18.2%) in their respective age groups living below the poverty level.
| Age Bracket | Male | Female |
| Under 5 Years | 0 (0.0%) | 0 (0.0%) |
| 5 Years | 0 (0.0%) | 0 (0.0%) |
| 6 to 11 Years | 0 (0.0%) | 0 (0.0%) |
| 12 to 14 Years | 0 (0.0%) | 0 (0.0%) |
| 15 Years | 0 (0.0%) | 0 (0.0%) |
| 16 and 17 Years | 0 (0.0%) | 0 (0.0%) |
| 18 to 24 Years | 0 (0.0%) | 0 (0.0%) |
| 25 to 34 Years | 0 (0.0%) | 0 (0.0%) |
| 35 to 44 Years | 0 (0.0%) | 0 (0.0%) |
| 45 to 54 Years | 0 (0.0%) | 0 (0.0%) |
| 55 to 64 Years | 9 (42.9%) | 2 (9.5%) |
| 65 to 74 Years | 0 (0.0%) | 0 (0.0%) |
| 75 Years and over | 3 (30.0%) | 2 (18.2%) |
| Total | 12 (13.8%) | 4 (4.3%) |
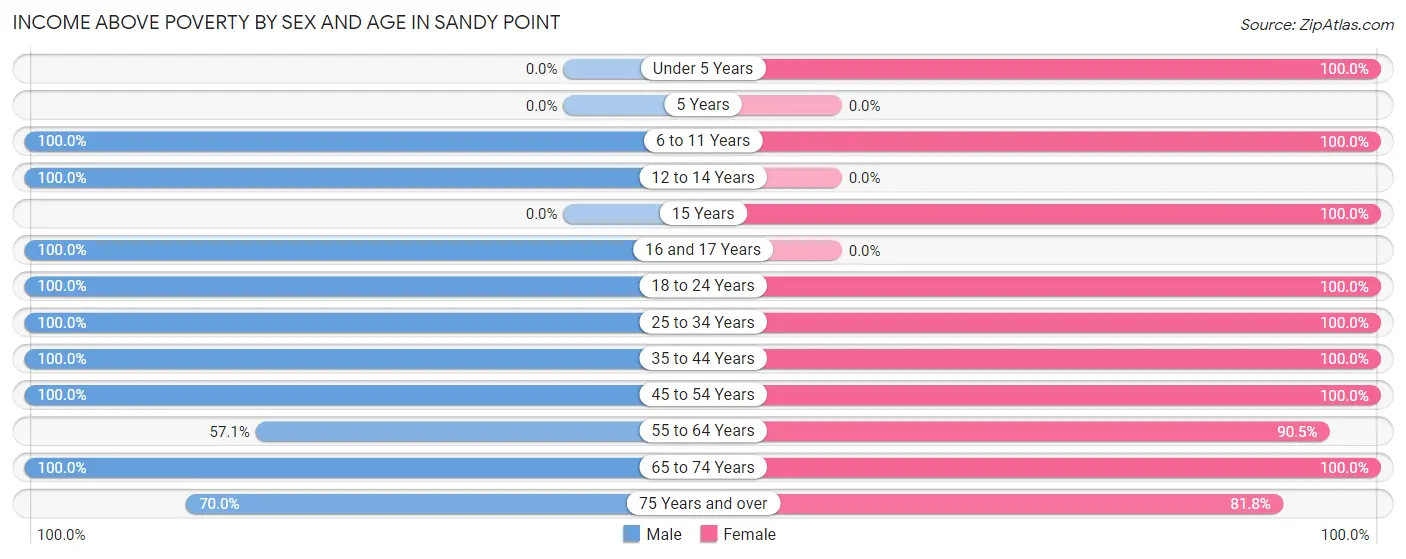
Income Above Poverty by Sex and Age in Sandy Point
According to the poverty statistics in Sandy Point, males aged 6 to 11 years and females aged under 5 years are the age groups that are most secure financially, with 100.0% of males and 100.0% of females in these age groups living above the poverty line.
| Age Bracket | Male | Female |
| Under 5 Years | 0 (0.0%) | 2 (100.0%) |
| 5 Years | 0 (0.0%) | 0 (0.0%) |
| 6 to 11 Years | 2 (100.0%) | 5 (100.0%) |
| 12 to 14 Years | 2 (100.0%) | 0 (0.0%) |
| 15 Years | 0 (0.0%) | 6 (100.0%) |
| 16 and 17 Years | 9 (100.0%) | 0 (0.0%) |
| 18 to 24 Years | 11 (100.0%) | 19 (100.0%) |
| 25 to 34 Years | 5 (100.0%) | 7 (100.0%) |
| 35 to 44 Years | 5 (100.0%) | 6 (100.0%) |
| 45 to 54 Years | 10 (100.0%) | 11 (100.0%) |
| 55 to 64 Years | 12 (57.1%) | 19 (90.5%) |
| 65 to 74 Years | 12 (100.0%) | 4 (100.0%) |
| 75 Years and over | 7 (70.0%) | 9 (81.8%) |
| Total | 75 (86.2%) | 88 (95.7%) |
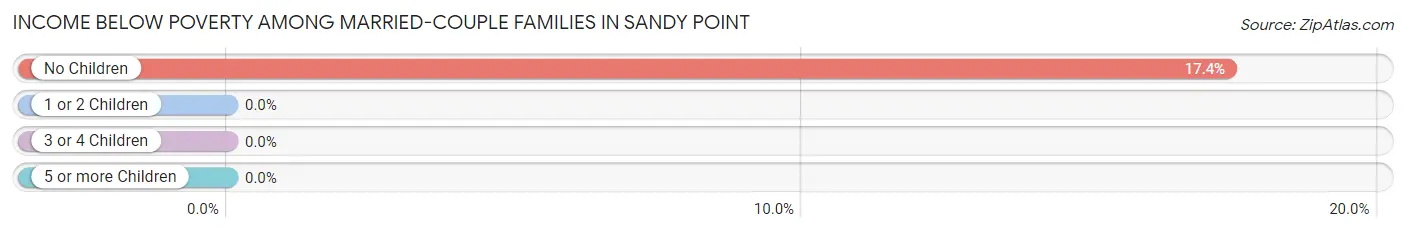
Income Below Poverty Among Married-Couple Families in Sandy Point
The poverty statistics for married-couple families in Sandy Point show that 10.8% or 4 of the total 37 families live below the poverty line. Families with no children have the highest poverty rate of 17.4%, comprising of 4 families. On the other hand, families with 1 or 2 children have the lowest poverty rate of 0.0%, which includes 0 families.
| Children | Above Poverty | Below Poverty |
| No Children | 19 (82.6%) | 4 (17.4%) |
| 1 or 2 Children | 12 (100.0%) | 0 (0.0%) |
| 3 or 4 Children | 2 (100.0%) | 0 (0.0%) |
| 5 or more Children | 0 (0.0%) | 0 (0.0%) |
| Total | 33 (89.2%) | 4 (10.8%) |
Income Below Poverty Among Single-Parent Households in Sandy Point
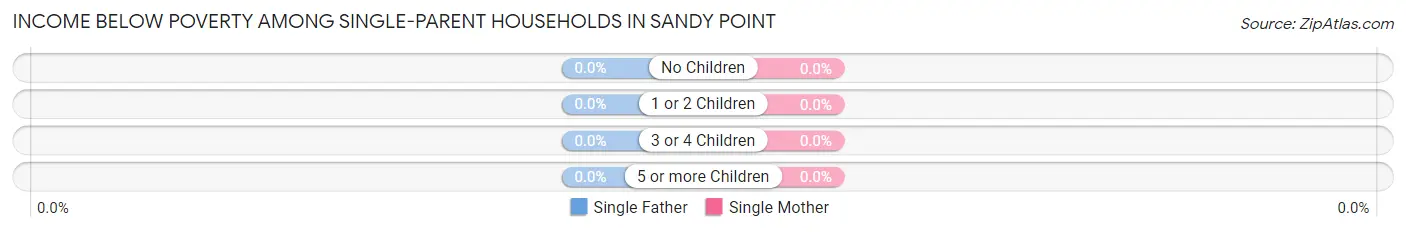
| Children | Single Father | Single Mother |
| No Children | 0 (0.0%) | 0 (0.0%) |
| 1 or 2 Children | 0 (0.0%) | 0 (0.0%) |
| 3 or 4 Children | 0 (0.0%) | 0 (0.0%) |
| 5 or more Children | 0 (0.0%) | 0 (0.0%) |
| Total | 0 (0.0%) | 0 (0.0%) |
Income Below Poverty Among Married-Couple vs Single-Parent Households in Sandy Point
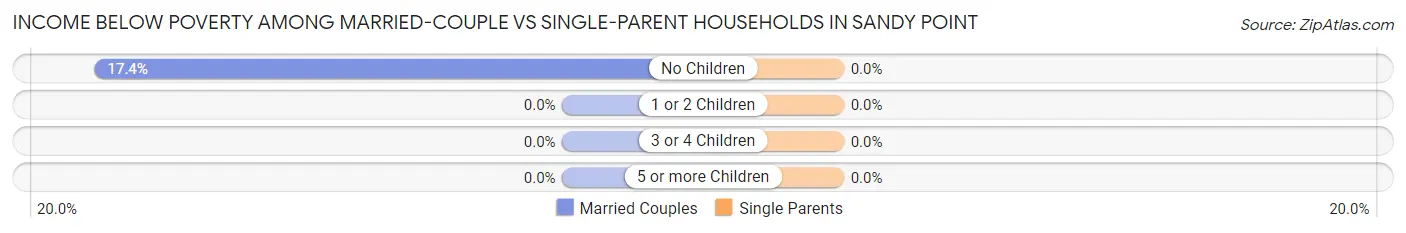
| Children | Married-Couple Families | Single-Parent Households |
| No Children | 4 (17.4%) | 0 (0.0%) |
| 1 or 2 Children | 0 (0.0%) | 0 (0.0%) |
| 3 or 4 Children | 0 (0.0%) | 0 (0.0%) |
| 5 or more Children | 0 (0.0%) | 0 (0.0%) |
| Total | 4 (10.8%) | 0 (0.0%) |
Employment Characteristics in Sandy Point
Employment by Class of Employer in Sandy Point
Among the 82 employed individuals in Sandy Point, private company employees (54 | 65.8%), local government employees (12 | 14.6%), and self-employed (incorporated) (6 | 7.3%) make up the most common classes of employment.
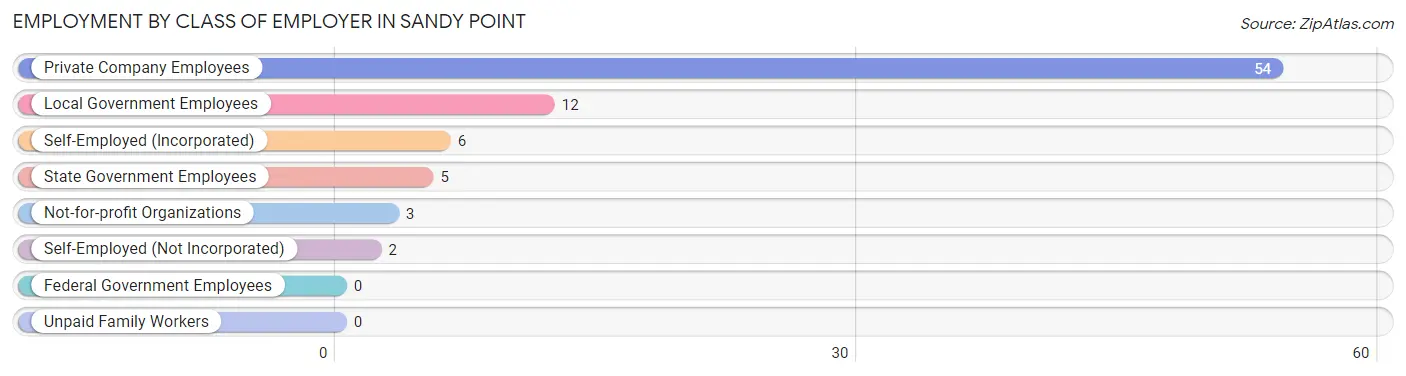
| Employer Class | # Employees | % Employees |
| Private Company Employees | 54 | 65.8% |
| Self-Employed (Incorporated) | 6 | 7.3% |
| Self-Employed (Not Incorporated) | 2 | 2.4% |
| Not-for-profit Organizations | 3 | 3.7% |
| Local Government Employees | 12 | 14.6% |
| State Government Employees | 5 | 6.1% |
| Federal Government Employees | 0 | 0.0% |
| Unpaid Family Workers | 0 | 0.0% |
| Total | 82 | 100.0% |
Employment Status by Age in Sandy Point
According to the labor force statistics for Sandy Point, out of the total population over 16 years of age (162), 51.2% or 83 individuals are in the labor force, with 1.2% or 1 of them unemployed. The age group with the highest labor force participation rate is 25 to 29 years, with 100.0% or 11 individuals in the labor force. Within the labor force, the 30 to 34 years age range has the highest percentage of unemployed individuals, with 100.0% or 1 of them being unemployed.
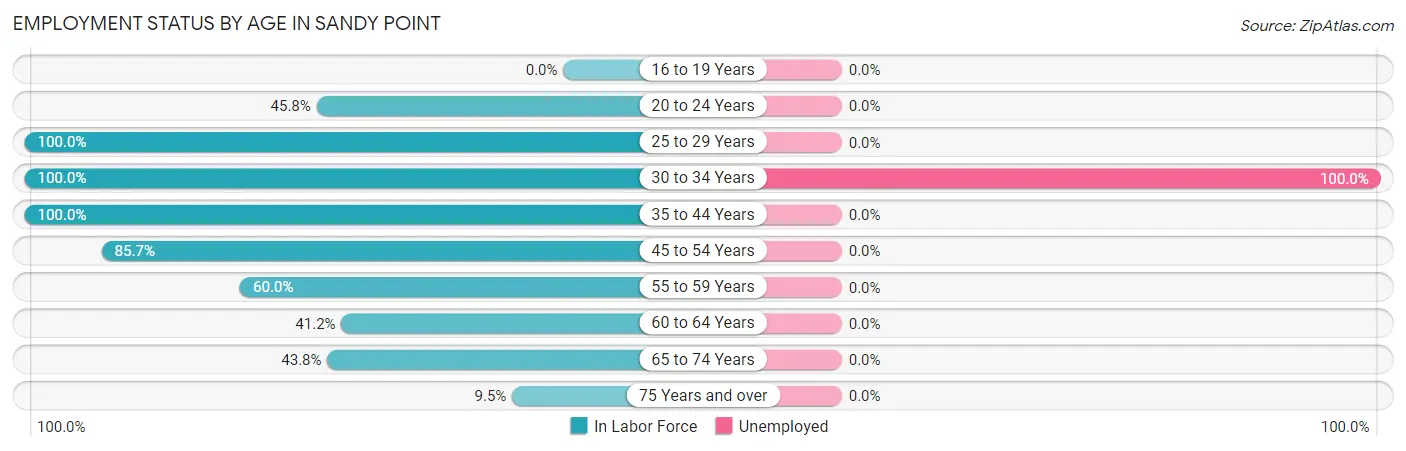
| Age Bracket | In Labor Force | Unemployed |
| 16 to 19 Years | 0 (0.0%) | 0 (0.0%) |
| 20 to 24 Years | 11 (45.8%) | 0 (0.0%) |
| 25 to 29 Years | 11 (100.0%) | 0 (0.0%) |
| 30 to 34 Years | 1 (100.0%) | 1 (100.0%) |
| 35 to 44 Years | 11 (100.0%) | 0 (0.0%) |
| 45 to 54 Years | 18 (85.7%) | 0 (0.0%) |
| 55 to 59 Years | 15 (60.0%) | 0 (0.0%) |
| 60 to 64 Years | 7 (41.2%) | 0 (0.0%) |
| 65 to 74 Years | 7 (43.8%) | 0 (0.0%) |
| 75 Years and over | 2 (9.5%) | 0 (0.0%) |
| Total | 83 (51.2%) | 1 (1.2%) |
Employment Status by Educational Attainment in Sandy Point
According to labor force statistics for Sandy Point, 73.3% of individuals (63) out of the total population between 25 and 64 years of age (86) are in the labor force, with 1.6% or 1 of them being unemployed. The group with the highest labor force participation rate are those with the educational attainment of bachelor's degree or higher, with 100.0% or 9 individuals in the labor force. Within the labor force, individuals with high school diploma education have the highest percentage of unemployment, with 2.9% or 1 of them being unemployed.
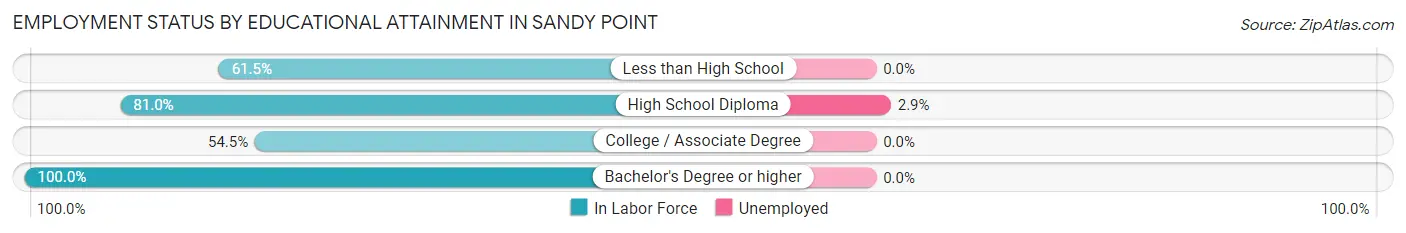
| Educational Attainment | In Labor Force | Unemployed |
| Less than High School | 8 (61.5%) | 0 (0.0%) |
| High School Diploma | 34 (81.0%) | 1 (2.9%) |
| College / Associate Degree | 12 (54.5%) | 0 (0.0%) |
| Bachelor's Degree or higher | 9 (100.0%) | 0 (0.0%) |
| Total | 63 (73.3%) | 1 (1.6%) |
Employment Occupations by Sex in Sandy Point
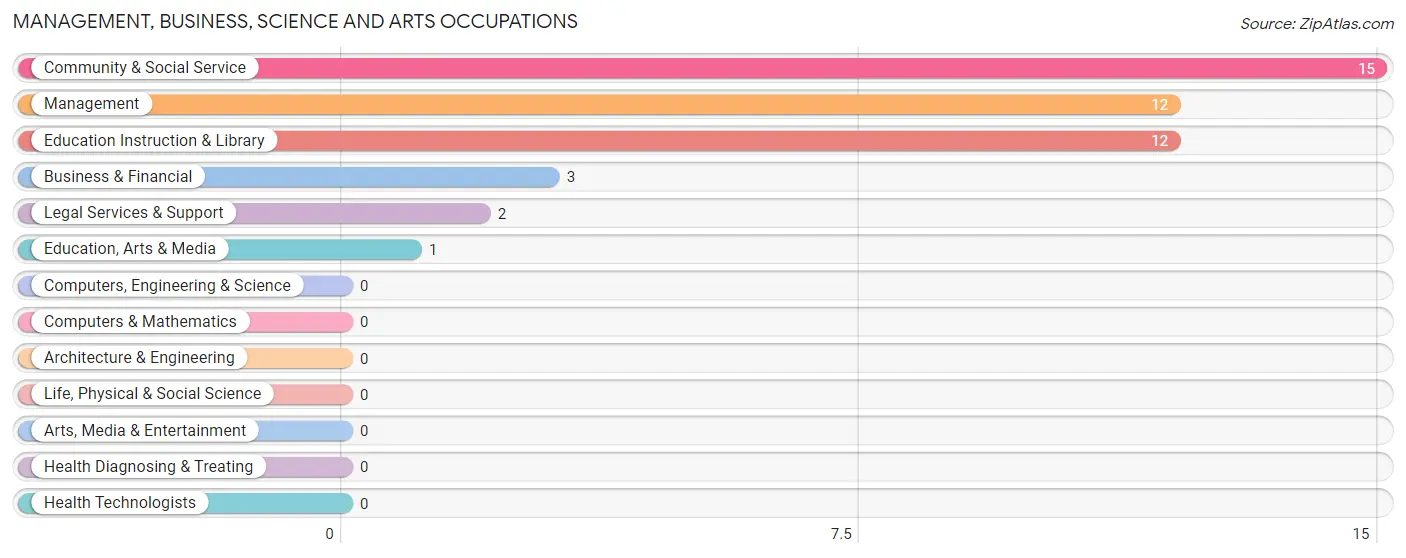
Management, Business, Science and Arts Occupations
The most common Management, Business, Science and Arts occupations in Sandy Point are Community & Social Service (15 | 18.3%), Management (12 | 14.6%), Education Instruction & Library (12 | 14.6%), Business & Financial (3 | 3.7%), and Legal Services & Support (2 | 2.4%).
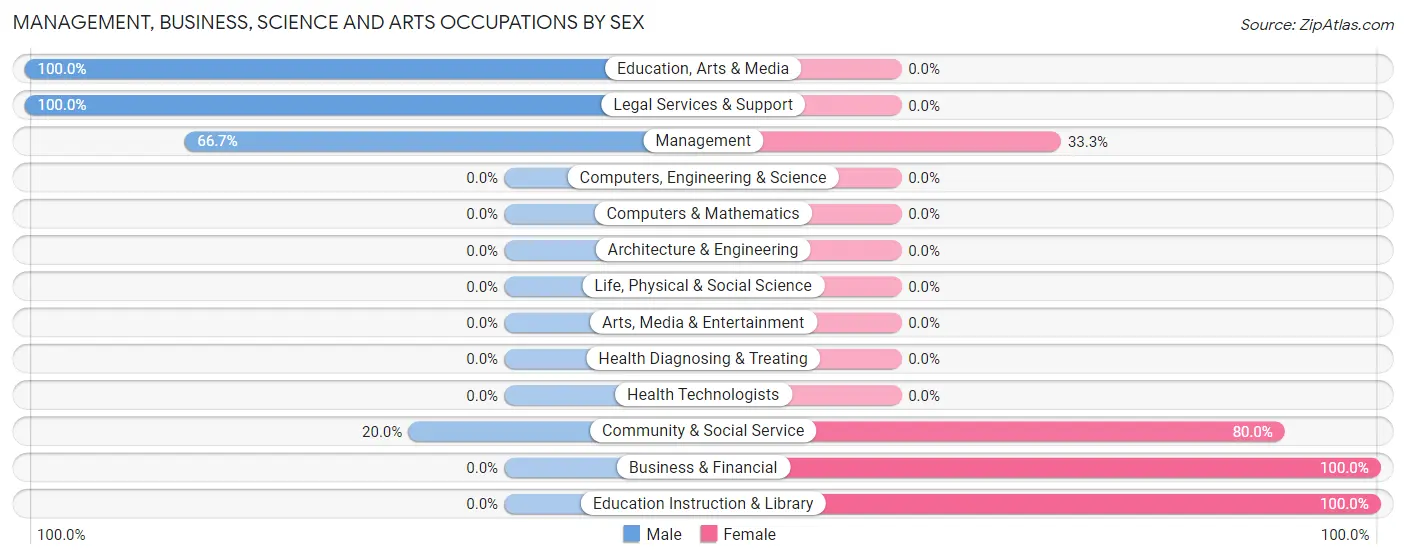
Management, Business, Science and Arts Occupations by Sex
Within the Management, Business, Science and Arts occupations in Sandy Point, the most male-oriented occupations are Education, Arts & Media (100.0%), Legal Services & Support (100.0%), and Management (66.7%), while the most female-oriented occupations are Business & Financial (100.0%), Education Instruction & Library (100.0%), and Community & Social Service (80.0%).
| Occupation | Male | Female |
| Management | 8 (66.7%) | 4 (33.3%) |
| Business & Financial | 0 (0.0%) | 3 (100.0%) |
| Computers, Engineering & Science | 0 (0.0%) | 0 (0.0%) |
| Computers & Mathematics | 0 (0.0%) | 0 (0.0%) |
| Architecture & Engineering | 0 (0.0%) | 0 (0.0%) |
| Life, Physical & Social Science | 0 (0.0%) | 0 (0.0%) |
| Community & Social Service | 3 (20.0%) | 12 (80.0%) |
| Education, Arts & Media | 1 (100.0%) | 0 (0.0%) |
| Legal Services & Support | 2 (100.0%) | 0 (0.0%) |
| Education Instruction & Library | 0 (0.0%) | 12 (100.0%) |
| Arts, Media & Entertainment | 0 (0.0%) | 0 (0.0%) |
| Health Diagnosing & Treating | 0 (0.0%) | 0 (0.0%) |
| Health Technologists | 0 (0.0%) | 0 (0.0%) |
| Total (Category) | 11 (36.7%) | 19 (63.3%) |
| Total (Overall) | 45 (54.9%) | 37 (45.1%) |
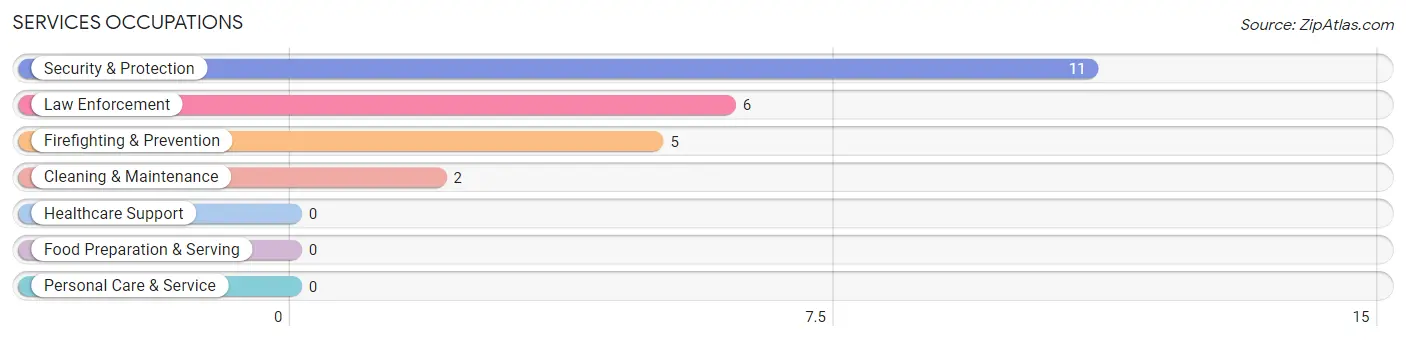
Services Occupations
The most common Services occupations in Sandy Point are Security & Protection (11 | 13.4%), Law Enforcement (6 | 7.3%), Firefighting & Prevention (5 | 6.1%), and Cleaning & Maintenance (2 | 2.4%).
Services Occupations by Sex
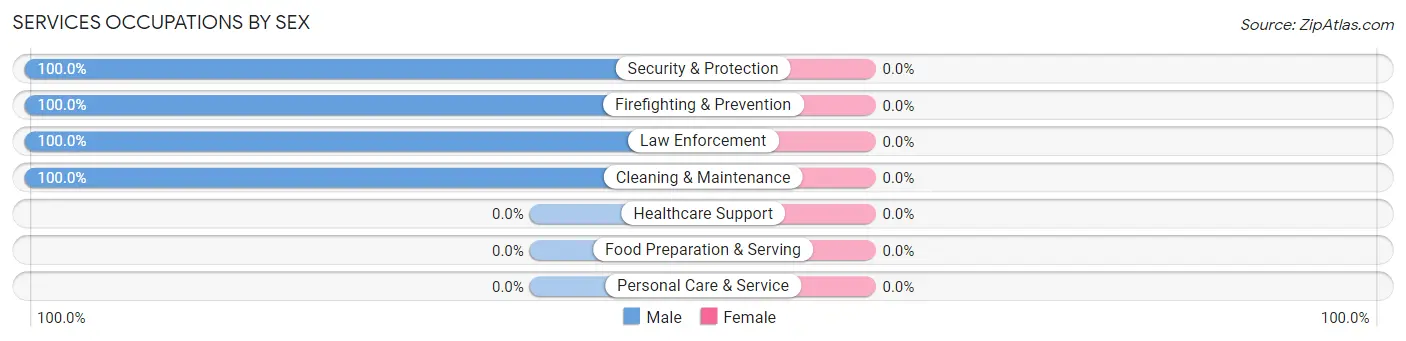
| Occupation | Male | Female |
| Healthcare Support | 0 (0.0%) | 0 (0.0%) |
| Security & Protection | 11 (100.0%) | 0 (0.0%) |
| Firefighting & Prevention | 5 (100.0%) | 0 (0.0%) |
| Law Enforcement | 6 (100.0%) | 0 (0.0%) |
| Food Preparation & Serving | 0 (0.0%) | 0 (0.0%) |
| Cleaning & Maintenance | 2 (100.0%) | 0 (0.0%) |
| Personal Care & Service | 0 (0.0%) | 0 (0.0%) |
| Total (Category) | 13 (100.0%) | 0 (0.0%) |
| Total (Overall) | 45 (54.9%) | 37 (45.1%) |
Sales and Office Occupations
The most common Sales and Office occupations in Sandy Point are Office & Administration (13 | 15.9%), and Sales & Related (10 | 12.2%).
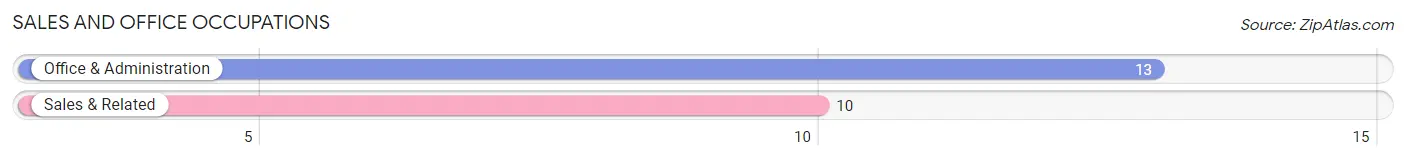
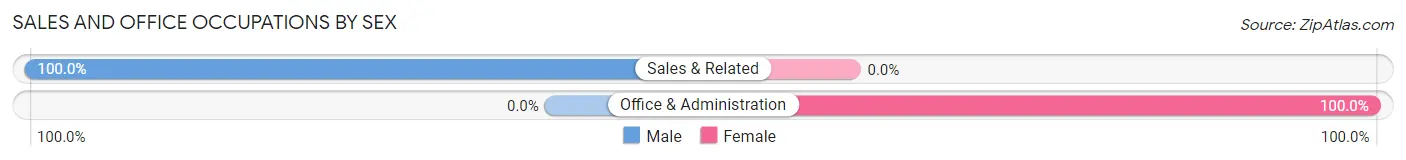
Sales and Office Occupations by Sex
| Occupation | Male | Female |
| Sales & Related | 10 (100.0%) | 0 (0.0%) |
| Office & Administration | 0 (0.0%) | 13 (100.0%) |
| Total (Category) | 10 (43.5%) | 13 (56.5%) |
| Total (Overall) | 45 (54.9%) | 37 (45.1%) |
Natural Resources, Construction and Maintenance Occupations
The most common Natural Resources, Construction and Maintenance occupations in Sandy Point are , and Construction & Extraction (5 | 6.1%).
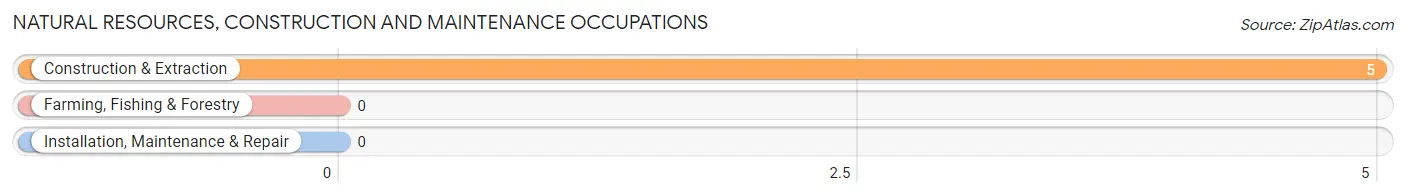
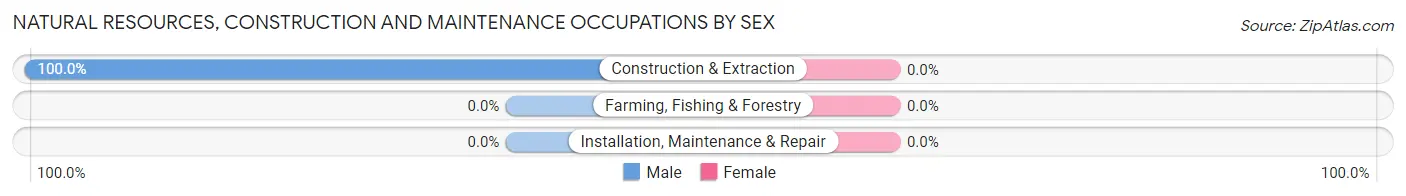
Natural Resources, Construction and Maintenance Occupations by Sex
| Occupation | Male | Female |
| Farming, Fishing & Forestry | 0 (0.0%) | 0 (0.0%) |
| Construction & Extraction | 5 (100.0%) | 0 (0.0%) |
| Installation, Maintenance & Repair | 0 (0.0%) | 0 (0.0%) |
| Total (Category) | 5 (100.0%) | 0 (0.0%) |
| Total (Overall) | 45 (54.9%) | 37 (45.1%) |
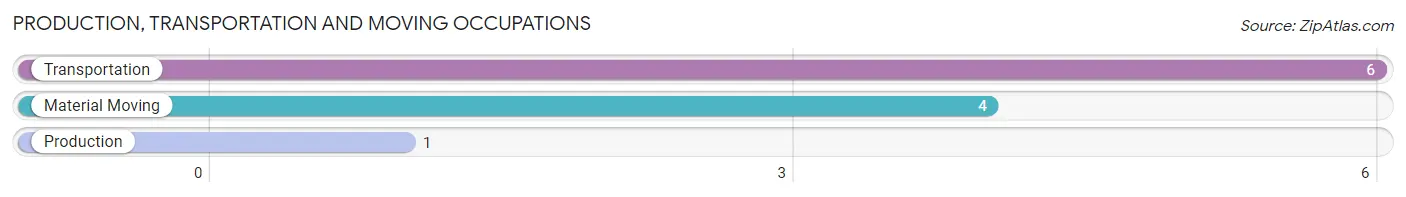
Production, Transportation and Moving Occupations
The most common Production, Transportation and Moving occupations in Sandy Point are Transportation (6 | 7.3%), Material Moving (4 | 4.9%), and Production (1 | 1.2%).
Production, Transportation and Moving Occupations by Sex
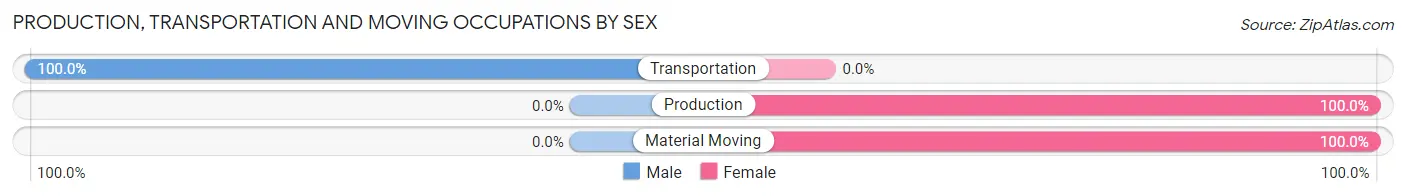
| Occupation | Male | Female |
| Production | 0 (0.0%) | 1 (100.0%) |
| Transportation | 6 (100.0%) | 0 (0.0%) |
| Material Moving | 0 (0.0%) | 4 (100.0%) |
| Total (Category) | 6 (54.5%) | 5 (45.5%) |
| Total (Overall) | 45 (54.9%) | 37 (45.1%) |
Employment Industries by Sex in Sandy Point
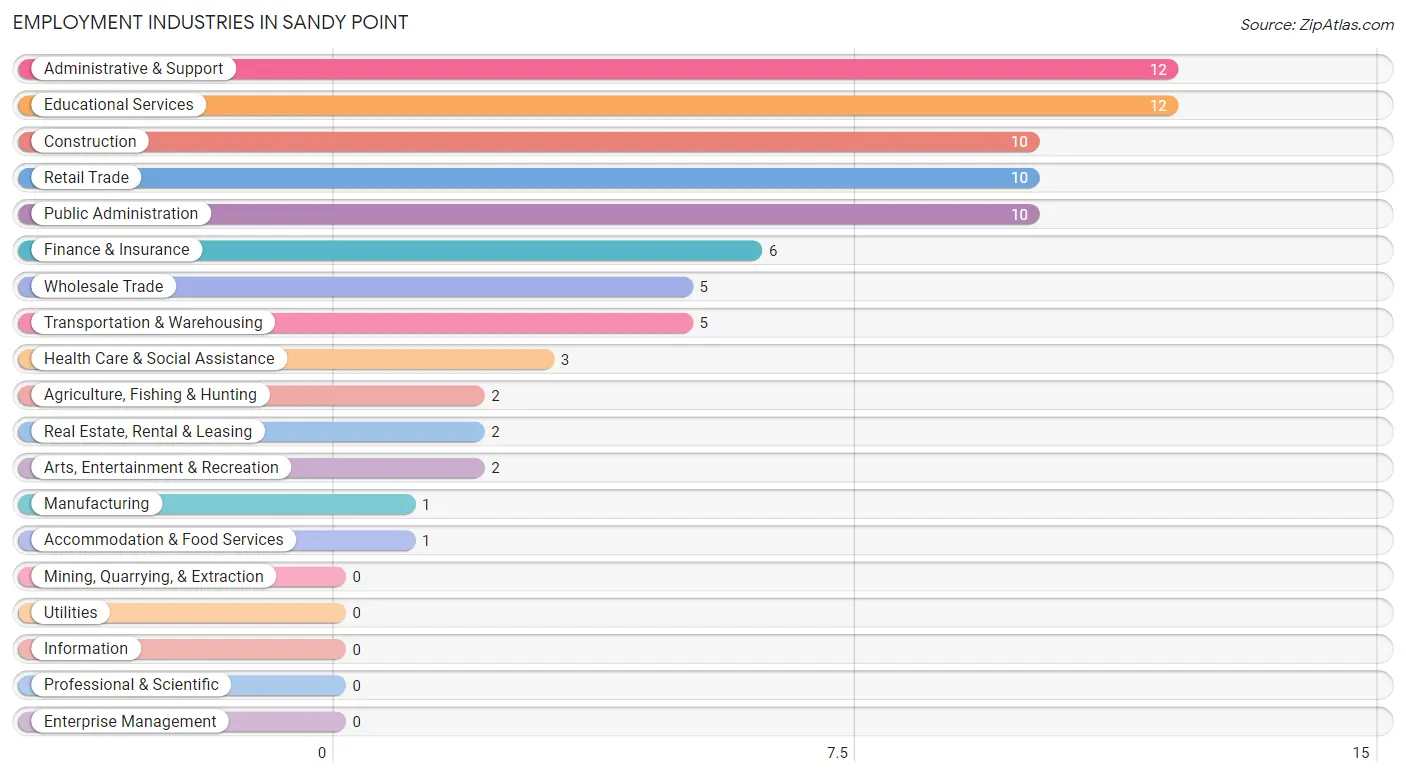
Employment Industries in Sandy Point
The major employment industries in Sandy Point include Administrative & Support (12 | 14.6%), Educational Services (12 | 14.6%), Construction (10 | 12.2%), Retail Trade (10 | 12.2%), and Public Administration (10 | 12.2%).
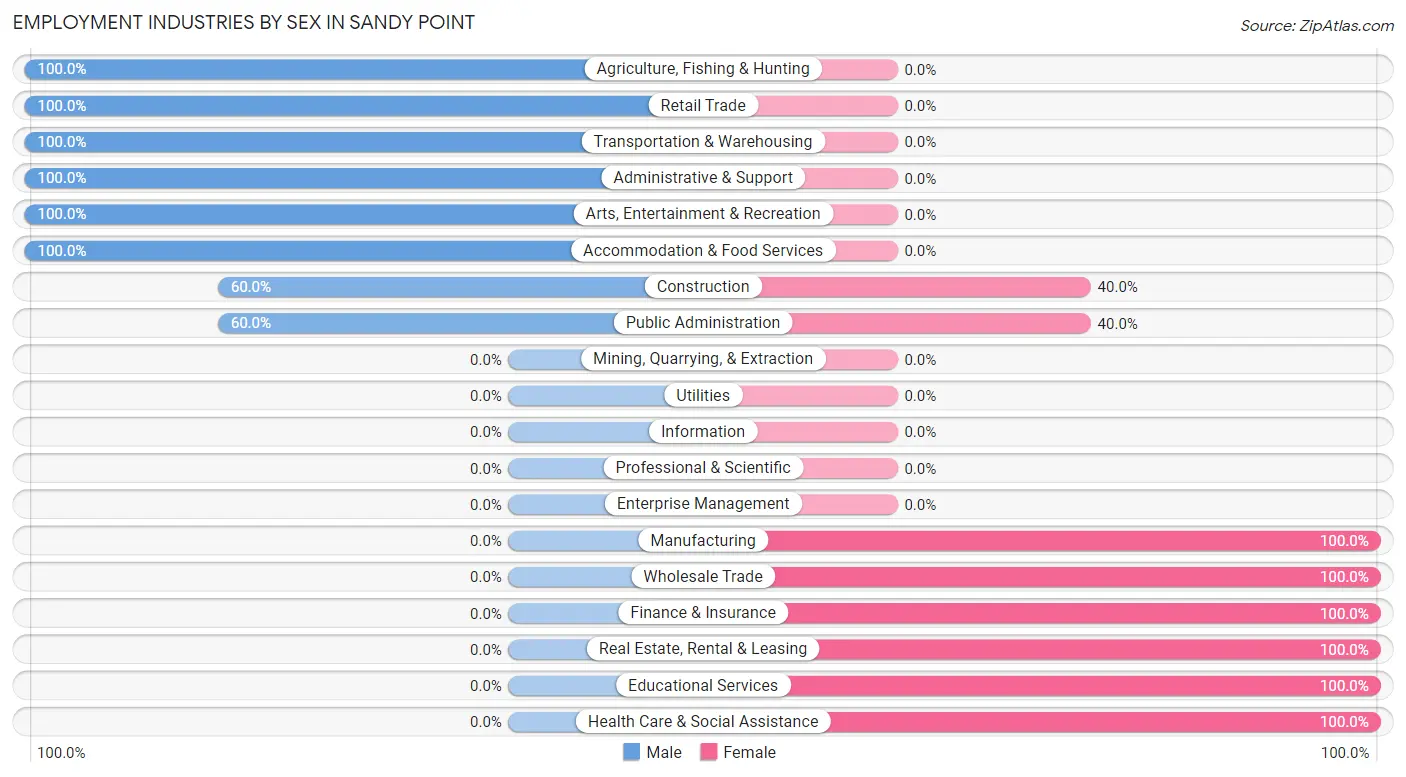
Employment Industries by Sex in Sandy Point
The Sandy Point industries that see more men than women are Agriculture, Fishing & Hunting (100.0%), Retail Trade (100.0%), and Transportation & Warehousing (100.0%), whereas the industries that tend to have a higher number of women are Manufacturing (100.0%), Wholesale Trade (100.0%), and Finance & Insurance (100.0%).
| Industry | Male | Female |
| Agriculture, Fishing & Hunting | 2 (100.0%) | 0 (0.0%) |
| Mining, Quarrying, & Extraction | 0 (0.0%) | 0 (0.0%) |
| Construction | 6 (60.0%) | 4 (40.0%) |
| Manufacturing | 0 (0.0%) | 1 (100.0%) |
| Wholesale Trade | 0 (0.0%) | 5 (100.0%) |
| Retail Trade | 10 (100.0%) | 0 (0.0%) |
| Transportation & Warehousing | 5 (100.0%) | 0 (0.0%) |
| Utilities | 0 (0.0%) | 0 (0.0%) |
| Information | 0 (0.0%) | 0 (0.0%) |
| Finance & Insurance | 0 (0.0%) | 6 (100.0%) |
| Real Estate, Rental & Leasing | 0 (0.0%) | 2 (100.0%) |
| Professional & Scientific | 0 (0.0%) | 0 (0.0%) |
| Enterprise Management | 0 (0.0%) | 0 (0.0%) |
| Administrative & Support | 12 (100.0%) | 0 (0.0%) |
| Educational Services | 0 (0.0%) | 12 (100.0%) |
| Health Care & Social Assistance | 0 (0.0%) | 3 (100.0%) |
| Arts, Entertainment & Recreation | 2 (100.0%) | 0 (0.0%) |
| Accommodation & Food Services | 1 (100.0%) | 0 (0.0%) |
| Public Administration | 6 (60.0%) | 4 (40.0%) |
| Total | 45 (54.9%) | 37 (45.1%) |
Education in Sandy Point
School Enrollment in Sandy Point
The most common levels of schooling among the 43 students in Sandy Point are high school (22 | 51.2%), college / undergraduate (18 | 41.9%), and kindergarten (2 | 4.6%).
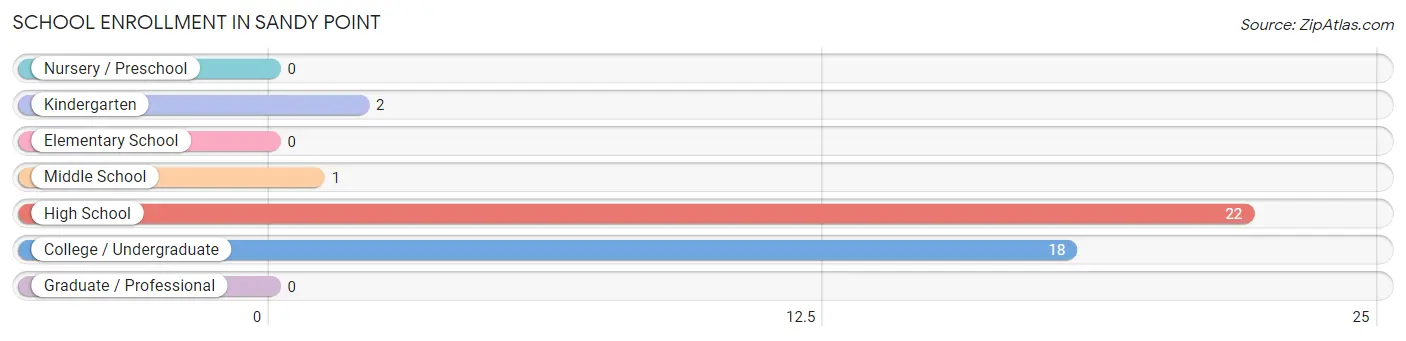
| School Level | # Students | % Students |
| Nursery / Preschool | 0 | 0.0% |
| Kindergarten | 2 | 4.6% |
| Elementary School | 0 | 0.0% |
| Middle School | 1 | 2.3% |
| High School | 22 | 51.2% |
| College / Undergraduate | 18 | 41.9% |
| Graduate / Professional | 0 | 0.0% |
| Total | 43 | 100.0% |
School Enrollment by Age by Funding Source in Sandy Point
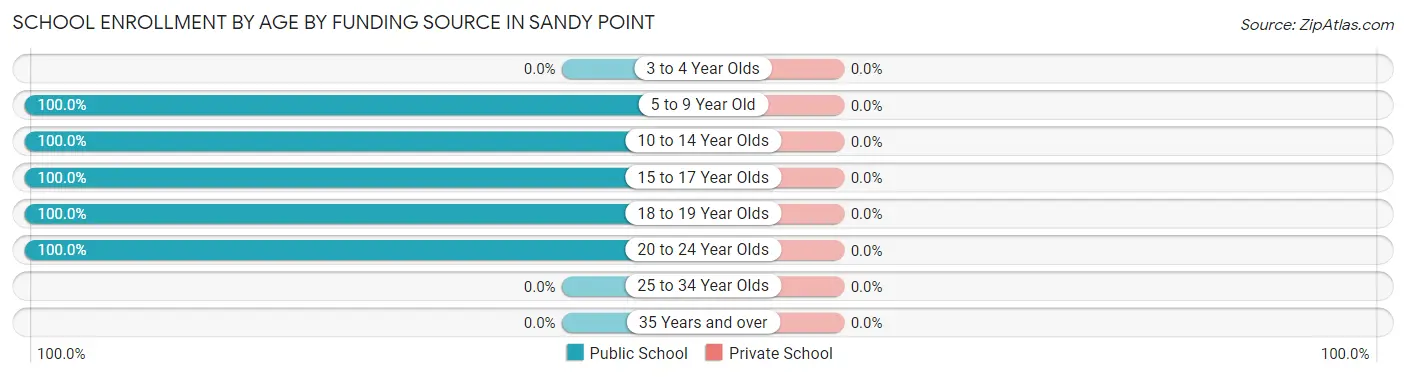
| Age Bracket | Public School | Private School |
| 3 to 4 Year Olds | 0 (0.0%) | 0 (0.0%) |
| 5 to 9 Year Old | 2 (100.0%) | 0 (0.0%) |
| 10 to 14 Year Olds | 2 (100.0%) | 0 (0.0%) |
| 15 to 17 Year Olds | 15 (100.0%) | 0 (0.0%) |
| 18 to 19 Year Olds | 6 (100.0%) | 0 (0.0%) |
| 20 to 24 Year Olds | 18 (100.0%) | 0 (0.0%) |
| 25 to 34 Year Olds | 0 (0.0%) | 0 (0.0%) |
| 35 Years and over | 0 (0.0%) | 0 (0.0%) |
| Total | 43 (100.0%) | 0 (0.0%) |
Educational Attainment by Field of Study in Sandy Point
Education (11 | 45.8%), social sciences (6 | 25.0%), science & technology (2 | 8.3%), business (2 | 8.3%), and communications (2 | 8.3%) are the most common fields of study among 24 individuals in Sandy Point who have obtained a bachelor's degree or higher.
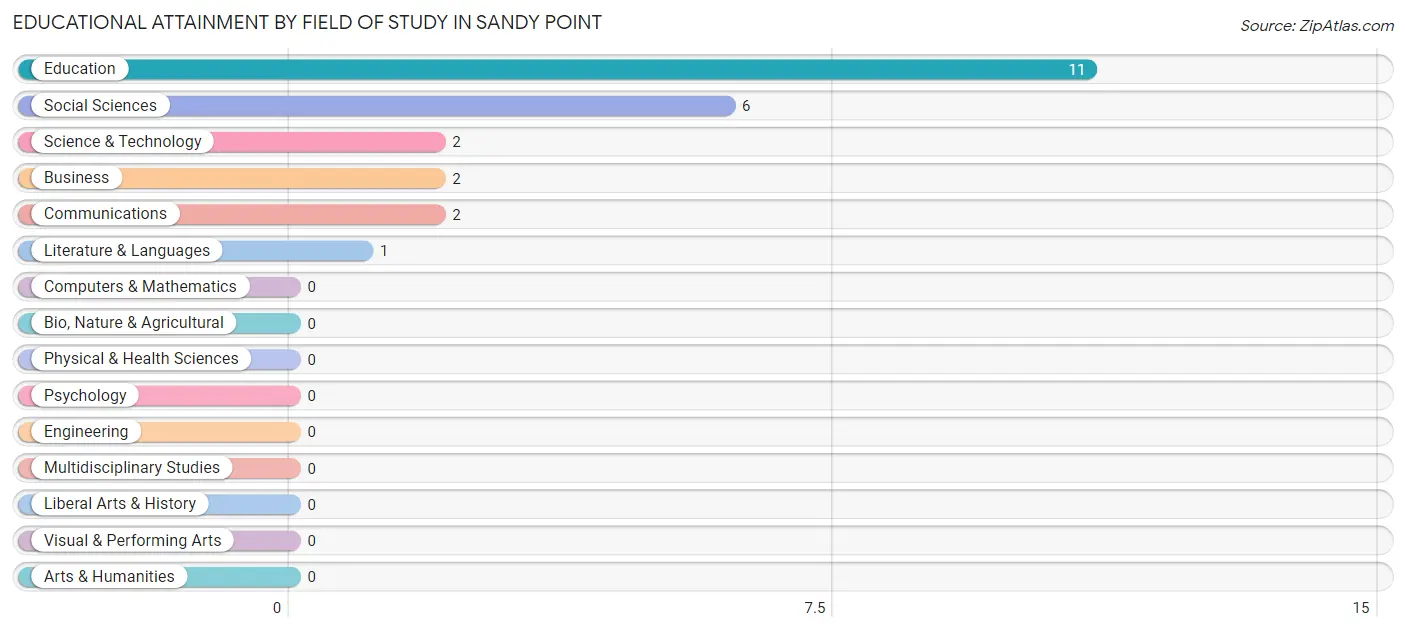
| Field of Study | # Graduates | % Graduates |
| Computers & Mathematics | 0 | 0.0% |
| Bio, Nature & Agricultural | 0 | 0.0% |
| Physical & Health Sciences | 0 | 0.0% |
| Psychology | 0 | 0.0% |
| Social Sciences | 6 | 25.0% |
| Engineering | 0 | 0.0% |
| Multidisciplinary Studies | 0 | 0.0% |
| Science & Technology | 2 | 8.3% |
| Business | 2 | 8.3% |
| Education | 11 | 45.8% |
| Literature & Languages | 1 | 4.2% |
| Liberal Arts & History | 0 | 0.0% |
| Visual & Performing Arts | 0 | 0.0% |
| Communications | 2 | 8.3% |
| Arts & Humanities | 0 | 0.0% |
| Total | 24 | 100.0% |
Transportation & Commute in Sandy Point
Vehicle Availability by Sex in Sandy Point
The most prevalent vehicle ownership categories in Sandy Point are males with 2 vehicles (13, accounting for 28.9%) and females with 2 vehicles (9, making up 35.1%).
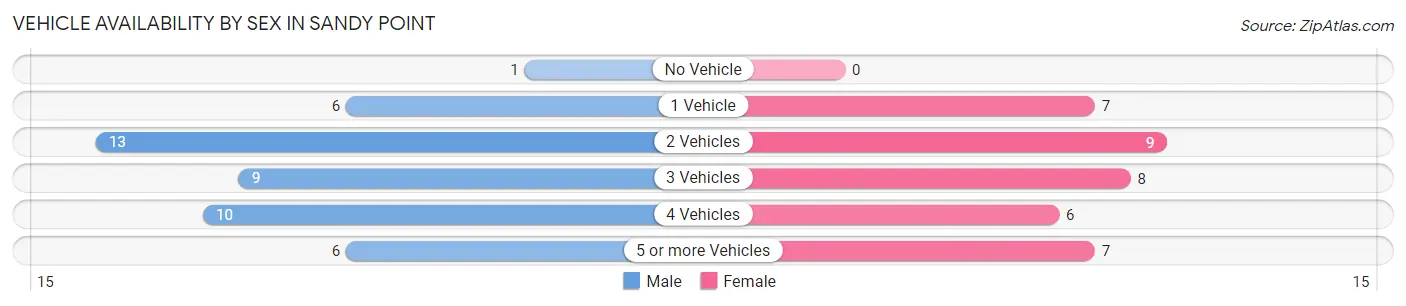
| Vehicles Available | Male | Female |
| No Vehicle | 1 (2.2%) | 0 (0.0%) |
| 1 Vehicle | 6 (13.3%) | 7 (18.9%) |
| 2 Vehicles | 13 (28.9%) | 9 (24.3%) |
| 3 Vehicles | 9 (20.0%) | 8 (21.6%) |
| 4 Vehicles | 10 (22.2%) | 6 (16.2%) |
| 5 or more Vehicles | 6 (13.3%) | 7 (18.9%) |
| Total | 45 (100.0%) | 37 (100.0%) |
Commute Time in Sandy Point
The most frequently occuring commute durations in Sandy Point are 30 to 34 minutes (24 commuters, 32.0%), 20 to 24 minutes (13 commuters, 17.3%), and 60 to 89 minutes (8 commuters, 10.7%).
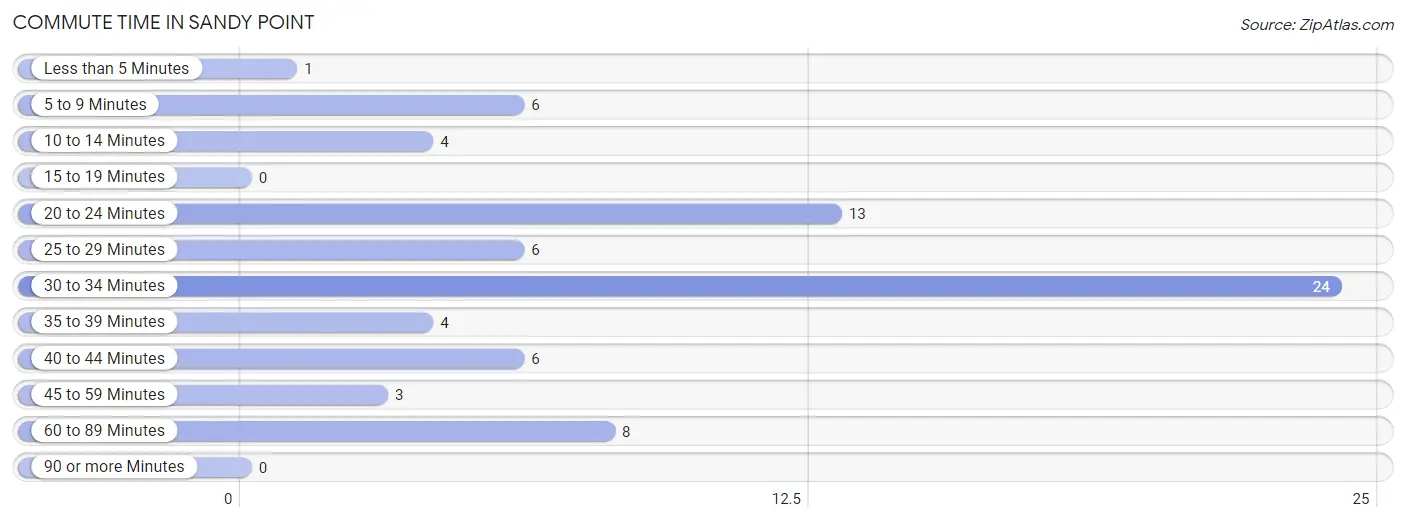
| Commute Time | # Commuters | % Commuters |
| Less than 5 Minutes | 1 | 1.3% |
| 5 to 9 Minutes | 6 | 8.0% |
| 10 to 14 Minutes | 4 | 5.3% |
| 15 to 19 Minutes | 0 | 0.0% |
| 20 to 24 Minutes | 13 | 17.3% |
| 25 to 29 Minutes | 6 | 8.0% |
| 30 to 34 Minutes | 24 | 32.0% |
| 35 to 39 Minutes | 4 | 5.3% |
| 40 to 44 Minutes | 6 | 8.0% |
| 45 to 59 Minutes | 3 | 4.0% |
| 60 to 89 Minutes | 8 | 10.7% |
| 90 or more Minutes | 0 | 0.0% |
Commute Time by Sex in Sandy Point
The most common commute times in Sandy Point are 30 to 34 minutes (17 commuters, 39.5%) for males and 20 to 24 minutes (13 commuters, 40.6%) for females.
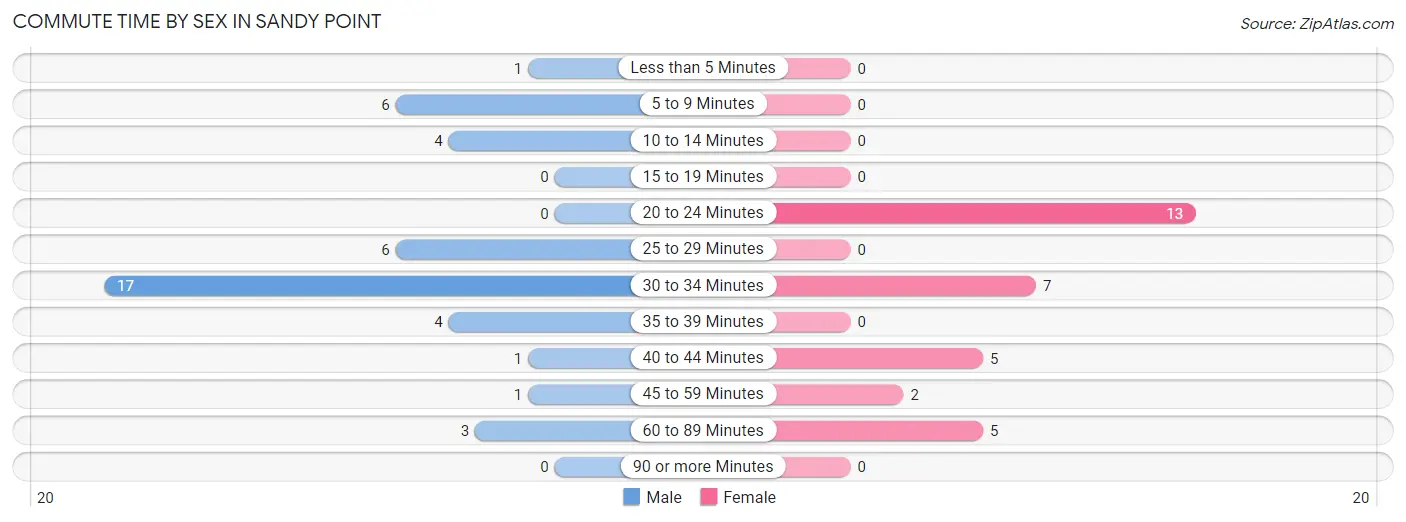
| Commute Time | Male | Female |
| Less than 5 Minutes | 1 (2.3%) | 0 (0.0%) |
| 5 to 9 Minutes | 6 (14.0%) | 0 (0.0%) |
| 10 to 14 Minutes | 4 (9.3%) | 0 (0.0%) |
| 15 to 19 Minutes | 0 (0.0%) | 0 (0.0%) |
| 20 to 24 Minutes | 0 (0.0%) | 13 (40.6%) |
| 25 to 29 Minutes | 6 (14.0%) | 0 (0.0%) |
| 30 to 34 Minutes | 17 (39.5%) | 7 (21.9%) |
| 35 to 39 Minutes | 4 (9.3%) | 0 (0.0%) |
| 40 to 44 Minutes | 1 (2.3%) | 5 (15.6%) |
| 45 to 59 Minutes | 1 (2.3%) | 2 (6.2%) |
| 60 to 89 Minutes | 3 (7.0%) | 5 (15.6%) |
| 90 or more Minutes | 0 (0.0%) | 0 (0.0%) |
Time of Departure to Work by Sex in Sandy Point
The most frequent times of departure to work in Sandy Point are 5:00 AM to 5:29 AM (7, 16.3%) for males and 6:30 AM to 6:59 AM (14, 43.8%) for females.
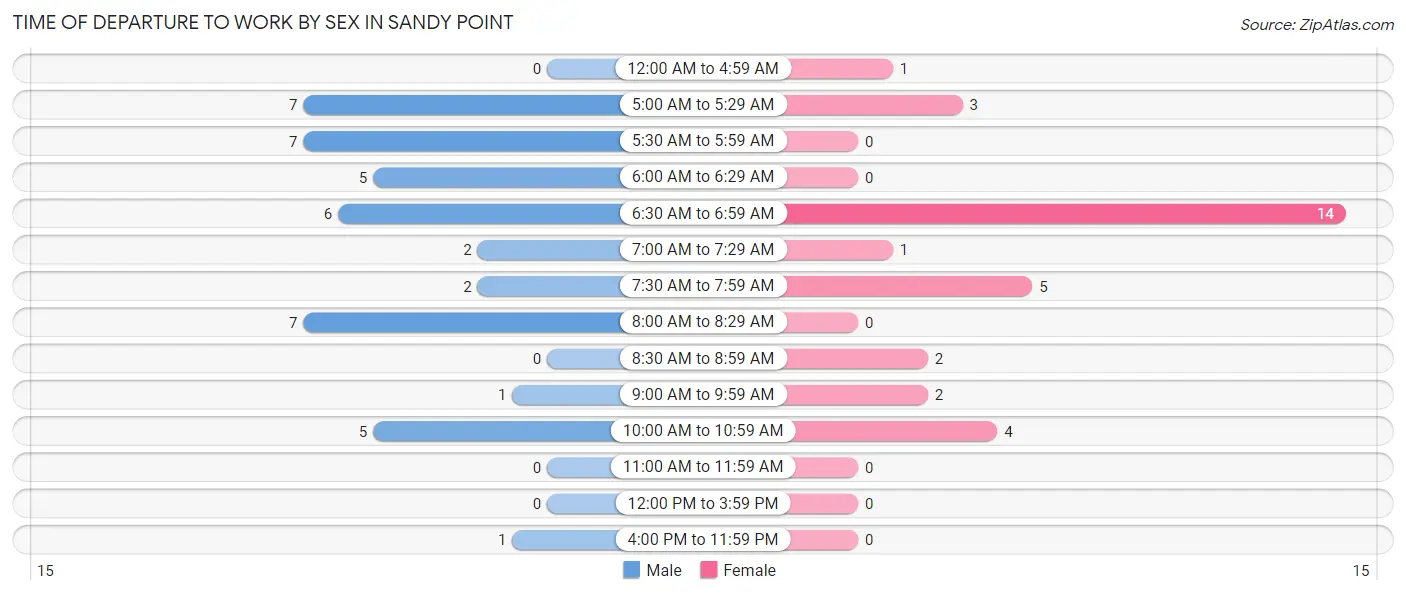
| Time of Departure | Male | Female |
| 12:00 AM to 4:59 AM | 0 (0.0%) | 1 (3.1%) |
| 5:00 AM to 5:29 AM | 7 (16.3%) | 3 (9.4%) |
| 5:30 AM to 5:59 AM | 7 (16.3%) | 0 (0.0%) |
| 6:00 AM to 6:29 AM | 5 (11.6%) | 0 (0.0%) |
| 6:30 AM to 6:59 AM | 6 (14.0%) | 14 (43.8%) |
| 7:00 AM to 7:29 AM | 2 (4.6%) | 1 (3.1%) |
| 7:30 AM to 7:59 AM | 2 (4.6%) | 5 (15.6%) |
| 8:00 AM to 8:29 AM | 7 (16.3%) | 0 (0.0%) |
| 8:30 AM to 8:59 AM | 0 (0.0%) | 2 (6.2%) |
| 9:00 AM to 9:59 AM | 1 (2.3%) | 2 (6.2%) |
| 10:00 AM to 10:59 AM | 5 (11.6%) | 4 (12.5%) |
| 11:00 AM to 11:59 AM | 0 (0.0%) | 0 (0.0%) |
| 12:00 PM to 3:59 PM | 0 (0.0%) | 0 (0.0%) |
| 4:00 PM to 11:59 PM | 1 (2.3%) | 0 (0.0%) |
| Total | 43 (100.0%) | 32 (100.0%) |
Housing Occupancy in Sandy Point
Occupancy by Ownership in Sandy Point
Of the total 67 dwellings in Sandy Point, owner-occupied units account for 52 (77.6%), while renter-occupied units make up 15 (22.4%).
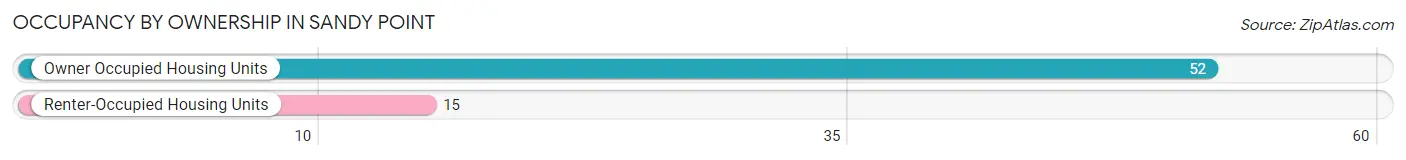
| Occupancy | # Housing Units | % Housing Units |
| Owner Occupied Housing Units | 52 | 77.6% |
| Renter-Occupied Housing Units | 15 | 22.4% |
| Total Occupied Housing Units | 67 | 100.0% |
Occupancy by Household Size in Sandy Point
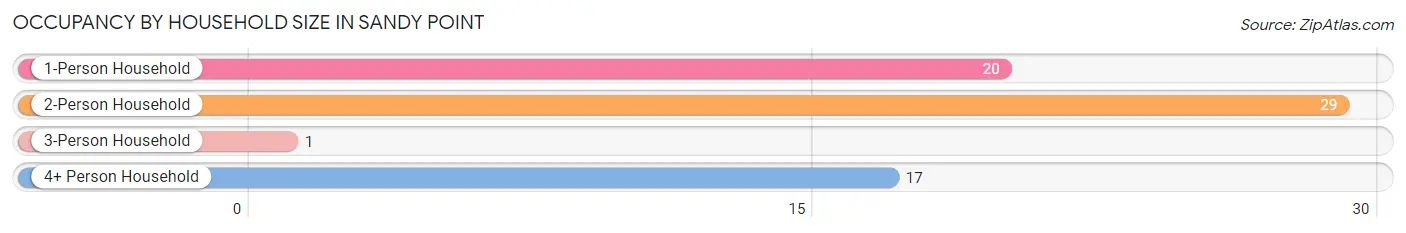
| Household Size | # Housing Units | % Housing Units |
| 1-Person Household | 20 | 29.8% |
| 2-Person Household | 29 | 43.3% |
| 3-Person Household | 1 | 1.5% |
| 4+ Person Household | 17 | 25.4% |
| Total Housing Units | 67 | 100.0% |
Occupancy by Ownership by Household Size in Sandy Point
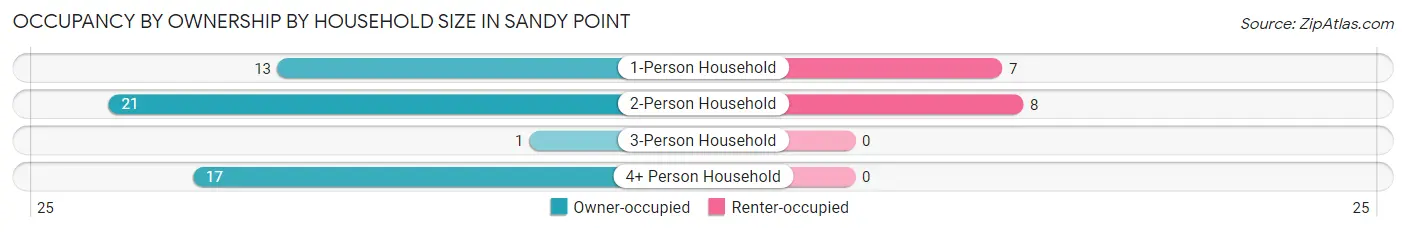
| Household Size | Owner-occupied | Renter-occupied |
| 1-Person Household | 13 (65.0%) | 7 (35.0%) |
| 2-Person Household | 21 (72.4%) | 8 (27.6%) |
| 3-Person Household | 1 (100.0%) | 0 (0.0%) |
| 4+ Person Household | 17 (100.0%) | 0 (0.0%) |
| Total Housing Units | 52 (77.6%) | 15 (22.4%) |
Occupancy by Educational Attainment in Sandy Point
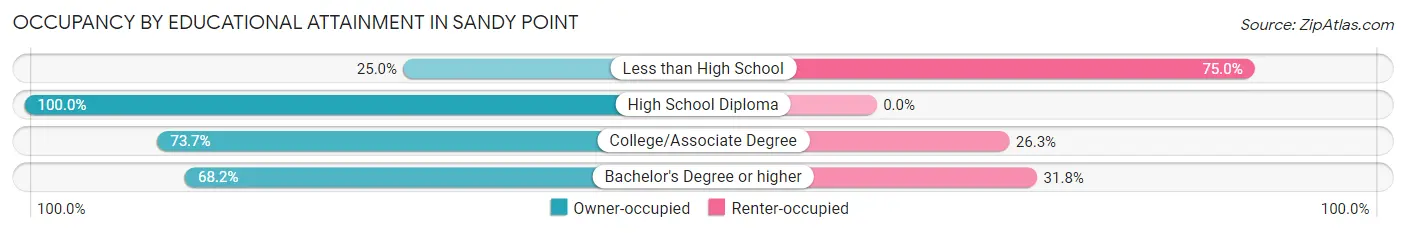
| Household Size | Owner-occupied | Renter-occupied |
| Less than High School | 1 (25.0%) | 3 (75.0%) |
| High School Diploma | 22 (100.0%) | 0 (0.0%) |
| College/Associate Degree | 14 (73.7%) | 5 (26.3%) |
| Bachelor's Degree or higher | 15 (68.2%) | 7 (31.8%) |
Occupancy by Age of Householder in Sandy Point
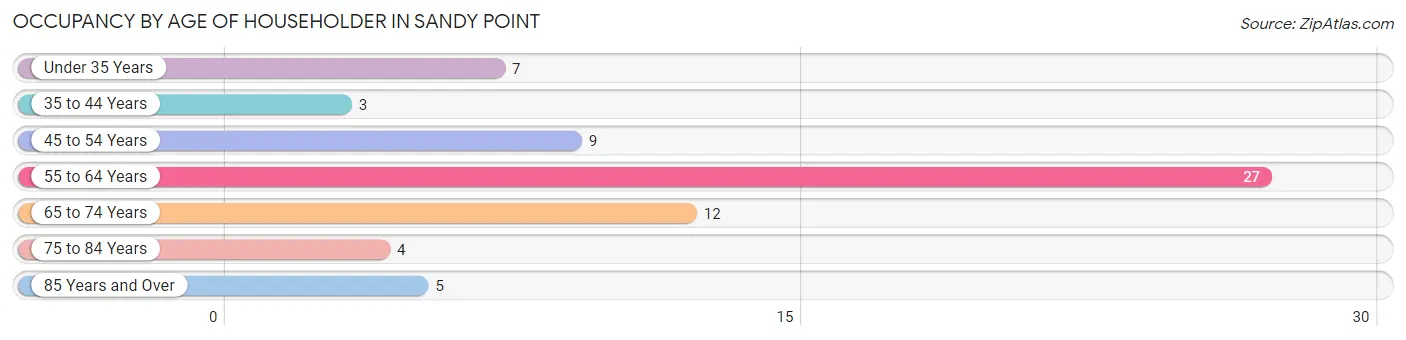
| Age Bracket | # Households | % Households |
| Under 35 Years | 7 | 10.4% |
| 35 to 44 Years | 3 | 4.5% |
| 45 to 54 Years | 9 | 13.4% |
| 55 to 64 Years | 27 | 40.3% |
| 65 to 74 Years | 12 | 17.9% |
| 75 to 84 Years | 4 | 6.0% |
| 85 Years and Over | 5 | 7.5% |
| Total | 67 | 100.0% |
Housing Finances in Sandy Point
Median Income by Occupancy in Sandy Point
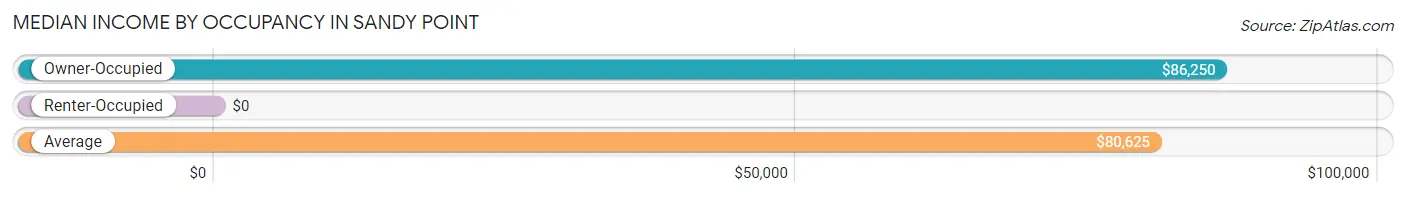
| Occupancy Type | # Households | Median Income |
| Owner-Occupied | 52 (77.6%) | $86,250 |
| Renter-Occupied | 15 (22.4%) | $0 |
| Average | 67 (100.0%) | $80,625 |
Occupancy by Householder Income Bracket in Sandy Point
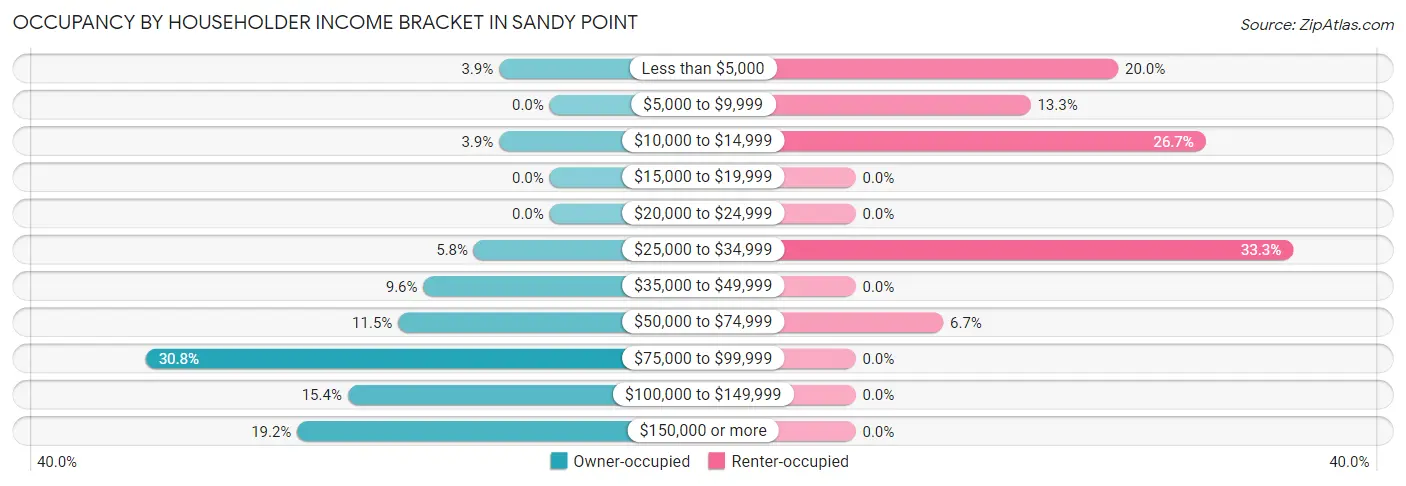
| Income Bracket | Owner-occupied | Renter-occupied |
| Less than $5,000 | 2 (3.8%) | 3 (20.0%) |
| $5,000 to $9,999 | 0 (0.0%) | 2 (13.3%) |
| $10,000 to $14,999 | 2 (3.8%) | 4 (26.7%) |
| $15,000 to $19,999 | 0 (0.0%) | 0 (0.0%) |
| $20,000 to $24,999 | 0 (0.0%) | 0 (0.0%) |
| $25,000 to $34,999 | 3 (5.8%) | 5 (33.3%) |
| $35,000 to $49,999 | 5 (9.6%) | 0 (0.0%) |
| $50,000 to $74,999 | 6 (11.5%) | 1 (6.7%) |
| $75,000 to $99,999 | 16 (30.8%) | 0 (0.0%) |
| $100,000 to $149,999 | 8 (15.4%) | 0 (0.0%) |
| $150,000 or more | 10 (19.2%) | 0 (0.0%) |
| Total | 52 (100.0%) | 15 (100.0%) |
Monthly Housing Cost Tiers in Sandy Point
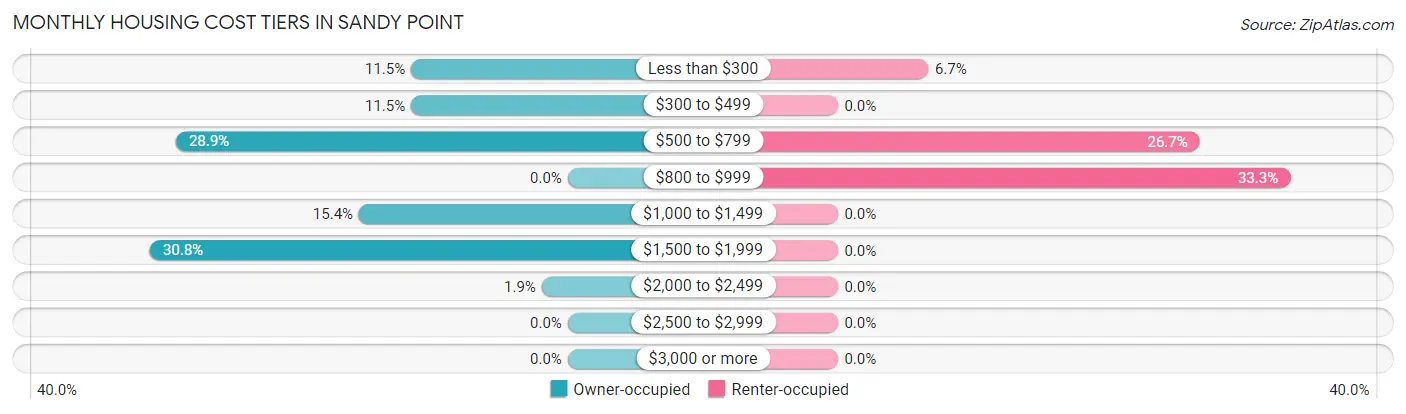
| Monthly Cost | Owner-occupied | Renter-occupied |
| Less than $300 | 6 (11.5%) | 1 (6.7%) |
| $300 to $499 | 6 (11.5%) | 0 (0.0%) |
| $500 to $799 | 15 (28.8%) | 4 (26.7%) |
| $800 to $999 | 0 (0.0%) | 5 (33.3%) |
| $1,000 to $1,499 | 8 (15.4%) | 0 (0.0%) |
| $1,500 to $1,999 | 16 (30.8%) | 0 (0.0%) |
| $2,000 to $2,499 | 1 (1.9%) | 0 (0.0%) |
| $2,500 to $2,999 | 0 (0.0%) | 0 (0.0%) |
| $3,000 or more | 0 (0.0%) | 0 (0.0%) |
| Total | 52 (100.0%) | 15 (100.0%) |
Physical Housing Characteristics in Sandy Point
Housing Structures in Sandy Point
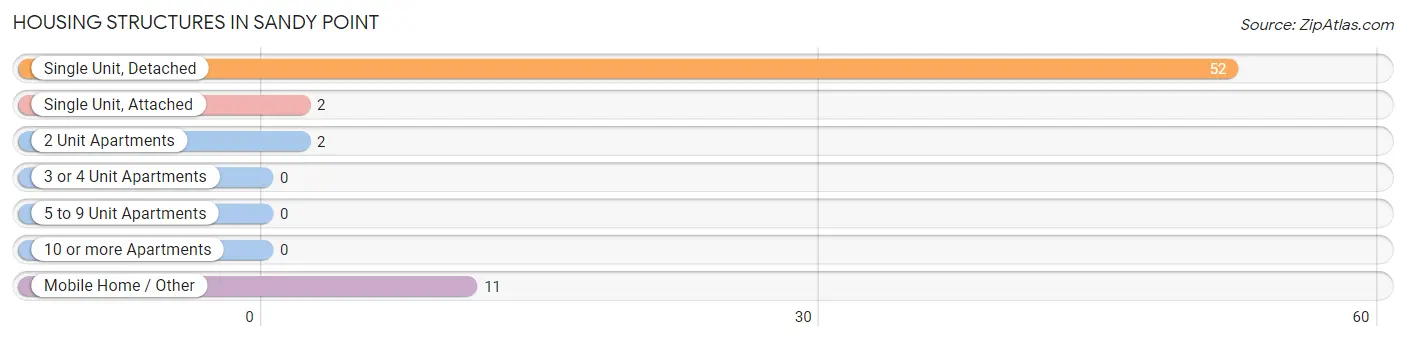
| Structure Type | # Housing Units | % Housing Units |
| Single Unit, Detached | 52 | 77.6% |
| Single Unit, Attached | 2 | 3.0% |
| 2 Unit Apartments | 2 | 3.0% |
| 3 or 4 Unit Apartments | 0 | 0.0% |
| 5 to 9 Unit Apartments | 0 | 0.0% |
| 10 or more Apartments | 0 | 0.0% |
| Mobile Home / Other | 11 | 16.4% |
| Total | 67 | 100.0% |
Housing Structures by Occupancy in Sandy Point
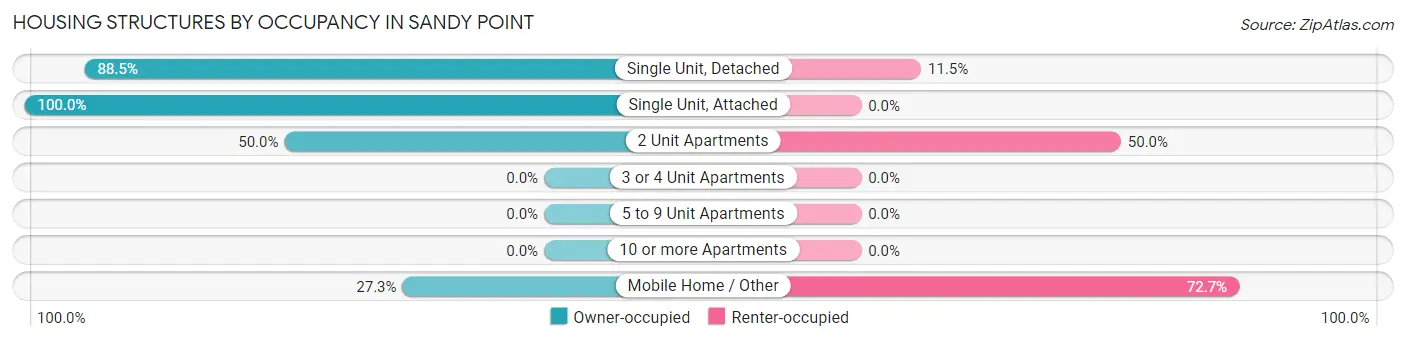
| Structure Type | Owner-occupied | Renter-occupied |
| Single Unit, Detached | 46 (88.5%) | 6 (11.5%) |
| Single Unit, Attached | 2 (100.0%) | 0 (0.0%) |
| 2 Unit Apartments | 1 (50.0%) | 1 (50.0%) |
| 3 or 4 Unit Apartments | 0 (0.0%) | 0 (0.0%) |
| 5 to 9 Unit Apartments | 0 (0.0%) | 0 (0.0%) |
| 10 or more Apartments | 0 (0.0%) | 0 (0.0%) |
| Mobile Home / Other | 3 (27.3%) | 8 (72.7%) |
| Total | 52 (77.6%) | 15 (22.4%) |
Housing Structures by Number of Rooms in Sandy Point
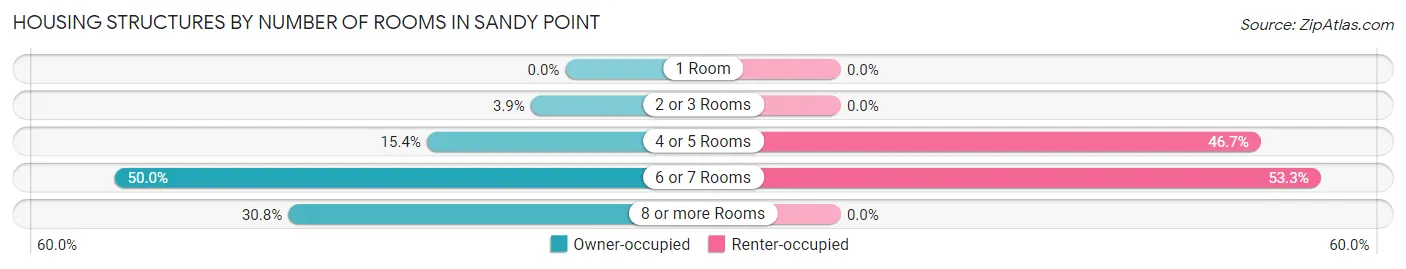
| Number of Rooms | Owner-occupied | Renter-occupied |
| 1 Room | 0 (0.0%) | 0 (0.0%) |
| 2 or 3 Rooms | 2 (3.8%) | 0 (0.0%) |
| 4 or 5 Rooms | 8 (15.4%) | 7 (46.7%) |
| 6 or 7 Rooms | 26 (50.0%) | 8 (53.3%) |
| 8 or more Rooms | 16 (30.8%) | 0 (0.0%) |
| Total | 52 (100.0%) | 15 (100.0%) |
Housing Structure by Heating Type in Sandy Point
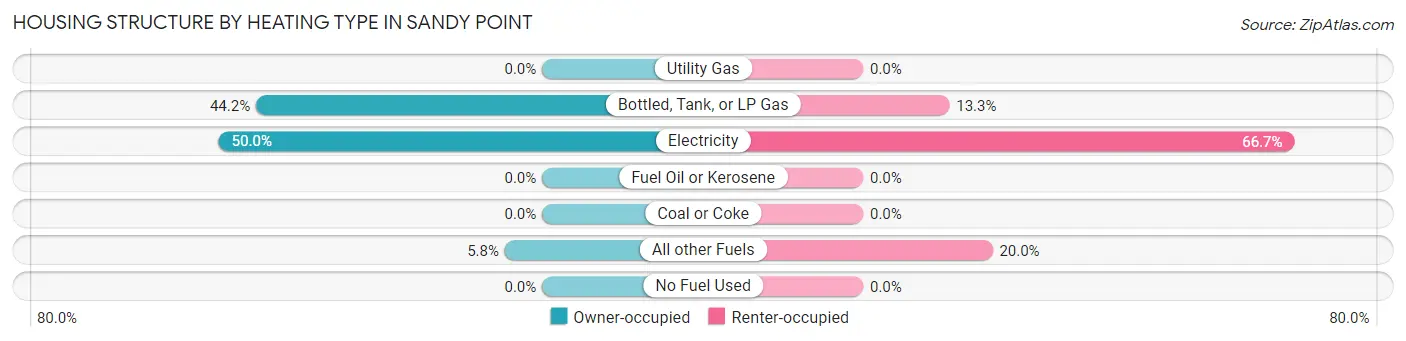
| Heating Type | Owner-occupied | Renter-occupied |
| Utility Gas | 0 (0.0%) | 0 (0.0%) |
| Bottled, Tank, or LP Gas | 23 (44.2%) | 2 (13.3%) |
| Electricity | 26 (50.0%) | 10 (66.7%) |
| Fuel Oil or Kerosene | 0 (0.0%) | 0 (0.0%) |
| Coal or Coke | 0 (0.0%) | 0 (0.0%) |
| All other Fuels | 3 (5.8%) | 3 (20.0%) |
| No Fuel Used | 0 (0.0%) | 0 (0.0%) |
| Total | 52 (100.0%) | 15 (100.0%) |
Household Vehicle Usage in Sandy Point
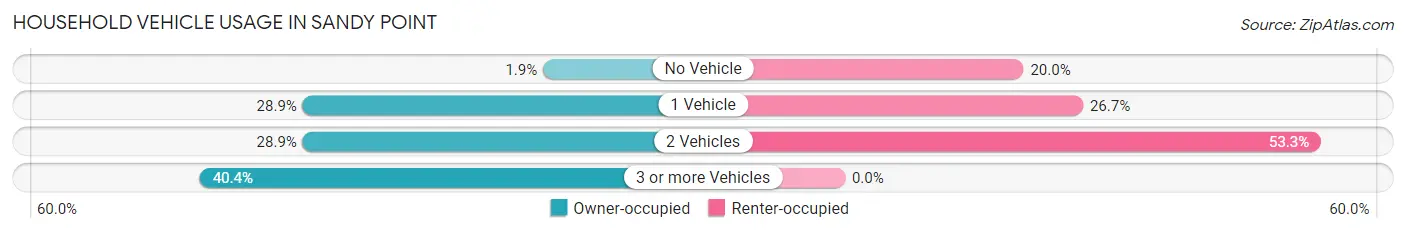
| Vehicles per Household | Owner-occupied | Renter-occupied |
| No Vehicle | 1 (1.9%) | 3 (20.0%) |
| 1 Vehicle | 15 (28.8%) | 4 (26.7%) |
| 2 Vehicles | 15 (28.8%) | 8 (53.3%) |
| 3 or more Vehicles | 21 (40.4%) | 0 (0.0%) |
| Total | 52 (100.0%) | 15 (100.0%) |
Real Estate & Mortgages in Sandy Point
Real Estate and Mortgage Overview in Sandy Point
| Characteristic | Without Mortgage | With Mortgage |
| Housing Units | 34 | 18 |
| Median Property Value | $161,500 | $275,000 |
| Median Household Income | $82,500 | $1 |
| Monthly Housing Costs | $620 | $0 |
| Real Estate Taxes | - | - |
Property Value by Mortgage Status in Sandy Point
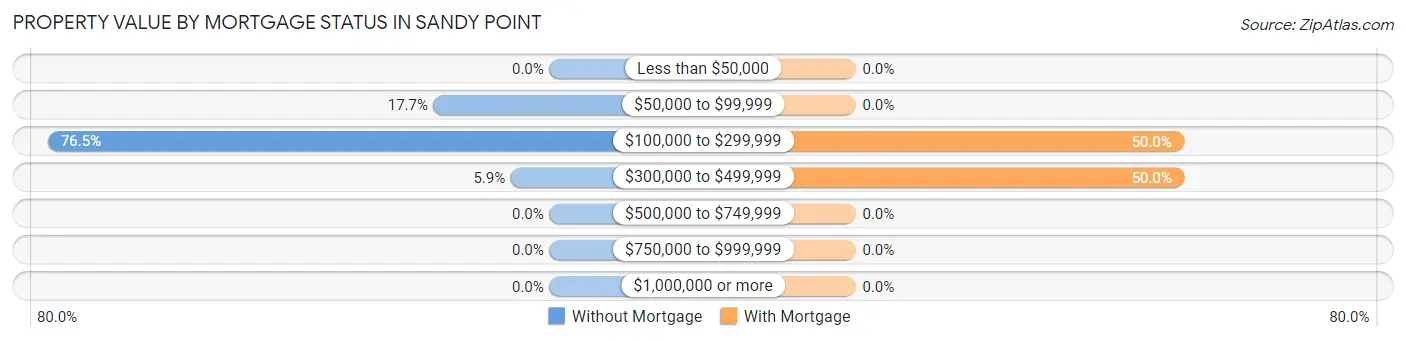
| Property Value | Without Mortgage | With Mortgage |
| Less than $50,000 | 0 (0.0%) | 0 (0.0%) |
| $50,000 to $99,999 | 6 (17.6%) | 0 (0.0%) |
| $100,000 to $299,999 | 26 (76.5%) | 9 (50.0%) |
| $300,000 to $499,999 | 2 (5.9%) | 9 (50.0%) |
| $500,000 to $749,999 | 0 (0.0%) | 0 (0.0%) |
| $750,000 to $999,999 | 0 (0.0%) | 0 (0.0%) |
| $1,000,000 or more | 0 (0.0%) | 0 (0.0%) |
| Total | 34 (100.0%) | 18 (100.0%) |
Household Income by Mortgage Status in Sandy Point
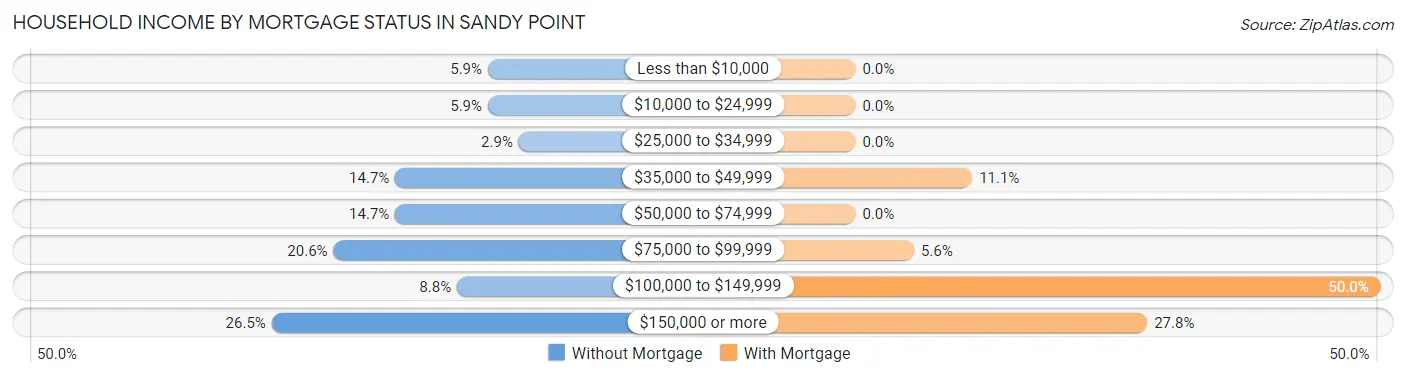
| Household Income | Without Mortgage | With Mortgage |
| Less than $10,000 | 2 (5.9%) | 0 (0.0%) |
| $10,000 to $24,999 | 2 (5.9%) | 0 (0.0%) |
| $25,000 to $34,999 | 1 (2.9%) | 0 (0.0%) |
| $35,000 to $49,999 | 5 (14.7%) | 2 (11.1%) |
| $50,000 to $74,999 | 5 (14.7%) | 0 (0.0%) |
| $75,000 to $99,999 | 7 (20.6%) | 1 (5.6%) |
| $100,000 to $149,999 | 3 (8.8%) | 9 (50.0%) |
| $150,000 or more | 9 (26.5%) | 5 (27.8%) |
| Total | 34 (100.0%) | 18 (100.0%) |
Property Value to Household Income Ratio in Sandy Point
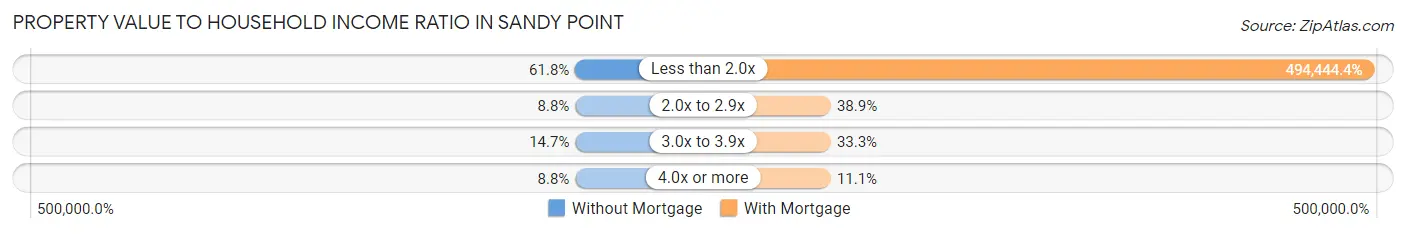
| Value-to-Income Ratio | Without Mortgage | With Mortgage |
| Less than 2.0x | 21 (61.8%) | 89,000 (494,444.4%) |
| 2.0x to 2.9x | 3 (8.8%) | 7 (38.9%) |
| 3.0x to 3.9x | 5 (14.7%) | 6 (33.3%) |
| 4.0x or more | 3 (8.8%) | 2 (11.1%) |
| Total | 34 (100.0%) | 18 (100.0%) |
Real Estate Taxes by Mortgage Status in Sandy Point
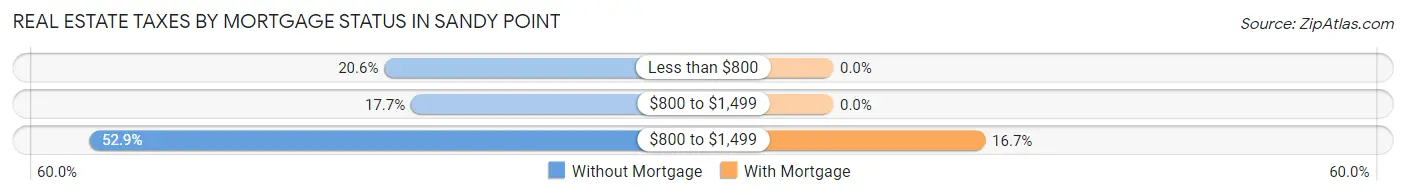
| Property Taxes | Without Mortgage | With Mortgage |
| Less than $800 | 7 (20.6%) | 0 (0.0%) |
| $800 to $1,499 | 6 (17.6%) | 0 (0.0%) |
| $800 to $1,499 | 18 (52.9%) | 3 (16.7%) |
| Total | 34 (100.0%) | 18 (100.0%) |
Health & Disability in Sandy Point
Health Insurance Coverage by Age in Sandy Point
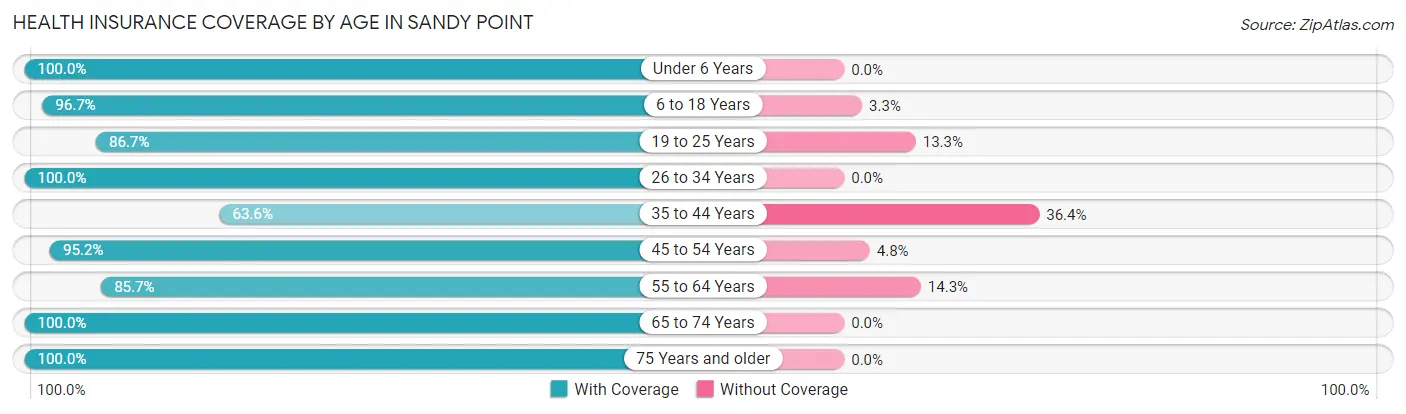
| Age Bracket | With Coverage | Without Coverage |
| Under 6 Years | 2 (100.0%) | 0 (0.0%) |
| 6 to 18 Years | 29 (96.7%) | 1 (3.3%) |
| 19 to 25 Years | 26 (86.7%) | 4 (13.3%) |
| 26 to 34 Years | 6 (100.0%) | 0 (0.0%) |
| 35 to 44 Years | 7 (63.6%) | 4 (36.4%) |
| 45 to 54 Years | 20 (95.2%) | 1 (4.8%) |
| 55 to 64 Years | 36 (85.7%) | 6 (14.3%) |
| 65 to 74 Years | 16 (100.0%) | 0 (0.0%) |
| 75 Years and older | 21 (100.0%) | 0 (0.0%) |
| Total | 163 (91.1%) | 16 (8.9%) |
Health Insurance Coverage by Citizenship Status in Sandy Point
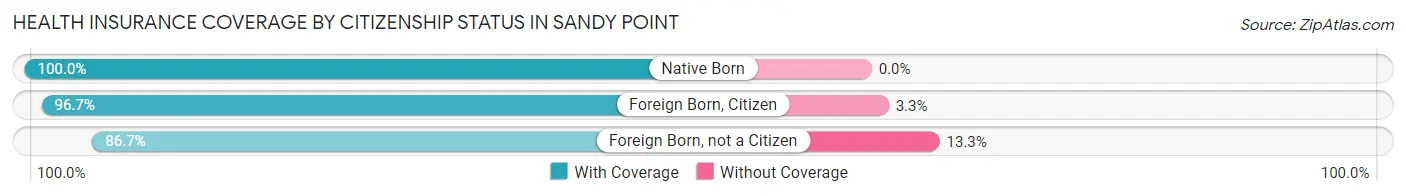
| Citizenship Status | With Coverage | Without Coverage |
| Native Born | 2 (100.0%) | 0 (0.0%) |
| Foreign Born, Citizen | 29 (96.7%) | 1 (3.3%) |
| Foreign Born, not a Citizen | 26 (86.7%) | 4 (13.3%) |
Health Insurance Coverage by Household Income in Sandy Point
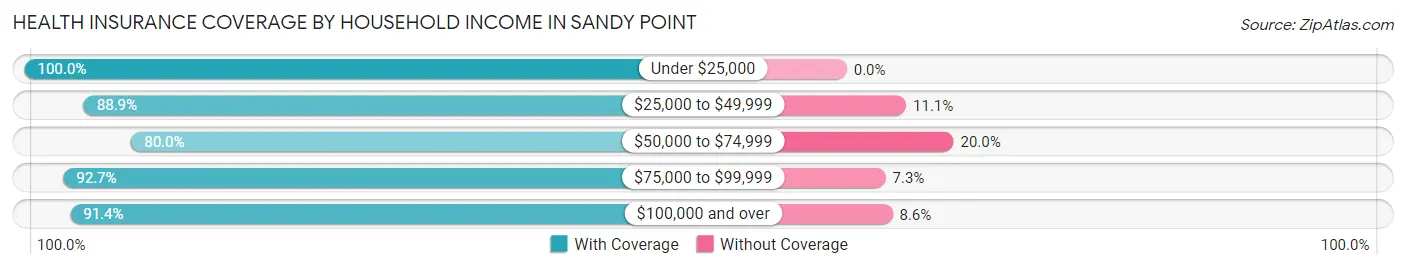
| Household Income | With Coverage | Without Coverage |
| Under $25,000 | 16 (100.0%) | 0 (0.0%) |
| $25,000 to $49,999 | 16 (88.9%) | 2 (11.1%) |
| $50,000 to $74,999 | 16 (80.0%) | 4 (20.0%) |
| $75,000 to $99,999 | 51 (92.7%) | 4 (7.3%) |
| $100,000 and over | 64 (91.4%) | 6 (8.6%) |
Public vs Private Health Insurance Coverage by Age in Sandy Point
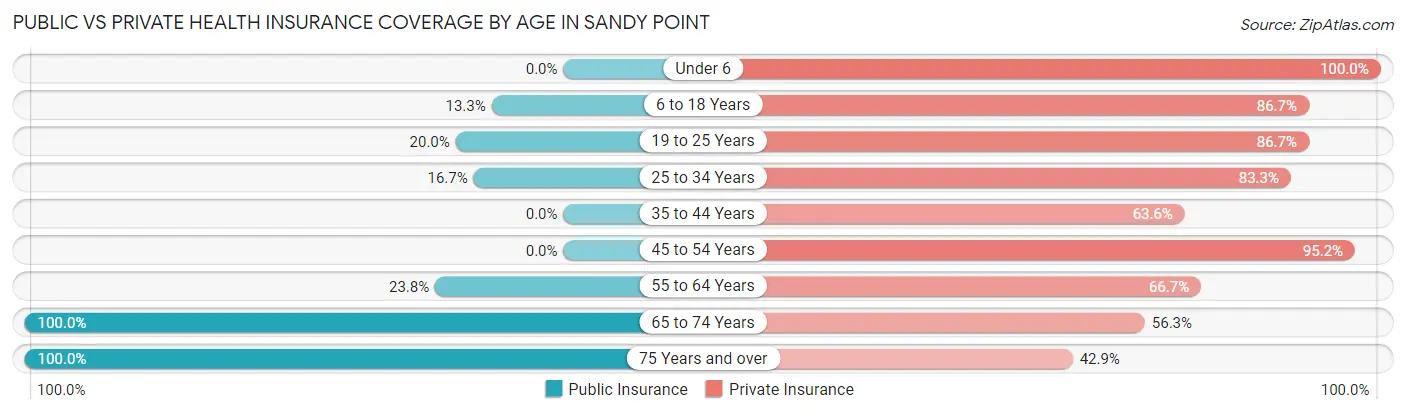
| Age Bracket | Public Insurance | Private Insurance |
| Under 6 | 0 (0.0%) | 2 (100.0%) |
| 6 to 18 Years | 4 (13.3%) | 26 (86.7%) |
| 19 to 25 Years | 6 (20.0%) | 26 (86.7%) |
| 25 to 34 Years | 1 (16.7%) | 5 (83.3%) |
| 35 to 44 Years | 0 (0.0%) | 7 (63.6%) |
| 45 to 54 Years | 0 (0.0%) | 20 (95.2%) |
| 55 to 64 Years | 10 (23.8%) | 28 (66.7%) |
| 65 to 74 Years | 16 (100.0%) | 9 (56.2%) |
| 75 Years and over | 21 (100.0%) | 9 (42.9%) |
| Total | 58 (32.4%) | 132 (73.7%) |
Disability Status by Sex by Age in Sandy Point
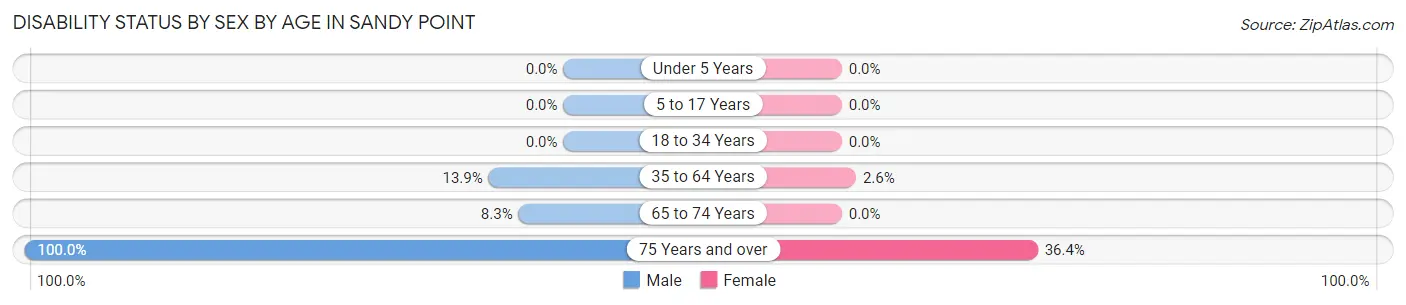
| Age Bracket | Male | Female |
| Under 5 Years | 0 (0.0%) | 0 (0.0%) |
| 5 to 17 Years | 0 (0.0%) | 0 (0.0%) |
| 18 to 34 Years | 0 (0.0%) | 0 (0.0%) |
| 35 to 64 Years | 5 (13.9%) | 1 (2.6%) |
| 65 to 74 Years | 1 (8.3%) | 0 (0.0%) |
| 75 Years and over | 10 (100.0%) | 4 (36.4%) |
Disability Class by Sex by Age in Sandy Point
Disability Class: Hearing Difficulty
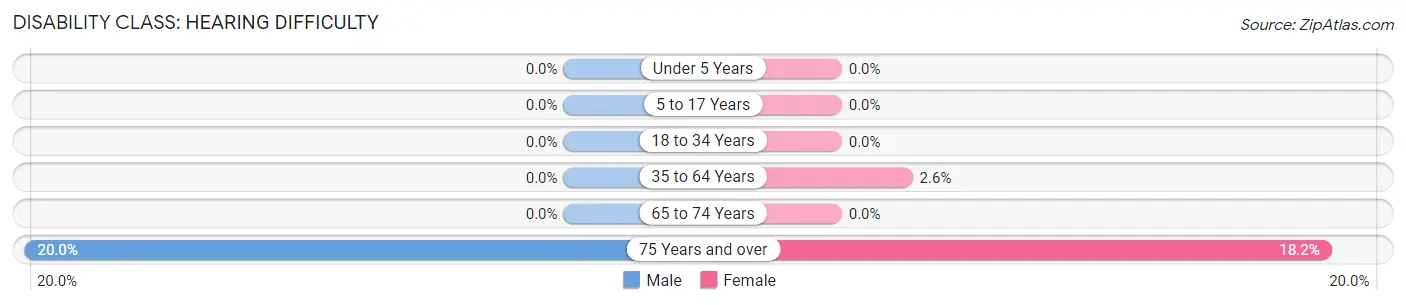
| Age Bracket | Male | Female |
| Under 5 Years | 0 (0.0%) | 0 (0.0%) |
| 5 to 17 Years | 0 (0.0%) | 0 (0.0%) |
| 18 to 34 Years | 0 (0.0%) | 0 (0.0%) |
| 35 to 64 Years | 0 (0.0%) | 1 (2.6%) |
| 65 to 74 Years | 0 (0.0%) | 0 (0.0%) |
| 75 Years and over | 2 (20.0%) | 2 (18.2%) |
Disability Class: Vision Difficulty
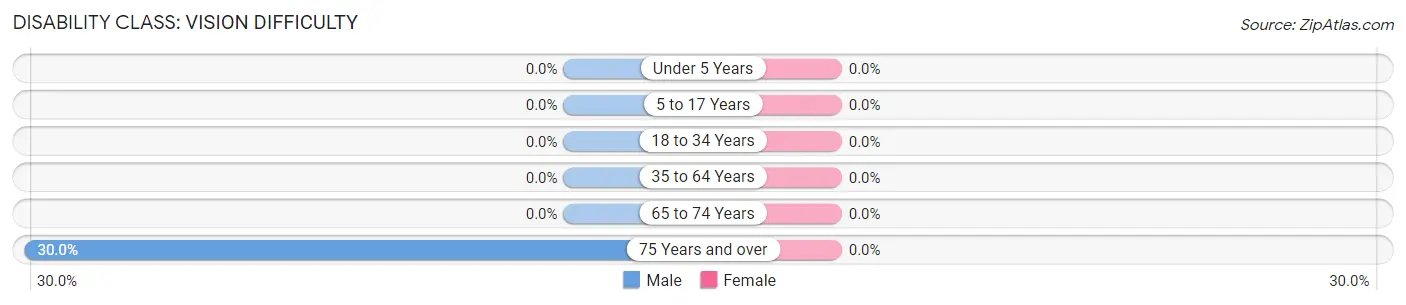
| Age Bracket | Male | Female |
| Under 5 Years | 0 (0.0%) | 0 (0.0%) |
| 5 to 17 Years | 0 (0.0%) | 0 (0.0%) |
| 18 to 34 Years | 0 (0.0%) | 0 (0.0%) |
| 35 to 64 Years | 0 (0.0%) | 0 (0.0%) |
| 65 to 74 Years | 0 (0.0%) | 0 (0.0%) |
| 75 Years and over | 3 (30.0%) | 0 (0.0%) |
Disability Class: Cognitive Difficulty
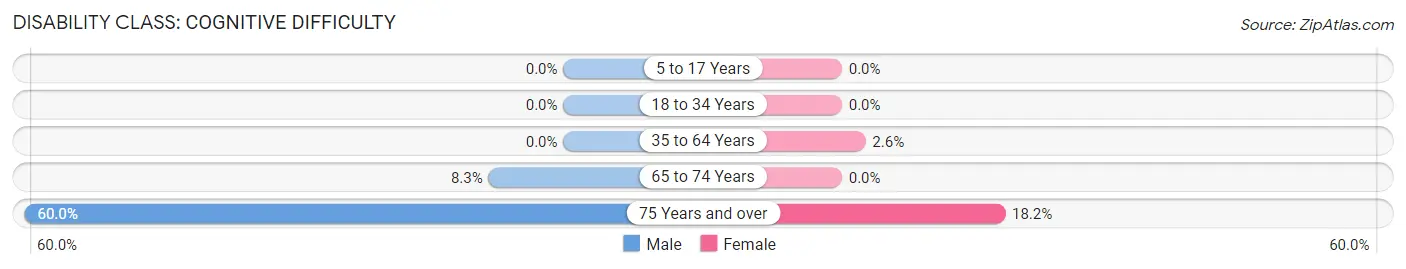
| Age Bracket | Male | Female |
| 5 to 17 Years | 0 (0.0%) | 0 (0.0%) |
| 18 to 34 Years | 0 (0.0%) | 0 (0.0%) |
| 35 to 64 Years | 0 (0.0%) | 1 (2.6%) |
| 65 to 74 Years | 1 (8.3%) | 0 (0.0%) |
| 75 Years and over | 6 (60.0%) | 2 (18.2%) |
Disability Class: Ambulatory Difficulty
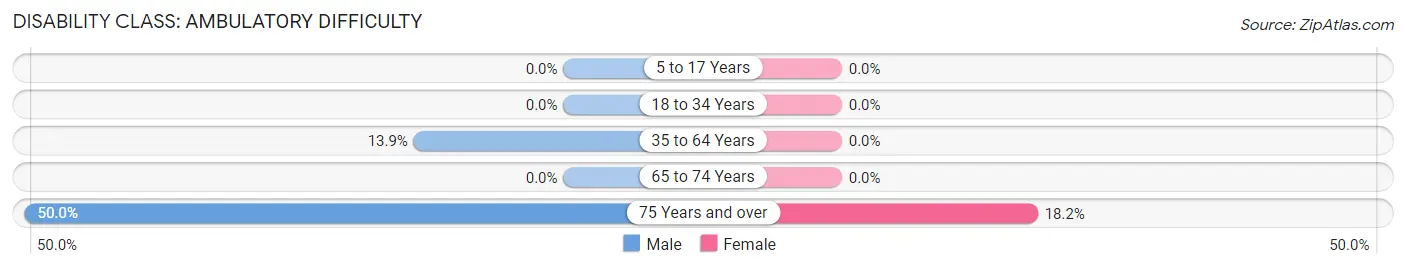
| Age Bracket | Male | Female |
| 5 to 17 Years | 0 (0.0%) | 0 (0.0%) |
| 18 to 34 Years | 0 (0.0%) | 0 (0.0%) |
| 35 to 64 Years | 5 (13.9%) | 0 (0.0%) |
| 65 to 74 Years | 0 (0.0%) | 0 (0.0%) |
| 75 Years and over | 5 (50.0%) | 2 (18.2%) |
Disability Class: Self-Care Difficulty
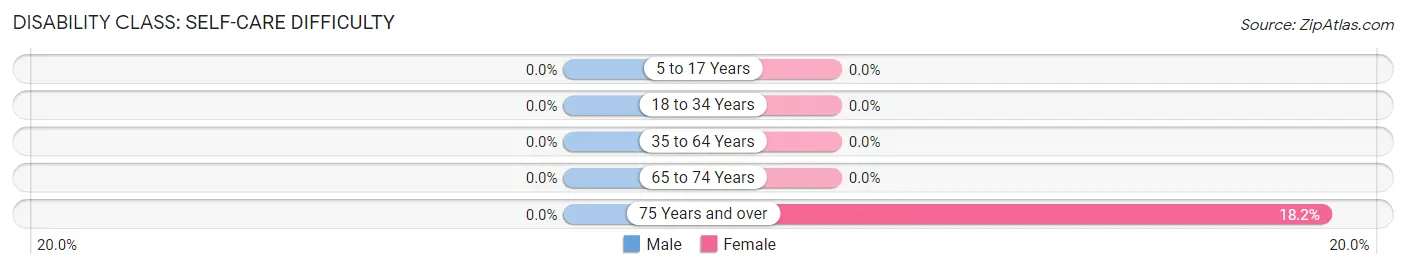
| Age Bracket | Male | Female |
| 5 to 17 Years | 0 (0.0%) | 0 (0.0%) |
| 18 to 34 Years | 0 (0.0%) | 0 (0.0%) |
| 35 to 64 Years | 0 (0.0%) | 0 (0.0%) |
| 65 to 74 Years | 0 (0.0%) | 0 (0.0%) |
| 75 Years and over | 0 (0.0%) | 2 (18.2%) |
Technology Access in Sandy Point
Computing Device Access in Sandy Point
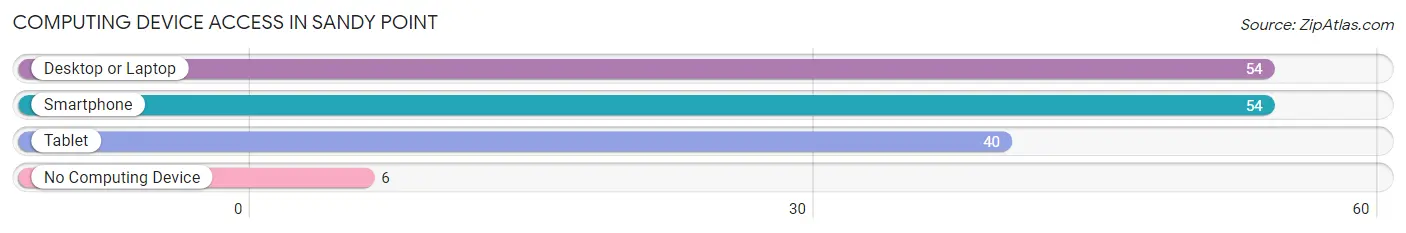
| Device Type | # Households | % Households |
| Desktop or Laptop | 54 | 80.6% |
| Smartphone | 54 | 80.6% |
| Tablet | 40 | 59.7% |
| No Computing Device | 6 | 9.0% |
| Total | 67 | 100.0% |
Internet Access in Sandy Point
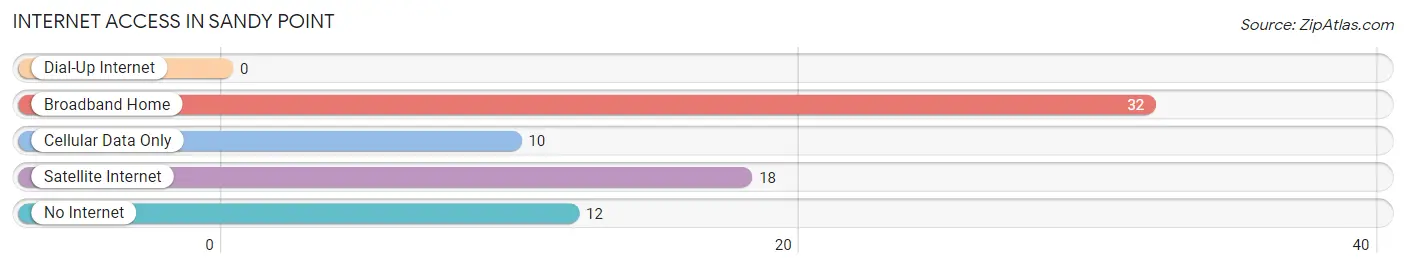
| Internet Type | # Households | % Households |
| Dial-Up Internet | 0 | 0.0% |
| Broadband Home | 32 | 47.8% |
| Cellular Data Only | 10 | 14.9% |
| Satellite Internet | 18 | 26.9% |
| No Internet | 12 | 17.9% |
| Total | 67 | 100.0% |
Sandy Point Summary
Sandy Point is a small unincorporated community located in Nueces County, Texas, United States. It is situated on the Gulf of Mexico, approximately 20 miles south of Corpus Christi. The population of Sandy Point was estimated to be around 200 people in 2020.
History
Sandy Point was first settled in the late 1800s by a group of fishermen from the nearby town of Port Aransas. The fishermen were attracted to the area due to its abundance of fish and shellfish. The first permanent settlers of Sandy Point were the families of John and Mary Ann Smith, who arrived in 1891. The Smiths built a small fishing camp on the beach and began to harvest oysters and other seafood from the Gulf of Mexico.
In the early 1900s, the population of Sandy Point began to grow as more families moved to the area. The community was officially established in 1912 when the post office was opened. The post office was named after the sandy point of land that jutted out into the Gulf of Mexico.
In the 1920s, the population of Sandy Point began to decline as the fishing industry began to decline. The Great Depression of the 1930s further decreased the population of Sandy Point as many of the fishermen were forced to move away in search of work.
In the 1940s, the population of Sandy Point began to increase again as the fishing industry began to recover. The population of Sandy Point continued to grow throughout the 1950s and 1960s as more people moved to the area.
Geography
Sandy Point is located on the Gulf of Mexico, approximately 20 miles south of Corpus Christi. The community is situated on a sandy point of land that juts out into the Gulf of Mexico. The area is surrounded by wetlands and is home to a variety of wildlife, including birds, fish, and other marine life.
The climate in Sandy Point is subtropical, with hot summers and mild winters. The average temperature in the summer is around 90°F and the average temperature in the winter is around 60°F.
Economy
The economy of Sandy Point is largely based on fishing and tourism. The fishing industry is the main source of income for many of the residents of Sandy Point. The area is home to a variety of fish, including redfish, flounder, and trout. The seafood harvested from the Gulf of Mexico is sold to local restaurants and markets.
Tourism is also an important part of the economy of Sandy Point. The area is home to a variety of attractions, including beaches, fishing charters, and boat tours. The area is also home to a variety of restaurants, bars, and shops.
Demographics
The population of Sandy Point was estimated to be around 200 people in 2020. The majority of the population is white (90%), followed by Hispanic (7%), and African American (3%). The median household income in Sandy Point is $45,000 and the median home value is $150,000. The majority of the population is employed in the fishing industry (50%), followed by tourism (25%), and other industries (25%).
Common Questions
What is the Total Population of Sandy Point?
Total Population of Sandy Point is 179.
What is the Total Male Population of Sandy Point?
Total Male Population of Sandy Point is 87.
What is the Total Female Population of Sandy Point?
Total Female Population of Sandy Point is 92.
What is the Ratio of Males per 100 Females in Sandy Point?
There are 94.57 Males per 100 Females in Sandy Point.
What is the Ratio of Females per 100 Males in Sandy Point?
There are 105.75 Females per 100 Males in Sandy Point.
What is the Median Population Age in Sandy Point?
Median Population Age in Sandy Point is 49.2 Years.
What is the Average Family Size in Sandy Point
Average Family Size in Sandy Point is 3.3 People.
What is the Average Household Size in Sandy Point
Average Household Size in Sandy Point is 2.7 People.
What is Per Capita Income in Sandy Point?
Per Capita income in Sandy Point is $40,898.
What is the Median Family Income in Sandy Point?
Median Family Income in Sandy Point is $88,036.
What is the Median Household income in Sandy Point?
Median Household Income in Sandy Point is $80,625.
What is Income or Wage Gap in Sandy Point?
Income or Wage Gap in Sandy Point is 15.2%.
Women in Sandy Point earn 84.8 cents for every dollar earned by a man.
What is Inequality or Gini Index in Sandy Point?
Inequality or Gini Index in Sandy Point is 0.56.
How Large is the Labor Force in Sandy Point?
There are 83 People in the Labor Forcein in Sandy Point.
What is the Percentage of People in the Labor Force in Sandy Point?
51.2% of People are in the Labor Force in Sandy Point.
What is the Unemployment Rate in Sandy Point?
Unemployment Rate in Sandy Point is 1.2%.