Petronilla, TX
Petronilla Overview
69
TOTAL POPULATION
41
MALE POPULATION
28
FEMALE POPULATION
146.43
MALES / 100 FEMALES
68.29
FEMALES / 100 MALES
50.3
MEDIAN AGE
3.9
AVG FAMILY SIZE
2.6
AVG HOUSEHOLD SIZE
$40,557
PER CAPITA INCOME
$183,125
AVG FAMILY INCOME
0.39
INEQUALITY / GINI INDEX
38
LABOR FORCE [ PEOPLE ]
59.4%
PERCENT IN LABOR FORCE
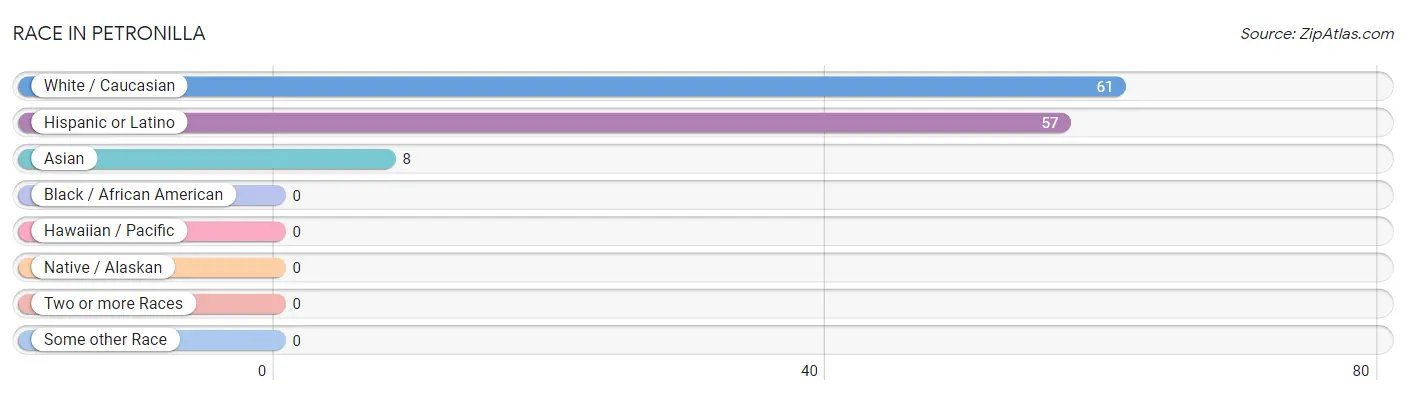
Race in Petronilla
The most populous races in Petronilla are White / Caucasian (61 | 88.4%), Hispanic or Latino (57 | 82.6%), and Asian (8 | 11.6%).
| Race | # Population | % Population |
| Asian | 8 | 11.6% |
| Black / African American | 0 | 0.0% |
| Hawaiian / Pacific | 0 | 0.0% |
| Hispanic or Latino | 57 | 82.6% |
| Native / Alaskan | 0 | 0.0% |
| White / Caucasian | 61 | 88.4% |
| Two or more Races | 0 | 0.0% |
| Some other Race | 0 | 0.0% |
| Total | 69 | 100.0% |
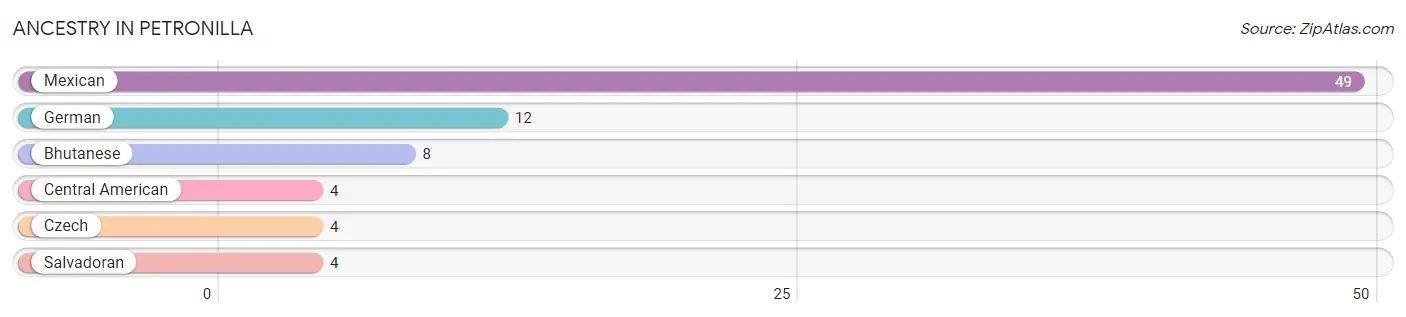
Ancestry in Petronilla
The most populous ancestries reported in Petronilla are Mexican (49 | 71.0%), German (12 | 17.4%), Bhutanese (8 | 11.6%), Central American (4 | 5.8%), and Czech (4 | 5.8%), together accounting for 111.6% of all Petronilla residents.
| Ancestry | # Population | % Population |
| Bhutanese | 8 | 11.6% |
| Central American | 4 | 5.8% |
| Czech | 4 | 5.8% |
| German | 12 | 17.4% |
| Mexican | 49 | 71.0% |
| Salvadoran | 4 | 5.8% | View All 6 Rows |
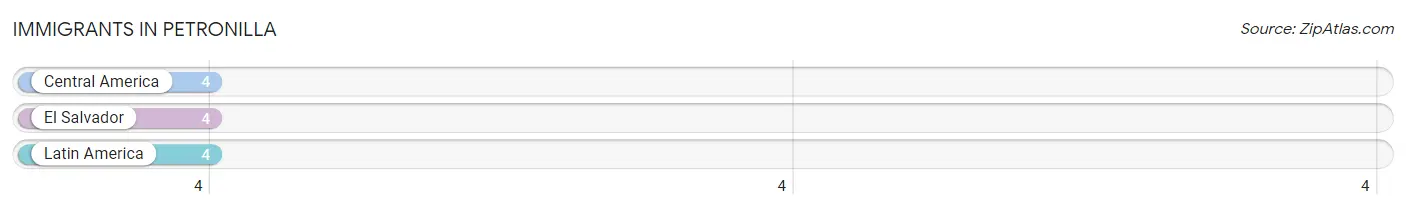
Immigrants in Petronilla
The most numerous immigrant groups reported in Petronilla came from Central America (4 | 5.8%), El Salvador (4 | 5.8%), and Latin America (4 | 5.8%), together accounting for 17.4% of all Petronilla residents.
| Immigration Origin | # Population | % Population |
| Central America | 4 | 5.8% |
| El Salvador | 4 | 5.8% |
| Latin America | 4 | 5.8% | View All 3 Rows |
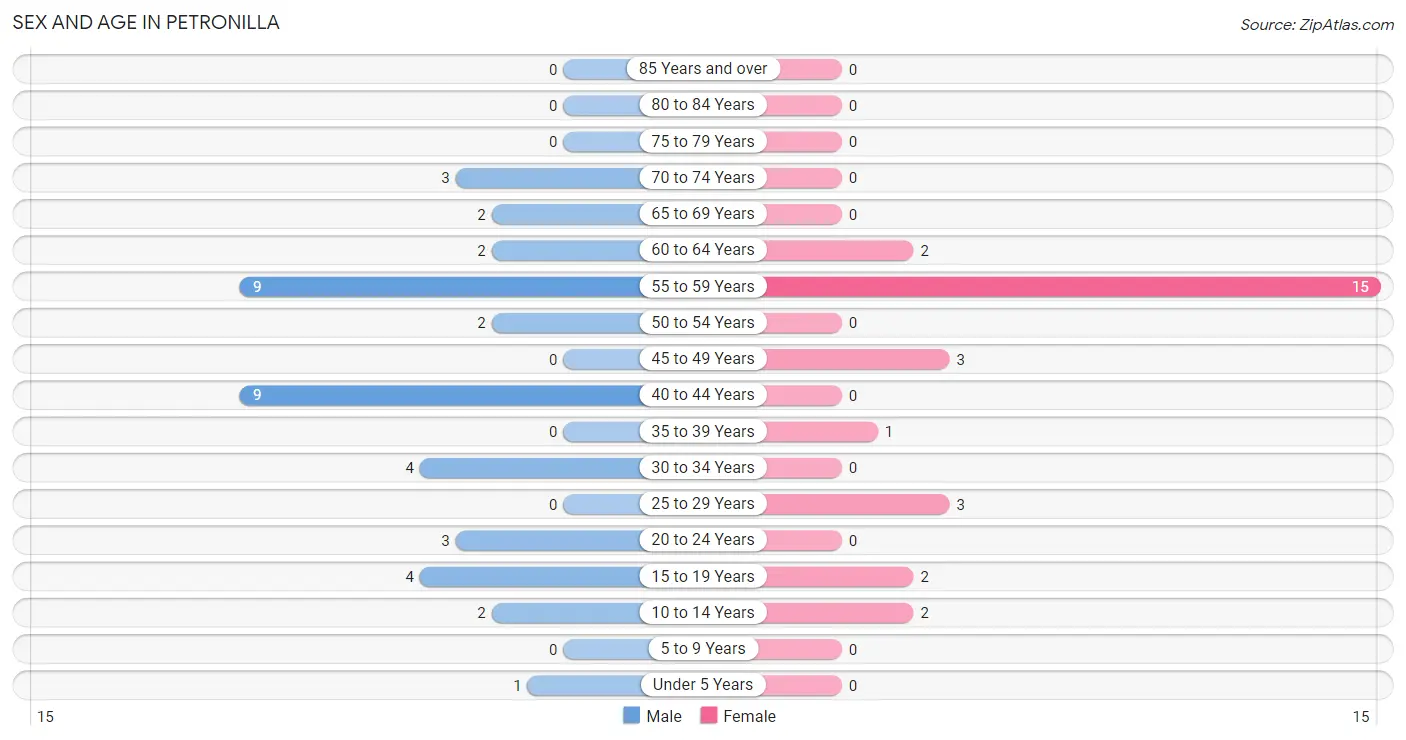
Sex and Age in Petronilla
Sex and Age in Petronilla
The most populous age groups in Petronilla are 40 to 44 Years (9 | 22.0%) for men and 55 to 59 Years (15 | 53.6%) for women.
| Age Bracket | Male | Female |
| Under 5 Years | 1 (2.4%) | 0 (0.0%) |
| 5 to 9 Years | 0 (0.0%) | 0 (0.0%) |
| 10 to 14 Years | 2 (4.9%) | 2 (7.1%) |
| 15 to 19 Years | 4 (9.8%) | 2 (7.1%) |
| 20 to 24 Years | 3 (7.3%) | 0 (0.0%) |
| 25 to 29 Years | 0 (0.0%) | 3 (10.7%) |
| 30 to 34 Years | 4 (9.8%) | 0 (0.0%) |
| 35 to 39 Years | 0 (0.0%) | 1 (3.6%) |
| 40 to 44 Years | 9 (22.0%) | 0 (0.0%) |
| 45 to 49 Years | 0 (0.0%) | 3 (10.7%) |
| 50 to 54 Years | 2 (4.9%) | 0 (0.0%) |
| 55 to 59 Years | 9 (22.0%) | 15 (53.6%) |
| 60 to 64 Years | 2 (4.9%) | 2 (7.1%) |
| 65 to 69 Years | 2 (4.9%) | 0 (0.0%) |
| 70 to 74 Years | 3 (7.3%) | 0 (0.0%) |
| 75 to 79 Years | 0 (0.0%) | 0 (0.0%) |
| 80 to 84 Years | 0 (0.0%) | 0 (0.0%) |
| 85 Years and over | 0 (0.0%) | 0 (0.0%) |
| Total | 41 (100.0%) | 28 (100.0%) |
Families and Households in Petronilla
Median Family Size in Petronilla
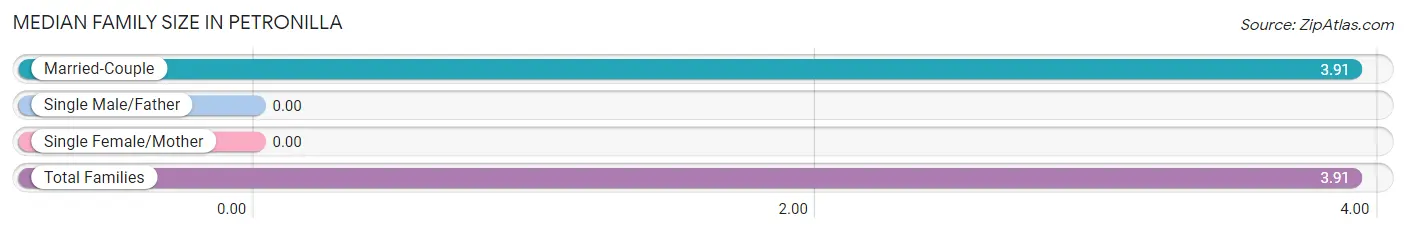
| Family Type | # Families | Family Size |
| Married-Couple | 11 (100.0%) | 3.91 |
| Single Male/Father | 0 (0.0%) | - |
| Single Female/Mother | 0 (0.0%) | - |
| Total Families | 11 (100.0%) | 3.91 |
Median Household Size in Petronilla
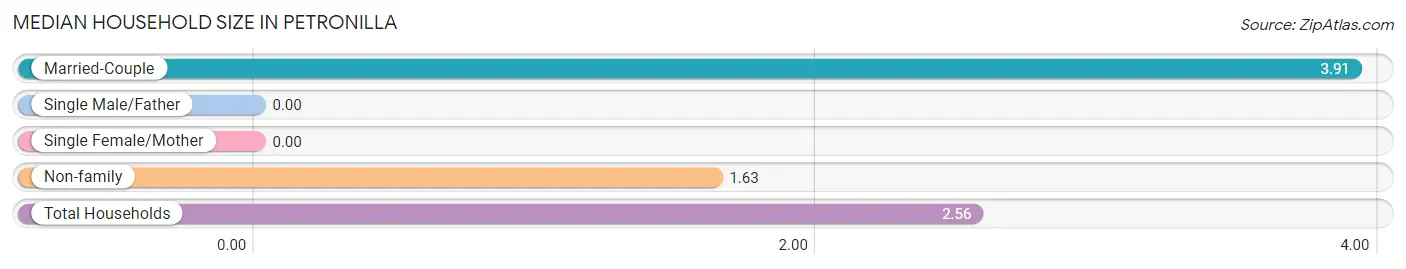
| Household Type | # Households | Household Size |
| Married-Couple | 11 (40.7%) | 3.91 |
| Single Male/Father | 0 (0.0%) | - |
| Single Female/Mother | 0 (0.0%) | - |
| Non-family | 16 (59.3%) | 1.63 |
| Total Households | 27 (100.0%) | 2.56 |
Household Size by Marriage Status in Petronilla
Out of a total of 27 households in Petronilla, 11 (40.7%) are family households, while 16 (59.3%) are nonfamily households. The most numerous type of family households are 2-person households, comprising 4, and the most common type of nonfamily households are 2-person households, comprising 9.
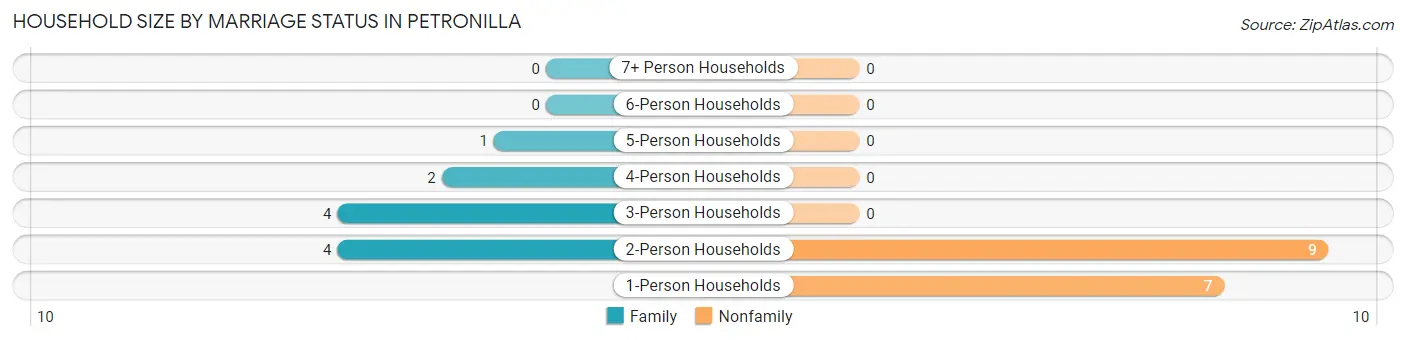
| Household Size | Family Households | Nonfamily Households |
| 1-Person Households | - | 7 (25.9%) |
| 2-Person Households | 4 (14.8%) | 9 (33.3%) |
| 3-Person Households | 4 (14.8%) | 0 (0.0%) |
| 4-Person Households | 2 (7.4%) | 0 (0.0%) |
| 5-Person Households | 1 (3.7%) | 0 (0.0%) |
| 6-Person Households | 0 (0.0%) | 0 (0.0%) |
| 7+ Person Households | 0 (0.0%) | 0 (0.0%) |
| Total | 11 (40.7%) | 16 (59.3%) |
Female Fertility in Petronilla
Fertility by Age in Petronilla
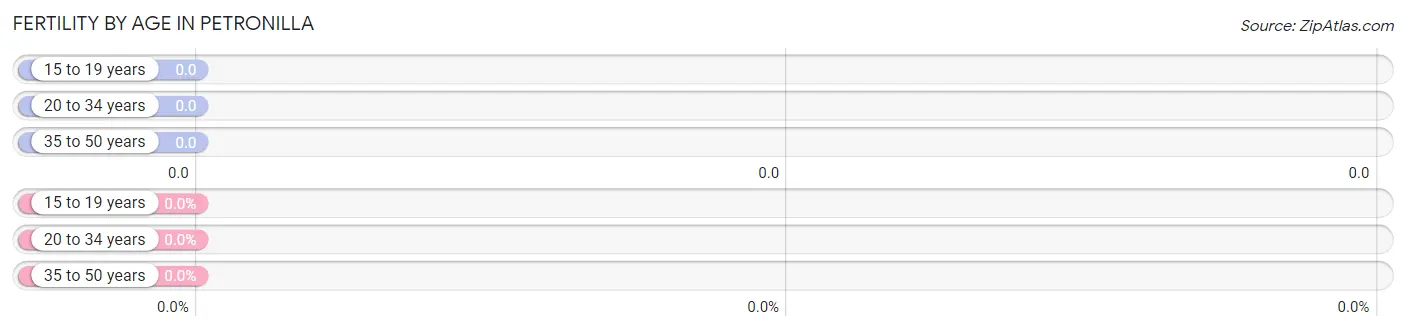
| Age Bracket | Women with Births | Births / 1,000 Women |
| 15 to 19 years | 0 (0.0%) | 0.0 |
| 20 to 34 years | 0 (0.0%) | 0.0 |
| 35 to 50 years | 0 (0.0%) | 0.0 |
| Total | 0 (0.0%) | 0.0 |
Fertility by Age by Marriage Status in Petronilla
| Age Bracket | Married | Unmarried |
| 15 to 19 years | 0 (0.0%) | 0 (0.0%) |
| 20 to 34 years | 0 (0.0%) | 0 (0.0%) |
| 35 to 50 years | 0 (0.0%) | 0 (0.0%) |
| Total | 0 (0.0%) | 0 (0.0%) |
Fertility by Education in Petronilla
| Educational Attainment | Women with Births | Births / 1,000 Women |
| Less than High School | 0 (0.0%) | 0.0 |
| High School Diploma | 0 (0.0%) | 0.0 |
| College or Associate's Degree | 0 (0.0%) | 0.0 |
| Bachelor's Degree | 0 (0.0%) | 0.0 |
| Graduate Degree | 0 (0.0%) | 0.0 |
| Total | 0 (0.0%) | 0.0 |
Fertility by Education by Marriage Status in Petronilla
| Educational Attainment | Married | Unmarried |
| Less than High School | 0 (0.0%) | 0 (0.0%) |
| High School Diploma | 0 (0.0%) | 0 (0.0%) |
| College or Associate's Degree | 0 (0.0%) | 0 (0.0%) |
| Bachelor's Degree | 0 (0.0%) | 0 (0.0%) |
| Graduate Degree | 0 (0.0%) | 0 (0.0%) |
| Total | 0 (0.0%) | 0 (0.0%) |
Income in Petronilla
Income Overview in Petronilla
| Characteristic | Number | Measure |
| Per Capita Income | 69 | $40,557 |
| Median Family Income | 11 | $183,125 |
| Mean Family Income | 11 | $164,464 |
| Median Household Income | 27 | $0 |
| Mean Household Income | 27 | $93,967 |
| Income Deficit | 11 | $0 |
| Wage / Income Gap (%) | 69 | 0.00% |
| Wage / Income Gap ($) | 69 | 100.00¢ per $1 |
| Gini / Inequality Index | 69 | 0.39 |
Earnings by Sex in Petronilla
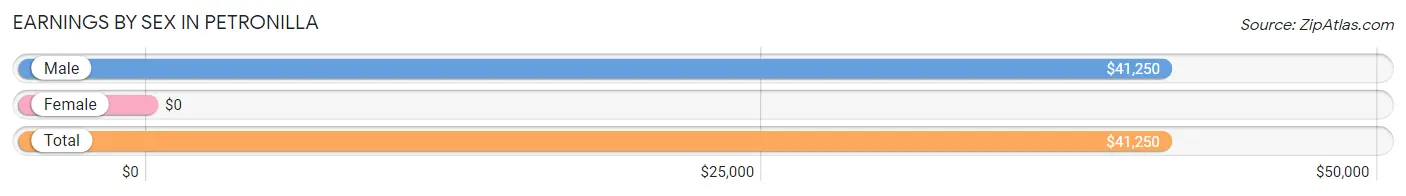
| Sex | Number | Average Earnings |
| Male | 31 (79.5%) | $41,250 |
| Female | 8 (20.5%) | $0 |
| Total | 39 (100.0%) | $41,250 |
Earnings by Sex by Income Bracket in Petronilla
The most common earnings brackets in Petronilla are $35,000 to $39,999 for men (9 | 29.0%) and $35,000 to $39,999 for women (3 | 37.5%).
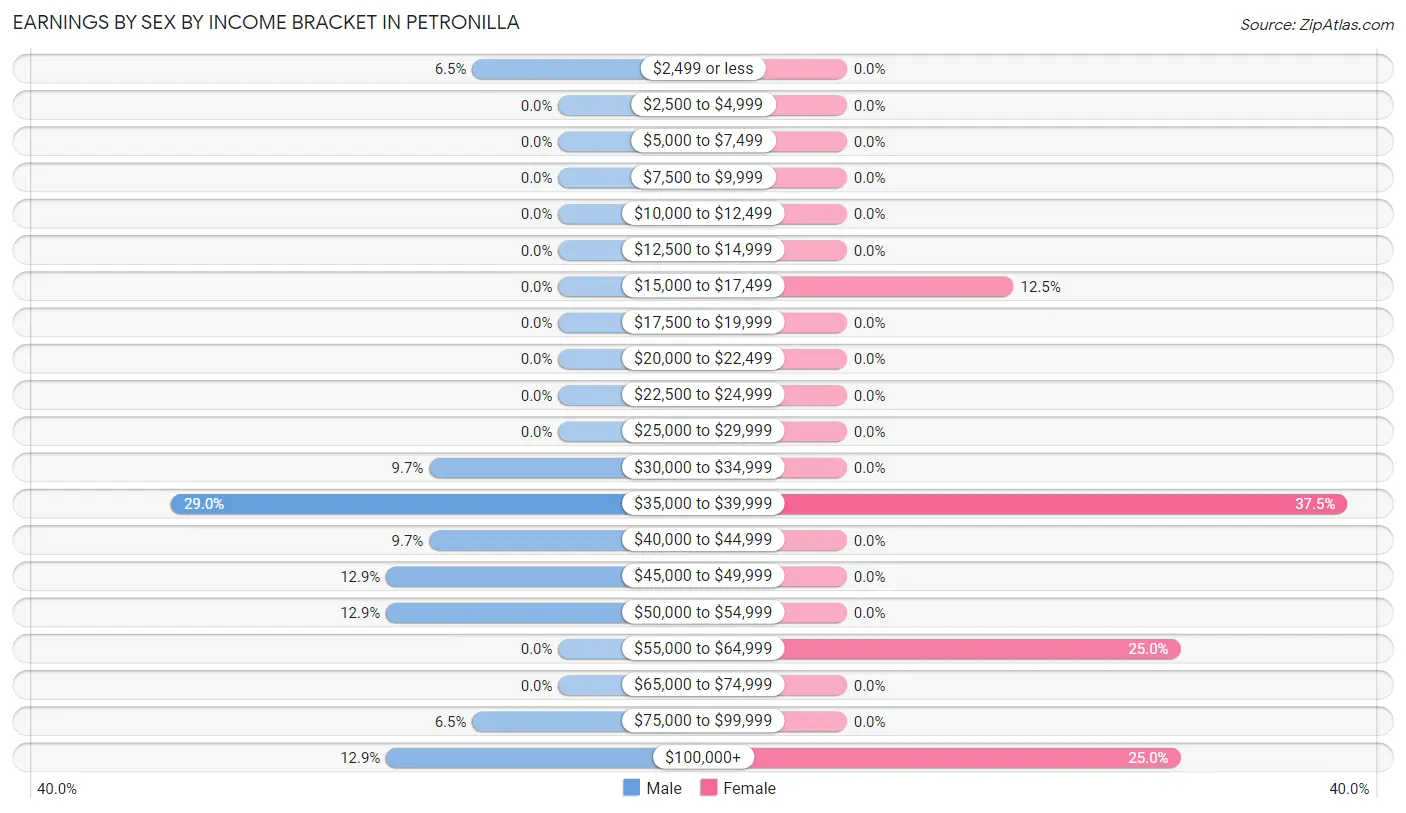
| Income | Male | Female |
| $2,499 or less | 2 (6.5%) | 0 (0.0%) |
| $2,500 to $4,999 | 0 (0.0%) | 0 (0.0%) |
| $5,000 to $7,499 | 0 (0.0%) | 0 (0.0%) |
| $7,500 to $9,999 | 0 (0.0%) | 0 (0.0%) |
| $10,000 to $12,499 | 0 (0.0%) | 0 (0.0%) |
| $12,500 to $14,999 | 0 (0.0%) | 0 (0.0%) |
| $15,000 to $17,499 | 0 (0.0%) | 1 (12.5%) |
| $17,500 to $19,999 | 0 (0.0%) | 0 (0.0%) |
| $20,000 to $22,499 | 0 (0.0%) | 0 (0.0%) |
| $22,500 to $24,999 | 0 (0.0%) | 0 (0.0%) |
| $25,000 to $29,999 | 0 (0.0%) | 0 (0.0%) |
| $30,000 to $34,999 | 3 (9.7%) | 0 (0.0%) |
| $35,000 to $39,999 | 9 (29.0%) | 3 (37.5%) |
| $40,000 to $44,999 | 3 (9.7%) | 0 (0.0%) |
| $45,000 to $49,999 | 4 (12.9%) | 0 (0.0%) |
| $50,000 to $54,999 | 4 (12.9%) | 0 (0.0%) |
| $55,000 to $64,999 | 0 (0.0%) | 2 (25.0%) |
| $65,000 to $74,999 | 0 (0.0%) | 0 (0.0%) |
| $75,000 to $99,999 | 2 (6.5%) | 0 (0.0%) |
| $100,000+ | 4 (12.9%) | 2 (25.0%) |
| Total | 31 (100.0%) | 8 (100.0%) |
Earnings by Sex by Educational Attainment in Petronilla
| Educational Attainment | Male Income | Female Income |
| Less than High School | - | - |
| High School Diploma | - | - |
| College or Associate's Degree | - | - |
| Bachelor's Degree | - | - |
| Graduate Degree | - | - |
| Total | $41,250 | $0 |
Family Income in Petronilla
Family Income Brackets in Petronilla
According to the Petronilla family income data, there are 4 families falling into the $150,000 to $199,999 income range, which is the most common income bracket and makes up 36.4% of all families.
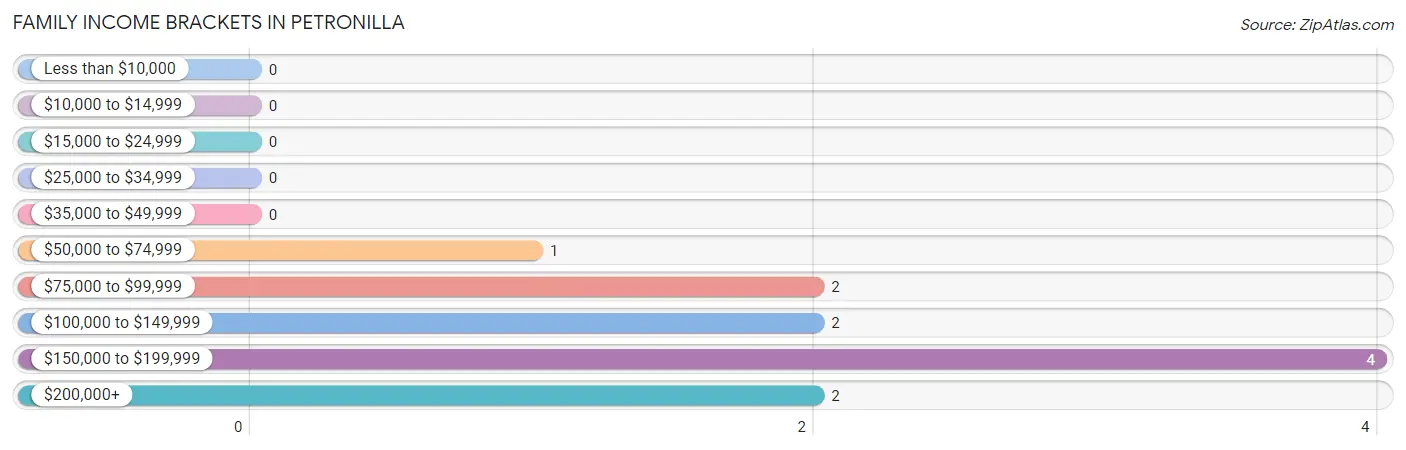
| Income Bracket | # Families | % Families |
| Less than $10,000 | 0 | 0.0% |
| $10,000 to $14,999 | 0 | 0.0% |
| $15,000 to $24,999 | 0 | 0.0% |
| $25,000 to $34,999 | 0 | 0.0% |
| $35,000 to $49,999 | 0 | 0.0% |
| $50,000 to $74,999 | 1 | 9.1% |
| $75,000 to $99,999 | 2 | 18.2% |
| $100,000 to $149,999 | 2 | 18.2% |
| $150,000 to $199,999 | 4 | 36.4% |
| $200,000+ | 2 | 18.2% |
Family Income by Famaliy Size in Petronilla
| Income Bracket | # Families | Median Income |
| 2-Person Families | 4 (36.4%) | $0 |
| 3-Person Families | 4 (36.4%) | $0 |
| 4-Person Families | 2 (18.2%) | $0 |
| 5-Person Families | 1 (9.1%) | $0 |
| 6-Person Families | 0 (0.0%) | $0 |
| 7+ Person Families | 0 (0.0%) | $0 |
| Total | 11 (100.0%) | $183,125 |
Family Income by Number of Earners in Petronilla
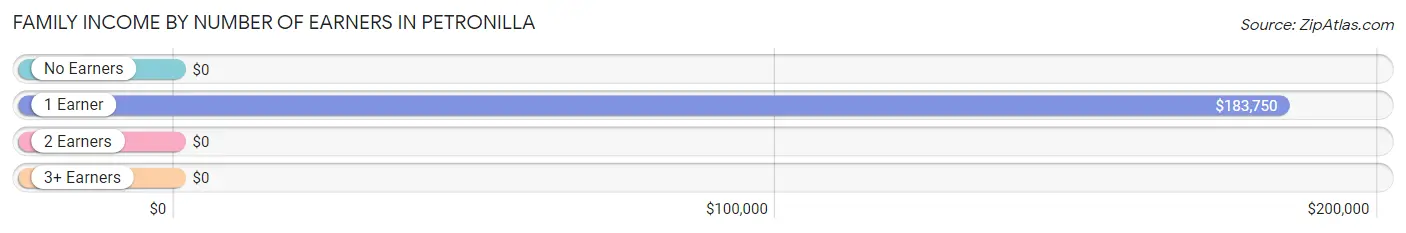
| Number of Earners | # Families | Median Income |
| No Earners | 0 (0.0%) | $0 |
| 1 Earner | 6 (54.5%) | $183,750 |
| 2 Earners | 1 (9.1%) | $0 |
| 3+ Earners | 4 (36.4%) | $0 |
| Total | 11 (100.0%) | $183,125 |
Household Income in Petronilla
Household Income Brackets in Petronilla
With 16 households falling in the category, the $35,000 to $49,999 income range is the most frequent in Petronilla, accounting for 59.3% of all households.
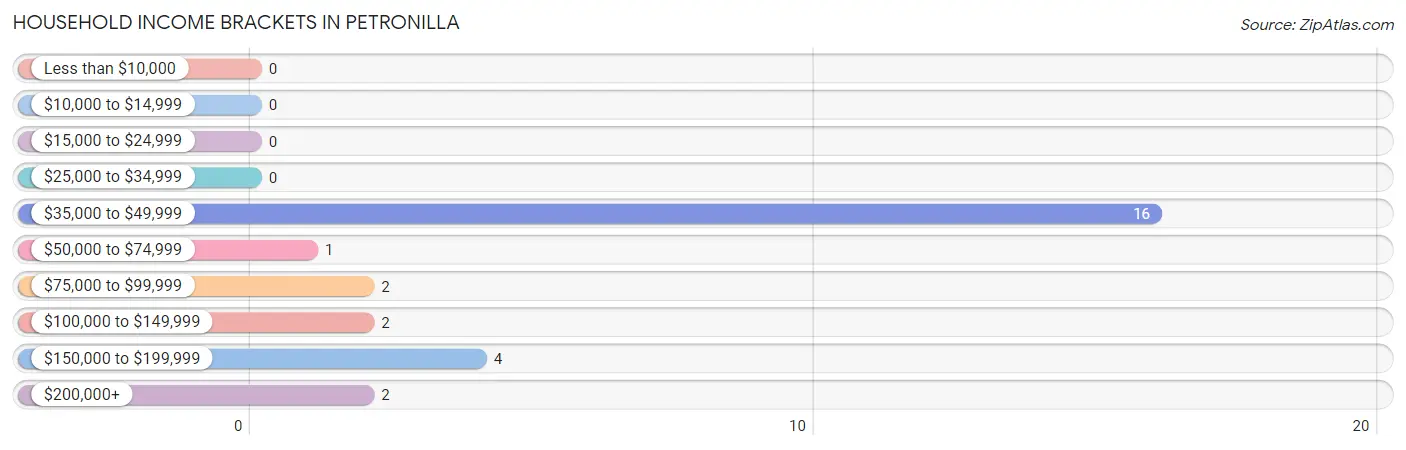
| Income Bracket | # Households | % Households |
| Less than $10,000 | 0 | 0.0% |
| $10,000 to $14,999 | 0 | 0.0% |
| $15,000 to $24,999 | 0 | 0.0% |
| $25,000 to $34,999 | 0 | 0.0% |
| $35,000 to $49,999 | 16 | 59.3% |
| $50,000 to $74,999 | 1 | 3.7% |
| $75,000 to $99,999 | 2 | 7.4% |
| $100,000 to $149,999 | 2 | 7.4% |
| $150,000 to $199,999 | 4 | 14.8% |
| $200,000+ | 2 | 7.4% |
Household Income by Householder Age in Petronilla
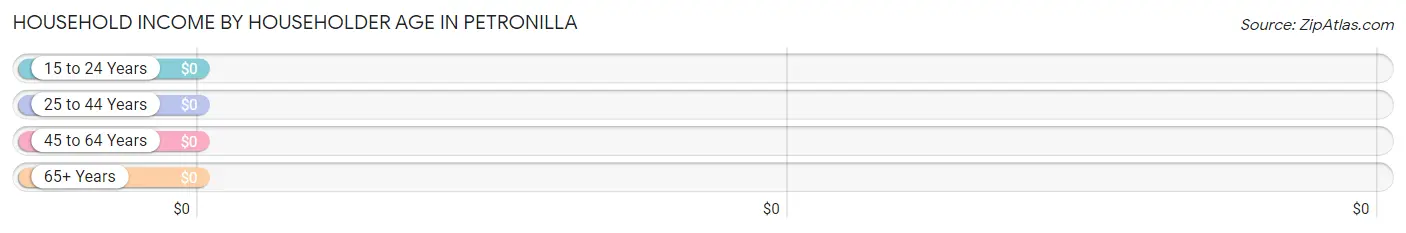
| Income Bracket | # Households | Median Income |
| 15 to 24 Years | 0 (0.0%) | $0 |
| 25 to 44 Years | 7 (25.9%) | $0 |
| 45 to 64 Years | 15 (55.6%) | $0 |
| 65+ Years | 5 (18.5%) | $0 |
| Total | 27 (100.0%) | $0 |
Poverty in Petronilla
Income Below Poverty by Sex and Age in Petronilla
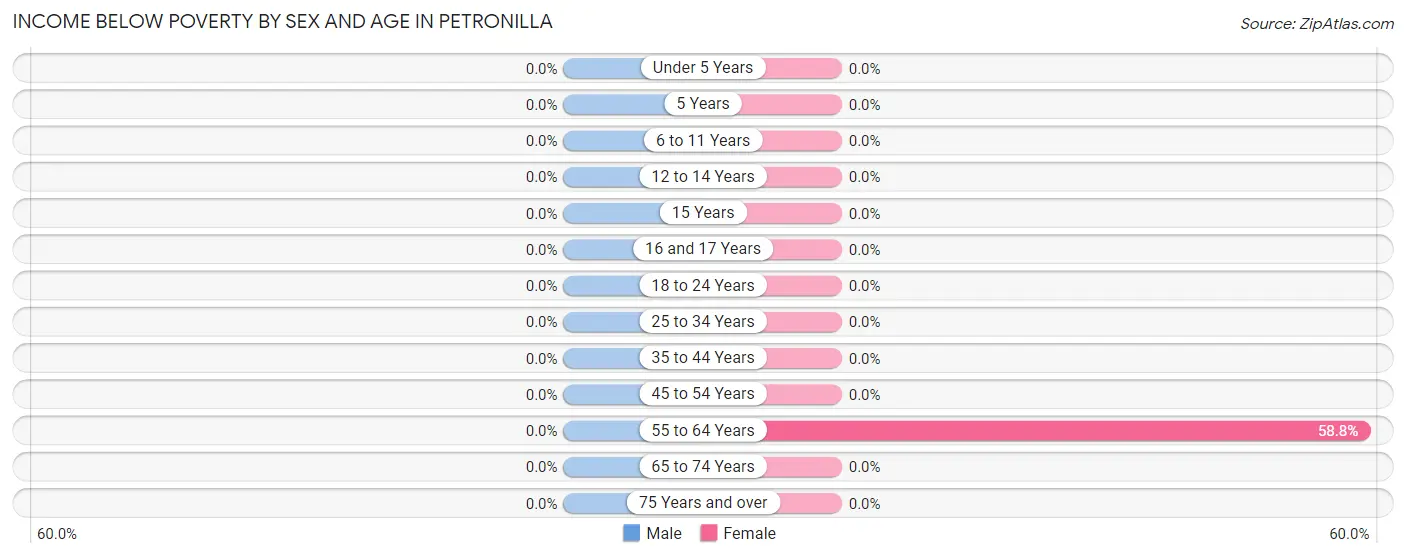
| Age Bracket | Male | Female |
| Under 5 Years | 0 (0.0%) | 0 (0.0%) |
| 5 Years | 0 (0.0%) | 0 (0.0%) |
| 6 to 11 Years | 0 (0.0%) | 0 (0.0%) |
| 12 to 14 Years | 0 (0.0%) | 0 (0.0%) |
| 15 Years | 0 (0.0%) | 0 (0.0%) |
| 16 and 17 Years | 0 (0.0%) | 0 (0.0%) |
| 18 to 24 Years | 0 (0.0%) | 0 (0.0%) |
| 25 to 34 Years | 0 (0.0%) | 0 (0.0%) |
| 35 to 44 Years | 0 (0.0%) | 0 (0.0%) |
| 45 to 54 Years | 0 (0.0%) | 0 (0.0%) |
| 55 to 64 Years | 0 (0.0%) | 10 (58.8%) |
| 65 to 74 Years | 0 (0.0%) | 0 (0.0%) |
| 75 Years and over | 0 (0.0%) | 0 (0.0%) |
| Total | 0 (0.0%) | 10 (35.7%) |
Income Above Poverty by Sex and Age in Petronilla
According to the poverty statistics in Petronilla, males aged under 5 years and females aged 12 to 14 years are the age groups that are most secure financially, with 100.0% of males and 100.0% of females in these age groups living above the poverty line.
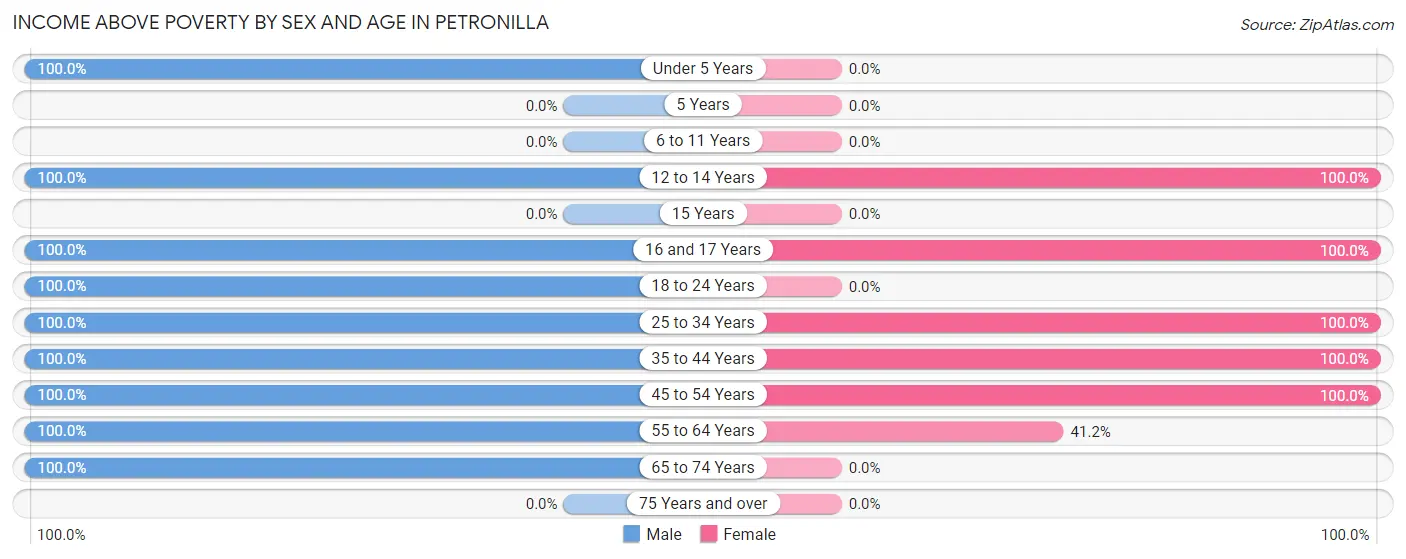
| Age Bracket | Male | Female |
| Under 5 Years | 1 (100.0%) | 0 (0.0%) |
| 5 Years | 0 (0.0%) | 0 (0.0%) |
| 6 to 11 Years | 0 (0.0%) | 0 (0.0%) |
| 12 to 14 Years | 2 (100.0%) | 2 (100.0%) |
| 15 Years | 0 (0.0%) | 0 (0.0%) |
| 16 and 17 Years | 4 (100.0%) | 2 (100.0%) |
| 18 to 24 Years | 3 (100.0%) | 0 (0.0%) |
| 25 to 34 Years | 4 (100.0%) | 3 (100.0%) |
| 35 to 44 Years | 9 (100.0%) | 1 (100.0%) |
| 45 to 54 Years | 2 (100.0%) | 3 (100.0%) |
| 55 to 64 Years | 11 (100.0%) | 7 (41.2%) |
| 65 to 74 Years | 5 (100.0%) | 0 (0.0%) |
| 75 Years and over | 0 (0.0%) | 0 (0.0%) |
| Total | 41 (100.0%) | 18 (64.3%) |
Income Below Poverty Among Married-Couple Families in Petronilla
| Children | Above Poverty | Below Poverty |
| No Children | 6 (100.0%) | 0 (0.0%) |
| 1 or 2 Children | 4 (100.0%) | 0 (0.0%) |
| 3 or 4 Children | 1 (100.0%) | 0 (0.0%) |
| 5 or more Children | 0 (0.0%) | 0 (0.0%) |
| Total | 11 (100.0%) | 0 (0.0%) |
Income Below Poverty Among Single-Parent Households in Petronilla
| Children | Single Father | Single Mother |
| No Children | 0 (0.0%) | 0 (0.0%) |
| 1 or 2 Children | 0 (0.0%) | 0 (0.0%) |
| 3 or 4 Children | 0 (0.0%) | 0 (0.0%) |
| 5 or more Children | 0 (0.0%) | 0 (0.0%) |
| Total | 0 (0.0%) | 0 (0.0%) |
Income Below Poverty Among Married-Couple vs Single-Parent Households in Petronilla
| Children | Married-Couple Families | Single-Parent Households |
| No Children | 0 (0.0%) | 0 (0.0%) |
| 1 or 2 Children | 0 (0.0%) | 0 (0.0%) |
| 3 or 4 Children | 0 (0.0%) | 0 (0.0%) |
| 5 or more Children | 0 (0.0%) | 0 (0.0%) |
| Total | 0 (0.0%) | 0 (0.0%) |
Employment Characteristics in Petronilla
Employment by Class of Employer in Petronilla
Among the 38 employed individuals in Petronilla, private company employees (19 | 50.0%), self-employed (not incorporated) (10 | 26.3%), and state government employees (4 | 10.5%) make up the most common classes of employment.
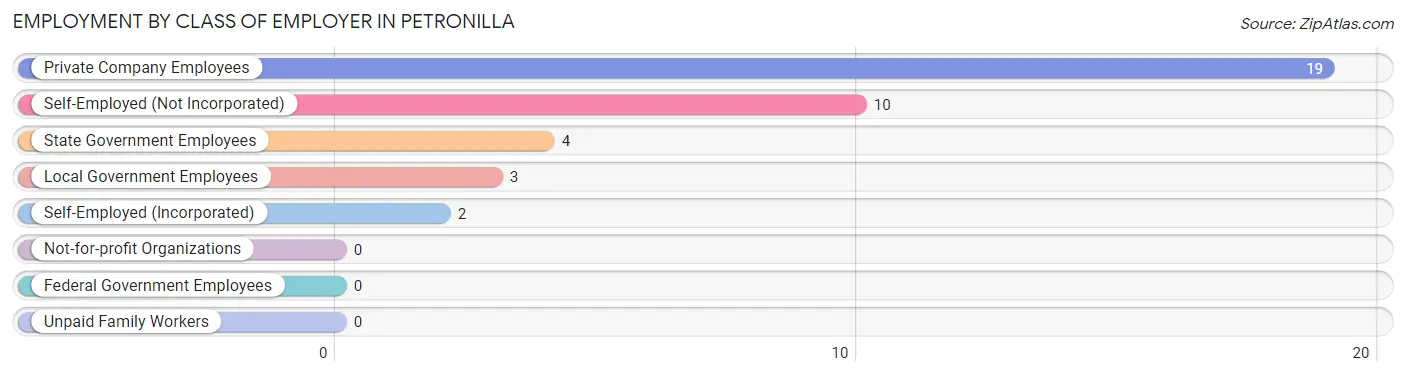
| Employer Class | # Employees | % Employees |
| Private Company Employees | 19 | 50.0% |
| Self-Employed (Incorporated) | 2 | 5.3% |
| Self-Employed (Not Incorporated) | 10 | 26.3% |
| Not-for-profit Organizations | 0 | 0.0% |
| Local Government Employees | 3 | 7.9% |
| State Government Employees | 4 | 10.5% |
| Federal Government Employees | 0 | 0.0% |
| Unpaid Family Workers | 0 | 0.0% |
| Total | 38 | 100.0% |
Employment Status by Age in Petronilla
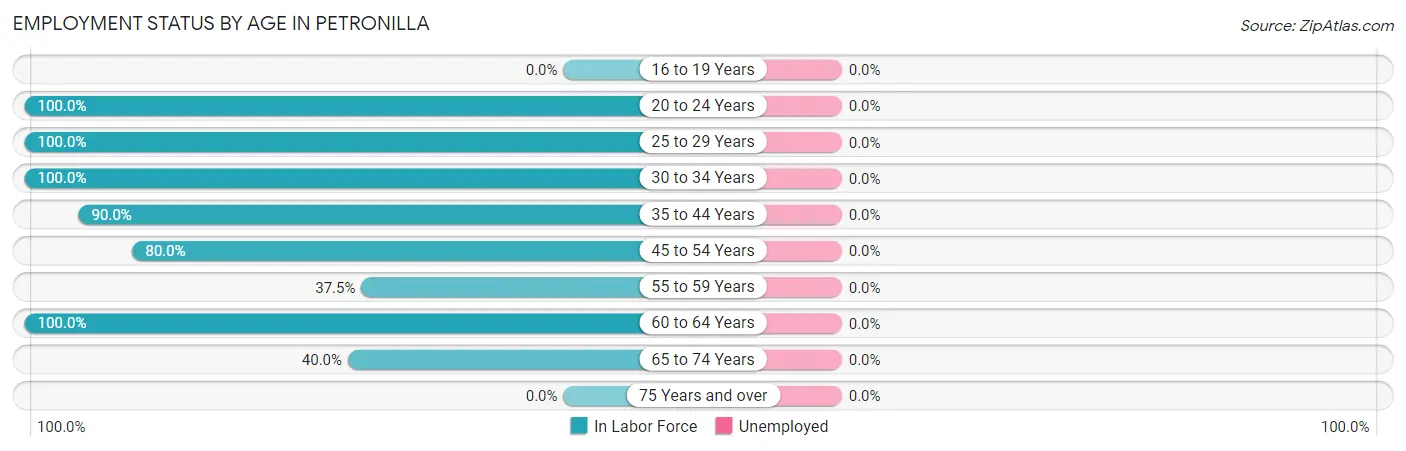
| Age Bracket | In Labor Force | Unemployed |
| 16 to 19 Years | 0 (0.0%) | 0 (0.0%) |
| 20 to 24 Years | 3 (100.0%) | 0 (0.0%) |
| 25 to 29 Years | 3 (100.0%) | 0 (0.0%) |
| 30 to 34 Years | 4 (100.0%) | 0 (0.0%) |
| 35 to 44 Years | 9 (90.0%) | 0 (0.0%) |
| 45 to 54 Years | 4 (80.0%) | 0 (0.0%) |
| 55 to 59 Years | 9 (37.5%) | 0 (0.0%) |
| 60 to 64 Years | 4 (100.0%) | 0 (0.0%) |
| 65 to 74 Years | 2 (40.0%) | 0 (0.0%) |
| 75 Years and over | 0 (0.0%) | 0 (0.0%) |
| Total | 38 (59.4%) | 0 (0.0%) |
Employment Status by Educational Attainment in Petronilla
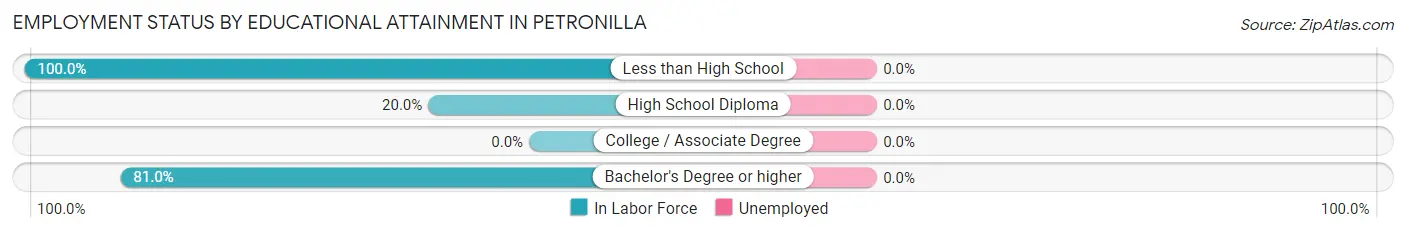
| Educational Attainment | In Labor Force | Unemployed |
| Less than High School | 13 (100.0%) | 0 (0.0%) |
| High School Diploma | 3 (20.0%) | 0 (0.0%) |
| College / Associate Degree | 0 (0.0%) | 0 (0.0%) |
| Bachelor's Degree or higher | 17 (81.0%) | 0 (0.0%) |
| Total | 33 (66.0%) | 0 (0.0%) |
Employment Occupations by Sex in Petronilla
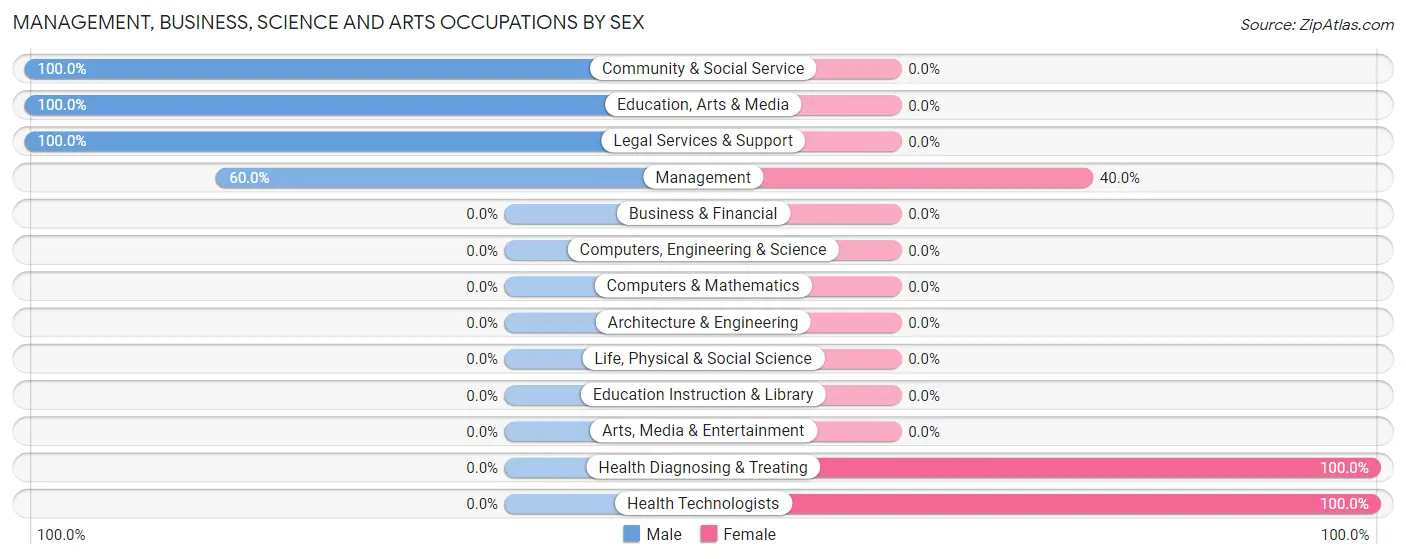
Management, Business, Science and Arts Occupations
The most common Management, Business, Science and Arts occupations in Petronilla are Management (10 | 26.3%), Community & Social Service (5 | 13.2%), Education, Arts & Media (3 | 7.9%), Health Diagnosing & Treating (3 | 7.9%), and Health Technologists (3 | 7.9%).
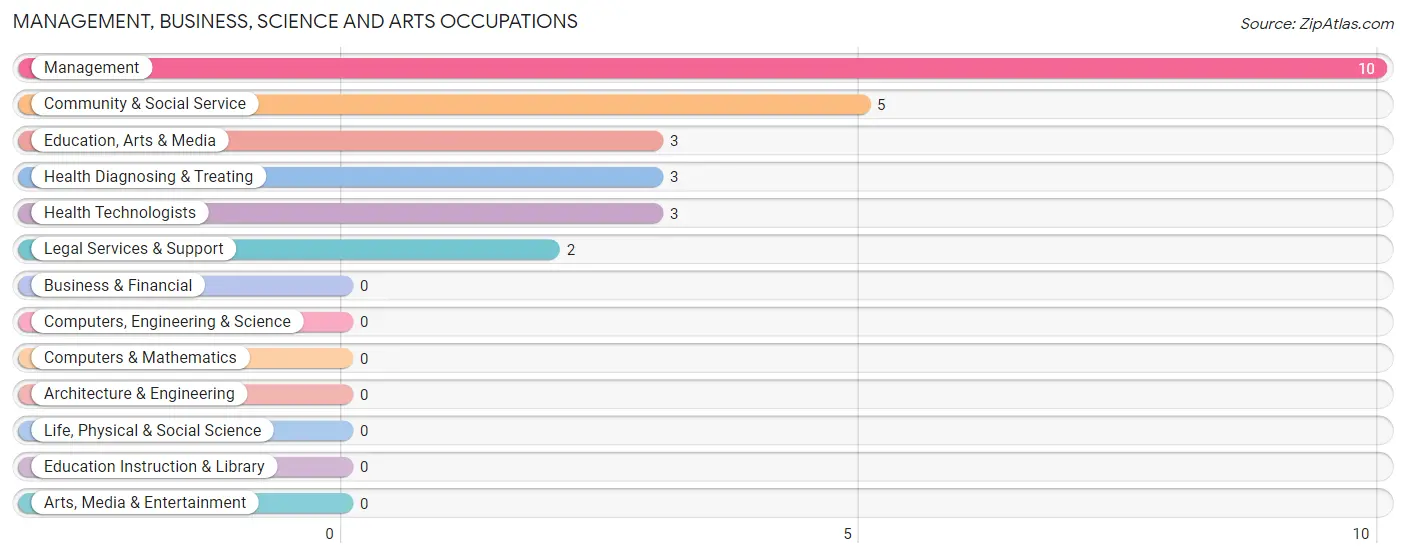
Management, Business, Science and Arts Occupations by Sex
Within the Management, Business, Science and Arts occupations in Petronilla, the most male-oriented occupations are Community & Social Service (100.0%), Education, Arts & Media (100.0%), and Legal Services & Support (100.0%), while the most female-oriented occupations are Health Diagnosing & Treating (100.0%), Health Technologists (100.0%), and Management (40.0%).
| Occupation | Male | Female |
| Management | 6 (60.0%) | 4 (40.0%) |
| Business & Financial | 0 (0.0%) | 0 (0.0%) |
| Computers, Engineering & Science | 0 (0.0%) | 0 (0.0%) |
| Computers & Mathematics | 0 (0.0%) | 0 (0.0%) |
| Architecture & Engineering | 0 (0.0%) | 0 (0.0%) |
| Life, Physical & Social Science | 0 (0.0%) | 0 (0.0%) |
| Community & Social Service | 5 (100.0%) | 0 (0.0%) |
| Education, Arts & Media | 3 (100.0%) | 0 (0.0%) |
| Legal Services & Support | 2 (100.0%) | 0 (0.0%) |
| Education Instruction & Library | 0 (0.0%) | 0 (0.0%) |
| Arts, Media & Entertainment | 0 (0.0%) | 0 (0.0%) |
| Health Diagnosing & Treating | 0 (0.0%) | 3 (100.0%) |
| Health Technologists | 0 (0.0%) | 3 (100.0%) |
| Total (Category) | 11 (61.1%) | 7 (38.9%) |
| Total (Overall) | 31 (81.6%) | 7 (18.4%) |
Services Occupations
Services Occupations by Sex
| Occupation | Male | Female |
| Healthcare Support | 0 (0.0%) | 0 (0.0%) |
| Security & Protection | 0 (0.0%) | 0 (0.0%) |
| Firefighting & Prevention | 0 (0.0%) | 0 (0.0%) |
| Law Enforcement | 0 (0.0%) | 0 (0.0%) |
| Food Preparation & Serving | 0 (0.0%) | 0 (0.0%) |
| Cleaning & Maintenance | 0 (0.0%) | 0 (0.0%) |
| Personal Care & Service | 0 (0.0%) | 0 (0.0%) |
| Total (Category) | 0 (0.0%) | 0 (0.0%) |
| Total (Overall) | 31 (81.6%) | 7 (18.4%) |
Sales and Office Occupations

Sales and Office Occupations by Sex
| Occupation | Male | Female |
| Sales & Related | 0 (0.0%) | 0 (0.0%) |
| Office & Administration | 0 (0.0%) | 0 (0.0%) |
| Total (Category) | 0 (0.0%) | 0 (0.0%) |
| Total (Overall) | 31 (81.6%) | 7 (18.4%) |
Natural Resources, Construction and Maintenance Occupations
The most common Natural Resources, Construction and Maintenance occupations in Petronilla are Farming, Fishing & Forestry (9 | 23.7%), Construction & Extraction (7 | 18.4%), and Installation, Maintenance & Repair (4 | 10.5%).
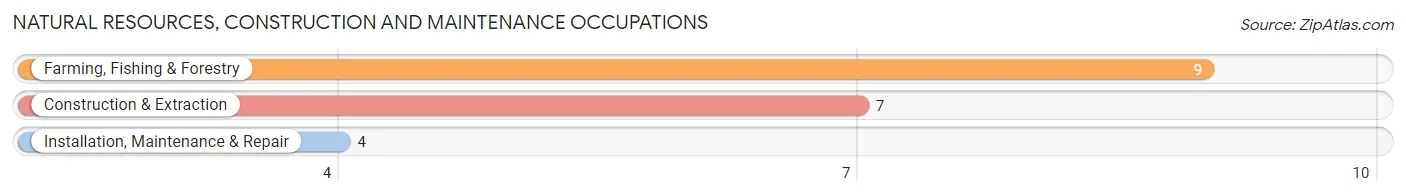
Natural Resources, Construction and Maintenance Occupations by Sex
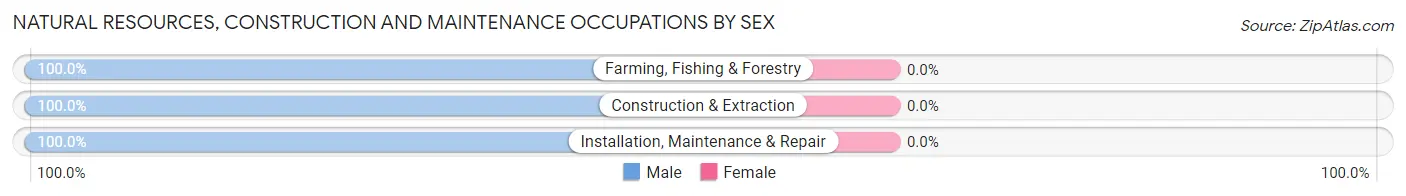
| Occupation | Male | Female |
| Farming, Fishing & Forestry | 9 (100.0%) | 0 (0.0%) |
| Construction & Extraction | 7 (100.0%) | 0 (0.0%) |
| Installation, Maintenance & Repair | 4 (100.0%) | 0 (0.0%) |
| Total (Category) | 20 (100.0%) | 0 (0.0%) |
| Total (Overall) | 31 (81.6%) | 7 (18.4%) |
Production, Transportation and Moving Occupations
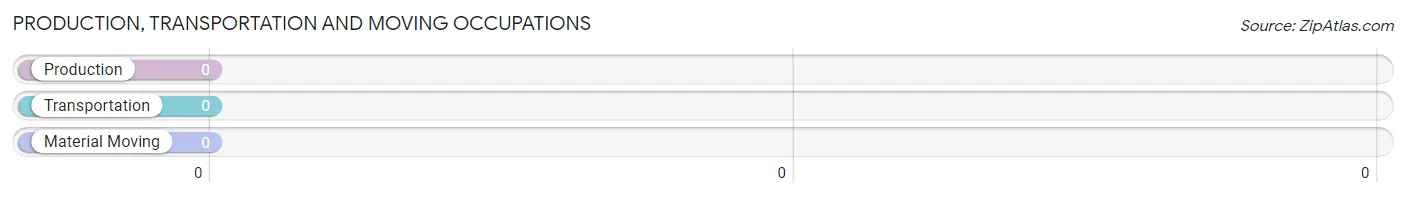
Production, Transportation and Moving Occupations by Sex
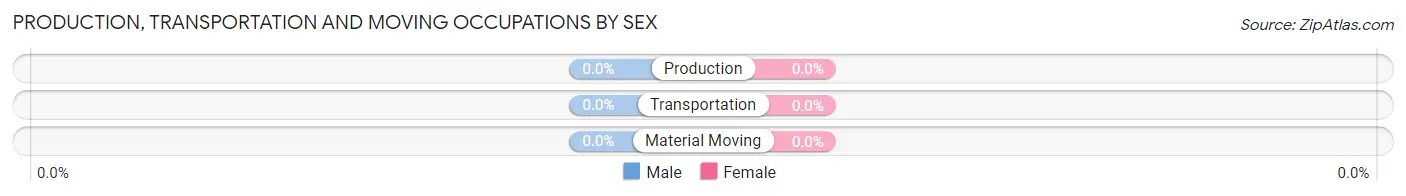
| Occupation | Male | Female |
| Production | 0 (0.0%) | 0 (0.0%) |
| Transportation | 0 (0.0%) | 0 (0.0%) |
| Material Moving | 0 (0.0%) | 0 (0.0%) |
| Total (Category) | 0 (0.0%) | 0 (0.0%) |
| Total (Overall) | 31 (81.6%) | 7 (18.4%) |
Employment Industries by Sex in Petronilla
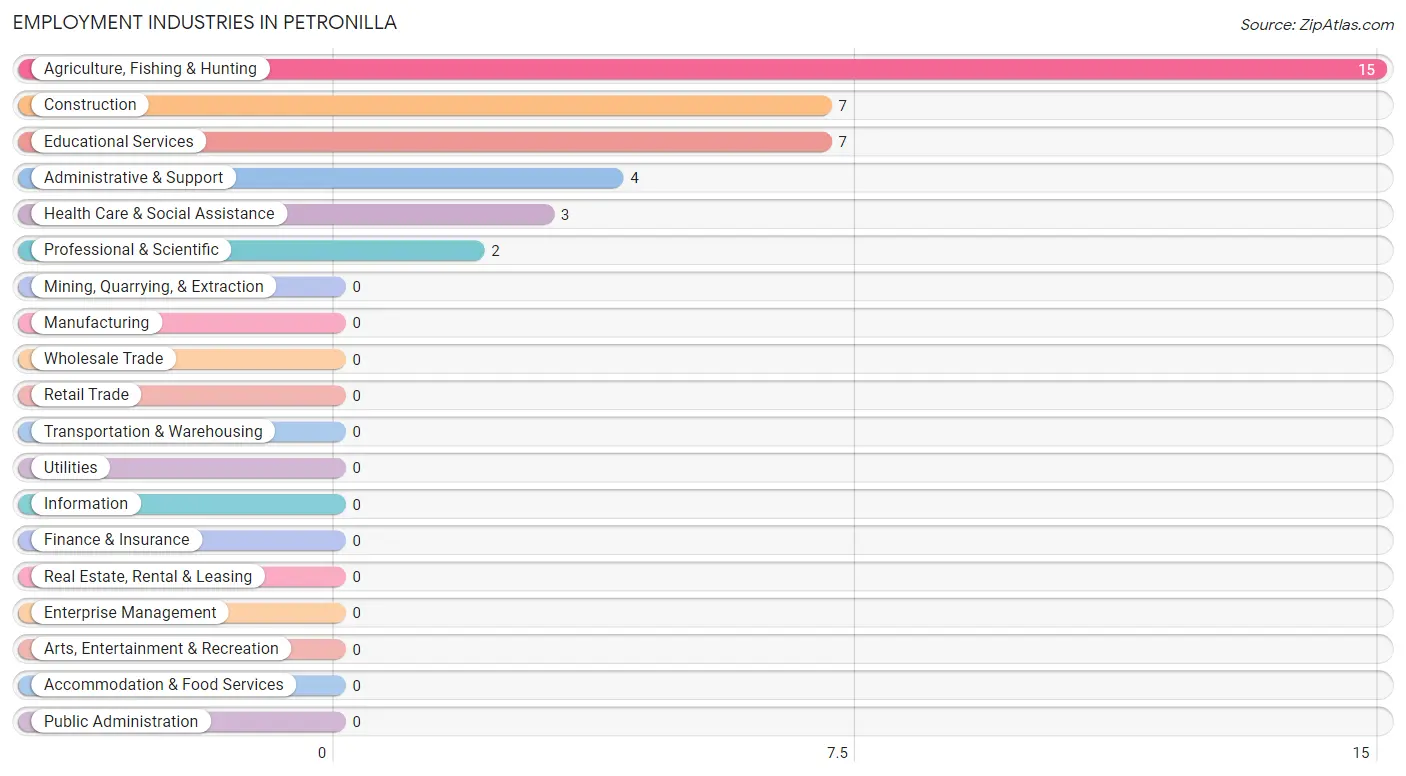
Employment Industries in Petronilla
The major employment industries in Petronilla include Agriculture, Fishing & Hunting (15 | 39.5%), Construction (7 | 18.4%), Educational Services (7 | 18.4%), Administrative & Support (4 | 10.5%), and Health Care & Social Assistance (3 | 7.9%).
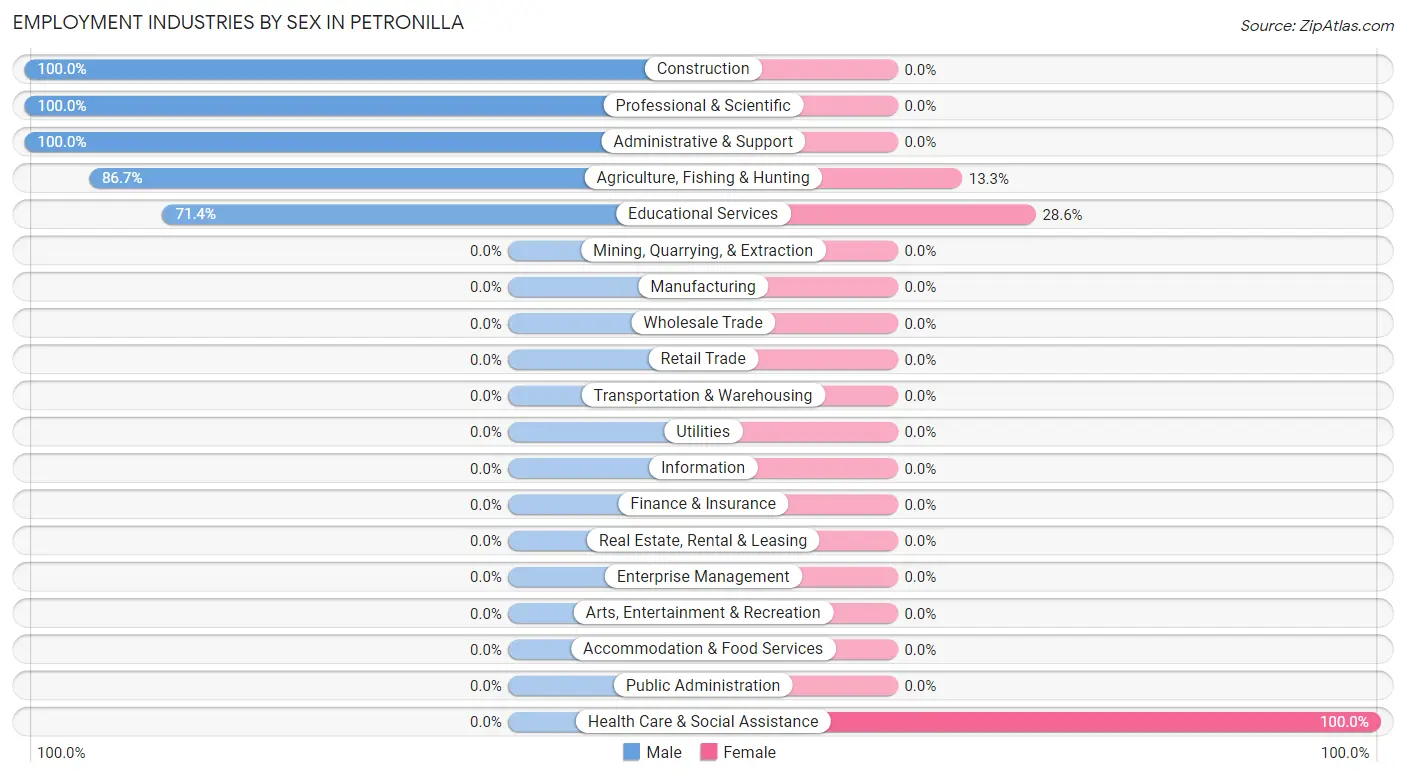
Employment Industries by Sex in Petronilla
The Petronilla industries that see more men than women are Construction (100.0%), Professional & Scientific (100.0%), and Administrative & Support (100.0%), whereas the industries that tend to have a higher number of women are Health Care & Social Assistance (100.0%), Educational Services (28.6%), and Agriculture, Fishing & Hunting (13.3%).
| Industry | Male | Female |
| Agriculture, Fishing & Hunting | 13 (86.7%) | 2 (13.3%) |
| Mining, Quarrying, & Extraction | 0 (0.0%) | 0 (0.0%) |
| Construction | 7 (100.0%) | 0 (0.0%) |
| Manufacturing | 0 (0.0%) | 0 (0.0%) |
| Wholesale Trade | 0 (0.0%) | 0 (0.0%) |
| Retail Trade | 0 (0.0%) | 0 (0.0%) |
| Transportation & Warehousing | 0 (0.0%) | 0 (0.0%) |
| Utilities | 0 (0.0%) | 0 (0.0%) |
| Information | 0 (0.0%) | 0 (0.0%) |
| Finance & Insurance | 0 (0.0%) | 0 (0.0%) |
| Real Estate, Rental & Leasing | 0 (0.0%) | 0 (0.0%) |
| Professional & Scientific | 2 (100.0%) | 0 (0.0%) |
| Enterprise Management | 0 (0.0%) | 0 (0.0%) |
| Administrative & Support | 4 (100.0%) | 0 (0.0%) |
| Educational Services | 5 (71.4%) | 2 (28.6%) |
| Health Care & Social Assistance | 0 (0.0%) | 3 (100.0%) |
| Arts, Entertainment & Recreation | 0 (0.0%) | 0 (0.0%) |
| Accommodation & Food Services | 0 (0.0%) | 0 (0.0%) |
| Public Administration | 0 (0.0%) | 0 (0.0%) |
| Total | 31 (81.6%) | 7 (18.4%) |
Education in Petronilla
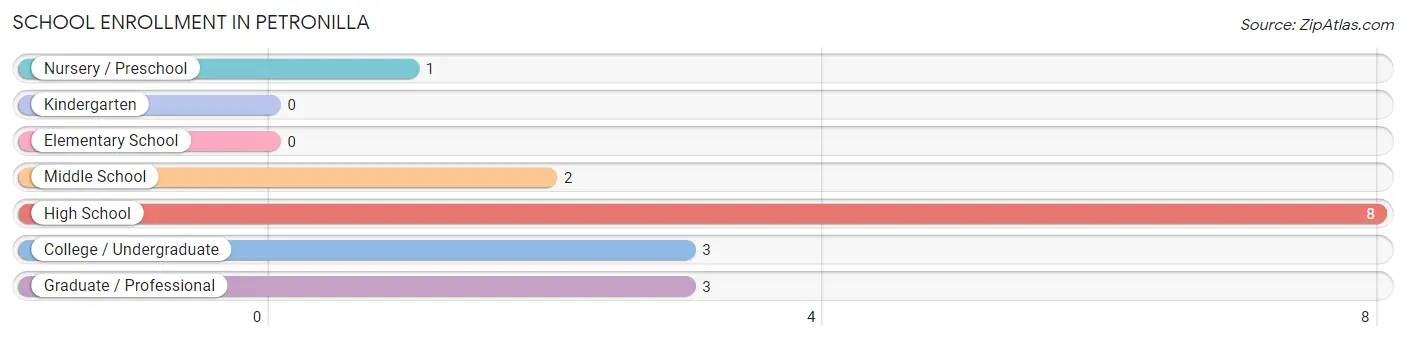
School Enrollment in Petronilla
The most common levels of schooling among the 17 students in Petronilla are high school (8 | 47.1%), college / undergraduate (3 | 17.6%), and graduate / professional (3 | 17.6%).
| School Level | # Students | % Students |
| Nursery / Preschool | 1 | 5.9% |
| Kindergarten | 0 | 0.0% |
| Elementary School | 0 | 0.0% |
| Middle School | 2 | 11.8% |
| High School | 8 | 47.1% |
| College / Undergraduate | 3 | 17.6% |
| Graduate / Professional | 3 | 17.6% |
| Total | 17 | 100.0% |
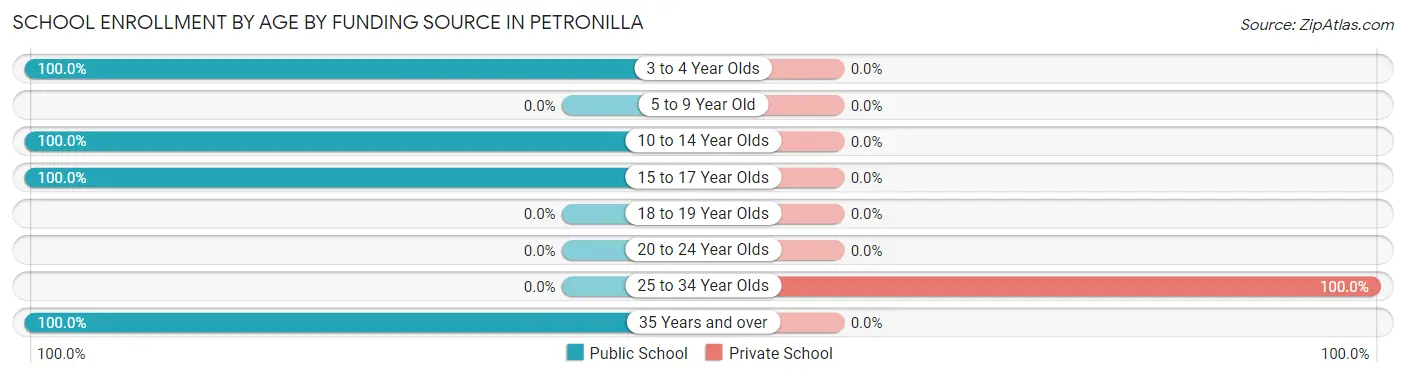
School Enrollment by Age by Funding Source in Petronilla
Out of a total of 17 students who are enrolled in schools in Petronilla, 3 (17.6%) attend a private institution, while the remaining 14 (82.4%) are enrolled in public schools. The age group of 25 to 34 year olds has the highest likelihood of being enrolled in private schools, with 3 (100.0% in the age bracket) enrolled. Conversely, the age group of 3 to 4 year olds has the lowest likelihood of being enrolled in a private school, with 1 (100.0% in the age bracket) attending a public institution.
| Age Bracket | Public School | Private School |
| 3 to 4 Year Olds | 1 (100.0%) | 0 (0.0%) |
| 5 to 9 Year Old | 0 (0.0%) | 0 (0.0%) |
| 10 to 14 Year Olds | 4 (100.0%) | 0 (0.0%) |
| 15 to 17 Year Olds | 6 (100.0%) | 0 (0.0%) |
| 18 to 19 Year Olds | 0 (0.0%) | 0 (0.0%) |
| 20 to 24 Year Olds | 0 (0.0%) | 0 (0.0%) |
| 25 to 34 Year Olds | 0 (0.0%) | 3 (100.0%) |
| 35 Years and over | 3 (100.0%) | 0 (0.0%) |
| Total | 14 (82.4%) | 3 (17.6%) |
Educational Attainment by Field of Study in Petronilla
Education (10 | 38.5%), bio, nature & agricultural (5 | 19.2%), business (4 | 15.4%), science & technology (3 | 11.5%), and social sciences (2 | 7.7%) are the most common fields of study among 26 individuals in Petronilla who have obtained a bachelor's degree or higher.
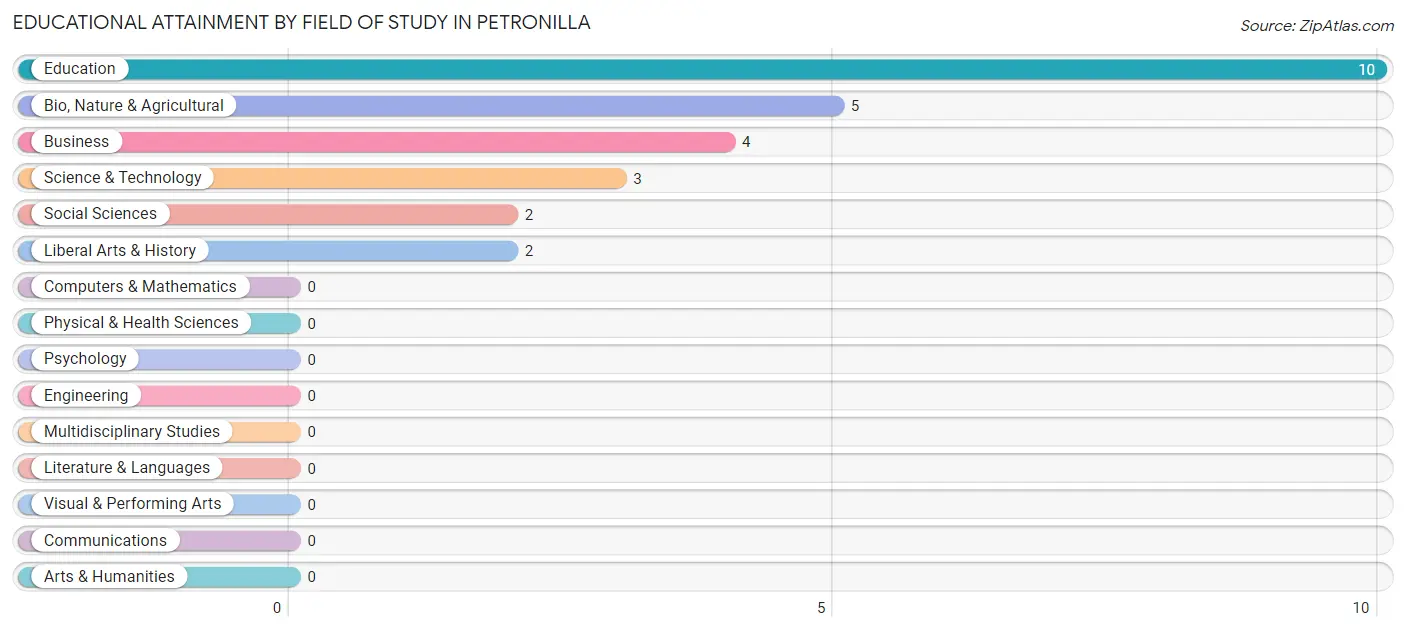
| Field of Study | # Graduates | % Graduates |
| Computers & Mathematics | 0 | 0.0% |
| Bio, Nature & Agricultural | 5 | 19.2% |
| Physical & Health Sciences | 0 | 0.0% |
| Psychology | 0 | 0.0% |
| Social Sciences | 2 | 7.7% |
| Engineering | 0 | 0.0% |
| Multidisciplinary Studies | 0 | 0.0% |
| Science & Technology | 3 | 11.5% |
| Business | 4 | 15.4% |
| Education | 10 | 38.5% |
| Literature & Languages | 0 | 0.0% |
| Liberal Arts & History | 2 | 7.7% |
| Visual & Performing Arts | 0 | 0.0% |
| Communications | 0 | 0.0% |
| Arts & Humanities | 0 | 0.0% |
| Total | 26 | 100.0% |
Transportation & Commute in Petronilla
Vehicle Availability by Sex in Petronilla
The most prevalent vehicle ownership categories in Petronilla are males with 2 vehicles (12, accounting for 38.7%) and females with 2 vehicles (0, making up 171.4%).
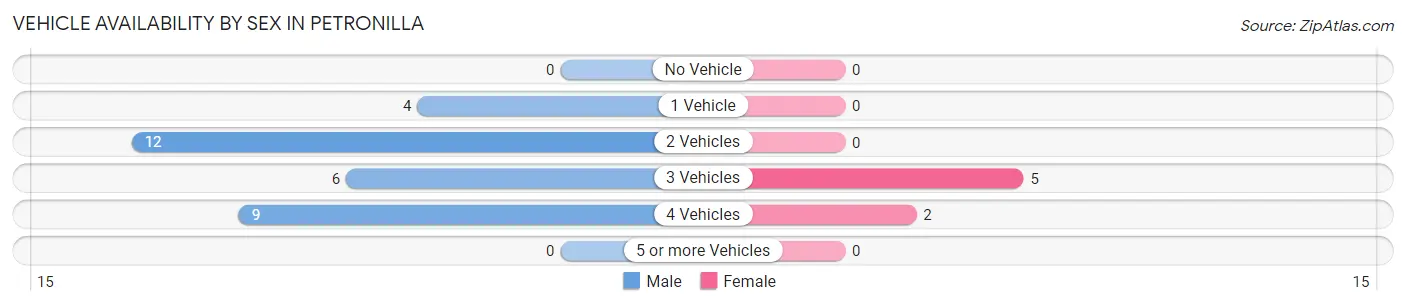
| Vehicles Available | Male | Female |
| No Vehicle | 0 (0.0%) | 0 (0.0%) |
| 1 Vehicle | 4 (12.9%) | 0 (0.0%) |
| 2 Vehicles | 12 (38.7%) | 0 (0.0%) |
| 3 Vehicles | 6 (19.4%) | 5 (71.4%) |
| 4 Vehicles | 9 (29.0%) | 2 (28.6%) |
| 5 or more Vehicles | 0 (0.0%) | 0 (0.0%) |
| Total | 31 (100.0%) | 7 (100.0%) |
Commute Time in Petronilla
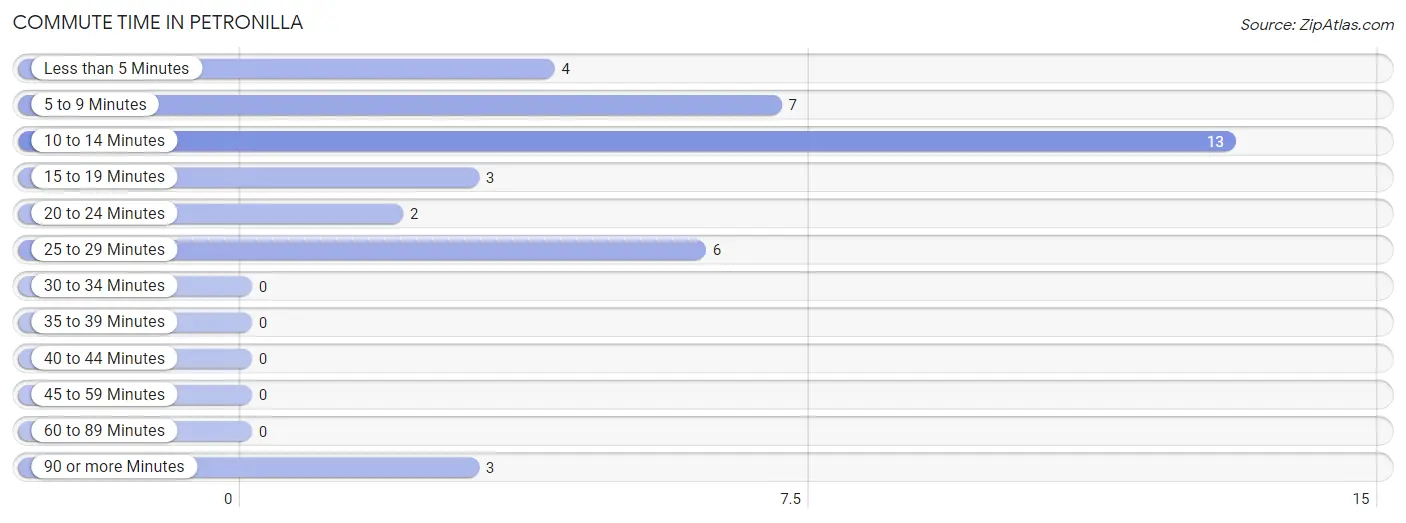
The most frequently occuring commute durations in Petronilla are 10 to 14 minutes (13 commuters, 34.2%), 5 to 9 minutes (7 commuters, 18.4%), and 25 to 29 minutes (6 commuters, 15.8%).
| Commute Time | # Commuters | % Commuters |
| Less than 5 Minutes | 4 | 10.5% |
| 5 to 9 Minutes | 7 | 18.4% |
| 10 to 14 Minutes | 13 | 34.2% |
| 15 to 19 Minutes | 3 | 7.9% |
| 20 to 24 Minutes | 2 | 5.3% |
| 25 to 29 Minutes | 6 | 15.8% |
| 30 to 34 Minutes | 0 | 0.0% |
| 35 to 39 Minutes | 0 | 0.0% |
| 40 to 44 Minutes | 0 | 0.0% |
| 45 to 59 Minutes | 0 | 0.0% |
| 60 to 89 Minutes | 0 | 0.0% |
| 90 or more Minutes | 3 | 7.9% |
Commute Time by Sex in Petronilla
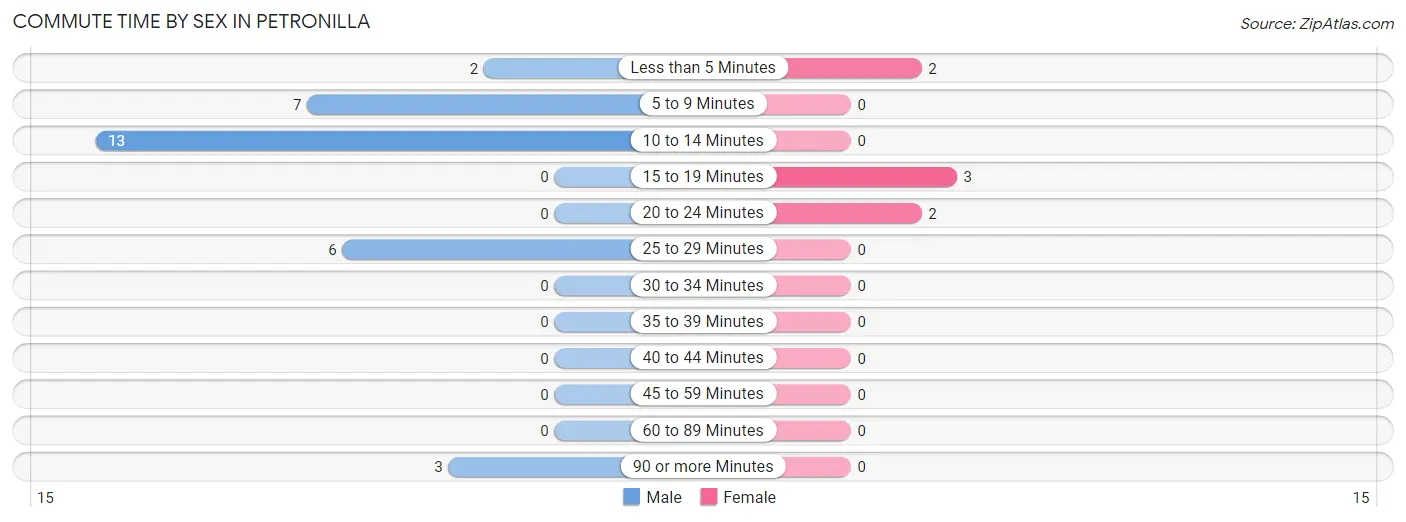
The most common commute times in Petronilla are 10 to 14 minutes (13 commuters, 41.9%) for males and 15 to 19 minutes (3 commuters, 42.9%) for females.
| Commute Time | Male | Female |
| Less than 5 Minutes | 2 (6.5%) | 2 (28.6%) |
| 5 to 9 Minutes | 7 (22.6%) | 0 (0.0%) |
| 10 to 14 Minutes | 13 (41.9%) | 0 (0.0%) |
| 15 to 19 Minutes | 0 (0.0%) | 3 (42.9%) |
| 20 to 24 Minutes | 0 (0.0%) | 2 (28.6%) |
| 25 to 29 Minutes | 6 (19.4%) | 0 (0.0%) |
| 30 to 34 Minutes | 0 (0.0%) | 0 (0.0%) |
| 35 to 39 Minutes | 0 (0.0%) | 0 (0.0%) |
| 40 to 44 Minutes | 0 (0.0%) | 0 (0.0%) |
| 45 to 59 Minutes | 0 (0.0%) | 0 (0.0%) |
| 60 to 89 Minutes | 0 (0.0%) | 0 (0.0%) |
| 90 or more Minutes | 3 (9.7%) | 0 (0.0%) |
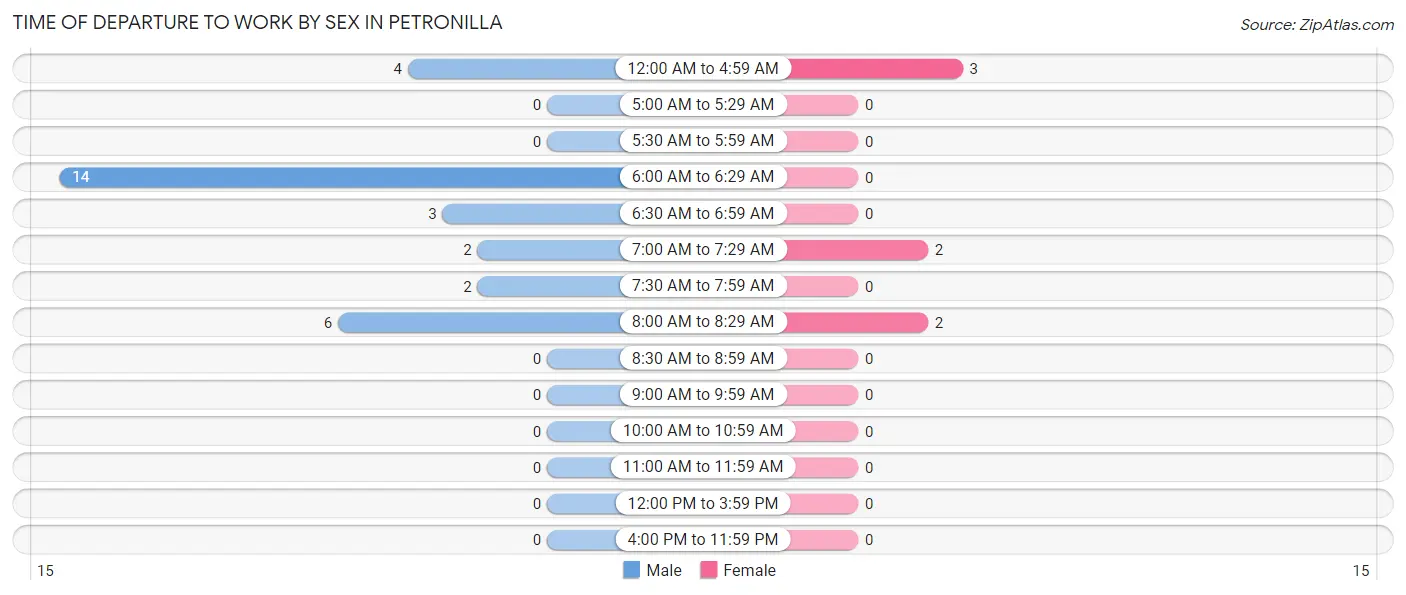
Time of Departure to Work by Sex in Petronilla
The most frequent times of departure to work in Petronilla are 6:00 AM to 6:29 AM (14, 45.2%) for males and 12:00 AM to 4:59 AM (3, 42.9%) for females.
| Time of Departure | Male | Female |
| 12:00 AM to 4:59 AM | 4 (12.9%) | 3 (42.9%) |
| 5:00 AM to 5:29 AM | 0 (0.0%) | 0 (0.0%) |
| 5:30 AM to 5:59 AM | 0 (0.0%) | 0 (0.0%) |
| 6:00 AM to 6:29 AM | 14 (45.2%) | 0 (0.0%) |
| 6:30 AM to 6:59 AM | 3 (9.7%) | 0 (0.0%) |
| 7:00 AM to 7:29 AM | 2 (6.5%) | 2 (28.6%) |
| 7:30 AM to 7:59 AM | 2 (6.5%) | 0 (0.0%) |
| 8:00 AM to 8:29 AM | 6 (19.4%) | 2 (28.6%) |
| 8:30 AM to 8:59 AM | 0 (0.0%) | 0 (0.0%) |
| 9:00 AM to 9:59 AM | 0 (0.0%) | 0 (0.0%) |
| 10:00 AM to 10:59 AM | 0 (0.0%) | 0 (0.0%) |
| 11:00 AM to 11:59 AM | 0 (0.0%) | 0 (0.0%) |
| 12:00 PM to 3:59 PM | 0 (0.0%) | 0 (0.0%) |
| 4:00 PM to 11:59 PM | 0 (0.0%) | 0 (0.0%) |
| Total | 31 (100.0%) | 7 (100.0%) |
Housing Occupancy in Petronilla
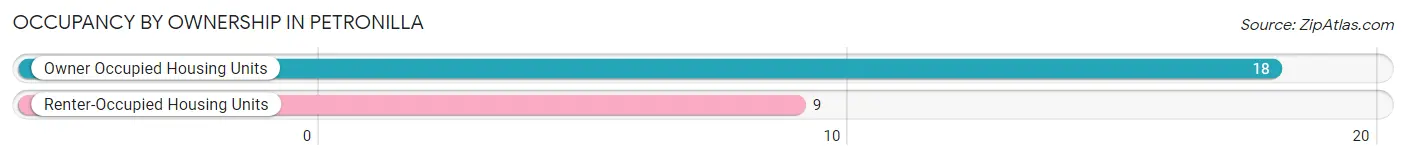
Occupancy by Ownership in Petronilla
Of the total 27 dwellings in Petronilla, owner-occupied units account for 18 (66.7%), while renter-occupied units make up 9 (33.3%).
| Occupancy | # Housing Units | % Housing Units |
| Owner Occupied Housing Units | 18 | 66.7% |
| Renter-Occupied Housing Units | 9 | 33.3% |
| Total Occupied Housing Units | 27 | 100.0% |
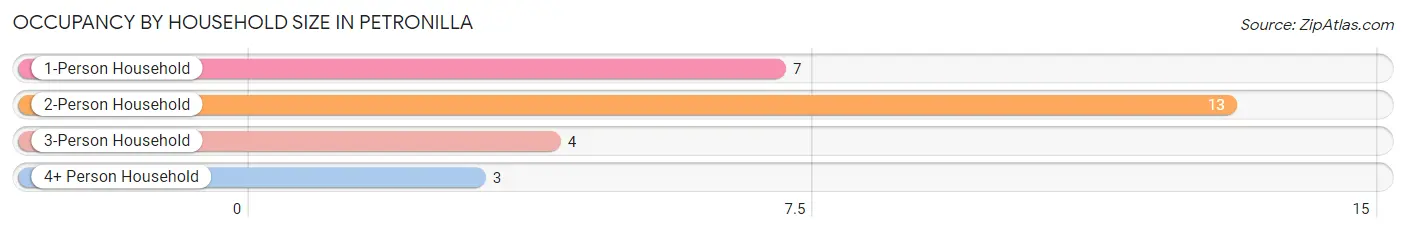
Occupancy by Household Size in Petronilla
| Household Size | # Housing Units | % Housing Units |
| 1-Person Household | 7 | 25.9% |
| 2-Person Household | 13 | 48.1% |
| 3-Person Household | 4 | 14.8% |
| 4+ Person Household | 3 | 11.1% |
| Total Housing Units | 27 | 100.0% |
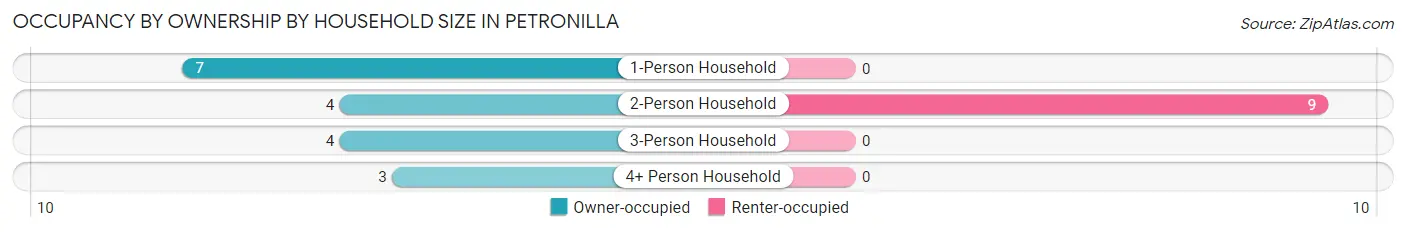
Occupancy by Ownership by Household Size in Petronilla
| Household Size | Owner-occupied | Renter-occupied |
| 1-Person Household | 7 (100.0%) | 0 (0.0%) |
| 2-Person Household | 4 (30.8%) | 9 (69.2%) |
| 3-Person Household | 4 (100.0%) | 0 (0.0%) |
| 4+ Person Household | 3 (100.0%) | 0 (0.0%) |
| Total Housing Units | 18 (66.7%) | 9 (33.3%) |
Occupancy by Educational Attainment in Petronilla
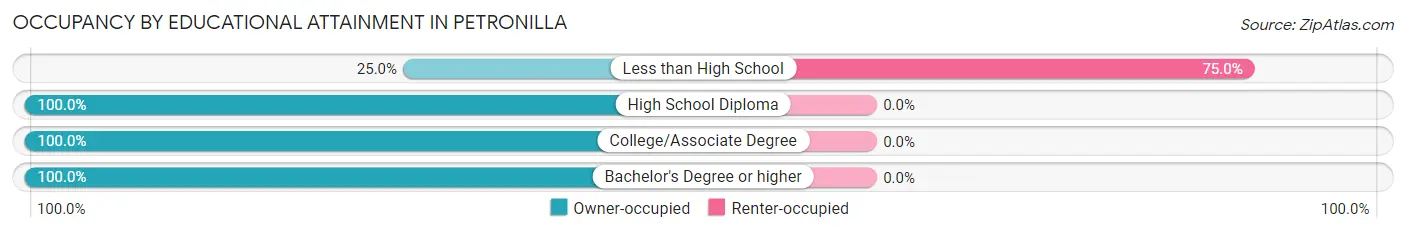
| Household Size | Owner-occupied | Renter-occupied |
| Less than High School | 3 (25.0%) | 9 (75.0%) |
| High School Diploma | 2 (100.0%) | 0 (0.0%) |
| College/Associate Degree | 3 (100.0%) | 0 (0.0%) |
| Bachelor's Degree or higher | 10 (100.0%) | 0 (0.0%) |
Occupancy by Age of Householder in Petronilla
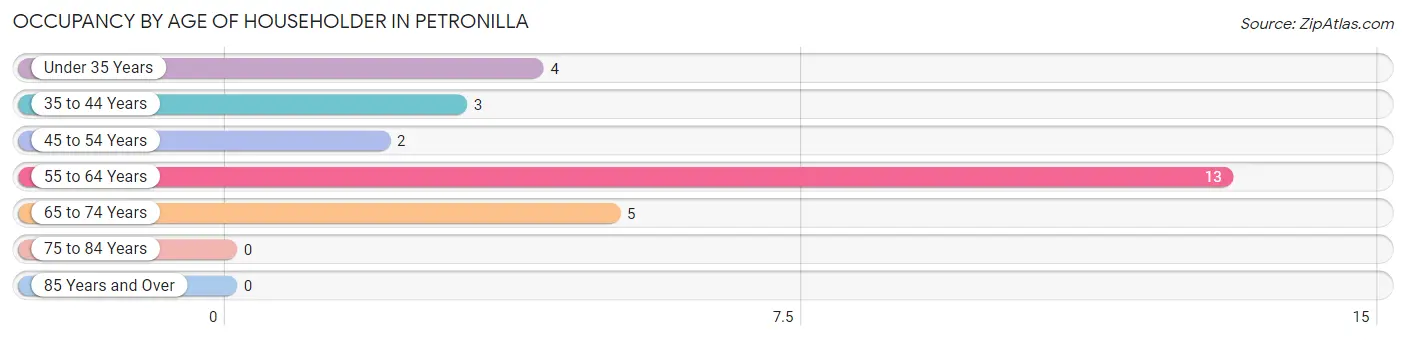
| Age Bracket | # Households | % Households |
| Under 35 Years | 4 | 14.8% |
| 35 to 44 Years | 3 | 11.1% |
| 45 to 54 Years | 2 | 7.4% |
| 55 to 64 Years | 13 | 48.1% |
| 65 to 74 Years | 5 | 18.5% |
| 75 to 84 Years | 0 | 0.0% |
| 85 Years and Over | 0 | 0.0% |
| Total | 27 | 100.0% |
Housing Finances in Petronilla
Median Income by Occupancy in Petronilla
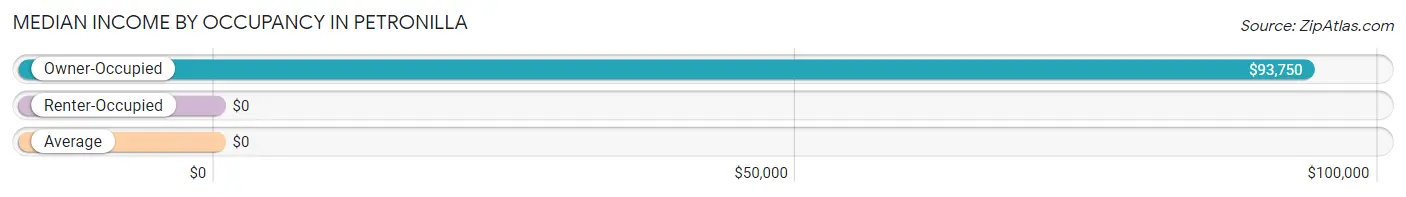
| Occupancy Type | # Households | Median Income |
| Owner-Occupied | 18 (66.7%) | $93,750 |
| Renter-Occupied | 9 (33.3%) | $0 |
| Average | 27 (100.0%) | $0 |
Occupancy by Householder Income Bracket in Petronilla
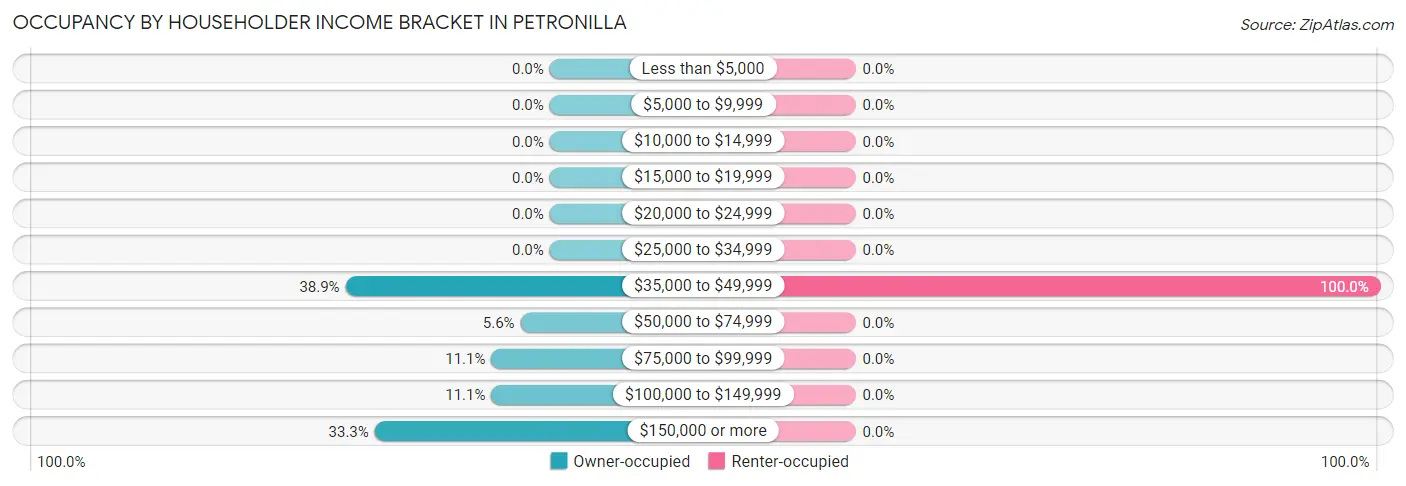
| Income Bracket | Owner-occupied | Renter-occupied |
| Less than $5,000 | 0 (0.0%) | 0 (0.0%) |
| $5,000 to $9,999 | 0 (0.0%) | 0 (0.0%) |
| $10,000 to $14,999 | 0 (0.0%) | 0 (0.0%) |
| $15,000 to $19,999 | 0 (0.0%) | 0 (0.0%) |
| $20,000 to $24,999 | 0 (0.0%) | 0 (0.0%) |
| $25,000 to $34,999 | 0 (0.0%) | 0 (0.0%) |
| $35,000 to $49,999 | 7 (38.9%) | 9 (100.0%) |
| $50,000 to $74,999 | 1 (5.6%) | 0 (0.0%) |
| $75,000 to $99,999 | 2 (11.1%) | 0 (0.0%) |
| $100,000 to $149,999 | 2 (11.1%) | 0 (0.0%) |
| $150,000 or more | 6 (33.3%) | 0 (0.0%) |
| Total | 18 (100.0%) | 9 (100.0%) |
Monthly Housing Cost Tiers in Petronilla
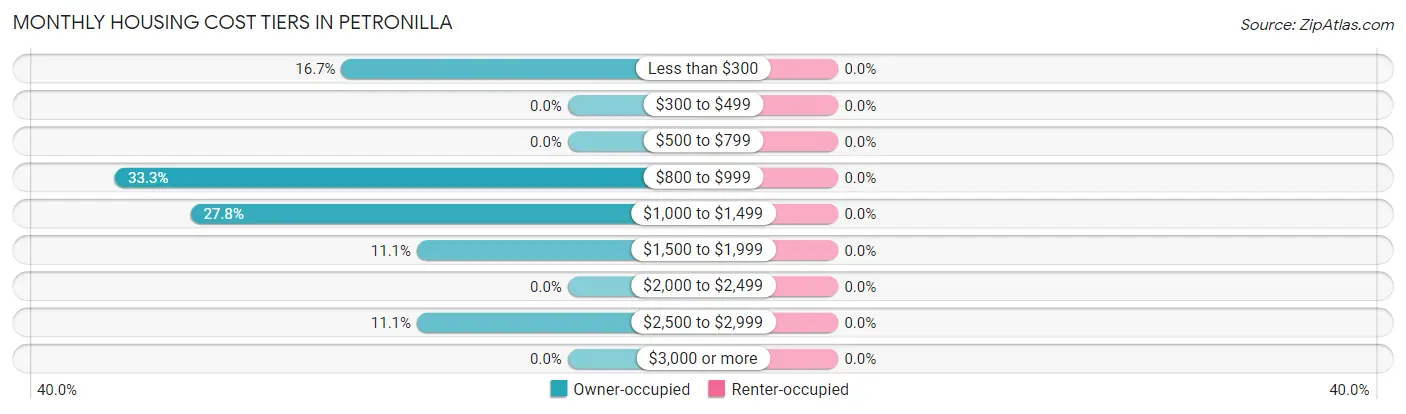
| Monthly Cost | Owner-occupied | Renter-occupied |
| Less than $300 | 3 (16.7%) | 0 (0.0%) |
| $300 to $499 | 0 (0.0%) | 0 (0.0%) |
| $500 to $799 | 0 (0.0%) | 0 (0.0%) |
| $800 to $999 | 6 (33.3%) | 0 (0.0%) |
| $1,000 to $1,499 | 5 (27.8%) | 0 (0.0%) |
| $1,500 to $1,999 | 2 (11.1%) | 0 (0.0%) |
| $2,000 to $2,499 | 0 (0.0%) | 0 (0.0%) |
| $2,500 to $2,999 | 2 (11.1%) | 0 (0.0%) |
| $3,000 or more | 0 (0.0%) | 0 (0.0%) |
| Total | 18 (100.0%) | 9 (100.0%) |
Physical Housing Characteristics in Petronilla
Housing Structures in Petronilla
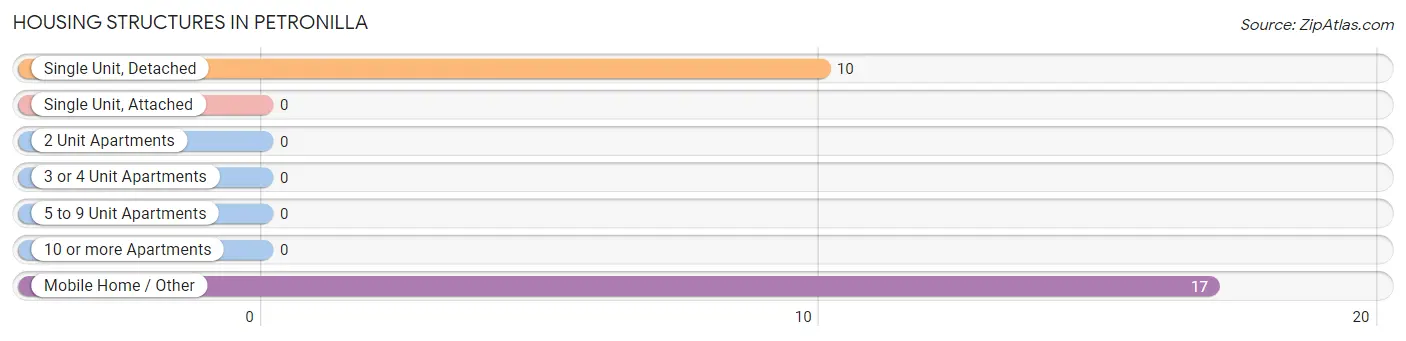
| Structure Type | # Housing Units | % Housing Units |
| Single Unit, Detached | 10 | 37.0% |
| Single Unit, Attached | 0 | 0.0% |
| 2 Unit Apartments | 0 | 0.0% |
| 3 or 4 Unit Apartments | 0 | 0.0% |
| 5 to 9 Unit Apartments | 0 | 0.0% |
| 10 or more Apartments | 0 | 0.0% |
| Mobile Home / Other | 17 | 63.0% |
| Total | 27 | 100.0% |
Housing Structures by Occupancy in Petronilla
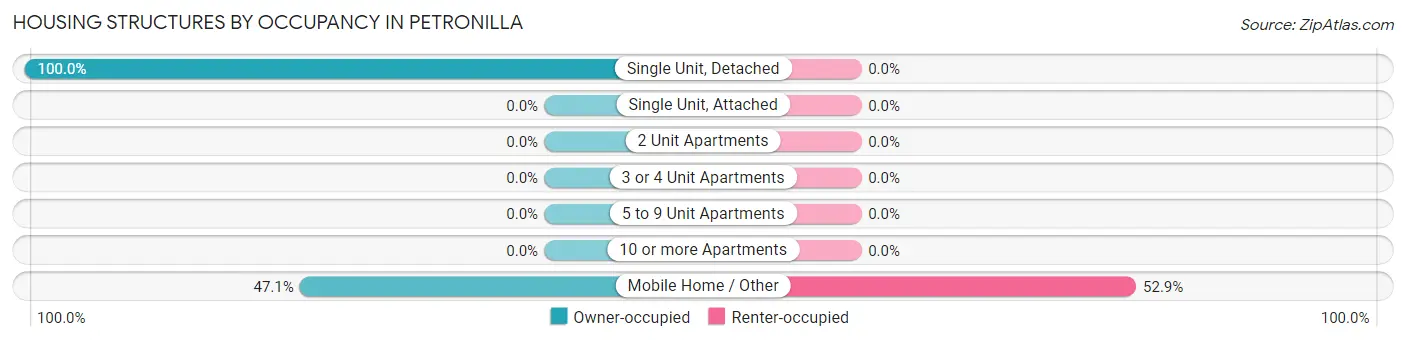
| Structure Type | Owner-occupied | Renter-occupied |
| Single Unit, Detached | 10 (100.0%) | 0 (0.0%) |
| Single Unit, Attached | 0 (0.0%) | 0 (0.0%) |
| 2 Unit Apartments | 0 (0.0%) | 0 (0.0%) |
| 3 or 4 Unit Apartments | 0 (0.0%) | 0 (0.0%) |
| 5 to 9 Unit Apartments | 0 (0.0%) | 0 (0.0%) |
| 10 or more Apartments | 0 (0.0%) | 0 (0.0%) |
| Mobile Home / Other | 8 (47.1%) | 9 (52.9%) |
| Total | 18 (66.7%) | 9 (33.3%) |
Housing Structures by Number of Rooms in Petronilla
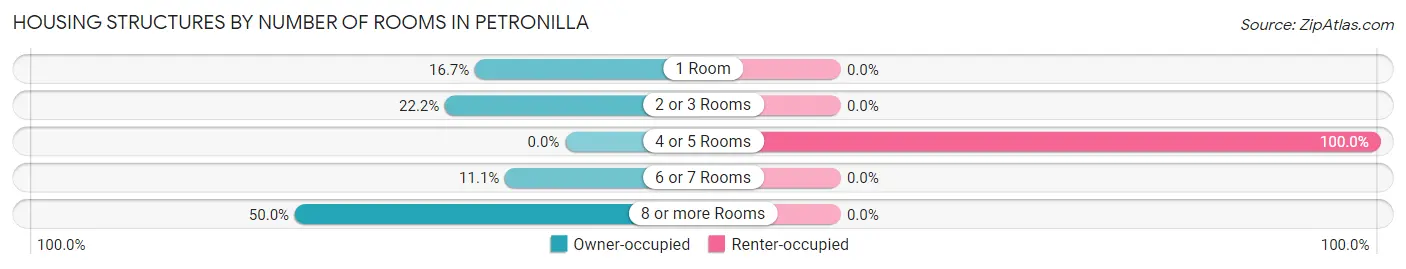
| Number of Rooms | Owner-occupied | Renter-occupied |
| 1 Room | 3 (16.7%) | 0 (0.0%) |
| 2 or 3 Rooms | 4 (22.2%) | 0 (0.0%) |
| 4 or 5 Rooms | 0 (0.0%) | 9 (100.0%) |
| 6 or 7 Rooms | 2 (11.1%) | 0 (0.0%) |
| 8 or more Rooms | 9 (50.0%) | 0 (0.0%) |
| Total | 18 (100.0%) | 9 (100.0%) |
Housing Structure by Heating Type in Petronilla
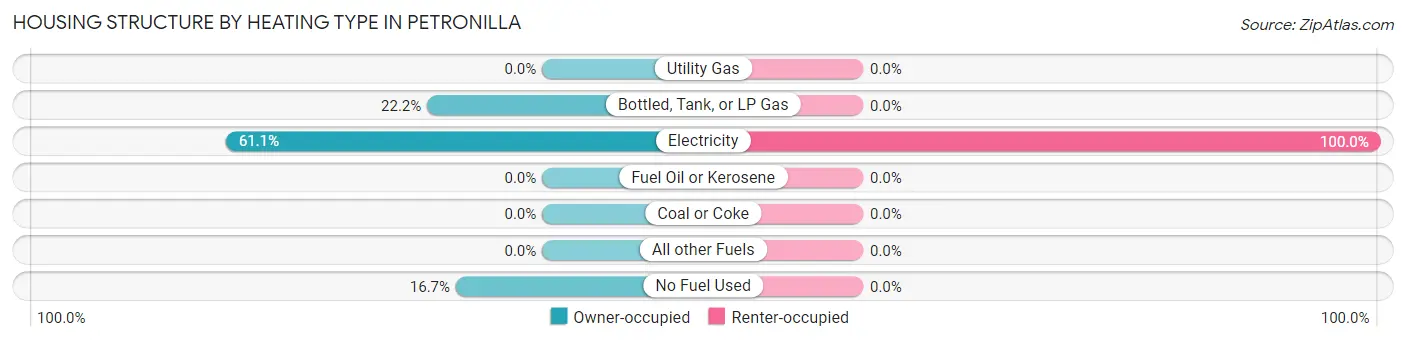
| Heating Type | Owner-occupied | Renter-occupied |
| Utility Gas | 0 (0.0%) | 0 (0.0%) |
| Bottled, Tank, or LP Gas | 4 (22.2%) | 0 (0.0%) |
| Electricity | 11 (61.1%) | 9 (100.0%) |
| Fuel Oil or Kerosene | 0 (0.0%) | 0 (0.0%) |
| Coal or Coke | 0 (0.0%) | 0 (0.0%) |
| All other Fuels | 0 (0.0%) | 0 (0.0%) |
| No Fuel Used | 3 (16.7%) | 0 (0.0%) |
| Total | 18 (100.0%) | 9 (100.0%) |
Household Vehicle Usage in Petronilla
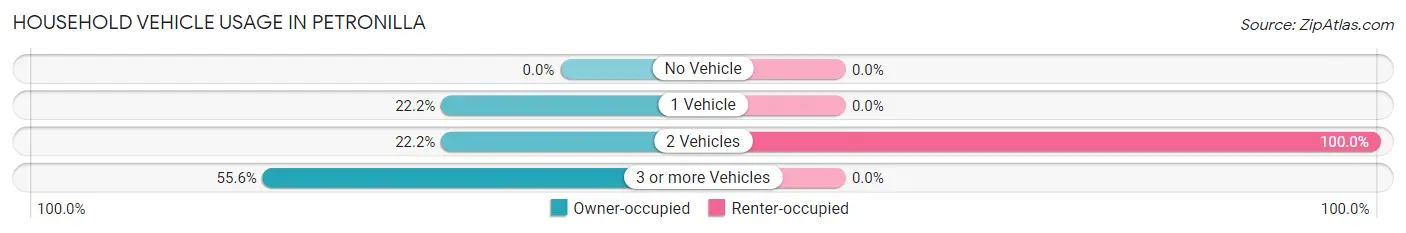
| Vehicles per Household | Owner-occupied | Renter-occupied |
| No Vehicle | 0 (0.0%) | 0 (0.0%) |
| 1 Vehicle | 4 (22.2%) | 0 (0.0%) |
| 2 Vehicles | 4 (22.2%) | 9 (100.0%) |
| 3 or more Vehicles | 10 (55.6%) | 0 (0.0%) |
| Total | 18 (100.0%) | 9 (100.0%) |
Real Estate & Mortgages in Petronilla
Real Estate and Mortgage Overview in Petronilla
| Characteristic | Without Mortgage | With Mortgage |
| Housing Units | 11 | 7 |
| Median Property Value | - | - |
| Median Household Income | $108,125 | $2 |
| Monthly Housing Costs | $1,025 | $0 |
| Real Estate Taxes | - | - |
Property Value by Mortgage Status in Petronilla
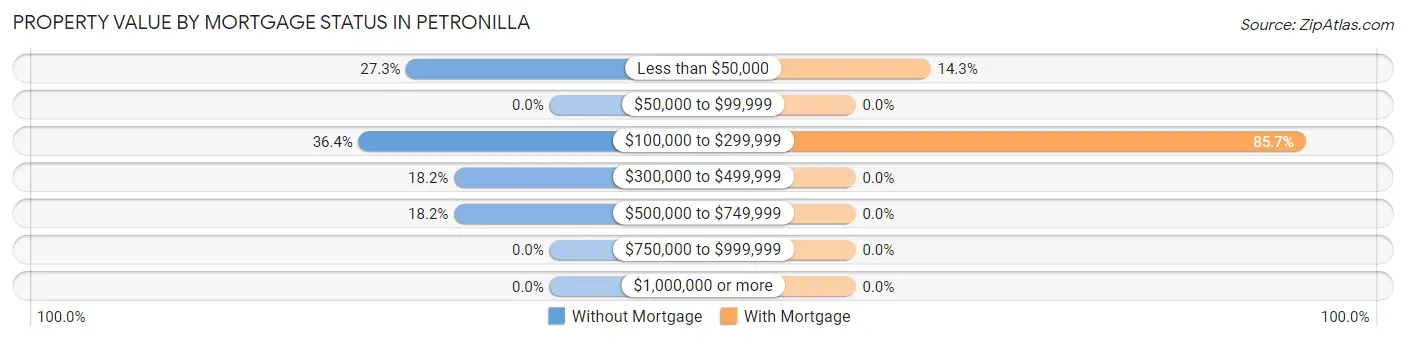
| Property Value | Without Mortgage | With Mortgage |
| Less than $50,000 | 3 (27.3%) | 1 (14.3%) |
| $50,000 to $99,999 | 0 (0.0%) | 0 (0.0%) |
| $100,000 to $299,999 | 4 (36.4%) | 6 (85.7%) |
| $300,000 to $499,999 | 2 (18.2%) | 0 (0.0%) |
| $500,000 to $749,999 | 2 (18.2%) | 0 (0.0%) |
| $750,000 to $999,999 | 0 (0.0%) | 0 (0.0%) |
| $1,000,000 or more | 0 (0.0%) | 0 (0.0%) |
| Total | 11 (100.0%) | 7 (100.0%) |
Household Income by Mortgage Status in Petronilla
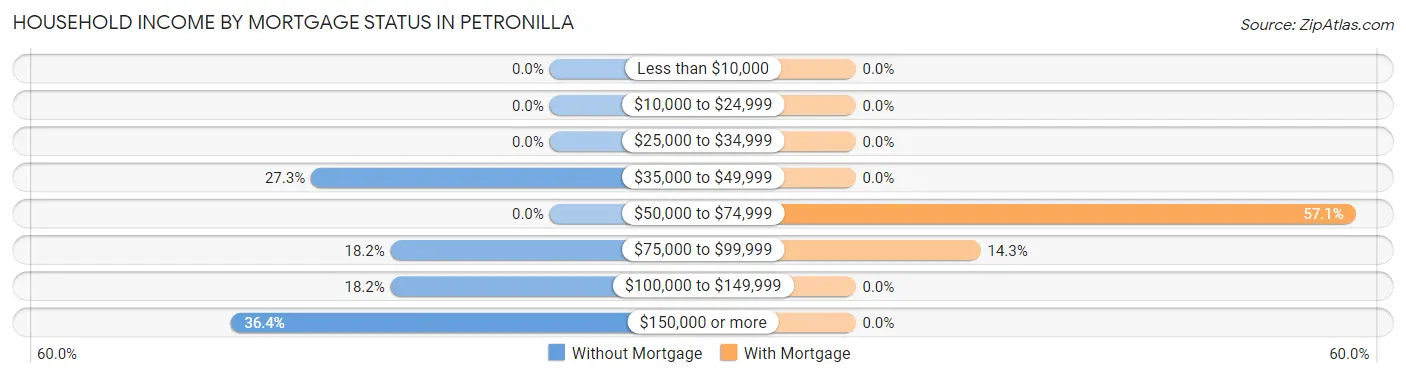
| Household Income | Without Mortgage | With Mortgage |
| Less than $10,000 | 0 (0.0%) | 0 (0.0%) |
| $10,000 to $24,999 | 0 (0.0%) | 0 (0.0%) |
| $25,000 to $34,999 | 0 (0.0%) | 0 (0.0%) |
| $35,000 to $49,999 | 3 (27.3%) | 0 (0.0%) |
| $50,000 to $74,999 | 0 (0.0%) | 4 (57.1%) |
| $75,000 to $99,999 | 2 (18.2%) | 1 (14.3%) |
| $100,000 to $149,999 | 2 (18.2%) | 0 (0.0%) |
| $150,000 or more | 4 (36.4%) | 0 (0.0%) |
| Total | 11 (100.0%) | 7 (100.0%) |
Property Value to Household Income Ratio in Petronilla
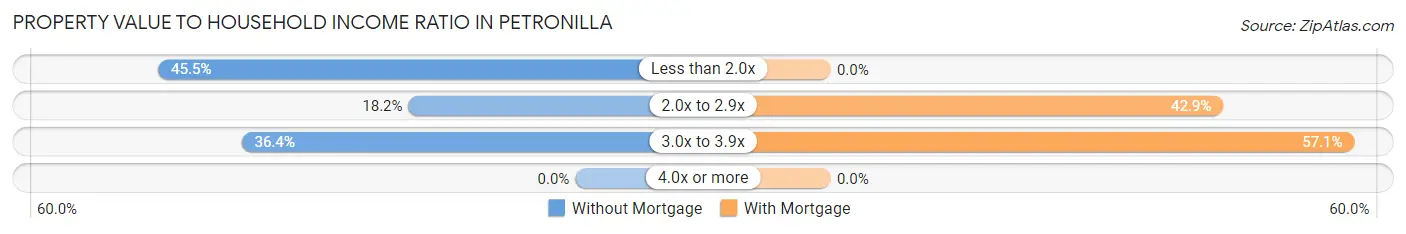
| Value-to-Income Ratio | Without Mortgage | With Mortgage |
| Less than 2.0x | 5 (45.5%) | 0 (0.0%) |
| 2.0x to 2.9x | 2 (18.2%) | 3 (42.9%) |
| 3.0x to 3.9x | 4 (36.4%) | 4 (57.1%) |
| 4.0x or more | 0 (0.0%) | 0 (0.0%) |
| Total | 11 (100.0%) | 7 (100.0%) |
Real Estate Taxes by Mortgage Status in Petronilla
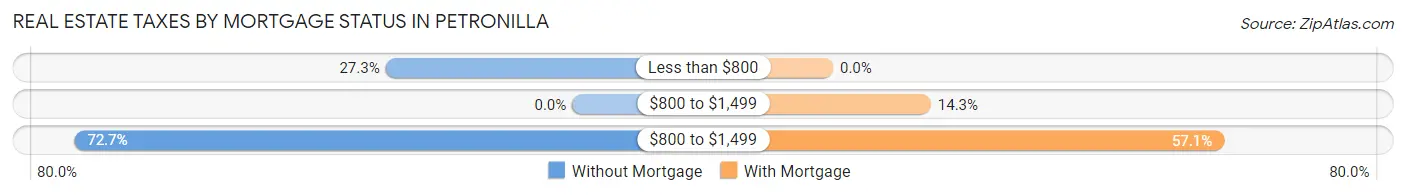
| Property Taxes | Without Mortgage | With Mortgage |
| Less than $800 | 3 (27.3%) | 0 (0.0%) |
| $800 to $1,499 | 0 (0.0%) | 1 (14.3%) |
| $800 to $1,499 | 8 (72.7%) | 4 (57.1%) |
| Total | 11 (100.0%) | 7 (100.0%) |
Health & Disability in Petronilla
Health Insurance Coverage by Age in Petronilla
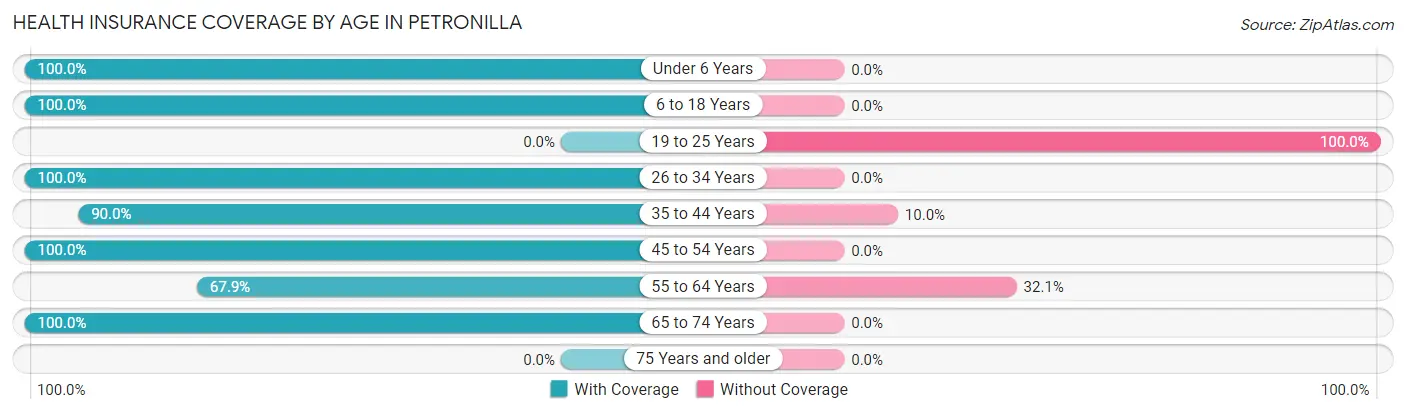
| Age Bracket | With Coverage | Without Coverage |
| Under 6 Years | 1 (100.0%) | 0 (0.0%) |
| 6 to 18 Years | 10 (100.0%) | 0 (0.0%) |
| 19 to 25 Years | 0 (0.0%) | 3 (100.0%) |
| 26 to 34 Years | 7 (100.0%) | 0 (0.0%) |
| 35 to 44 Years | 9 (90.0%) | 1 (10.0%) |
| 45 to 54 Years | 5 (100.0%) | 0 (0.0%) |
| 55 to 64 Years | 19 (67.9%) | 9 (32.1%) |
| 65 to 74 Years | 5 (100.0%) | 0 (0.0%) |
| 75 Years and older | 0 (0.0%) | 0 (0.0%) |
| Total | 56 (81.2%) | 13 (18.8%) |
Health Insurance Coverage by Citizenship Status in Petronilla
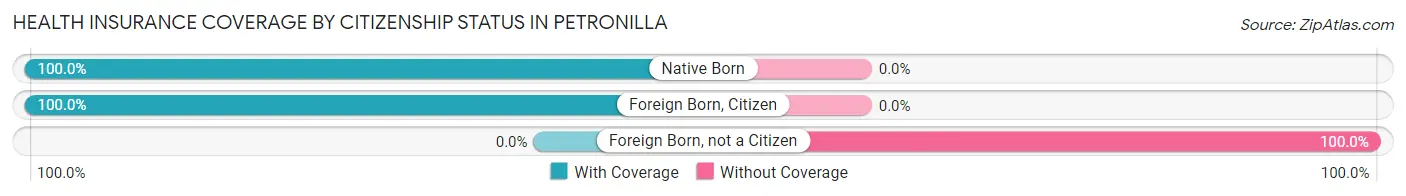
| Citizenship Status | With Coverage | Without Coverage |
| Native Born | 1 (100.0%) | 0 (0.0%) |
| Foreign Born, Citizen | 10 (100.0%) | 0 (0.0%) |
| Foreign Born, not a Citizen | 0 (0.0%) | 3 (100.0%) |
Health Insurance Coverage by Household Income in Petronilla
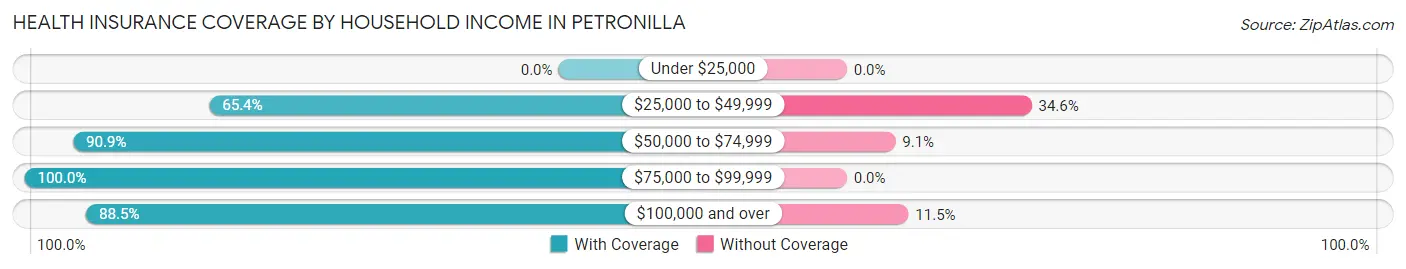
| Household Income | With Coverage | Without Coverage |
| Under $25,000 | 0 (0.0%) | 0 (0.0%) |
| $25,000 to $49,999 | 17 (65.4%) | 9 (34.6%) |
| $50,000 to $74,999 | 10 (90.9%) | 1 (9.1%) |
| $75,000 to $99,999 | 6 (100.0%) | 0 (0.0%) |
| $100,000 and over | 23 (88.5%) | 3 (11.5%) |
Public vs Private Health Insurance Coverage by Age in Petronilla
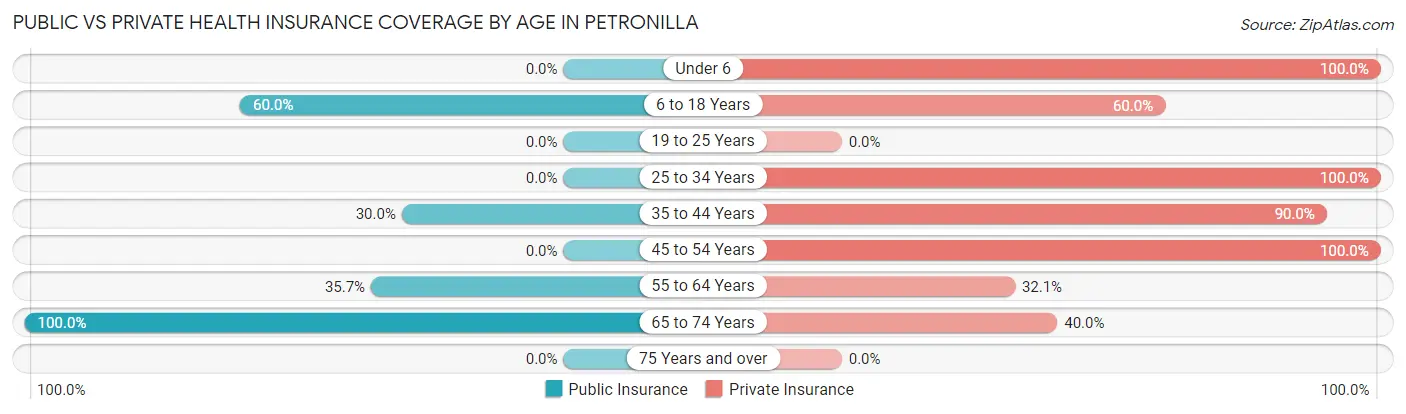
| Age Bracket | Public Insurance | Private Insurance |
| Under 6 | 0 (0.0%) | 1 (100.0%) |
| 6 to 18 Years | 6 (60.0%) | 6 (60.0%) |
| 19 to 25 Years | 0 (0.0%) | 0 (0.0%) |
| 25 to 34 Years | 0 (0.0%) | 7 (100.0%) |
| 35 to 44 Years | 3 (30.0%) | 9 (90.0%) |
| 45 to 54 Years | 0 (0.0%) | 5 (100.0%) |
| 55 to 64 Years | 10 (35.7%) | 9 (32.1%) |
| 65 to 74 Years | 5 (100.0%) | 2 (40.0%) |
| 75 Years and over | 0 (0.0%) | 0 (0.0%) |
| Total | 24 (34.8%) | 39 (56.5%) |
Disability Status by Sex by Age in Petronilla
| Age Bracket | Male | Female |
| Under 5 Years | 0 (0.0%) | 0 (0.0%) |
| 5 to 17 Years | 0 (0.0%) | 0 (0.0%) |
| 18 to 34 Years | 0 (0.0%) | 0 (0.0%) |
| 35 to 64 Years | 0 (0.0%) | 0 (0.0%) |
| 65 to 74 Years | 0 (0.0%) | 0 (0.0%) |
| 75 Years and over | 0 (0.0%) | 0 (0.0%) |
Disability Class by Sex by Age in Petronilla
Disability Class: Hearing Difficulty
| Age Bracket | Male | Female |
| Under 5 Years | 0 (0.0%) | 0 (0.0%) |
| 5 to 17 Years | 0 (0.0%) | 0 (0.0%) |
| 18 to 34 Years | 0 (0.0%) | 0 (0.0%) |
| 35 to 64 Years | 0 (0.0%) | 0 (0.0%) |
| 65 to 74 Years | 0 (0.0%) | 0 (0.0%) |
| 75 Years and over | 0 (0.0%) | 0 (0.0%) |
Disability Class: Vision Difficulty
| Age Bracket | Male | Female |
| Under 5 Years | 0 (0.0%) | 0 (0.0%) |
| 5 to 17 Years | 0 (0.0%) | 0 (0.0%) |
| 18 to 34 Years | 0 (0.0%) | 0 (0.0%) |
| 35 to 64 Years | 0 (0.0%) | 0 (0.0%) |
| 65 to 74 Years | 0 (0.0%) | 0 (0.0%) |
| 75 Years and over | 0 (0.0%) | 0 (0.0%) |
Disability Class: Cognitive Difficulty
| Age Bracket | Male | Female |
| 5 to 17 Years | 0 (0.0%) | 0 (0.0%) |
| 18 to 34 Years | 0 (0.0%) | 0 (0.0%) |
| 35 to 64 Years | 0 (0.0%) | 0 (0.0%) |
| 65 to 74 Years | 0 (0.0%) | 0 (0.0%) |
| 75 Years and over | 0 (0.0%) | 0 (0.0%) |
Disability Class: Ambulatory Difficulty
| Age Bracket | Male | Female |
| 5 to 17 Years | 0 (0.0%) | 0 (0.0%) |
| 18 to 34 Years | 0 (0.0%) | 0 (0.0%) |
| 35 to 64 Years | 0 (0.0%) | 0 (0.0%) |
| 65 to 74 Years | 0 (0.0%) | 0 (0.0%) |
| 75 Years and over | 0 (0.0%) | 0 (0.0%) |
Disability Class: Self-Care Difficulty
| Age Bracket | Male | Female |
| 5 to 17 Years | 0 (0.0%) | 0 (0.0%) |
| 18 to 34 Years | 0 (0.0%) | 0 (0.0%) |
| 35 to 64 Years | 0 (0.0%) | 0 (0.0%) |
| 65 to 74 Years | 0 (0.0%) | 0 (0.0%) |
| 75 Years and over | 0 (0.0%) | 0 (0.0%) |
Technology Access in Petronilla
Computing Device Access in Petronilla
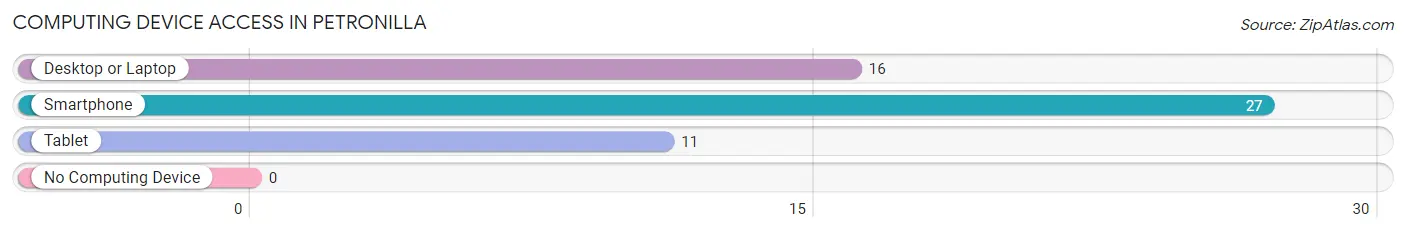
| Device Type | # Households | % Households |
| Desktop or Laptop | 16 | 59.3% |
| Smartphone | 27 | 100.0% |
| Tablet | 11 | 40.7% |
| No Computing Device | 0 | 0.0% |
| Total | 27 | 100.0% |
Internet Access in Petronilla
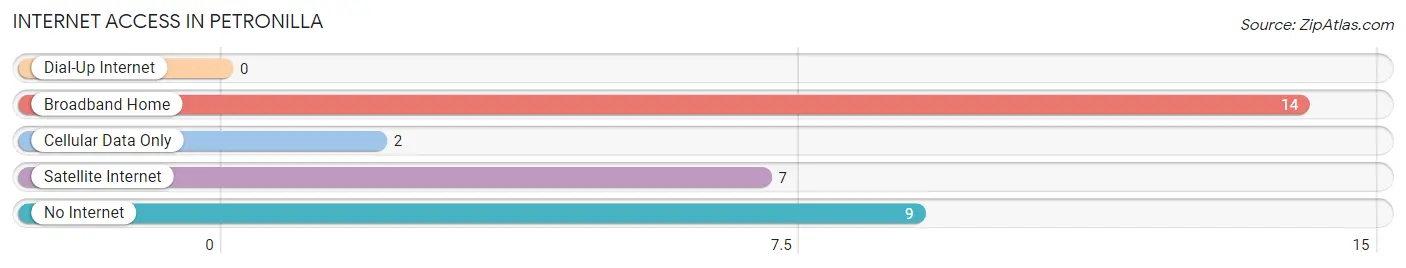
| Internet Type | # Households | % Households |
| Dial-Up Internet | 0 | 0.0% |
| Broadband Home | 14 | 51.8% |
| Cellular Data Only | 2 | 7.4% |
| Satellite Internet | 7 | 25.9% |
| No Internet | 9 | 33.3% |
| Total | 27 | 100.0% |
Petronilla Summary
Petronilla, Texas is a small unincorporated community located in the southeastern corner of Nueces County, Texas. It is situated on the banks of the Nueces River, approximately 20 miles south of Corpus Christi. The population of Petronilla was estimated to be around 200 people in 2020.
History
Petronilla was founded in 1883 by a group of settlers from Mexico. The town was named after Petronilla de la Garza, the daughter of a prominent Mexican rancher. The settlers were attracted to the area due to its fertile soil and abundant water supply. The town quickly grew and by the early 1900s, it had become a thriving agricultural community.
Petronilla was a popular stop for travelers on the Southern Pacific Railroad, which ran through the town. The railroad provided a convenient way for farmers to transport their goods to market. The town also had a post office, a general store, and a school.
Geography
Petronilla is located in the southeastern corner of Nueces County, Texas. It is situated on the banks of the Nueces River, approximately 20 miles south of Corpus Christi. The town is surrounded by farmland and is bordered by the Nueces River to the east and the San Patricio County line to the south.
The climate in Petronilla is subtropical, with hot summers and mild winters. The average annual temperature is around 70 degrees Fahrenheit. The average annual rainfall is around 30 inches.
Economy
The economy of Petronilla is largely based on agriculture. The town is home to several farms, which produce a variety of crops, including cotton, corn, and sorghum. The town also has a few small businesses, including a general store and a gas station.
Demographics
The population of Petronilla was estimated to be around 200 people in 2020. The town is predominantly Hispanic, with a majority of the population being of Mexican descent. The median household income in Petronilla is around $30,000. The town has a high poverty rate, with around 40% of the population living below the poverty line.
Petronilla is a small, rural community with a rich history and culture. The town is home to a diverse population and offers a unique way of life. Despite its small size, Petronilla has a lot to offer, from its agricultural roots to its vibrant culture.
Common Questions
What is the Total Population of Petronilla?
Total Population of Petronilla is 69.
What is the Total Male Population of Petronilla?
Total Male Population of Petronilla is 41.
What is the Total Female Population of Petronilla?
Total Female Population of Petronilla is 28.
What is the Ratio of Males per 100 Females in Petronilla?
There are 146.43 Males per 100 Females in Petronilla.
What is the Ratio of Females per 100 Males in Petronilla?
There are 68.29 Females per 100 Males in Petronilla.
What is the Median Population Age in Petronilla?
Median Population Age in Petronilla is 50.3 Years.
What is the Average Family Size in Petronilla
Average Family Size in Petronilla is 3.9 People.
What is the Average Household Size in Petronilla
Average Household Size in Petronilla is 2.6 People.
What is Per Capita Income in Petronilla?
Per Capita income in Petronilla is $40,557.
What is the Median Family Income in Petronilla?
Median Family Income in Petronilla is $183,125.
What is Inequality or Gini Index in Petronilla?
Inequality or Gini Index in Petronilla is 0.39.
How Large is the Labor Force in Petronilla?
There are 38 People in the Labor Forcein in Petronilla.
What is the Percentage of People in the Labor Force in Petronilla?
59.4% of People are in the Labor Force in Petronilla.