Cities with the Highest Percentage of Immigrants from El Salvador in Florida
RELATED REPORTS & OPTIONS
El Salvador
Florida
Compare Cities
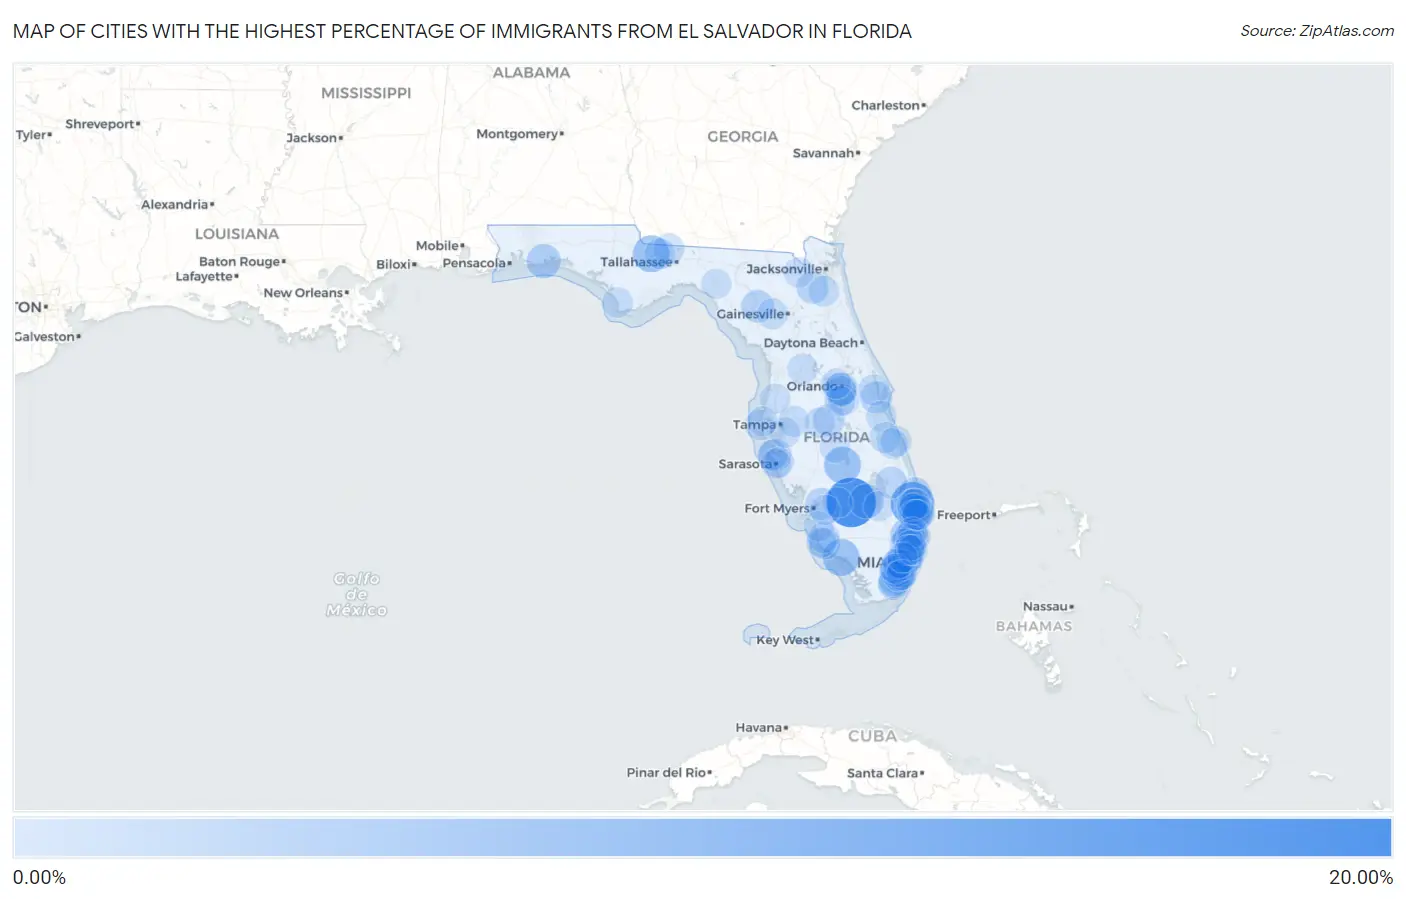
Map of Cities with the Highest Percentage of Immigrants from El Salvador in Florida
0.00%
20.00%
Cities with the Highest Percentage of Immigrants from El Salvador in Florida
| City | El Salvador | vs State | vs National | |
| 1. | Pioneer | 17.90% | 0.23%(+17.7)#-1 | 0.43%(+17.5)#0 |
| 2. | Plantation Mobile Home Park | 12.21% | 0.23%(+12.0)#0 | 0.43%(+11.8)#1 |
| 3. | Everglades | 6.29% | 0.23%(+6.06)#1 | 0.43%(+5.87)#2 |
| 4. | Lake Placid | 6.17% | 0.23%(+5.94)#98 | 0.43%(+5.75)#217 |
| 5. | Greensboro | 6.17% | 0.23%(+5.94)#99 | 0.43%(+5.74)#218 |
| 6. | San Castle | 6.14% | 0.23%(+5.91)#100 | 0.43%(+5.71)#219 |
| 7. | Oakland Park | 4.18% | 0.23%(+3.95)#101 | 0.43%(+3.76)#220 |
| 8. | Clewiston | 4.12% | 0.23%(+3.89)#318 | 0.43%(+3.70)#1,310 |
| 9. | Ocean City | 3.85% | 0.23%(+3.62)#319 | 0.43%(+3.42)#1,311 |
| 10. | North Lauderdale | 3.79% | 0.23%(+3.56)#320 | 0.43%(+3.36)#1,312 |
| 11. | Cabana Colony | 2.66% | 0.23%(+2.43)#321 | 0.43%(+2.23)#1,313 |
| 12. | Oak Ridge | 2.62% | 0.23%(+2.39)#322 | 0.43%(+2.20)#1,314 |
| 13. | Bell | 2.56% | 0.23%(+2.33)#323 | 0.43%(+2.13)#1,315 |
| 14. | Samoset | 2.53% | 0.23%(+2.30)#324 | 0.43%(+2.10)#1,316 |
| 15. | Haverhill | 2.52% | 0.23%(+2.29)#325 | 0.43%(+2.09)#1,317 |
| 16. | Berkshire Lakes | 2.50% | 0.23%(+2.27)#326 | 0.43%(+2.08)#1,318 |
| 17. | Holden Heights | 2.44% | 0.23%(+2.21)#327 | 0.43%(+2.02)#1,319 |
| 18. | Middleburg | 2.16% | 0.23%(+1.93)#328 | 0.43%(+1.74)#1,320 |
| 19. | Cocoa West | 2.06% | 0.23%(+1.83)#329 | 0.43%(+1.64)#1,321 |
| 20. | Princeton | 2.04% | 0.23%(+1.81)#330 | 0.43%(+1.61)#1,322 |
| 21. | Florida City | 2.02% | 0.23%(+1.79)#331 | 0.43%(+1.60)#1,323 |
| 22. | Fort Myers Shores | 1.99% | 0.23%(+1.76)#332 | 0.43%(+1.56)#1,324 |
| 23. | Leisure City | 1.96% | 0.23%(+1.73)#333 | 0.43%(+1.53)#1,325 |
| 24. | Indiantown | 1.90% | 0.23%(+1.67)#334 | 0.43%(+1.48)#1,326 |
| 25. | Dundee | 1.90% | 0.23%(+1.67)#335 | 0.43%(+1.47)#1,327 |
| 26. | Lantana | 1.70% | 0.23%(+1.47)#336 | 0.43%(+1.28)#1,328 |
| 27. | West Little River | 1.61% | 0.23%(+1.38)#337 | 0.43%(+1.18)#1,329 |
| 28. | Verona Walk | 1.53% | 0.23%(+1.30)#338 | 0.43%(+1.11)#1,330 |
| 29. | South Miami Heights | 1.41% | 0.23%(+1.18)#339 | 0.43%(+0.986)#1,331 |
| 30. | Three Lakes | 1.36% | 0.23%(+1.13)#340 | 0.43%(+0.930)#1,332 |
| 31. | Sea Ranch Lakes | 1.35% | 0.23%(+1.12)#341 | 0.43%(+0.929)#1,333 |
| 32. | Palm Springs | 1.34% | 0.23%(+1.11)#342 | 0.43%(+0.916)#1,334 |
| 33. | Lake Worth Beach | 1.30% | 0.23%(+1.07)#343 | 0.43%(+0.874)#1,335 |
| 34. | Country Walk | 1.28% | 0.23%(+1.05)#344 | 0.43%(+0.851)#1,336 |
| 35. | Lake Belvedere Estates | 1.26% | 0.23%(+1.03)#345 | 0.43%(+0.830)#1,337 |
| 36. | Port St John | 1.15% | 0.23%(+0.923)#346 | 0.43%(+0.728)#1,338 |
| 37. | Havana | 1.13% | 0.23%(+0.898)#347 | 0.43%(+0.703)#1,339 |
| 38. | Quincy | 1.05% | 0.23%(+0.819)#348 | 0.43%(+0.624)#1,340 |
| 39. | Golden Gate | 1.05% | 0.23%(+0.817)#349 | 0.43%(+0.622)#1,341 |
| 40. | Miami | 1.02% | 0.23%(+0.788)#350 | 0.43%(+0.593)#1,342 |
| 41. | Dover | 1.02% | 0.23%(+0.786)#351 | 0.43%(+0.591)#1,343 |
| 42. | Newberry | 1.00% | 0.23%(+0.770)#352 | 0.43%(+0.575)#1,344 |
| 43. | Kendall West | 0.97% | 0.23%(+0.744)#353 | 0.43%(+0.549)#1,345 |
| 44. | West Melbourne | 0.95% | 0.23%(+0.722)#354 | 0.43%(+0.527)#1,346 |
| 45. | Homestead | 0.95% | 0.23%(+0.715)#355 | 0.43%(+0.520)#1,347 |
| 46. | El Portal | 0.89% | 0.23%(+0.662)#356 | 0.43%(+0.468)#1,348 |
| 47. | Green Cove Springs | 0.89% | 0.23%(+0.661)#357 | 0.43%(+0.466)#1,553 |
| 48. | Westview | 0.89% | 0.23%(+0.661)#358 | 0.43%(+0.466)#1,554 |
| 49. | Greenacres | 0.89% | 0.23%(+0.659)#359 | 0.43%(+0.464)#1,555 |
| 50. | Brownsville | 0.89% | 0.23%(+0.656)#360 | 0.43%(+0.461)#1,556 |
| 51. | Gifford | 0.88% | 0.23%(+0.653)#361 | 0.43%(+0.458)#1,557 |
| 52. | Fellsmere | 0.86% | 0.23%(+0.629)#362 | 0.43%(+0.434)#1,558 |
| 53. | Buenaventura Lakes | 0.86% | 0.23%(+0.629)#363 | 0.43%(+0.434)#1,559 |
| 54. | Westwood Lakes | 0.86% | 0.23%(+0.627)#364 | 0.43%(+0.432)#1,560 |
| 55. | Westgate | 0.82% | 0.23%(+0.585)#365 | 0.43%(+0.390)#1,561 |
| 56. | Sweetwater | 0.81% | 0.23%(+0.579)#366 | 0.43%(+0.384)#1,562 |
| 57. | Port St Joe | 0.76% | 0.23%(+0.534)#367 | 0.43%(+0.339)#1,563 |
| 58. | West Vero Corridor | 0.76% | 0.23%(+0.526)#368 | 0.43%(+0.331)#1,564 |
| 59. | Liberty Triangle | 0.73% | 0.23%(+0.497)#369 | 0.43%(+0.302)#1,565 |
| 60. | Fountainebleau | 0.72% | 0.23%(+0.486)#370 | 0.43%(+0.291)#1,566 |
| 61. | Hollywood | 0.70% | 0.23%(+0.465)#371 | 0.43%(+0.270)#1,567 |
| 62. | Fort Lauderdale | 0.69% | 0.23%(+0.462)#372 | 0.43%(+0.267)#1,568 |
| 63. | Boynton Beach | 0.67% | 0.23%(+0.439)#373 | 0.43%(+0.244)#1,569 |
| 64. | Coleman | 0.65% | 0.23%(+0.423)#374 | 0.43%(+0.228)#1,570 |
| 65. | Lauderhill | 0.61% | 0.23%(+0.385)#375 | 0.43%(+0.190)#1,571 |
| 66. | Eagle Lake | 0.61% | 0.23%(+0.380)#376 | 0.43%(+0.185)#1,572 |
| 67. | Palmetto Bay | 0.61% | 0.23%(+0.375)#377 | 0.43%(+0.180)#1,573 |
| 68. | Avon Park | 0.60% | 0.23%(+0.372)#378 | 0.43%(+0.177)#1,574 |
| 69. | Pinewood | 0.58% | 0.23%(+0.352)#379 | 0.43%(+0.157)#1,575 |
| 70. | Davie | 0.58% | 0.23%(+0.351)#380 | 0.43%(+0.156)#1,576 |
| 71. | Kensington Park | 0.58% | 0.23%(+0.350)#381 | 0.43%(+0.155)#1,577 |
| 72. | Coral Terrace | 0.58% | 0.23%(+0.347)#382 | 0.43%(+0.152)#1,616 |
| 73. | Macclenny | 0.57% | 0.23%(+0.341)#383 | 0.43%(+0.146)#1,617 |
| 74. | Labelle | 0.56% | 0.23%(+0.334)#384 | 0.43%(+0.139)#1,618 |
| 75. | Pembroke Park | 0.56% | 0.23%(+0.328)#385 | 0.43%(+0.133)#1,619 |
| 76. | South Bradenton | 0.53% | 0.23%(+0.304)#386 | 0.43%(+0.109)#1,620 |
| 77. | Pompano Beach | 0.53% | 0.23%(+0.303)#387 | 0.43%(+0.108)#1,621 |
| 78. | Sky Lake | 0.51% | 0.23%(+0.281)#388 | 0.43%(+0.086)#1,622 |
| 79. | Goulds | 0.51% | 0.23%(+0.280)#389 | 0.43%(+0.085)#1,623 |
| 80. | Gibsonton | 0.49% | 0.23%(+0.262)#390 | 0.43%(+0.067)#1,624 |
| 81. | Belleair | 0.49% | 0.23%(+0.259)#391 | 0.43%(+0.064)#1,625 |
| 82. | Kissimmee | 0.48% | 0.23%(+0.254)#392 | 0.43%(+0.059)#1,626 |
| 83. | West Park | 0.47% | 0.23%(+0.241)#393 | 0.43%(+0.046)#1,627 |
| 84. | University Cdp Hillsborough County | 0.47% | 0.23%(+0.238)#394 | 0.43%(+0.043)#1,628 |
| 85. | Ocean Ridge | 0.47% | 0.23%(+0.237)#395 | 0.43%(+0.042)#1,629 |
| 86. | Pine Hills | 0.45% | 0.23%(+0.223)#396 | 0.43%(+0.028)#1,630 |
| 87. | Perry | 0.45% | 0.23%(+0.220)#397 | 0.43%(+0.025)#1,631 |
| 88. | Tamiami | 0.45% | 0.23%(+0.220)#398 | 0.43%(+0.025)#1,632 |
| 89. | Bonita Springs | 0.44% | 0.23%(+0.209)#399 | 0.43%(+0.014)#1,633 |
| 90. | Dania Beach | 0.44% | 0.23%(+0.205)#400 | 0.43%(+0.010)#1,634 |
| 91. | The Hammocks | 0.43% | 0.23%(+0.204)#401 | 0.43%(+0.009)#1,635 |
| 92. | Cutler Bay | 0.43% | 0.23%(+0.201)#402 | 0.43%(+0.006)#1,636 |
| 93. | Quail Ridge | 0.43% | 0.23%(+0.197)#403 | 0.43%(+0.002)#1,637 |
| 94. | Hialeah | 0.43% | 0.23%(+0.195)#404 | 0.43%(+0.000)#1,638 |
| 95. | South Bay | 0.41% | 0.23%(+0.184)#405 | 0.43%(-0.011)#1,639 |
| 96. | Clearwater | 0.41% | 0.23%(+0.182)#406 | 0.43%(-0.013)#1,640 |
| 97. | Hallandale Beach | 0.41% | 0.23%(+0.178)#407 | 0.43%(-0.017)#1,641 |
| 98. | Naples Manor | 0.41% | 0.23%(+0.178)#408 | 0.43%(-0.017)#1,642 |
| 99. | Lehigh Acres | 0.39% | 0.23%(+0.164)#409 | 0.43%(-0.031)#1,643 |
| 100. | Sarasota | 0.39% | 0.23%(+0.164)#410 | 0.43%(-0.031)#1,644 |
Common Questions
What are the Top 10 Cities with the Highest Percentage of Immigrants from El Salvador in Florida?
Top 10 Cities with the Highest Percentage of Immigrants from El Salvador in Florida are:
#1
17.90%
#2
12.21%
#3
6.29%
#4
6.17%
#5
6.17%
#6
6.14%
#7
4.18%
#8
4.12%
#9
3.85%
#10
3.79%
What city has the Highest Percentage of Immigrants from El Salvador in Florida?
Pioneer has the Highest Percentage of Immigrants from El Salvador in Florida with 17.90%.
What is the Percentage of Immigrants from El Salvador in the State of Florida?
Percentage of Immigrants from El Salvador in Florida is 0.23%.
What is the Percentage of Immigrants from El Salvador in the United States?
Percentage of Immigrants from El Salvador in the United States is 0.43%.