McGregor, TX
McGregor Map
McGregor Overview
5,478
TOTAL POPULATION
2,966
MALE POPULATION
2,512
FEMALE POPULATION
118.07
MALES / 100 FEMALES
84.69
FEMALES / 100 MALES
32.7
MEDIAN AGE
3.9
AVG FAMILY SIZE
3.2
AVG HOUSEHOLD SIZE
$29,071
PER CAPITA INCOME
$82,115
AVG FAMILY INCOME
$69,677
AVG HOUSEHOLD INCOME
43.8%
WAGE / INCOME GAP [ % ]
56.2¢/ $1
WAGE / INCOME GAP [ $ ]
0.46
INEQUALITY / GINI INDEX
2,646
LABOR FORCE [ PEOPLE ]
64.6%
PERCENT IN LABOR FORCE
4.9%
UNEMPLOYMENT RATE
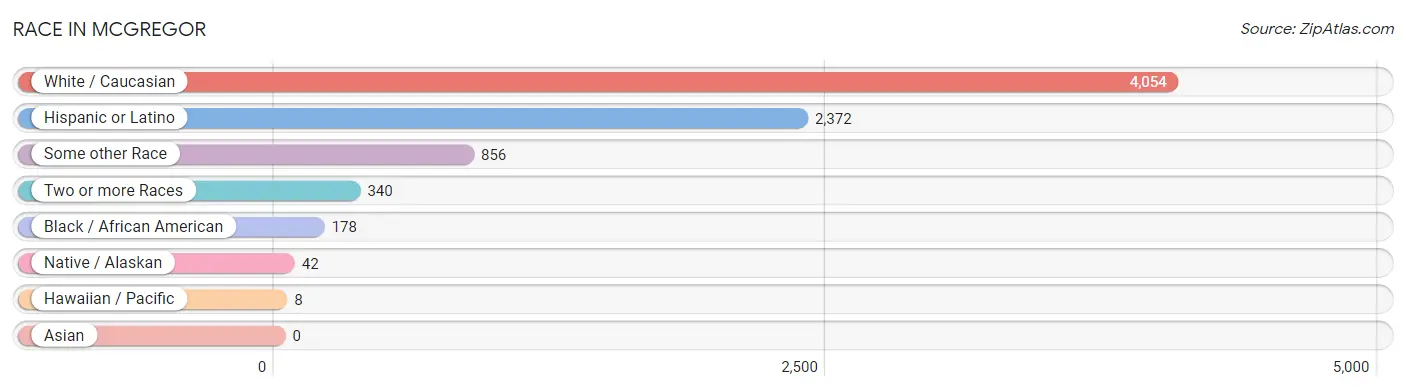
Race in McGregor
The most populous races in McGregor are White / Caucasian (4,054 | 74.0%), Hispanic or Latino (2,372 | 43.3%), and Some other Race (856 | 15.6%).
| Race | # Population | % Population |
| Asian | 0 | 0.0% |
| Black / African American | 178 | 3.3% |
| Hawaiian / Pacific | 8 | 0.2% |
| Hispanic or Latino | 2,372 | 43.3% |
| Native / Alaskan | 42 | 0.8% |
| White / Caucasian | 4,054 | 74.0% |
| Two or more Races | 340 | 6.2% |
| Some other Race | 856 | 15.6% |
| Total | 5,478 | 100.0% |
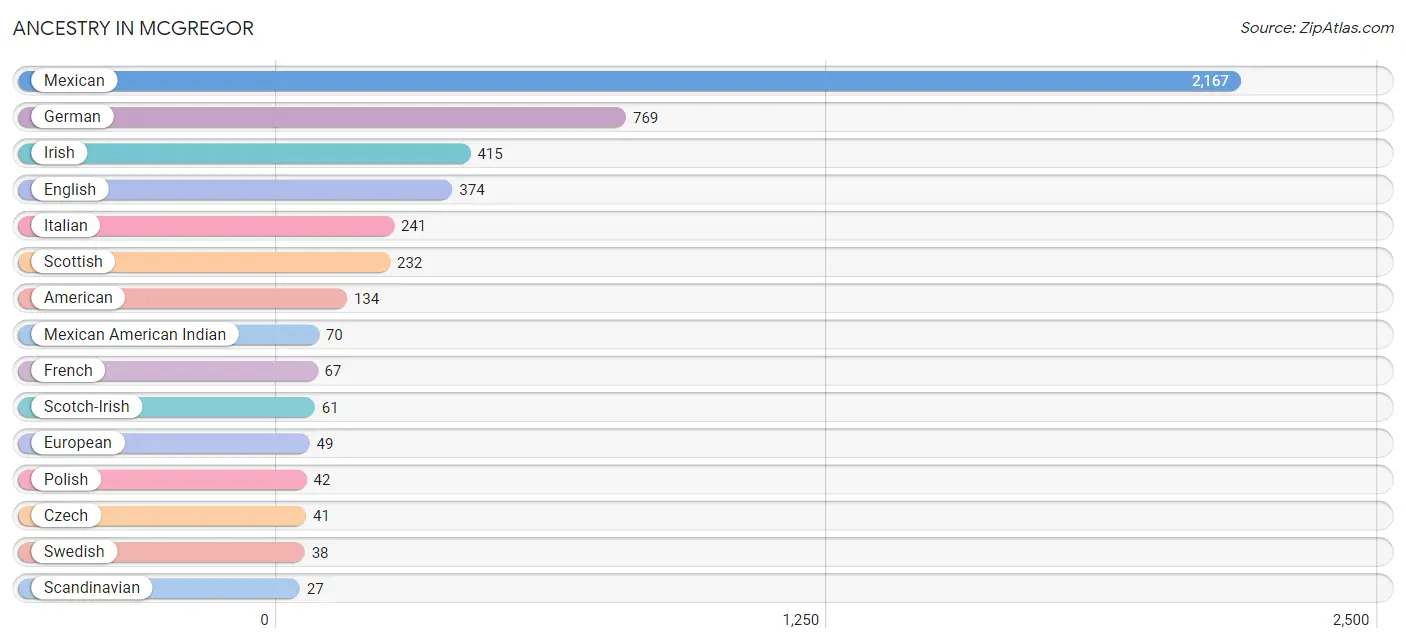
Ancestry in McGregor
The most populous ancestries reported in McGregor are Mexican (2,167 | 39.6%), German (769 | 14.0%), Irish (415 | 7.6%), English (374 | 6.8%), and Italian (241 | 4.4%), together accounting for 72.4% of all McGregor residents.
| Ancestry | # Population | % Population |
| African | 19 | 0.4% |
| American | 134 | 2.5% |
| Arab | 7 | 0.1% |
| Central American | 21 | 0.4% |
| Cuban | 6 | 0.1% |
| Czech | 41 | 0.7% |
| Danish | 16 | 0.3% |
| Dutch | 16 | 0.3% |
| Eastern European | 9 | 0.2% |
| Egyptian | 7 | 0.1% |
| English | 374 | 6.8% |
| European | 49 | 0.9% |
| French | 67 | 1.2% |
| German | 769 | 14.0% |
| Guamanian / Chamorro | 20 | 0.4% |
| Irish | 415 | 7.6% |
| Italian | 241 | 4.4% |
| Korean | 16 | 0.3% |
| Mexican | 2,167 | 39.6% |
| Mexican American Indian | 70 | 1.3% |
| Native Hawaiian | 8 | 0.2% |
| Northern European | 16 | 0.3% |
| Norwegian | 9 | 0.2% |
| Polish | 42 | 0.8% |
| Salvadoran | 21 | 0.4% |
| Scandinavian | 27 | 0.5% |
| Scotch-Irish | 61 | 1.1% |
| Scottish | 232 | 4.2% |
| Subsaharan African | 19 | 0.4% |
| Swedish | 38 | 0.7% | View All 30 Rows |
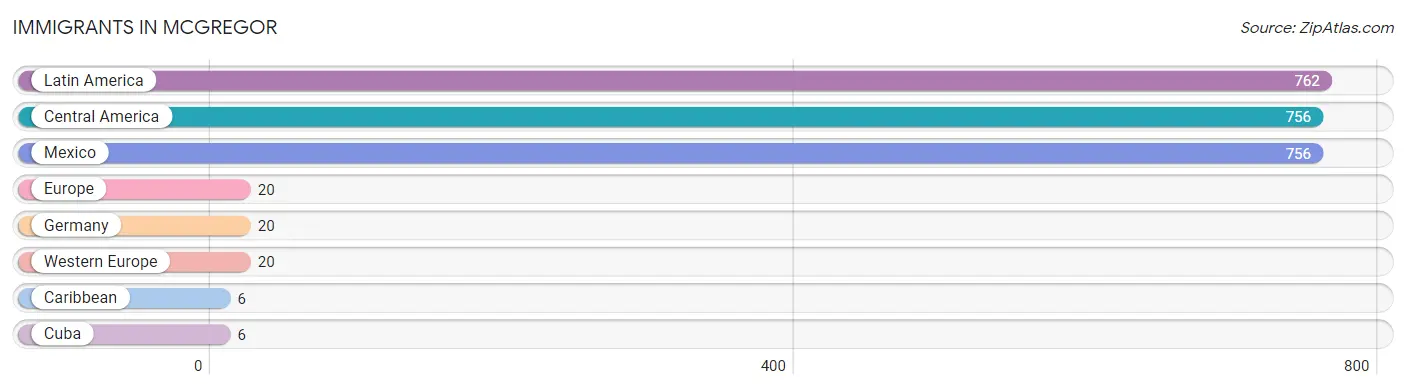
Immigrants in McGregor
The most numerous immigrant groups reported in McGregor came from Latin America (762 | 13.9%), Central America (756 | 13.8%), Mexico (756 | 13.8%), Europe (20 | 0.4%), and Germany (20 | 0.4%), together accounting for 42.2% of all McGregor residents.
| Immigration Origin | # Population | % Population |
| Caribbean | 6 | 0.1% |
| Central America | 756 | 13.8% |
| Cuba | 6 | 0.1% |
| Europe | 20 | 0.4% |
| Germany | 20 | 0.4% |
| Latin America | 762 | 13.9% |
| Mexico | 756 | 13.8% |
| Western Europe | 20 | 0.4% | View All 8 Rows |
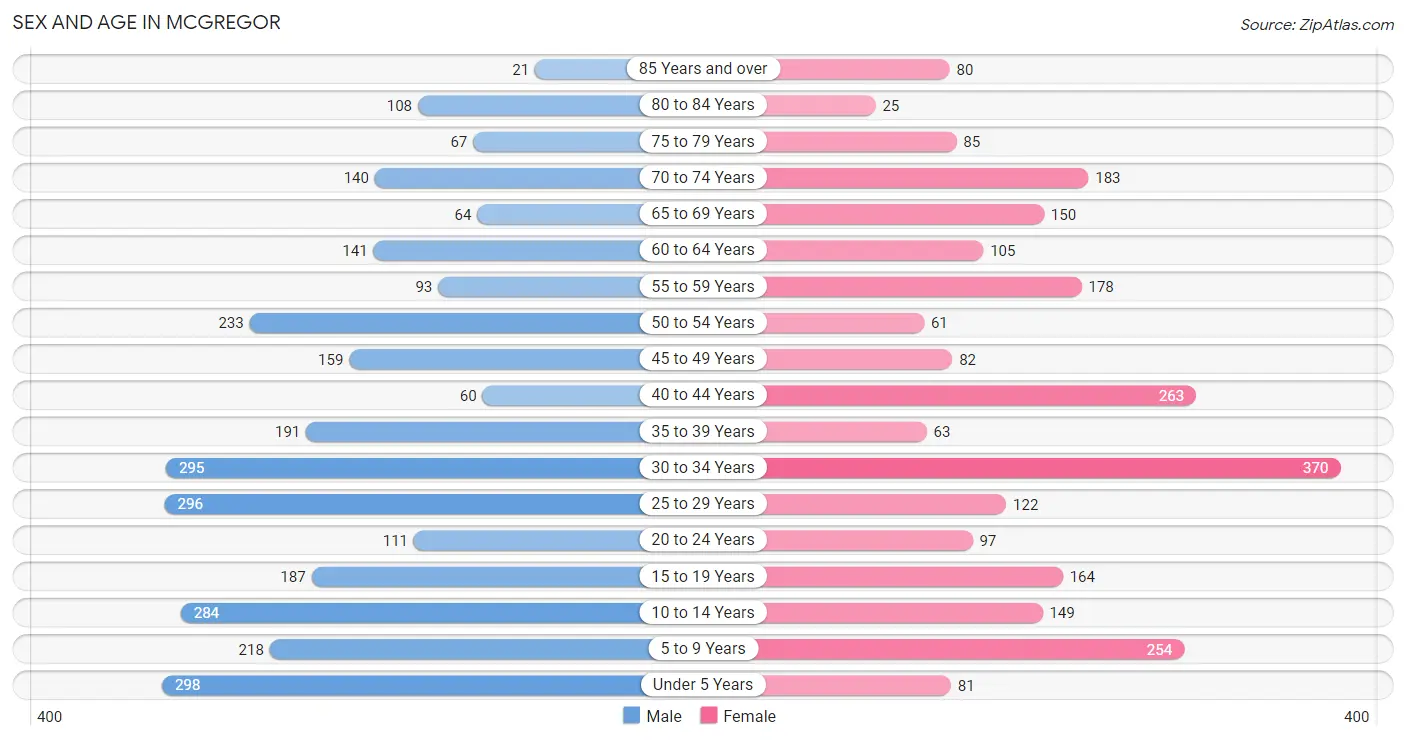
Sex and Age in McGregor
Sex and Age in McGregor
The most populous age groups in McGregor are Under 5 Years (298 | 10.1%) for men and 30 to 34 Years (370 | 14.7%) for women.
| Age Bracket | Male | Female |
| Under 5 Years | 298 (10.1%) | 81 (3.2%) |
| 5 to 9 Years | 218 (7.3%) | 254 (10.1%) |
| 10 to 14 Years | 284 (9.6%) | 149 (5.9%) |
| 15 to 19 Years | 187 (6.3%) | 164 (6.5%) |
| 20 to 24 Years | 111 (3.7%) | 97 (3.9%) |
| 25 to 29 Years | 296 (10.0%) | 122 (4.9%) |
| 30 to 34 Years | 295 (10.0%) | 370 (14.7%) |
| 35 to 39 Years | 191 (6.4%) | 63 (2.5%) |
| 40 to 44 Years | 60 (2.0%) | 263 (10.5%) |
| 45 to 49 Years | 159 (5.4%) | 82 (3.3%) |
| 50 to 54 Years | 233 (7.9%) | 61 (2.4%) |
| 55 to 59 Years | 93 (3.1%) | 178 (7.1%) |
| 60 to 64 Years | 141 (4.8%) | 105 (4.2%) |
| 65 to 69 Years | 64 (2.2%) | 150 (6.0%) |
| 70 to 74 Years | 140 (4.7%) | 183 (7.3%) |
| 75 to 79 Years | 67 (2.3%) | 85 (3.4%) |
| 80 to 84 Years | 108 (3.6%) | 25 (1.0%) |
| 85 Years and over | 21 (0.7%) | 80 (3.2%) |
| Total | 2,966 (100.0%) | 2,512 (100.0%) |
Families and Households in McGregor
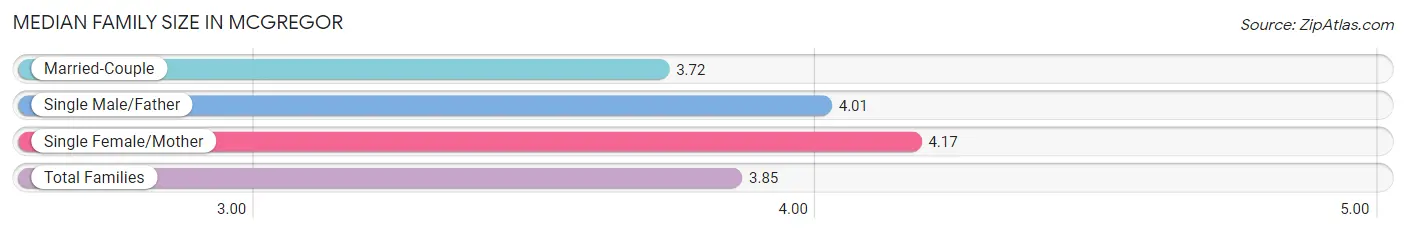
Median Family Size in McGregor
The median family size in McGregor is 3.85 persons per family, with single female/mother families (249 | 21.3%) accounting for the largest median family size of 4.17 persons per family. On the other hand, married-couple families (809 | 69.2%) represent the smallest median family size with 3.72 persons per family.
| Family Type | # Families | Family Size |
| Married-Couple | 809 (69.2%) | 3.72 |
| Single Male/Father | 112 (9.6%) | 4.01 |
| Single Female/Mother | 249 (21.3%) | 4.17 |
| Total Families | 1,170 (100.0%) | 3.85 |
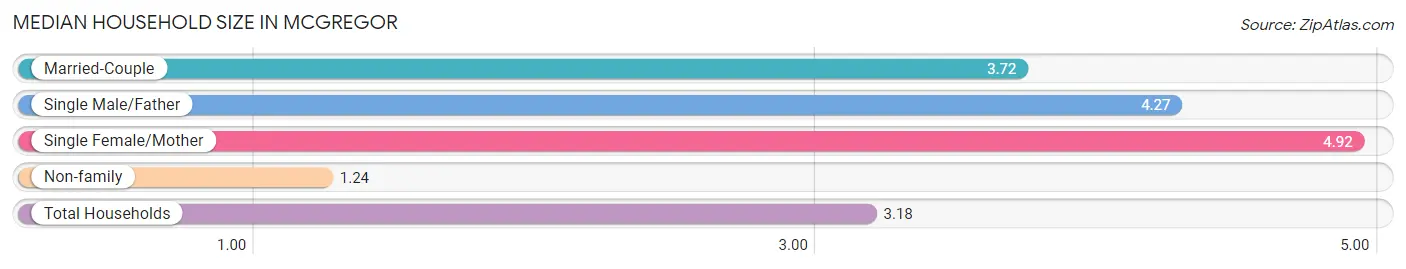
Median Household Size in McGregor
The median household size in McGregor is 3.18 persons per household, with single female/mother households (249 | 14.8%) accounting for the largest median household size of 4.92 persons per household. non-family households (509 | 30.3%) represent the smallest median household size with 1.24 persons per household.
| Household Type | # Households | Household Size |
| Married-Couple | 809 (48.2%) | 3.72 |
| Single Male/Father | 112 (6.7%) | 4.27 |
| Single Female/Mother | 249 (14.8%) | 4.92 |
| Non-family | 509 (30.3%) | 1.24 |
| Total Households | 1,679 (100.0%) | 3.18 |
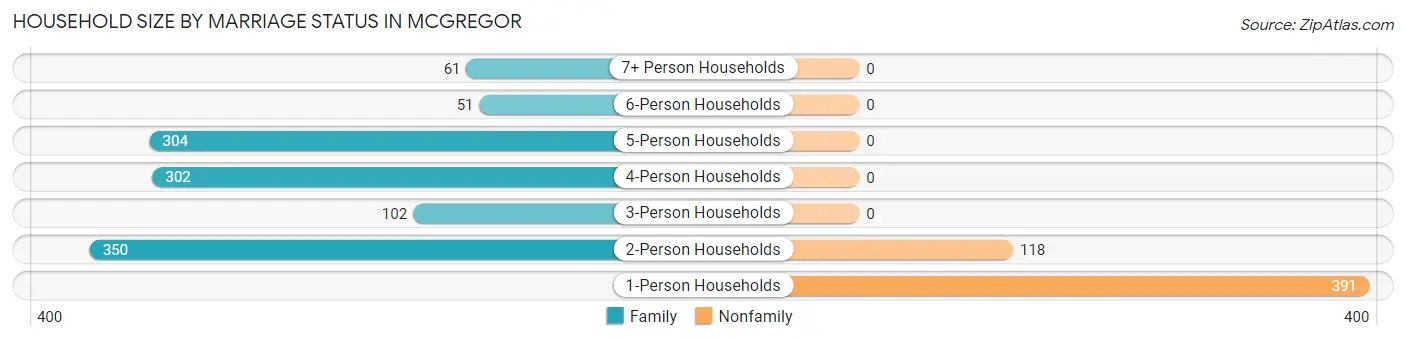
Household Size by Marriage Status in McGregor
Out of a total of 1,679 households in McGregor, 1,170 (69.7%) are family households, while 509 (30.3%) are nonfamily households. The most numerous type of family households are 2-person households, comprising 350, and the most common type of nonfamily households are 1-person households, comprising 391.
| Household Size | Family Households | Nonfamily Households |
| 1-Person Households | - | 391 (23.3%) |
| 2-Person Households | 350 (20.8%) | 118 (7.0%) |
| 3-Person Households | 102 (6.1%) | 0 (0.0%) |
| 4-Person Households | 302 (18.0%) | 0 (0.0%) |
| 5-Person Households | 304 (18.1%) | 0 (0.0%) |
| 6-Person Households | 51 (3.0%) | 0 (0.0%) |
| 7+ Person Households | 61 (3.6%) | 0 (0.0%) |
| Total | 1,170 (69.7%) | 509 (30.3%) |
Female Fertility in McGregor
Fertility by Age in McGregor
Average fertility rate in McGregor is 149.0 births per 1,000 women. Women in the age bracket of 15 to 19 years have the highest fertility rate with 287.0 births per 1,000 women. Women in the age bracket of 20 to 34 years acount for 53.7% of all women with births.
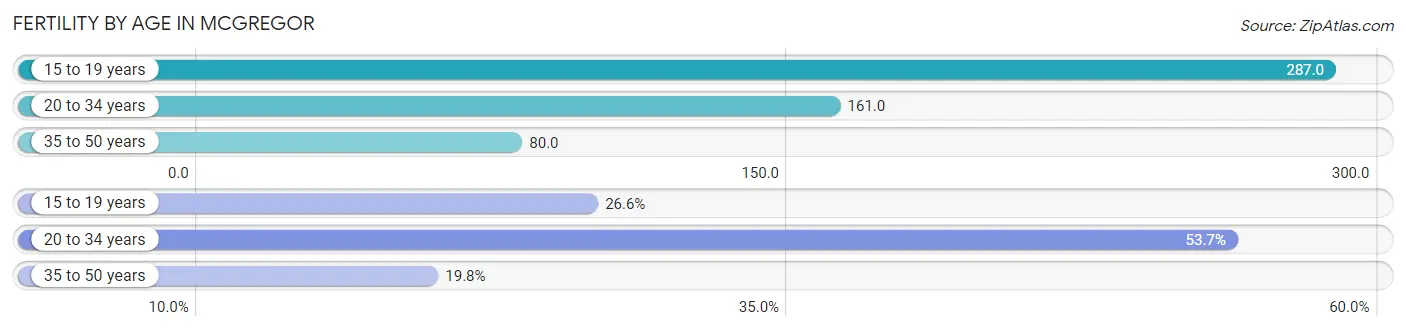
| Age Bracket | Women with Births | Births / 1,000 Women |
| 15 to 19 years | 47 (26.6%) | 287.0 |
| 20 to 34 years | 95 (53.7%) | 161.0 |
| 35 to 50 years | 35 (19.8%) | 80.0 |
| Total | 177 (100.0%) | 149.0 |
Fertility by Age by Marriage Status in McGregor
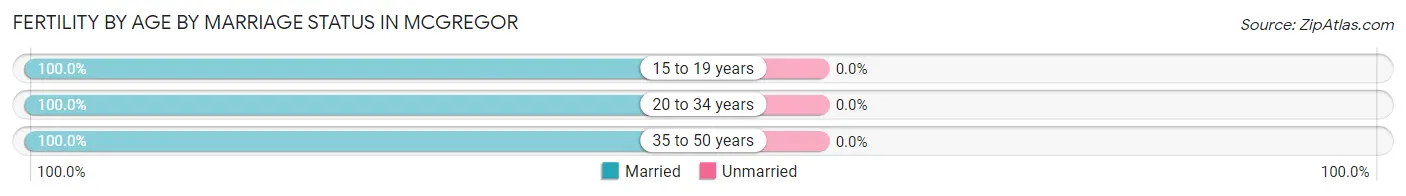
| Age Bracket | Married | Unmarried |
| 15 to 19 years | 47 (100.0%) | 0 (0.0%) |
| 20 to 34 years | 95 (100.0%) | 0 (0.0%) |
| 35 to 50 years | 35 (100.0%) | 0 (0.0%) |
| Total | 177 (100.0%) | 0 (0.0%) |
Fertility by Education in McGregor
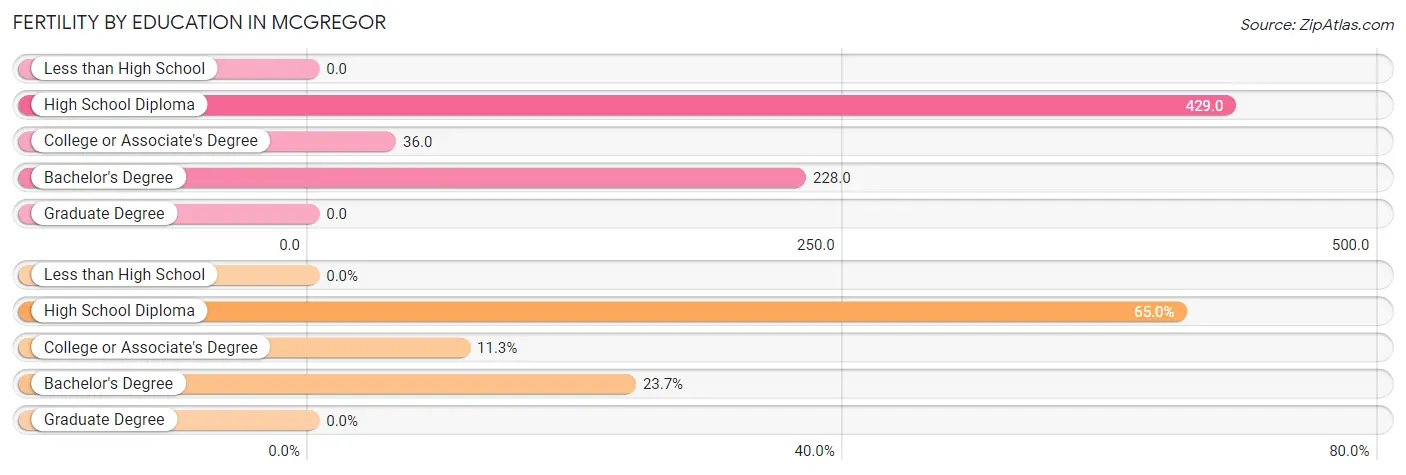
| Educational Attainment | Women with Births | Births / 1,000 Women |
| Less than High School | 0 (0.0%) | 0.0 |
| High School Diploma | 115 (65.0%) | 429.0 |
| College or Associate's Degree | 20 (11.3%) | 36.0 |
| Bachelor's Degree | 42 (23.7%) | 228.0 |
| Graduate Degree | 0 (0.0%) | 0.0 |
| Total | 177 (100.0%) | 149.0 |
Fertility by Education by Marriage Status in McGregor
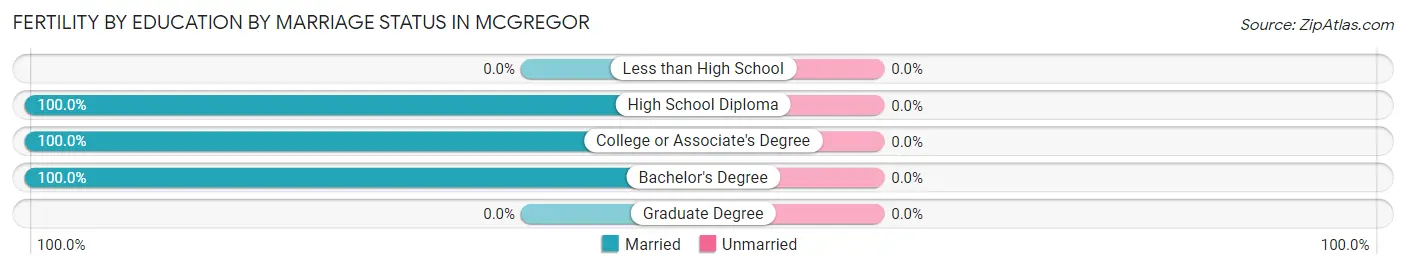
| Educational Attainment | Married | Unmarried |
| Less than High School | 0 (0.0%) | 0 (0.0%) |
| High School Diploma | 115 (100.0%) | 0 (0.0%) |
| College or Associate's Degree | 20 (100.0%) | 0 (0.0%) |
| Bachelor's Degree | 42 (100.0%) | 0 (0.0%) |
| Graduate Degree | 0 (0.0%) | 0 (0.0%) |
| Total | 177 (100.0%) | 0 (0.0%) |
Income in McGregor
Income Overview in McGregor
Per Capita Income in McGregor is $29,071, while median incomes of families and households are $82,115 and $69,677 respectively.
| Characteristic | Number | Measure |
| Per Capita Income | 5,478 | $29,071 |
| Median Family Income | 1,170 | $82,115 |
| Mean Family Income | 1,170 | $103,419 |
| Median Household Income | 1,679 | $69,677 |
| Mean Household Income | 1,679 | $92,030 |
| Income Deficit | 1,170 | $0 |
| Wage / Income Gap (%) | 5,478 | 43.75% |
| Wage / Income Gap ($) | 5,478 | 56.25¢ per $1 |
| Gini / Inequality Index | 5,478 | 0.46 |
Earnings by Sex in McGregor
Average Earnings in McGregor are $36,145, $45,625 for men and $25,664 for women, a difference of 43.8%.
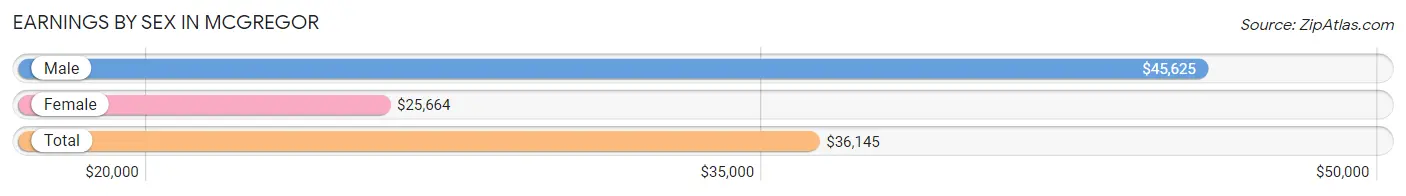
| Sex | Number | Average Earnings |
| Male | 1,596 (58.5%) | $45,625 |
| Female | 1,131 (41.5%) | $25,664 |
| Total | 2,727 (100.0%) | $36,145 |
Earnings by Sex by Income Bracket in McGregor
The most common earnings brackets in McGregor are $75,000 to $99,999 for men (335 | 21.0%) and $2,500 to $4,999 for women (157 | 13.9%).
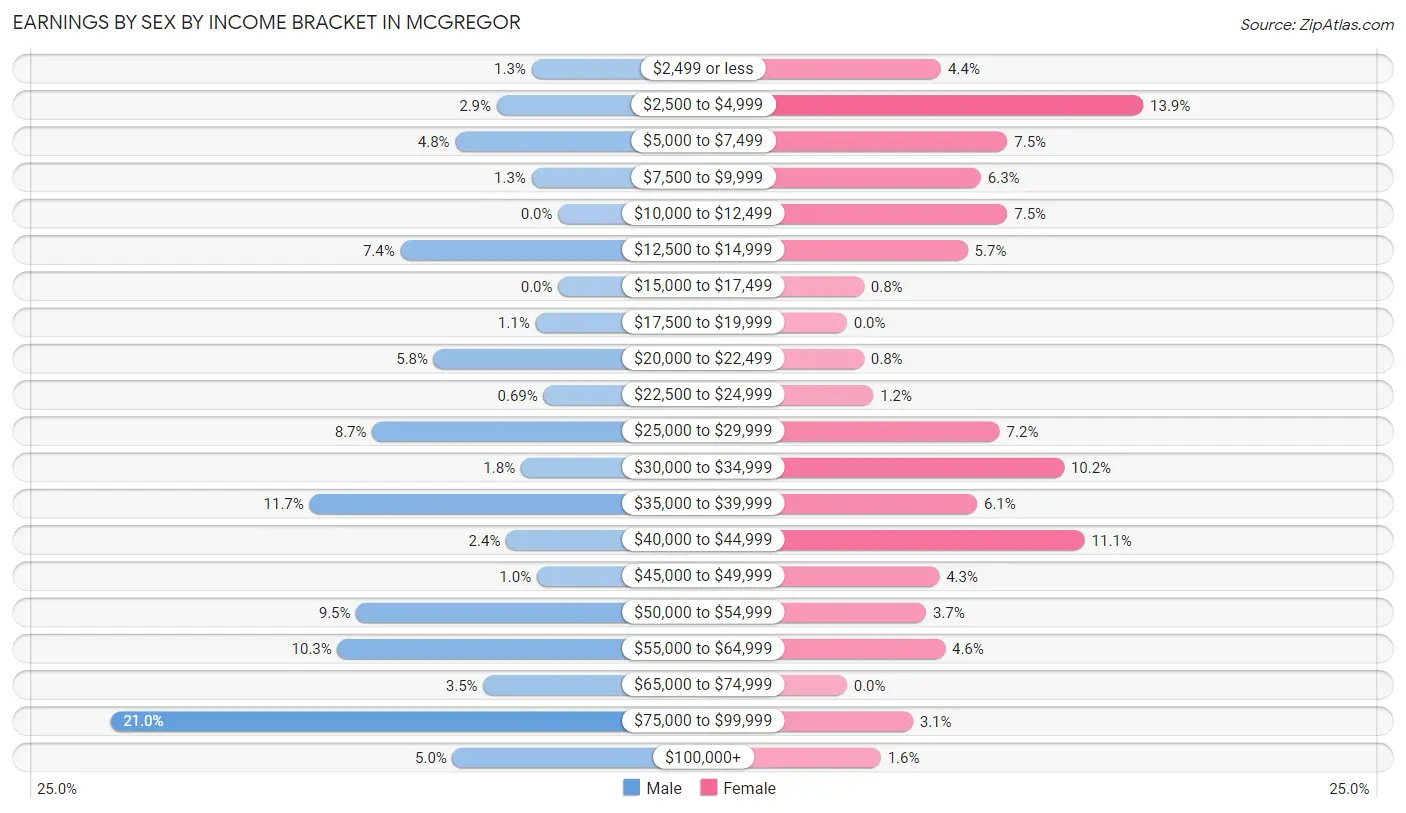
| Income | Male | Female |
| $2,499 or less | 20 (1.3%) | 50 (4.4%) |
| $2,500 to $4,999 | 46 (2.9%) | 157 (13.9%) |
| $5,000 to $7,499 | 77 (4.8%) | 85 (7.5%) |
| $7,500 to $9,999 | 20 (1.3%) | 71 (6.3%) |
| $10,000 to $12,499 | 0 (0.0%) | 85 (7.5%) |
| $12,500 to $14,999 | 118 (7.4%) | 64 (5.7%) |
| $15,000 to $17,499 | 0 (0.0%) | 9 (0.8%) |
| $17,500 to $19,999 | 17 (1.1%) | 0 (0.0%) |
| $20,000 to $22,499 | 93 (5.8%) | 9 (0.8%) |
| $22,500 to $24,999 | 11 (0.7%) | 14 (1.2%) |
| $25,000 to $29,999 | 139 (8.7%) | 81 (7.2%) |
| $30,000 to $34,999 | 28 (1.8%) | 115 (10.2%) |
| $35,000 to $39,999 | 186 (11.7%) | 69 (6.1%) |
| $40,000 to $44,999 | 39 (2.4%) | 126 (11.1%) |
| $45,000 to $49,999 | 16 (1.0%) | 49 (4.3%) |
| $50,000 to $54,999 | 151 (9.5%) | 42 (3.7%) |
| $55,000 to $64,999 | 165 (10.3%) | 52 (4.6%) |
| $65,000 to $74,999 | 56 (3.5%) | 0 (0.0%) |
| $75,000 to $99,999 | 335 (21.0%) | 35 (3.1%) |
| $100,000+ | 79 (5.0%) | 18 (1.6%) |
| Total | 1,596 (100.0%) | 1,131 (100.0%) |
Earnings by Sex by Educational Attainment in McGregor
Average earnings in McGregor are $51,641 for men and $25,895 for women, a difference of 49.9%. Men with an educational attainment of college or associate's degree enjoy the highest average annual earnings of $67,198, while those with high school diploma education earn the least with $43,750. Women with an educational attainment of bachelor's degree earn the most with the average annual earnings of $39,528, while those with bachelor's degree education have the smallest earnings of $39,528.
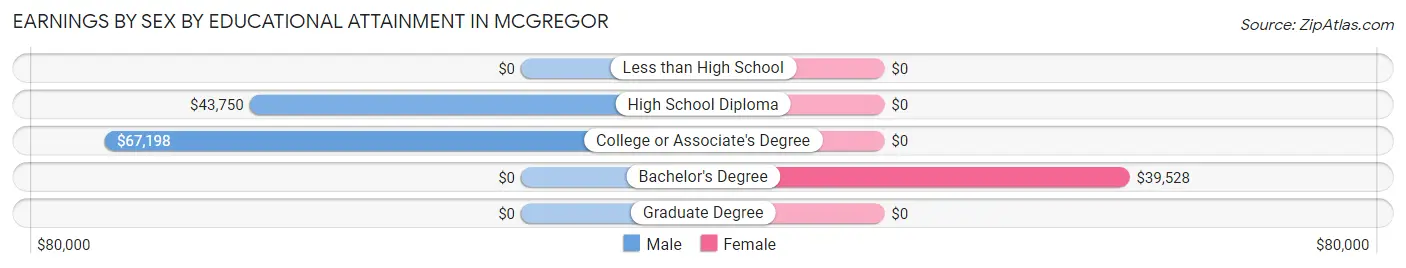
| Educational Attainment | Male Income | Female Income |
| Less than High School | - | - |
| High School Diploma | $43,750 | $0 |
| College or Associate's Degree | $67,198 | $0 |
| Bachelor's Degree | - | - |
| Graduate Degree | - | - |
| Total | $51,641 | $25,895 |
Family Income in McGregor
Family Income Brackets in McGregor
According to the McGregor family income data, there are 253 families falling into the $100,000 to $149,999 income range, which is the most common income bracket and makes up 21.6% of all families.
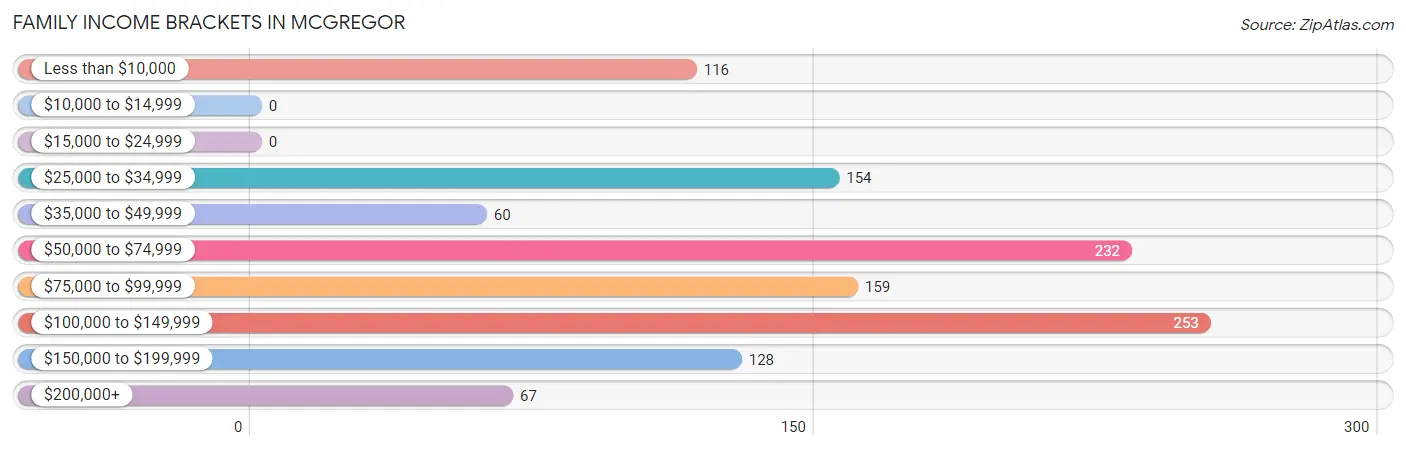
| Income Bracket | # Families | % Families |
| Less than $10,000 | 116 | 9.9% |
| $10,000 to $14,999 | 0 | 0.0% |
| $15,000 to $24,999 | 0 | 0.0% |
| $25,000 to $34,999 | 154 | 13.2% |
| $35,000 to $49,999 | 60 | 5.1% |
| $50,000 to $74,999 | 232 | 19.8% |
| $75,000 to $99,999 | 159 | 13.6% |
| $100,000 to $149,999 | 253 | 21.6% |
| $150,000 to $199,999 | 128 | 10.9% |
| $200,000+ | 67 | 5.7% |
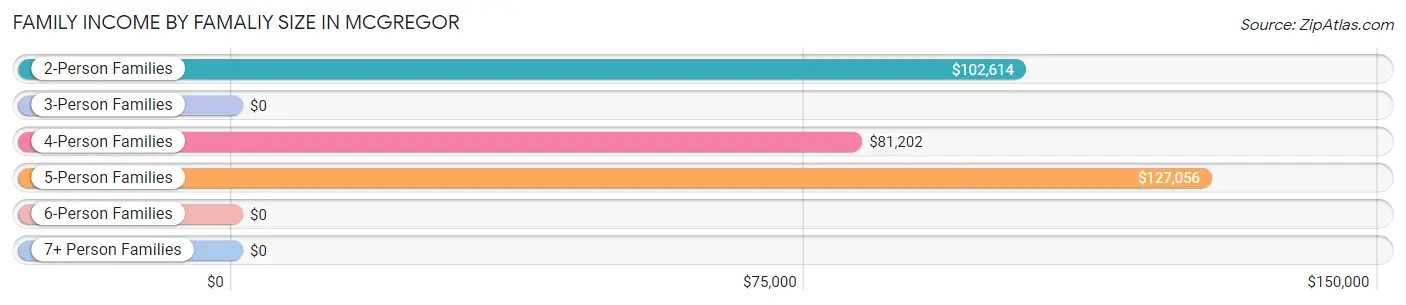
Family Income by Famaliy Size in McGregor
5-person families (168 | 14.4%) account for the highest median family income in McGregor with $127,056 per family, while 2-person families (350 | 29.9%) have the highest median income of $51,307 per family member.
| Income Bracket | # Families | Median Income |
| 2-Person Families | 350 (29.9%) | $102,614 |
| 3-Person Families | 159 (13.6%) | $0 |
| 4-Person Families | 381 (32.6%) | $81,202 |
| 5-Person Families | 168 (14.4%) | $127,056 |
| 6-Person Families | 51 (4.4%) | $0 |
| 7+ Person Families | 61 (5.2%) | $0 |
| Total | 1,170 (100.0%) | $82,115 |
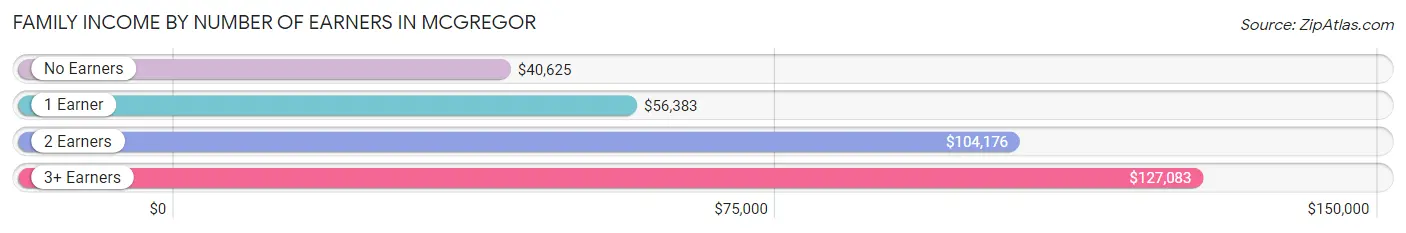
Family Income by Number of Earners in McGregor
The median family income in McGregor is $82,115, with families comprising 3+ earners (255) having the highest median family income of $127,083, while families with no earners (208) have the lowest median family income of $40,625, accounting for 21.8% and 17.8% of families, respectively.
| Number of Earners | # Families | Median Income |
| No Earners | 208 (17.8%) | $40,625 |
| 1 Earner | 356 (30.4%) | $56,383 |
| 2 Earners | 351 (30.0%) | $104,176 |
| 3+ Earners | 255 (21.8%) | $127,083 |
| Total | 1,170 (100.0%) | $82,115 |
Household Income in McGregor
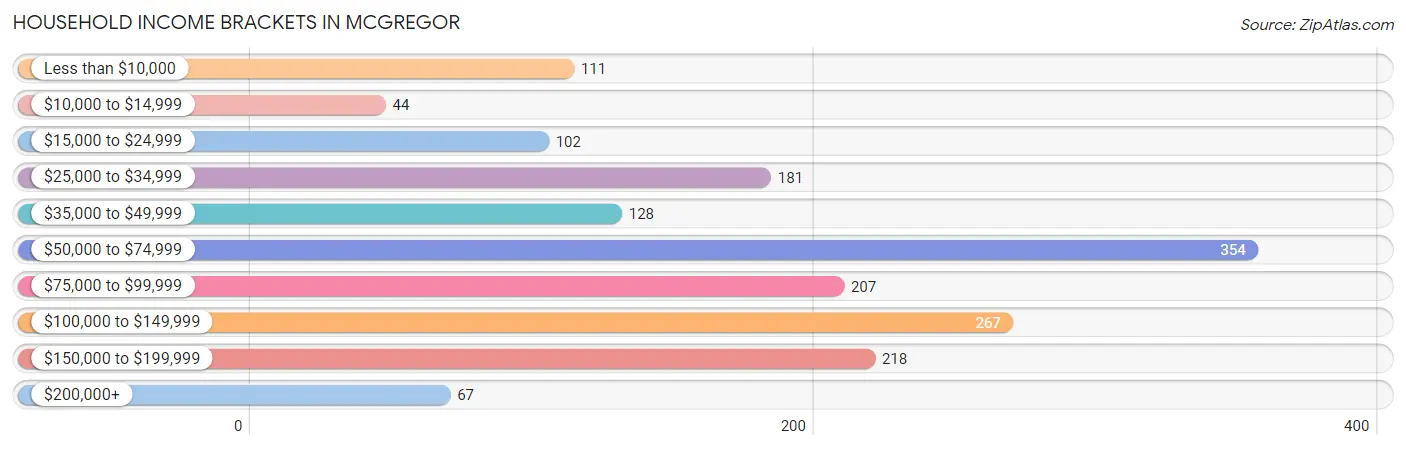
Household Income Brackets in McGregor
With 354 households falling in the category, the $50,000 to $74,999 income range is the most frequent in McGregor, accounting for 21.1% of all households. In contrast, only 44 households (2.6%) fall into the $10,000 to $14,999 income bracket, making it the least populous group.
| Income Bracket | # Households | % Households |
| Less than $10,000 | 111 | 6.6% |
| $10,000 to $14,999 | 44 | 2.6% |
| $15,000 to $24,999 | 102 | 6.1% |
| $25,000 to $34,999 | 181 | 10.8% |
| $35,000 to $49,999 | 128 | 7.6% |
| $50,000 to $74,999 | 354 | 21.1% |
| $75,000 to $99,999 | 207 | 12.3% |
| $100,000 to $149,999 | 267 | 15.9% |
| $150,000 to $199,999 | 218 | 13.0% |
| $200,000+ | 67 | 4.0% |
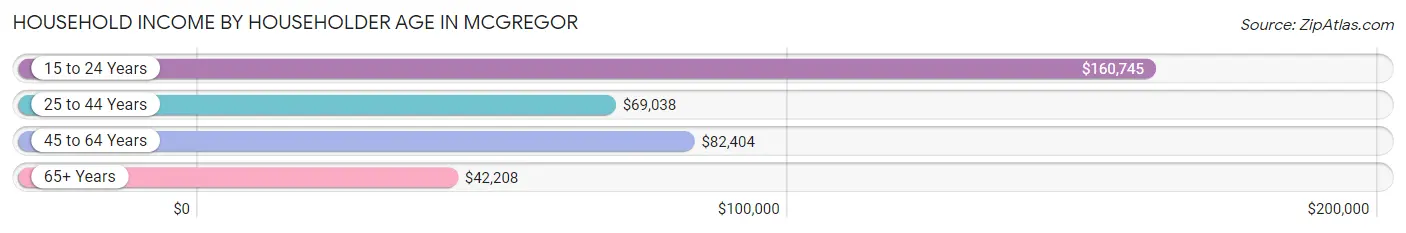
Household Income by Householder Age in McGregor
The median household income in McGregor is $69,677, with the highest median household income of $160,745 found in the 15 to 24 years age bracket for the primary householder. A total of 92 households (5.5%) fall into this category. Meanwhile, the 65+ years age bracket for the primary householder has the lowest median household income of $42,208, with 381 households (22.7%) in this group.
| Income Bracket | # Households | Median Income |
| 15 to 24 Years | 92 (5.5%) | $160,745 |
| 25 to 44 Years | 636 (37.9%) | $69,038 |
| 45 to 64 Years | 570 (34.0%) | $82,404 |
| 65+ Years | 381 (22.7%) | $42,208 |
| Total | 1,679 (100.0%) | $69,677 |
Poverty in McGregor
Income Below Poverty by Sex and Age in McGregor
With 13.1% poverty level for males and 16.8% for females among the residents of McGregor, 16 and 17 year old males and 16 and 17 year old females are the most vulnerable to poverty, with 33 males (35.9%) and 37 females (100.0%) in their respective age groups living below the poverty level.
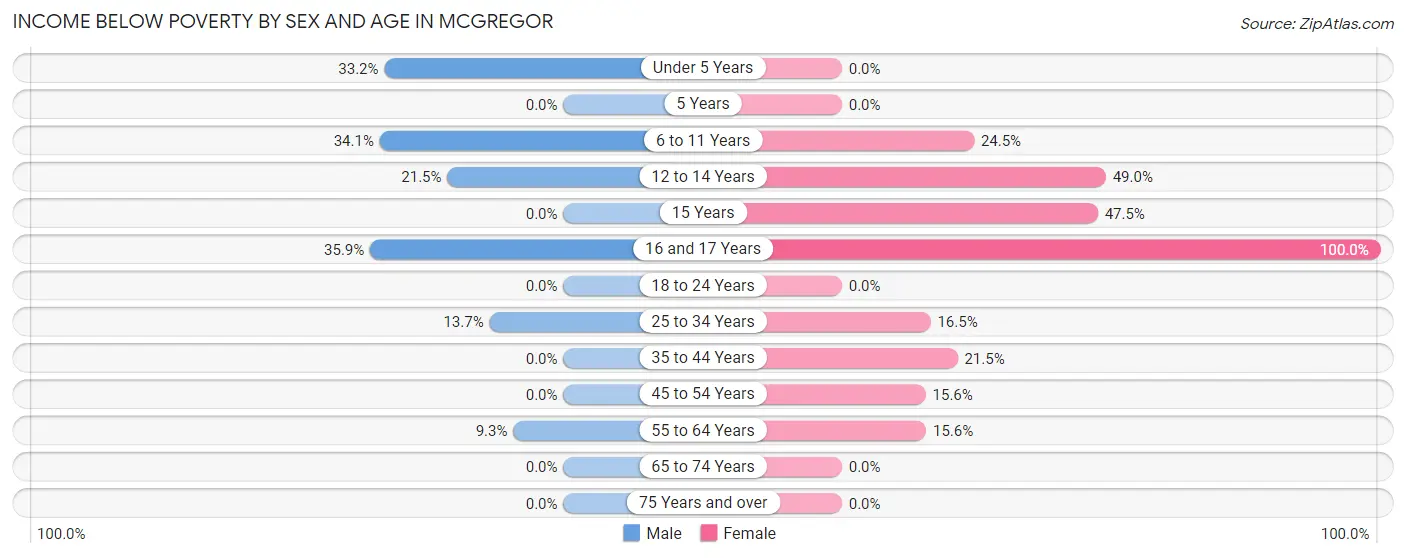
| Age Bracket | Male | Female |
| Under 5 Years | 99 (33.2%) | 0 (0.0%) |
| 5 Years | 0 (0.0%) | 0 (0.0%) |
| 6 to 11 Years | 122 (34.1%) | 39 (24.5%) |
| 12 to 14 Years | 31 (21.5%) | 73 (49.0%) |
| 15 Years | 0 (0.0%) | 38 (47.5%) |
| 16 and 17 Years | 33 (35.9%) | 37 (100.0%) |
| 18 to 24 Years | 0 (0.0%) | 0 (0.0%) |
| 25 to 34 Years | 81 (13.7%) | 81 (16.5%) |
| 35 to 44 Years | 0 (0.0%) | 70 (21.5%) |
| 45 to 54 Years | 0 (0.0%) | 21 (15.6%) |
| 55 to 64 Years | 21 (9.3%) | 43 (15.6%) |
| 65 to 74 Years | 0 (0.0%) | 0 (0.0%) |
| 75 Years and over | 0 (0.0%) | 0 (0.0%) |
| Total | 387 (13.1%) | 402 (16.8%) |
Income Above Poverty by Sex and Age in McGregor
According to the poverty statistics in McGregor, males aged 15 years and females aged under 5 years are the age groups that are most secure financially, with 100.0% of males and 100.0% of females in these age groups living above the poverty line.
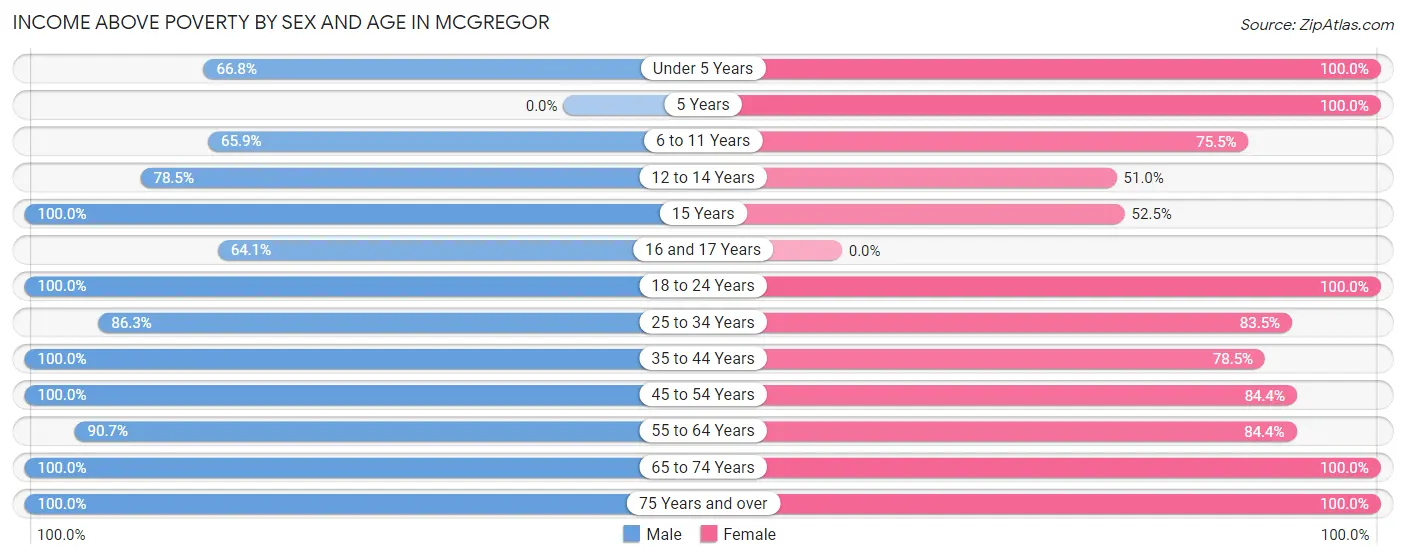
| Age Bracket | Male | Female |
| Under 5 Years | 199 (66.8%) | 81 (100.0%) |
| 5 Years | 0 (0.0%) | 95 (100.0%) |
| 6 to 11 Years | 236 (65.9%) | 120 (75.5%) |
| 12 to 14 Years | 113 (78.5%) | 76 (51.0%) |
| 15 Years | 18 (100.0%) | 42 (52.5%) |
| 16 and 17 Years | 59 (64.1%) | 0 (0.0%) |
| 18 to 24 Years | 188 (100.0%) | 144 (100.0%) |
| 25 to 34 Years | 510 (86.3%) | 411 (83.5%) |
| 35 to 44 Years | 251 (100.0%) | 256 (78.5%) |
| 45 to 54 Years | 392 (100.0%) | 114 (84.4%) |
| 55 to 64 Years | 205 (90.7%) | 232 (84.4%) |
| 65 to 74 Years | 196 (100.0%) | 309 (100.0%) |
| 75 Years and over | 196 (100.0%) | 112 (100.0%) |
| Total | 2,563 (86.9%) | 1,992 (83.2%) |
Income Below Poverty Among Married-Couple Families in McGregor
The poverty statistics for married-couple families in McGregor show that 3.5% or 28 of the total 809 families live below the poverty line. Families with 1 or 2 children have the highest poverty rate of 11.2%, comprising of 28 families. On the other hand, families with no children have the lowest poverty rate of 0.0%, which includes 0 families.
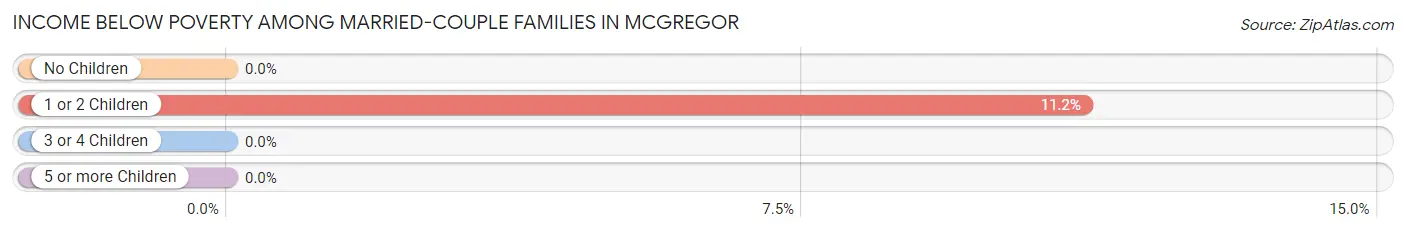
| Children | Above Poverty | Below Poverty |
| No Children | 486 (100.0%) | 0 (0.0%) |
| 1 or 2 Children | 223 (88.8%) | 28 (11.2%) |
| 3 or 4 Children | 11 (100.0%) | 0 (0.0%) |
| 5 or more Children | 61 (100.0%) | 0 (0.0%) |
| Total | 781 (96.5%) | 28 (3.5%) |
Income Below Poverty Among Single-Parent Households in McGregor
According to the poverty data in McGregor, 41.1% or 46 single-father households and 28.1% or 70 single-mother households are living below the poverty line. Among single-father households, those with 3 or 4 children have the highest poverty rate, with 46 households (100.0%) experiencing poverty. Likewise, among single-mother households, those with 3 or 4 children have the highest poverty rate, with 30 households (100.0%) falling below the poverty line.
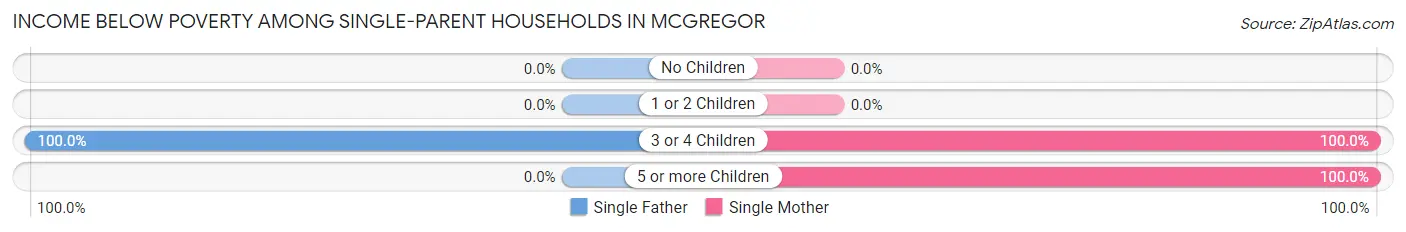
| Children | Single Father | Single Mother |
| No Children | 0 (0.0%) | 0 (0.0%) |
| 1 or 2 Children | 0 (0.0%) | 0 (0.0%) |
| 3 or 4 Children | 46 (100.0%) | 30 (100.0%) |
| 5 or more Children | 0 (0.0%) | 40 (100.0%) |
| Total | 46 (41.1%) | 70 (28.1%) |
Income Below Poverty Among Married-Couple vs Single-Parent Households in McGregor
The poverty data for McGregor shows that 28 of the married-couple family households (3.5%) and 116 of the single-parent households (32.1%) are living below the poverty level. Within the married-couple family households, those with 1 or 2 children have the highest poverty rate, with 28 households (11.2%) falling below the poverty line. Among the single-parent households, those with 3 or 4 children have the highest poverty rate, with 76 household (100.0%) living below poverty.
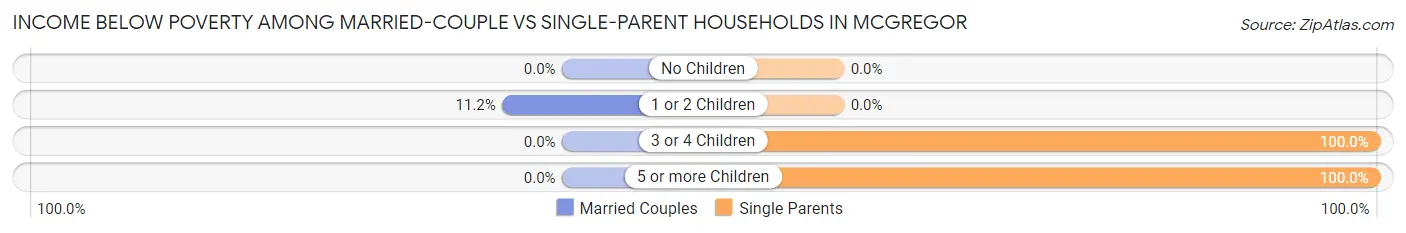
| Children | Married-Couple Families | Single-Parent Households |
| No Children | 0 (0.0%) | 0 (0.0%) |
| 1 or 2 Children | 28 (11.2%) | 0 (0.0%) |
| 3 or 4 Children | 0 (0.0%) | 76 (100.0%) |
| 5 or more Children | 0 (0.0%) | 40 (100.0%) |
| Total | 28 (3.5%) | 116 (32.1%) |
Employment Characteristics in McGregor
Employment by Class of Employer in McGregor
Among the 2,498 employed individuals in McGregor, private company employees (2,049 | 82.0%), local government employees (189 | 7.6%), and not-for-profit organizations (106 | 4.2%) make up the most common classes of employment.
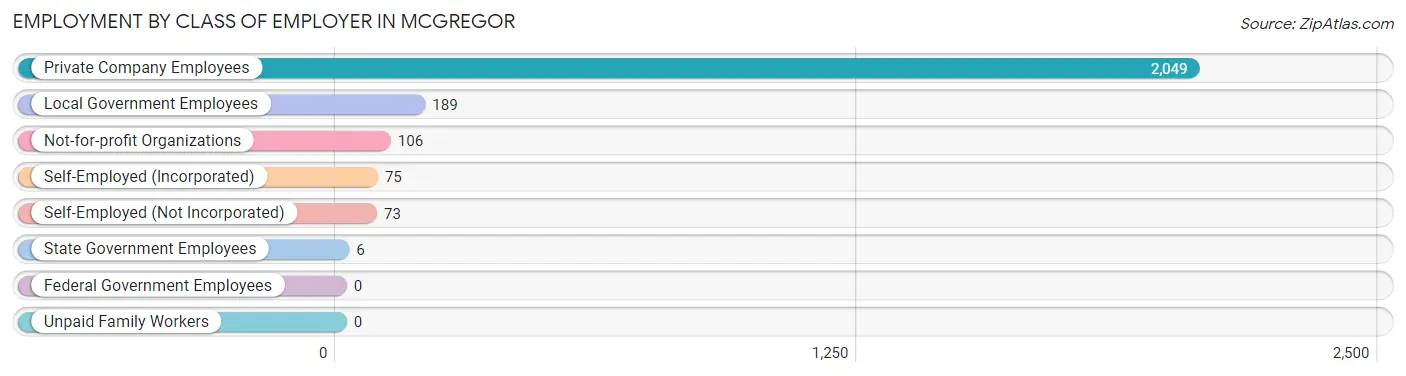
| Employer Class | # Employees | % Employees |
| Private Company Employees | 2,049 | 82.0% |
| Self-Employed (Incorporated) | 75 | 3.0% |
| Self-Employed (Not Incorporated) | 73 | 2.9% |
| Not-for-profit Organizations | 106 | 4.2% |
| Local Government Employees | 189 | 7.6% |
| State Government Employees | 6 | 0.2% |
| Federal Government Employees | 0 | 0.0% |
| Unpaid Family Workers | 0 | 0.0% |
| Total | 2,498 | 100.0% |
Employment Status by Age in McGregor
According to the labor force statistics for McGregor, out of the total population over 16 years of age (4,096), 64.6% or 2,646 individuals are in the labor force, with 4.9% or 130 of them unemployed. The age group with the highest labor force participation rate is 45 to 54 years, with 95.7% or 512 individuals in the labor force. Within the labor force, the 30 to 34 years age range has the highest percentage of unemployed individuals, with 20.0% or 109 of them being unemployed.
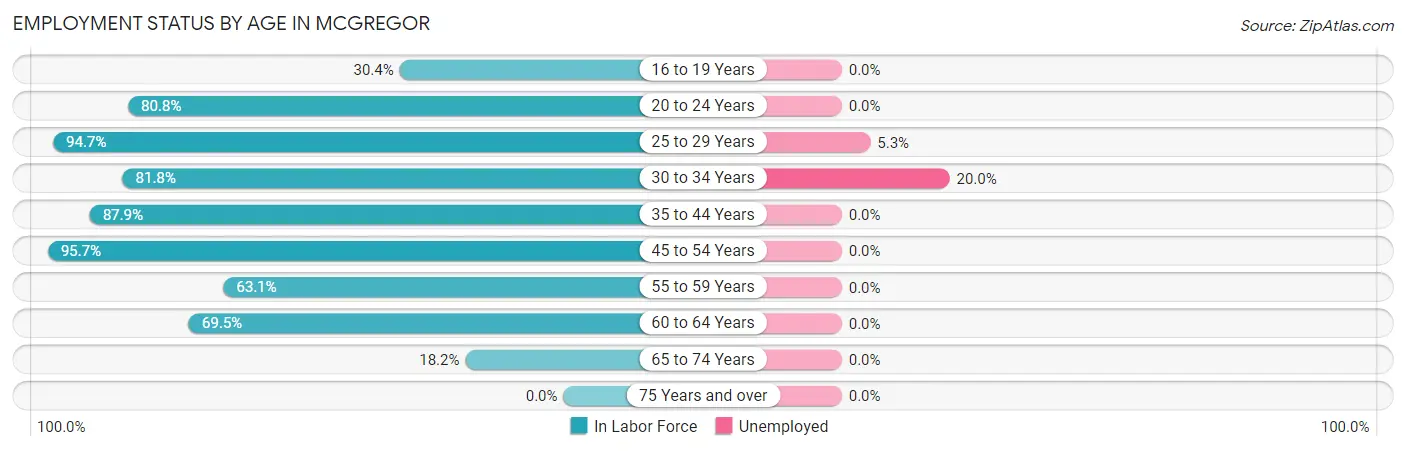
| Age Bracket | In Labor Force | Unemployed |
| 16 to 19 Years | 77 (30.4%) | 0 (0.0%) |
| 20 to 24 Years | 168 (80.8%) | 0 (0.0%) |
| 25 to 29 Years | 396 (94.7%) | 21 (5.3%) |
| 30 to 34 Years | 544 (81.8%) | 109 (20.0%) |
| 35 to 44 Years | 507 (87.9%) | 0 (0.0%) |
| 45 to 54 Years | 512 (95.7%) | 0 (0.0%) |
| 55 to 59 Years | 171 (63.1%) | 0 (0.0%) |
| 60 to 64 Years | 171 (69.5%) | 0 (0.0%) |
| 65 to 74 Years | 98 (18.2%) | 0 (0.0%) |
| 75 Years and over | 0 (0.0%) | 0 (0.0%) |
| Total | 2,646 (64.6%) | 130 (4.9%) |
Employment Status by Educational Attainment in McGregor
According to labor force statistics for McGregor, 84.8% of individuals (2,300) out of the total population between 25 and 64 years of age (2,712) are in the labor force, with 5.6% or 129 of them being unemployed. The group with the highest labor force participation rate are those with the educational attainment of high school diploma, with 89.8% or 1,065 individuals in the labor force. Within the labor force, individuals with high school diploma education have the highest percentage of unemployment, with 10.3% or 110 of them being unemployed.
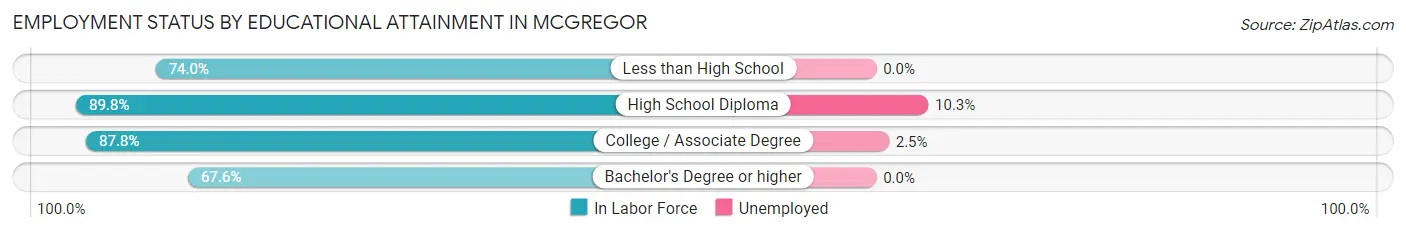
| Educational Attainment | In Labor Force | Unemployed |
| Less than High School | 233 (74.0%) | 0 (0.0%) |
| High School Diploma | 1,065 (89.8%) | 122 (10.3%) |
| College / Associate Degree | 801 (87.8%) | 23 (2.5%) |
| Bachelor's Degree or higher | 202 (67.6%) | 0 (0.0%) |
| Total | 2,300 (84.8%) | 152 (5.6%) |
Employment Occupations by Sex in McGregor
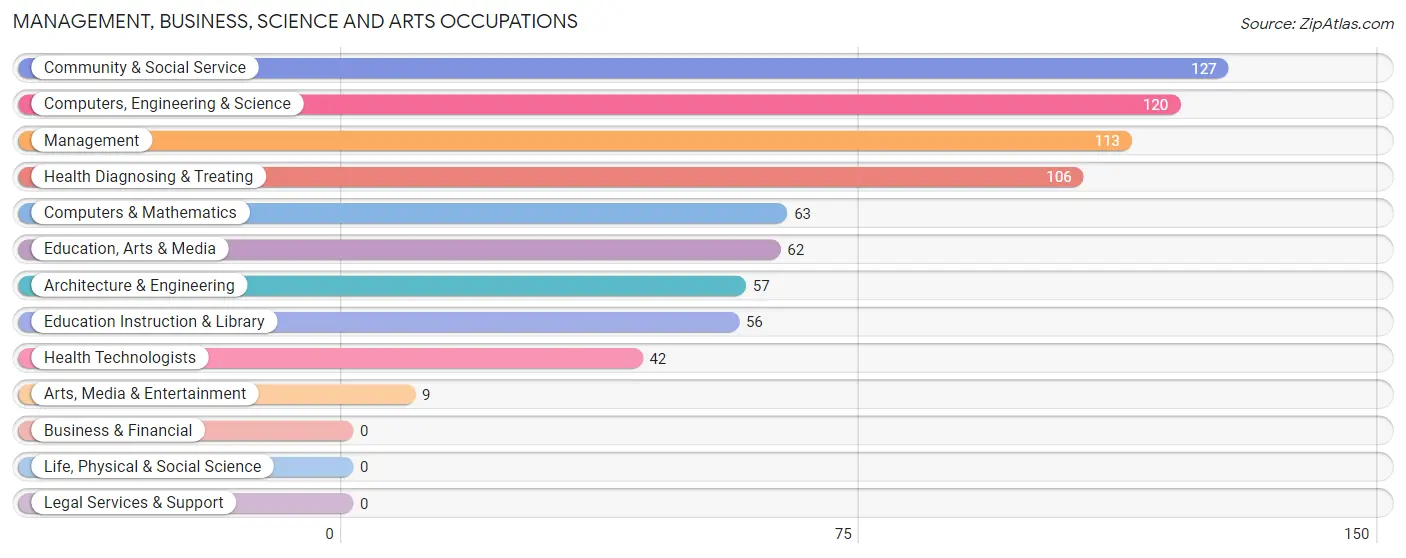
Management, Business, Science and Arts Occupations
The most common Management, Business, Science and Arts occupations in McGregor are Community & Social Service (127 | 5.1%), Computers, Engineering & Science (120 | 4.8%), Management (113 | 4.5%), Health Diagnosing & Treating (106 | 4.2%), and Computers & Mathematics (63 | 2.5%).
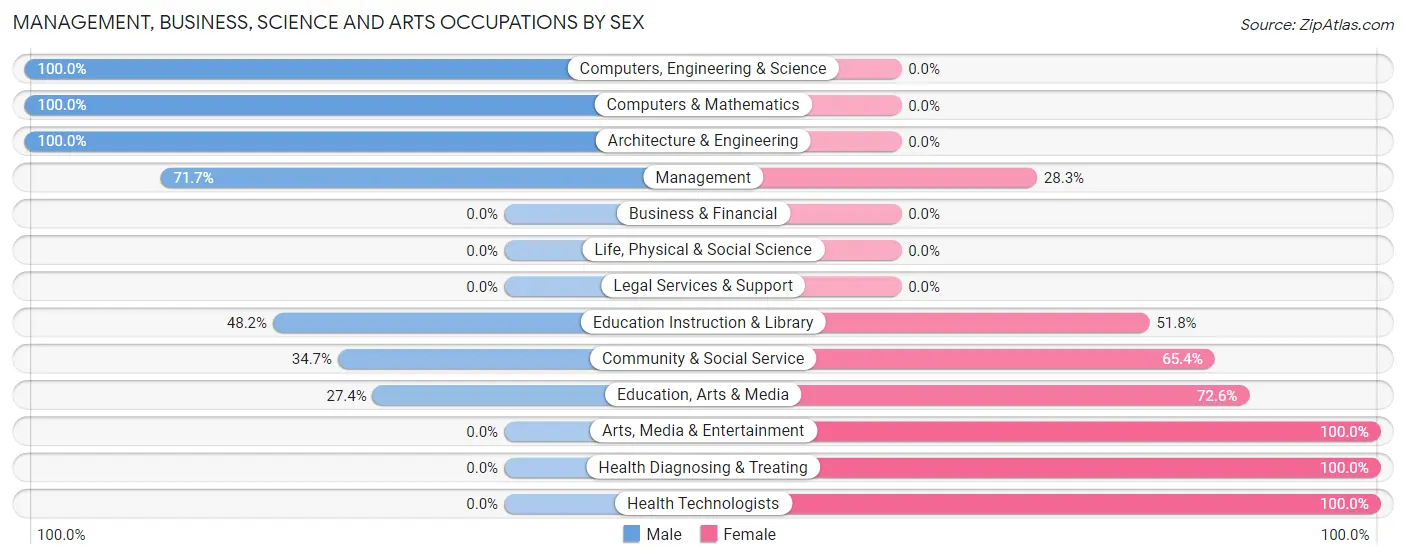
Management, Business, Science and Arts Occupations by Sex
Within the Management, Business, Science and Arts occupations in McGregor, the most male-oriented occupations are Computers, Engineering & Science (100.0%), Computers & Mathematics (100.0%), and Architecture & Engineering (100.0%), while the most female-oriented occupations are Arts, Media & Entertainment (100.0%), Health Diagnosing & Treating (100.0%), and Health Technologists (100.0%).
| Occupation | Male | Female |
| Management | 81 (71.7%) | 32 (28.3%) |
| Business & Financial | 0 (0.0%) | 0 (0.0%) |
| Computers, Engineering & Science | 120 (100.0%) | 0 (0.0%) |
| Computers & Mathematics | 63 (100.0%) | 0 (0.0%) |
| Architecture & Engineering | 57 (100.0%) | 0 (0.0%) |
| Life, Physical & Social Science | 0 (0.0%) | 0 (0.0%) |
| Community & Social Service | 44 (34.6%) | 83 (65.3%) |
| Education, Arts & Media | 17 (27.4%) | 45 (72.6%) |
| Legal Services & Support | 0 (0.0%) | 0 (0.0%) |
| Education Instruction & Library | 27 (48.2%) | 29 (51.8%) |
| Arts, Media & Entertainment | 0 (0.0%) | 9 (100.0%) |
| Health Diagnosing & Treating | 0 (0.0%) | 106 (100.0%) |
| Health Technologists | 0 (0.0%) | 42 (100.0%) |
| Total (Category) | 245 (52.6%) | 221 (47.4%) |
| Total (Overall) | 1,451 (57.7%) | 1,063 (42.3%) |
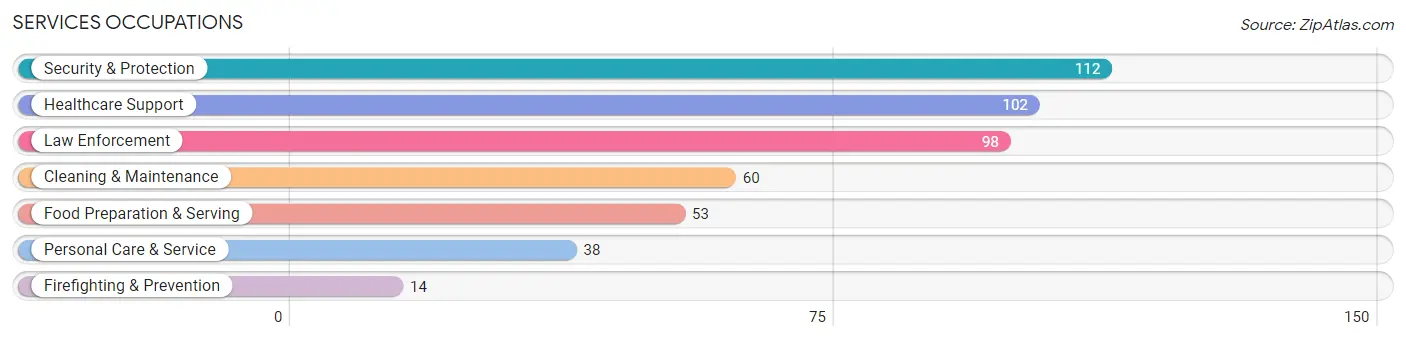
Services Occupations
The most common Services occupations in McGregor are Security & Protection (112 | 4.5%), Healthcare Support (102 | 4.1%), Law Enforcement (98 | 3.9%), Cleaning & Maintenance (60 | 2.4%), and Food Preparation & Serving (53 | 2.1%).
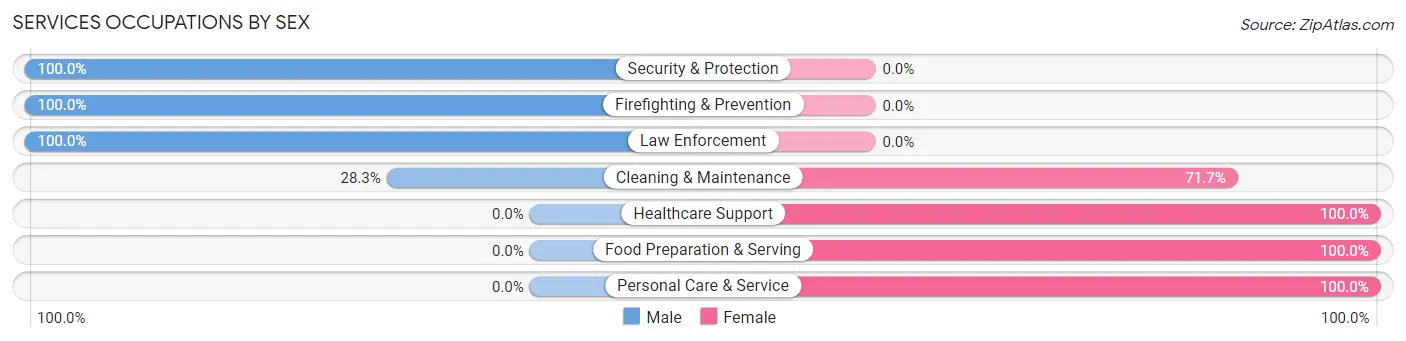
Services Occupations by Sex
Within the Services occupations in McGregor, the most male-oriented occupations are Security & Protection (100.0%), Firefighting & Prevention (100.0%), and Law Enforcement (100.0%), while the most female-oriented occupations are Healthcare Support (100.0%), Food Preparation & Serving (100.0%), and Personal Care & Service (100.0%).
| Occupation | Male | Female |
| Healthcare Support | 0 (0.0%) | 102 (100.0%) |
| Security & Protection | 112 (100.0%) | 0 (0.0%) |
| Firefighting & Prevention | 14 (100.0%) | 0 (0.0%) |
| Law Enforcement | 98 (100.0%) | 0 (0.0%) |
| Food Preparation & Serving | 0 (0.0%) | 53 (100.0%) |
| Cleaning & Maintenance | 17 (28.3%) | 43 (71.7%) |
| Personal Care & Service | 0 (0.0%) | 38 (100.0%) |
| Total (Category) | 129 (35.3%) | 236 (64.7%) |
| Total (Overall) | 1,451 (57.7%) | 1,063 (42.3%) |
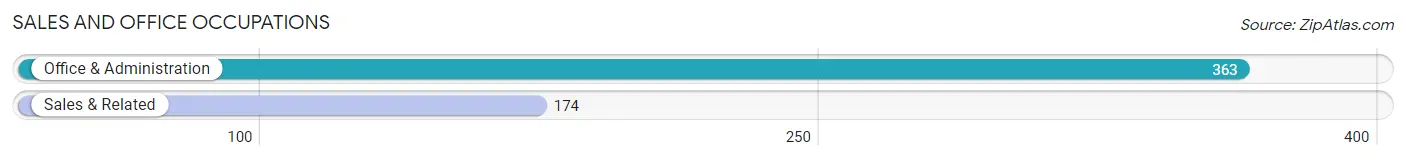
Sales and Office Occupations
The most common Sales and Office occupations in McGregor are Office & Administration (363 | 14.4%), and Sales & Related (174 | 6.9%).
Sales and Office Occupations by Sex
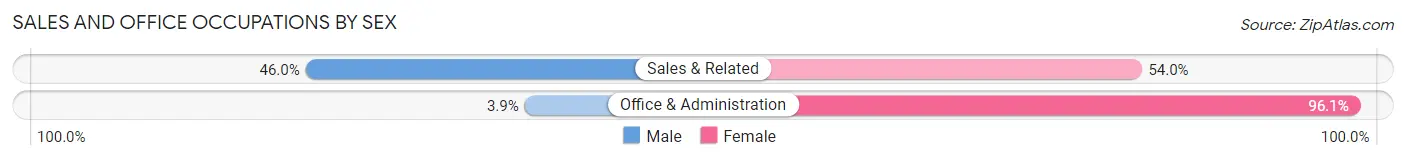
| Occupation | Male | Female |
| Sales & Related | 80 (46.0%) | 94 (54.0%) |
| Office & Administration | 14 (3.9%) | 349 (96.1%) |
| Total (Category) | 94 (17.5%) | 443 (82.5%) |
| Total (Overall) | 1,451 (57.7%) | 1,063 (42.3%) |
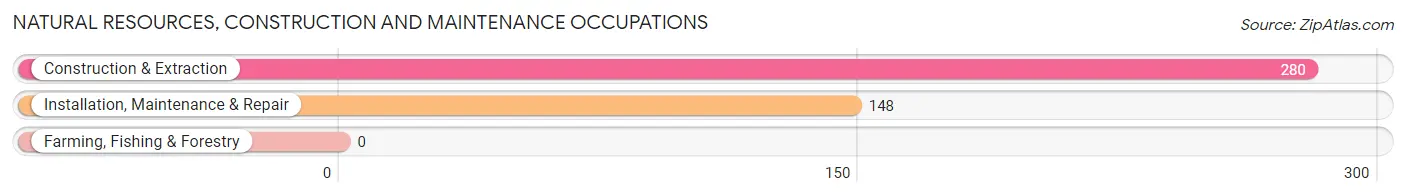
Natural Resources, Construction and Maintenance Occupations
The most common Natural Resources, Construction and Maintenance occupations in McGregor are Construction & Extraction (280 | 11.1%), and Installation, Maintenance & Repair (148 | 5.9%).
Natural Resources, Construction and Maintenance Occupations by Sex
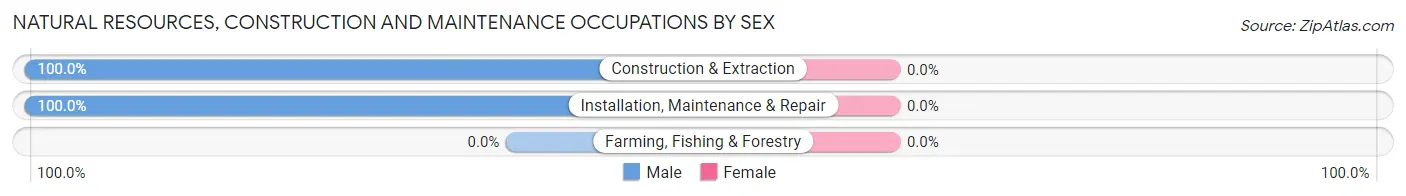
| Occupation | Male | Female |
| Farming, Fishing & Forestry | 0 (0.0%) | 0 (0.0%) |
| Construction & Extraction | 280 (100.0%) | 0 (0.0%) |
| Installation, Maintenance & Repair | 148 (100.0%) | 0 (0.0%) |
| Total (Category) | 428 (100.0%) | 0 (0.0%) |
| Total (Overall) | 1,451 (57.7%) | 1,063 (42.3%) |
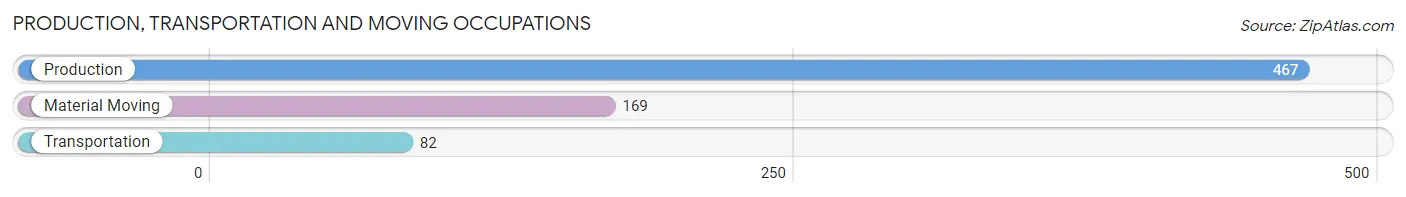
Production, Transportation and Moving Occupations
The most common Production, Transportation and Moving occupations in McGregor are Production (467 | 18.6%), Material Moving (169 | 6.7%), and Transportation (82 | 3.3%).
Production, Transportation and Moving Occupations by Sex
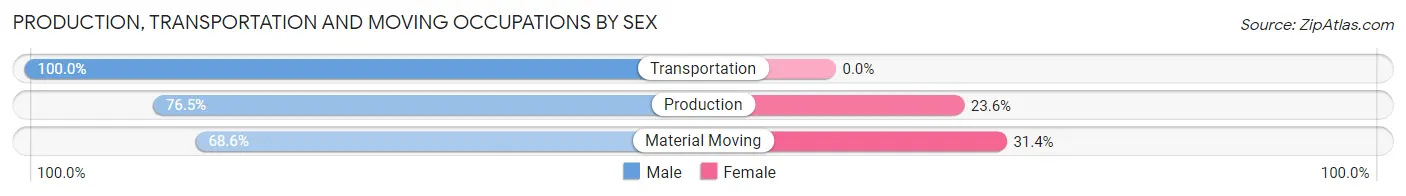
| Occupation | Male | Female |
| Production | 357 (76.4%) | 110 (23.5%) |
| Transportation | 82 (100.0%) | 0 (0.0%) |
| Material Moving | 116 (68.6%) | 53 (31.4%) |
| Total (Category) | 555 (77.3%) | 163 (22.7%) |
| Total (Overall) | 1,451 (57.7%) | 1,063 (42.3%) |
Employment Industries by Sex in McGregor
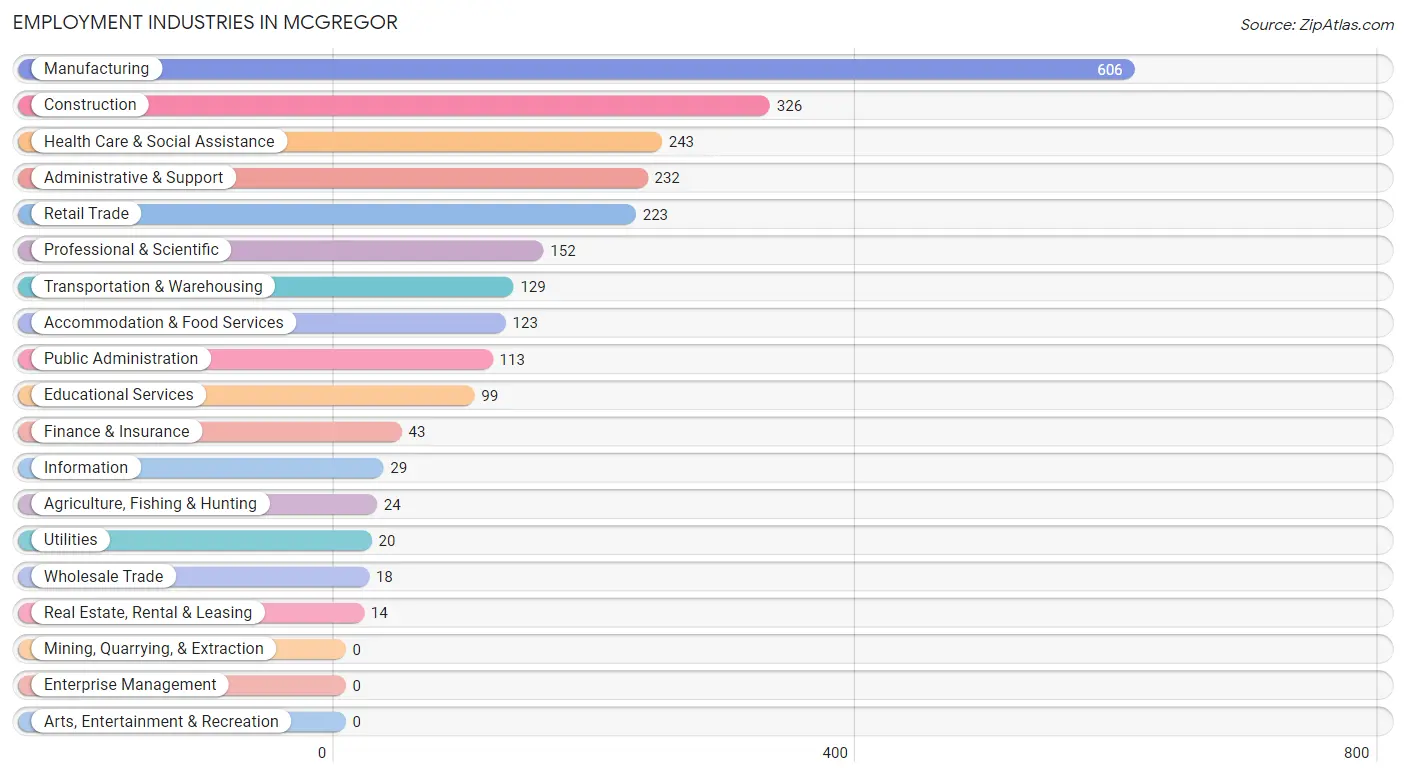
Employment Industries in McGregor
The major employment industries in McGregor include Manufacturing (606 | 24.1%), Construction (326 | 13.0%), Health Care & Social Assistance (243 | 9.7%), Administrative & Support (232 | 9.2%), and Retail Trade (223 | 8.9%).
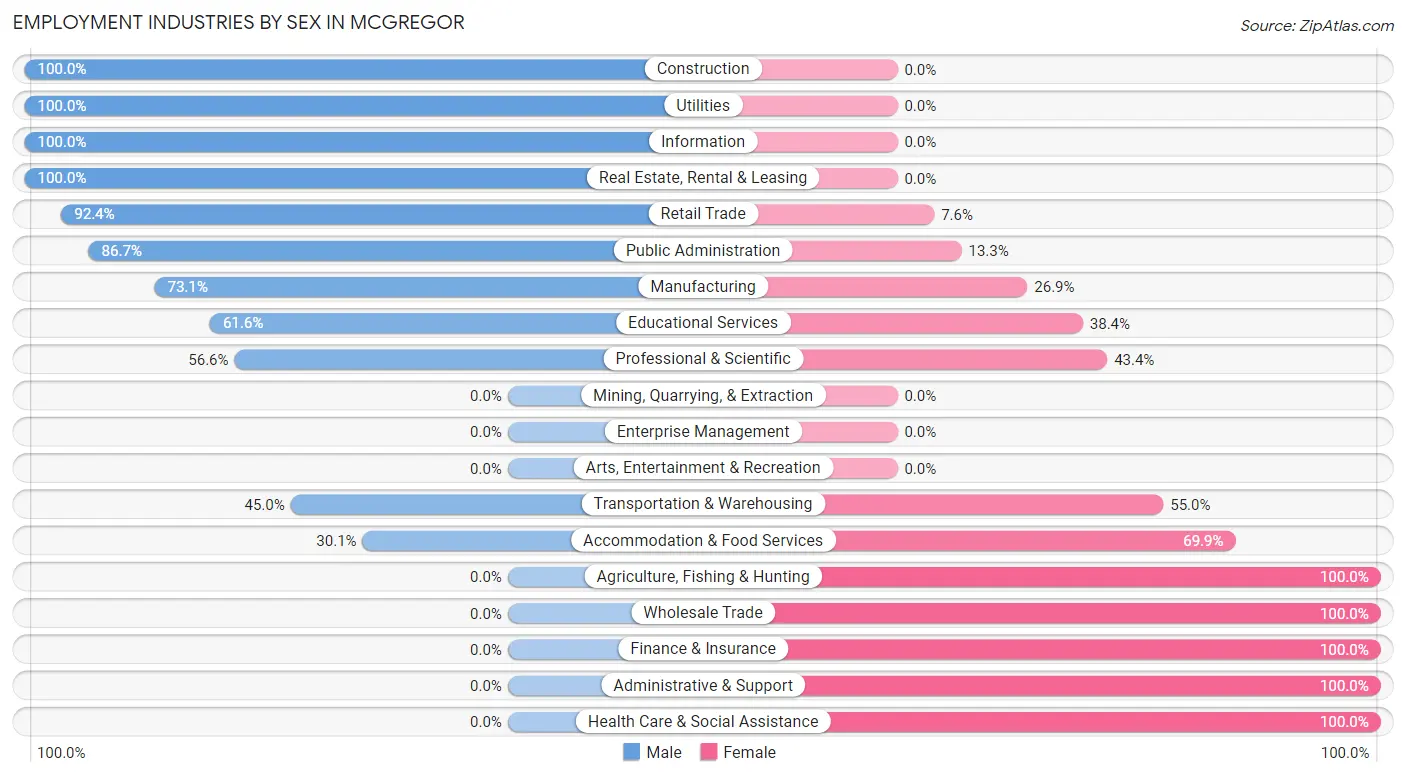
Employment Industries by Sex in McGregor
The McGregor industries that see more men than women are Construction (100.0%), Utilities (100.0%), and Information (100.0%), whereas the industries that tend to have a higher number of women are Agriculture, Fishing & Hunting (100.0%), Wholesale Trade (100.0%), and Finance & Insurance (100.0%).
| Industry | Male | Female |
| Agriculture, Fishing & Hunting | 0 (0.0%) | 24 (100.0%) |
| Mining, Quarrying, & Extraction | 0 (0.0%) | 0 (0.0%) |
| Construction | 326 (100.0%) | 0 (0.0%) |
| Manufacturing | 443 (73.1%) | 163 (26.9%) |
| Wholesale Trade | 0 (0.0%) | 18 (100.0%) |
| Retail Trade | 206 (92.4%) | 17 (7.6%) |
| Transportation & Warehousing | 58 (45.0%) | 71 (55.0%) |
| Utilities | 20 (100.0%) | 0 (0.0%) |
| Information | 29 (100.0%) | 0 (0.0%) |
| Finance & Insurance | 0 (0.0%) | 43 (100.0%) |
| Real Estate, Rental & Leasing | 14 (100.0%) | 0 (0.0%) |
| Professional & Scientific | 86 (56.6%) | 66 (43.4%) |
| Enterprise Management | 0 (0.0%) | 0 (0.0%) |
| Administrative & Support | 0 (0.0%) | 232 (100.0%) |
| Educational Services | 61 (61.6%) | 38 (38.4%) |
| Health Care & Social Assistance | 0 (0.0%) | 243 (100.0%) |
| Arts, Entertainment & Recreation | 0 (0.0%) | 0 (0.0%) |
| Accommodation & Food Services | 37 (30.1%) | 86 (69.9%) |
| Public Administration | 98 (86.7%) | 15 (13.3%) |
| Total | 1,451 (57.7%) | 1,063 (42.3%) |
Education in McGregor
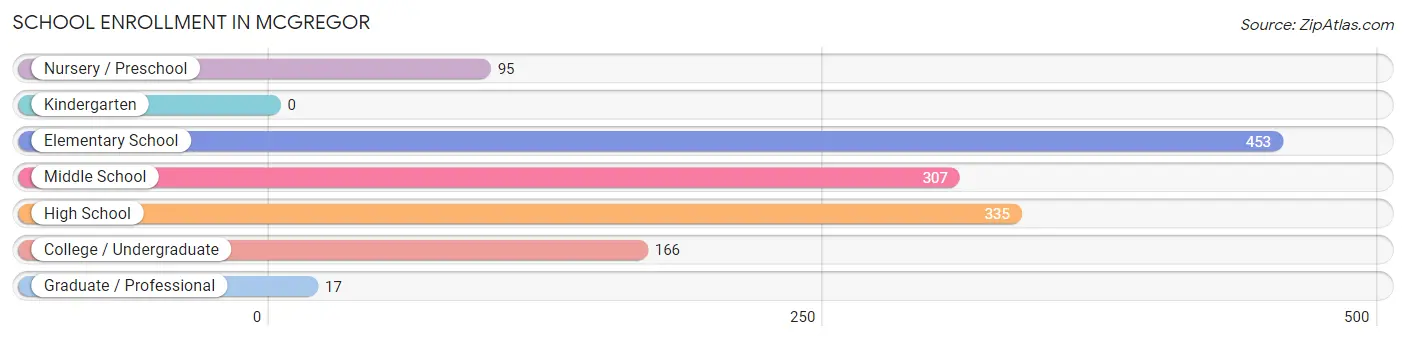
School Enrollment in McGregor
The most common levels of schooling among the 1,373 students in McGregor are elementary school (453 | 33.0%), high school (335 | 24.4%), and middle school (307 | 22.4%).
| School Level | # Students | % Students |
| Nursery / Preschool | 95 | 6.9% |
| Kindergarten | 0 | 0.0% |
| Elementary School | 453 | 33.0% |
| Middle School | 307 | 22.4% |
| High School | 335 | 24.4% |
| College / Undergraduate | 166 | 12.1% |
| Graduate / Professional | 17 | 1.2% |
| Total | 1,373 | 100.0% |
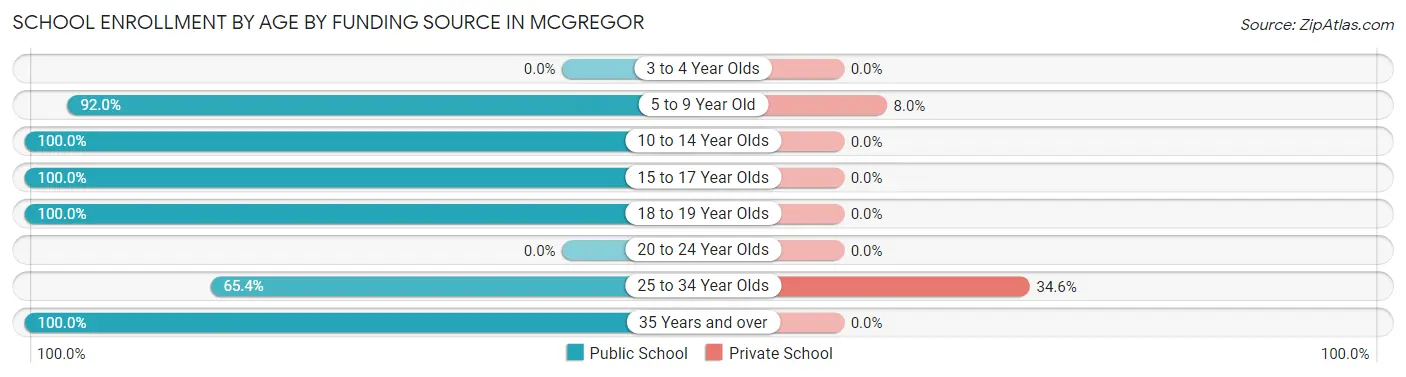
School Enrollment by Age by Funding Source in McGregor
Out of a total of 1,373 students who are enrolled in schools in McGregor, 82 (6.0%) attend a private institution, while the remaining 1,291 (94.0%) are enrolled in public schools. The age group of 25 to 34 year olds has the highest likelihood of being enrolled in private schools, with 45 (34.6% in the age bracket) enrolled. Conversely, the age group of 10 to 14 year olds has the lowest likelihood of being enrolled in a private school, with 423 (100.0% in the age bracket) attending a public institution.
| Age Bracket | Public School | Private School |
| 3 to 4 Year Olds | 0 (0.0%) | 0 (0.0%) |
| 5 to 9 Year Old | 426 (92.0%) | 37 (8.0%) |
| 10 to 14 Year Olds | 423 (100.0%) | 0 (0.0%) |
| 15 to 17 Year Olds | 227 (100.0%) | 0 (0.0%) |
| 18 to 19 Year Olds | 77 (100.0%) | 0 (0.0%) |
| 20 to 24 Year Olds | 0 (0.0%) | 0 (0.0%) |
| 25 to 34 Year Olds | 85 (65.4%) | 45 (34.6%) |
| 35 Years and over | 53 (100.0%) | 0 (0.0%) |
| Total | 1,291 (94.0%) | 82 (6.0%) |
Educational Attainment by Field of Study in McGregor
Education (140 | 31.0%), business (48 | 10.6%), arts & humanities (45 | 10.0%), social sciences (39 | 8.6%), and liberal arts & history (36 | 8.0%) are the most common fields of study among 452 individuals in McGregor who have obtained a bachelor's degree or higher.
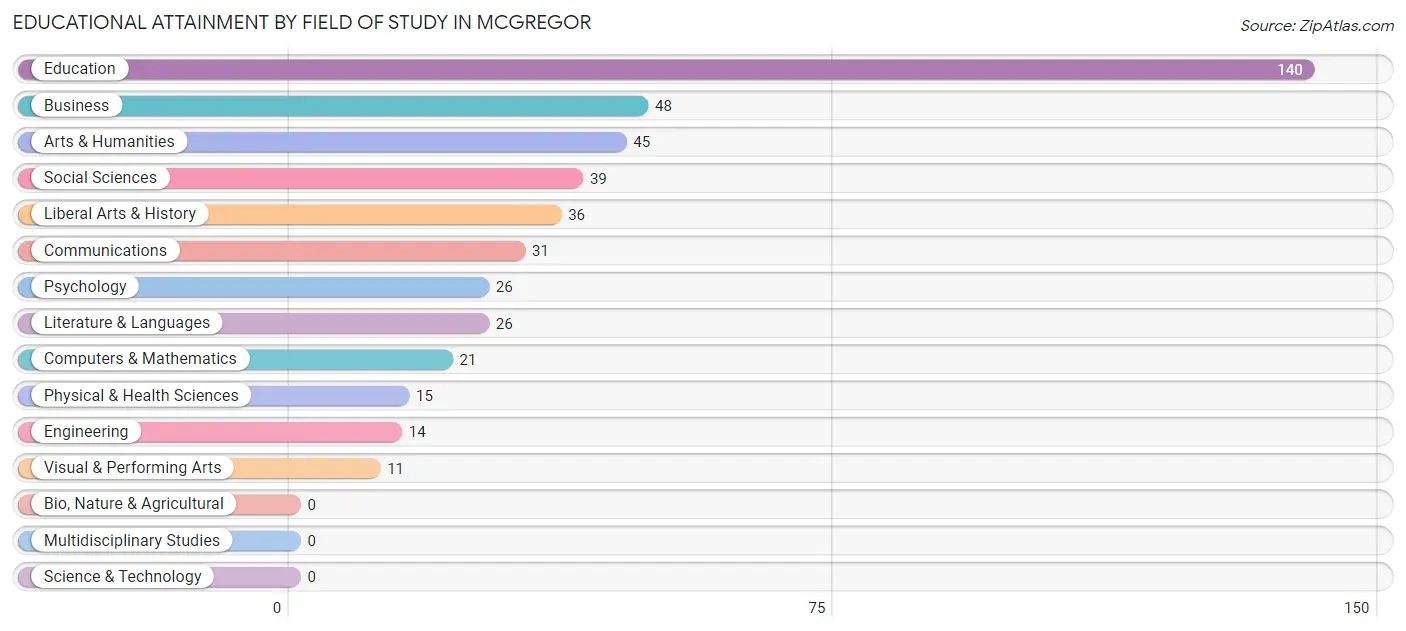
| Field of Study | # Graduates | % Graduates |
| Computers & Mathematics | 21 | 4.6% |
| Bio, Nature & Agricultural | 0 | 0.0% |
| Physical & Health Sciences | 15 | 3.3% |
| Psychology | 26 | 5.8% |
| Social Sciences | 39 | 8.6% |
| Engineering | 14 | 3.1% |
| Multidisciplinary Studies | 0 | 0.0% |
| Science & Technology | 0 | 0.0% |
| Business | 48 | 10.6% |
| Education | 140 | 31.0% |
| Literature & Languages | 26 | 5.8% |
| Liberal Arts & History | 36 | 8.0% |
| Visual & Performing Arts | 11 | 2.4% |
| Communications | 31 | 6.9% |
| Arts & Humanities | 45 | 10.0% |
| Total | 452 | 100.0% |
Transportation & Commute in McGregor
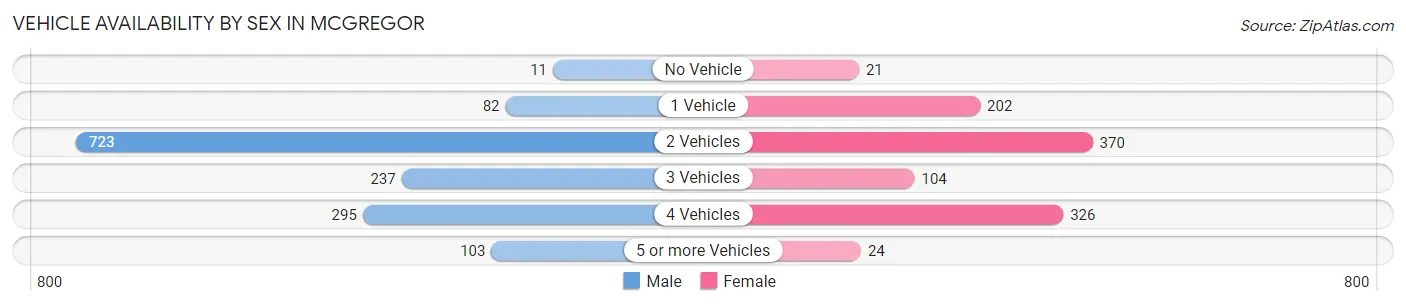
Vehicle Availability by Sex in McGregor
The most prevalent vehicle ownership categories in McGregor are males with 2 vehicles (723, accounting for 49.8%) and females with 2 vehicles (370, making up 69.1%).
| Vehicles Available | Male | Female |
| No Vehicle | 11 (0.8%) | 21 (2.0%) |
| 1 Vehicle | 82 (5.7%) | 202 (19.3%) |
| 2 Vehicles | 723 (49.8%) | 370 (35.3%) |
| 3 Vehicles | 237 (16.3%) | 104 (9.9%) |
| 4 Vehicles | 295 (20.3%) | 326 (31.1%) |
| 5 or more Vehicles | 103 (7.1%) | 24 (2.3%) |
| Total | 1,451 (100.0%) | 1,047 (100.0%) |
Commute Time in McGregor
The most frequently occuring commute durations in McGregor are 20 to 24 minutes (569 commuters, 24.1%), 5 to 9 minutes (557 commuters, 23.5%), and less than 5 minutes (259 commuters, 11.0%).
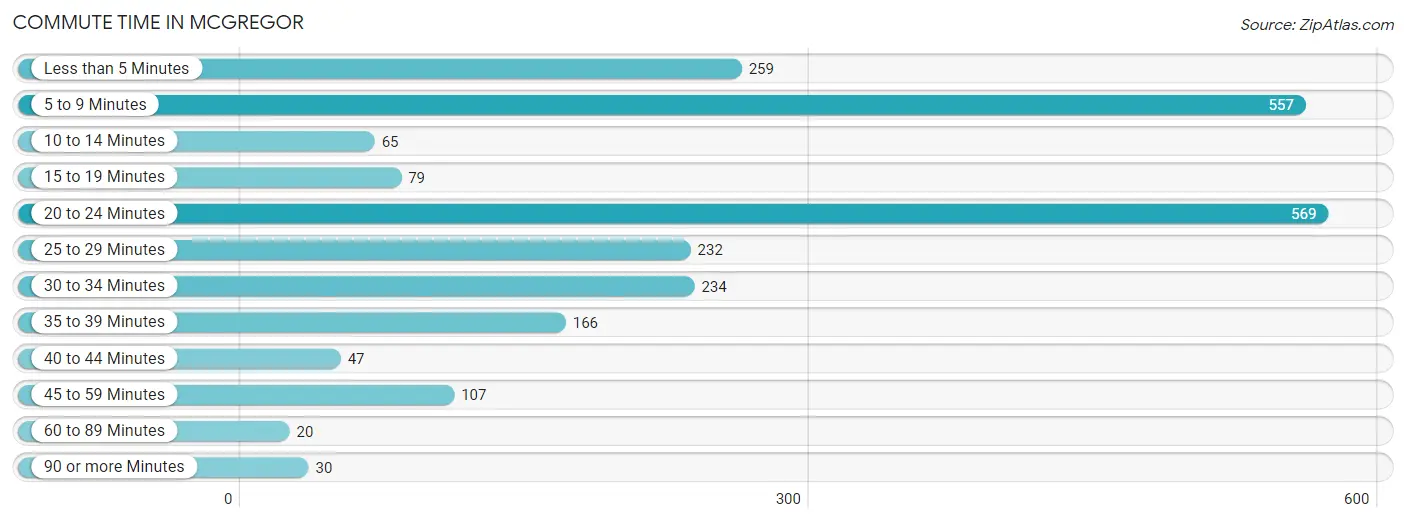
| Commute Time | # Commuters | % Commuters |
| Less than 5 Minutes | 259 | 11.0% |
| 5 to 9 Minutes | 557 | 23.5% |
| 10 to 14 Minutes | 65 | 2.8% |
| 15 to 19 Minutes | 79 | 3.3% |
| 20 to 24 Minutes | 569 | 24.1% |
| 25 to 29 Minutes | 232 | 9.8% |
| 30 to 34 Minutes | 234 | 9.9% |
| 35 to 39 Minutes | 166 | 7.0% |
| 40 to 44 Minutes | 47 | 2.0% |
| 45 to 59 Minutes | 107 | 4.5% |
| 60 to 89 Minutes | 20 | 0.9% |
| 90 or more Minutes | 30 | 1.3% |
Commute Time by Sex in McGregor
The most common commute times in McGregor are 20 to 24 minutes (394 commuters, 27.5%) for males and 20 to 24 minutes (175 commuters, 18.8%) for females.
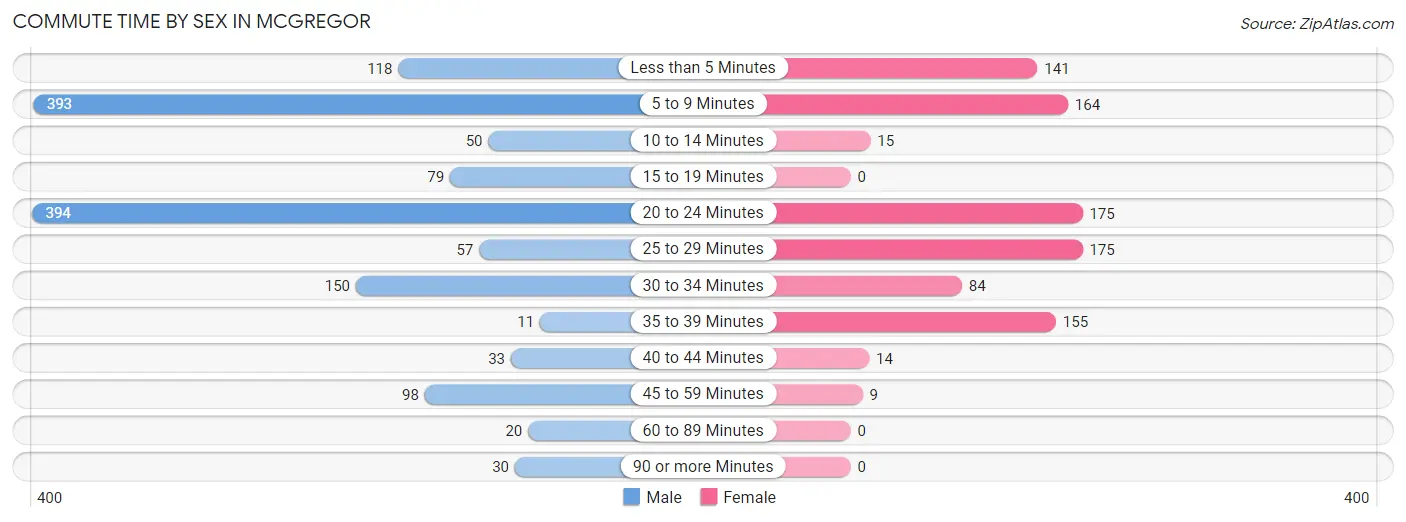
| Commute Time | Male | Female |
| Less than 5 Minutes | 118 (8.2%) | 141 (15.1%) |
| 5 to 9 Minutes | 393 (27.4%) | 164 (17.6%) |
| 10 to 14 Minutes | 50 (3.5%) | 15 (1.6%) |
| 15 to 19 Minutes | 79 (5.5%) | 0 (0.0%) |
| 20 to 24 Minutes | 394 (27.5%) | 175 (18.8%) |
| 25 to 29 Minutes | 57 (4.0%) | 175 (18.8%) |
| 30 to 34 Minutes | 150 (10.5%) | 84 (9.0%) |
| 35 to 39 Minutes | 11 (0.8%) | 155 (16.6%) |
| 40 to 44 Minutes | 33 (2.3%) | 14 (1.5%) |
| 45 to 59 Minutes | 98 (6.8%) | 9 (1.0%) |
| 60 to 89 Minutes | 20 (1.4%) | 0 (0.0%) |
| 90 or more Minutes | 30 (2.1%) | 0 (0.0%) |
Time of Departure to Work by Sex in McGregor
The most frequent times of departure to work in McGregor are 7:00 AM to 7:29 AM (484, 33.8%) for males and 7:00 AM to 7:29 AM (213, 22.9%) for females.
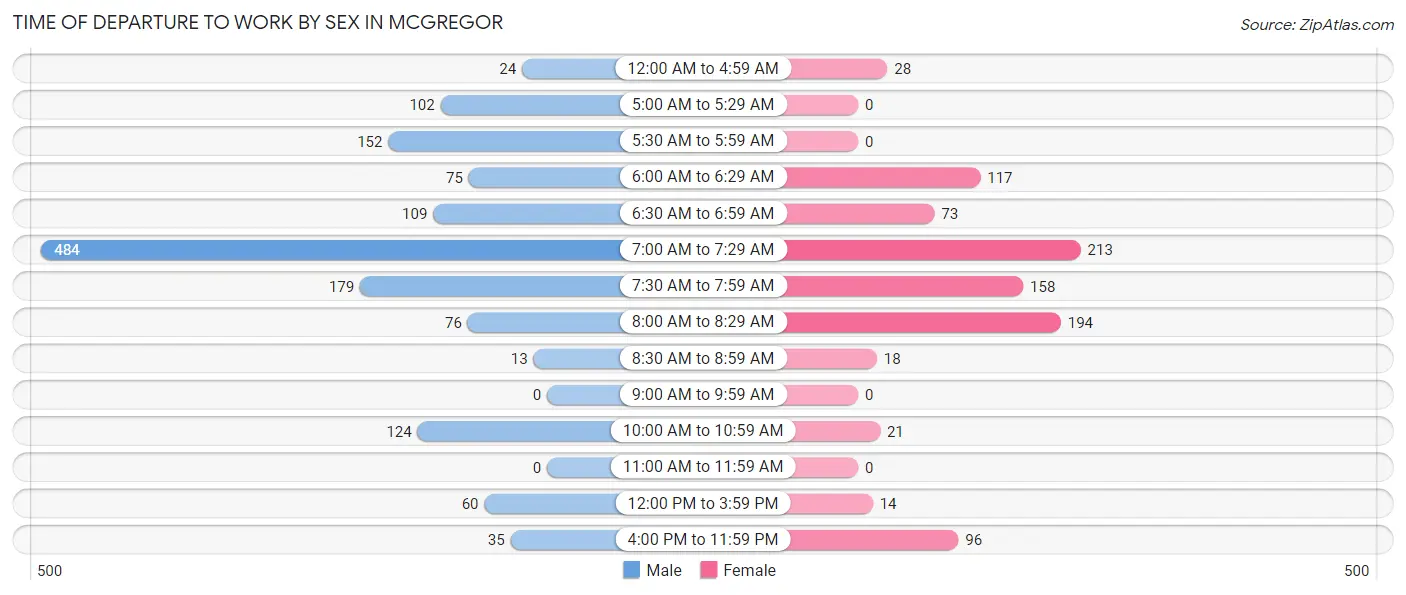
| Time of Departure | Male | Female |
| 12:00 AM to 4:59 AM | 24 (1.7%) | 28 (3.0%) |
| 5:00 AM to 5:29 AM | 102 (7.1%) | 0 (0.0%) |
| 5:30 AM to 5:59 AM | 152 (10.6%) | 0 (0.0%) |
| 6:00 AM to 6:29 AM | 75 (5.2%) | 117 (12.6%) |
| 6:30 AM to 6:59 AM | 109 (7.6%) | 73 (7.8%) |
| 7:00 AM to 7:29 AM | 484 (33.8%) | 213 (22.9%) |
| 7:30 AM to 7:59 AM | 179 (12.5%) | 158 (17.0%) |
| 8:00 AM to 8:29 AM | 76 (5.3%) | 194 (20.8%) |
| 8:30 AM to 8:59 AM | 13 (0.9%) | 18 (1.9%) |
| 9:00 AM to 9:59 AM | 0 (0.0%) | 0 (0.0%) |
| 10:00 AM to 10:59 AM | 124 (8.6%) | 21 (2.2%) |
| 11:00 AM to 11:59 AM | 0 (0.0%) | 0 (0.0%) |
| 12:00 PM to 3:59 PM | 60 (4.2%) | 14 (1.5%) |
| 4:00 PM to 11:59 PM | 35 (2.4%) | 96 (10.3%) |
| Total | 1,433 (100.0%) | 932 (100.0%) |
Housing Occupancy in McGregor
Occupancy by Ownership in McGregor
Of the total 1,679 dwellings in McGregor, owner-occupied units account for 1,021 (60.8%), while renter-occupied units make up 658 (39.2%).
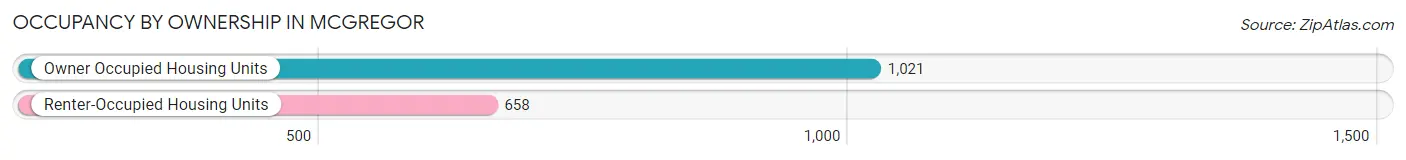
| Occupancy | # Housing Units | % Housing Units |
| Owner Occupied Housing Units | 1,021 | 60.8% |
| Renter-Occupied Housing Units | 658 | 39.2% |
| Total Occupied Housing Units | 1,679 | 100.0% |
Occupancy by Household Size in McGregor
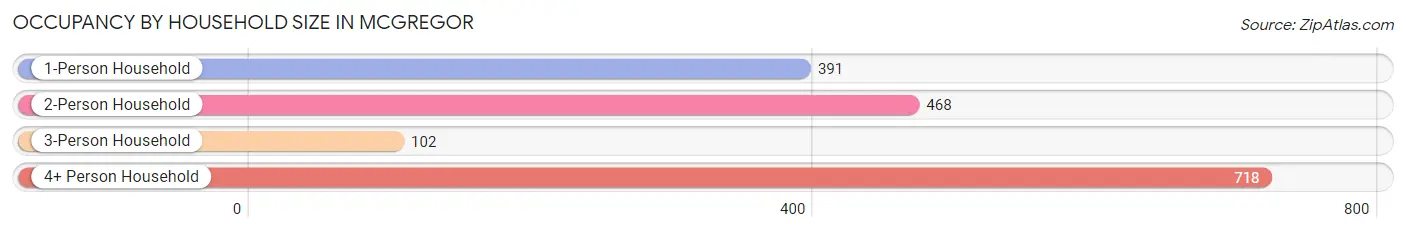
| Household Size | # Housing Units | % Housing Units |
| 1-Person Household | 391 | 23.3% |
| 2-Person Household | 468 | 27.9% |
| 3-Person Household | 102 | 6.1% |
| 4+ Person Household | 718 | 42.8% |
| Total Housing Units | 1,679 | 100.0% |
Occupancy by Ownership by Household Size in McGregor
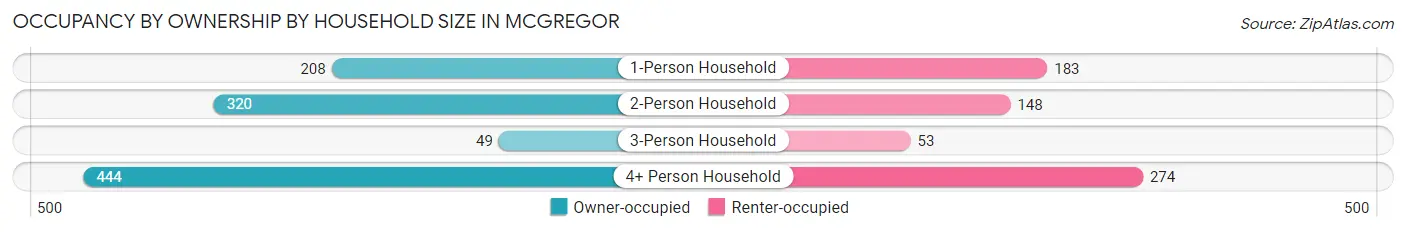
| Household Size | Owner-occupied | Renter-occupied |
| 1-Person Household | 208 (53.2%) | 183 (46.8%) |
| 2-Person Household | 320 (68.4%) | 148 (31.6%) |
| 3-Person Household | 49 (48.0%) | 53 (52.0%) |
| 4+ Person Household | 444 (61.8%) | 274 (38.2%) |
| Total Housing Units | 1,021 (60.8%) | 658 (39.2%) |
Occupancy by Educational Attainment in McGregor
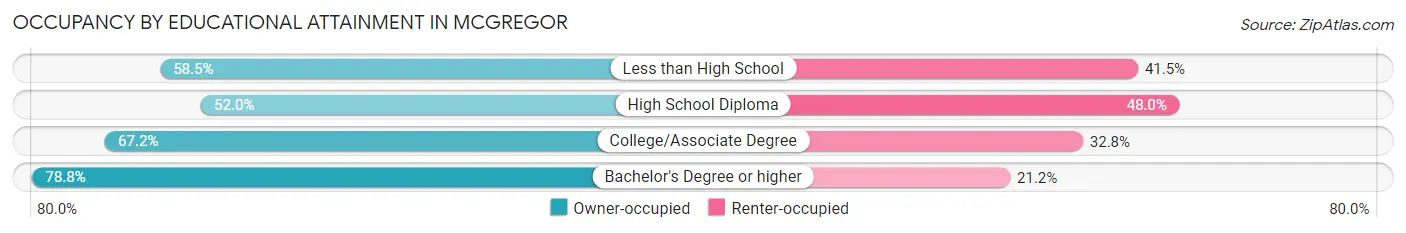
| Household Size | Owner-occupied | Renter-occupied |
| Less than High School | 131 (58.5%) | 93 (41.5%) |
| High School Diploma | 403 (52.0%) | 372 (48.0%) |
| College/Associate Degree | 283 (67.2%) | 138 (32.8%) |
| Bachelor's Degree or higher | 204 (78.8%) | 55 (21.2%) |
Occupancy by Age of Householder in McGregor
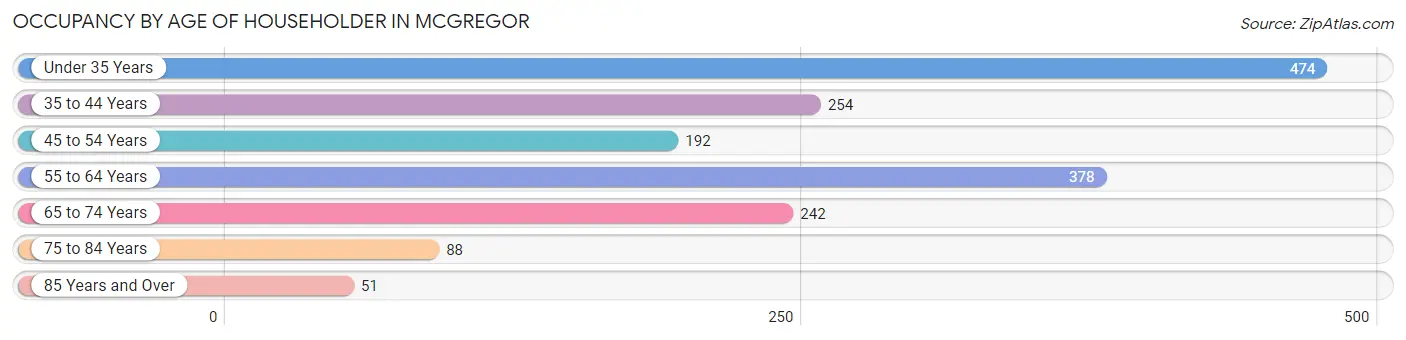
| Age Bracket | # Households | % Households |
| Under 35 Years | 474 | 28.2% |
| 35 to 44 Years | 254 | 15.1% |
| 45 to 54 Years | 192 | 11.4% |
| 55 to 64 Years | 378 | 22.5% |
| 65 to 74 Years | 242 | 14.4% |
| 75 to 84 Years | 88 | 5.2% |
| 85 Years and Over | 51 | 3.0% |
| Total | 1,679 | 100.0% |
Housing Finances in McGregor
Median Income by Occupancy in McGregor
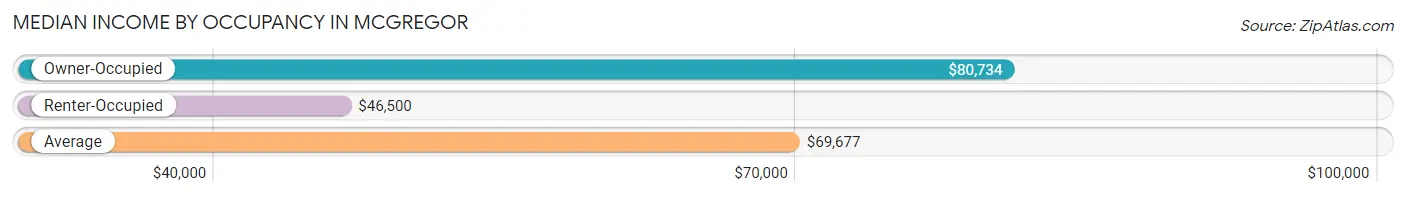
| Occupancy Type | # Households | Median Income |
| Owner-Occupied | 1,021 (60.8%) | $80,734 |
| Renter-Occupied | 658 (39.2%) | $46,500 |
| Average | 1,679 (100.0%) | $69,677 |
Occupancy by Householder Income Bracket in McGregor
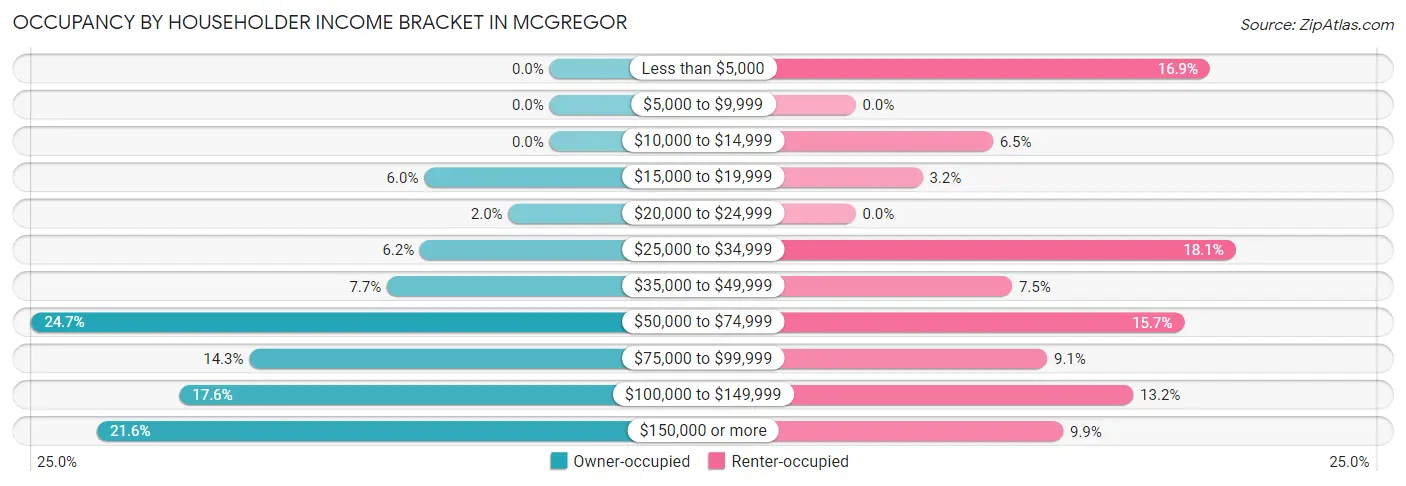
| Income Bracket | Owner-occupied | Renter-occupied |
| Less than $5,000 | 0 (0.0%) | 111 (16.9%) |
| $5,000 to $9,999 | 0 (0.0%) | 0 (0.0%) |
| $10,000 to $14,999 | 0 (0.0%) | 43 (6.5%) |
| $15,000 to $19,999 | 61 (6.0%) | 21 (3.2%) |
| $20,000 to $24,999 | 20 (2.0%) | 0 (0.0%) |
| $25,000 to $34,999 | 63 (6.2%) | 119 (18.1%) |
| $35,000 to $49,999 | 79 (7.7%) | 49 (7.4%) |
| $50,000 to $74,999 | 252 (24.7%) | 103 (15.7%) |
| $75,000 to $99,999 | 146 (14.3%) | 60 (9.1%) |
| $100,000 to $149,999 | 180 (17.6%) | 87 (13.2%) |
| $150,000 or more | 220 (21.5%) | 65 (9.9%) |
| Total | 1,021 (100.0%) | 658 (100.0%) |
Monthly Housing Cost Tiers in McGregor
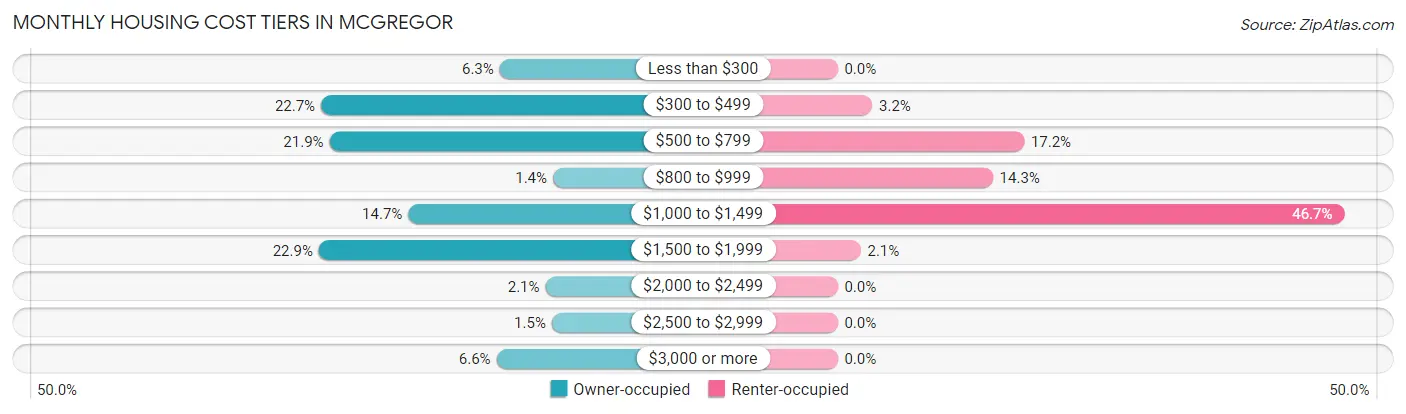
| Monthly Cost | Owner-occupied | Renter-occupied |
| Less than $300 | 64 (6.3%) | 0 (0.0%) |
| $300 to $499 | 232 (22.7%) | 21 (3.2%) |
| $500 to $799 | 224 (21.9%) | 113 (17.2%) |
| $800 to $999 | 14 (1.4%) | 94 (14.3%) |
| $1,000 to $1,499 | 150 (14.7%) | 307 (46.7%) |
| $1,500 to $1,999 | 234 (22.9%) | 14 (2.1%) |
| $2,000 to $2,499 | 21 (2.1%) | 0 (0.0%) |
| $2,500 to $2,999 | 15 (1.5%) | 0 (0.0%) |
| $3,000 or more | 67 (6.6%) | 0 (0.0%) |
| Total | 1,021 (100.0%) | 658 (100.0%) |
Physical Housing Characteristics in McGregor
Housing Structures in McGregor
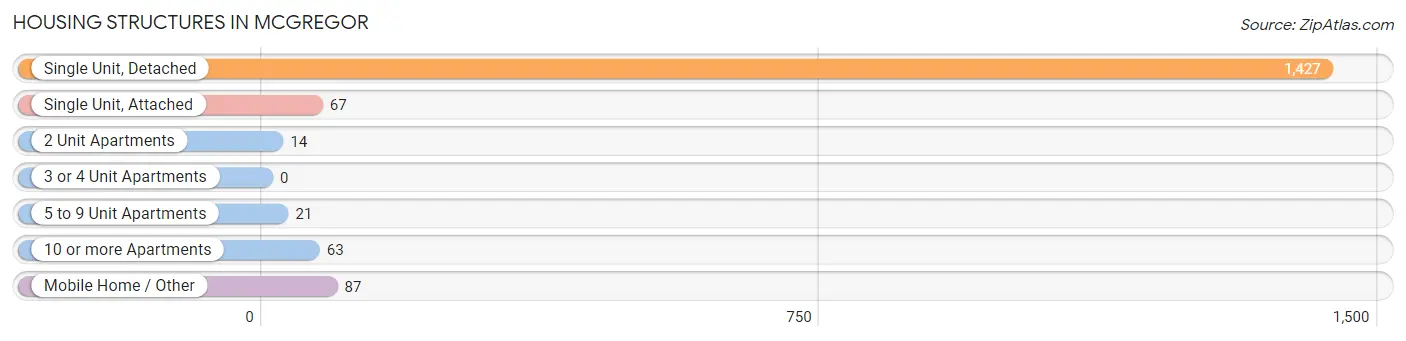
| Structure Type | # Housing Units | % Housing Units |
| Single Unit, Detached | 1,427 | 85.0% |
| Single Unit, Attached | 67 | 4.0% |
| 2 Unit Apartments | 14 | 0.8% |
| 3 or 4 Unit Apartments | 0 | 0.0% |
| 5 to 9 Unit Apartments | 21 | 1.3% |
| 10 or more Apartments | 63 | 3.7% |
| Mobile Home / Other | 87 | 5.2% |
| Total | 1,679 | 100.0% |
Housing Structures by Occupancy in McGregor
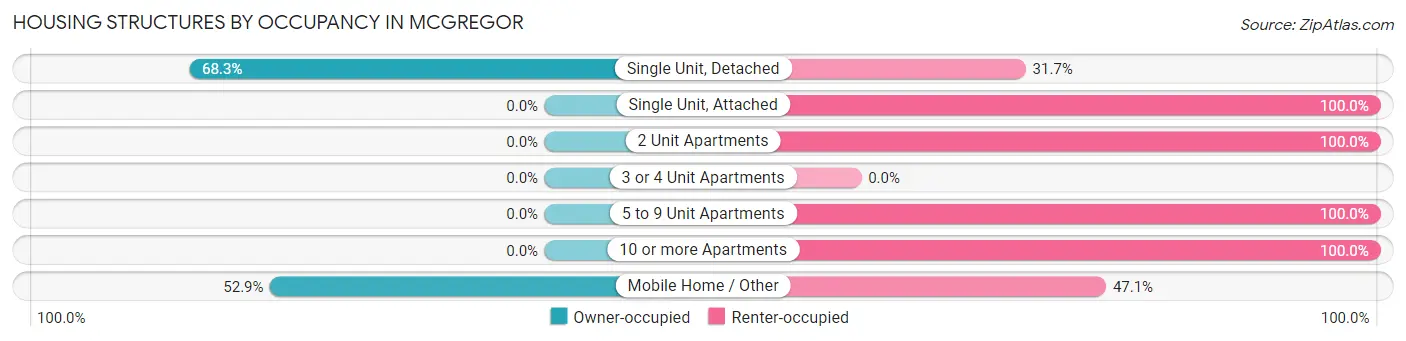
| Structure Type | Owner-occupied | Renter-occupied |
| Single Unit, Detached | 975 (68.3%) | 452 (31.7%) |
| Single Unit, Attached | 0 (0.0%) | 67 (100.0%) |
| 2 Unit Apartments | 0 (0.0%) | 14 (100.0%) |
| 3 or 4 Unit Apartments | 0 (0.0%) | 0 (0.0%) |
| 5 to 9 Unit Apartments | 0 (0.0%) | 21 (100.0%) |
| 10 or more Apartments | 0 (0.0%) | 63 (100.0%) |
| Mobile Home / Other | 46 (52.9%) | 41 (47.1%) |
| Total | 1,021 (60.8%) | 658 (39.2%) |
Housing Structures by Number of Rooms in McGregor
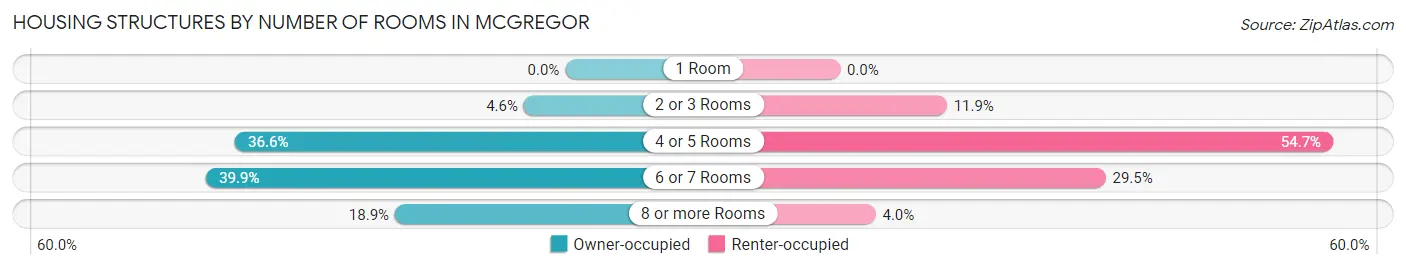
| Number of Rooms | Owner-occupied | Renter-occupied |
| 1 Room | 0 (0.0%) | 0 (0.0%) |
| 2 or 3 Rooms | 47 (4.6%) | 78 (11.8%) |
| 4 or 5 Rooms | 374 (36.6%) | 360 (54.7%) |
| 6 or 7 Rooms | 407 (39.9%) | 194 (29.5%) |
| 8 or more Rooms | 193 (18.9%) | 26 (4.0%) |
| Total | 1,021 (100.0%) | 658 (100.0%) |
Housing Structure by Heating Type in McGregor
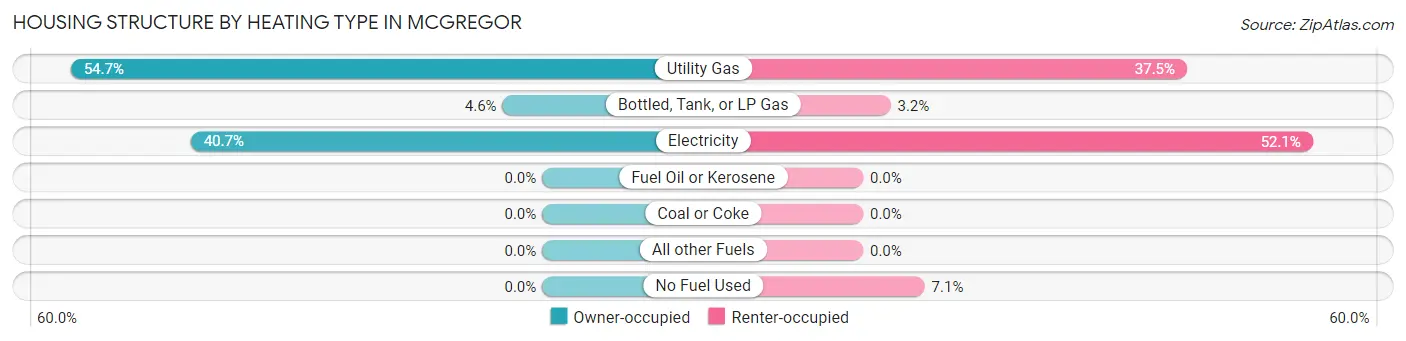
| Heating Type | Owner-occupied | Renter-occupied |
| Utility Gas | 558 (54.6%) | 247 (37.5%) |
| Bottled, Tank, or LP Gas | 47 (4.6%) | 21 (3.2%) |
| Electricity | 416 (40.7%) | 343 (52.1%) |
| Fuel Oil or Kerosene | 0 (0.0%) | 0 (0.0%) |
| Coal or Coke | 0 (0.0%) | 0 (0.0%) |
| All other Fuels | 0 (0.0%) | 0 (0.0%) |
| No Fuel Used | 0 (0.0%) | 47 (7.1%) |
| Total | 1,021 (100.0%) | 658 (100.0%) |
Household Vehicle Usage in McGregor
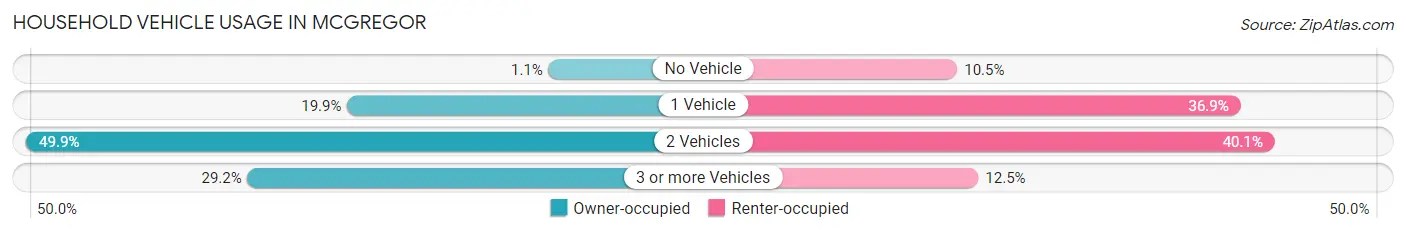
| Vehicles per Household | Owner-occupied | Renter-occupied |
| No Vehicle | 11 (1.1%) | 69 (10.5%) |
| 1 Vehicle | 203 (19.9%) | 243 (36.9%) |
| 2 Vehicles | 509 (49.8%) | 264 (40.1%) |
| 3 or more Vehicles | 298 (29.2%) | 82 (12.5%) |
| Total | 1,021 (100.0%) | 658 (100.0%) |
Real Estate & Mortgages in McGregor
Real Estate and Mortgage Overview in McGregor
| Characteristic | Without Mortgage | With Mortgage |
| Housing Units | 481 | 540 |
| Median Property Value | $88,000 | $204,000 |
| Median Household Income | $55,970 | $148 |
| Monthly Housing Costs | $430 | $67 |
| Real Estate Taxes | $1,620 | $0 |
Property Value by Mortgage Status in McGregor
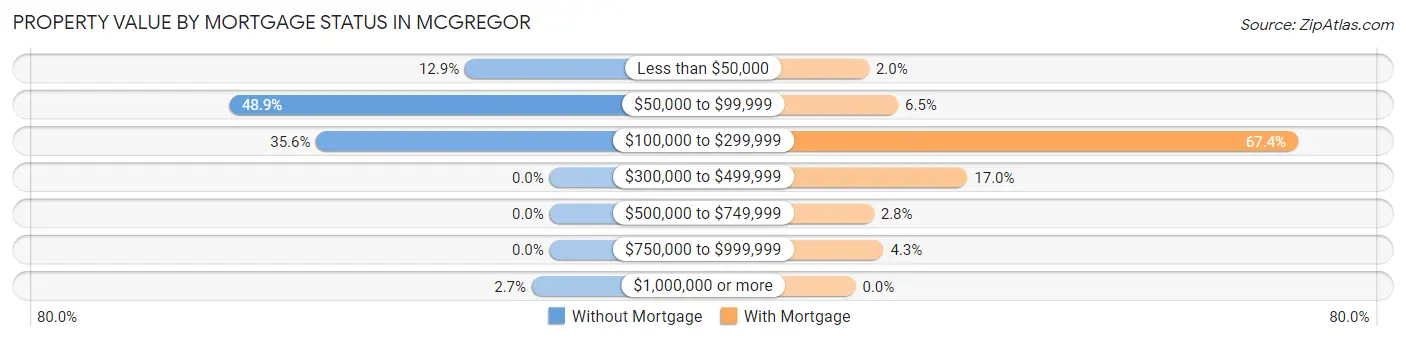
| Property Value | Without Mortgage | With Mortgage |
| Less than $50,000 | 62 (12.9%) | 11 (2.0%) |
| $50,000 to $99,999 | 235 (48.9%) | 35 (6.5%) |
| $100,000 to $299,999 | 171 (35.5%) | 364 (67.4%) |
| $300,000 to $499,999 | 0 (0.0%) | 92 (17.0%) |
| $500,000 to $749,999 | 0 (0.0%) | 15 (2.8%) |
| $750,000 to $999,999 | 0 (0.0%) | 23 (4.3%) |
| $1,000,000 or more | 13 (2.7%) | 0 (0.0%) |
| Total | 481 (100.0%) | 540 (100.0%) |
Household Income by Mortgage Status in McGregor
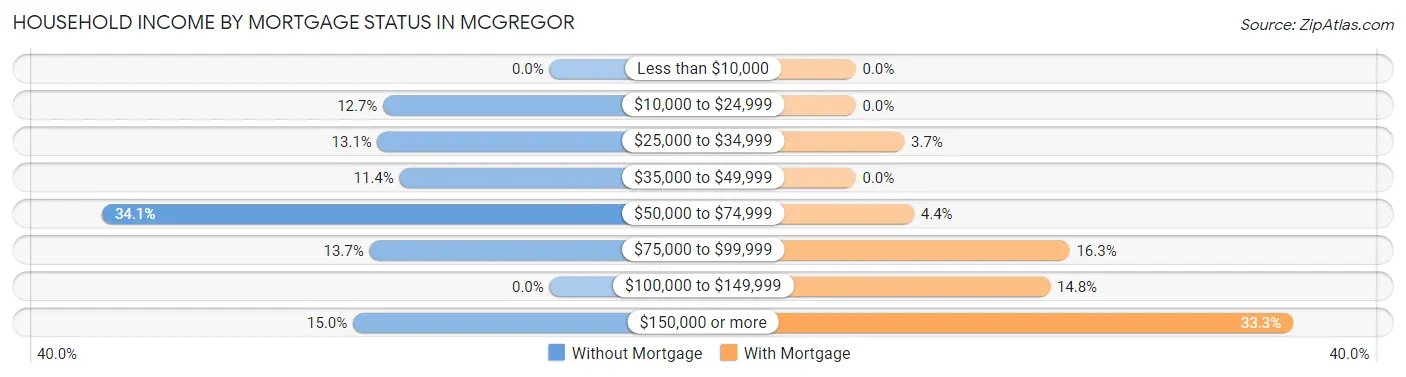
| Household Income | Without Mortgage | With Mortgage |
| Less than $10,000 | 0 (0.0%) | 0 (0.0%) |
| $10,000 to $24,999 | 61 (12.7%) | 0 (0.0%) |
| $25,000 to $34,999 | 63 (13.1%) | 20 (3.7%) |
| $35,000 to $49,999 | 55 (11.4%) | 0 (0.0%) |
| $50,000 to $74,999 | 164 (34.1%) | 24 (4.4%) |
| $75,000 to $99,999 | 66 (13.7%) | 88 (16.3%) |
| $100,000 to $149,999 | 0 (0.0%) | 80 (14.8%) |
| $150,000 or more | 72 (15.0%) | 180 (33.3%) |
| Total | 481 (100.0%) | 540 (100.0%) |
Property Value to Household Income Ratio in McGregor
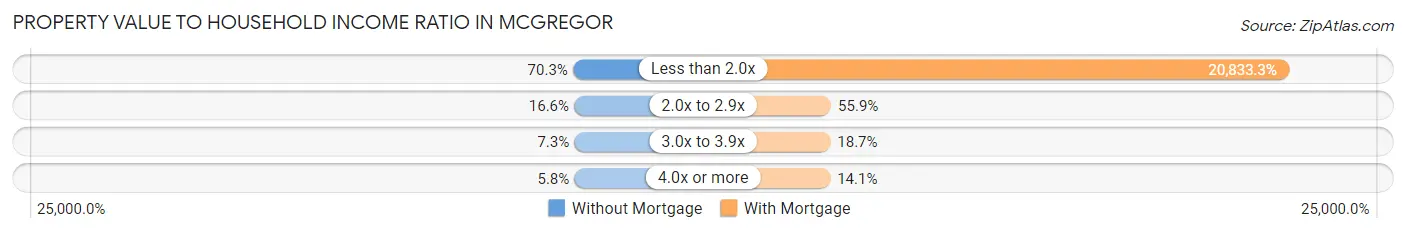
| Value-to-Income Ratio | Without Mortgage | With Mortgage |
| Less than 2.0x | 338 (70.3%) | 112,500 (20,833.3%) |
| 2.0x to 2.9x | 80 (16.6%) | 302 (55.9%) |
| 3.0x to 3.9x | 35 (7.3%) | 101 (18.7%) |
| 4.0x or more | 28 (5.8%) | 76 (14.1%) |
| Total | 481 (100.0%) | 540 (100.0%) |
Real Estate Taxes by Mortgage Status in McGregor
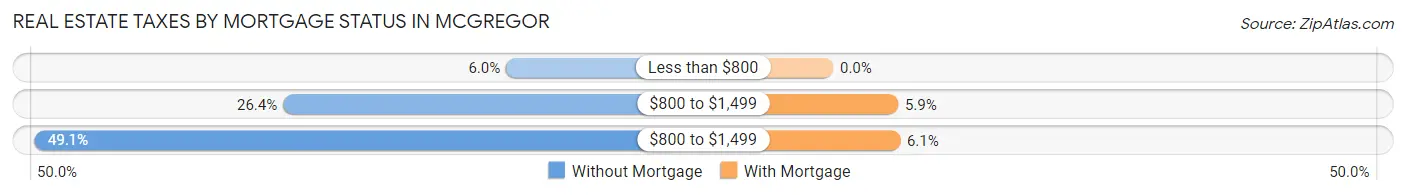
| Property Taxes | Without Mortgage | With Mortgage |
| Less than $800 | 29 (6.0%) | 0 (0.0%) |
| $800 to $1,499 | 127 (26.4%) | 32 (5.9%) |
| $800 to $1,499 | 236 (49.1%) | 33 (6.1%) |
| Total | 481 (100.0%) | 540 (100.0%) |
Health & Disability in McGregor
Health Insurance Coverage by Age in McGregor
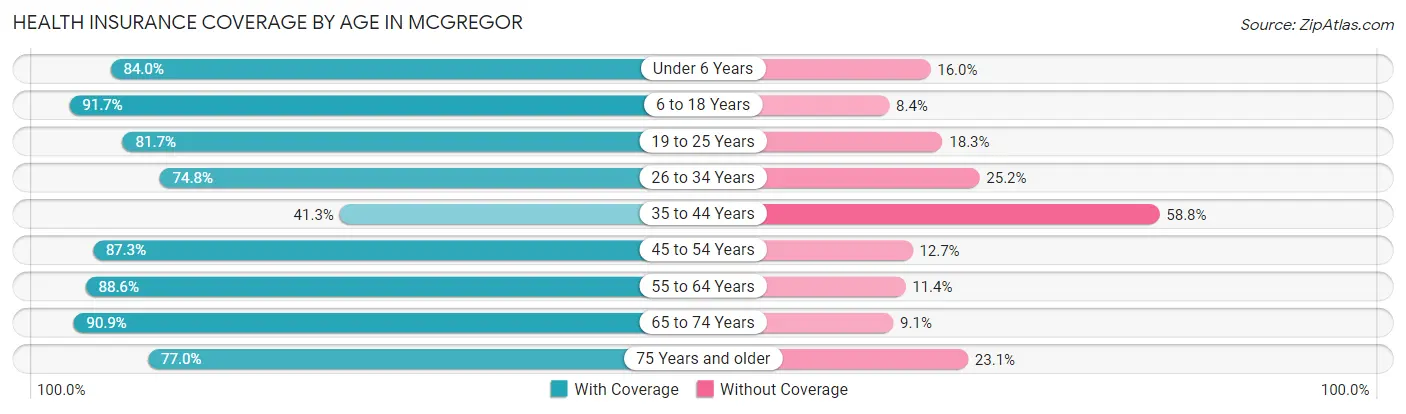
| Age Bracket | With Coverage | Without Coverage |
| Under 6 Years | 398 (84.0%) | 76 (16.0%) |
| 6 to 18 Years | 1,064 (91.6%) | 97 (8.4%) |
| 19 to 25 Years | 286 (81.7%) | 64 (18.3%) |
| 26 to 34 Years | 704 (74.8%) | 237 (25.2%) |
| 35 to 44 Years | 238 (41.2%) | 339 (58.8%) |
| 45 to 54 Years | 460 (87.3%) | 67 (12.7%) |
| 55 to 64 Years | 444 (88.6%) | 57 (11.4%) |
| 65 to 74 Years | 459 (90.9%) | 46 (9.1%) |
| 75 Years and older | 237 (76.9%) | 71 (23.1%) |
| Total | 4,290 (80.3%) | 1,054 (19.7%) |
Health Insurance Coverage by Citizenship Status in McGregor
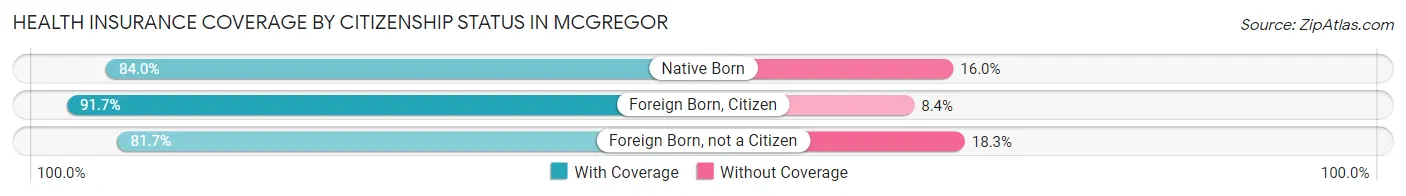
| Citizenship Status | With Coverage | Without Coverage |
| Native Born | 398 (84.0%) | 76 (16.0%) |
| Foreign Born, Citizen | 1,064 (91.6%) | 97 (8.4%) |
| Foreign Born, not a Citizen | 286 (81.7%) | 64 (18.3%) |
Health Insurance Coverage by Household Income in McGregor
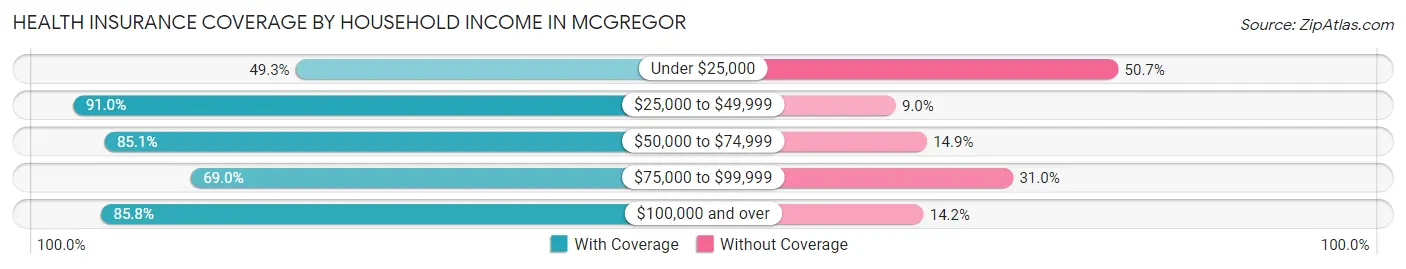
| Household Income | With Coverage | Without Coverage |
| Under $25,000 | 333 (49.3%) | 343 (50.7%) |
| $25,000 to $49,999 | 755 (91.0%) | 75 (9.0%) |
| $50,000 to $74,999 | 1,167 (85.1%) | 204 (14.9%) |
| $75,000 to $99,999 | 331 (69.0%) | 149 (31.0%) |
| $100,000 and over | 1,704 (85.8%) | 283 (14.2%) |
Public vs Private Health Insurance Coverage by Age in McGregor
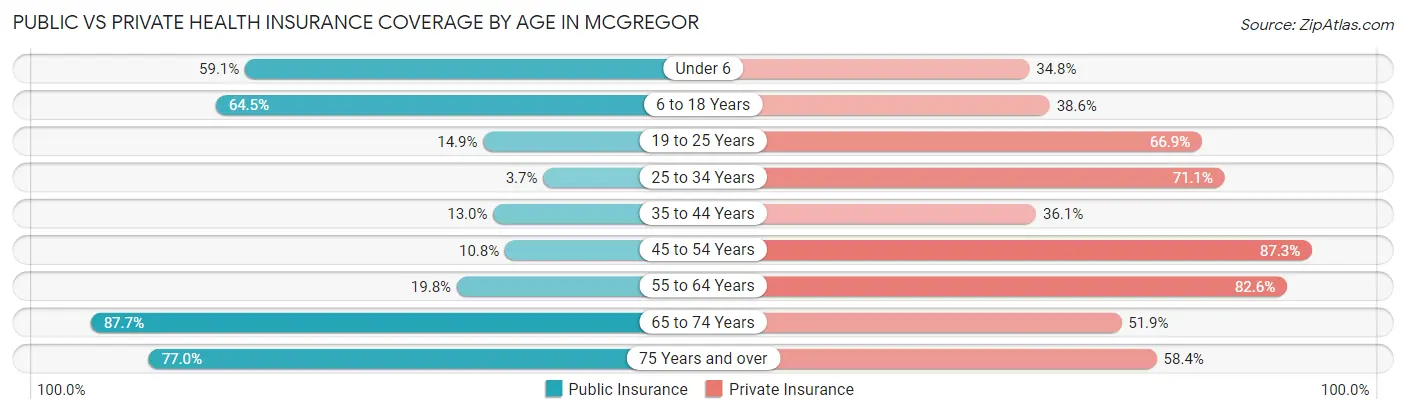
| Age Bracket | Public Insurance | Private Insurance |
| Under 6 | 280 (59.1%) | 165 (34.8%) |
| 6 to 18 Years | 749 (64.5%) | 448 (38.6%) |
| 19 to 25 Years | 52 (14.9%) | 234 (66.9%) |
| 25 to 34 Years | 35 (3.7%) | 669 (71.1%) |
| 35 to 44 Years | 75 (13.0%) | 208 (36.0%) |
| 45 to 54 Years | 57 (10.8%) | 460 (87.3%) |
| 55 to 64 Years | 99 (19.8%) | 414 (82.6%) |
| 65 to 74 Years | 443 (87.7%) | 262 (51.9%) |
| 75 Years and over | 237 (76.9%) | 180 (58.4%) |
| Total | 2,027 (37.9%) | 3,040 (56.9%) |
Disability Status by Sex by Age in McGregor
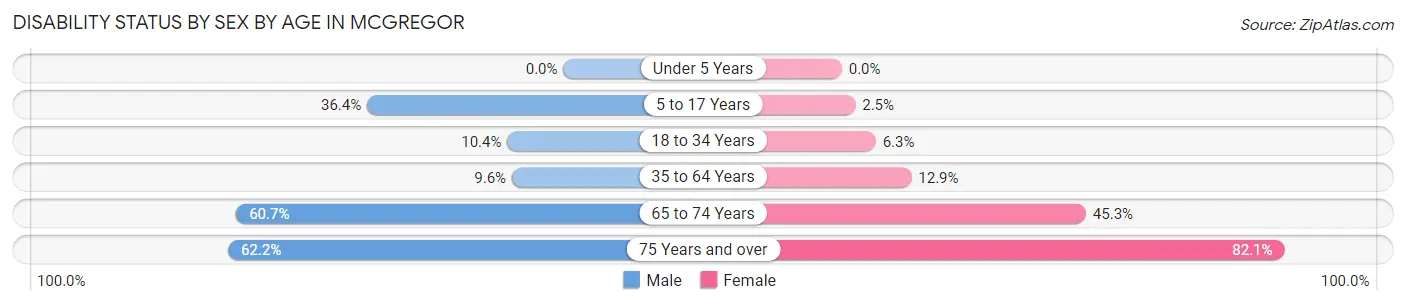
| Age Bracket | Male | Female |
| Under 5 Years | 0 (0.0%) | 0 (0.0%) |
| 5 to 17 Years | 223 (36.4%) | 13 (2.5%) |
| 18 to 34 Years | 81 (10.4%) | 40 (6.3%) |
| 35 to 64 Years | 83 (9.6%) | 95 (12.9%) |
| 65 to 74 Years | 119 (60.7%) | 140 (45.3%) |
| 75 Years and over | 122 (62.2%) | 92 (82.1%) |
Disability Class by Sex by Age in McGregor
Disability Class: Hearing Difficulty
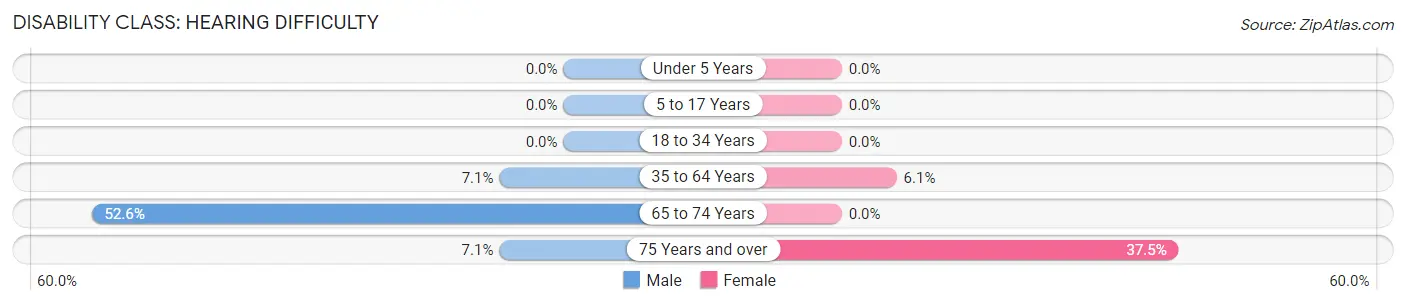
| Age Bracket | Male | Female |
| Under 5 Years | 0 (0.0%) | 0 (0.0%) |
| 5 to 17 Years | 0 (0.0%) | 0 (0.0%) |
| 18 to 34 Years | 0 (0.0%) | 0 (0.0%) |
| 35 to 64 Years | 62 (7.1%) | 45 (6.1%) |
| 65 to 74 Years | 103 (52.5%) | 0 (0.0%) |
| 75 Years and over | 14 (7.1%) | 42 (37.5%) |
Disability Class: Vision Difficulty
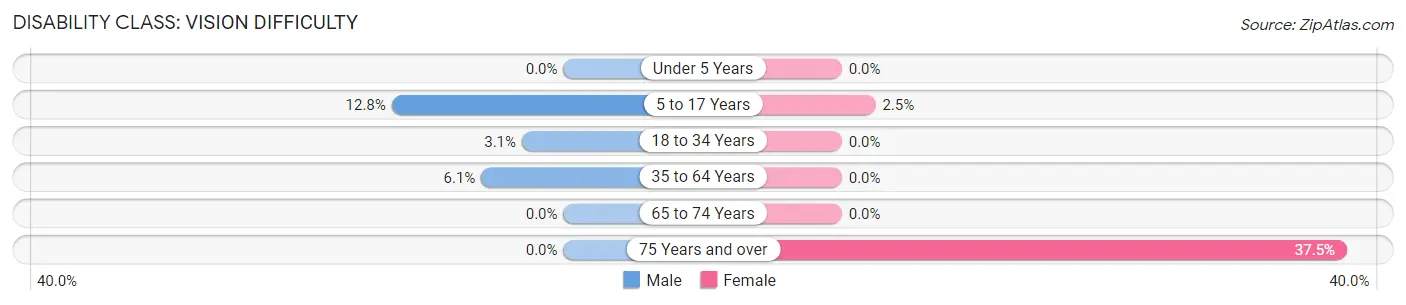
| Age Bracket | Male | Female |
| Under 5 Years | 0 (0.0%) | 0 (0.0%) |
| 5 to 17 Years | 78 (12.8%) | 13 (2.5%) |
| 18 to 34 Years | 24 (3.1%) | 0 (0.0%) |
| 35 to 64 Years | 53 (6.1%) | 0 (0.0%) |
| 65 to 74 Years | 0 (0.0%) | 0 (0.0%) |
| 75 Years and over | 0 (0.0%) | 42 (37.5%) |
Disability Class: Cognitive Difficulty
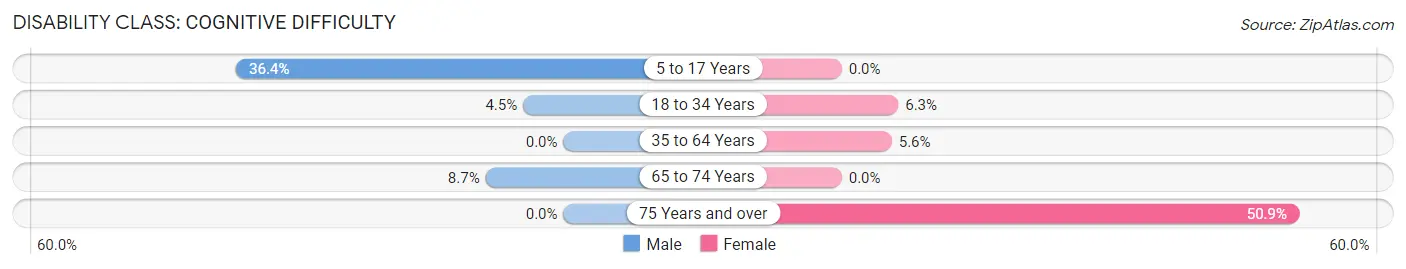
| Age Bracket | Male | Female |
| 5 to 17 Years | 223 (36.4%) | 0 (0.0%) |
| 18 to 34 Years | 35 (4.5%) | 40 (6.3%) |
| 35 to 64 Years | 0 (0.0%) | 41 (5.6%) |
| 65 to 74 Years | 17 (8.7%) | 0 (0.0%) |
| 75 Years and over | 0 (0.0%) | 57 (50.9%) |
Disability Class: Ambulatory Difficulty
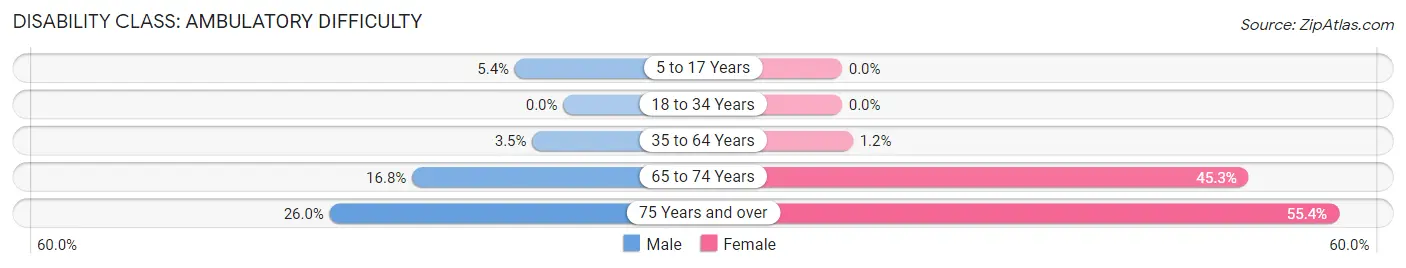
| Age Bracket | Male | Female |
| 5 to 17 Years | 33 (5.4%) | 0 (0.0%) |
| 18 to 34 Years | 0 (0.0%) | 0 (0.0%) |
| 35 to 64 Years | 30 (3.5%) | 9 (1.2%) |
| 65 to 74 Years | 33 (16.8%) | 140 (45.3%) |
| 75 Years and over | 51 (26.0%) | 62 (55.4%) |
Disability Class: Self-Care Difficulty
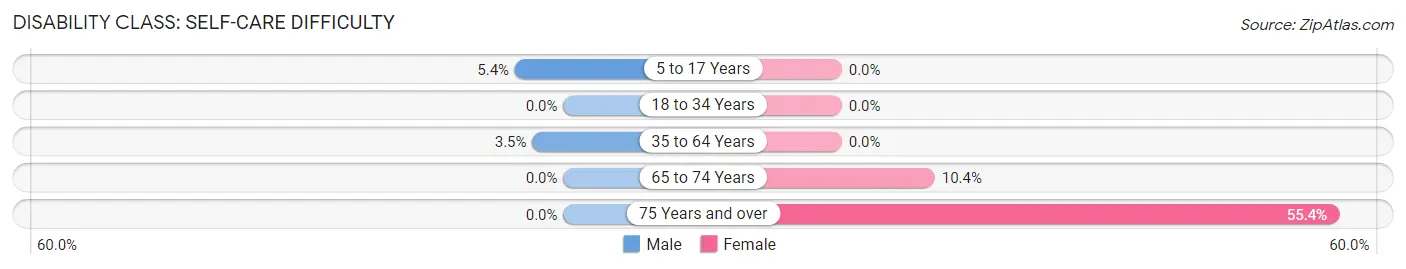
| Age Bracket | Male | Female |
| 5 to 17 Years | 33 (5.4%) | 0 (0.0%) |
| 18 to 34 Years | 0 (0.0%) | 0 (0.0%) |
| 35 to 64 Years | 30 (3.5%) | 0 (0.0%) |
| 65 to 74 Years | 0 (0.0%) | 32 (10.4%) |
| 75 Years and over | 0 (0.0%) | 62 (55.4%) |
Technology Access in McGregor
Computing Device Access in McGregor
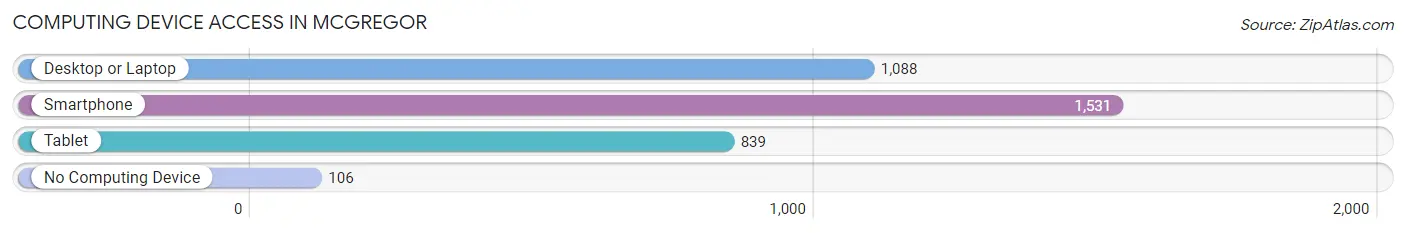
| Device Type | # Households | % Households |
| Desktop or Laptop | 1,088 | 64.8% |
| Smartphone | 1,531 | 91.2% |
| Tablet | 839 | 50.0% |
| No Computing Device | 106 | 6.3% |
| Total | 1,679 | 100.0% |
Internet Access in McGregor
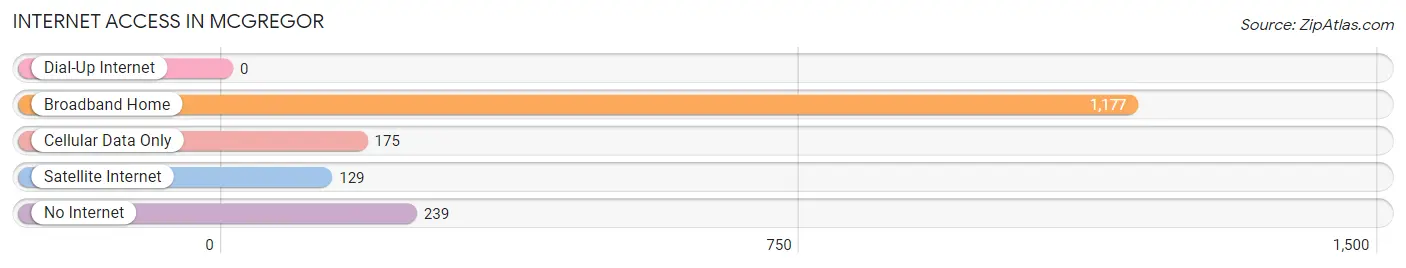
| Internet Type | # Households | % Households |
| Dial-Up Internet | 0 | 0.0% |
| Broadband Home | 1,177 | 70.1% |
| Cellular Data Only | 175 | 10.4% |
| Satellite Internet | 129 | 7.7% |
| No Internet | 239 | 14.2% |
| Total | 1,679 | 100.0% |
McGregor Summary
McGregor, Texas is a small city located in McLennan County, Texas, United States. The city is situated along the banks of the Brazos River, approximately 20 miles south of Waco and 100 miles north of Austin. The population of McGregor was 5,873 at the 2010 census, up from 4,726 at the 2000 census.
History
McGregor was founded in 1848 by a group of settlers from Scotland, led by John McGregor. The settlers named the town after their leader, and the town was officially incorporated in 1881. The town was originally a farming community, but it soon became a center for the railroad industry. The first railroad line to pass through the town was the Houston and Texas Central Railway, which was completed in 1881.
The town grew rapidly in the late 19th and early 20th centuries, and by the 1920s, it had become a major railroad hub. The town was also home to several cotton gins, and it was a popular stop for travelers on the Texas and Pacific Railway.
Geography
McGregor is located in McLennan County, Texas, at the intersection of U.S. Route 84 and State Highway 317. The city is situated along the banks of the Brazos River, approximately 20 miles south of Waco and 100 miles north of Austin. The city has a total area of 4.2 square miles, all of which is land.
Economy
McGregor’s economy is largely based on the railroad industry. The city is home to several major railroads, including the Union Pacific Railroad, the Burlington Northern Santa Fe Railway, and the Texas and Pacific Railway. The city is also home to several manufacturing companies, including a steel mill and a paper mill.
McGregor is also home to several retail stores, restaurants, and other businesses. The city is home to several parks, including the McGregor City Park, which features a swimming pool, tennis courts, and a playground.
Demographics
As of the 2010 census, the population of McGregor was 5,873. The racial makeup of the city was 79.3% White, 15.2% African American, 0.5% Native American, 0.7% Asian, 0.1% Pacific Islander, 2.2% from other races, and 2.1% from two or more races. Hispanic or Latino of any race were 6.7% of the population.
The median income for a household in the city was $37,917, and the median income for a family was $45,938. The per capita income for the city was $18,945. About 11.2% of families and 14.2% of the population were below the poverty line, including 19.2% of those under age 18 and 10.2% of those age 65 or over.
McGregor is served by the McGregor Independent School District, which includes three elementary schools, one middle school, and one high school. The city is also home to several churches, including the First United Methodist Church, the First Baptist Church, and the Church of Christ.
Common Questions
What is the Total Population of McGregor?
Total Population of McGregor is 5,478.
What is the Total Male Population of McGregor?
Total Male Population of McGregor is 2,966.
What is the Total Female Population of McGregor?
Total Female Population of McGregor is 2,512.
What is the Ratio of Males per 100 Females in McGregor?
There are 118.07 Males per 100 Females in McGregor.
What is the Ratio of Females per 100 Males in McGregor?
There are 84.69 Females per 100 Males in McGregor.
What is the Median Population Age in McGregor?
Median Population Age in McGregor is 32.7 Years.
What is the Average Family Size in McGregor
Average Family Size in McGregor is 3.9 People.
What is the Average Household Size in McGregor
Average Household Size in McGregor is 3.2 People.
What is Per Capita Income in McGregor?
Per Capita income in McGregor is $29,071.
What is the Median Family Income in McGregor?
Median Family Income in McGregor is $82,115.
What is the Median Household income in McGregor?
Median Household Income in McGregor is $69,677.
What is Income or Wage Gap in McGregor?
Income or Wage Gap in McGregor is 43.8%.
Women in McGregor earn 56.2 cents for every dollar earned by a man.
What is Inequality or Gini Index in McGregor?
Inequality or Gini Index in McGregor is 0.46.
How Large is the Labor Force in McGregor?
There are 2,646 People in the Labor Forcein in McGregor.
What is the Percentage of People in the Labor Force in McGregor?
64.6% of People are in the Labor Force in McGregor.
What is the Unemployment Rate in McGregor?
Unemployment Rate in McGregor is 4.9%.