Hammondsport, NY
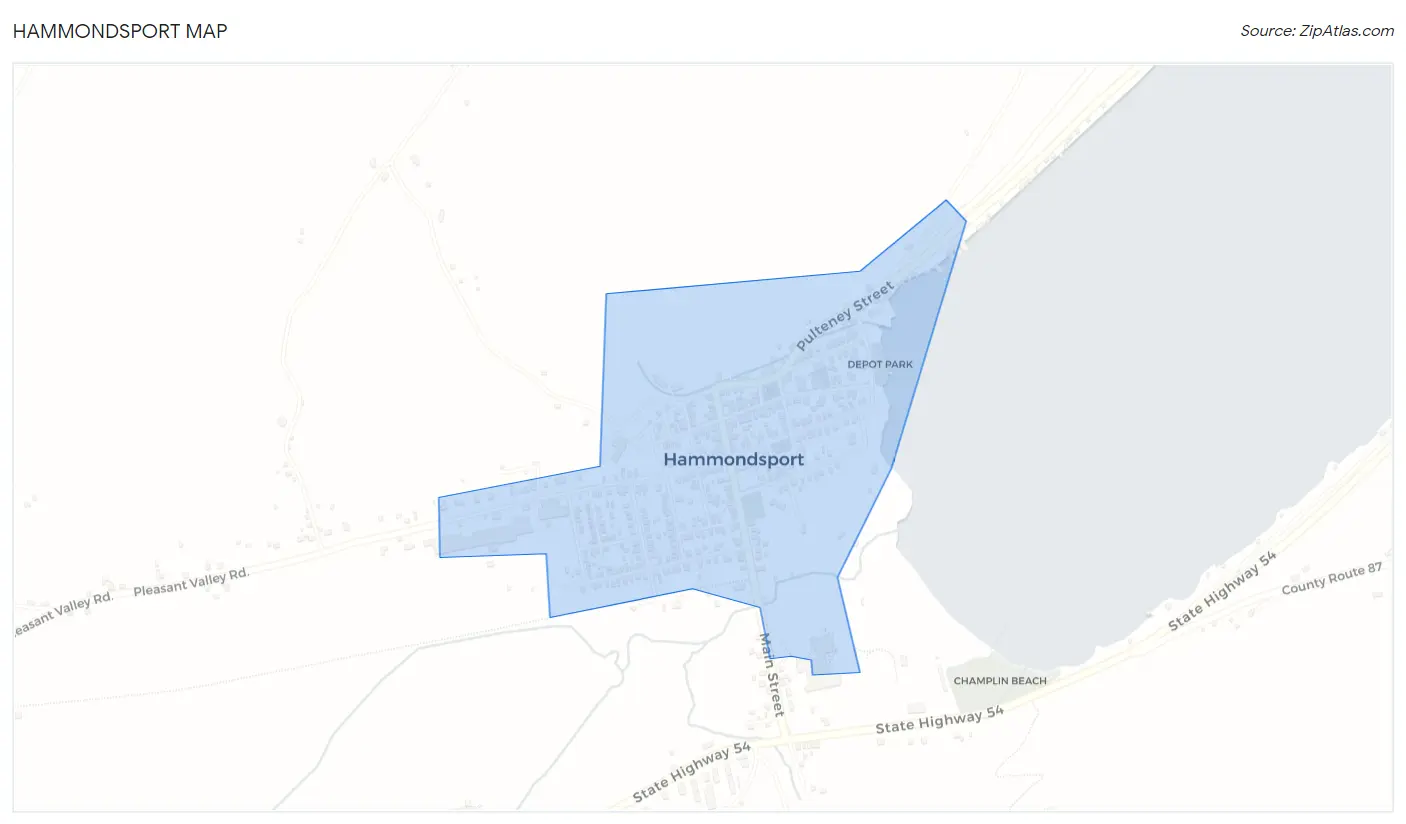
Hammondsport Map
Hammondsport Overview
569
TOTAL POPULATION
266
MALE POPULATION
303
FEMALE POPULATION
87.79
MALES / 100 FEMALES
113.91
FEMALES / 100 MALES
54.4
MEDIAN AGE
2.8
AVG FAMILY SIZE
1.9
AVG HOUSEHOLD SIZE
$41,433
PER CAPITA INCOME
$79,750
AVG FAMILY INCOME
$64,375
AVG HOUSEHOLD INCOME
32.7%
WAGE / INCOME GAP [ % ]
67.3¢/ $1
WAGE / INCOME GAP [ $ ]
0.44
INEQUALITY / GINI INDEX
281
LABOR FORCE [ PEOPLE ]
57.6%
PERCENT IN LABOR FORCE
2.5%
UNEMPLOYMENT RATE
Hammondsport Zip Codes
Hammondsport Area Codes
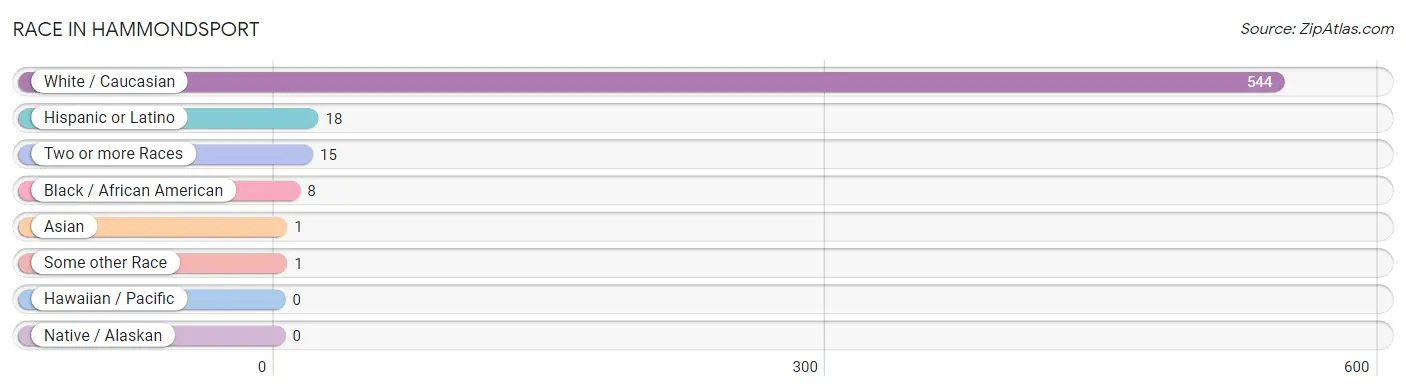
Race in Hammondsport
The most populous races in Hammondsport are White / Caucasian (544 | 95.6%), Hispanic or Latino (18 | 3.2%), and Two or more Races (15 | 2.6%).
| Race | # Population | % Population |
| Asian | 1 | 0.2% |
| Black / African American | 8 | 1.4% |
| Hawaiian / Pacific | 0 | 0.0% |
| Hispanic or Latino | 18 | 3.2% |
| Native / Alaskan | 0 | 0.0% |
| White / Caucasian | 544 | 95.6% |
| Two or more Races | 15 | 2.6% |
| Some other Race | 1 | 0.2% |
| Total | 569 | 100.0% |
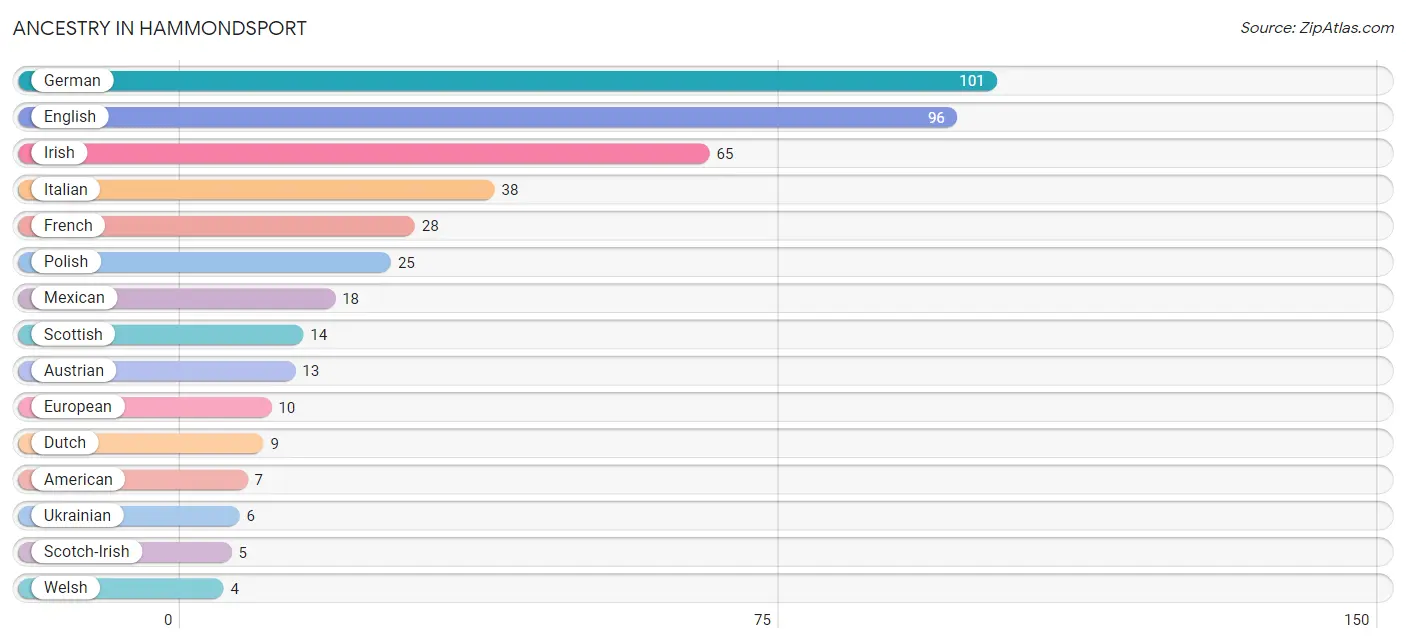
Ancestry in Hammondsport
The most populous ancestries reported in Hammondsport are German (101 | 17.7%), English (96 | 16.9%), Irish (65 | 11.4%), Italian (38 | 6.7%), and French (28 | 4.9%), together accounting for 57.6% of all Hammondsport residents.
| Ancestry | # Population | % Population |
| American | 7 | 1.2% |
| Austrian | 13 | 2.3% |
| Dutch | 9 | 1.6% |
| Eastern European | 2 | 0.4% |
| English | 96 | 16.9% |
| European | 10 | 1.8% |
| French | 28 | 4.9% |
| French Canadian | 3 | 0.5% |
| German | 101 | 17.7% |
| Irish | 65 | 11.4% |
| Iroquois | 3 | 0.5% |
| Italian | 38 | 6.7% |
| Korean | 2 | 0.4% |
| Mexican | 18 | 3.2% |
| Pennsylvania German | 2 | 0.4% |
| Polish | 25 | 4.4% |
| Portuguese | 2 | 0.4% |
| Russian | 1 | 0.2% |
| Scotch-Irish | 5 | 0.9% |
| Scottish | 14 | 2.5% |
| Slovak | 2 | 0.4% |
| Swedish | 2 | 0.4% |
| Ukrainian | 6 | 1.1% |
| Welsh | 4 | 0.7% | View All 24 Rows |
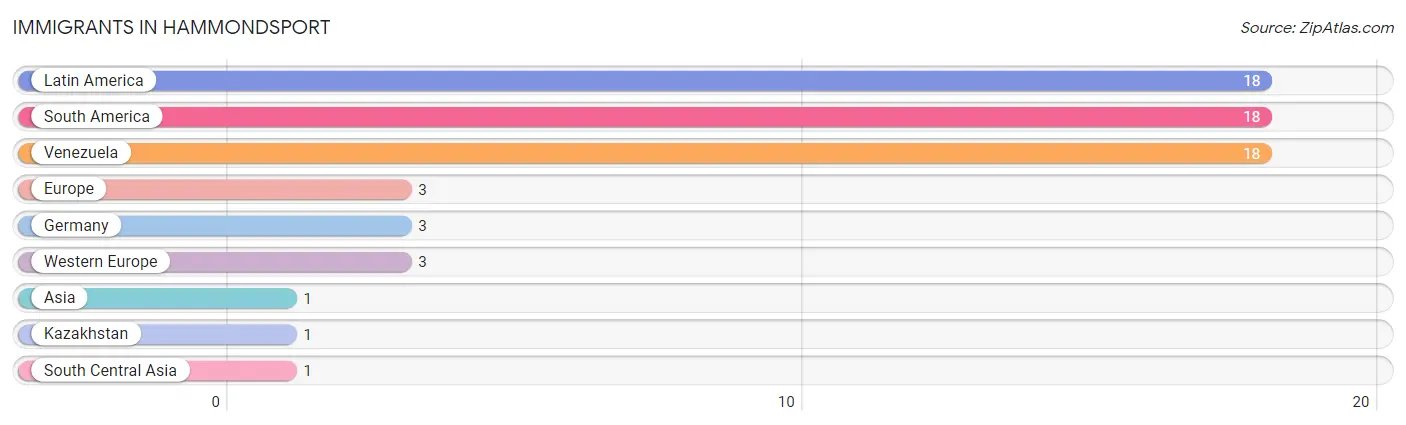
Immigrants in Hammondsport
The most numerous immigrant groups reported in Hammondsport came from Latin America (18 | 3.2%), South America (18 | 3.2%), Venezuela (18 | 3.2%), Europe (3 | 0.5%), and Germany (3 | 0.5%), together accounting for 10.5% of all Hammondsport residents.
| Immigration Origin | # Population | % Population |
| Asia | 1 | 0.2% |
| Europe | 3 | 0.5% |
| Germany | 3 | 0.5% |
| Kazakhstan | 1 | 0.2% |
| Latin America | 18 | 3.2% |
| South America | 18 | 3.2% |
| South Central Asia | 1 | 0.2% |
| Venezuela | 18 | 3.2% |
| Western Europe | 3 | 0.5% | View All 9 Rows |
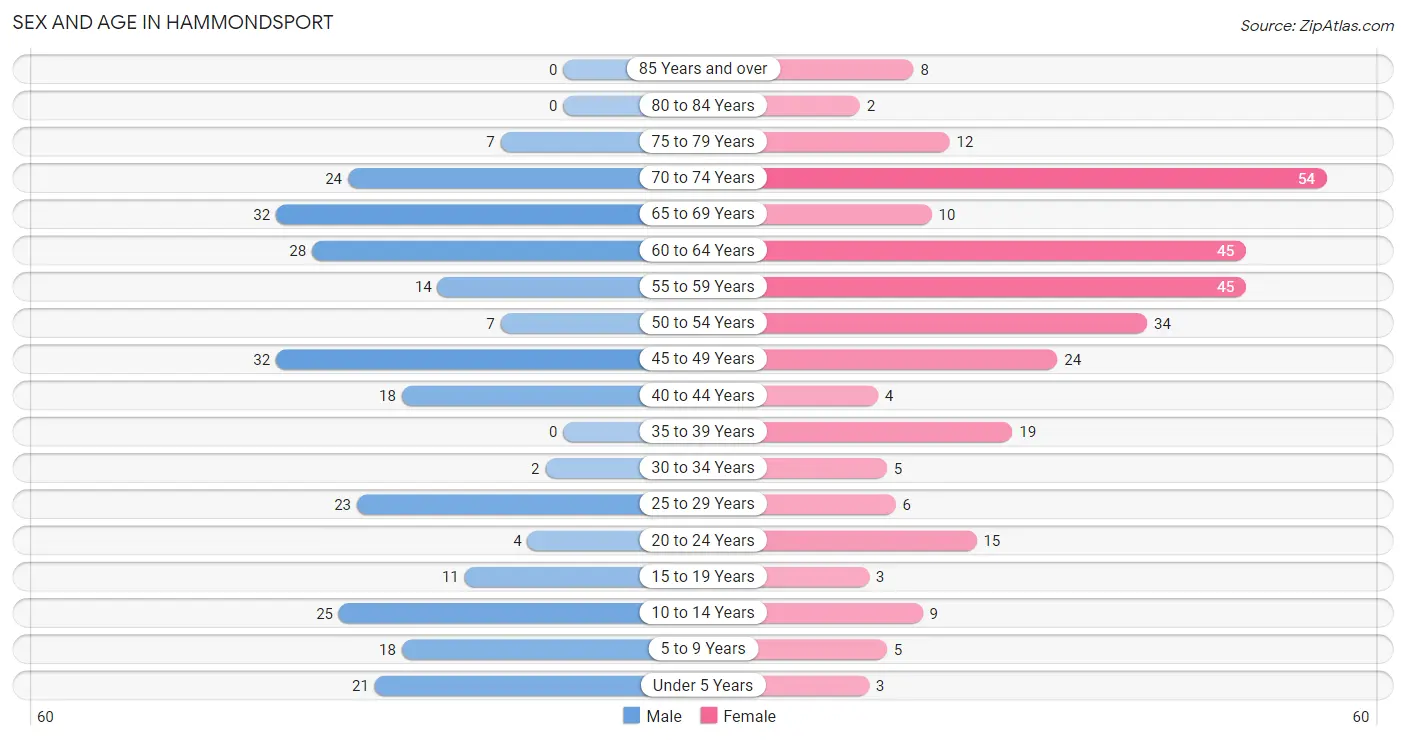
Sex and Age in Hammondsport
Sex and Age in Hammondsport
The most populous age groups in Hammondsport are 45 to 49 Years (32 | 12.0%) for men and 70 to 74 Years (54 | 17.8%) for women.
| Age Bracket | Male | Female |
| Under 5 Years | 21 (7.9%) | 3 (1.0%) |
| 5 to 9 Years | 18 (6.8%) | 5 (1.7%) |
| 10 to 14 Years | 25 (9.4%) | 9 (3.0%) |
| 15 to 19 Years | 11 (4.1%) | 3 (1.0%) |
| 20 to 24 Years | 4 (1.5%) | 15 (5.0%) |
| 25 to 29 Years | 23 (8.6%) | 6 (2.0%) |
| 30 to 34 Years | 2 (0.7%) | 5 (1.7%) |
| 35 to 39 Years | 0 (0.0%) | 19 (6.3%) |
| 40 to 44 Years | 18 (6.8%) | 4 (1.3%) |
| 45 to 49 Years | 32 (12.0%) | 24 (7.9%) |
| 50 to 54 Years | 7 (2.6%) | 34 (11.2%) |
| 55 to 59 Years | 14 (5.3%) | 45 (14.8%) |
| 60 to 64 Years | 28 (10.5%) | 45 (14.8%) |
| 65 to 69 Years | 32 (12.0%) | 10 (3.3%) |
| 70 to 74 Years | 24 (9.0%) | 54 (17.8%) |
| 75 to 79 Years | 7 (2.6%) | 12 (4.0%) |
| 80 to 84 Years | 0 (0.0%) | 2 (0.7%) |
| 85 Years and over | 0 (0.0%) | 8 (2.6%) |
| Total | 266 (100.0%) | 303 (100.0%) |
Families and Households in Hammondsport
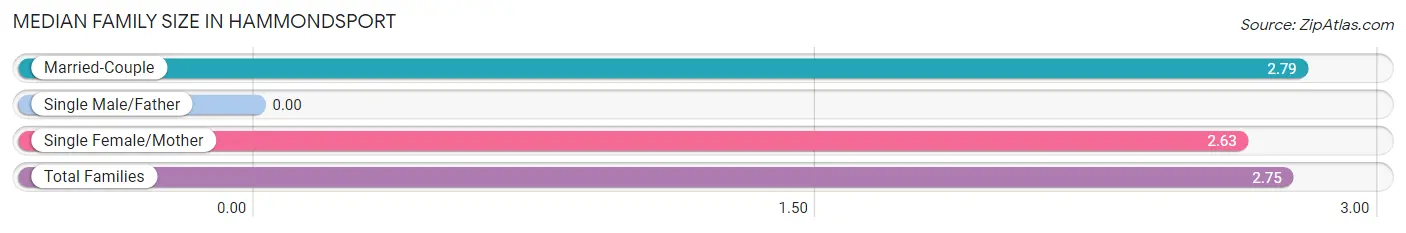
Median Family Size in Hammondsport
| Family Type | # Families | Family Size |
| Married-Couple | 99 (75.6%) | 2.79 |
| Single Male/Father | 0 (0.0%) | - |
| Single Female/Mother | 32 (24.4%) | 2.63 |
| Total Families | 131 (100.0%) | 2.75 |
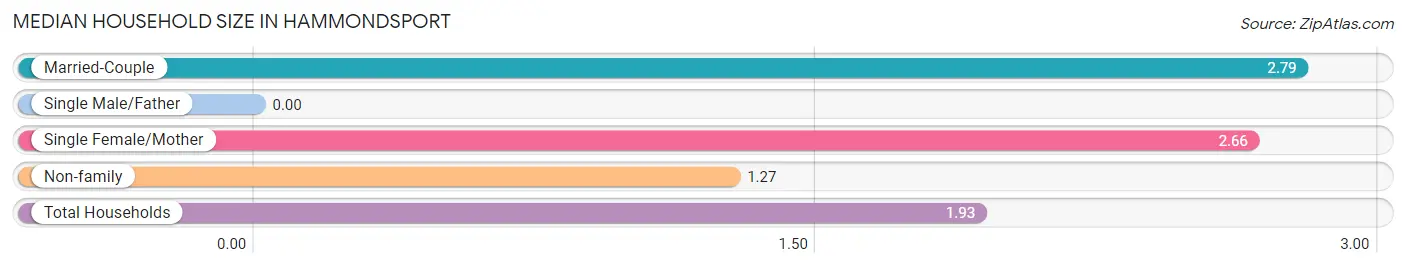
Median Household Size in Hammondsport
| Household Type | # Households | Household Size |
| Married-Couple | 99 (33.8%) | 2.79 |
| Single Male/Father | 0 (0.0%) | - |
| Single Female/Mother | 32 (10.9%) | 2.66 |
| Non-family | 162 (55.3%) | 1.27 |
| Total Households | 293 (100.0%) | 1.93 |
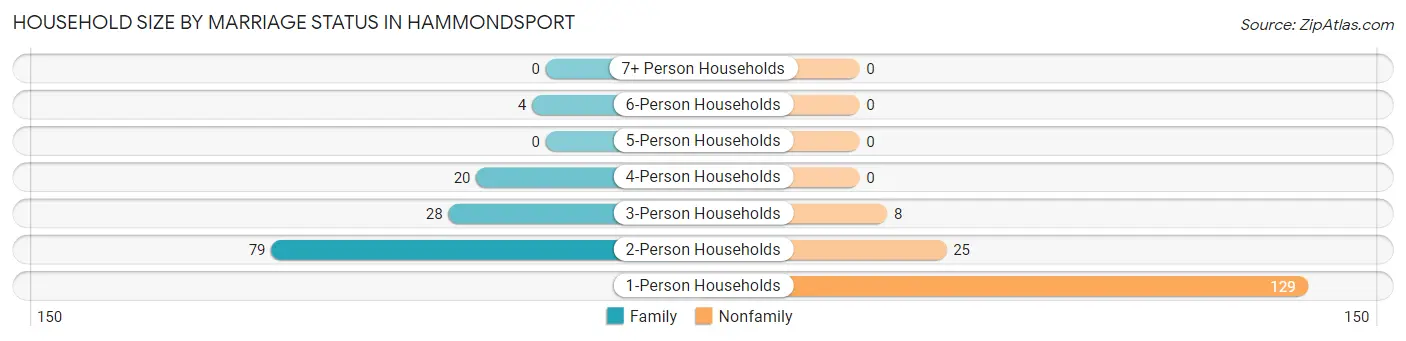
Household Size by Marriage Status in Hammondsport
Out of a total of 293 households in Hammondsport, 131 (44.7%) are family households, while 162 (55.3%) are nonfamily households. The most numerous type of family households are 2-person households, comprising 79, and the most common type of nonfamily households are 1-person households, comprising 129.
| Household Size | Family Households | Nonfamily Households |
| 1-Person Households | - | 129 (44.0%) |
| 2-Person Households | 79 (27.0%) | 25 (8.5%) |
| 3-Person Households | 28 (9.6%) | 8 (2.7%) |
| 4-Person Households | 20 (6.8%) | 0 (0.0%) |
| 5-Person Households | 0 (0.0%) | 0 (0.0%) |
| 6-Person Households | 4 (1.4%) | 0 (0.0%) |
| 7+ Person Households | 0 (0.0%) | 0 (0.0%) |
| Total | 131 (44.7%) | 162 (55.3%) |
Female Fertility in Hammondsport
Fertility by Age in Hammondsport
| Age Bracket | Women with Births | Births / 1,000 Women |
| 15 to 19 years | 0 (0.0%) | 0.0 |
| 20 to 34 years | 0 (0.0%) | 0.0 |
| 35 to 50 years | 0 (0.0%) | 0.0 |
| Total | 0 (0.0%) | 0.0 |
Fertility by Age by Marriage Status in Hammondsport
| Age Bracket | Married | Unmarried |
| 15 to 19 years | 0 (0.0%) | 0 (0.0%) |
| 20 to 34 years | 0 (0.0%) | 0 (0.0%) |
| 35 to 50 years | 0 (0.0%) | 0 (0.0%) |
| Total | 0 (0.0%) | 0 (0.0%) |
Fertility by Education in Hammondsport
| Educational Attainment | Women with Births | Births / 1,000 Women |
| Less than High School | 0 (0.0%) | 0.0 |
| High School Diploma | 0 (0.0%) | 0.0 |
| College or Associate's Degree | 0 (0.0%) | 0.0 |
| Bachelor's Degree | 0 (0.0%) | 0.0 |
| Graduate Degree | 0 (0.0%) | 0.0 |
| Total | 0 (0.0%) | 0.0 |
Fertility by Education by Marriage Status in Hammondsport
| Educational Attainment | Married | Unmarried |
| Less than High School | 0 (0.0%) | 0 (0.0%) |
| High School Diploma | 0 (0.0%) | 0 (0.0%) |
| College or Associate's Degree | 0 (0.0%) | 0 (0.0%) |
| Bachelor's Degree | 0 (0.0%) | 0 (0.0%) |
| Graduate Degree | 0 (0.0%) | 0 (0.0%) |
| Total | 0 (0.0%) | 0 (0.0%) |
Income in Hammondsport
Income Overview in Hammondsport
Per Capita Income in Hammondsport is $41,433, while median incomes of families and households are $79,750 and $64,375 respectively.
| Characteristic | Number | Measure |
| Per Capita Income | 569 | $41,433 |
| Median Family Income | 131 | $79,750 |
| Mean Family Income | 131 | $98,467 |
| Median Household Income | 293 | $64,375 |
| Mean Household Income | 293 | $78,439 |
| Income Deficit | 131 | $0 |
| Wage / Income Gap (%) | 569 | 32.70% |
| Wage / Income Gap ($) | 569 | 67.30¢ per $1 |
| Gini / Inequality Index | 569 | 0.44 |
Earnings by Sex in Hammondsport
Average Earnings in Hammondsport are $36,625, $47,917 for men and $32,250 for women, a difference of 32.7%.
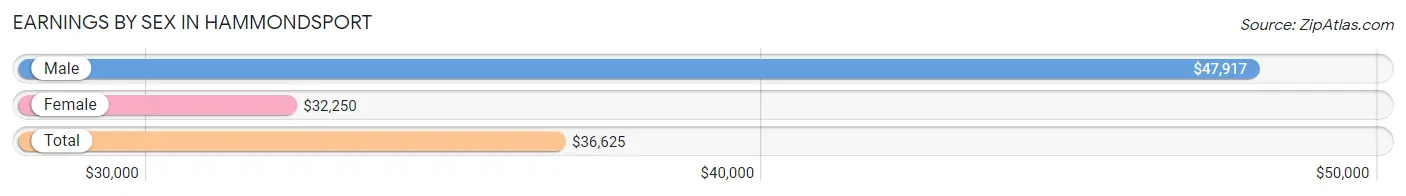
| Sex | Number | Average Earnings |
| Male | 119 (37.5%) | $47,917 |
| Female | 198 (62.5%) | $32,250 |
| Total | 317 (100.0%) | $36,625 |
Earnings by Sex by Income Bracket in Hammondsport
The most common earnings brackets in Hammondsport are $75,000 to $99,999 for men (21 | 17.6%) and $65,000 to $74,999 for women (34 | 17.2%).
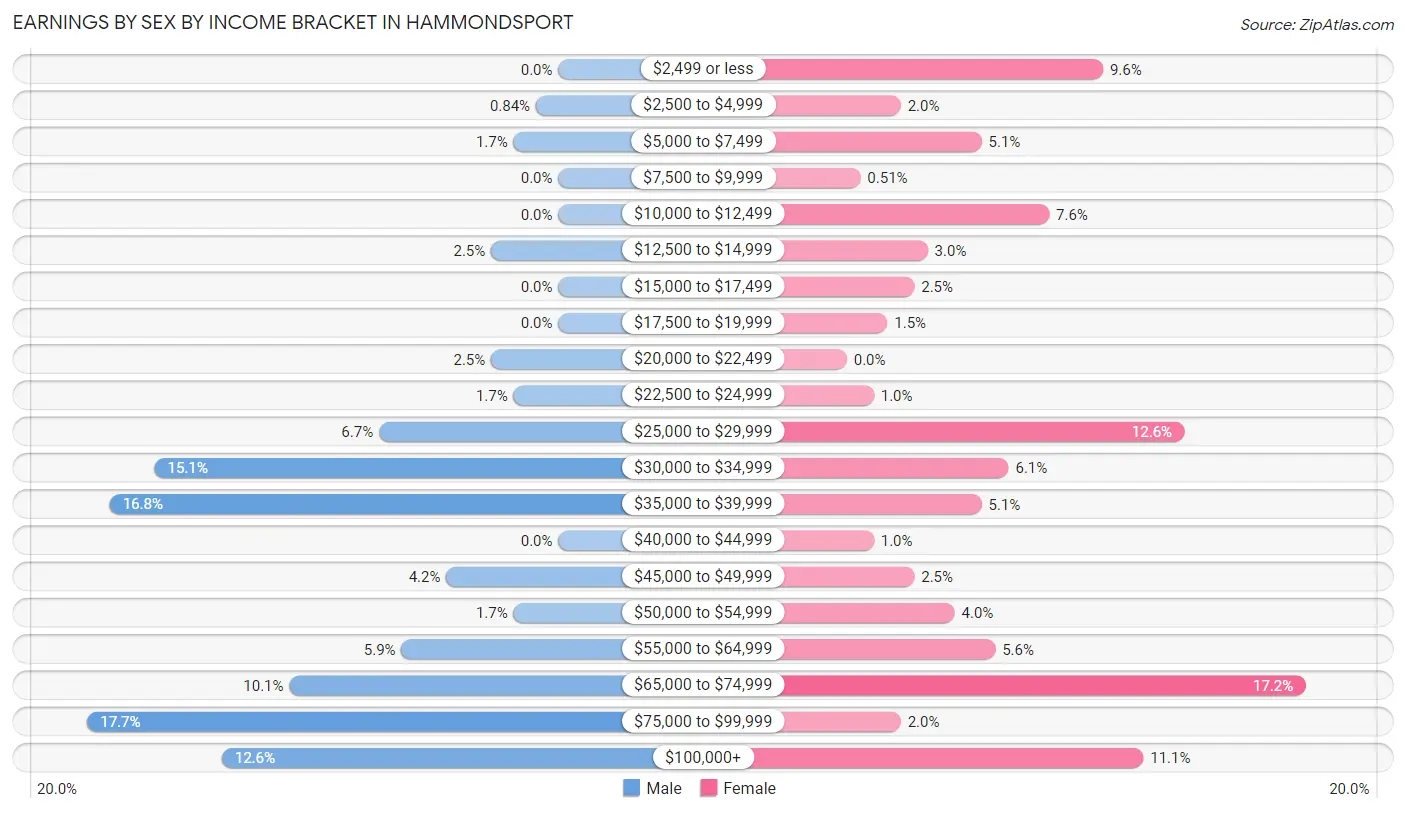
| Income | Male | Female |
| $2,499 or less | 0 (0.0%) | 19 (9.6%) |
| $2,500 to $4,999 | 1 (0.8%) | 4 (2.0%) |
| $5,000 to $7,499 | 2 (1.7%) | 10 (5.1%) |
| $7,500 to $9,999 | 0 (0.0%) | 1 (0.5%) |
| $10,000 to $12,499 | 0 (0.0%) | 15 (7.6%) |
| $12,500 to $14,999 | 3 (2.5%) | 6 (3.0%) |
| $15,000 to $17,499 | 0 (0.0%) | 5 (2.5%) |
| $17,500 to $19,999 | 0 (0.0%) | 3 (1.5%) |
| $20,000 to $22,499 | 3 (2.5%) | 0 (0.0%) |
| $22,500 to $24,999 | 2 (1.7%) | 2 (1.0%) |
| $25,000 to $29,999 | 8 (6.7%) | 25 (12.6%) |
| $30,000 to $34,999 | 18 (15.1%) | 12 (6.1%) |
| $35,000 to $39,999 | 20 (16.8%) | 10 (5.1%) |
| $40,000 to $44,999 | 0 (0.0%) | 2 (1.0%) |
| $45,000 to $49,999 | 5 (4.2%) | 5 (2.5%) |
| $50,000 to $54,999 | 2 (1.7%) | 8 (4.0%) |
| $55,000 to $64,999 | 7 (5.9%) | 11 (5.6%) |
| $65,000 to $74,999 | 12 (10.1%) | 34 (17.2%) |
| $75,000 to $99,999 | 21 (17.6%) | 4 (2.0%) |
| $100,000+ | 15 (12.6%) | 22 (11.1%) |
| Total | 119 (100.0%) | 198 (100.0%) |
Earnings by Sex by Educational Attainment in Hammondsport
Average earnings in Hammondsport are $49,583 for men and $36,500 for women, a difference of 26.4%. Men with an educational attainment of graduate degree enjoy the highest average annual earnings of $80,729, while those with high school diploma education earn the least with $34,922. Women with an educational attainment of graduate degree earn the most with the average annual earnings of $69,028, while those with bachelor's degree education have the smallest earnings of $68,583.
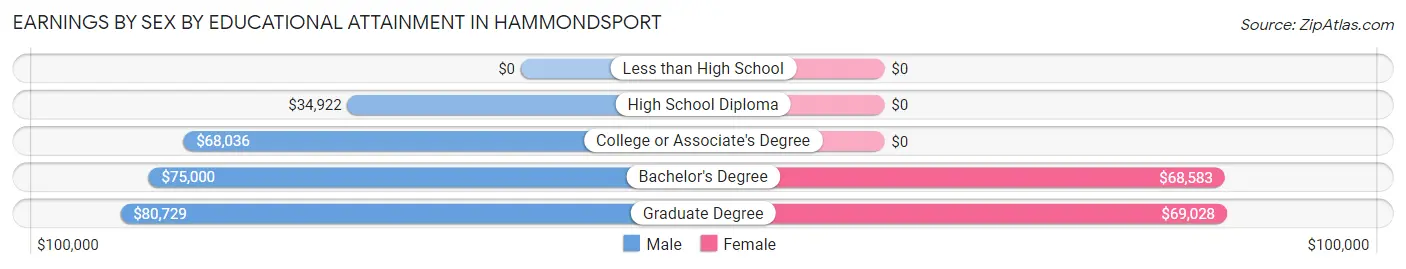
| Educational Attainment | Male Income | Female Income |
| Less than High School | - | - |
| High School Diploma | $34,922 | $0 |
| College or Associate's Degree | $68,036 | $0 |
| Bachelor's Degree | $75,000 | $68,583 |
| Graduate Degree | $80,729 | $69,028 |
| Total | $49,583 | $36,500 |
Family Income in Hammondsport
Family Income Brackets in Hammondsport
According to the Hammondsport family income data, there are 38 families falling into the $50,000 to $74,999 income range, which is the most common income bracket and makes up 29.0% of all families.
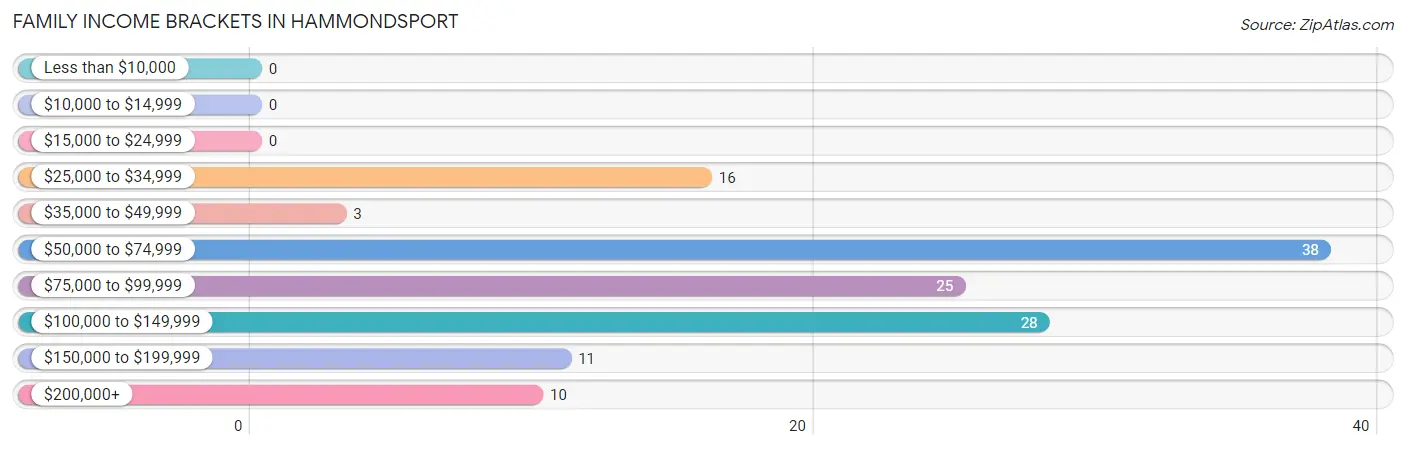
| Income Bracket | # Families | % Families |
| Less than $10,000 | 0 | 0.0% |
| $10,000 to $14,999 | 0 | 0.0% |
| $15,000 to $24,999 | 0 | 0.0% |
| $25,000 to $34,999 | 16 | 12.2% |
| $35,000 to $49,999 | 3 | 2.3% |
| $50,000 to $74,999 | 38 | 29.0% |
| $75,000 to $99,999 | 25 | 19.1% |
| $100,000 to $149,999 | 28 | 21.4% |
| $150,000 to $199,999 | 11 | 8.4% |
| $200,000+ | 10 | 7.6% |
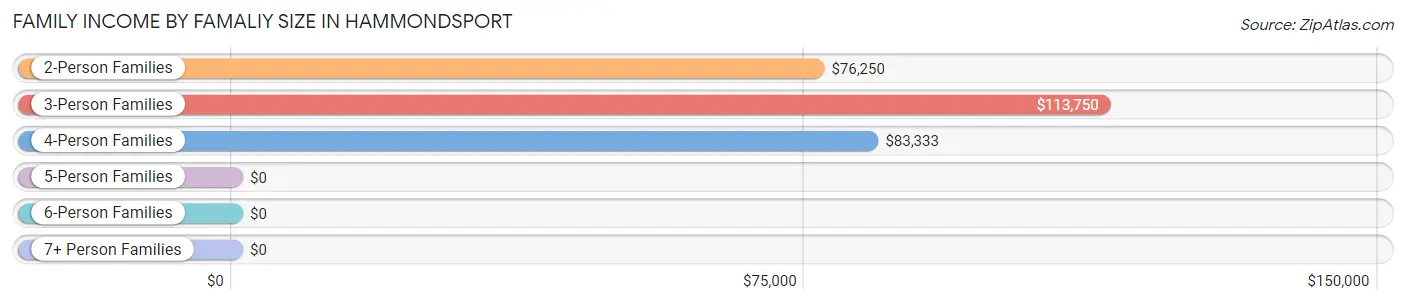
Family Income by Famaliy Size in Hammondsport
3-person families (18 | 13.7%) account for the highest median family income in Hammondsport with $113,750 per family, while 2-person families (89 | 67.9%) have the highest median income of $38,125 per family member.
| Income Bracket | # Families | Median Income |
| 2-Person Families | 89 (67.9%) | $76,250 |
| 3-Person Families | 18 (13.7%) | $113,750 |
| 4-Person Families | 20 (15.3%) | $83,333 |
| 5-Person Families | 0 (0.0%) | $0 |
| 6-Person Families | 4 (3.0%) | $0 |
| 7+ Person Families | 0 (0.0%) | $0 |
| Total | 131 (100.0%) | $79,750 |
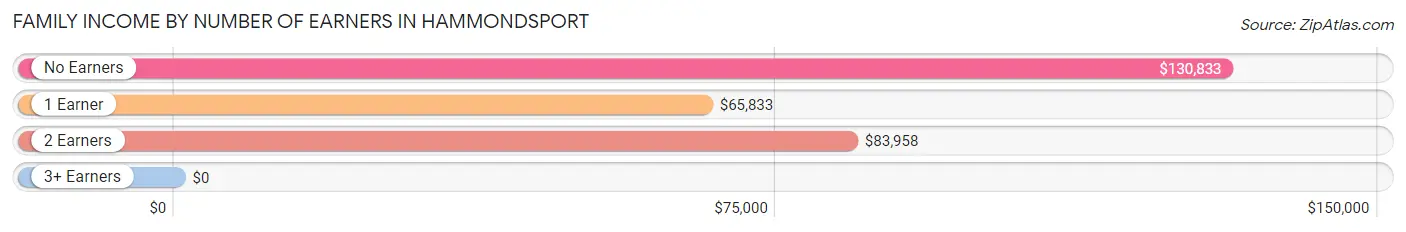
Family Income by Number of Earners in Hammondsport
| Number of Earners | # Families | Median Income |
| No Earners | 12 (9.2%) | $130,833 |
| 1 Earner | 46 (35.1%) | $65,833 |
| 2 Earners | 71 (54.2%) | $83,958 |
| 3+ Earners | 2 (1.5%) | $0 |
| Total | 131 (100.0%) | $79,750 |
Household Income in Hammondsport
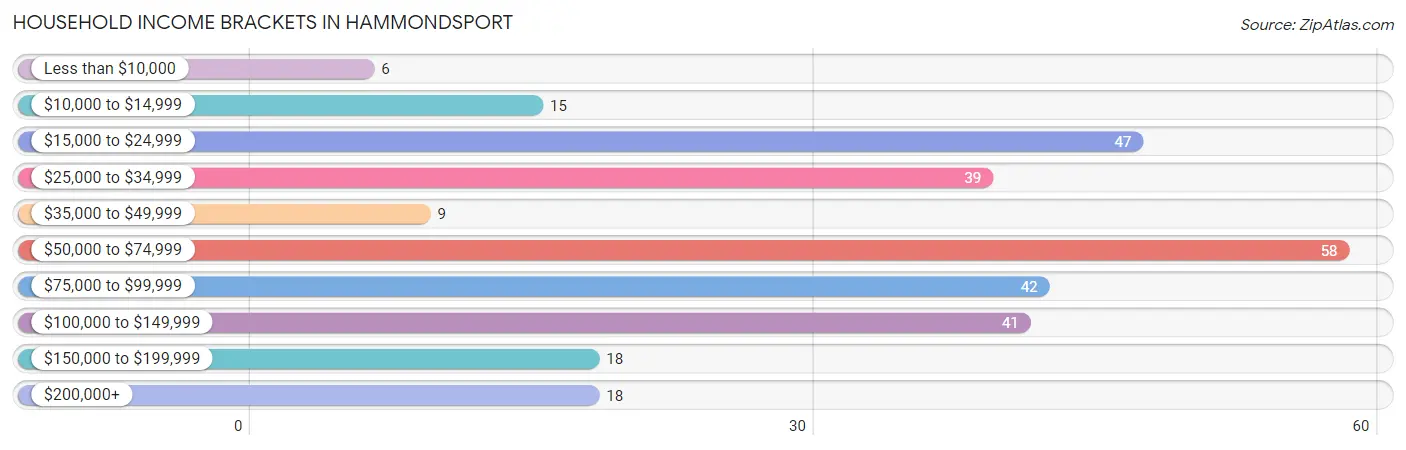
Household Income Brackets in Hammondsport
With 58 households falling in the category, the $50,000 to $74,999 income range is the most frequent in Hammondsport, accounting for 19.8% of all households. In contrast, only 6 households (2.1%) fall into the less than $10,000 income bracket, making it the least populous group.
| Income Bracket | # Households | % Households |
| Less than $10,000 | 6 | 2.0% |
| $10,000 to $14,999 | 15 | 5.1% |
| $15,000 to $24,999 | 47 | 16.0% |
| $25,000 to $34,999 | 39 | 13.3% |
| $35,000 to $49,999 | 9 | 3.1% |
| $50,000 to $74,999 | 58 | 19.8% |
| $75,000 to $99,999 | 42 | 14.3% |
| $100,000 to $149,999 | 41 | 14.0% |
| $150,000 to $199,999 | 18 | 6.1% |
| $200,000+ | 18 | 6.1% |
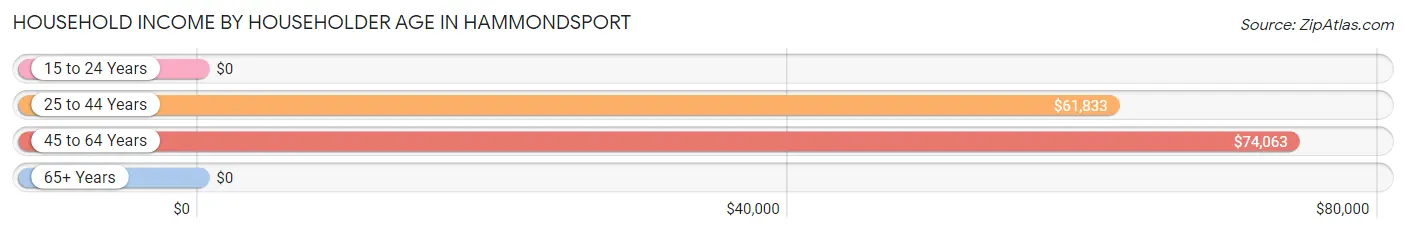
Household Income by Householder Age in Hammondsport
The median household income in Hammondsport is $64,375, with the highest median household income of $74,063 found in the 45 to 64 years age bracket for the primary householder. A total of 132 households (45.1%) fall into this category.
| Income Bracket | # Households | Median Income |
| 15 to 24 Years | 0 (0.0%) | $0 |
| 25 to 44 Years | 48 (16.4%) | $61,833 |
| 45 to 64 Years | 132 (45.1%) | $74,063 |
| 65+ Years | 113 (38.6%) | $0 |
| Total | 293 (100.0%) | $64,375 |
Poverty in Hammondsport
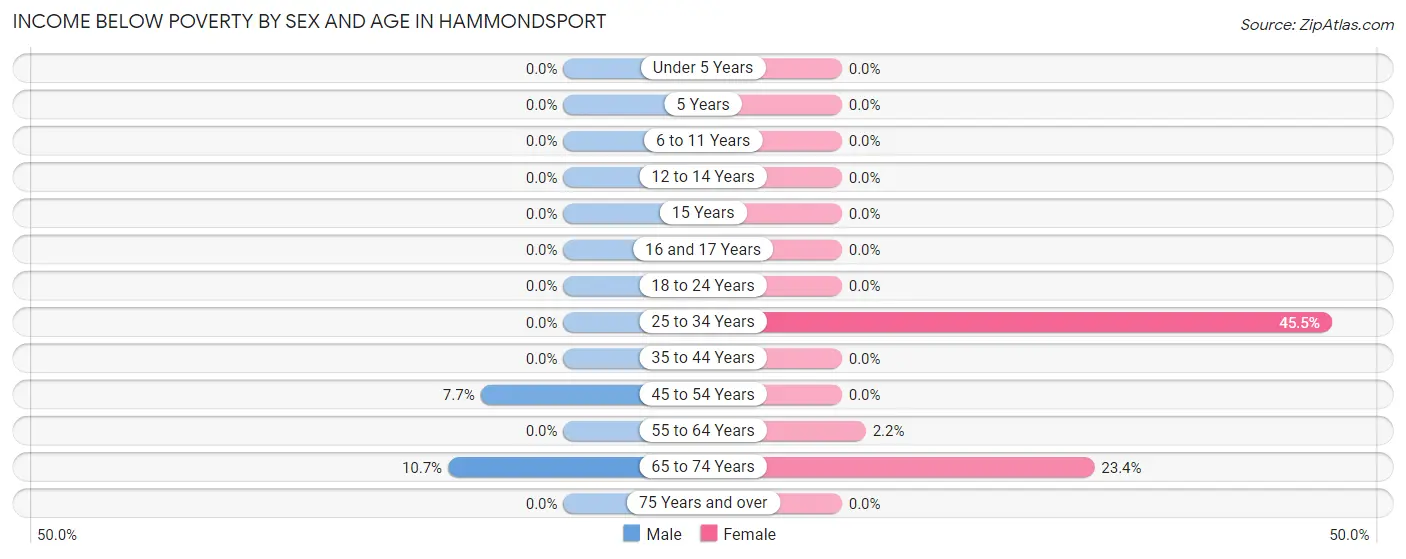
Income Below Poverty by Sex and Age in Hammondsport
With 3.4% poverty level for males and 7.3% for females among the residents of Hammondsport, 65 to 74 year old males and 25 to 34 year old females are the most vulnerable to poverty, with 6 males (10.7%) and 5 females (45.5%) in their respective age groups living below the poverty level.
| Age Bracket | Male | Female |
| Under 5 Years | 0 (0.0%) | 0 (0.0%) |
| 5 Years | 0 (0.0%) | 0 (0.0%) |
| 6 to 11 Years | 0 (0.0%) | 0 (0.0%) |
| 12 to 14 Years | 0 (0.0%) | 0 (0.0%) |
| 15 Years | 0 (0.0%) | 0 (0.0%) |
| 16 and 17 Years | 0 (0.0%) | 0 (0.0%) |
| 18 to 24 Years | 0 (0.0%) | 0 (0.0%) |
| 25 to 34 Years | 0 (0.0%) | 5 (45.5%) |
| 35 to 44 Years | 0 (0.0%) | 0 (0.0%) |
| 45 to 54 Years | 3 (7.7%) | 0 (0.0%) |
| 55 to 64 Years | 0 (0.0%) | 2 (2.2%) |
| 65 to 74 Years | 6 (10.7%) | 15 (23.4%) |
| 75 Years and over | 0 (0.0%) | 0 (0.0%) |
| Total | 9 (3.4%) | 22 (7.3%) |
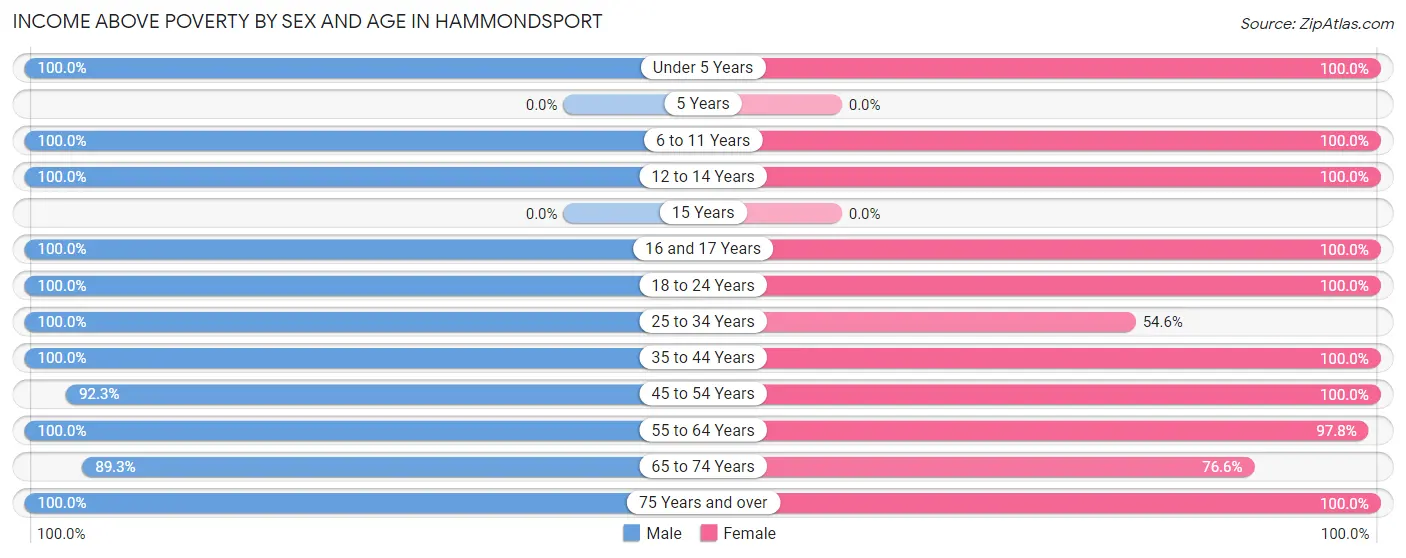
Income Above Poverty by Sex and Age in Hammondsport
According to the poverty statistics in Hammondsport, males aged under 5 years and females aged under 5 years are the age groups that are most secure financially, with 100.0% of males and 100.0% of females in these age groups living above the poverty line.
| Age Bracket | Male | Female |
| Under 5 Years | 20 (100.0%) | 3 (100.0%) |
| 5 Years | 0 (0.0%) | 0 (0.0%) |
| 6 to 11 Years | 28 (100.0%) | 5 (100.0%) |
| 12 to 14 Years | 15 (100.0%) | 9 (100.0%) |
| 15 Years | 0 (0.0%) | 0 (0.0%) |
| 16 and 17 Years | 11 (100.0%) | 3 (100.0%) |
| 18 to 24 Years | 4 (100.0%) | 15 (100.0%) |
| 25 to 34 Years | 25 (100.0%) | 6 (54.5%) |
| 35 to 44 Years | 18 (100.0%) | 23 (100.0%) |
| 45 to 54 Years | 36 (92.3%) | 58 (100.0%) |
| 55 to 64 Years | 42 (100.0%) | 88 (97.8%) |
| 65 to 74 Years | 50 (89.3%) | 49 (76.6%) |
| 75 Years and over | 7 (100.0%) | 22 (100.0%) |
| Total | 256 (96.6%) | 281 (92.7%) |
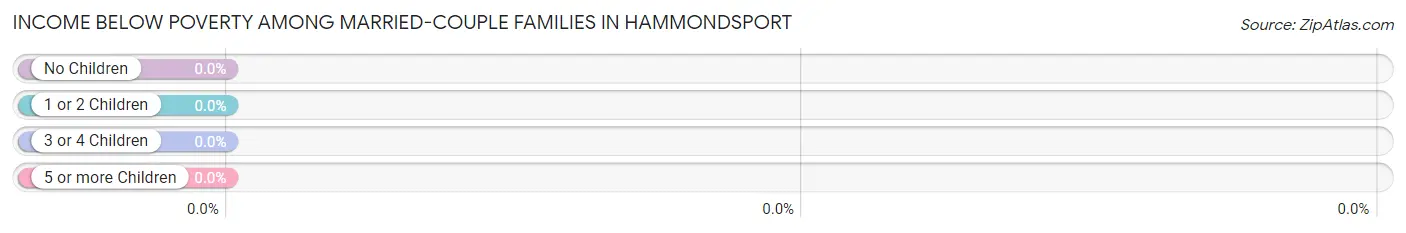
Income Below Poverty Among Married-Couple Families in Hammondsport
| Children | Above Poverty | Below Poverty |
| No Children | 67 (100.0%) | 0 (0.0%) |
| 1 or 2 Children | 28 (100.0%) | 0 (0.0%) |
| 3 or 4 Children | 4 (100.0%) | 0 (0.0%) |
| 5 or more Children | 0 (0.0%) | 0 (0.0%) |
| Total | 99 (100.0%) | 0 (0.0%) |
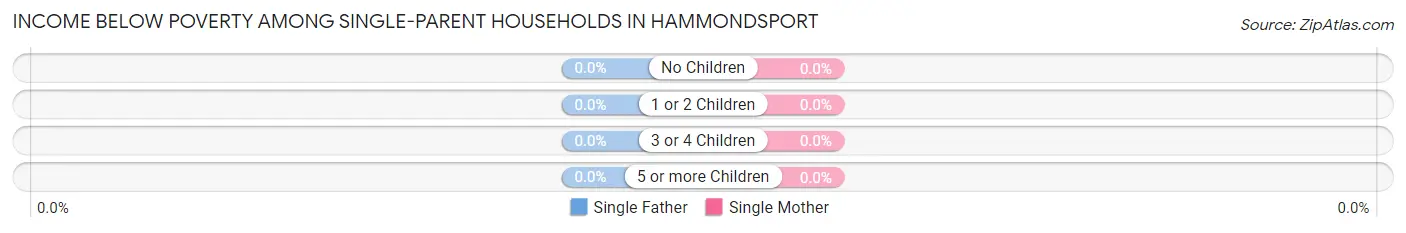
Income Below Poverty Among Single-Parent Households in Hammondsport
| Children | Single Father | Single Mother |
| No Children | 0 (0.0%) | 0 (0.0%) |
| 1 or 2 Children | 0 (0.0%) | 0 (0.0%) |
| 3 or 4 Children | 0 (0.0%) | 0 (0.0%) |
| 5 or more Children | 0 (0.0%) | 0 (0.0%) |
| Total | 0 (0.0%) | 0 (0.0%) |
Income Below Poverty Among Married-Couple vs Single-Parent Households in Hammondsport
| Children | Married-Couple Families | Single-Parent Households |
| No Children | 0 (0.0%) | 0 (0.0%) |
| 1 or 2 Children | 0 (0.0%) | 0 (0.0%) |
| 3 or 4 Children | 0 (0.0%) | 0 (0.0%) |
| 5 or more Children | 0 (0.0%) | 0 (0.0%) |
| Total | 0 (0.0%) | 0 (0.0%) |
Employment Characteristics in Hammondsport
Employment by Class of Employer in Hammondsport
Among the 264 employed individuals in Hammondsport, private company employees (156 | 59.1%), local government employees (36 | 13.6%), and not-for-profit organizations (29 | 11.0%) make up the most common classes of employment.
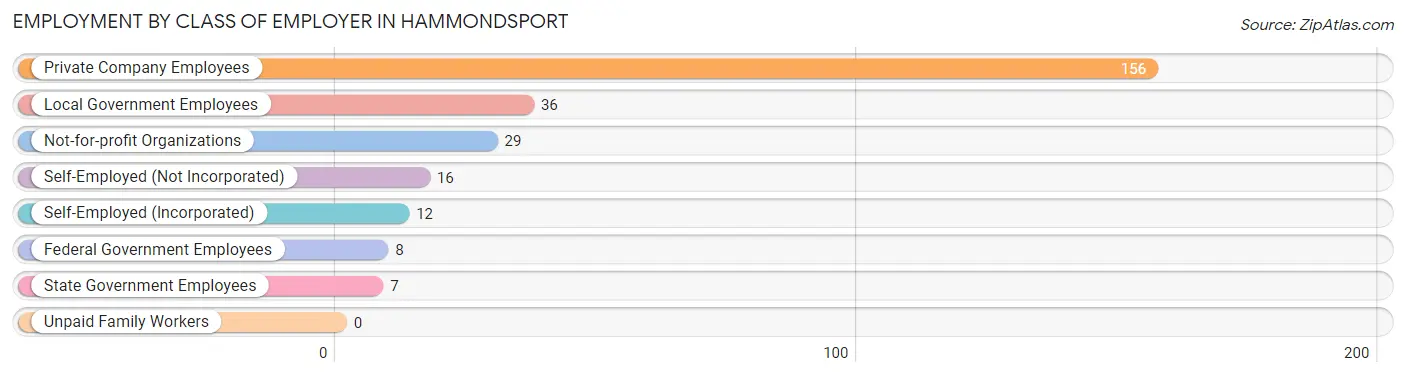
| Employer Class | # Employees | % Employees |
| Private Company Employees | 156 | 59.1% |
| Self-Employed (Incorporated) | 12 | 4.5% |
| Self-Employed (Not Incorporated) | 16 | 6.1% |
| Not-for-profit Organizations | 29 | 11.0% |
| Local Government Employees | 36 | 13.6% |
| State Government Employees | 7 | 2.6% |
| Federal Government Employees | 8 | 3.0% |
| Unpaid Family Workers | 0 | 0.0% |
| Total | 264 | 100.0% |
Employment Status by Age in Hammondsport
According to the labor force statistics for Hammondsport, out of the total population over 16 years of age (488), 57.6% or 281 individuals are in the labor force, with 2.5% or 7 of them unemployed. The age group with the highest labor force participation rate is 20 to 24 years, with 100.0% or 19 individuals in the labor force. Within the labor force, the 60 to 64 years age range has the highest percentage of unemployed individuals, with 14.3% or 7 of them being unemployed.
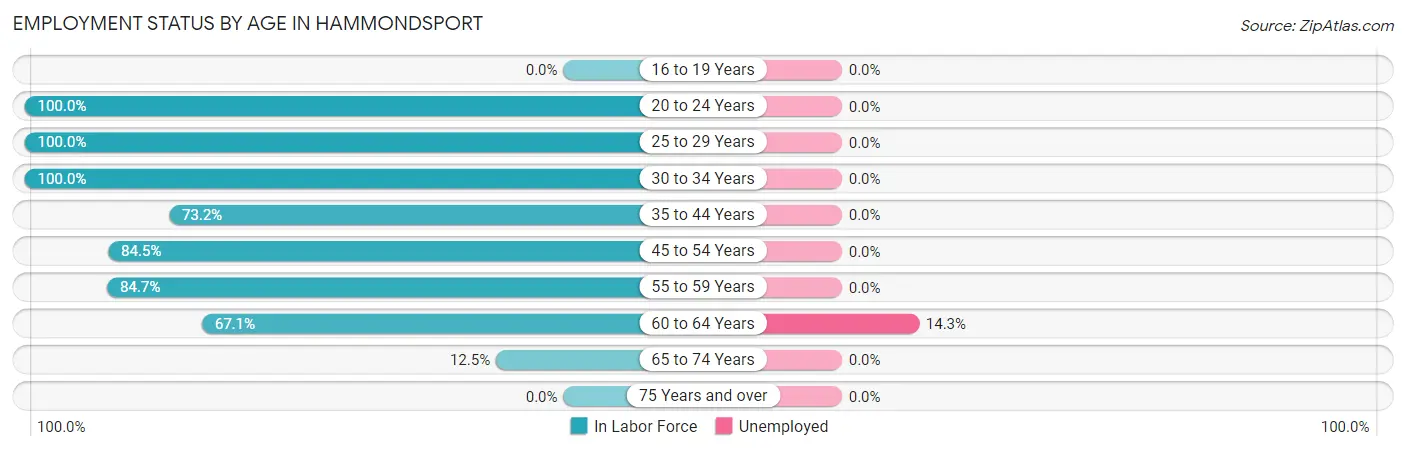
| Age Bracket | In Labor Force | Unemployed |
| 16 to 19 Years | 0 (0.0%) | 0 (0.0%) |
| 20 to 24 Years | 19 (100.0%) | 0 (0.0%) |
| 25 to 29 Years | 29 (100.0%) | 0 (0.0%) |
| 30 to 34 Years | 7 (100.0%) | 0 (0.0%) |
| 35 to 44 Years | 30 (73.2%) | 0 (0.0%) |
| 45 to 54 Years | 82 (84.5%) | 0 (0.0%) |
| 55 to 59 Years | 50 (84.7%) | 0 (0.0%) |
| 60 to 64 Years | 49 (67.1%) | 7 (14.3%) |
| 65 to 74 Years | 15 (12.5%) | 0 (0.0%) |
| 75 Years and over | 0 (0.0%) | 0 (0.0%) |
| Total | 281 (57.6%) | 7 (2.5%) |
Employment Status by Educational Attainment in Hammondsport
According to labor force statistics for Hammondsport, 80.7% of individuals (247) out of the total population between 25 and 64 years of age (306) are in the labor force, with 2.8% or 7 of them being unemployed. The group with the highest labor force participation rate are those with the educational attainment of less than high school, with 100.0% or 14 individuals in the labor force. Within the labor force, individuals with bachelor's degree or higher education have the highest percentage of unemployment, with 7.1% or 7 of them being unemployed.
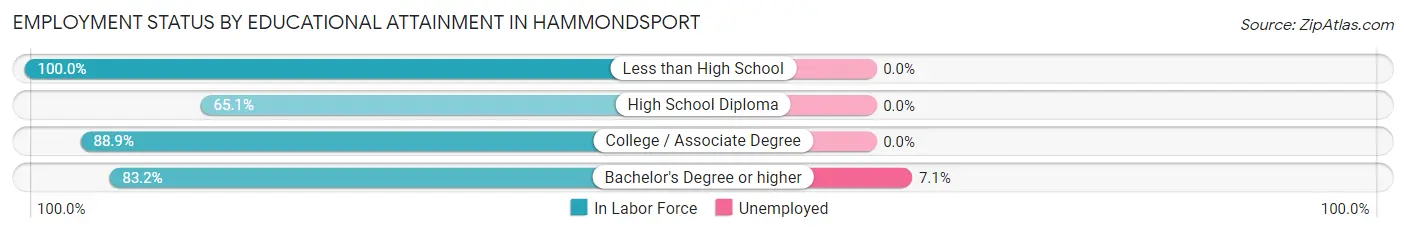
| Educational Attainment | In Labor Force | Unemployed |
| Less than High School | 14 (100.0%) | 0 (0.0%) |
| High School Diploma | 54 (65.1%) | 0 (0.0%) |
| College / Associate Degree | 80 (88.9%) | 0 (0.0%) |
| Bachelor's Degree or higher | 99 (83.2%) | 8 (7.1%) |
| Total | 247 (80.7%) | 9 (2.8%) |
Employment Occupations by Sex in Hammondsport
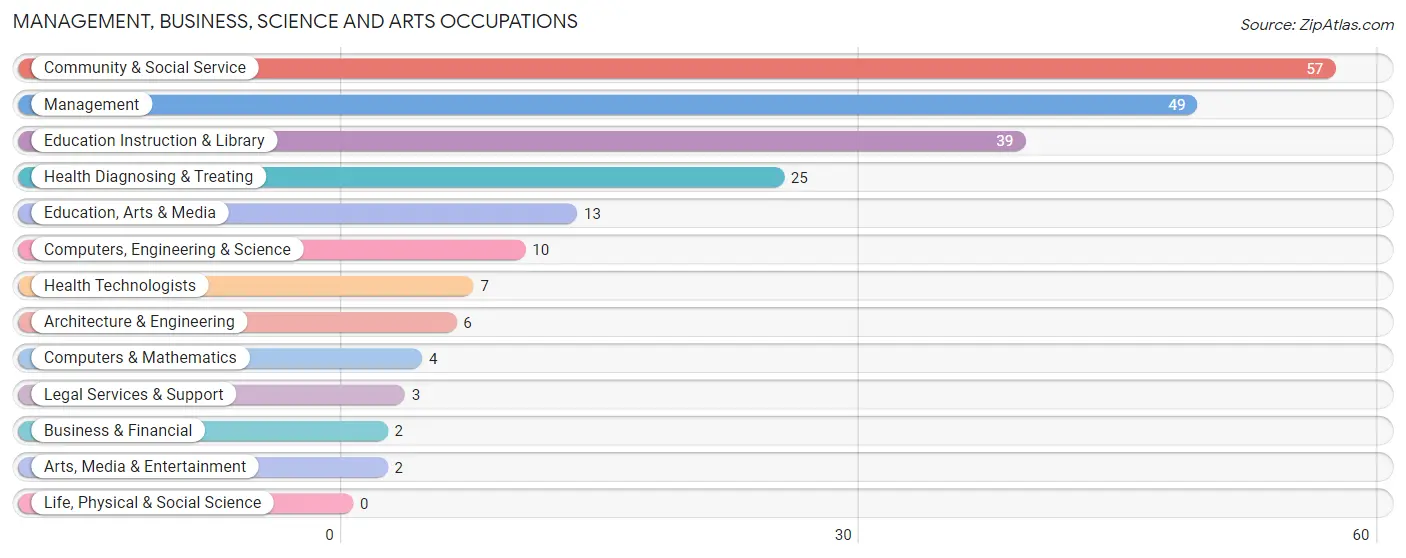
Management, Business, Science and Arts Occupations
The most common Management, Business, Science and Arts occupations in Hammondsport are Community & Social Service (57 | 20.8%), Management (49 | 17.9%), Education Instruction & Library (39 | 14.2%), Health Diagnosing & Treating (25 | 9.1%), and Education, Arts & Media (13 | 4.7%).
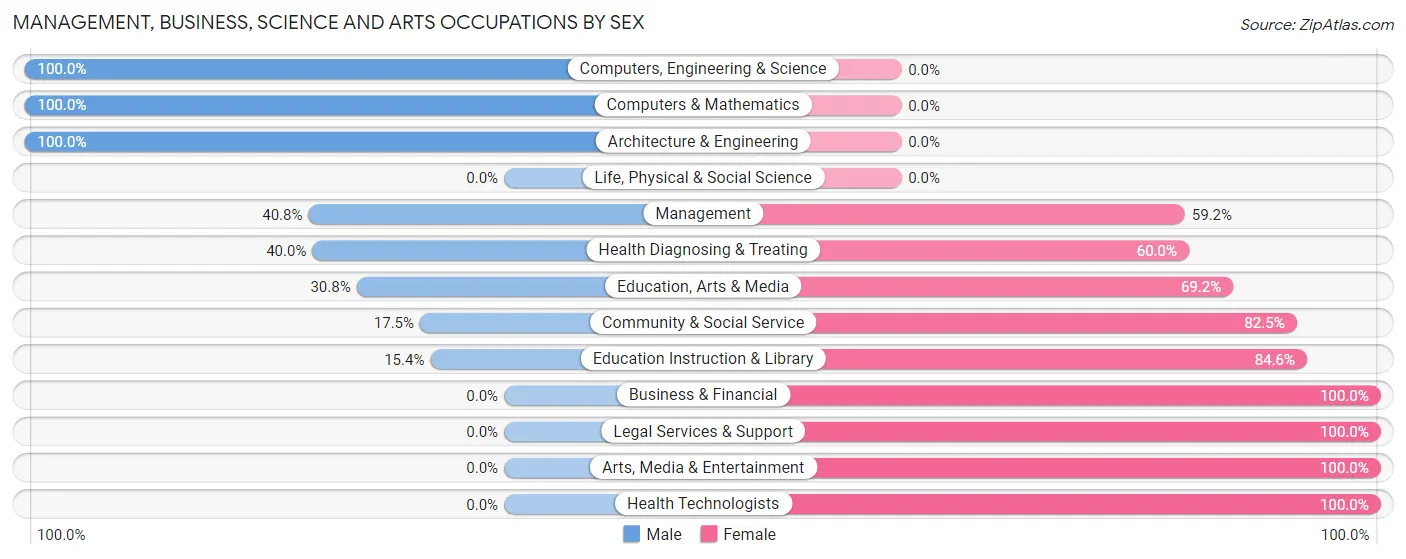
Management, Business, Science and Arts Occupations by Sex
Within the Management, Business, Science and Arts occupations in Hammondsport, the most male-oriented occupations are Computers, Engineering & Science (100.0%), Computers & Mathematics (100.0%), and Architecture & Engineering (100.0%), while the most female-oriented occupations are Business & Financial (100.0%), Legal Services & Support (100.0%), and Arts, Media & Entertainment (100.0%).
| Occupation | Male | Female |
| Management | 20 (40.8%) | 29 (59.2%) |
| Business & Financial | 0 (0.0%) | 2 (100.0%) |
| Computers, Engineering & Science | 10 (100.0%) | 0 (0.0%) |
| Computers & Mathematics | 4 (100.0%) | 0 (0.0%) |
| Architecture & Engineering | 6 (100.0%) | 0 (0.0%) |
| Life, Physical & Social Science | 0 (0.0%) | 0 (0.0%) |
| Community & Social Service | 10 (17.5%) | 47 (82.5%) |
| Education, Arts & Media | 4 (30.8%) | 9 (69.2%) |
| Legal Services & Support | 0 (0.0%) | 3 (100.0%) |
| Education Instruction & Library | 6 (15.4%) | 33 (84.6%) |
| Arts, Media & Entertainment | 0 (0.0%) | 2 (100.0%) |
| Health Diagnosing & Treating | 10 (40.0%) | 15 (60.0%) |
| Health Technologists | 0 (0.0%) | 7 (100.0%) |
| Total (Category) | 50 (35.0%) | 93 (65.0%) |
| Total (Overall) | 110 (40.2%) | 164 (59.9%) |
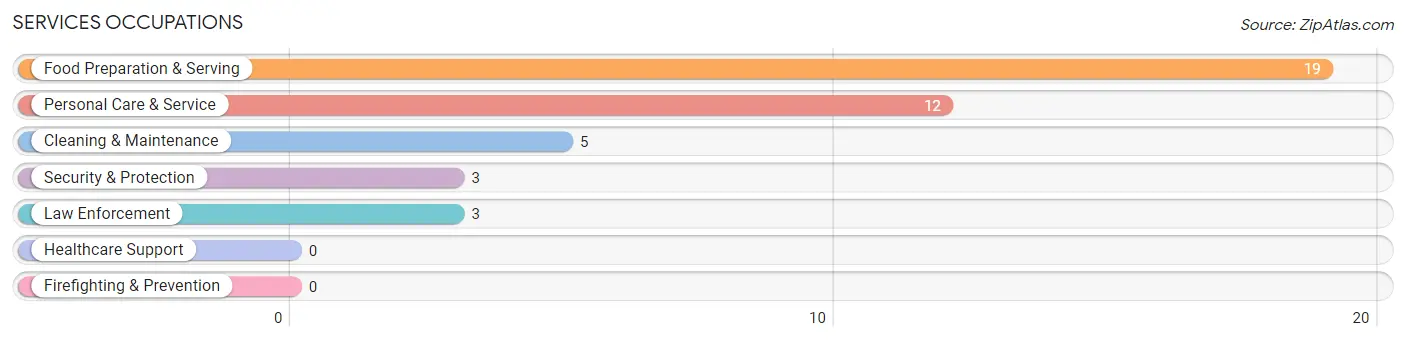
Services Occupations
The most common Services occupations in Hammondsport are Food Preparation & Serving (19 | 6.9%), Personal Care & Service (12 | 4.4%), Cleaning & Maintenance (5 | 1.8%), Security & Protection (3 | 1.1%), and Law Enforcement (3 | 1.1%).
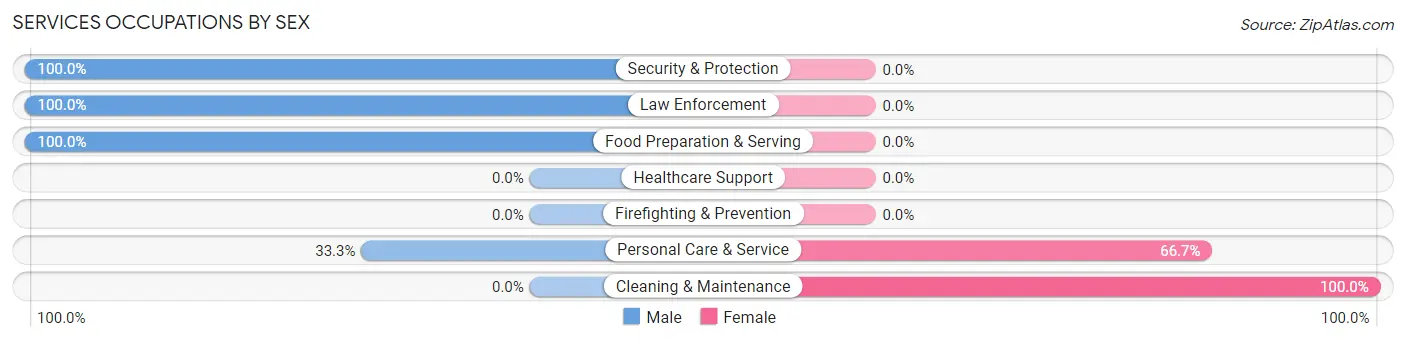
Services Occupations by Sex
Within the Services occupations in Hammondsport, the most male-oriented occupations are Security & Protection (100.0%), Law Enforcement (100.0%), and Food Preparation & Serving (100.0%), while the most female-oriented occupations are Cleaning & Maintenance (100.0%), and Personal Care & Service (66.7%).
| Occupation | Male | Female |
| Healthcare Support | 0 (0.0%) | 0 (0.0%) |
| Security & Protection | 3 (100.0%) | 0 (0.0%) |
| Firefighting & Prevention | 0 (0.0%) | 0 (0.0%) |
| Law Enforcement | 3 (100.0%) | 0 (0.0%) |
| Food Preparation & Serving | 19 (100.0%) | 0 (0.0%) |
| Cleaning & Maintenance | 0 (0.0%) | 5 (100.0%) |
| Personal Care & Service | 4 (33.3%) | 8 (66.7%) |
| Total (Category) | 26 (66.7%) | 13 (33.3%) |
| Total (Overall) | 110 (40.2%) | 164 (59.9%) |
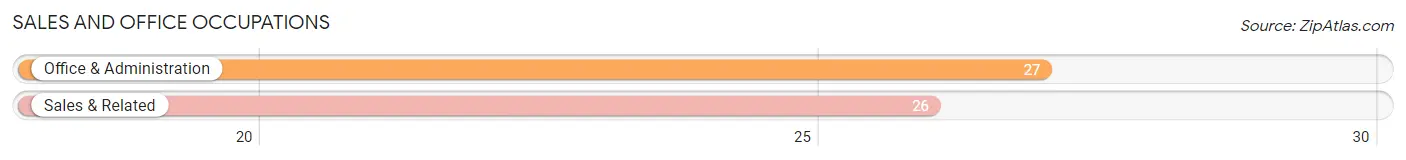
Sales and Office Occupations
The most common Sales and Office occupations in Hammondsport are Office & Administration (27 | 9.9%), and Sales & Related (26 | 9.5%).
Sales and Office Occupations by Sex
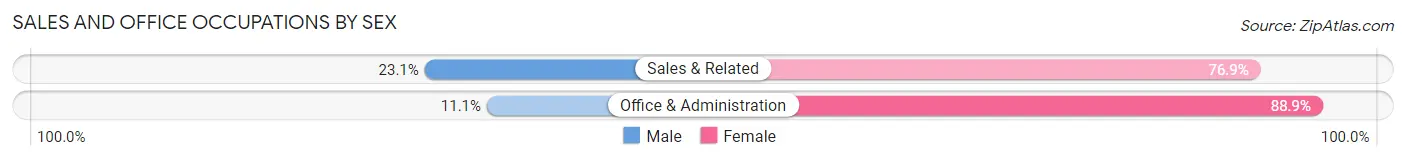
| Occupation | Male | Female |
| Sales & Related | 6 (23.1%) | 20 (76.9%) |
| Office & Administration | 3 (11.1%) | 24 (88.9%) |
| Total (Category) | 9 (17.0%) | 44 (83.0%) |
| Total (Overall) | 110 (40.2%) | 164 (59.9%) |
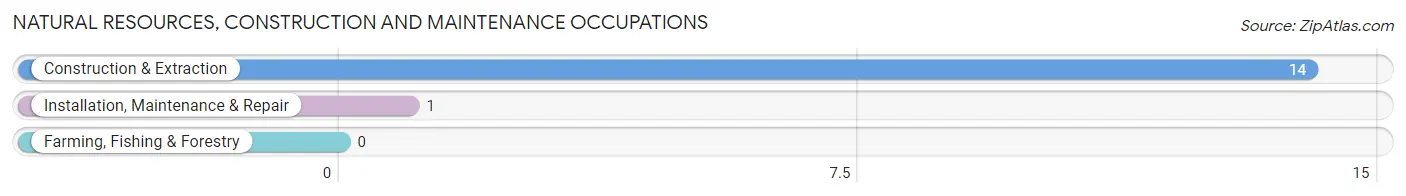
Natural Resources, Construction and Maintenance Occupations
The most common Natural Resources, Construction and Maintenance occupations in Hammondsport are Construction & Extraction (14 | 5.1%), and Installation, Maintenance & Repair (1 | 0.4%).
Natural Resources, Construction and Maintenance Occupations by Sex
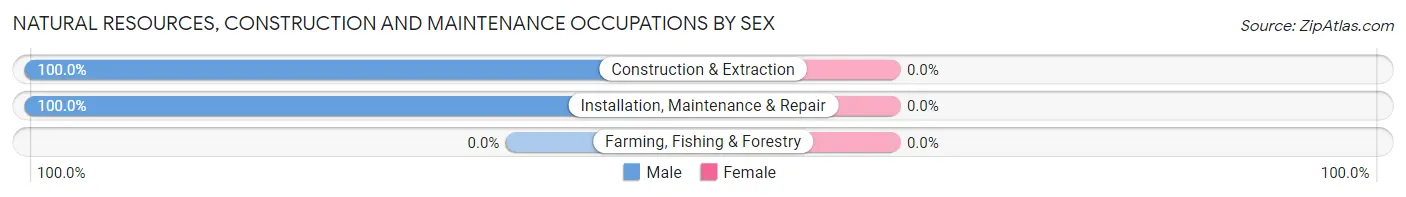
| Occupation | Male | Female |
| Farming, Fishing & Forestry | 0 (0.0%) | 0 (0.0%) |
| Construction & Extraction | 14 (100.0%) | 0 (0.0%) |
| Installation, Maintenance & Repair | 1 (100.0%) | 0 (0.0%) |
| Total (Category) | 15 (100.0%) | 0 (0.0%) |
| Total (Overall) | 110 (40.2%) | 164 (59.9%) |
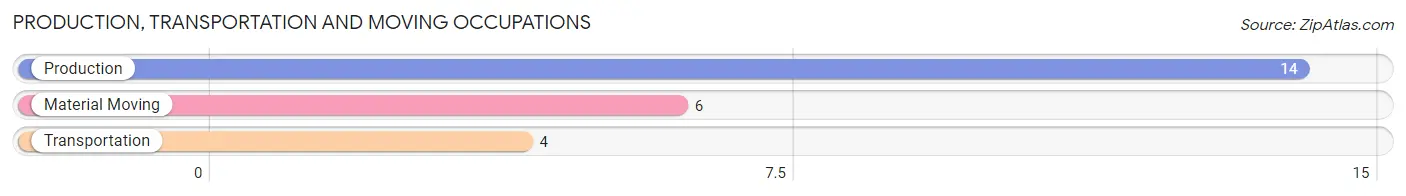
Production, Transportation and Moving Occupations
The most common Production, Transportation and Moving occupations in Hammondsport are Production (14 | 5.1%), Material Moving (6 | 2.2%), and Transportation (4 | 1.5%).
Production, Transportation and Moving Occupations by Sex
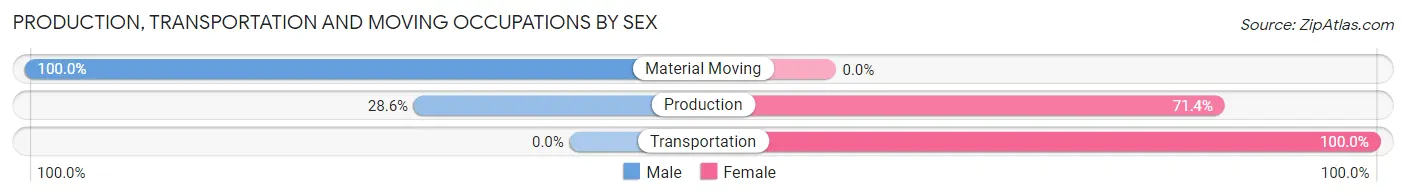
| Occupation | Male | Female |
| Production | 4 (28.6%) | 10 (71.4%) |
| Transportation | 0 (0.0%) | 4 (100.0%) |
| Material Moving | 6 (100.0%) | 0 (0.0%) |
| Total (Category) | 10 (41.7%) | 14 (58.3%) |
| Total (Overall) | 110 (40.2%) | 164 (59.9%) |
Employment Industries by Sex in Hammondsport
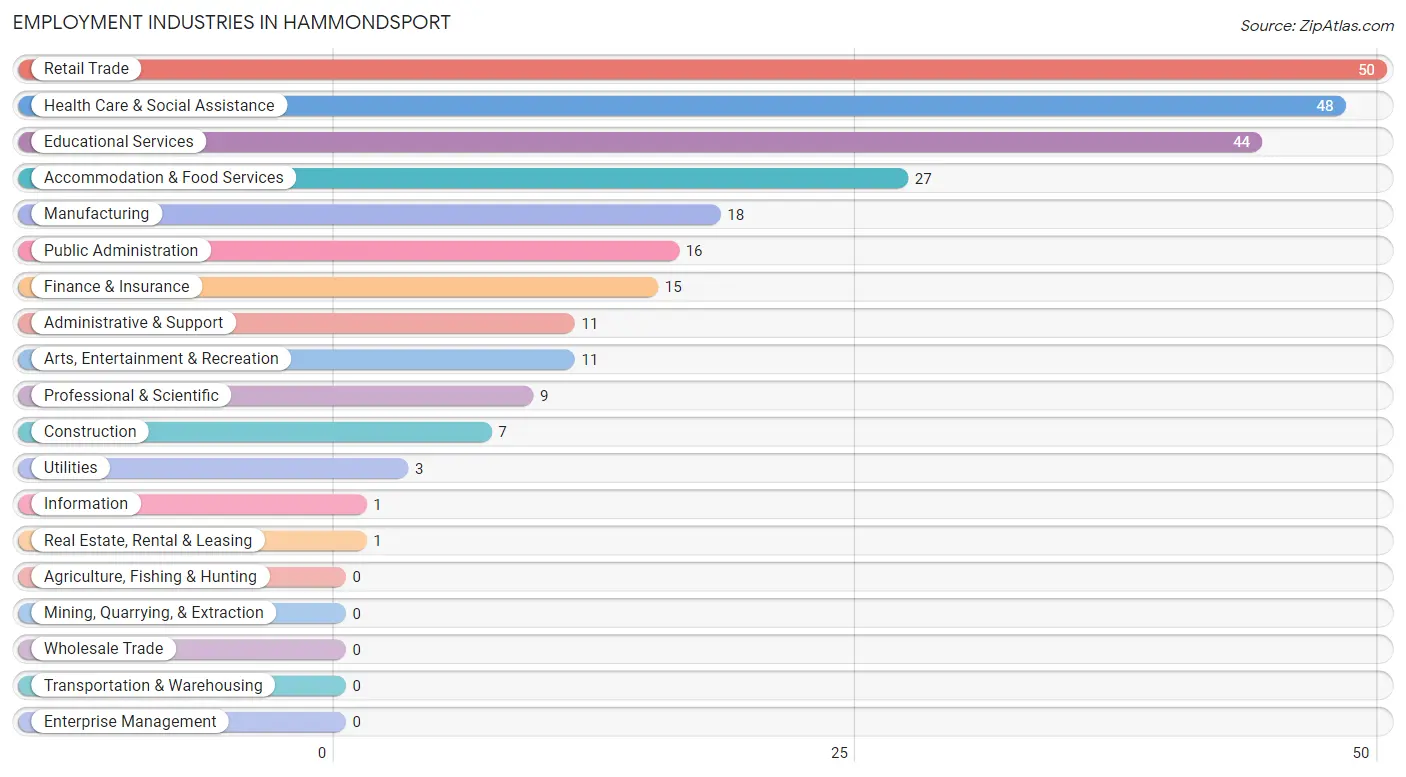
Employment Industries in Hammondsport
The major employment industries in Hammondsport include Retail Trade (50 | 18.2%), Health Care & Social Assistance (48 | 17.5%), Educational Services (44 | 16.1%), Accommodation & Food Services (27 | 9.9%), and Manufacturing (18 | 6.6%).
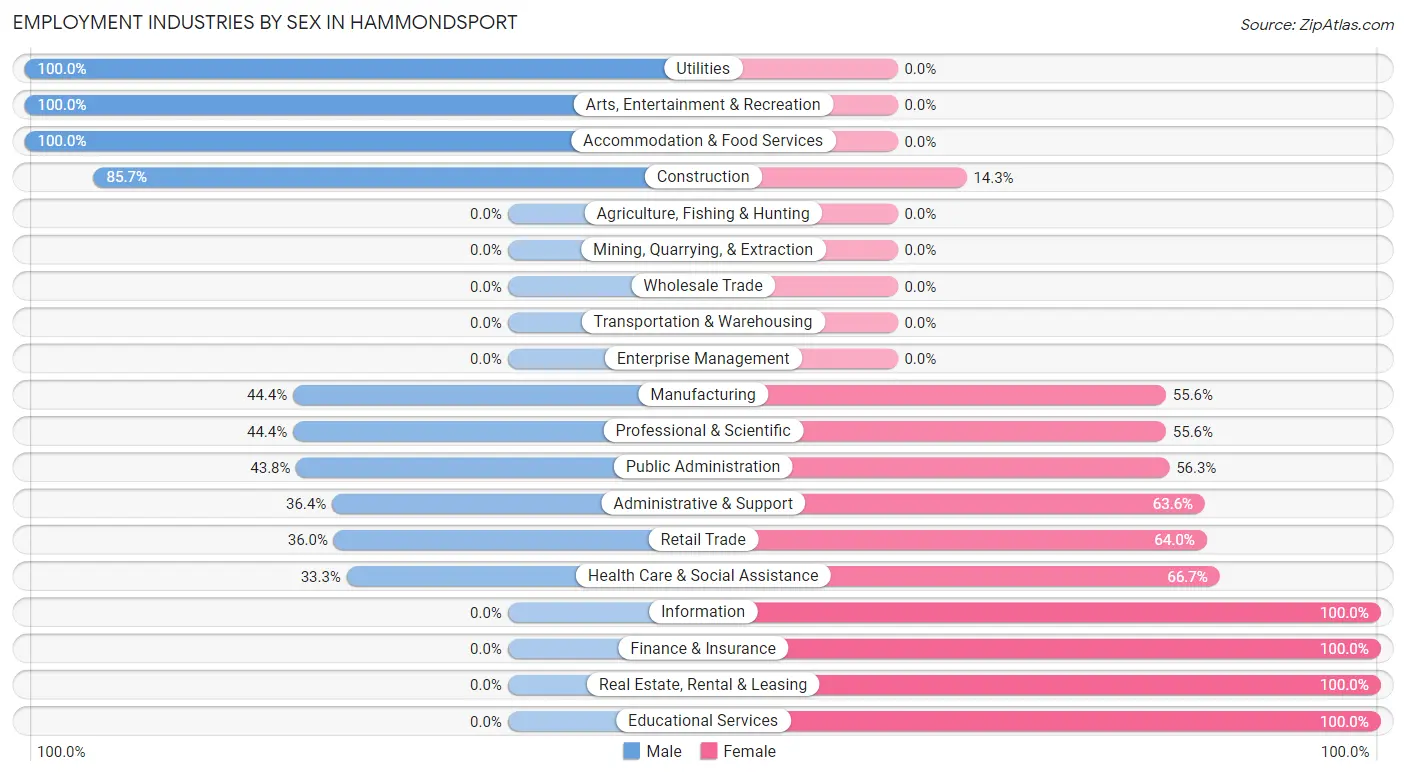
Employment Industries by Sex in Hammondsport
The Hammondsport industries that see more men than women are Utilities (100.0%), Arts, Entertainment & Recreation (100.0%), and Accommodation & Food Services (100.0%), whereas the industries that tend to have a higher number of women are Information (100.0%), Finance & Insurance (100.0%), and Real Estate, Rental & Leasing (100.0%).
| Industry | Male | Female |
| Agriculture, Fishing & Hunting | 0 (0.0%) | 0 (0.0%) |
| Mining, Quarrying, & Extraction | 0 (0.0%) | 0 (0.0%) |
| Construction | 6 (85.7%) | 1 (14.3%) |
| Manufacturing | 8 (44.4%) | 10 (55.6%) |
| Wholesale Trade | 0 (0.0%) | 0 (0.0%) |
| Retail Trade | 18 (36.0%) | 32 (64.0%) |
| Transportation & Warehousing | 0 (0.0%) | 0 (0.0%) |
| Utilities | 3 (100.0%) | 0 (0.0%) |
| Information | 0 (0.0%) | 1 (100.0%) |
| Finance & Insurance | 0 (0.0%) | 15 (100.0%) |
| Real Estate, Rental & Leasing | 0 (0.0%) | 1 (100.0%) |
| Professional & Scientific | 4 (44.4%) | 5 (55.6%) |
| Enterprise Management | 0 (0.0%) | 0 (0.0%) |
| Administrative & Support | 4 (36.4%) | 7 (63.6%) |
| Educational Services | 0 (0.0%) | 44 (100.0%) |
| Health Care & Social Assistance | 16 (33.3%) | 32 (66.7%) |
| Arts, Entertainment & Recreation | 11 (100.0%) | 0 (0.0%) |
| Accommodation & Food Services | 27 (100.0%) | 0 (0.0%) |
| Public Administration | 7 (43.8%) | 9 (56.2%) |
| Total | 110 (40.2%) | 164 (59.9%) |
Education in Hammondsport
School Enrollment in Hammondsport
The most common levels of schooling among the 77 students in Hammondsport are elementary school (28 | 36.4%), middle school (25 | 32.5%), and high school (18 | 23.4%).
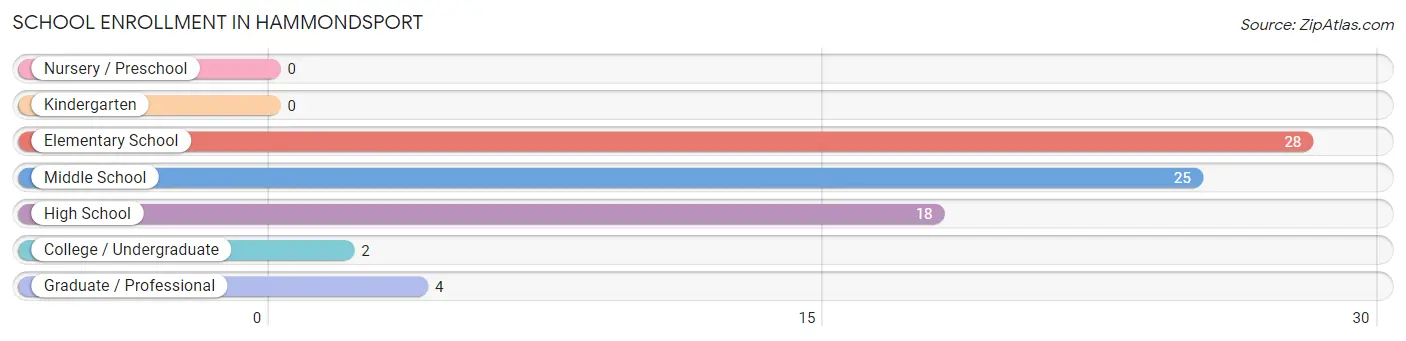
| School Level | # Students | % Students |
| Nursery / Preschool | 0 | 0.0% |
| Kindergarten | 0 | 0.0% |
| Elementary School | 28 | 36.4% |
| Middle School | 25 | 32.5% |
| High School | 18 | 23.4% |
| College / Undergraduate | 2 | 2.6% |
| Graduate / Professional | 4 | 5.2% |
| Total | 77 | 100.0% |
School Enrollment by Age by Funding Source in Hammondsport
Out of a total of 77 students who are enrolled in schools in Hammondsport, 6 (7.8%) attend a private institution, while the remaining 71 (92.2%) are enrolled in public schools. The age group of 20 to 24 year olds has the highest likelihood of being enrolled in private schools, with 2 (100.0% in the age bracket) enrolled. Conversely, the age group of 5 to 9 year old has the lowest likelihood of being enrolled in a private school, with 23 (100.0% in the age bracket) attending a public institution.
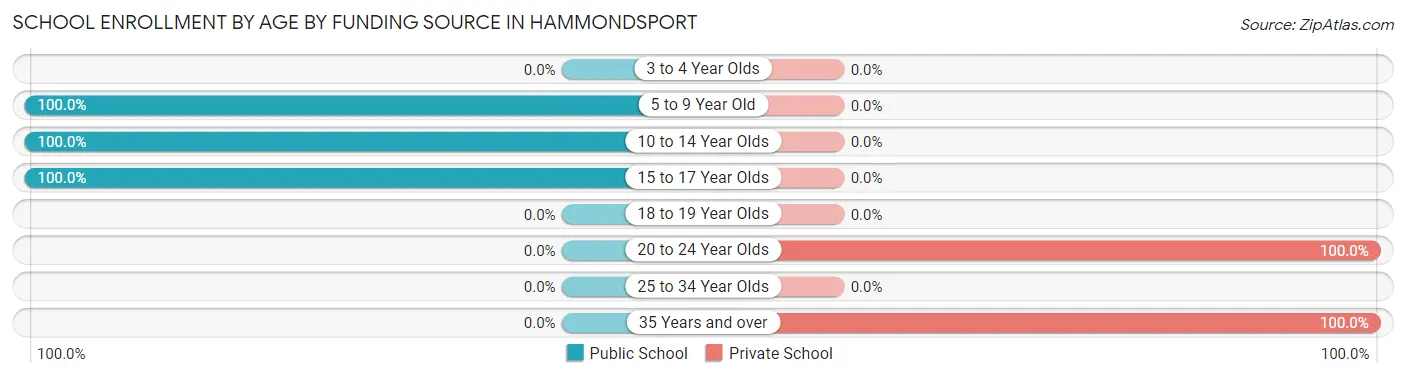
| Age Bracket | Public School | Private School |
| 3 to 4 Year Olds | 0 (0.0%) | 0 (0.0%) |
| 5 to 9 Year Old | 23 (100.0%) | 0 (0.0%) |
| 10 to 14 Year Olds | 34 (100.0%) | 0 (0.0%) |
| 15 to 17 Year Olds | 14 (100.0%) | 0 (0.0%) |
| 18 to 19 Year Olds | 0 (0.0%) | 0 (0.0%) |
| 20 to 24 Year Olds | 0 (0.0%) | 2 (100.0%) |
| 25 to 34 Year Olds | 0 (0.0%) | 0 (0.0%) |
| 35 Years and over | 0 (0.0%) | 4 (100.0%) |
| Total | 71 (92.2%) | 6 (7.8%) |
Educational Attainment by Field of Study in Hammondsport
Business (43 | 23.9%), science & technology (19 | 10.6%), bio, nature & agricultural (18 | 10.0%), arts & humanities (14 | 7.8%), and social sciences (13 | 7.2%) are the most common fields of study among 180 individuals in Hammondsport who have obtained a bachelor's degree or higher.
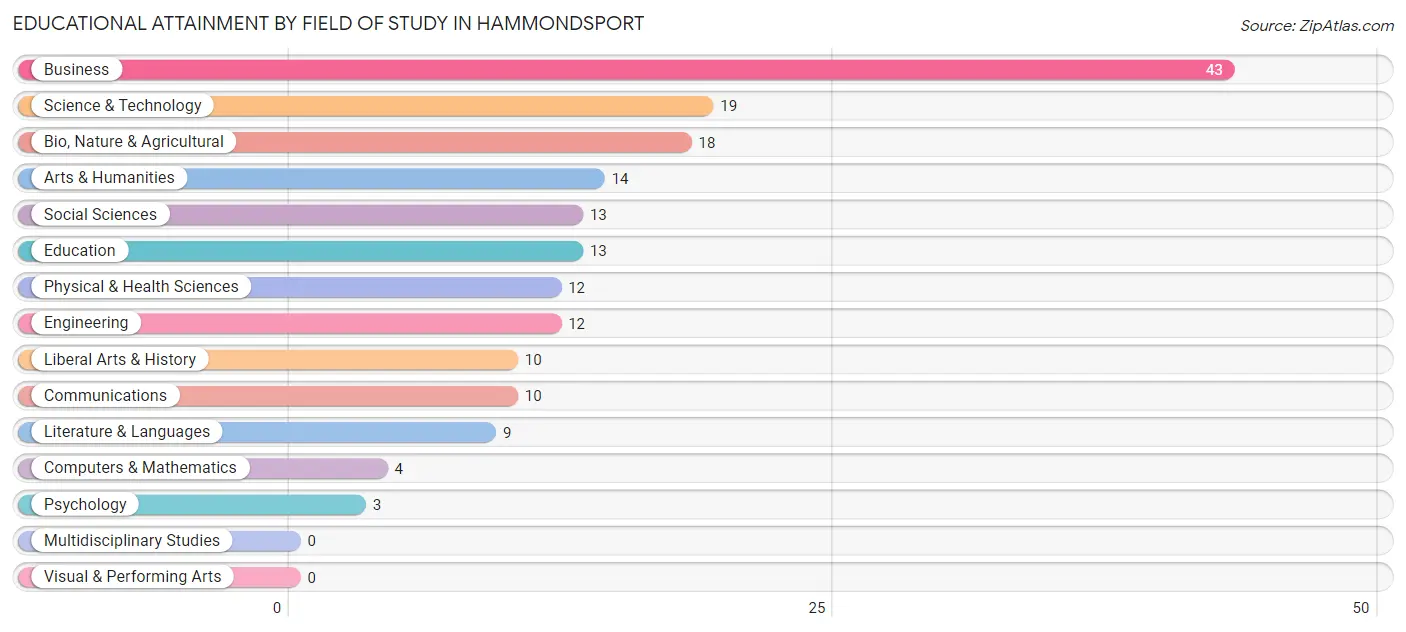
| Field of Study | # Graduates | % Graduates |
| Computers & Mathematics | 4 | 2.2% |
| Bio, Nature & Agricultural | 18 | 10.0% |
| Physical & Health Sciences | 12 | 6.7% |
| Psychology | 3 | 1.7% |
| Social Sciences | 13 | 7.2% |
| Engineering | 12 | 6.7% |
| Multidisciplinary Studies | 0 | 0.0% |
| Science & Technology | 19 | 10.6% |
| Business | 43 | 23.9% |
| Education | 13 | 7.2% |
| Literature & Languages | 9 | 5.0% |
| Liberal Arts & History | 10 | 5.6% |
| Visual & Performing Arts | 0 | 0.0% |
| Communications | 10 | 5.6% |
| Arts & Humanities | 14 | 7.8% |
| Total | 180 | 100.0% |
Transportation & Commute in Hammondsport
Vehicle Availability by Sex in Hammondsport
The most prevalent vehicle ownership categories in Hammondsport are males with 2 vehicles (57, accounting for 52.8%) and females with 2 vehicles (68, making up 36.5%).
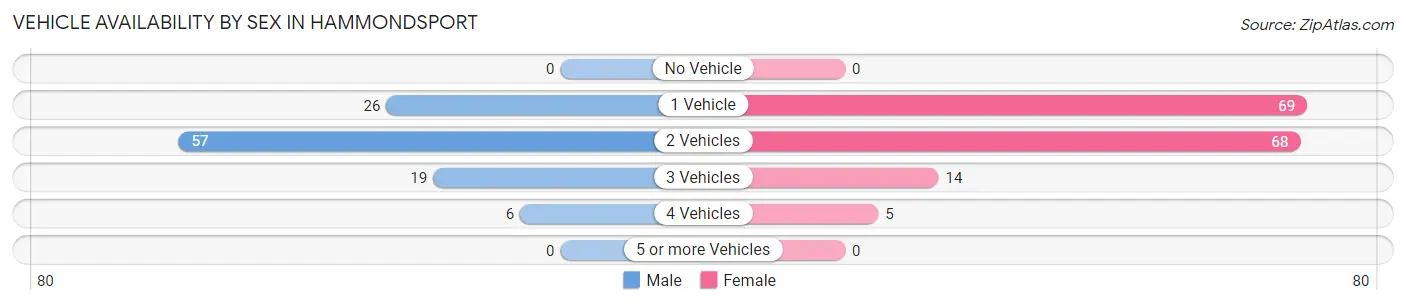
| Vehicles Available | Male | Female |
| No Vehicle | 0 (0.0%) | 0 (0.0%) |
| 1 Vehicle | 26 (24.1%) | 69 (44.2%) |
| 2 Vehicles | 57 (52.8%) | 68 (43.6%) |
| 3 Vehicles | 19 (17.6%) | 14 (9.0%) |
| 4 Vehicles | 6 (5.6%) | 5 (3.2%) |
| 5 or more Vehicles | 0 (0.0%) | 0 (0.0%) |
| Total | 108 (100.0%) | 156 (100.0%) |
Commute Time in Hammondsport
The most frequently occuring commute durations in Hammondsport are 5 to 9 minutes (39 commuters, 17.8%), less than 5 minutes (34 commuters, 15.5%), and 15 to 19 minutes (33 commuters, 15.1%).
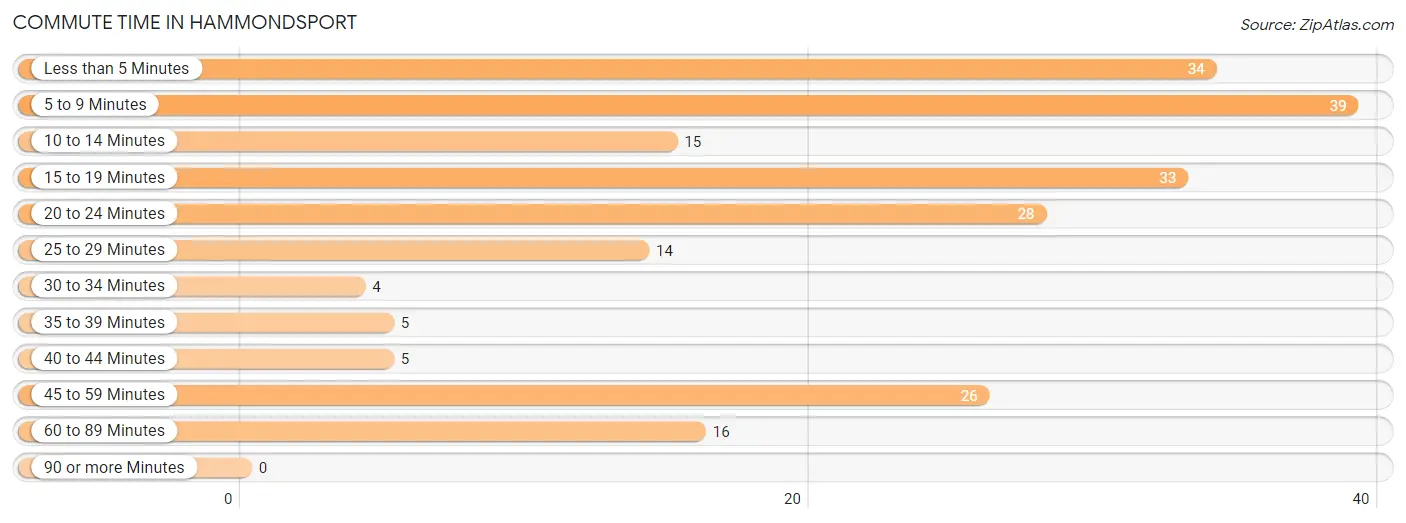
| Commute Time | # Commuters | % Commuters |
| Less than 5 Minutes | 34 | 15.5% |
| 5 to 9 Minutes | 39 | 17.8% |
| 10 to 14 Minutes | 15 | 6.9% |
| 15 to 19 Minutes | 33 | 15.1% |
| 20 to 24 Minutes | 28 | 12.8% |
| 25 to 29 Minutes | 14 | 6.4% |
| 30 to 34 Minutes | 4 | 1.8% |
| 35 to 39 Minutes | 5 | 2.3% |
| 40 to 44 Minutes | 5 | 2.3% |
| 45 to 59 Minutes | 26 | 11.9% |
| 60 to 89 Minutes | 16 | 7.3% |
| 90 or more Minutes | 0 | 0.0% |
Commute Time by Sex in Hammondsport
The most common commute times in Hammondsport are less than 5 minutes (25 commuters, 27.8%) for males and 5 to 9 minutes (36 commuters, 27.9%) for females.
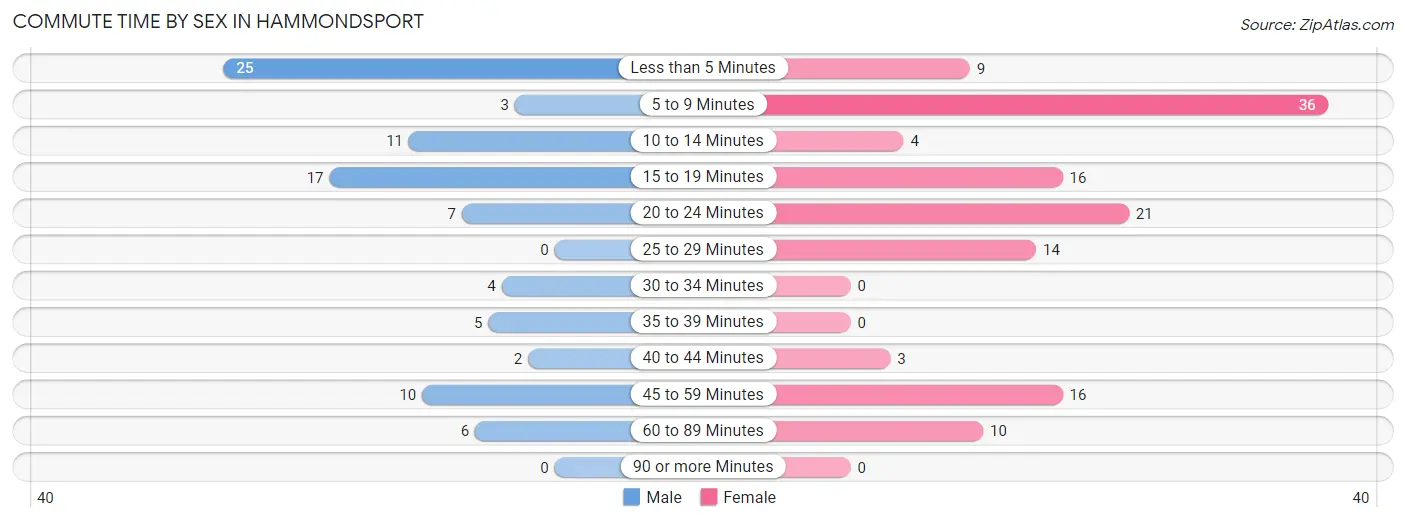
| Commute Time | Male | Female |
| Less than 5 Minutes | 25 (27.8%) | 9 (7.0%) |
| 5 to 9 Minutes | 3 (3.3%) | 36 (27.9%) |
| 10 to 14 Minutes | 11 (12.2%) | 4 (3.1%) |
| 15 to 19 Minutes | 17 (18.9%) | 16 (12.4%) |
| 20 to 24 Minutes | 7 (7.8%) | 21 (16.3%) |
| 25 to 29 Minutes | 0 (0.0%) | 14 (10.8%) |
| 30 to 34 Minutes | 4 (4.4%) | 0 (0.0%) |
| 35 to 39 Minutes | 5 (5.6%) | 0 (0.0%) |
| 40 to 44 Minutes | 2 (2.2%) | 3 (2.3%) |
| 45 to 59 Minutes | 10 (11.1%) | 16 (12.4%) |
| 60 to 89 Minutes | 6 (6.7%) | 10 (7.7%) |
| 90 or more Minutes | 0 (0.0%) | 0 (0.0%) |
Time of Departure to Work by Sex in Hammondsport
The most frequent times of departure to work in Hammondsport are 7:30 AM to 7:59 AM (28, 31.1%) for males and 7:00 AM to 7:29 AM (39, 30.2%) for females.
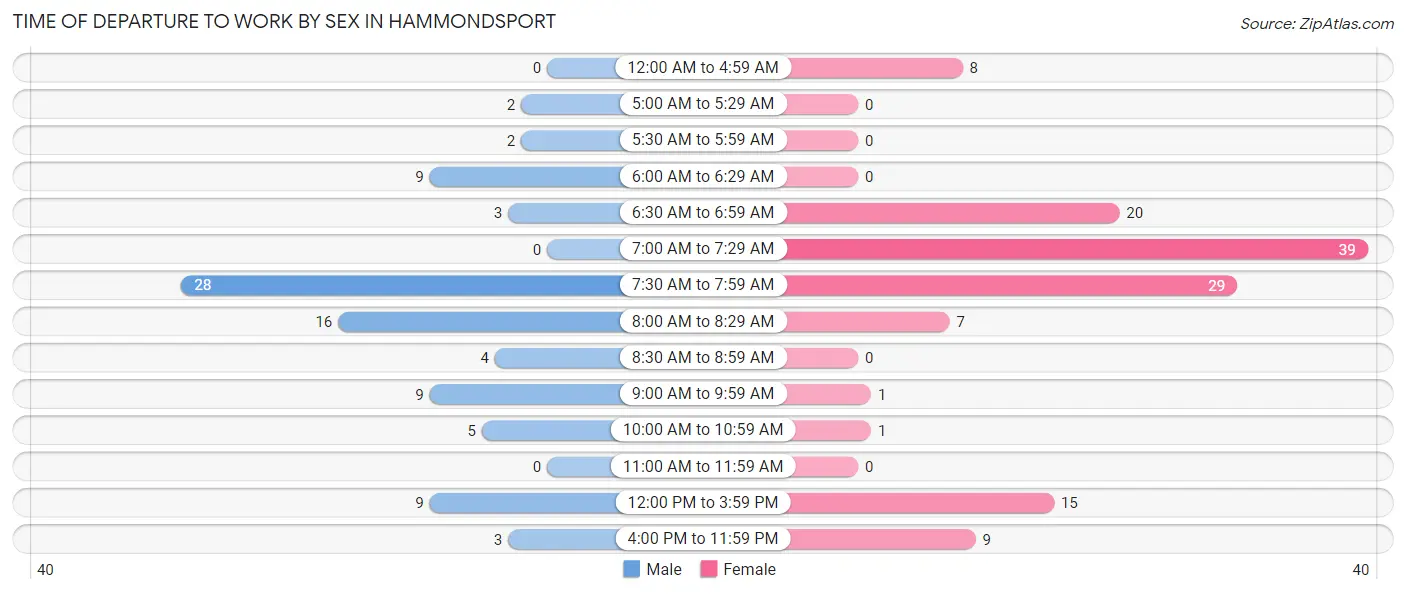
| Time of Departure | Male | Female |
| 12:00 AM to 4:59 AM | 0 (0.0%) | 8 (6.2%) |
| 5:00 AM to 5:29 AM | 2 (2.2%) | 0 (0.0%) |
| 5:30 AM to 5:59 AM | 2 (2.2%) | 0 (0.0%) |
| 6:00 AM to 6:29 AM | 9 (10.0%) | 0 (0.0%) |
| 6:30 AM to 6:59 AM | 3 (3.3%) | 20 (15.5%) |
| 7:00 AM to 7:29 AM | 0 (0.0%) | 39 (30.2%) |
| 7:30 AM to 7:59 AM | 28 (31.1%) | 29 (22.5%) |
| 8:00 AM to 8:29 AM | 16 (17.8%) | 7 (5.4%) |
| 8:30 AM to 8:59 AM | 4 (4.4%) | 0 (0.0%) |
| 9:00 AM to 9:59 AM | 9 (10.0%) | 1 (0.8%) |
| 10:00 AM to 10:59 AM | 5 (5.6%) | 1 (0.8%) |
| 11:00 AM to 11:59 AM | 0 (0.0%) | 0 (0.0%) |
| 12:00 PM to 3:59 PM | 9 (10.0%) | 15 (11.6%) |
| 4:00 PM to 11:59 PM | 3 (3.3%) | 9 (7.0%) |
| Total | 90 (100.0%) | 129 (100.0%) |
Housing Occupancy in Hammondsport
Occupancy by Ownership in Hammondsport
Of the total 293 dwellings in Hammondsport, owner-occupied units account for 191 (65.2%), while renter-occupied units make up 102 (34.8%).
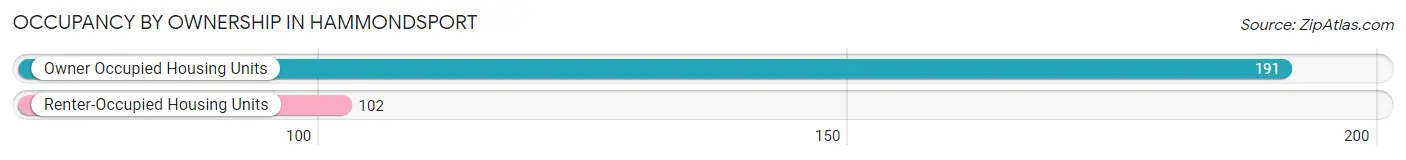
| Occupancy | # Housing Units | % Housing Units |
| Owner Occupied Housing Units | 191 | 65.2% |
| Renter-Occupied Housing Units | 102 | 34.8% |
| Total Occupied Housing Units | 293 | 100.0% |
Occupancy by Household Size in Hammondsport
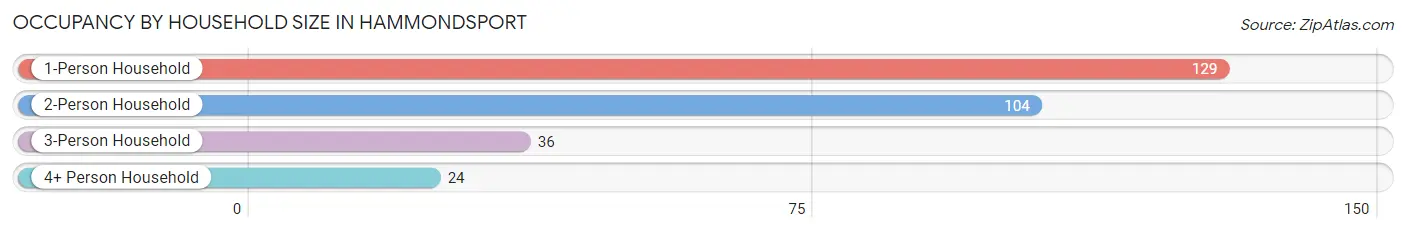
| Household Size | # Housing Units | % Housing Units |
| 1-Person Household | 129 | 44.0% |
| 2-Person Household | 104 | 35.5% |
| 3-Person Household | 36 | 12.3% |
| 4+ Person Household | 24 | 8.2% |
| Total Housing Units | 293 | 100.0% |
Occupancy by Ownership by Household Size in Hammondsport
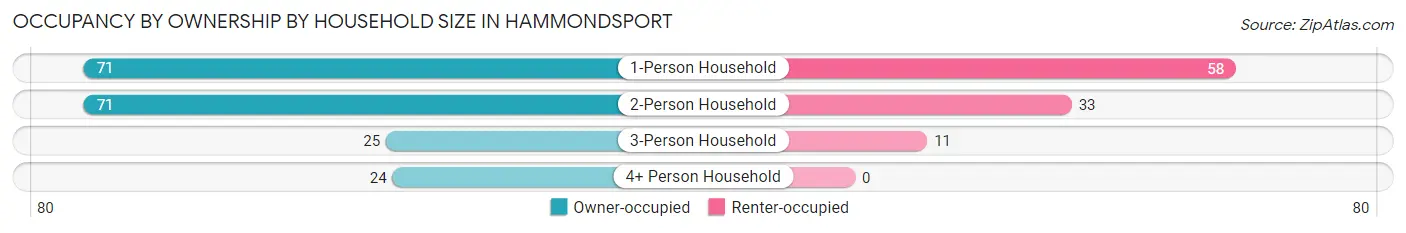
| Household Size | Owner-occupied | Renter-occupied |
| 1-Person Household | 71 (55.0%) | 58 (45.0%) |
| 2-Person Household | 71 (68.3%) | 33 (31.7%) |
| 3-Person Household | 25 (69.4%) | 11 (30.6%) |
| 4+ Person Household | 24 (100.0%) | 0 (0.0%) |
| Total Housing Units | 191 (65.2%) | 102 (34.8%) |
Occupancy by Educational Attainment in Hammondsport
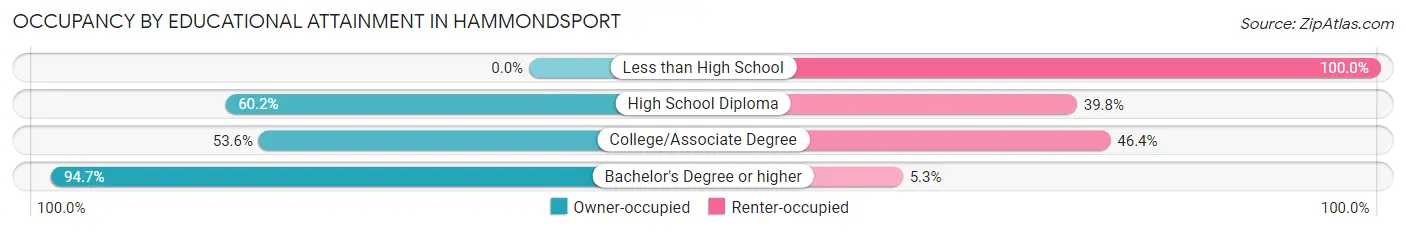
| Household Size | Owner-occupied | Renter-occupied |
| Less than High School | 0 (0.0%) | 21 (100.0%) |
| High School Diploma | 56 (60.2%) | 37 (39.8%) |
| College/Associate Degree | 45 (53.6%) | 39 (46.4%) |
| Bachelor's Degree or higher | 90 (94.7%) | 5 (5.3%) |
Occupancy by Age of Householder in Hammondsport
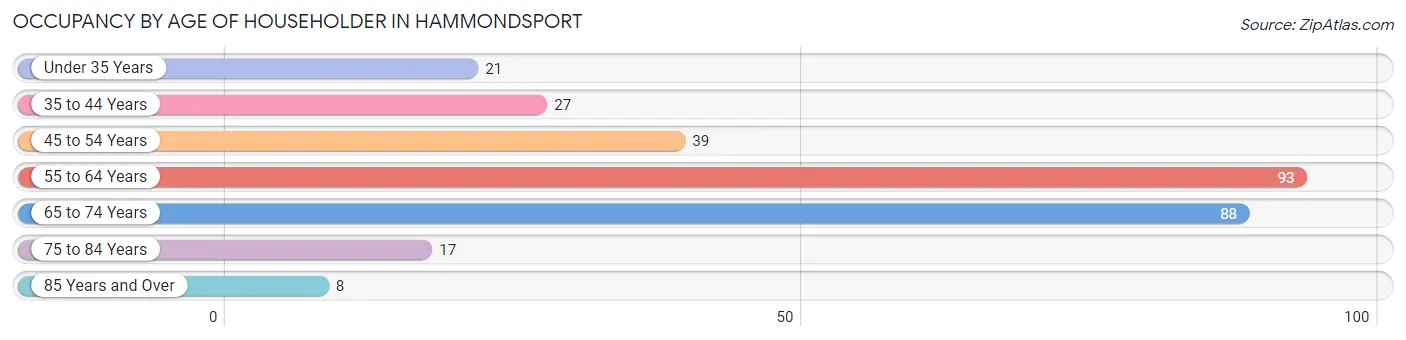
| Age Bracket | # Households | % Households |
| Under 35 Years | 21 | 7.2% |
| 35 to 44 Years | 27 | 9.2% |
| 45 to 54 Years | 39 | 13.3% |
| 55 to 64 Years | 93 | 31.7% |
| 65 to 74 Years | 88 | 30.0% |
| 75 to 84 Years | 17 | 5.8% |
| 85 Years and Over | 8 | 2.7% |
| Total | 293 | 100.0% |
Housing Finances in Hammondsport
Median Income by Occupancy in Hammondsport
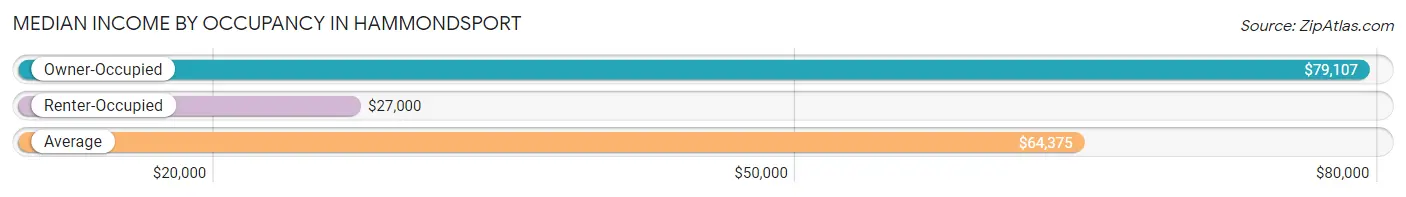
| Occupancy Type | # Households | Median Income |
| Owner-Occupied | 191 (65.2%) | $79,107 |
| Renter-Occupied | 102 (34.8%) | $27,000 |
| Average | 293 (100.0%) | $64,375 |
Occupancy by Householder Income Bracket in Hammondsport
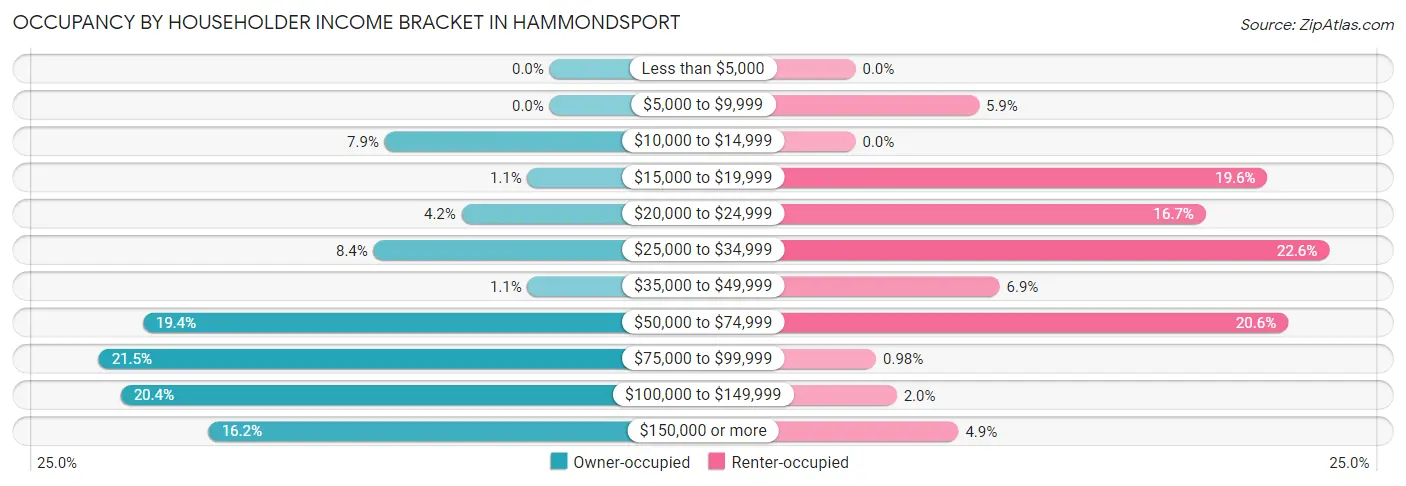
| Income Bracket | Owner-occupied | Renter-occupied |
| Less than $5,000 | 0 (0.0%) | 0 (0.0%) |
| $5,000 to $9,999 | 0 (0.0%) | 6 (5.9%) |
| $10,000 to $14,999 | 15 (7.9%) | 0 (0.0%) |
| $15,000 to $19,999 | 2 (1.1%) | 20 (19.6%) |
| $20,000 to $24,999 | 8 (4.2%) | 17 (16.7%) |
| $25,000 to $34,999 | 16 (8.4%) | 23 (22.6%) |
| $35,000 to $49,999 | 2 (1.1%) | 7 (6.9%) |
| $50,000 to $74,999 | 37 (19.4%) | 21 (20.6%) |
| $75,000 to $99,999 | 41 (21.5%) | 1 (1.0%) |
| $100,000 to $149,999 | 39 (20.4%) | 2 (2.0%) |
| $150,000 or more | 31 (16.2%) | 5 (4.9%) |
| Total | 191 (100.0%) | 102 (100.0%) |
Monthly Housing Cost Tiers in Hammondsport
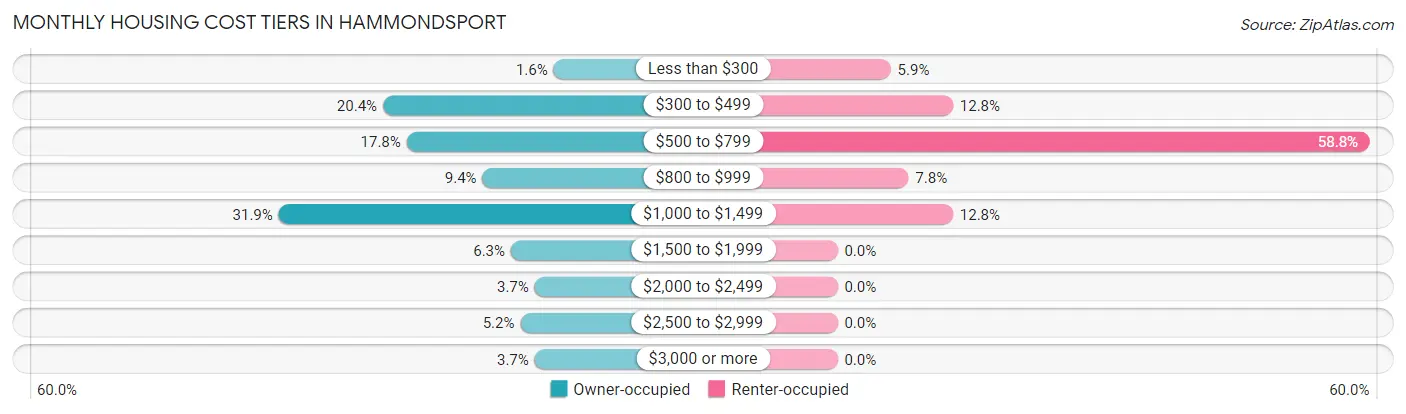
| Monthly Cost | Owner-occupied | Renter-occupied |
| Less than $300 | 3 (1.6%) | 6 (5.9%) |
| $300 to $499 | 39 (20.4%) | 13 (12.8%) |
| $500 to $799 | 34 (17.8%) | 60 (58.8%) |
| $800 to $999 | 18 (9.4%) | 8 (7.8%) |
| $1,000 to $1,499 | 61 (31.9%) | 13 (12.8%) |
| $1,500 to $1,999 | 12 (6.3%) | 0 (0.0%) |
| $2,000 to $2,499 | 7 (3.7%) | 0 (0.0%) |
| $2,500 to $2,999 | 10 (5.2%) | 0 (0.0%) |
| $3,000 or more | 7 (3.7%) | 0 (0.0%) |
| Total | 191 (100.0%) | 102 (100.0%) |
Physical Housing Characteristics in Hammondsport
Housing Structures in Hammondsport
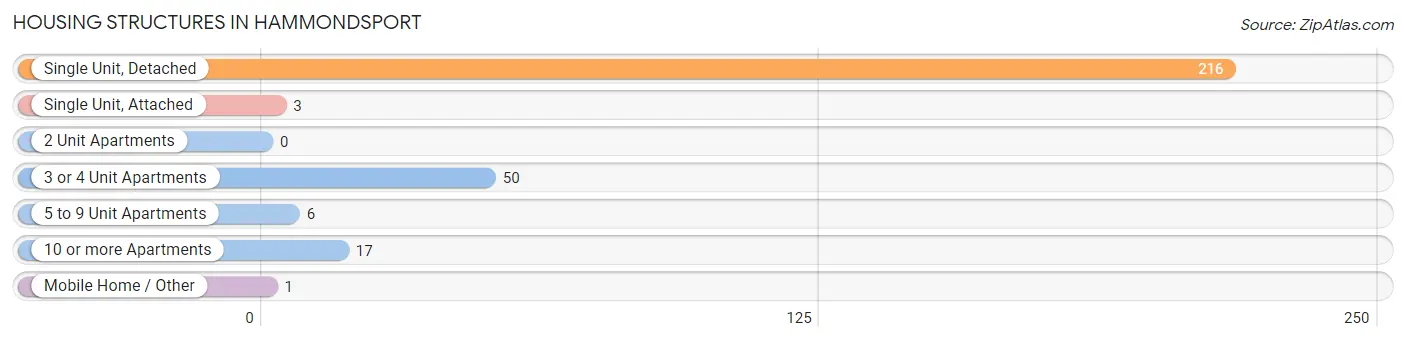
| Structure Type | # Housing Units | % Housing Units |
| Single Unit, Detached | 216 | 73.7% |
| Single Unit, Attached | 3 | 1.0% |
| 2 Unit Apartments | 0 | 0.0% |
| 3 or 4 Unit Apartments | 50 | 17.1% |
| 5 to 9 Unit Apartments | 6 | 2.1% |
| 10 or more Apartments | 17 | 5.8% |
| Mobile Home / Other | 1 | 0.3% |
| Total | 293 | 100.0% |
Housing Structures by Occupancy in Hammondsport
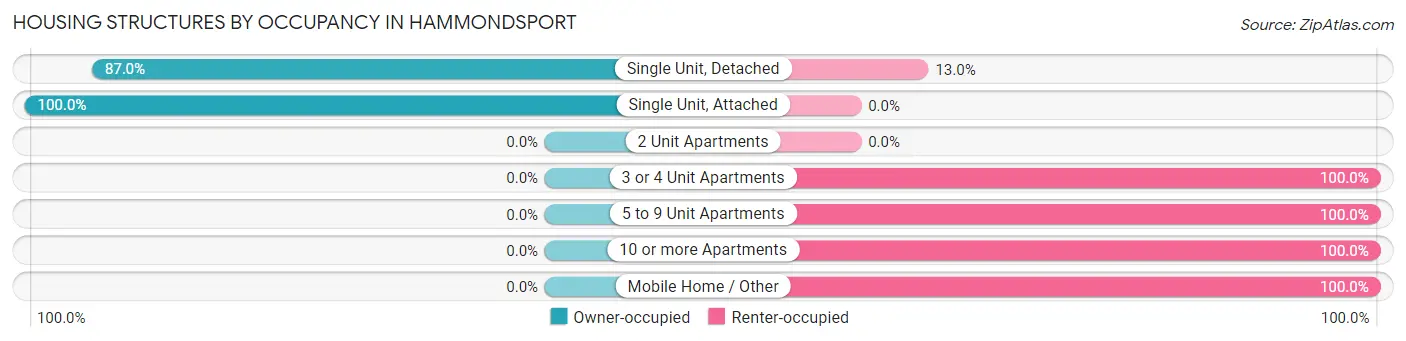
| Structure Type | Owner-occupied | Renter-occupied |
| Single Unit, Detached | 188 (87.0%) | 28 (13.0%) |
| Single Unit, Attached | 3 (100.0%) | 0 (0.0%) |
| 2 Unit Apartments | 0 (0.0%) | 0 (0.0%) |
| 3 or 4 Unit Apartments | 0 (0.0%) | 50 (100.0%) |
| 5 to 9 Unit Apartments | 0 (0.0%) | 6 (100.0%) |
| 10 or more Apartments | 0 (0.0%) | 17 (100.0%) |
| Mobile Home / Other | 0 (0.0%) | 1 (100.0%) |
| Total | 191 (65.2%) | 102 (34.8%) |
Housing Structures by Number of Rooms in Hammondsport
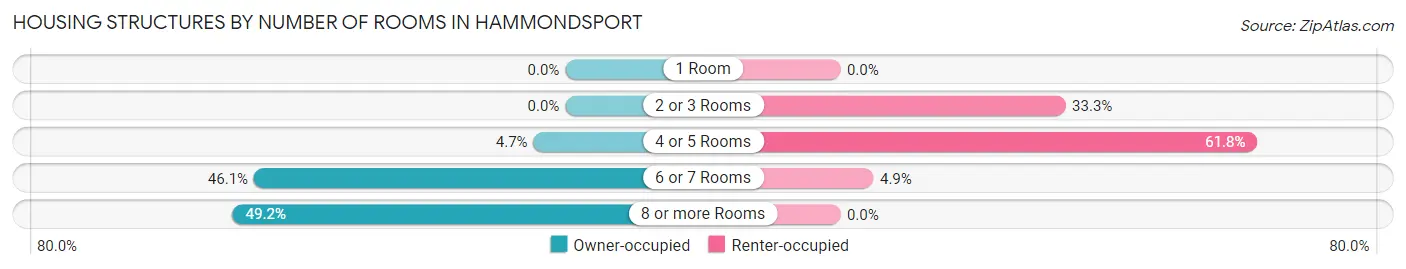
| Number of Rooms | Owner-occupied | Renter-occupied |
| 1 Room | 0 (0.0%) | 0 (0.0%) |
| 2 or 3 Rooms | 0 (0.0%) | 34 (33.3%) |
| 4 or 5 Rooms | 9 (4.7%) | 63 (61.8%) |
| 6 or 7 Rooms | 88 (46.1%) | 5 (4.9%) |
| 8 or more Rooms | 94 (49.2%) | 0 (0.0%) |
| Total | 191 (100.0%) | 102 (100.0%) |
Housing Structure by Heating Type in Hammondsport
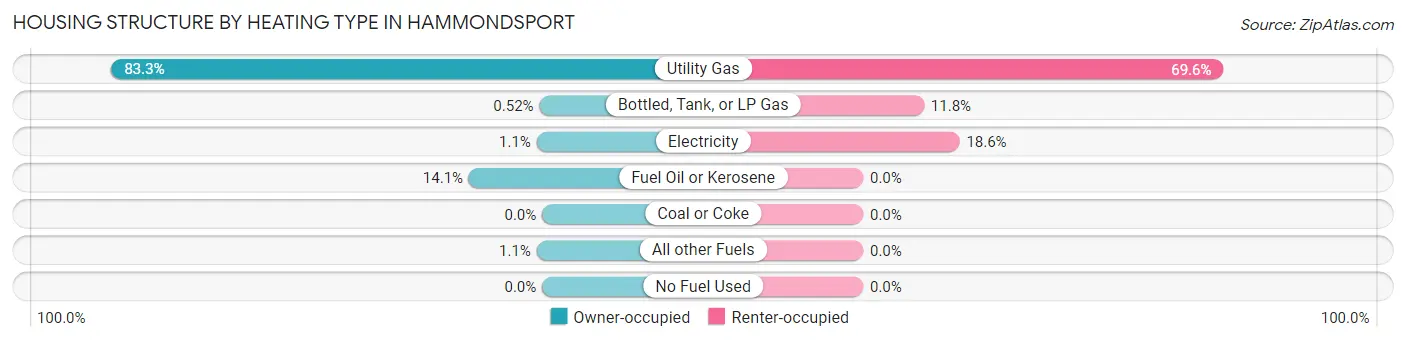
| Heating Type | Owner-occupied | Renter-occupied |
| Utility Gas | 159 (83.3%) | 71 (69.6%) |
| Bottled, Tank, or LP Gas | 1 (0.5%) | 12 (11.8%) |
| Electricity | 2 (1.1%) | 19 (18.6%) |
| Fuel Oil or Kerosene | 27 (14.1%) | 0 (0.0%) |
| Coal or Coke | 0 (0.0%) | 0 (0.0%) |
| All other Fuels | 2 (1.1%) | 0 (0.0%) |
| No Fuel Used | 0 (0.0%) | 0 (0.0%) |
| Total | 191 (100.0%) | 102 (100.0%) |
Household Vehicle Usage in Hammondsport
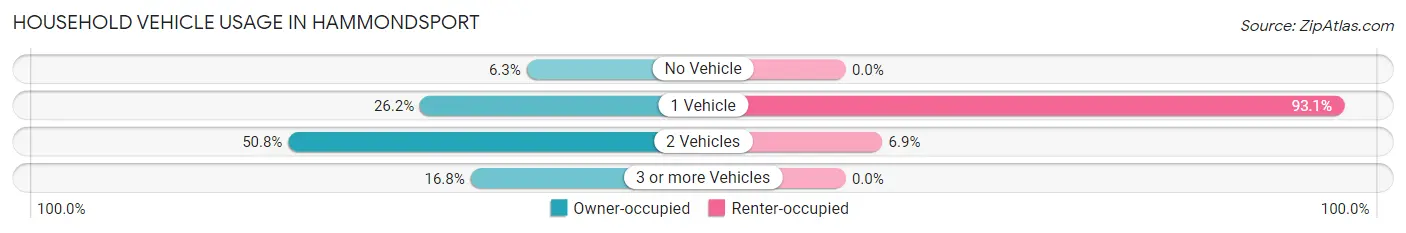
| Vehicles per Household | Owner-occupied | Renter-occupied |
| No Vehicle | 12 (6.3%) | 0 (0.0%) |
| 1 Vehicle | 50 (26.2%) | 95 (93.1%) |
| 2 Vehicles | 97 (50.8%) | 7 (6.9%) |
| 3 or more Vehicles | 32 (16.8%) | 0 (0.0%) |
| Total | 191 (100.0%) | 102 (100.0%) |
Real Estate & Mortgages in Hammondsport
Real Estate and Mortgage Overview in Hammondsport
| Characteristic | Without Mortgage | With Mortgage |
| Housing Units | 88 | 103 |
| Median Property Value | $166,700 | $186,600 |
| Median Household Income | $75,455 | $23 |
| Monthly Housing Costs | $529 | $7 |
| Real Estate Taxes | $3,500 | $0 |
Property Value by Mortgage Status in Hammondsport
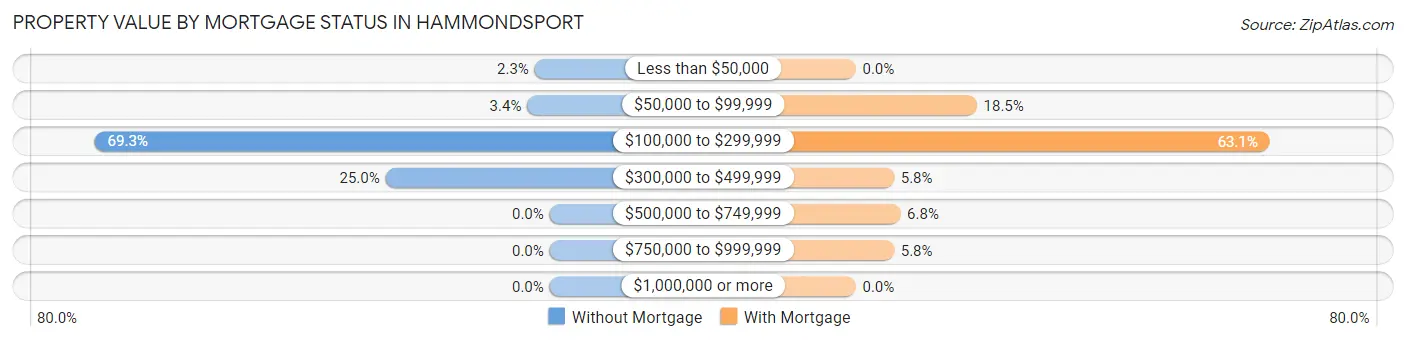
| Property Value | Without Mortgage | With Mortgage |
| Less than $50,000 | 2 (2.3%) | 0 (0.0%) |
| $50,000 to $99,999 | 3 (3.4%) | 19 (18.4%) |
| $100,000 to $299,999 | 61 (69.3%) | 65 (63.1%) |
| $300,000 to $499,999 | 22 (25.0%) | 6 (5.8%) |
| $500,000 to $749,999 | 0 (0.0%) | 7 (6.8%) |
| $750,000 to $999,999 | 0 (0.0%) | 6 (5.8%) |
| $1,000,000 or more | 0 (0.0%) | 0 (0.0%) |
| Total | 88 (100.0%) | 103 (100.0%) |
Household Income by Mortgage Status in Hammondsport
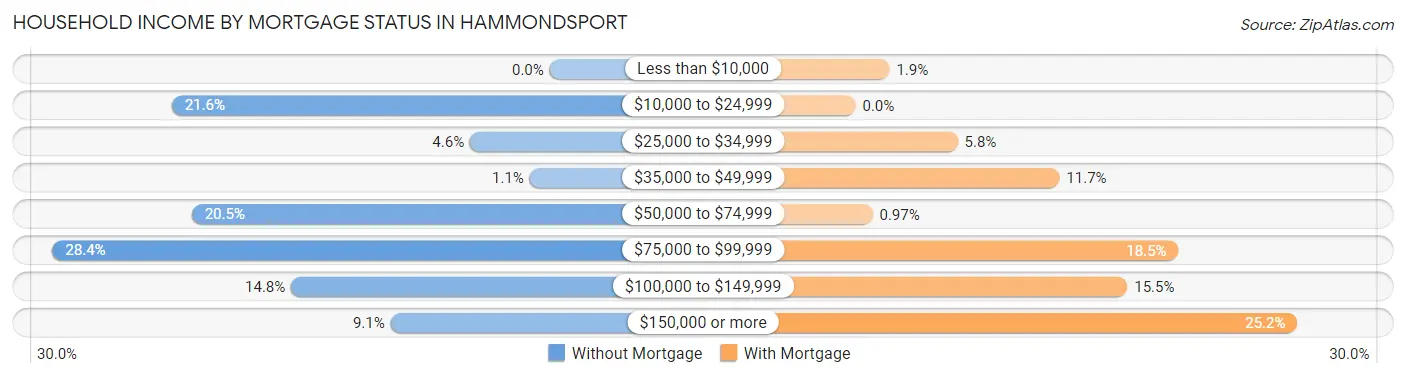
| Household Income | Without Mortgage | With Mortgage |
| Less than $10,000 | 0 (0.0%) | 2 (1.9%) |
| $10,000 to $24,999 | 19 (21.6%) | 0 (0.0%) |
| $25,000 to $34,999 | 4 (4.5%) | 6 (5.8%) |
| $35,000 to $49,999 | 1 (1.1%) | 12 (11.7%) |
| $50,000 to $74,999 | 18 (20.4%) | 1 (1.0%) |
| $75,000 to $99,999 | 25 (28.4%) | 19 (18.4%) |
| $100,000 to $149,999 | 13 (14.8%) | 16 (15.5%) |
| $150,000 or more | 8 (9.1%) | 26 (25.2%) |
| Total | 88 (100.0%) | 103 (100.0%) |
Property Value to Household Income Ratio in Hammondsport
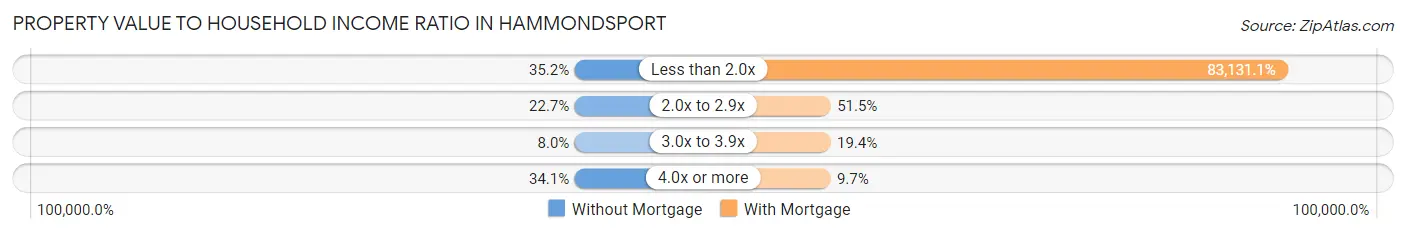
| Value-to-Income Ratio | Without Mortgage | With Mortgage |
| Less than 2.0x | 31 (35.2%) | 85,625 (83,131.1%) |
| 2.0x to 2.9x | 20 (22.7%) | 53 (51.5%) |
| 3.0x to 3.9x | 7 (8.0%) | 20 (19.4%) |
| 4.0x or more | 30 (34.1%) | 10 (9.7%) |
| Total | 88 (100.0%) | 103 (100.0%) |
Real Estate Taxes by Mortgage Status in Hammondsport
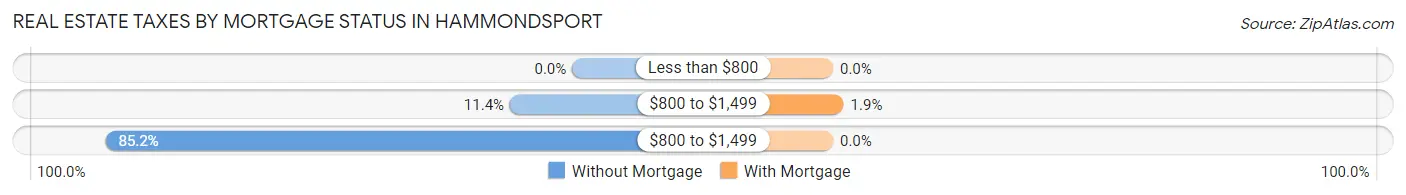
| Property Taxes | Without Mortgage | With Mortgage |
| Less than $800 | 0 (0.0%) | 0 (0.0%) |
| $800 to $1,499 | 10 (11.4%) | 2 (1.9%) |
| $800 to $1,499 | 75 (85.2%) | 0 (0.0%) |
| Total | 88 (100.0%) | 103 (100.0%) |
Health & Disability in Hammondsport
Health Insurance Coverage by Age in Hammondsport
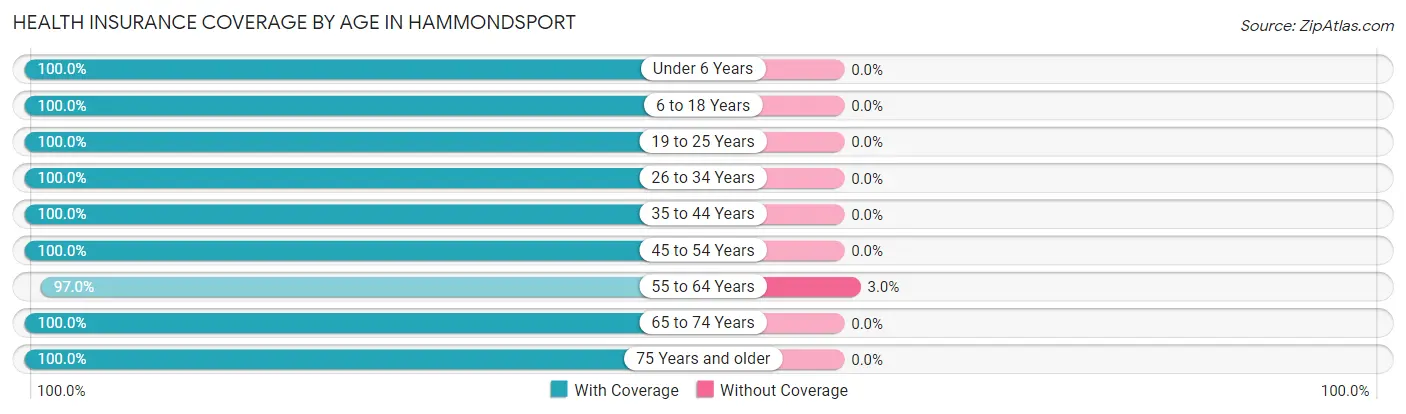
| Age Bracket | With Coverage | Without Coverage |
| Under 6 Years | 24 (100.0%) | 0 (0.0%) |
| 6 to 18 Years | 71 (100.0%) | 0 (0.0%) |
| 19 to 25 Years | 25 (100.0%) | 0 (0.0%) |
| 26 to 34 Years | 30 (100.0%) | 0 (0.0%) |
| 35 to 44 Years | 41 (100.0%) | 0 (0.0%) |
| 45 to 54 Years | 97 (100.0%) | 0 (0.0%) |
| 55 to 64 Years | 128 (97.0%) | 4 (3.0%) |
| 65 to 74 Years | 120 (100.0%) | 0 (0.0%) |
| 75 Years and older | 29 (100.0%) | 0 (0.0%) |
| Total | 565 (99.3%) | 4 (0.7%) |
Health Insurance Coverage by Citizenship Status in Hammondsport
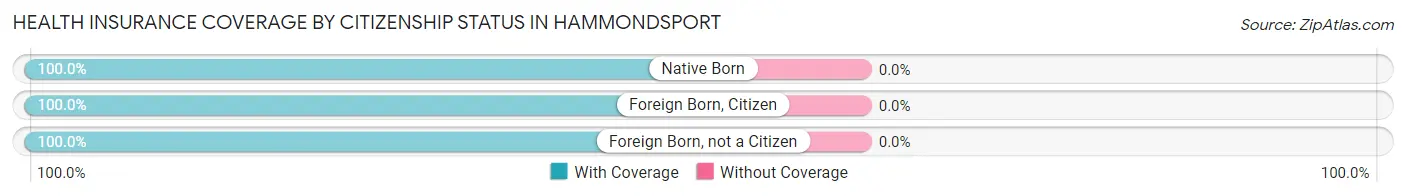
| Citizenship Status | With Coverage | Without Coverage |
| Native Born | 24 (100.0%) | 0 (0.0%) |
| Foreign Born, Citizen | 71 (100.0%) | 0 (0.0%) |
| Foreign Born, not a Citizen | 25 (100.0%) | 0 (0.0%) |
Health Insurance Coverage by Household Income in Hammondsport
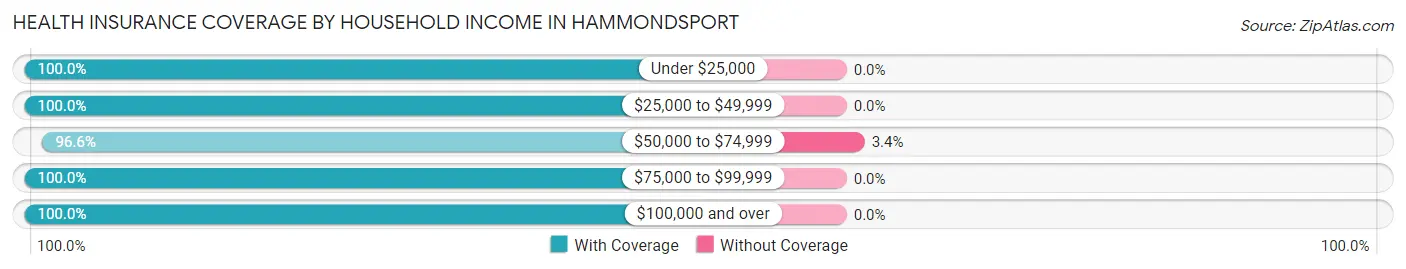
| Household Income | With Coverage | Without Coverage |
| Under $25,000 | 68 (100.0%) | 0 (0.0%) |
| $25,000 to $49,999 | 87 (100.0%) | 0 (0.0%) |
| $50,000 to $74,999 | 115 (96.6%) | 4 (3.4%) |
| $75,000 to $99,999 | 86 (100.0%) | 0 (0.0%) |
| $100,000 and over | 206 (100.0%) | 0 (0.0%) |
Public vs Private Health Insurance Coverage by Age in Hammondsport
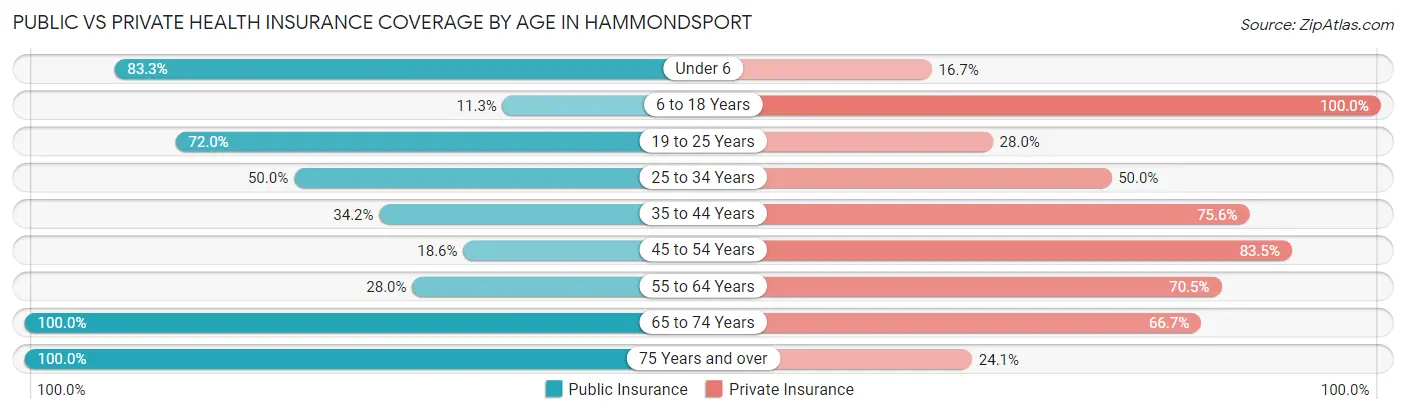
| Age Bracket | Public Insurance | Private Insurance |
| Under 6 | 20 (83.3%) | 4 (16.7%) |
| 6 to 18 Years | 8 (11.3%) | 71 (100.0%) |
| 19 to 25 Years | 18 (72.0%) | 7 (28.0%) |
| 25 to 34 Years | 15 (50.0%) | 15 (50.0%) |
| 35 to 44 Years | 14 (34.2%) | 31 (75.6%) |
| 45 to 54 Years | 18 (18.6%) | 81 (83.5%) |
| 55 to 64 Years | 37 (28.0%) | 93 (70.5%) |
| 65 to 74 Years | 120 (100.0%) | 80 (66.7%) |
| 75 Years and over | 29 (100.0%) | 7 (24.1%) |
| Total | 279 (49.0%) | 389 (68.4%) |
Disability Status by Sex by Age in Hammondsport
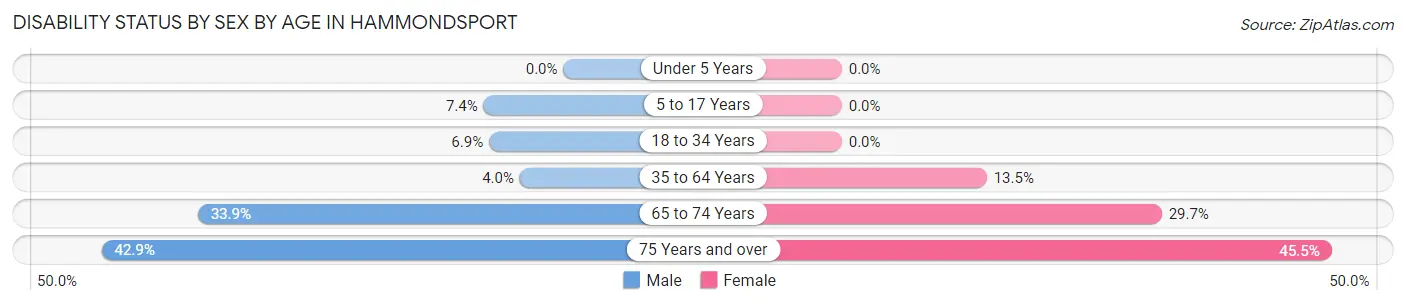
| Age Bracket | Male | Female |
| Under 5 Years | 0 (0.0%) | 0 (0.0%) |
| 5 to 17 Years | 4 (7.4%) | 0 (0.0%) |
| 18 to 34 Years | 2 (6.9%) | 0 (0.0%) |
| 35 to 64 Years | 4 (4.0%) | 23 (13.5%) |
| 65 to 74 Years | 19 (33.9%) | 19 (29.7%) |
| 75 Years and over | 3 (42.9%) | 10 (45.5%) |
Disability Class by Sex by Age in Hammondsport
Disability Class: Hearing Difficulty
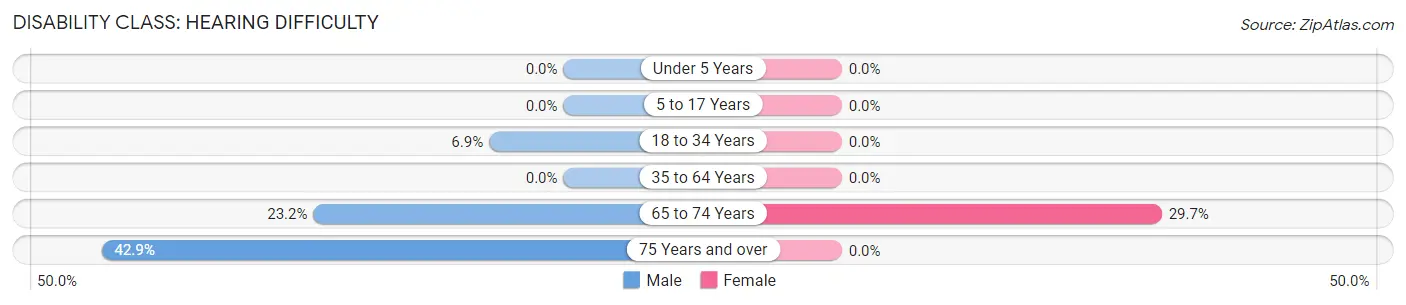
| Age Bracket | Male | Female |
| Under 5 Years | 0 (0.0%) | 0 (0.0%) |
| 5 to 17 Years | 0 (0.0%) | 0 (0.0%) |
| 18 to 34 Years | 2 (6.9%) | 0 (0.0%) |
| 35 to 64 Years | 0 (0.0%) | 0 (0.0%) |
| 65 to 74 Years | 13 (23.2%) | 19 (29.7%) |
| 75 Years and over | 3 (42.9%) | 0 (0.0%) |
Disability Class: Vision Difficulty
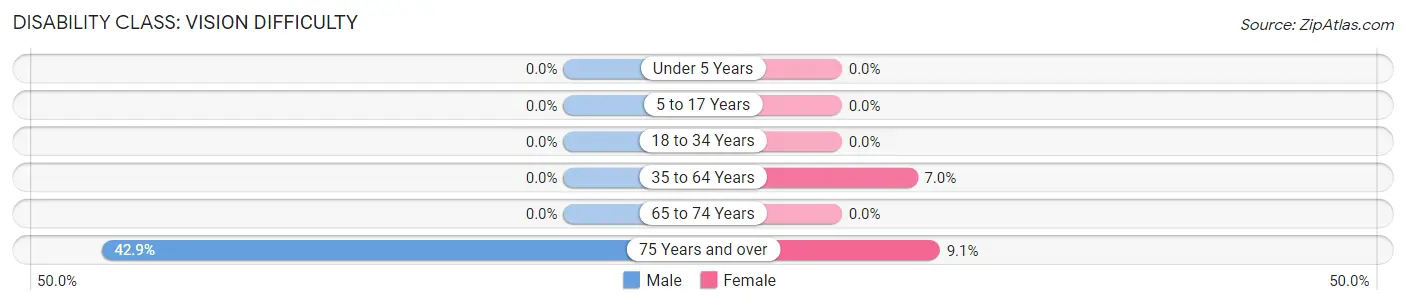
| Age Bracket | Male | Female |
| Under 5 Years | 0 (0.0%) | 0 (0.0%) |
| 5 to 17 Years | 0 (0.0%) | 0 (0.0%) |
| 18 to 34 Years | 0 (0.0%) | 0 (0.0%) |
| 35 to 64 Years | 0 (0.0%) | 12 (7.0%) |
| 65 to 74 Years | 0 (0.0%) | 0 (0.0%) |
| 75 Years and over | 3 (42.9%) | 2 (9.1%) |
Disability Class: Cognitive Difficulty
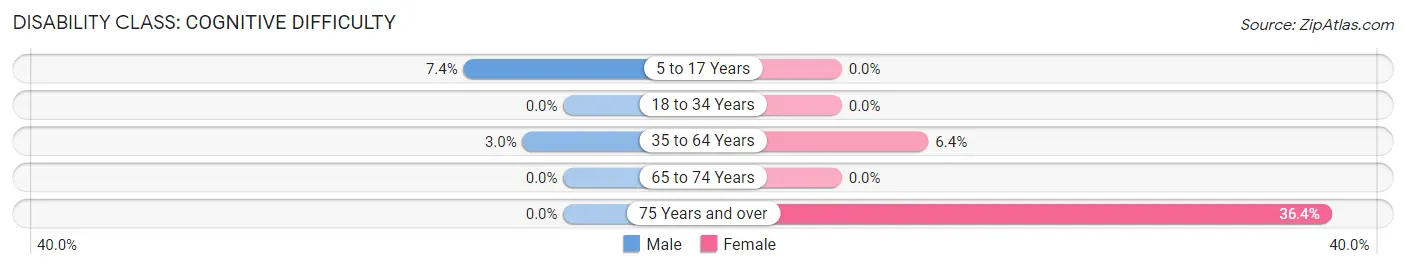
| Age Bracket | Male | Female |
| 5 to 17 Years | 4 (7.4%) | 0 (0.0%) |
| 18 to 34 Years | 0 (0.0%) | 0 (0.0%) |
| 35 to 64 Years | 3 (3.0%) | 11 (6.4%) |
| 65 to 74 Years | 0 (0.0%) | 0 (0.0%) |
| 75 Years and over | 0 (0.0%) | 8 (36.4%) |
Disability Class: Ambulatory Difficulty
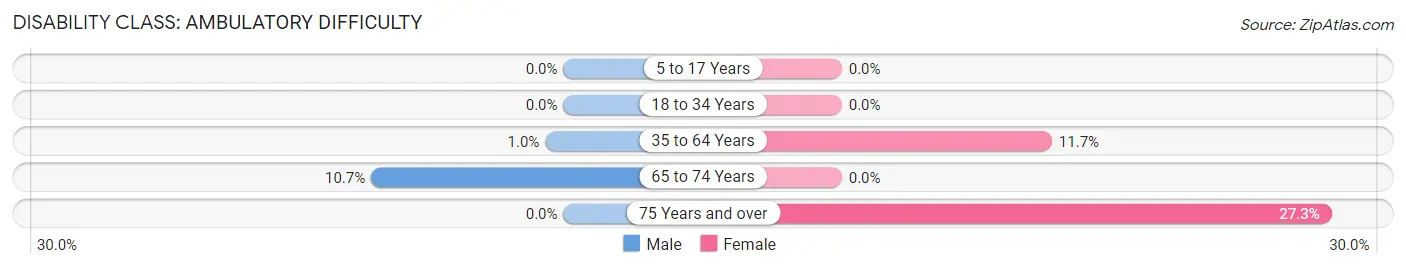
| Age Bracket | Male | Female |
| 5 to 17 Years | 0 (0.0%) | 0 (0.0%) |
| 18 to 34 Years | 0 (0.0%) | 0 (0.0%) |
| 35 to 64 Years | 1 (1.0%) | 20 (11.7%) |
| 65 to 74 Years | 6 (10.7%) | 0 (0.0%) |
| 75 Years and over | 0 (0.0%) | 6 (27.3%) |
Disability Class: Self-Care Difficulty
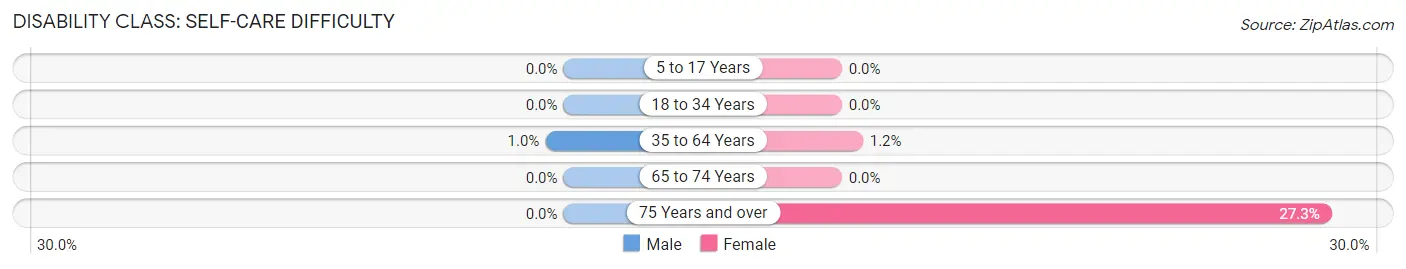
| Age Bracket | Male | Female |
| 5 to 17 Years | 0 (0.0%) | 0 (0.0%) |
| 18 to 34 Years | 0 (0.0%) | 0 (0.0%) |
| 35 to 64 Years | 1 (1.0%) | 2 (1.2%) |
| 65 to 74 Years | 0 (0.0%) | 0 (0.0%) |
| 75 Years and over | 0 (0.0%) | 6 (27.3%) |
Technology Access in Hammondsport
Computing Device Access in Hammondsport
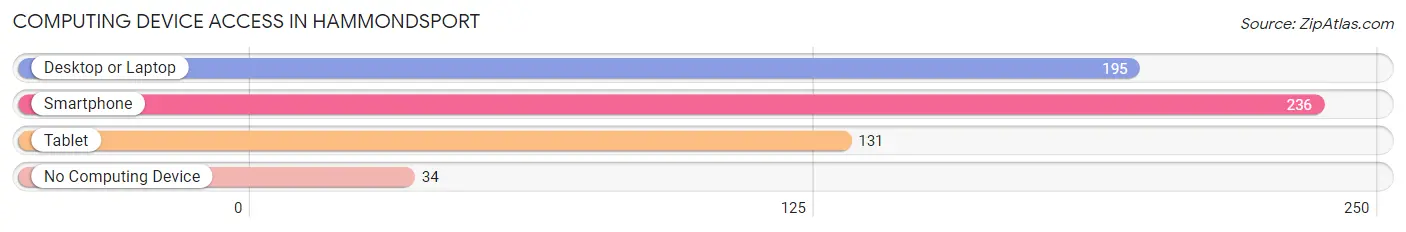
| Device Type | # Households | % Households |
| Desktop or Laptop | 195 | 66.5% |
| Smartphone | 236 | 80.5% |
| Tablet | 131 | 44.7% |
| No Computing Device | 34 | 11.6% |
| Total | 293 | 100.0% |
Internet Access in Hammondsport
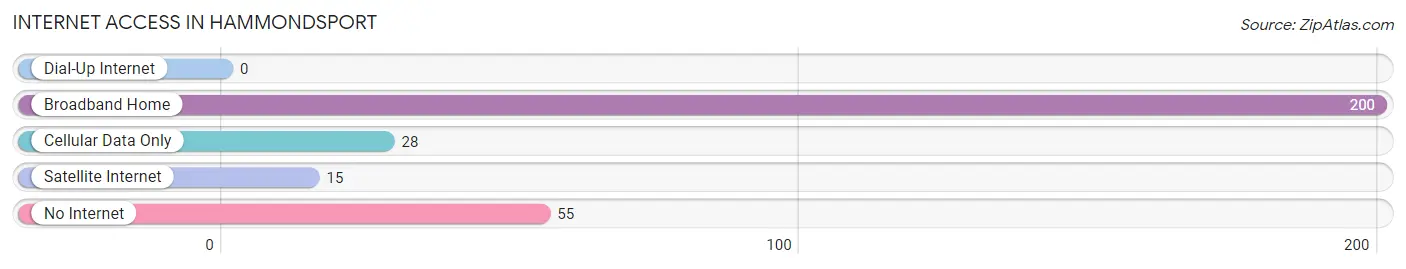
| Internet Type | # Households | % Households |
| Dial-Up Internet | 0 | 0.0% |
| Broadband Home | 200 | 68.3% |
| Cellular Data Only | 28 | 9.6% |
| Satellite Internet | 15 | 5.1% |
| No Internet | 55 | 18.8% |
| Total | 293 | 100.0% |
Hammondsport Summary
Hammondsport is a village located in the Finger Lakes region of New York State. It is situated in the Town of Urbana in Steuben County, and is located on the northern shore of Keuka Lake. The village has a population of approximately 600 people, and is known for its wineries, breweries, and its connection to aviation pioneer Glenn Curtiss.
History
The area that is now Hammondsport was originally inhabited by the Seneca Nation of the Iroquois Confederacy. The first European settlers arrived in the area in the late 1700s, and the village was officially founded in 1812. It was named after Judge Abraham Hammond, who was a prominent local landowner.
In the late 1800s, Hammondsport became a popular tourist destination due to its proximity to Keuka Lake. The village was also home to several wineries, breweries, and distilleries.
In the early 1900s, Hammondsport became known as the “Cradle of Aviation” due to its connection to aviation pioneer Glenn Curtiss. Curtiss established the Curtiss Aeroplane and Motor Company in Hammondsport in 1909, and the village was the site of the first public flight of an airplane in the United States.
Geography
Hammondsport is located in the Finger Lakes region of New York State. It is situated in the Town of Urbana in Steuben County, and is located on the northern shore of Keuka Lake. The village is approximately 30 miles south of Rochester and 60 miles southeast of Syracuse.
The terrain around Hammondsport is mostly flat, with some rolling hills. The village is surrounded by vineyards, orchards, and farms. The Finger Lakes National Forest is located nearby, and the village is also close to several state parks, including Letchworth State Park and Watkins Glen State Park.
Economy
The economy of Hammondsport is largely based on tourism and agriculture. The village is home to several wineries, breweries, and distilleries, and is a popular destination for wine and beer enthusiasts. The village is also home to several small businesses, including restaurants, shops, and galleries.
Agriculture is also an important part of the local economy. The area around Hammondsport is known for its vineyards, orchards, and farms. The village is also home to several fruit and vegetable stands, which sell locally grown produce.
Demographics
As of the 2010 census, the population of Hammondsport was 590. The racial makeup of the village was 97.2% White, 0.2% African American, 0.2% Native American, 0.2% Asian, 0.2% from other races, and 1.9% from two or more races. Hispanic or Latino of any race were 1.7% of the population.
The median household income in Hammondsport was $41,250, and the median family income was $50,000. The per capita income for the village was $20,945. About 8.3% of families and 10.2% of the population were below the poverty line, including 11.3% of those under age 18 and 8.3% of those age 65 or over.
Common Questions
What is the Total Population of Hammondsport?
Total Population of Hammondsport is 569.
What is the Total Male Population of Hammondsport?
Total Male Population of Hammondsport is 266.
What is the Total Female Population of Hammondsport?
Total Female Population of Hammondsport is 303.
What is the Ratio of Males per 100 Females in Hammondsport?
There are 87.79 Males per 100 Females in Hammondsport.
What is the Ratio of Females per 100 Males in Hammondsport?
There are 113.91 Females per 100 Males in Hammondsport.
What is the Median Population Age in Hammondsport?
Median Population Age in Hammondsport is 54.4 Years.
What is the Average Family Size in Hammondsport
Average Family Size in Hammondsport is 2.8 People.
What is the Average Household Size in Hammondsport
Average Household Size in Hammondsport is 1.9 People.
What is Per Capita Income in Hammondsport?
Per Capita income in Hammondsport is $41,433.
What is the Median Family Income in Hammondsport?
Median Family Income in Hammondsport is $79,750.
What is the Median Household income in Hammondsport?
Median Household Income in Hammondsport is $64,375.
What is Income or Wage Gap in Hammondsport?
Income or Wage Gap in Hammondsport is 32.7%.
Women in Hammondsport earn 67.3 cents for every dollar earned by a man.
What is Inequality or Gini Index in Hammondsport?
Inequality or Gini Index in Hammondsport is 0.44.
How Large is the Labor Force in Hammondsport?
There are 281 People in the Labor Forcein in Hammondsport.
What is the Percentage of People in the Labor Force in Hammondsport?
57.6% of People are in the Labor Force in Hammondsport.
What is the Unemployment Rate in Hammondsport?
Unemployment Rate in Hammondsport is 2.5%.