Long View, NC
Long View Map
Long View Overview
5,029
TOTAL POPULATION
2,815
MALE POPULATION
2,214
FEMALE POPULATION
127.15
MALES / 100 FEMALES
78.65
FEMALES / 100 MALES
38.7
MEDIAN AGE
2.9
AVG FAMILY SIZE
2.4
AVG HOUSEHOLD SIZE
$26,604
PER CAPITA INCOME
$50,019
AVG FAMILY INCOME
$44,740
AVG HOUSEHOLD INCOME
23.2%
WAGE / INCOME GAP [ % ]
76.8¢/ $1
WAGE / INCOME GAP [ $ ]
0.40
INEQUALITY / GINI INDEX
2,843
LABOR FORCE [ PEOPLE ]
66.4%
PERCENT IN LABOR FORCE
5.3%
UNEMPLOYMENT RATE
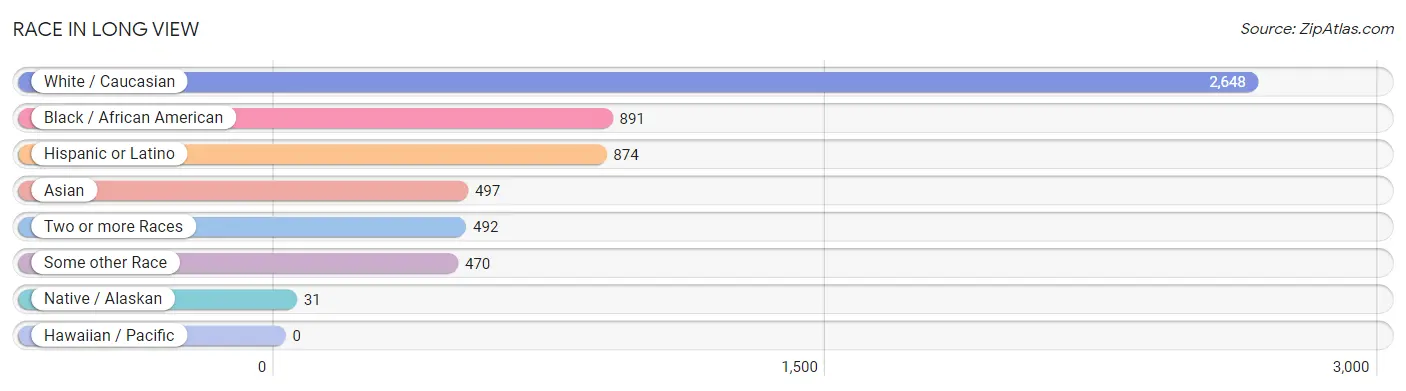
Race in Long View
The most populous races in Long View are White / Caucasian (2,648 | 52.6%), Black / African American (891 | 17.7%), and Hispanic or Latino (874 | 17.4%).
| Race | # Population | % Population |
| Asian | 497 | 9.9% |
| Black / African American | 891 | 17.7% |
| Hawaiian / Pacific | 0 | 0.0% |
| Hispanic or Latino | 874 | 17.4% |
| Native / Alaskan | 31 | 0.6% |
| White / Caucasian | 2,648 | 52.6% |
| Two or more Races | 492 | 9.8% |
| Some other Race | 470 | 9.3% |
| Total | 5,029 | 100.0% |
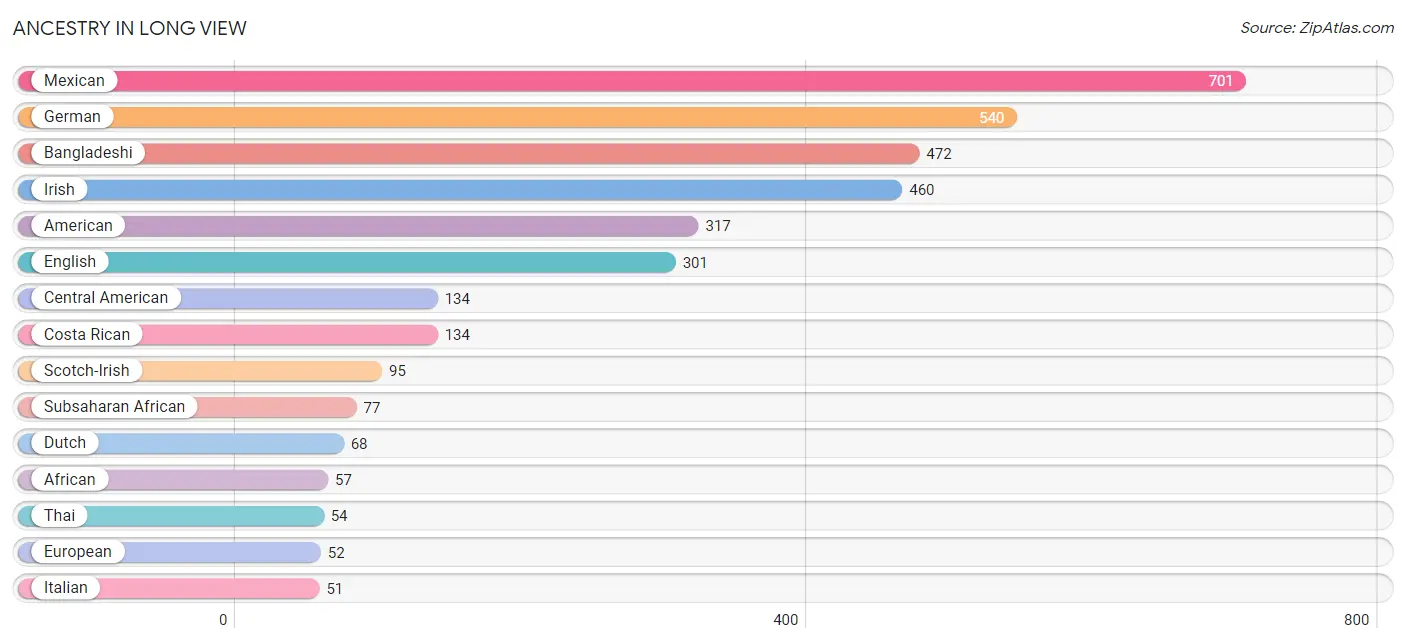
Ancestry in Long View
The most populous ancestries reported in Long View are Mexican (701 | 13.9%), German (540 | 10.7%), Bangladeshi (472 | 9.4%), Irish (460 | 9.1%), and American (317 | 6.3%), together accounting for 49.5% of all Long View residents.
| Ancestry | # Population | % Population |
| African | 57 | 1.1% |
| American | 317 | 6.3% |
| Bangladeshi | 472 | 9.4% |
| Blackfeet | 3 | 0.1% |
| British | 24 | 0.5% |
| Central American | 134 | 2.7% |
| Cherokee | 15 | 0.3% |
| Costa Rican | 134 | 2.7% |
| Dutch | 68 | 1.3% |
| English | 301 | 6.0% |
| European | 52 | 1.0% |
| French | 45 | 0.9% |
| French Canadian | 20 | 0.4% |
| German | 540 | 10.7% |
| Irish | 460 | 9.1% |
| Italian | 51 | 1.0% |
| Lithuanian | 11 | 0.2% |
| Malaysian | 49 | 1.0% |
| Mexican | 701 | 13.9% |
| Portuguese | 8 | 0.2% |
| Puerto Rican | 24 | 0.5% |
| Scotch-Irish | 95 | 1.9% |
| Scottish | 42 | 0.8% |
| South American | 15 | 0.3% |
| Subsaharan African | 77 | 1.5% |
| Thai | 54 | 1.1% |
| Venezuelan | 15 | 0.3% |
| Welsh | 30 | 0.6% | View All 28 Rows |
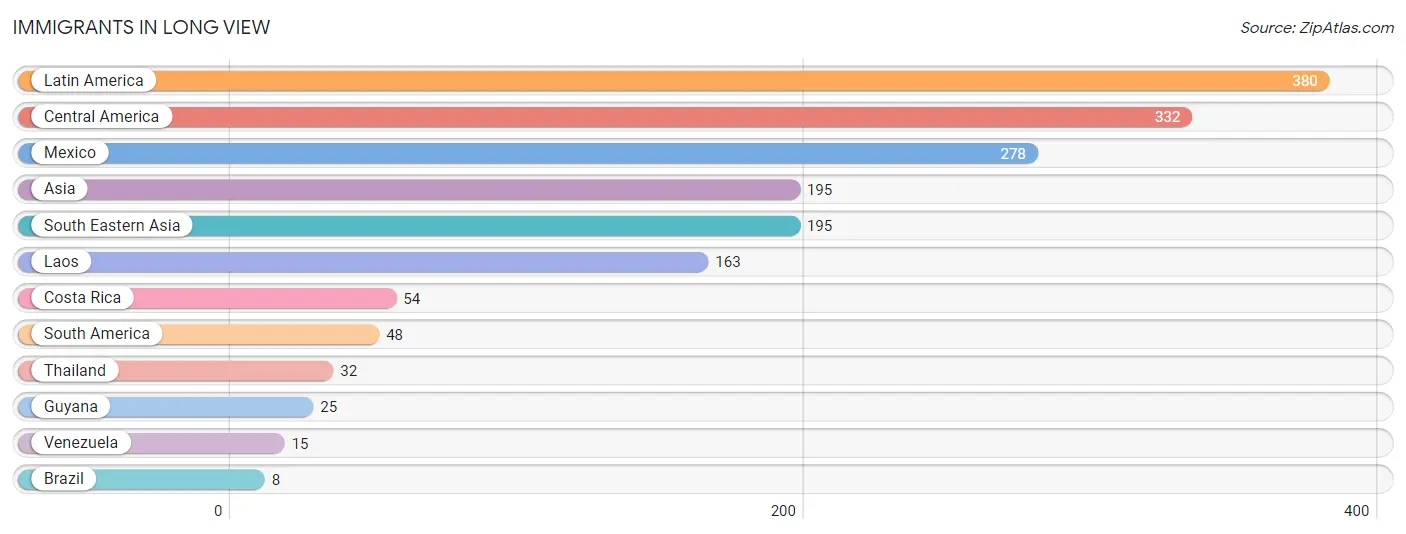
Immigrants in Long View
The most numerous immigrant groups reported in Long View came from Latin America (380 | 7.6%), Central America (332 | 6.6%), Mexico (278 | 5.5%), Asia (195 | 3.9%), and South Eastern Asia (195 | 3.9%), together accounting for 27.5% of all Long View residents.
| Immigration Origin | # Population | % Population |
| Asia | 195 | 3.9% |
| Brazil | 8 | 0.2% |
| Central America | 332 | 6.6% |
| Costa Rica | 54 | 1.1% |
| Guyana | 25 | 0.5% |
| Laos | 163 | 3.2% |
| Latin America | 380 | 7.6% |
| Mexico | 278 | 5.5% |
| South America | 48 | 0.9% |
| South Eastern Asia | 195 | 3.9% |
| Thailand | 32 | 0.6% |
| Venezuela | 15 | 0.3% | View All 12 Rows |
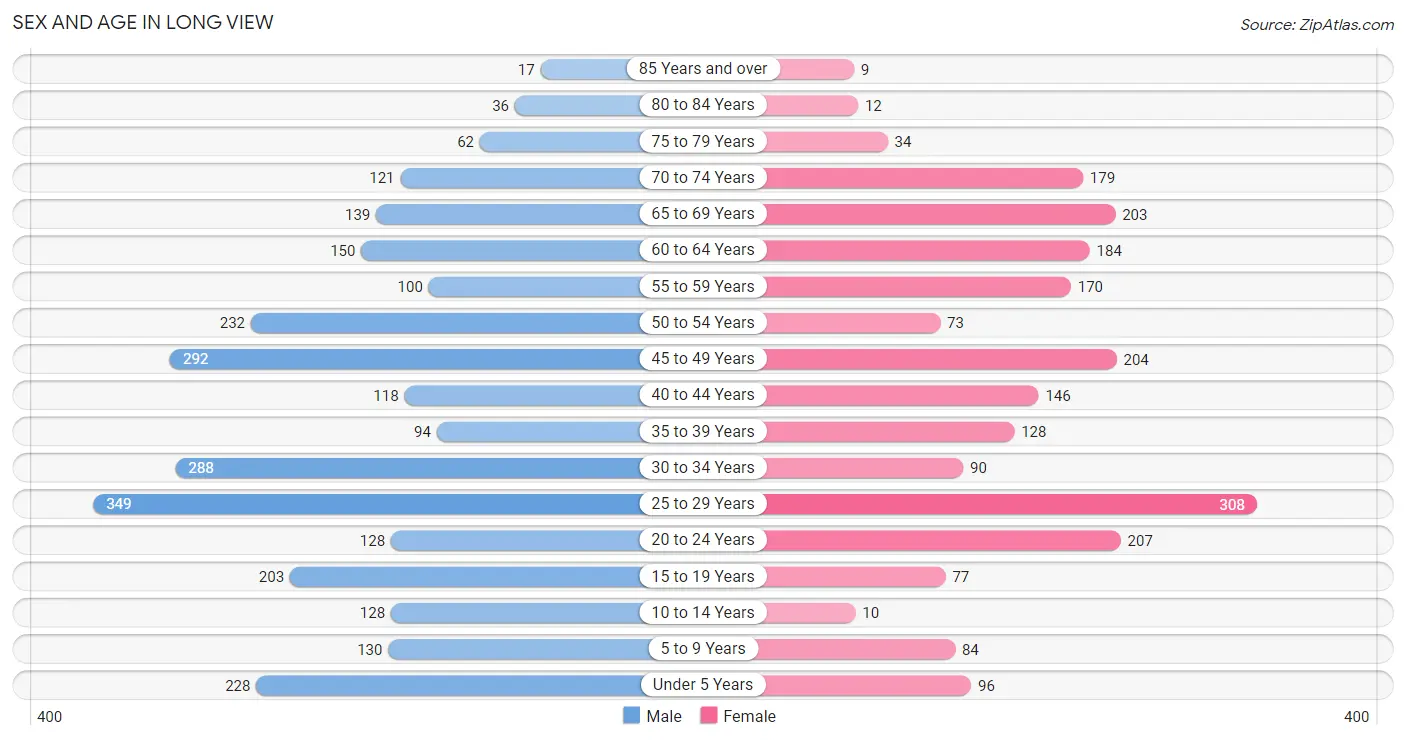
Sex and Age in Long View
Sex and Age in Long View
The most populous age groups in Long View are 25 to 29 Years (349 | 12.4%) for men and 25 to 29 Years (308 | 13.9%) for women.
| Age Bracket | Male | Female |
| Under 5 Years | 228 (8.1%) | 96 (4.3%) |
| 5 to 9 Years | 130 (4.6%) | 84 (3.8%) |
| 10 to 14 Years | 128 (4.5%) | 10 (0.4%) |
| 15 to 19 Years | 203 (7.2%) | 77 (3.5%) |
| 20 to 24 Years | 128 (4.5%) | 207 (9.3%) |
| 25 to 29 Years | 349 (12.4%) | 308 (13.9%) |
| 30 to 34 Years | 288 (10.2%) | 90 (4.1%) |
| 35 to 39 Years | 94 (3.3%) | 128 (5.8%) |
| 40 to 44 Years | 118 (4.2%) | 146 (6.6%) |
| 45 to 49 Years | 292 (10.4%) | 204 (9.2%) |
| 50 to 54 Years | 232 (8.2%) | 73 (3.3%) |
| 55 to 59 Years | 100 (3.5%) | 170 (7.7%) |
| 60 to 64 Years | 150 (5.3%) | 184 (8.3%) |
| 65 to 69 Years | 139 (4.9%) | 203 (9.2%) |
| 70 to 74 Years | 121 (4.3%) | 179 (8.1%) |
| 75 to 79 Years | 62 (2.2%) | 34 (1.5%) |
| 80 to 84 Years | 36 (1.3%) | 12 (0.5%) |
| 85 Years and over | 17 (0.6%) | 9 (0.4%) |
| Total | 2,815 (100.0%) | 2,214 (100.0%) |
Families and Households in Long View
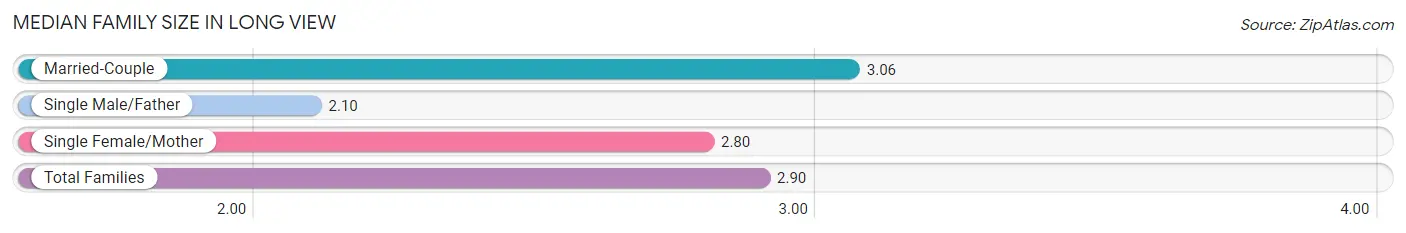
Median Family Size in Long View
The median family size in Long View is 2.90 persons per family, with married-couple families (832 | 63.3%) accounting for the largest median family size of 3.06 persons per family. On the other hand, single male/father families (121 | 9.2%) represent the smallest median family size with 2.10 persons per family.
| Family Type | # Families | Family Size |
| Married-Couple | 832 (63.3%) | 3.06 |
| Single Male/Father | 121 (9.2%) | 2.10 |
| Single Female/Mother | 361 (27.5%) | 2.80 |
| Total Families | 1,314 (100.0%) | 2.90 |
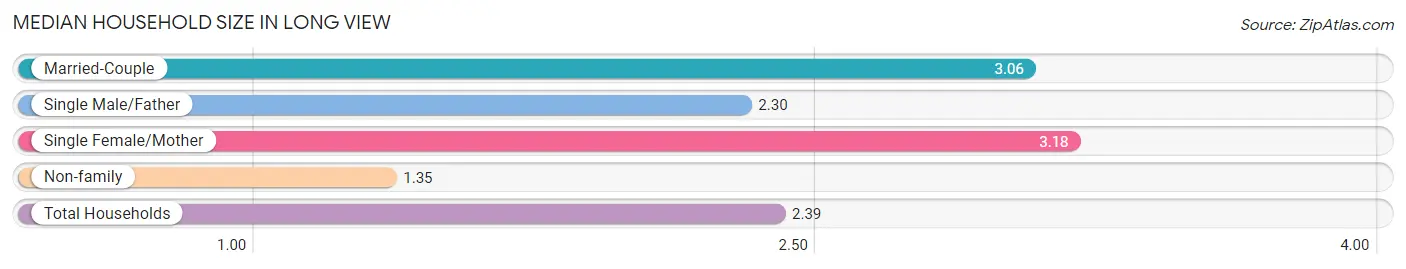
Median Household Size in Long View
The median household size in Long View is 2.39 persons per household, with single female/mother households (361 | 17.2%) accounting for the largest median household size of 3.18 persons per household. non-family households (788 | 37.5%) represent the smallest median household size with 1.35 persons per household.
| Household Type | # Households | Household Size |
| Married-Couple | 832 (39.6%) | 3.06 |
| Single Male/Father | 121 (5.8%) | 2.30 |
| Single Female/Mother | 361 (17.2%) | 3.18 |
| Non-family | 788 (37.5%) | 1.35 |
| Total Households | 2,102 (100.0%) | 2.39 |
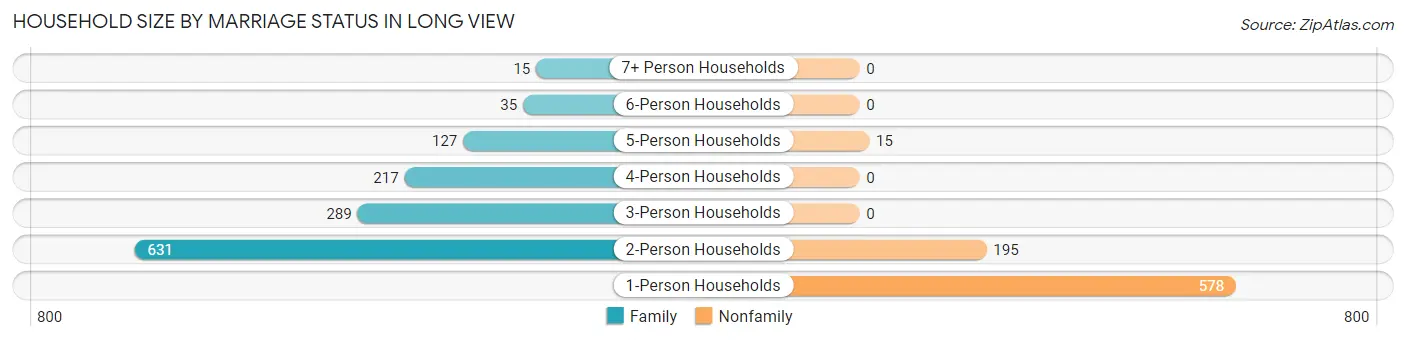
Household Size by Marriage Status in Long View
Out of a total of 2,102 households in Long View, 1,314 (62.5%) are family households, while 788 (37.5%) are nonfamily households. The most numerous type of family households are 2-person households, comprising 631, and the most common type of nonfamily households are 1-person households, comprising 578.
| Household Size | Family Households | Nonfamily Households |
| 1-Person Households | - | 578 (27.5%) |
| 2-Person Households | 631 (30.0%) | 195 (9.3%) |
| 3-Person Households | 289 (13.8%) | 0 (0.0%) |
| 4-Person Households | 217 (10.3%) | 0 (0.0%) |
| 5-Person Households | 127 (6.0%) | 15 (0.7%) |
| 6-Person Households | 35 (1.7%) | 0 (0.0%) |
| 7+ Person Households | 15 (0.7%) | 0 (0.0%) |
| Total | 1,314 (62.5%) | 788 (37.5%) |
Female Fertility in Long View
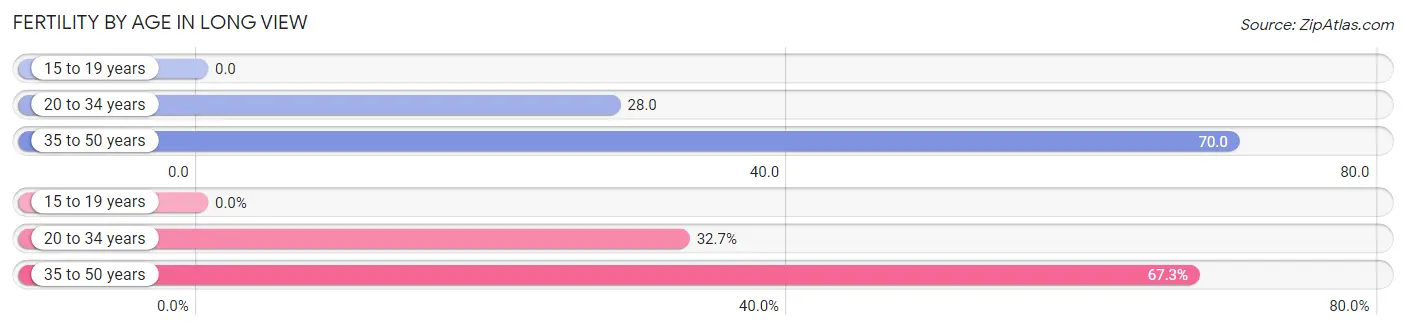
Fertility by Age in Long View
Average fertility rate in Long View is 44.0 births per 1,000 women. Women in the age bracket of 35 to 50 years have the highest fertility rate with 70.0 births per 1,000 women. Women in the age bracket of 35 to 50 years acount for 67.3% of all women with births.
| Age Bracket | Women with Births | Births / 1,000 Women |
| 15 to 19 years | 0 (0.0%) | 0.0 |
| 20 to 34 years | 17 (32.7%) | 28.0 |
| 35 to 50 years | 35 (67.3%) | 70.0 |
| Total | 52 (100.0%) | 44.0 |
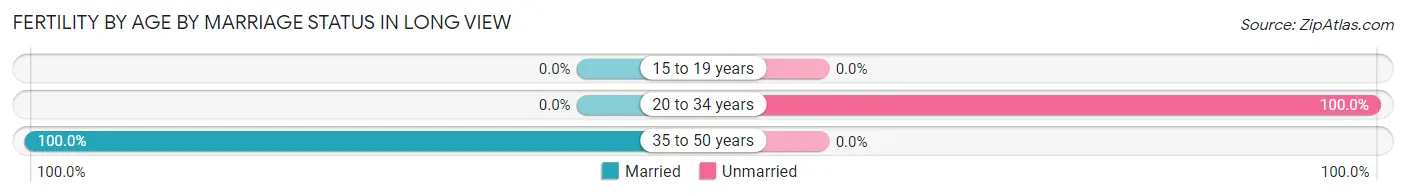
Fertility by Age by Marriage Status in Long View
67.3% of women with births (52) in Long View are married. The highest percentage of unmarried women with births falls into 20 to 34 years age bracket with 100.0% of them unmarried at the time of birth, while the lowest percentage of unmarried women with births belong to 35 to 50 years age bracket with 0.0% of them unmarried.
| Age Bracket | Married | Unmarried |
| 15 to 19 years | 0 (0.0%) | 0 (0.0%) |
| 20 to 34 years | 0 (0.0%) | 17 (100.0%) |
| 35 to 50 years | 35 (100.0%) | 0 (0.0%) |
| Total | 35 (67.3%) | 17 (32.7%) |
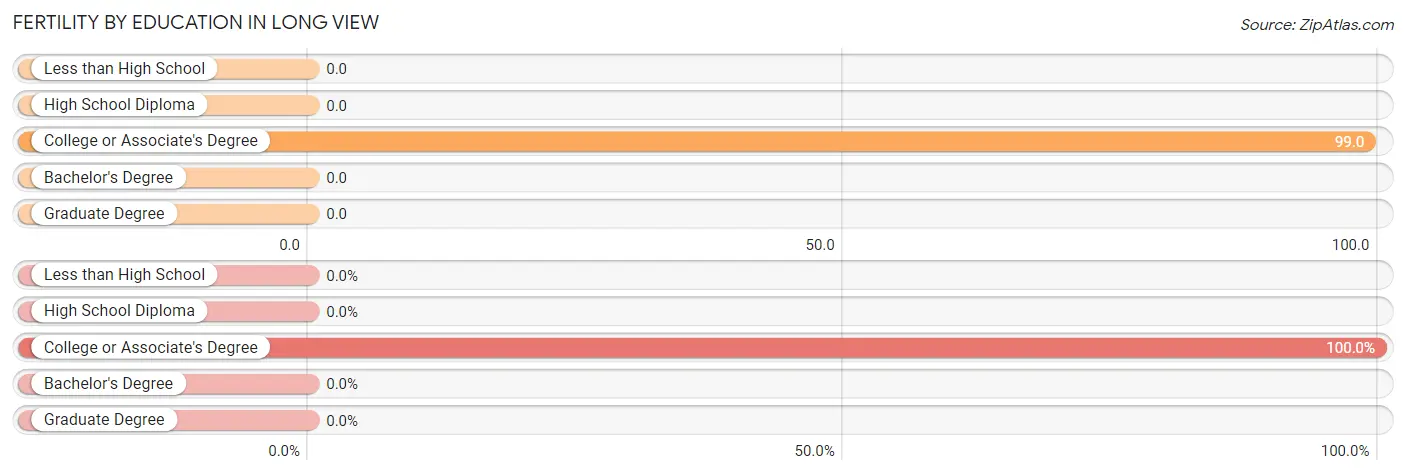
Fertility by Education in Long View
| Educational Attainment | Women with Births | Births / 1,000 Women |
| Less than High School | 0 (0.0%) | 0.0 |
| High School Diploma | 0 (0.0%) | 0.0 |
| College or Associate's Degree | 52 (100.0%) | 99.0 |
| Bachelor's Degree | 0 (0.0%) | 0.0 |
| Graduate Degree | 0 (0.0%) | 0.0 |
| Total | 52 (100.0%) | 44.0 |
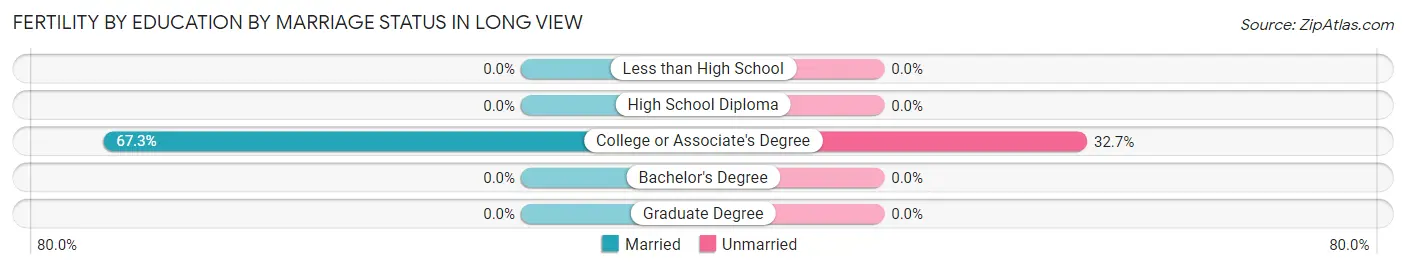
Fertility by Education by Marriage Status in Long View
32.7% of women with births in Long View are unmarried. Women with the educational attainment of college or associate's degree are most likely to be married with 67.3% of them married at childbirth, while women with the educational attainment of college or associate's degree are least likely to be married with 32.7% of them unmarried at childbirth.
| Educational Attainment | Married | Unmarried |
| Less than High School | 0 (0.0%) | 0 (0.0%) |
| High School Diploma | 0 (0.0%) | 0 (0.0%) |
| College or Associate's Degree | 35 (67.3%) | 17 (32.7%) |
| Bachelor's Degree | 0 (0.0%) | 0 (0.0%) |
| Graduate Degree | 0 (0.0%) | 0 (0.0%) |
| Total | 35 (67.3%) | 17 (32.7%) |
Income in Long View
Income Overview in Long View
Per Capita Income in Long View is $26,604, while median incomes of families and households are $50,019 and $44,740 respectively.
| Characteristic | Number | Measure |
| Per Capita Income | 5,029 | $26,604 |
| Median Family Income | 1,314 | $50,019 |
| Mean Family Income | 1,314 | $61,317 |
| Median Household Income | 2,102 | $44,740 |
| Mean Household Income | 2,102 | $61,026 |
| Income Deficit | 1,314 | $0 |
| Wage / Income Gap (%) | 5,029 | 23.23% |
| Wage / Income Gap ($) | 5,029 | 76.77¢ per $1 |
| Gini / Inequality Index | 5,029 | 0.40 |
Earnings by Sex in Long View
Average Earnings in Long View are $28,780, $33,684 for men and $25,859 for women, a difference of 23.2%.
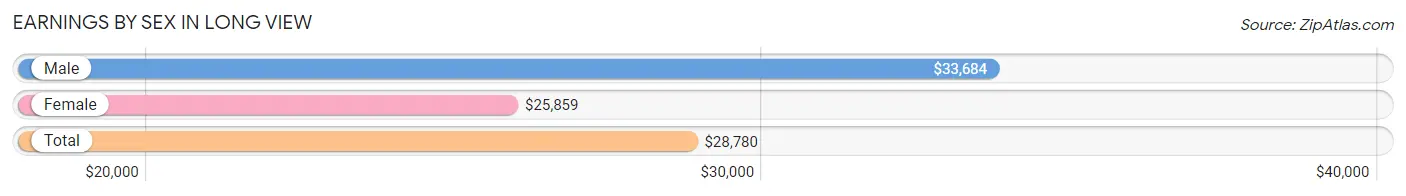
| Sex | Number | Average Earnings |
| Male | 1,532 (53.2%) | $33,684 |
| Female | 1,345 (46.8%) | $25,859 |
| Total | 2,877 (100.0%) | $28,780 |
Earnings by Sex by Income Bracket in Long View
The most common earnings brackets in Long View are $25,000 to $29,999 for men (187 | 12.2%) and $25,000 to $29,999 for women (260 | 19.3%).
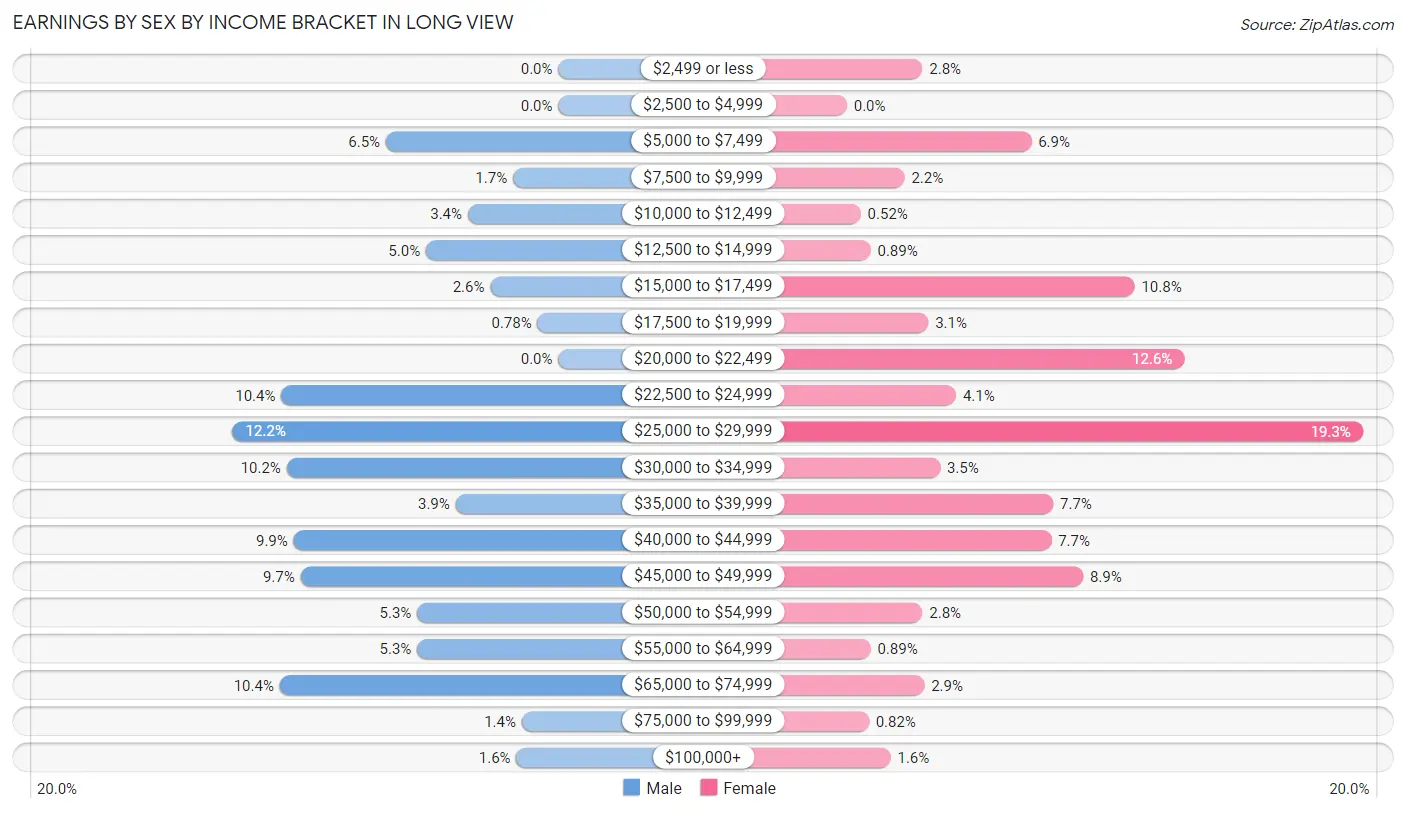
| Income | Male | Female |
| $2,499 or less | 0 (0.0%) | 38 (2.8%) |
| $2,500 to $4,999 | 0 (0.0%) | 0 (0.0%) |
| $5,000 to $7,499 | 99 (6.5%) | 93 (6.9%) |
| $7,500 to $9,999 | 26 (1.7%) | 29 (2.2%) |
| $10,000 to $12,499 | 52 (3.4%) | 7 (0.5%) |
| $12,500 to $14,999 | 76 (5.0%) | 12 (0.9%) |
| $15,000 to $17,499 | 39 (2.5%) | 145 (10.8%) |
| $17,500 to $19,999 | 12 (0.8%) | 41 (3.0%) |
| $20,000 to $22,499 | 0 (0.0%) | 170 (12.6%) |
| $22,500 to $24,999 | 159 (10.4%) | 55 (4.1%) |
| $25,000 to $29,999 | 187 (12.2%) | 260 (19.3%) |
| $30,000 to $34,999 | 156 (10.2%) | 47 (3.5%) |
| $35,000 to $39,999 | 59 (3.8%) | 104 (7.7%) |
| $40,000 to $44,999 | 152 (9.9%) | 103 (7.7%) |
| $45,000 to $49,999 | 148 (9.7%) | 119 (8.8%) |
| $50,000 to $54,999 | 81 (5.3%) | 38 (2.8%) |
| $55,000 to $64,999 | 81 (5.3%) | 12 (0.9%) |
| $65,000 to $74,999 | 160 (10.4%) | 39 (2.9%) |
| $75,000 to $99,999 | 21 (1.4%) | 11 (0.8%) |
| $100,000+ | 24 (1.6%) | 22 (1.6%) |
| Total | 1,532 (100.0%) | 1,345 (100.0%) |
Earnings by Sex by Educational Attainment in Long View
Average earnings in Long View are $34,441 for men and $25,915 for women, a difference of 24.8%. Men with an educational attainment of bachelor's degree enjoy the highest average annual earnings of $55,563, while those with high school diploma education earn the least with $31,333. Women with an educational attainment of bachelor's degree earn the most with the average annual earnings of $73,281, while those with high school diploma education have the smallest earnings of $17,443.
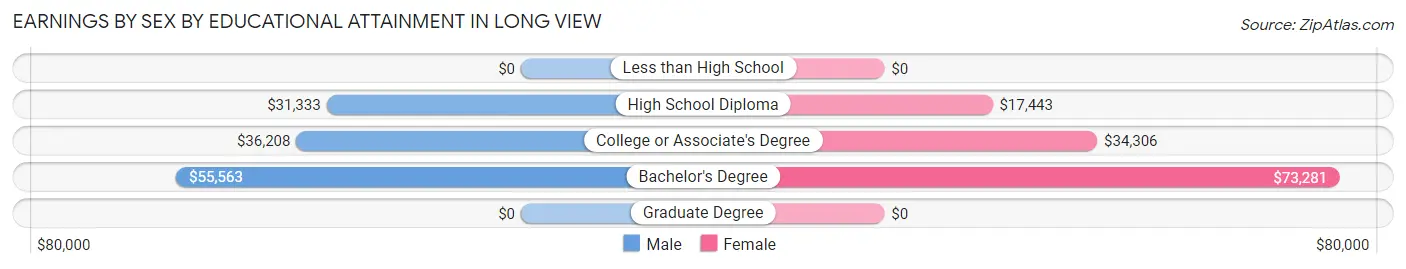
| Educational Attainment | Male Income | Female Income |
| Less than High School | - | - |
| High School Diploma | $31,333 | $17,443 |
| College or Associate's Degree | $36,208 | $34,306 |
| Bachelor's Degree | $55,563 | $73,281 |
| Graduate Degree | - | - |
| Total | $34,441 | $25,915 |
Family Income in Long View
Family Income Brackets in Long View
According to the Long View family income data, there are 359 families falling into the $35,000 to $49,999 income range, which is the most common income bracket and makes up 27.3% of all families.
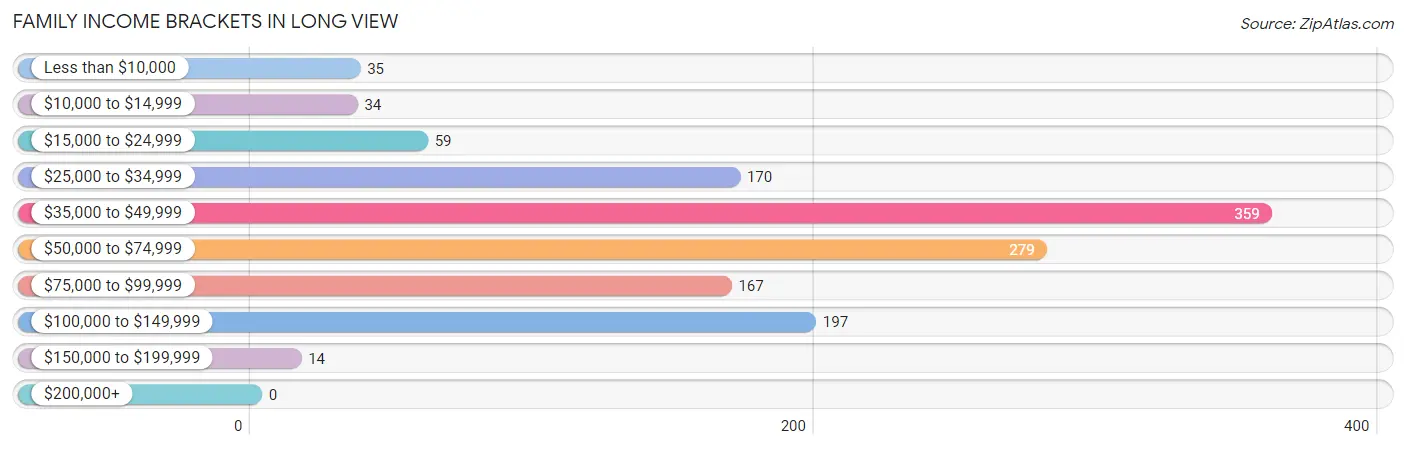
| Income Bracket | # Families | % Families |
| Less than $10,000 | 35 | 2.7% |
| $10,000 to $14,999 | 34 | 2.6% |
| $15,000 to $24,999 | 59 | 4.5% |
| $25,000 to $34,999 | 170 | 12.9% |
| $35,000 to $49,999 | 359 | 27.3% |
| $50,000 to $74,999 | 279 | 21.2% |
| $75,000 to $99,999 | 167 | 12.7% |
| $100,000 to $149,999 | 197 | 15.0% |
| $150,000 to $199,999 | 14 | 1.1% |
| $200,000+ | 0 | 0.0% |
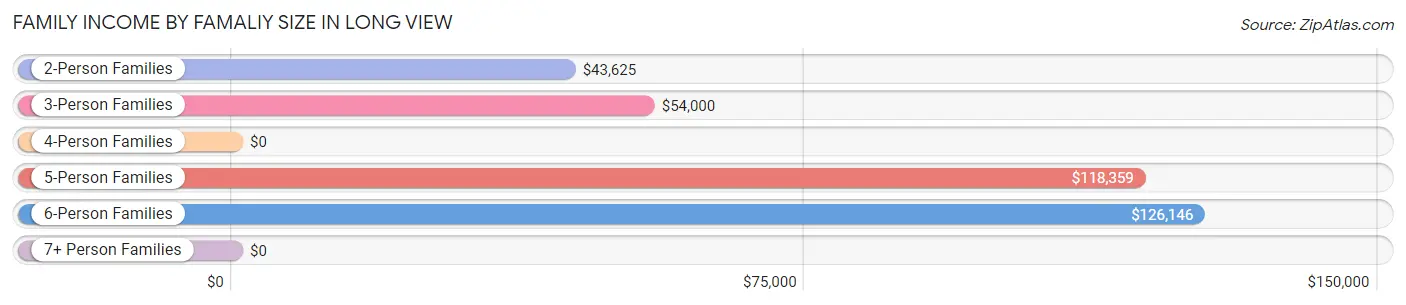
Family Income by Famaliy Size in Long View
6-person families (35 | 2.7%) account for the highest median family income in Long View with $126,146 per family, while 5-person families (116 | 8.8%) have the highest median income of $23,672 per family member.
| Income Bracket | # Families | Median Income |
| 2-Person Families | 723 (55.0%) | $43,625 |
| 3-Person Families | 226 (17.2%) | $54,000 |
| 4-Person Families | 199 (15.1%) | $0 |
| 5-Person Families | 116 (8.8%) | $118,359 |
| 6-Person Families | 35 (2.7%) | $126,146 |
| 7+ Person Families | 15 (1.1%) | $0 |
| Total | 1,314 (100.0%) | $50,019 |
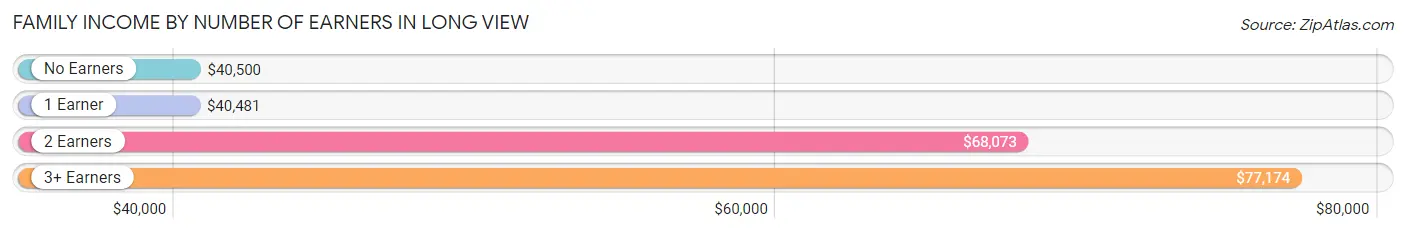
Family Income by Number of Earners in Long View
The median family income in Long View is $50,019, with families comprising 3+ earners (250) having the highest median family income of $77,174, while families with 1 earner (331) have the lowest median family income of $40,481, accounting for 19.0% and 25.2% of families, respectively.
| Number of Earners | # Families | Median Income |
| No Earners | 240 (18.3%) | $40,500 |
| 1 Earner | 331 (25.2%) | $40,481 |
| 2 Earners | 493 (37.5%) | $68,073 |
| 3+ Earners | 250 (19.0%) | $77,174 |
| Total | 1,314 (100.0%) | $50,019 |
Household Income in Long View
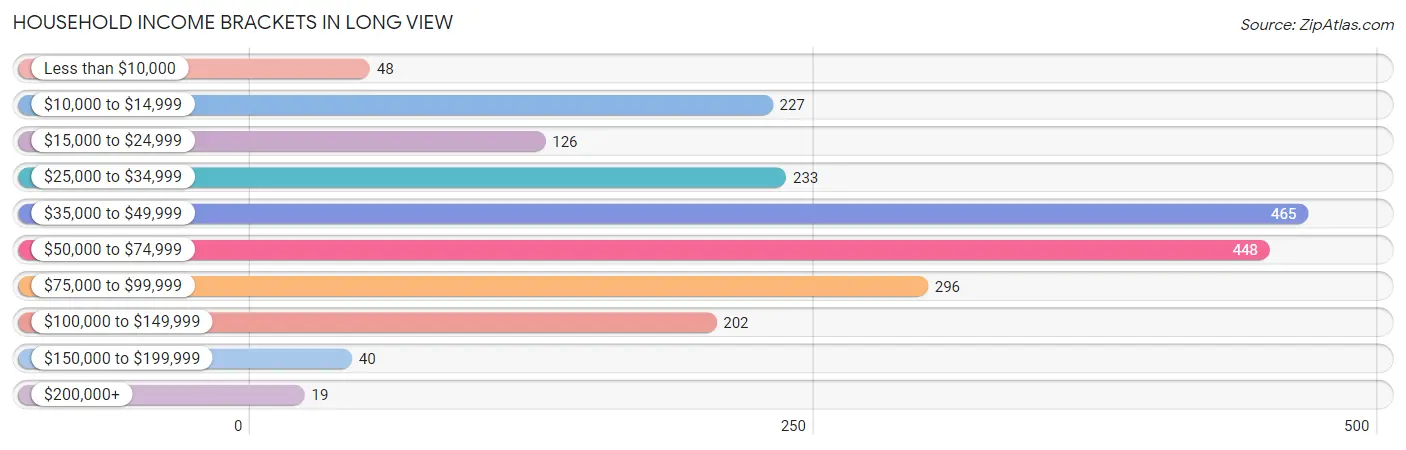
Household Income Brackets in Long View
With 465 households falling in the category, the $35,000 to $49,999 income range is the most frequent in Long View, accounting for 22.1% of all households. In contrast, only 19 households (0.9%) fall into the $200,000+ income bracket, making it the least populous group.
| Income Bracket | # Households | % Households |
| Less than $10,000 | 48 | 2.3% |
| $10,000 to $14,999 | 227 | 10.8% |
| $15,000 to $24,999 | 126 | 6.0% |
| $25,000 to $34,999 | 233 | 11.1% |
| $35,000 to $49,999 | 465 | 22.1% |
| $50,000 to $74,999 | 448 | 21.3% |
| $75,000 to $99,999 | 296 | 14.1% |
| $100,000 to $149,999 | 202 | 9.6% |
| $150,000 to $199,999 | 40 | 1.9% |
| $200,000+ | 19 | 0.9% |
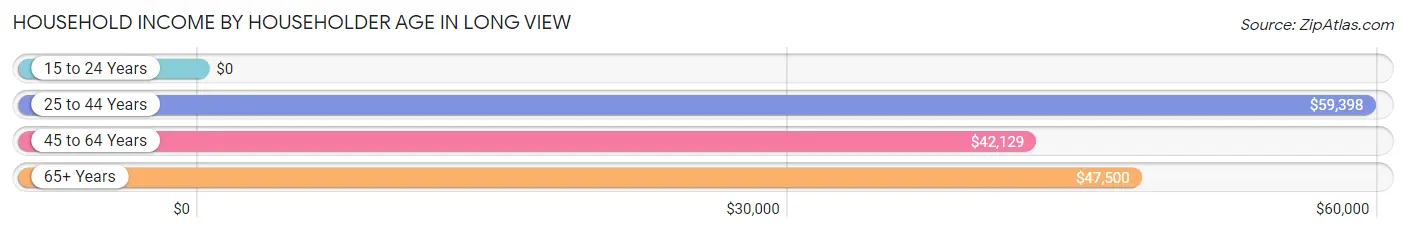
Household Income by Householder Age in Long View
The median household income in Long View is $44,740, with the highest median household income of $59,398 found in the 25 to 44 years age bracket for the primary householder. A total of 713 households (33.9%) fall into this category. Meanwhile, the 15 to 24 years age bracket for the primary householder has the lowest median household income of $0, with 10 households (0.5%) in this group.
| Income Bracket | # Households | Median Income |
| 15 to 24 Years | 10 (0.5%) | $0 |
| 25 to 44 Years | 713 (33.9%) | $59,398 |
| 45 to 64 Years | 817 (38.9%) | $42,129 |
| 65+ Years | 562 (26.7%) | $47,500 |
| Total | 2,102 (100.0%) | $44,740 |
Poverty in Long View
Income Below Poverty by Sex and Age in Long View
With 14.8% poverty level for males and 10.9% for females among the residents of Long View, 6 to 11 year old males and 12 to 14 year old females are the most vulnerable to poverty, with 67 males (49.6%) and 10 females (100.0%) in their respective age groups living below the poverty level.
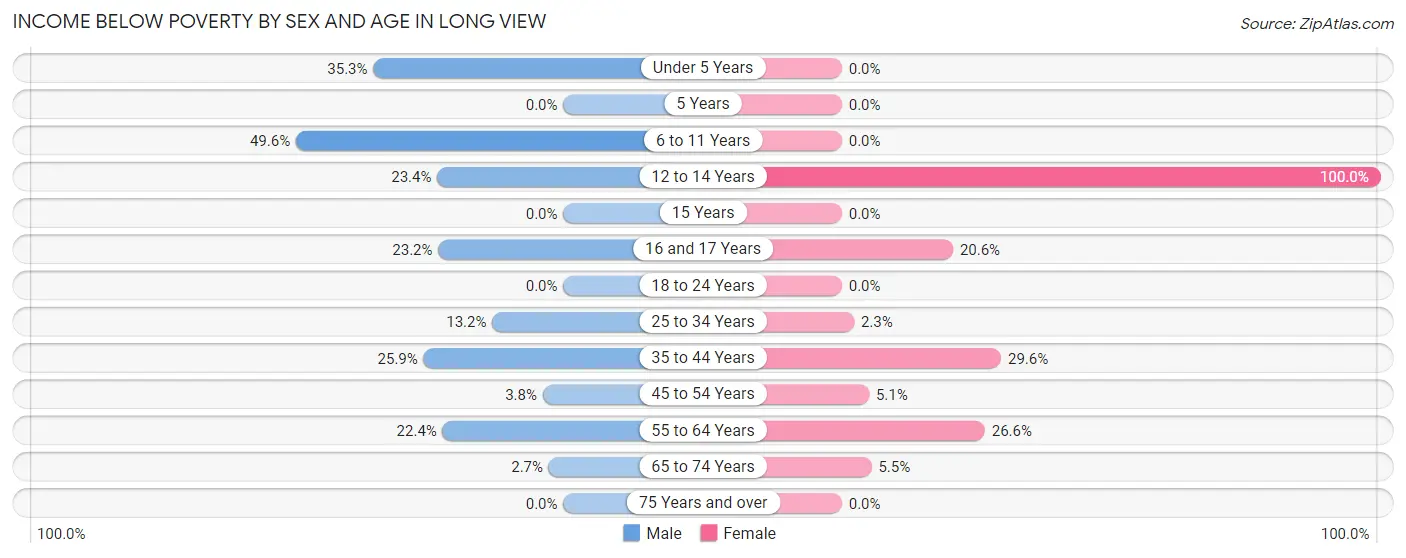
| Age Bracket | Male | Female |
| Under 5 Years | 73 (35.3%) | 0 (0.0%) |
| 5 Years | 0 (0.0%) | 0 (0.0%) |
| 6 to 11 Years | 67 (49.6%) | 0 (0.0%) |
| 12 to 14 Years | 22 (23.4%) | 10 (100.0%) |
| 15 Years | 0 (0.0%) | 0 (0.0%) |
| 16 and 17 Years | 29 (23.2%) | 13 (20.6%) |
| 18 to 24 Years | 0 (0.0%) | 0 (0.0%) |
| 25 to 34 Years | 84 (13.2%) | 9 (2.3%) |
| 35 to 44 Years | 55 (25.9%) | 81 (29.6%) |
| 45 to 54 Years | 20 (3.8%) | 14 (5.1%) |
| 55 to 64 Years | 56 (22.4%) | 94 (26.6%) |
| 65 to 74 Years | 7 (2.7%) | 21 (5.5%) |
| 75 Years and over | 0 (0.0%) | 0 (0.0%) |
| Total | 413 (14.8%) | 242 (10.9%) |
Income Above Poverty by Sex and Age in Long View
According to the poverty statistics in Long View, males aged 5 years and females aged under 5 years are the age groups that are most secure financially, with 100.0% of males and 100.0% of females in these age groups living above the poverty line.
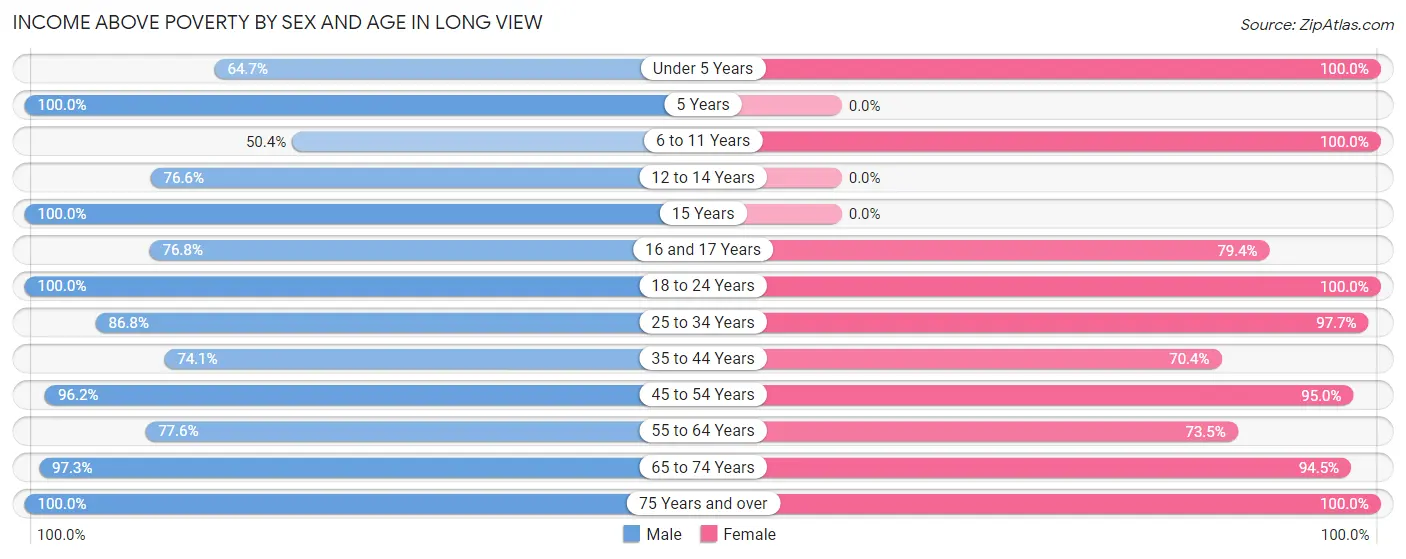
| Age Bracket | Male | Female |
| Under 5 Years | 134 (64.7%) | 96 (100.0%) |
| 5 Years | 29 (100.0%) | 0 (0.0%) |
| 6 to 11 Years | 68 (50.4%) | 84 (100.0%) |
| 12 to 14 Years | 72 (76.6%) | 0 (0.0%) |
| 15 Years | 72 (100.0%) | 0 (0.0%) |
| 16 and 17 Years | 96 (76.8%) | 50 (79.4%) |
| 18 to 24 Years | 134 (100.0%) | 221 (100.0%) |
| 25 to 34 Years | 553 (86.8%) | 389 (97.7%) |
| 35 to 44 Years | 157 (74.1%) | 193 (70.4%) |
| 45 to 54 Years | 504 (96.2%) | 263 (95.0%) |
| 55 to 64 Years | 194 (77.6%) | 260 (73.5%) |
| 65 to 74 Years | 253 (97.3%) | 361 (94.5%) |
| 75 Years and over | 115 (100.0%) | 55 (100.0%) |
| Total | 2,381 (85.2%) | 1,972 (89.1%) |
Income Below Poverty Among Married-Couple Families in Long View
The poverty statistics for married-couple families in Long View show that 7.3% or 61 of the total 832 families live below the poverty line. Families with 3 or 4 children have the highest poverty rate of 58.9%, comprising of 33 families. On the other hand, families with no children have the lowest poverty rate of 0.0%, which includes 0 families.
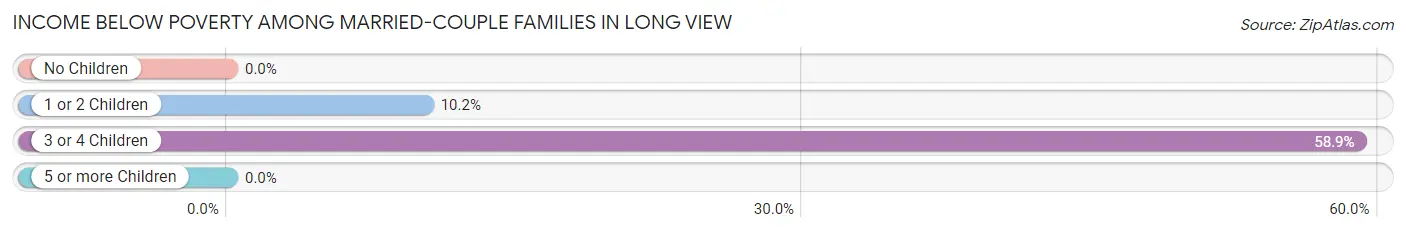
| Children | Above Poverty | Below Poverty |
| No Children | 502 (100.0%) | 0 (0.0%) |
| 1 or 2 Children | 246 (89.8%) | 28 (10.2%) |
| 3 or 4 Children | 23 (41.1%) | 33 (58.9%) |
| 5 or more Children | 0 (0.0%) | 0 (0.0%) |
| Total | 771 (92.7%) | 61 (7.3%) |
Income Below Poverty Among Single-Parent Households in Long View
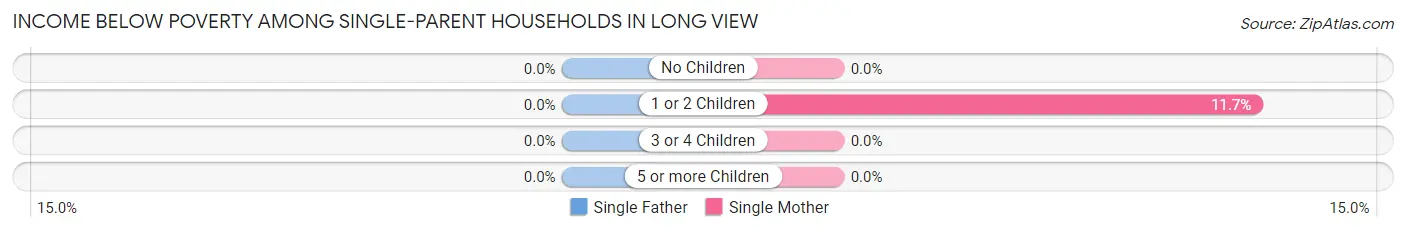
| Children | Single Father | Single Mother |
| No Children | 0 (0.0%) | 0 (0.0%) |
| 1 or 2 Children | 0 (0.0%) | 15 (11.7%) |
| 3 or 4 Children | 0 (0.0%) | 0 (0.0%) |
| 5 or more Children | 0 (0.0%) | 0 (0.0%) |
| Total | 0 (0.0%) | 15 (4.2%) |
Income Below Poverty Among Married-Couple vs Single-Parent Households in Long View
The poverty data for Long View shows that 61 of the married-couple family households (7.3%) and 15 of the single-parent households (3.1%) are living below the poverty level. Within the married-couple family households, those with 3 or 4 children have the highest poverty rate, with 33 households (58.9%) falling below the poverty line. Among the single-parent households, those with 1 or 2 children have the highest poverty rate, with 15 household (8.2%) living below poverty.
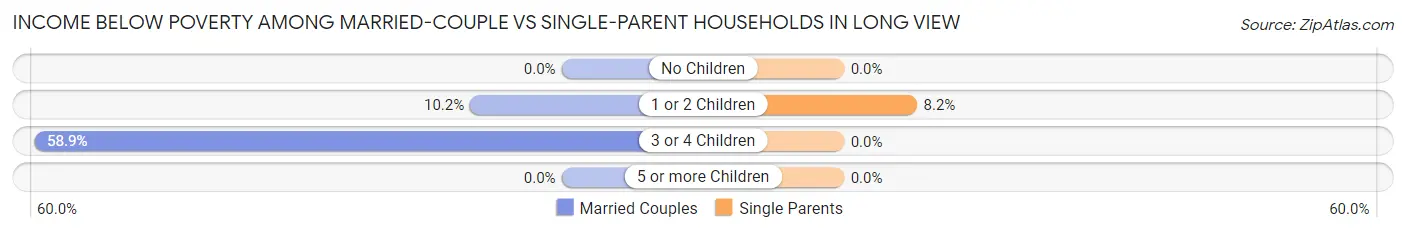
| Children | Married-Couple Families | Single-Parent Households |
| No Children | 0 (0.0%) | 0 (0.0%) |
| 1 or 2 Children | 28 (10.2%) | 15 (8.2%) |
| 3 or 4 Children | 33 (58.9%) | 0 (0.0%) |
| 5 or more Children | 0 (0.0%) | 0 (0.0%) |
| Total | 61 (7.3%) | 15 (3.1%) |
Employment Characteristics in Long View
Employment by Class of Employer in Long View
Among the 2,654 employed individuals in Long View, private company employees (2,138 | 80.6%), self-employed (not incorporated) (202 | 7.6%), and local government employees (140 | 5.3%) make up the most common classes of employment.
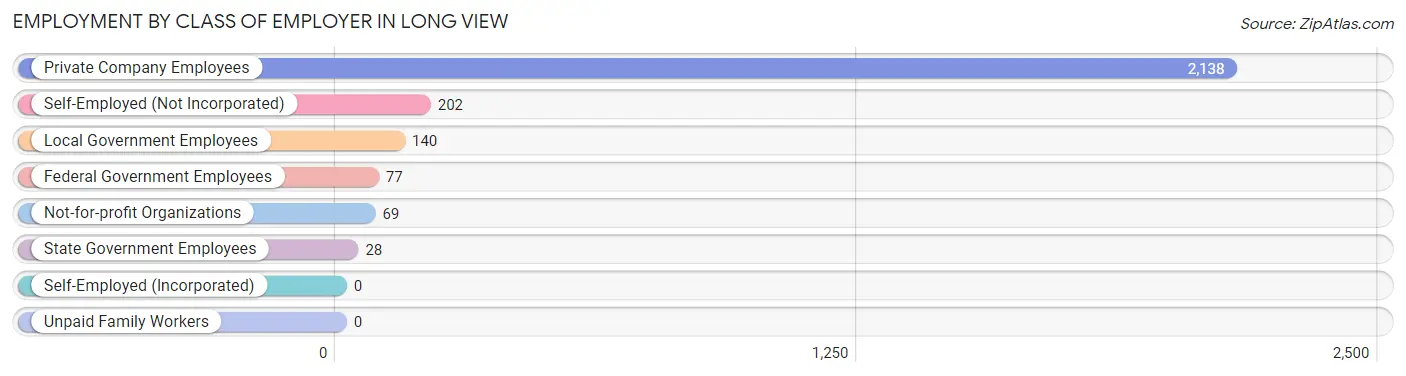
| Employer Class | # Employees | % Employees |
| Private Company Employees | 2,138 | 80.6% |
| Self-Employed (Incorporated) | 0 | 0.0% |
| Self-Employed (Not Incorporated) | 202 | 7.6% |
| Not-for-profit Organizations | 69 | 2.6% |
| Local Government Employees | 140 | 5.3% |
| State Government Employees | 28 | 1.1% |
| Federal Government Employees | 77 | 2.9% |
| Unpaid Family Workers | 0 | 0.0% |
| Total | 2,654 | 100.0% |
Employment Status by Age in Long View
According to the labor force statistics for Long View, out of the total population over 16 years of age (4,281), 66.4% or 2,843 individuals are in the labor force, with 5.3% or 151 of them unemployed. The age group with the highest labor force participation rate is 25 to 29 years, with 96.5% or 634 individuals in the labor force. Within the labor force, the 20 to 24 years age range has the highest percentage of unemployed individuals, with 14.9% or 46 of them being unemployed.
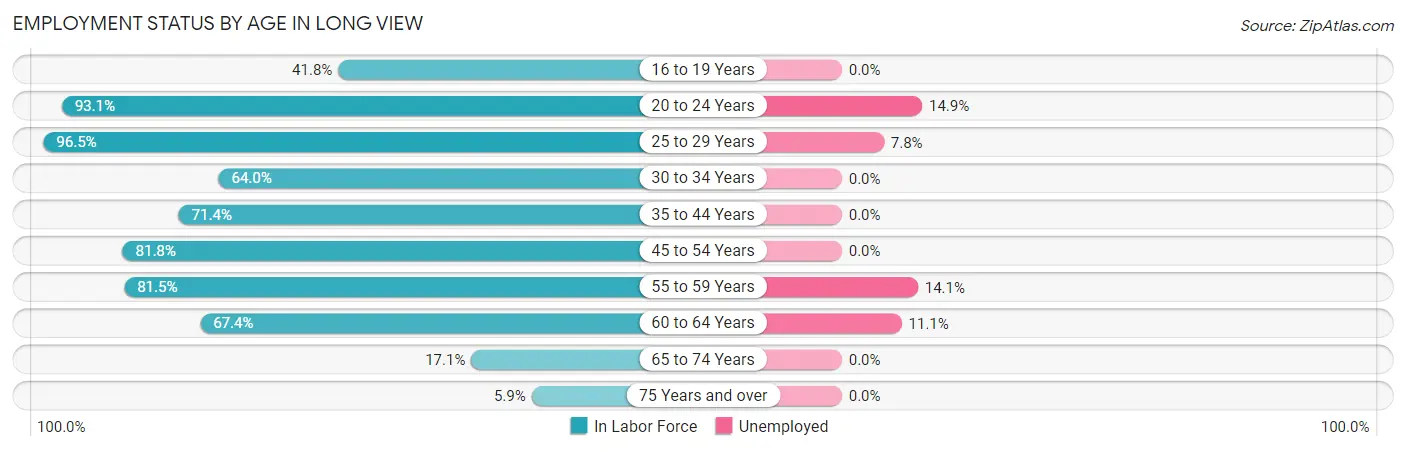
| Age Bracket | In Labor Force | Unemployed |
| 16 to 19 Years | 87 (41.8%) | 0 (0.0%) |
| 20 to 24 Years | 312 (93.1%) | 46 (14.9%) |
| 25 to 29 Years | 634 (96.5%) | 49 (7.8%) |
| 30 to 34 Years | 242 (64.0%) | 0 (0.0%) |
| 35 to 44 Years | 347 (71.4%) | 0 (0.0%) |
| 45 to 54 Years | 655 (81.8%) | 0 (0.0%) |
| 55 to 59 Years | 220 (81.5%) | 31 (14.1%) |
| 60 to 64 Years | 225 (67.4%) | 25 (11.1%) |
| 65 to 74 Years | 110 (17.1%) | 0 (0.0%) |
| 75 Years and over | 10 (5.9%) | 0 (0.0%) |
| Total | 2,843 (66.4%) | 151 (5.3%) |
Employment Status by Educational Attainment in Long View
According to labor force statistics for Long View, 79.4% of individuals (2,323) out of the total population between 25 and 64 years of age (2,926) are in the labor force, with 4.5% or 105 of them being unemployed. The group with the highest labor force participation rate are those with the educational attainment of bachelor's degree or higher, with 100.0% or 205 individuals in the labor force. Within the labor force, individuals with less than high school education have the highest percentage of unemployment, with 14.9% or 31 of them being unemployed.
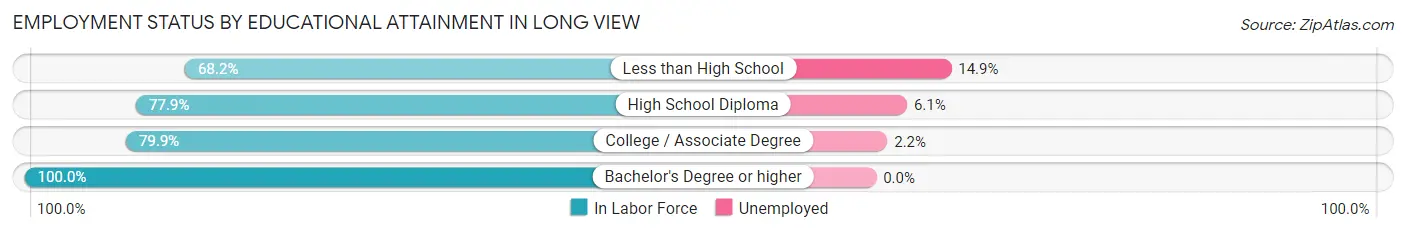
| Educational Attainment | In Labor Force | Unemployed |
| Less than High School | 208 (68.2%) | 45 (14.9%) |
| High School Diploma | 809 (77.9%) | 63 (6.1%) |
| College / Associate Degree | 1,101 (79.9%) | 30 (2.2%) |
| Bachelor's Degree or higher | 205 (100.0%) | 0 (0.0%) |
| Total | 2,323 (79.4%) | 132 (4.5%) |
Employment Occupations by Sex in Long View
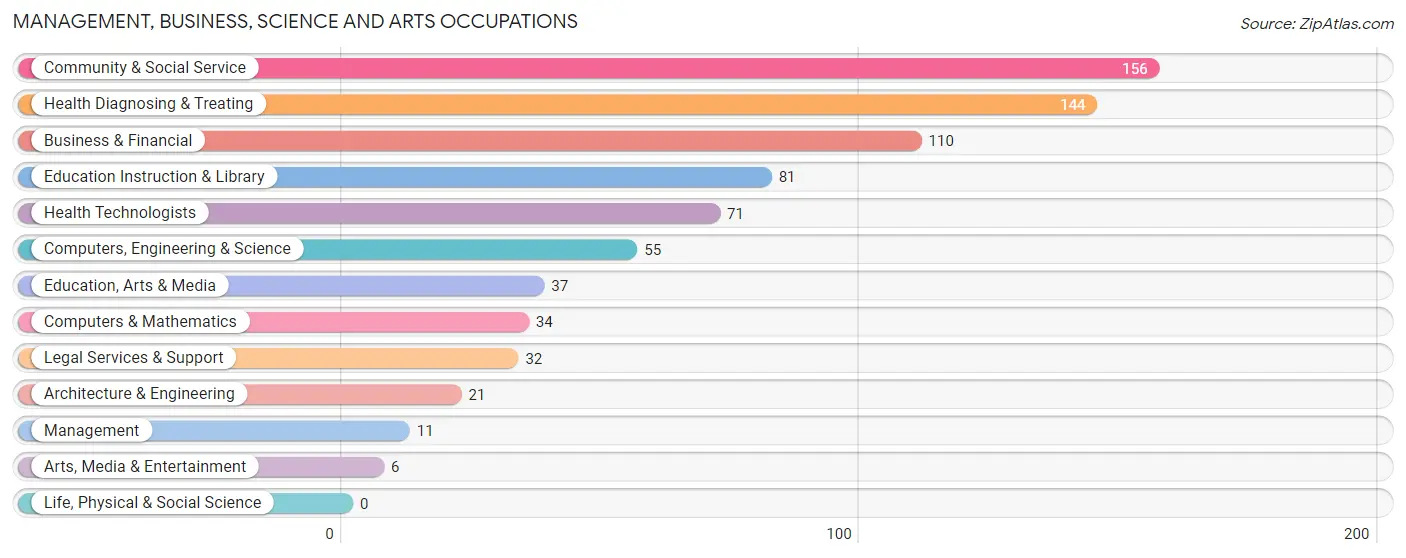
Management, Business, Science and Arts Occupations
The most common Management, Business, Science and Arts occupations in Long View are Community & Social Service (156 | 5.9%), Health Diagnosing & Treating (144 | 5.4%), Business & Financial (110 | 4.1%), Education Instruction & Library (81 | 3.0%), and Health Technologists (71 | 2.7%).
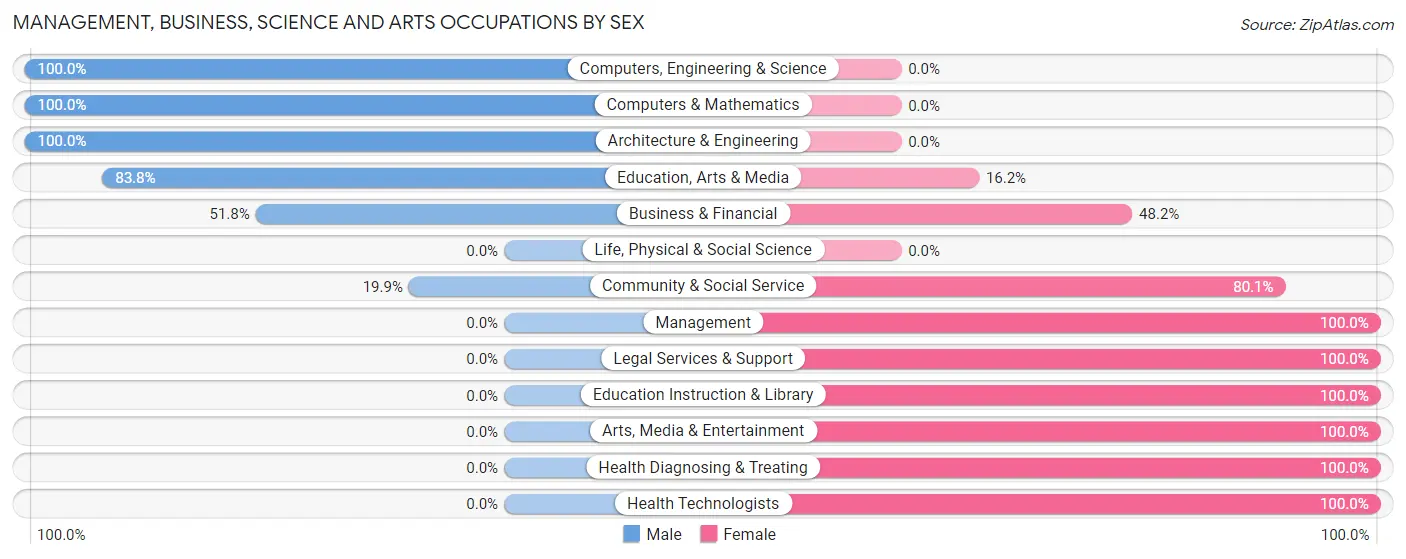
Management, Business, Science and Arts Occupations by Sex
Within the Management, Business, Science and Arts occupations in Long View, the most male-oriented occupations are Computers, Engineering & Science (100.0%), Computers & Mathematics (100.0%), and Architecture & Engineering (100.0%), while the most female-oriented occupations are Management (100.0%), Legal Services & Support (100.0%), and Education Instruction & Library (100.0%).
| Occupation | Male | Female |
| Management | 0 (0.0%) | 11 (100.0%) |
| Business & Financial | 57 (51.8%) | 53 (48.2%) |
| Computers, Engineering & Science | 55 (100.0%) | 0 (0.0%) |
| Computers & Mathematics | 34 (100.0%) | 0 (0.0%) |
| Architecture & Engineering | 21 (100.0%) | 0 (0.0%) |
| Life, Physical & Social Science | 0 (0.0%) | 0 (0.0%) |
| Community & Social Service | 31 (19.9%) | 125 (80.1%) |
| Education, Arts & Media | 31 (83.8%) | 6 (16.2%) |
| Legal Services & Support | 0 (0.0%) | 32 (100.0%) |
| Education Instruction & Library | 0 (0.0%) | 81 (100.0%) |
| Arts, Media & Entertainment | 0 (0.0%) | 6 (100.0%) |
| Health Diagnosing & Treating | 0 (0.0%) | 144 (100.0%) |
| Health Technologists | 0 (0.0%) | 71 (100.0%) |
| Total (Category) | 143 (30.0%) | 333 (70.0%) |
| Total (Overall) | 1,375 (51.6%) | 1,288 (48.4%) |
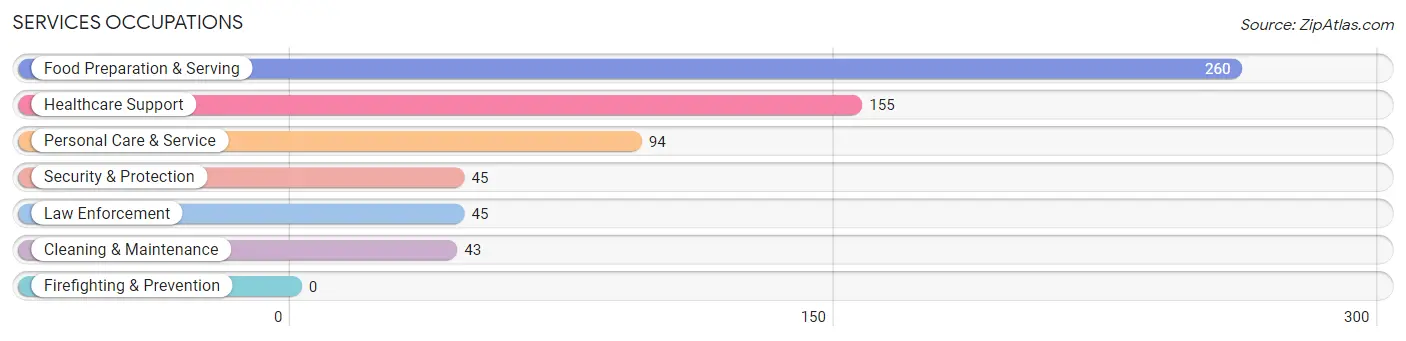
Services Occupations
The most common Services occupations in Long View are Food Preparation & Serving (260 | 9.8%), Healthcare Support (155 | 5.8%), Personal Care & Service (94 | 3.5%), Security & Protection (45 | 1.7%), and Law Enforcement (45 | 1.7%).
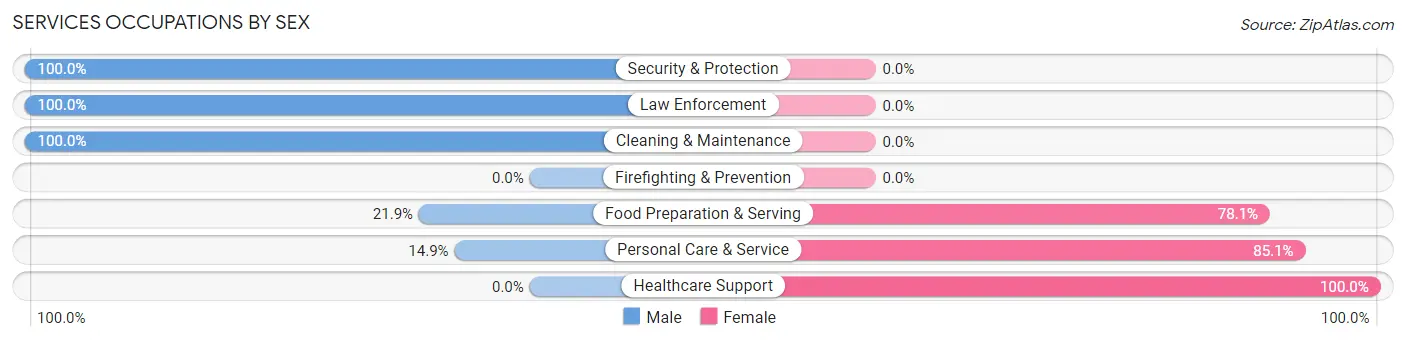
Services Occupations by Sex
Within the Services occupations in Long View, the most male-oriented occupations are Security & Protection (100.0%), Law Enforcement (100.0%), and Cleaning & Maintenance (100.0%), while the most female-oriented occupations are Healthcare Support (100.0%), Personal Care & Service (85.1%), and Food Preparation & Serving (78.1%).
| Occupation | Male | Female |
| Healthcare Support | 0 (0.0%) | 155 (100.0%) |
| Security & Protection | 45 (100.0%) | 0 (0.0%) |
| Firefighting & Prevention | 0 (0.0%) | 0 (0.0%) |
| Law Enforcement | 45 (100.0%) | 0 (0.0%) |
| Food Preparation & Serving | 57 (21.9%) | 203 (78.1%) |
| Cleaning & Maintenance | 43 (100.0%) | 0 (0.0%) |
| Personal Care & Service | 14 (14.9%) | 80 (85.1%) |
| Total (Category) | 159 (26.6%) | 438 (73.4%) |
| Total (Overall) | 1,375 (51.6%) | 1,288 (48.4%) |
Sales and Office Occupations
The most common Sales and Office occupations in Long View are Sales & Related (275 | 10.3%), and Office & Administration (178 | 6.7%).

Sales and Office Occupations by Sex
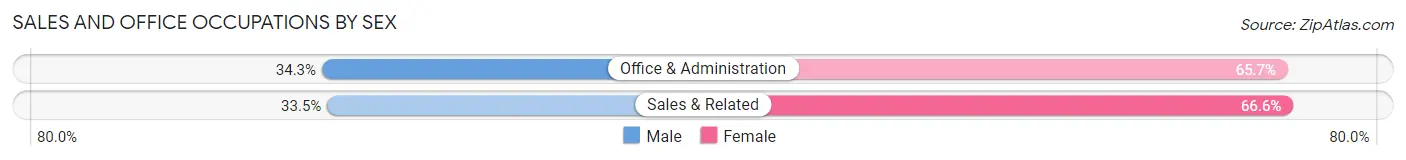
| Occupation | Male | Female |
| Sales & Related | 92 (33.5%) | 183 (66.5%) |
| Office & Administration | 61 (34.3%) | 117 (65.7%) |
| Total (Category) | 153 (33.8%) | 300 (66.2%) |
| Total (Overall) | 1,375 (51.6%) | 1,288 (48.4%) |
Natural Resources, Construction and Maintenance Occupations
The most common Natural Resources, Construction and Maintenance occupations in Long View are Installation, Maintenance & Repair (149 | 5.6%), and Construction & Extraction (84 | 3.2%).
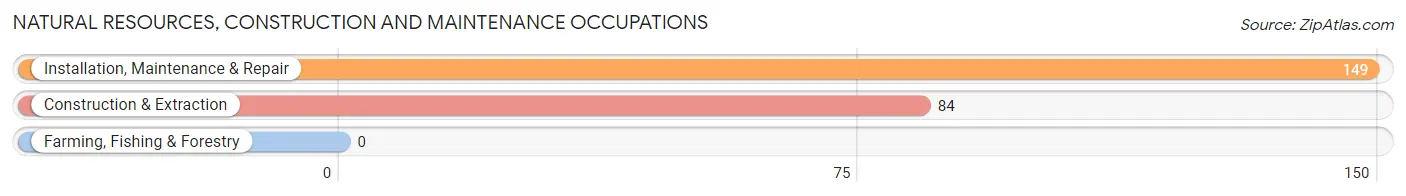
Natural Resources, Construction and Maintenance Occupations by Sex

| Occupation | Male | Female |
| Farming, Fishing & Forestry | 0 (0.0%) | 0 (0.0%) |
| Construction & Extraction | 84 (100.0%) | 0 (0.0%) |
| Installation, Maintenance & Repair | 149 (100.0%) | 0 (0.0%) |
| Total (Category) | 233 (100.0%) | 0 (0.0%) |
| Total (Overall) | 1,375 (51.6%) | 1,288 (48.4%) |
Production, Transportation and Moving Occupations
The most common Production, Transportation and Moving occupations in Long View are Production (531 | 19.9%), Material Moving (212 | 8.0%), and Transportation (161 | 6.0%).
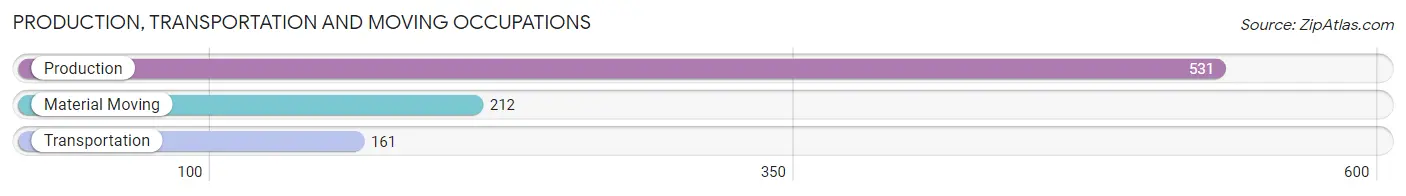
Production, Transportation and Moving Occupations by Sex
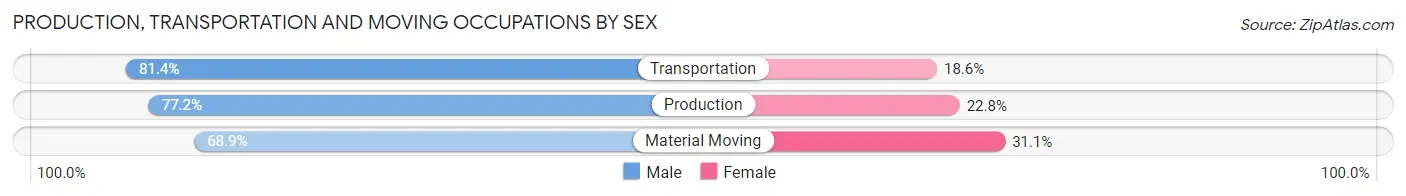
| Occupation | Male | Female |
| Production | 410 (77.2%) | 121 (22.8%) |
| Transportation | 131 (81.4%) | 30 (18.6%) |
| Material Moving | 146 (68.9%) | 66 (31.1%) |
| Total (Category) | 687 (76.0%) | 217 (24.0%) |
| Total (Overall) | 1,375 (51.6%) | 1,288 (48.4%) |
Employment Industries by Sex in Long View
Employment Industries in Long View
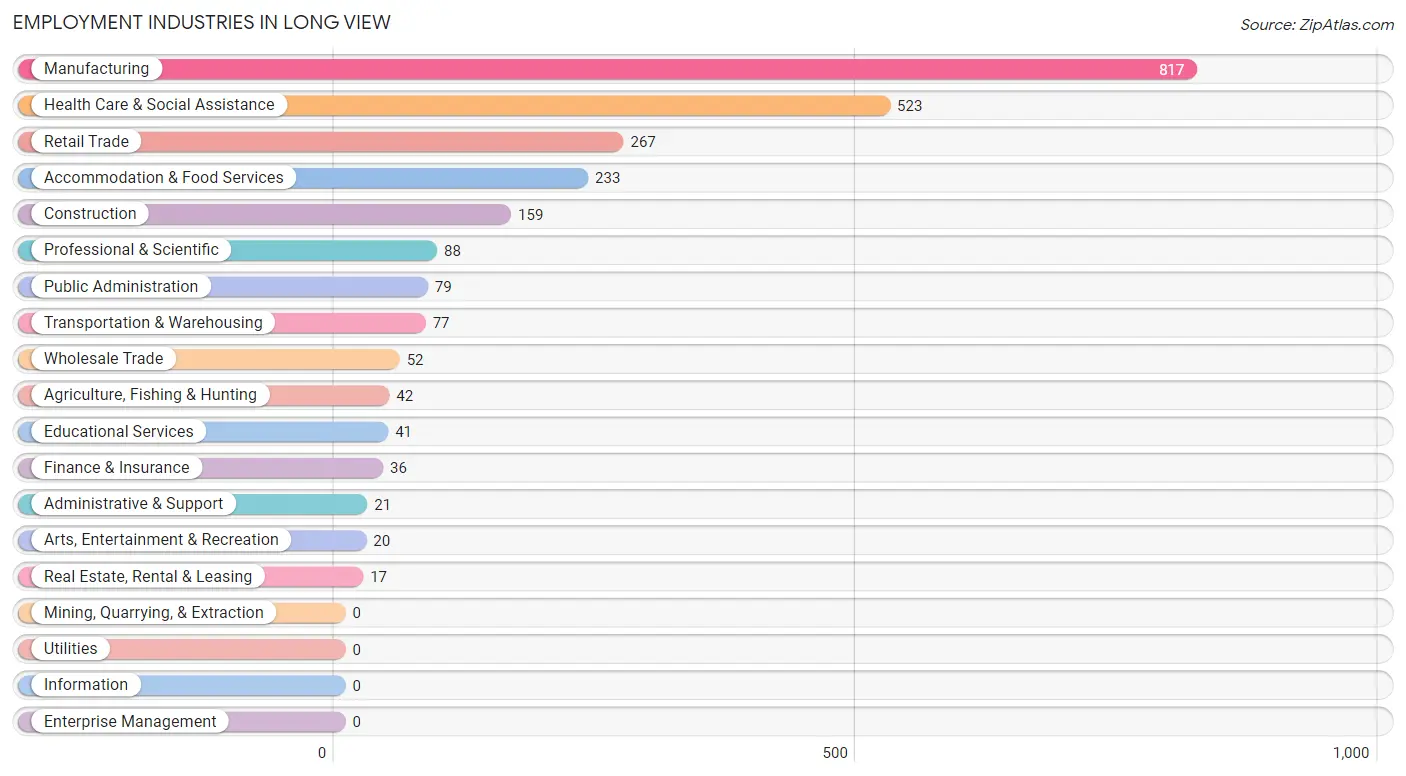
The major employment industries in Long View include Manufacturing (817 | 30.7%), Health Care & Social Assistance (523 | 19.6%), Retail Trade (267 | 10.0%), Accommodation & Food Services (233 | 8.7%), and Construction (159 | 6.0%).
Employment Industries by Sex in Long View
The Long View industries that see more men than women are Agriculture, Fishing & Hunting (100.0%), Construction (100.0%), and Finance & Insurance (100.0%), whereas the industries that tend to have a higher number of women are Educational Services (100.0%), Health Care & Social Assistance (93.5%), and Professional & Scientific (69.3%).
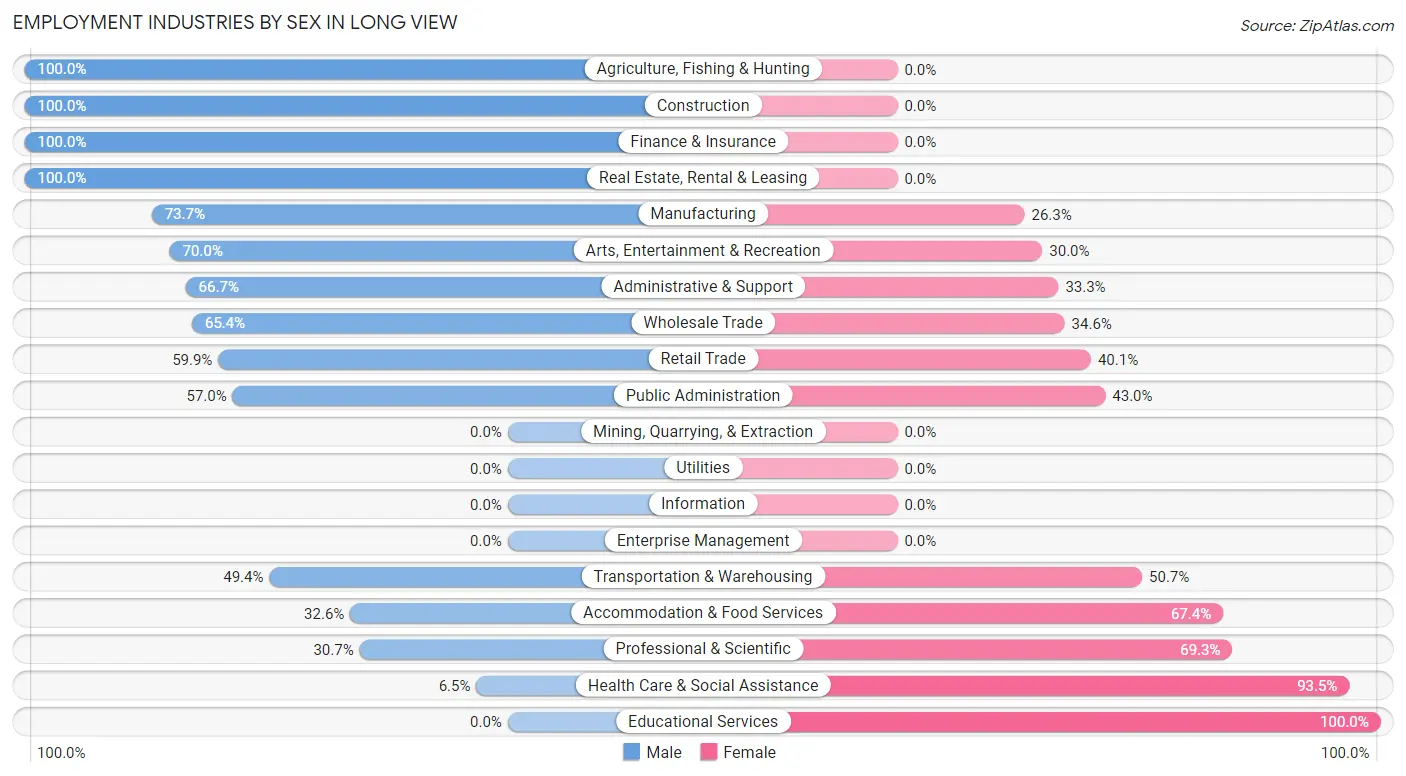
| Industry | Male | Female |
| Agriculture, Fishing & Hunting | 42 (100.0%) | 0 (0.0%) |
| Mining, Quarrying, & Extraction | 0 (0.0%) | 0 (0.0%) |
| Construction | 159 (100.0%) | 0 (0.0%) |
| Manufacturing | 602 (73.7%) | 215 (26.3%) |
| Wholesale Trade | 34 (65.4%) | 18 (34.6%) |
| Retail Trade | 160 (59.9%) | 107 (40.1%) |
| Transportation & Warehousing | 38 (49.3%) | 39 (50.6%) |
| Utilities | 0 (0.0%) | 0 (0.0%) |
| Information | 0 (0.0%) | 0 (0.0%) |
| Finance & Insurance | 36 (100.0%) | 0 (0.0%) |
| Real Estate, Rental & Leasing | 17 (100.0%) | 0 (0.0%) |
| Professional & Scientific | 27 (30.7%) | 61 (69.3%) |
| Enterprise Management | 0 (0.0%) | 0 (0.0%) |
| Administrative & Support | 14 (66.7%) | 7 (33.3%) |
| Educational Services | 0 (0.0%) | 41 (100.0%) |
| Health Care & Social Assistance | 34 (6.5%) | 489 (93.5%) |
| Arts, Entertainment & Recreation | 14 (70.0%) | 6 (30.0%) |
| Accommodation & Food Services | 76 (32.6%) | 157 (67.4%) |
| Public Administration | 45 (57.0%) | 34 (43.0%) |
| Total | 1,375 (51.6%) | 1,288 (48.4%) |
Education in Long View
School Enrollment in Long View
The most common levels of schooling among the 799 students in Long View are high school (251 | 31.4%), middle school (136 | 17.0%), and college / undergraduate (118 | 14.8%).
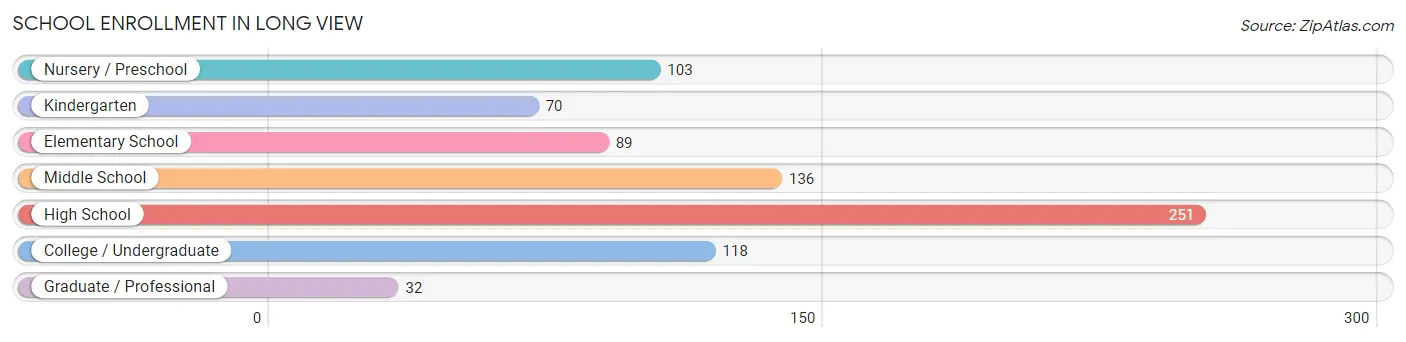
| School Level | # Students | % Students |
| Nursery / Preschool | 103 | 12.9% |
| Kindergarten | 70 | 8.8% |
| Elementary School | 89 | 11.1% |
| Middle School | 136 | 17.0% |
| High School | 251 | 31.4% |
| College / Undergraduate | 118 | 14.8% |
| Graduate / Professional | 32 | 4.0% |
| Total | 799 | 100.0% |
School Enrollment by Age by Funding Source in Long View
Out of a total of 799 students who are enrolled in schools in Long View, 209 (26.2%) attend a private institution, while the remaining 590 (73.8%) are enrolled in public schools. The age group of 3 to 4 year olds has the highest likelihood of being enrolled in private schools, with 43 (70.5% in the age bracket) enrolled. Conversely, the age group of 5 to 9 year old has the lowest likelihood of being enrolled in a private school, with 190 (100.0% in the age bracket) attending a public institution.
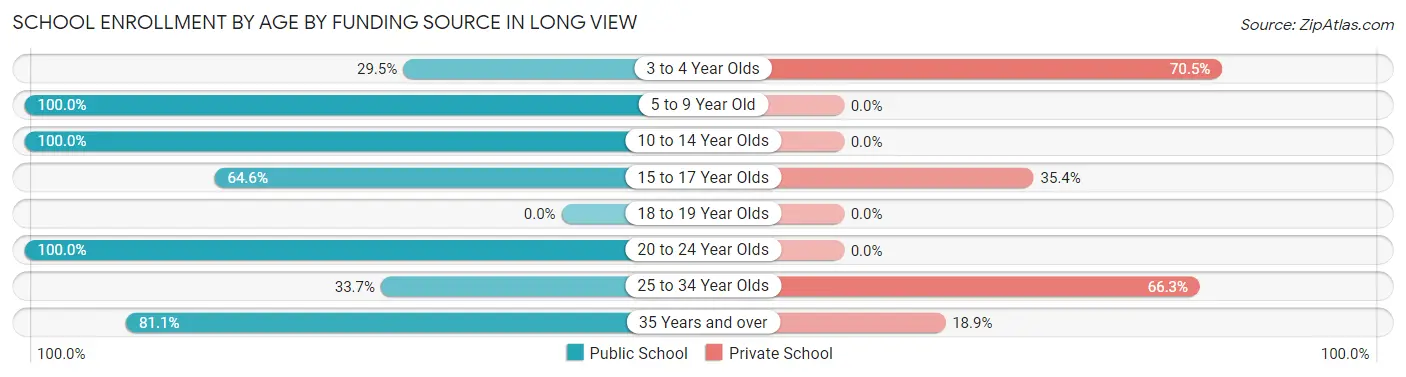
| Age Bracket | Public School | Private School |
| 3 to 4 Year Olds | 18 (29.5%) | 43 (70.5%) |
| 5 to 9 Year Old | 190 (100.0%) | 0 (0.0%) |
| 10 to 14 Year Olds | 138 (100.0%) | 0 (0.0%) |
| 15 to 17 Year Olds | 168 (64.6%) | 92 (35.4%) |
| 18 to 19 Year Olds | 0 (0.0%) | 0 (0.0%) |
| 20 to 24 Year Olds | 12 (100.0%) | 0 (0.0%) |
| 25 to 34 Year Olds | 34 (33.7%) | 67 (66.3%) |
| 35 Years and over | 30 (81.1%) | 7 (18.9%) |
| Total | 590 (73.8%) | 209 (26.2%) |
Educational Attainment by Field of Study in Long View
Science & technology (64 | 22.6%), arts & humanities (42 | 14.8%), business (33 | 11.7%), psychology (29 | 10.2%), and engineering (24 | 8.5%) are the most common fields of study among 283 individuals in Long View who have obtained a bachelor's degree or higher.
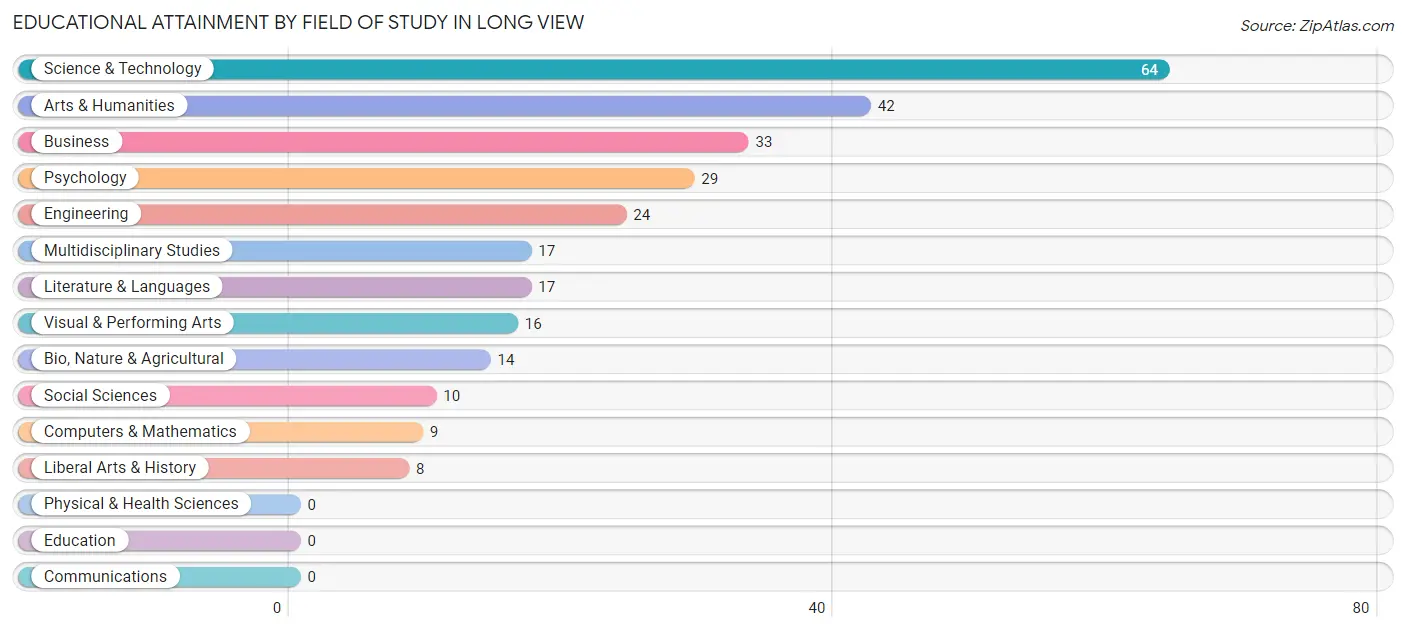
| Field of Study | # Graduates | % Graduates |
| Computers & Mathematics | 9 | 3.2% |
| Bio, Nature & Agricultural | 14 | 5.0% |
| Physical & Health Sciences | 0 | 0.0% |
| Psychology | 29 | 10.2% |
| Social Sciences | 10 | 3.5% |
| Engineering | 24 | 8.5% |
| Multidisciplinary Studies | 17 | 6.0% |
| Science & Technology | 64 | 22.6% |
| Business | 33 | 11.7% |
| Education | 0 | 0.0% |
| Literature & Languages | 17 | 6.0% |
| Liberal Arts & History | 8 | 2.8% |
| Visual & Performing Arts | 16 | 5.7% |
| Communications | 0 | 0.0% |
| Arts & Humanities | 42 | 14.8% |
| Total | 283 | 100.0% |
Transportation & Commute in Long View
Vehicle Availability by Sex in Long View
The most prevalent vehicle ownership categories in Long View are males with 2 vehicles (484, accounting for 34.8%) and females with 2 vehicles (437, making up 38.3%).
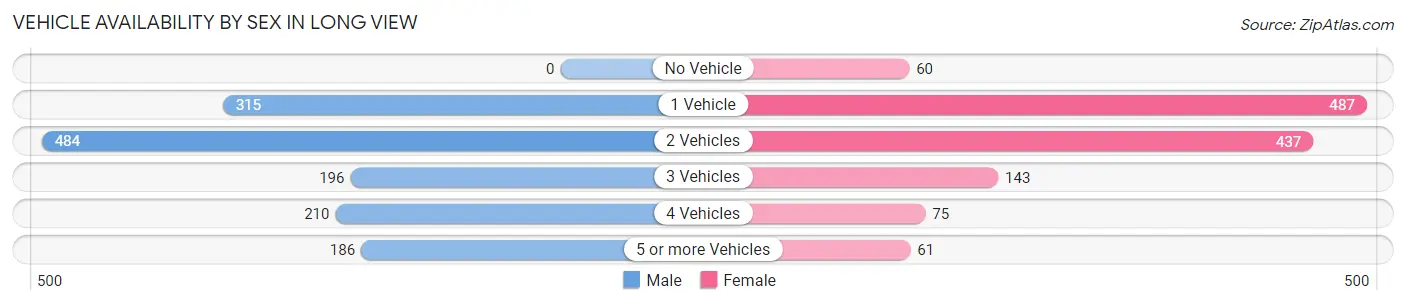
| Vehicles Available | Male | Female |
| No Vehicle | 0 (0.0%) | 60 (4.8%) |
| 1 Vehicle | 315 (22.7%) | 487 (38.6%) |
| 2 Vehicles | 484 (34.8%) | 437 (34.6%) |
| 3 Vehicles | 196 (14.1%) | 143 (11.3%) |
| 4 Vehicles | 210 (15.1%) | 75 (5.9%) |
| 5 or more Vehicles | 186 (13.4%) | 61 (4.8%) |
| Total | 1,391 (100.0%) | 1,263 (100.0%) |
Commute Time in Long View
The most frequently occuring commute durations in Long View are 10 to 14 minutes (544 commuters, 20.6%), 30 to 34 minutes (499 commuters, 18.9%), and 15 to 19 minutes (466 commuters, 17.7%).
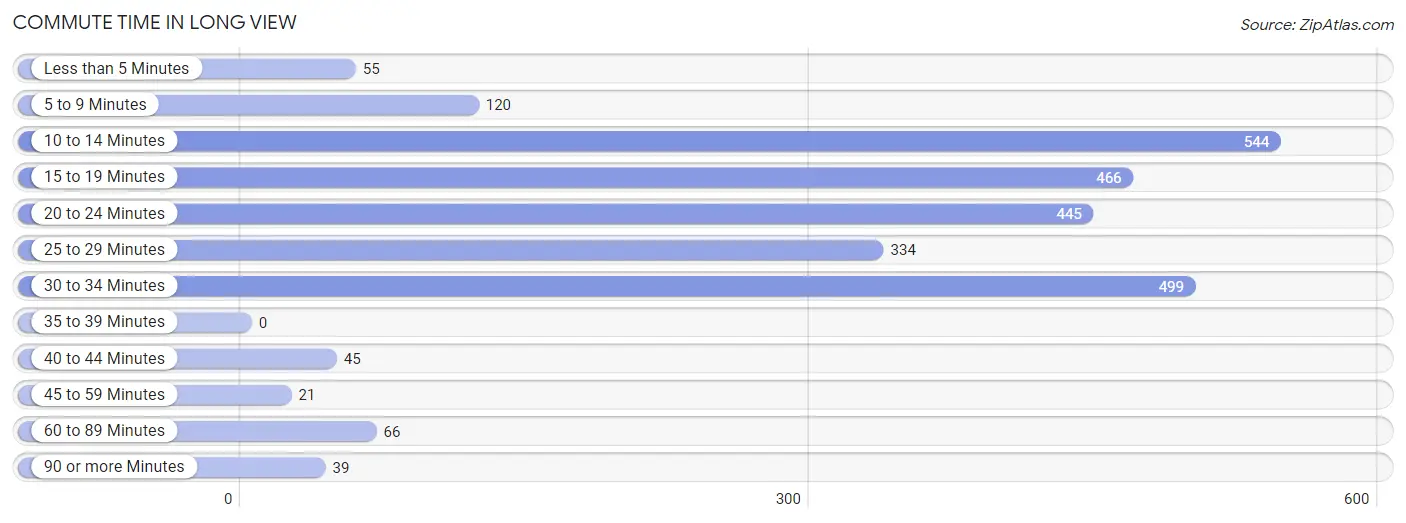
| Commute Time | # Commuters | % Commuters |
| Less than 5 Minutes | 55 | 2.1% |
| 5 to 9 Minutes | 120 | 4.6% |
| 10 to 14 Minutes | 544 | 20.6% |
| 15 to 19 Minutes | 466 | 17.7% |
| 20 to 24 Minutes | 445 | 16.9% |
| 25 to 29 Minutes | 334 | 12.7% |
| 30 to 34 Minutes | 499 | 18.9% |
| 35 to 39 Minutes | 0 | 0.0% |
| 40 to 44 Minutes | 45 | 1.7% |
| 45 to 59 Minutes | 21 | 0.8% |
| 60 to 89 Minutes | 66 | 2.5% |
| 90 or more Minutes | 39 | 1.5% |
Commute Time by Sex in Long View
The most common commute times in Long View are 30 to 34 minutes (286 commuters, 20.6%) for males and 10 to 14 minutes (267 commuters, 21.5%) for females.
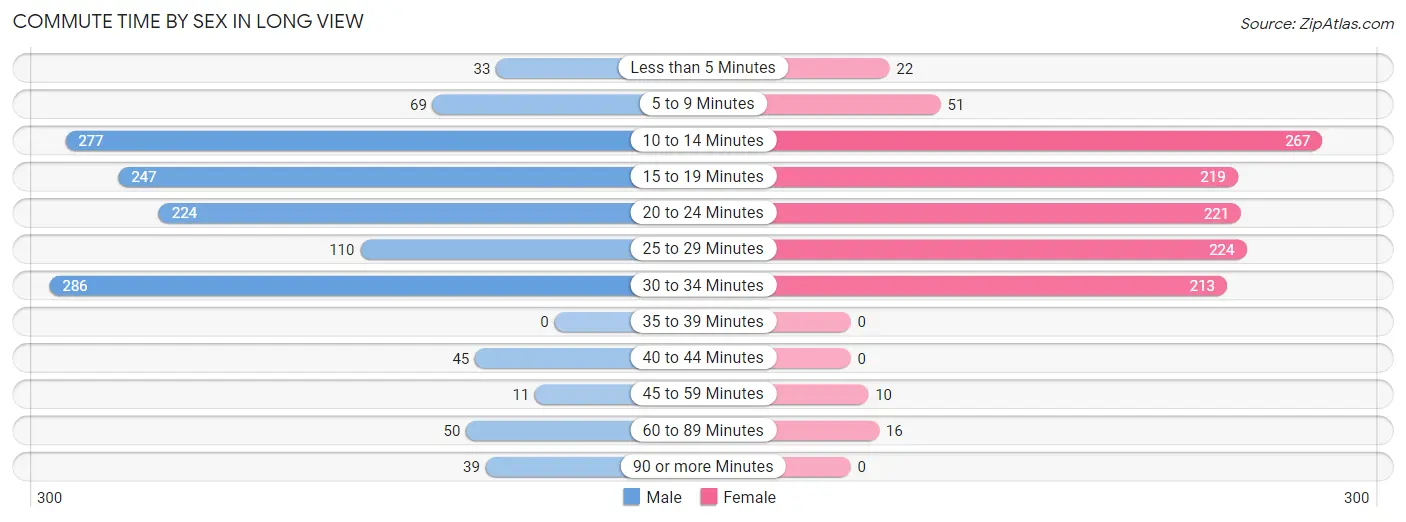
| Commute Time | Male | Female |
| Less than 5 Minutes | 33 (2.4%) | 22 (1.8%) |
| 5 to 9 Minutes | 69 (5.0%) | 51 (4.1%) |
| 10 to 14 Minutes | 277 (19.9%) | 267 (21.5%) |
| 15 to 19 Minutes | 247 (17.8%) | 219 (17.6%) |
| 20 to 24 Minutes | 224 (16.1%) | 221 (17.8%) |
| 25 to 29 Minutes | 110 (7.9%) | 224 (18.0%) |
| 30 to 34 Minutes | 286 (20.6%) | 213 (17.1%) |
| 35 to 39 Minutes | 0 (0.0%) | 0 (0.0%) |
| 40 to 44 Minutes | 45 (3.2%) | 0 (0.0%) |
| 45 to 59 Minutes | 11 (0.8%) | 10 (0.8%) |
| 60 to 89 Minutes | 50 (3.6%) | 16 (1.3%) |
| 90 or more Minutes | 39 (2.8%) | 0 (0.0%) |
Time of Departure to Work by Sex in Long View
The most frequent times of departure to work in Long View are 4:00 PM to 11:59 PM (229, 16.5%) for males and 7:30 AM to 7:59 AM (260, 20.9%) for females.
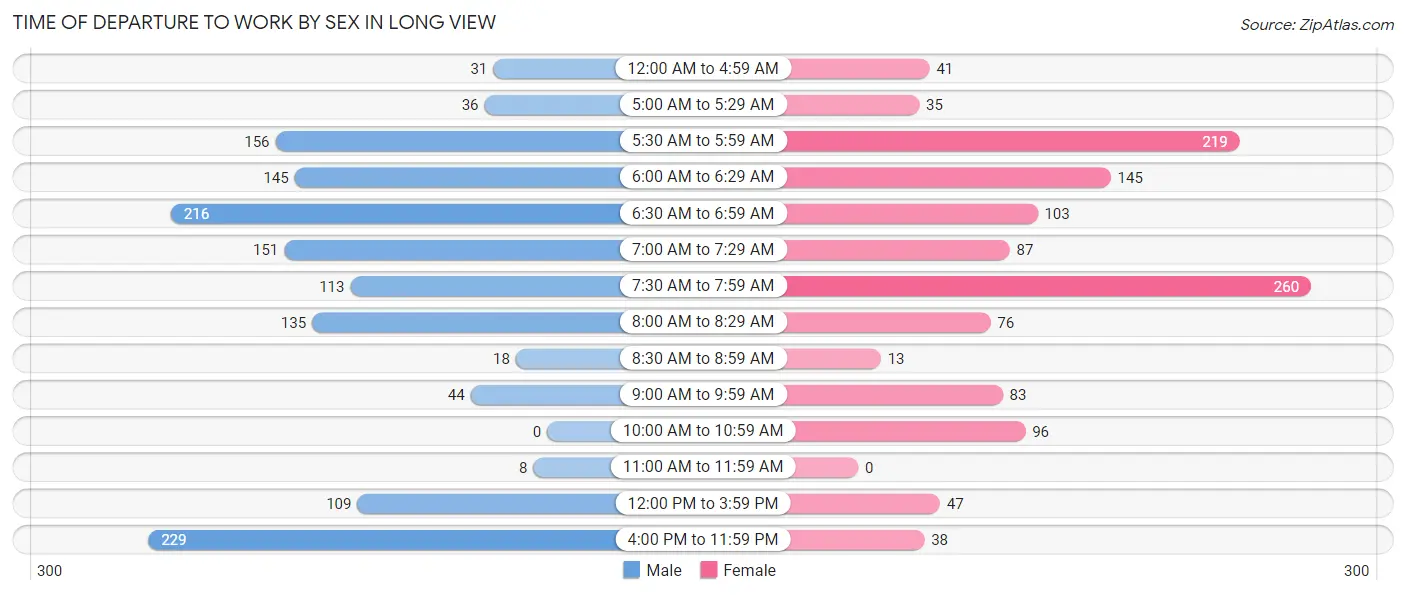
| Time of Departure | Male | Female |
| 12:00 AM to 4:59 AM | 31 (2.2%) | 41 (3.3%) |
| 5:00 AM to 5:29 AM | 36 (2.6%) | 35 (2.8%) |
| 5:30 AM to 5:59 AM | 156 (11.2%) | 219 (17.6%) |
| 6:00 AM to 6:29 AM | 145 (10.4%) | 145 (11.7%) |
| 6:30 AM to 6:59 AM | 216 (15.5%) | 103 (8.3%) |
| 7:00 AM to 7:29 AM | 151 (10.9%) | 87 (7.0%) |
| 7:30 AM to 7:59 AM | 113 (8.1%) | 260 (20.9%) |
| 8:00 AM to 8:29 AM | 135 (9.7%) | 76 (6.1%) |
| 8:30 AM to 8:59 AM | 18 (1.3%) | 13 (1.1%) |
| 9:00 AM to 9:59 AM | 44 (3.2%) | 83 (6.7%) |
| 10:00 AM to 10:59 AM | 0 (0.0%) | 96 (7.7%) |
| 11:00 AM to 11:59 AM | 8 (0.6%) | 0 (0.0%) |
| 12:00 PM to 3:59 PM | 109 (7.8%) | 47 (3.8%) |
| 4:00 PM to 11:59 PM | 229 (16.5%) | 38 (3.1%) |
| Total | 1,391 (100.0%) | 1,243 (100.0%) |
Housing Occupancy in Long View
Occupancy by Ownership in Long View
Of the total 2,102 dwellings in Long View, owner-occupied units account for 1,112 (52.9%), while renter-occupied units make up 990 (47.1%).
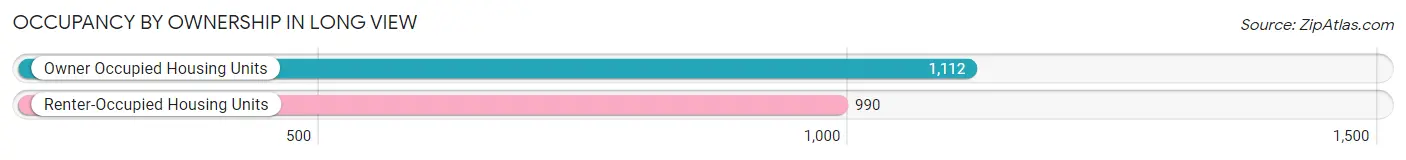
| Occupancy | # Housing Units | % Housing Units |
| Owner Occupied Housing Units | 1,112 | 52.9% |
| Renter-Occupied Housing Units | 990 | 47.1% |
| Total Occupied Housing Units | 2,102 | 100.0% |
Occupancy by Household Size in Long View
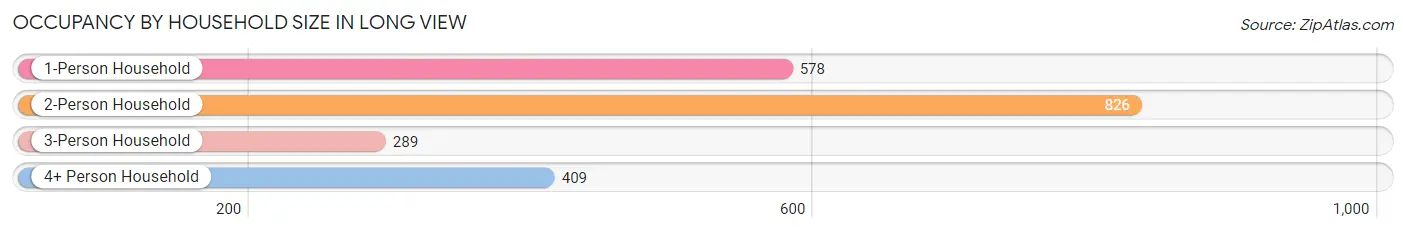
| Household Size | # Housing Units | % Housing Units |
| 1-Person Household | 578 | 27.5% |
| 2-Person Household | 826 | 39.3% |
| 3-Person Household | 289 | 13.8% |
| 4+ Person Household | 409 | 19.5% |
| Total Housing Units | 2,102 | 100.0% |
Occupancy by Ownership by Household Size in Long View
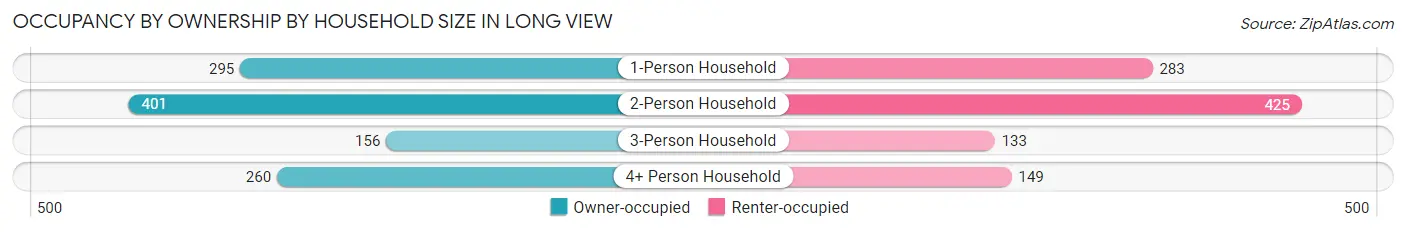
| Household Size | Owner-occupied | Renter-occupied |
| 1-Person Household | 295 (51.0%) | 283 (49.0%) |
| 2-Person Household | 401 (48.5%) | 425 (51.4%) |
| 3-Person Household | 156 (54.0%) | 133 (46.0%) |
| 4+ Person Household | 260 (63.6%) | 149 (36.4%) |
| Total Housing Units | 1,112 (52.9%) | 990 (47.1%) |
Occupancy by Educational Attainment in Long View
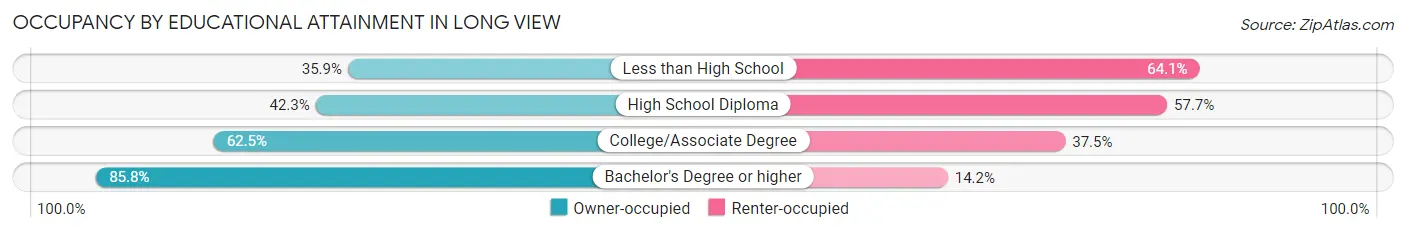
| Household Size | Owner-occupied | Renter-occupied |
| Less than High School | 88 (35.9%) | 157 (64.1%) |
| High School Diploma | 369 (42.3%) | 503 (57.7%) |
| College/Associate Degree | 510 (62.5%) | 306 (37.5%) |
| Bachelor's Degree or higher | 145 (85.8%) | 24 (14.2%) |
Occupancy by Age of Householder in Long View
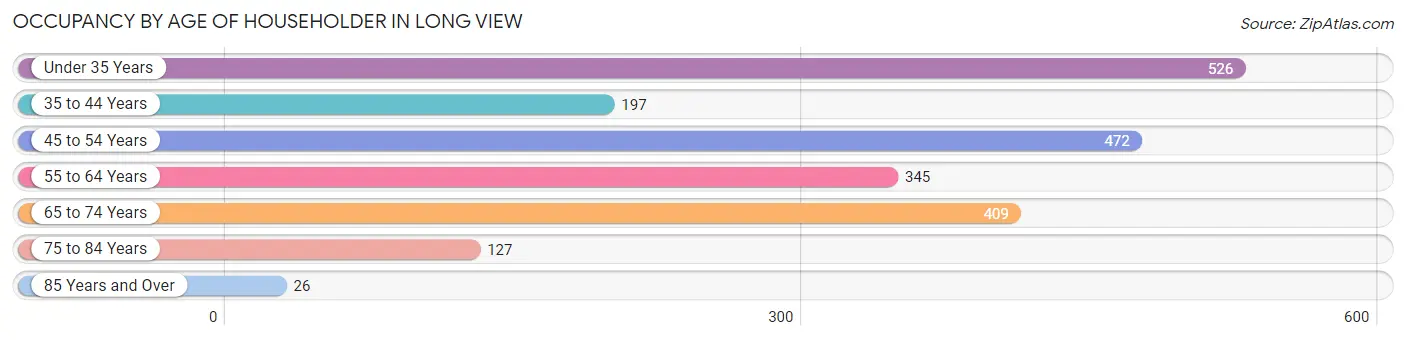
| Age Bracket | # Households | % Households |
| Under 35 Years | 526 | 25.0% |
| 35 to 44 Years | 197 | 9.4% |
| 45 to 54 Years | 472 | 22.5% |
| 55 to 64 Years | 345 | 16.4% |
| 65 to 74 Years | 409 | 19.5% |
| 75 to 84 Years | 127 | 6.0% |
| 85 Years and Over | 26 | 1.2% |
| Total | 2,102 | 100.0% |
Housing Finances in Long View
Median Income by Occupancy in Long View
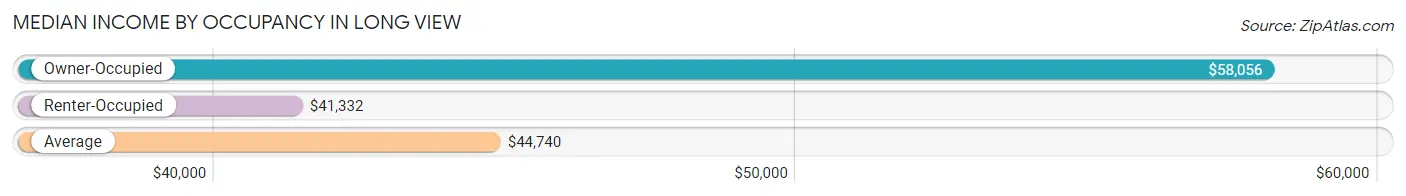
| Occupancy Type | # Households | Median Income |
| Owner-Occupied | 1,112 (52.9%) | $58,056 |
| Renter-Occupied | 990 (47.1%) | $41,332 |
| Average | 2,102 (100.0%) | $44,740 |
Occupancy by Householder Income Bracket in Long View
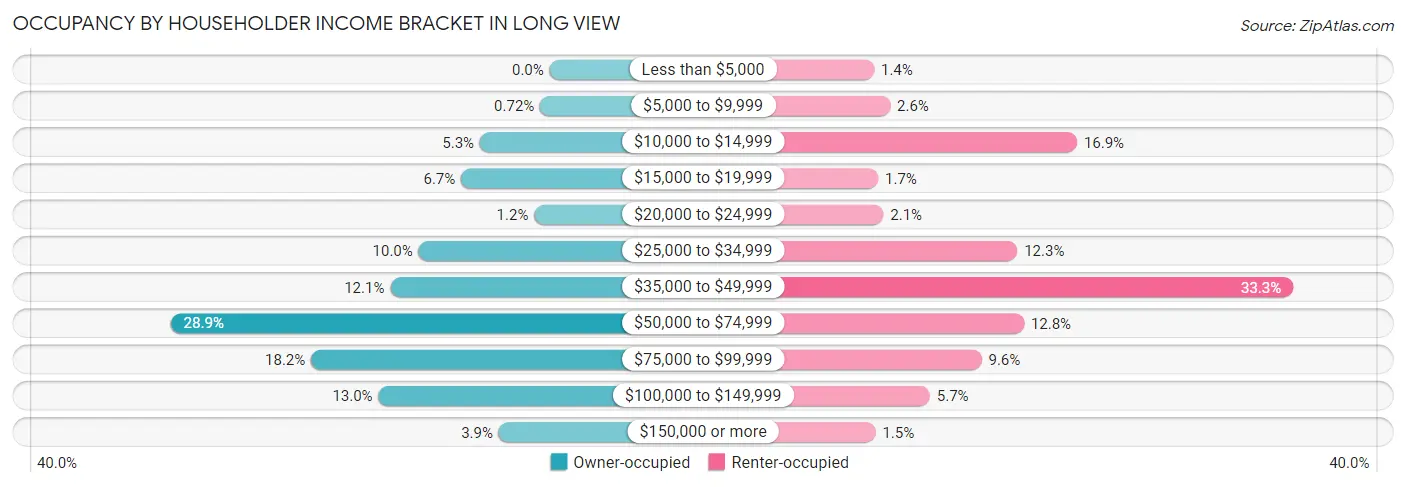
| Income Bracket | Owner-occupied | Renter-occupied |
| Less than $5,000 | 0 (0.0%) | 14 (1.4%) |
| $5,000 to $9,999 | 8 (0.7%) | 26 (2.6%) |
| $10,000 to $14,999 | 59 (5.3%) | 167 (16.9%) |
| $15,000 to $19,999 | 75 (6.7%) | 17 (1.7%) |
| $20,000 to $24,999 | 13 (1.2%) | 21 (2.1%) |
| $25,000 to $34,999 | 111 (10.0%) | 122 (12.3%) |
| $35,000 to $49,999 | 135 (12.1%) | 330 (33.3%) |
| $50,000 to $74,999 | 321 (28.9%) | 127 (12.8%) |
| $75,000 to $99,999 | 202 (18.2%) | 95 (9.6%) |
| $100,000 to $149,999 | 145 (13.0%) | 56 (5.7%) |
| $150,000 or more | 43 (3.9%) | 15 (1.5%) |
| Total | 1,112 (100.0%) | 990 (100.0%) |
Monthly Housing Cost Tiers in Long View
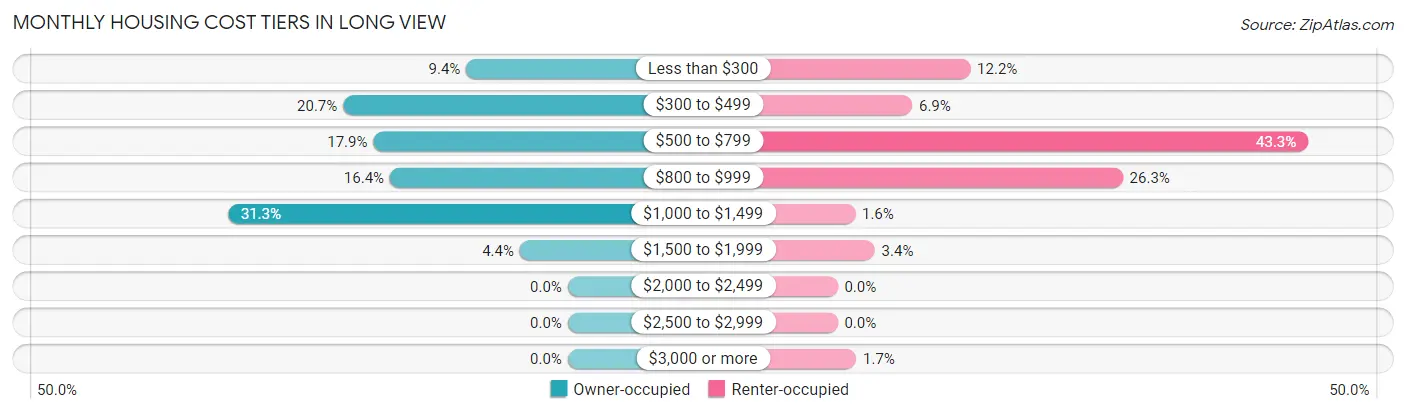
| Monthly Cost | Owner-occupied | Renter-occupied |
| Less than $300 | 104 (9.3%) | 121 (12.2%) |
| $300 to $499 | 230 (20.7%) | 68 (6.9%) |
| $500 to $799 | 199 (17.9%) | 429 (43.3%) |
| $800 to $999 | 182 (16.4%) | 260 (26.3%) |
| $1,000 to $1,499 | 348 (31.3%) | 16 (1.6%) |
| $1,500 to $1,999 | 49 (4.4%) | 34 (3.4%) |
| $2,000 to $2,499 | 0 (0.0%) | 0 (0.0%) |
| $2,500 to $2,999 | 0 (0.0%) | 0 (0.0%) |
| $3,000 or more | 0 (0.0%) | 17 (1.7%) |
| Total | 1,112 (100.0%) | 990 (100.0%) |
Physical Housing Characteristics in Long View
Housing Structures in Long View
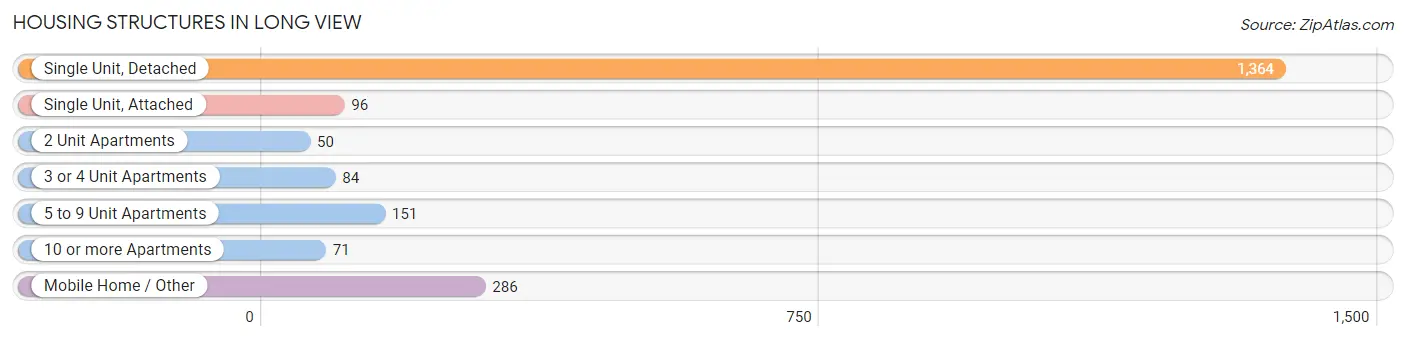
| Structure Type | # Housing Units | % Housing Units |
| Single Unit, Detached | 1,364 | 64.9% |
| Single Unit, Attached | 96 | 4.6% |
| 2 Unit Apartments | 50 | 2.4% |
| 3 or 4 Unit Apartments | 84 | 4.0% |
| 5 to 9 Unit Apartments | 151 | 7.2% |
| 10 or more Apartments | 71 | 3.4% |
| Mobile Home / Other | 286 | 13.6% |
| Total | 2,102 | 100.0% |
Housing Structures by Occupancy in Long View
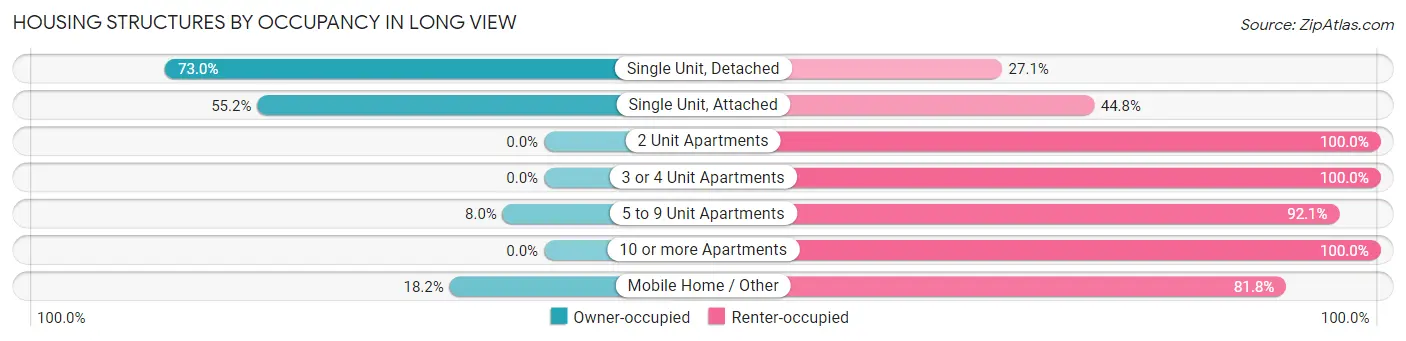
| Structure Type | Owner-occupied | Renter-occupied |
| Single Unit, Detached | 995 (73.0%) | 369 (27.1%) |
| Single Unit, Attached | 53 (55.2%) | 43 (44.8%) |
| 2 Unit Apartments | 0 (0.0%) | 50 (100.0%) |
| 3 or 4 Unit Apartments | 0 (0.0%) | 84 (100.0%) |
| 5 to 9 Unit Apartments | 12 (8.0%) | 139 (92.0%) |
| 10 or more Apartments | 0 (0.0%) | 71 (100.0%) |
| Mobile Home / Other | 52 (18.2%) | 234 (81.8%) |
| Total | 1,112 (52.9%) | 990 (47.1%) |
Housing Structures by Number of Rooms in Long View
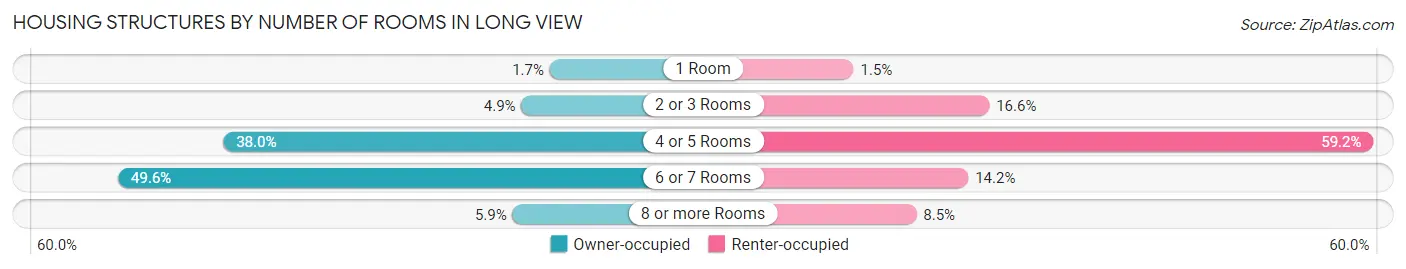
| Number of Rooms | Owner-occupied | Renter-occupied |
| 1 Room | 19 (1.7%) | 15 (1.5%) |
| 2 or 3 Rooms | 54 (4.9%) | 164 (16.6%) |
| 4 or 5 Rooms | 422 (38.0%) | 586 (59.2%) |
| 6 or 7 Rooms | 552 (49.6%) | 141 (14.2%) |
| 8 or more Rooms | 65 (5.9%) | 84 (8.5%) |
| Total | 1,112 (100.0%) | 990 (100.0%) |
Housing Structure by Heating Type in Long View
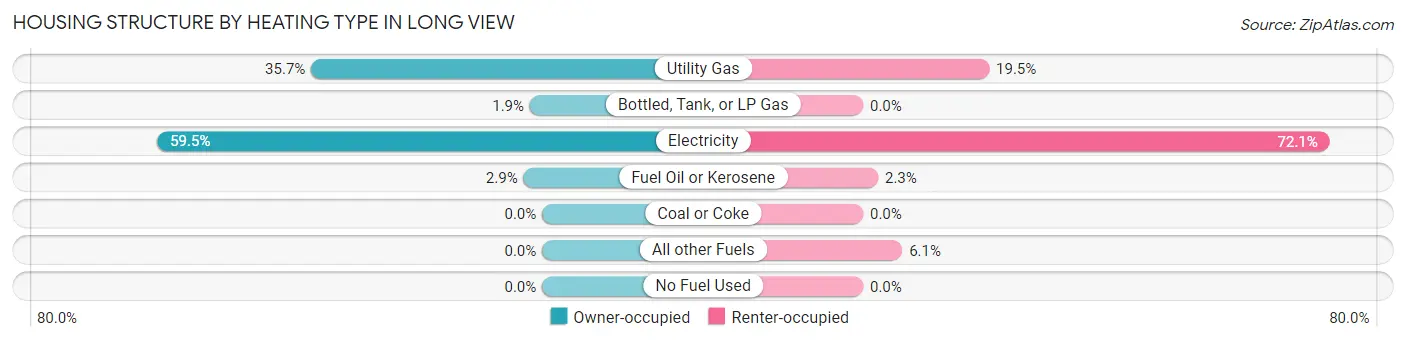
| Heating Type | Owner-occupied | Renter-occupied |
| Utility Gas | 397 (35.7%) | 193 (19.5%) |
| Bottled, Tank, or LP Gas | 21 (1.9%) | 0 (0.0%) |
| Electricity | 662 (59.5%) | 714 (72.1%) |
| Fuel Oil or Kerosene | 32 (2.9%) | 23 (2.3%) |
| Coal or Coke | 0 (0.0%) | 0 (0.0%) |
| All other Fuels | 0 (0.0%) | 60 (6.1%) |
| No Fuel Used | 0 (0.0%) | 0 (0.0%) |
| Total | 1,112 (100.0%) | 990 (100.0%) |
Household Vehicle Usage in Long View
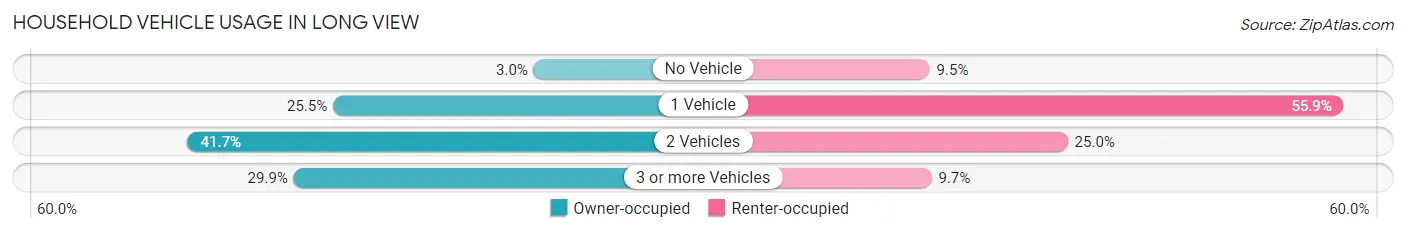
| Vehicles per Household | Owner-occupied | Renter-occupied |
| No Vehicle | 33 (3.0%) | 94 (9.5%) |
| 1 Vehicle | 283 (25.5%) | 553 (55.9%) |
| 2 Vehicles | 464 (41.7%) | 247 (24.9%) |
| 3 or more Vehicles | 332 (29.9%) | 96 (9.7%) |
| Total | 1,112 (100.0%) | 990 (100.0%) |
Real Estate & Mortgages in Long View
Real Estate and Mortgage Overview in Long View
| Characteristic | Without Mortgage | With Mortgage |
| Housing Units | 370 | 742 |
| Median Property Value | $106,700 | $139,900 |
| Median Household Income | $54,000 | $43 |
| Monthly Housing Costs | $375 | $0 |
| Real Estate Taxes | $1,182 | $0 |
Property Value by Mortgage Status in Long View
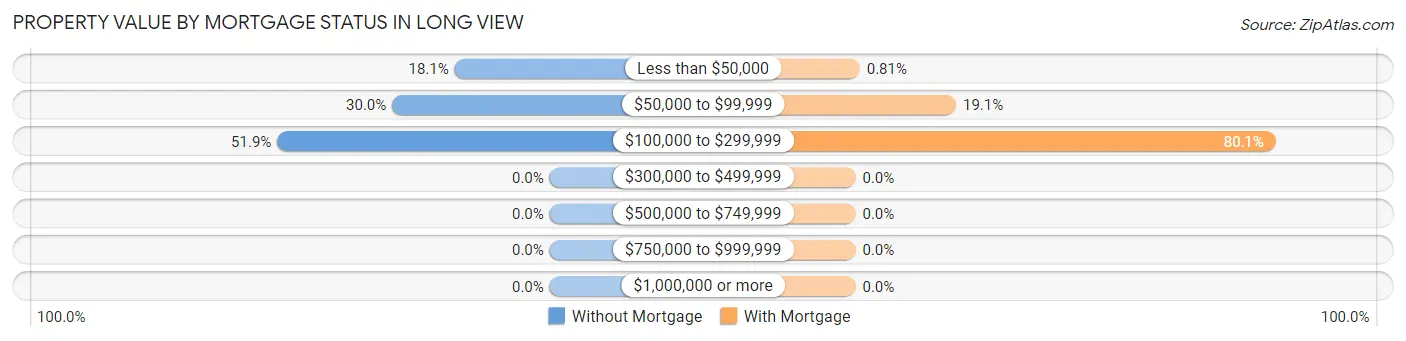
| Property Value | Without Mortgage | With Mortgage |
| Less than $50,000 | 67 (18.1%) | 6 (0.8%) |
| $50,000 to $99,999 | 111 (30.0%) | 142 (19.1%) |
| $100,000 to $299,999 | 192 (51.9%) | 594 (80.0%) |
| $300,000 to $499,999 | 0 (0.0%) | 0 (0.0%) |
| $500,000 to $749,999 | 0 (0.0%) | 0 (0.0%) |
| $750,000 to $999,999 | 0 (0.0%) | 0 (0.0%) |
| $1,000,000 or more | 0 (0.0%) | 0 (0.0%) |
| Total | 370 (100.0%) | 742 (100.0%) |
Household Income by Mortgage Status in Long View
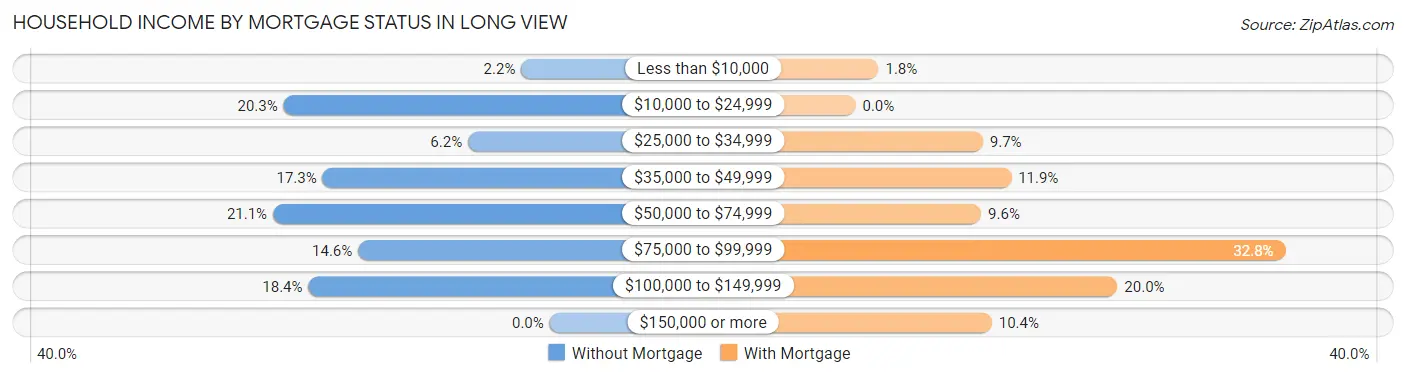
| Household Income | Without Mortgage | With Mortgage |
| Less than $10,000 | 8 (2.2%) | 13 (1.8%) |
| $10,000 to $24,999 | 75 (20.3%) | 0 (0.0%) |
| $25,000 to $34,999 | 23 (6.2%) | 72 (9.7%) |
| $35,000 to $49,999 | 64 (17.3%) | 88 (11.9%) |
| $50,000 to $74,999 | 78 (21.1%) | 71 (9.6%) |
| $75,000 to $99,999 | 54 (14.6%) | 243 (32.8%) |
| $100,000 to $149,999 | 68 (18.4%) | 148 (20.0%) |
| $150,000 or more | 0 (0.0%) | 77 (10.4%) |
| Total | 370 (100.0%) | 742 (100.0%) |
Property Value to Household Income Ratio in Long View
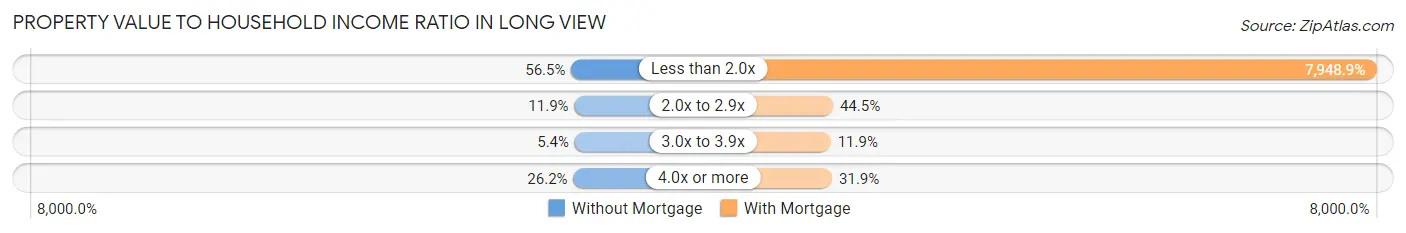
| Value-to-Income Ratio | Without Mortgage | With Mortgage |
| Less than 2.0x | 209 (56.5%) | 58,981 (7,948.9%) |
| 2.0x to 2.9x | 44 (11.9%) | 330 (44.5%) |
| 3.0x to 3.9x | 20 (5.4%) | 88 (11.9%) |
| 4.0x or more | 97 (26.2%) | 237 (31.9%) |
| Total | 370 (100.0%) | 742 (100.0%) |
Real Estate Taxes by Mortgage Status in Long View
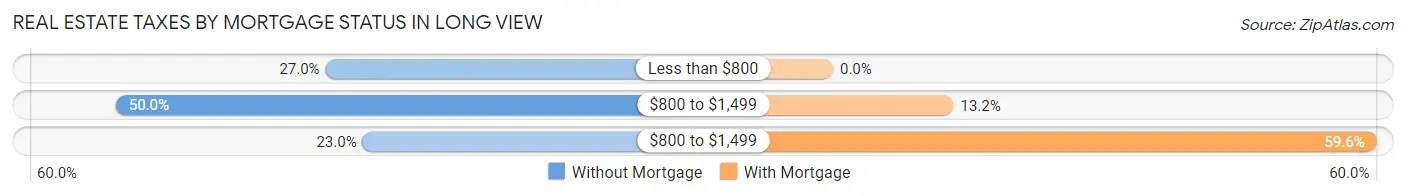
| Property Taxes | Without Mortgage | With Mortgage |
| Less than $800 | 100 (27.0%) | 0 (0.0%) |
| $800 to $1,499 | 185 (50.0%) | 98 (13.2%) |
| $800 to $1,499 | 85 (23.0%) | 442 (59.6%) |
| Total | 370 (100.0%) | 742 (100.0%) |
Health & Disability in Long View
Health Insurance Coverage by Age in Long View
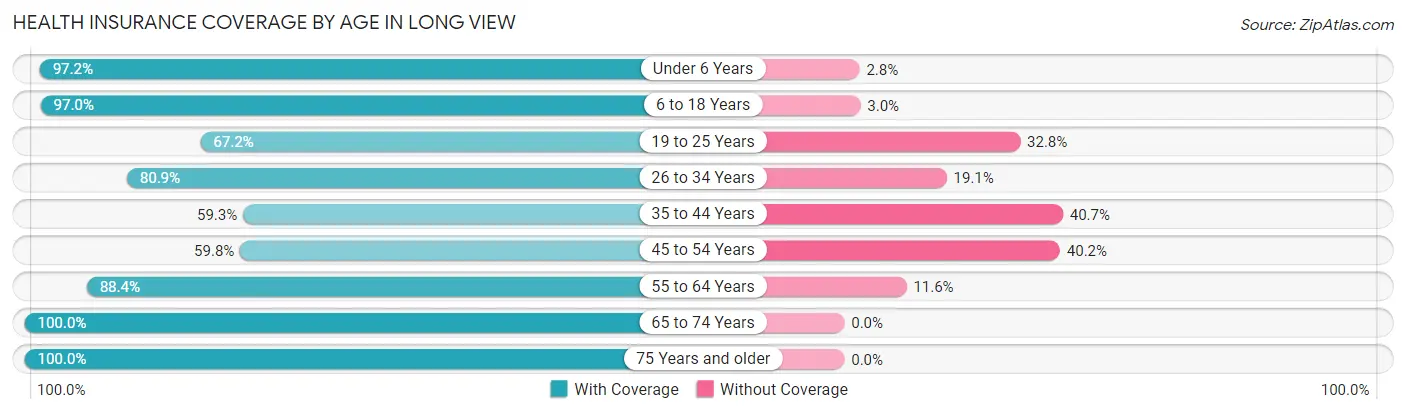
| Age Bracket | With Coverage | Without Coverage |
| Under 6 Years | 343 (97.2%) | 10 (2.8%) |
| 6 to 18 Years | 585 (97.0%) | 18 (3.0%) |
| 19 to 25 Years | 330 (67.2%) | 161 (32.8%) |
| 26 to 34 Years | 687 (80.9%) | 162 (19.1%) |
| 35 to 44 Years | 288 (59.3%) | 198 (40.7%) |
| 45 to 54 Years | 479 (59.8%) | 322 (40.2%) |
| 55 to 64 Years | 534 (88.4%) | 70 (11.6%) |
| 65 to 74 Years | 642 (100.0%) | 0 (0.0%) |
| 75 Years and older | 170 (100.0%) | 0 (0.0%) |
| Total | 4,058 (81.2%) | 941 (18.8%) |
Health Insurance Coverage by Citizenship Status in Long View
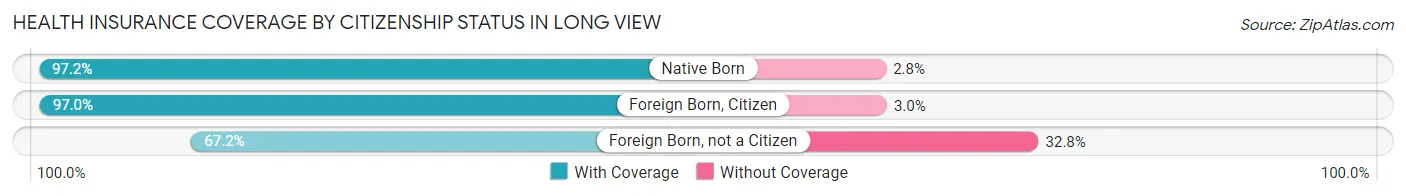
| Citizenship Status | With Coverage | Without Coverage |
| Native Born | 343 (97.2%) | 10 (2.8%) |
| Foreign Born, Citizen | 585 (97.0%) | 18 (3.0%) |
| Foreign Born, not a Citizen | 330 (67.2%) | 161 (32.8%) |
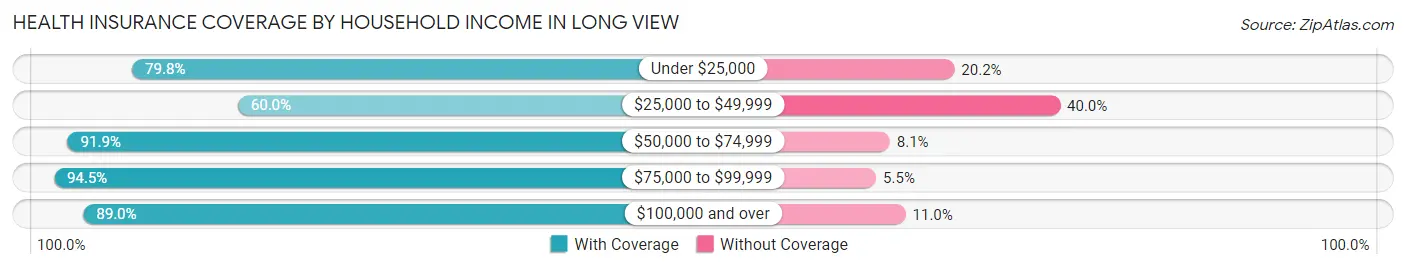
Health Insurance Coverage by Household Income in Long View
| Household Income | With Coverage | Without Coverage |
| Under $25,000 | 487 (79.8%) | 123 (20.2%) |
| $25,000 to $49,999 | 867 (60.0%) | 577 (40.0%) |
| $50,000 to $74,999 | 1,003 (91.9%) | 88 (8.1%) |
| $75,000 to $99,999 | 877 (94.5%) | 51 (5.5%) |
| $100,000 and over | 824 (89.0%) | 102 (11.0%) |
Public vs Private Health Insurance Coverage by Age in Long View
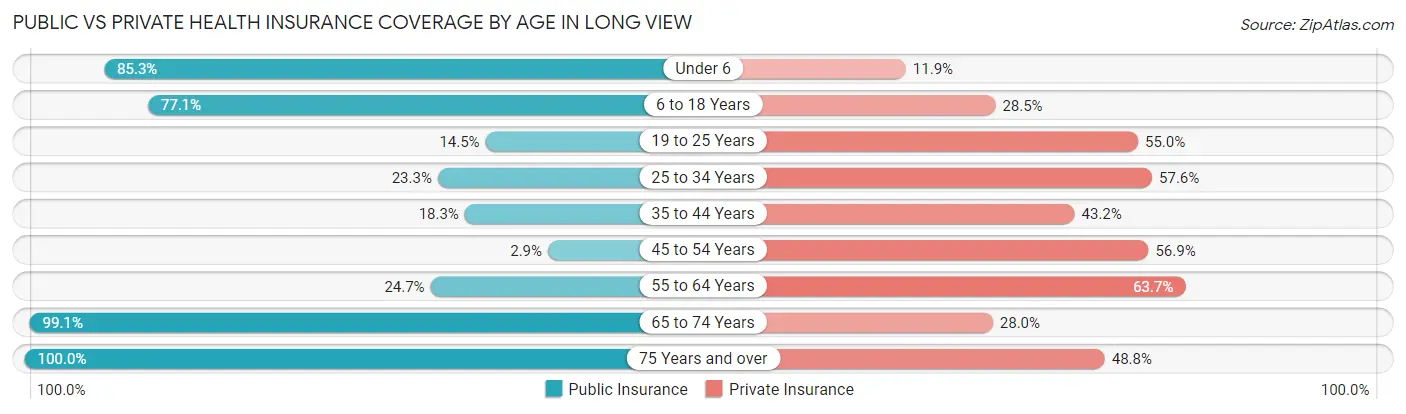
| Age Bracket | Public Insurance | Private Insurance |
| Under 6 | 301 (85.3%) | 42 (11.9%) |
| 6 to 18 Years | 465 (77.1%) | 172 (28.5%) |
| 19 to 25 Years | 71 (14.5%) | 270 (55.0%) |
| 25 to 34 Years | 198 (23.3%) | 489 (57.6%) |
| 35 to 44 Years | 89 (18.3%) | 210 (43.2%) |
| 45 to 54 Years | 23 (2.9%) | 456 (56.9%) |
| 55 to 64 Years | 149 (24.7%) | 385 (63.7%) |
| 65 to 74 Years | 636 (99.1%) | 180 (28.0%) |
| 75 Years and over | 170 (100.0%) | 83 (48.8%) |
| Total | 2,102 (42.0%) | 2,287 (45.8%) |
Disability Status by Sex by Age in Long View
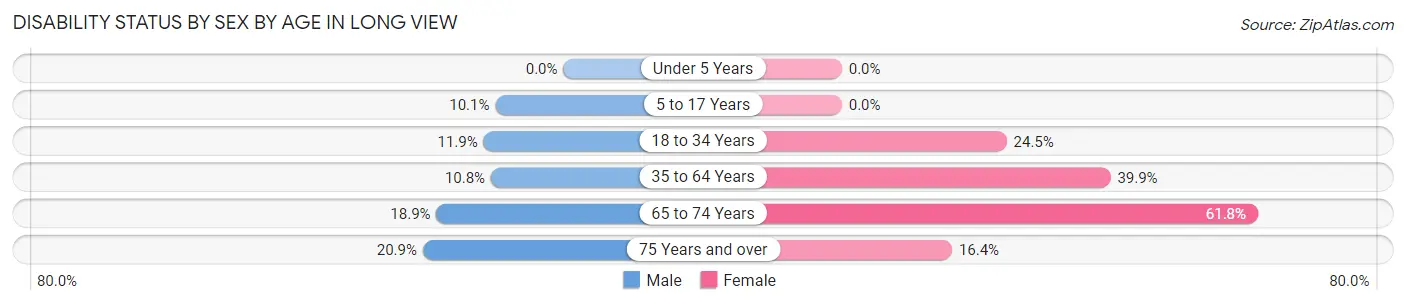
| Age Bracket | Male | Female |
| Under 5 Years | 0 (0.0%) | 0 (0.0%) |
| 5 to 17 Years | 46 (10.1%) | 0 (0.0%) |
| 18 to 34 Years | 89 (11.8%) | 149 (24.5%) |
| 35 to 64 Years | 106 (10.7%) | 361 (39.9%) |
| 65 to 74 Years | 49 (18.9%) | 236 (61.8%) |
| 75 Years and over | 24 (20.9%) | 9 (16.4%) |
Disability Class by Sex by Age in Long View
Disability Class: Hearing Difficulty
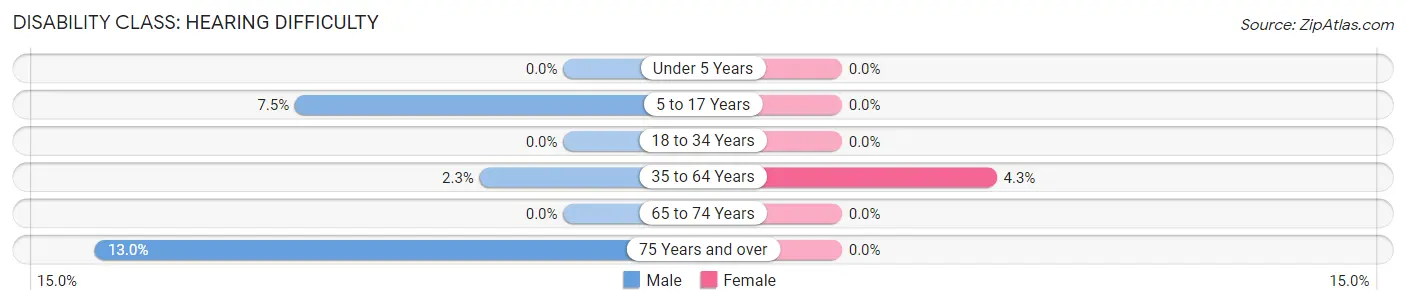
| Age Bracket | Male | Female |
| Under 5 Years | 0 (0.0%) | 0 (0.0%) |
| 5 to 17 Years | 34 (7.5%) | 0 (0.0%) |
| 18 to 34 Years | 0 (0.0%) | 0 (0.0%) |
| 35 to 64 Years | 23 (2.3%) | 39 (4.3%) |
| 65 to 74 Years | 0 (0.0%) | 0 (0.0%) |
| 75 Years and over | 15 (13.0%) | 0 (0.0%) |
Disability Class: Vision Difficulty
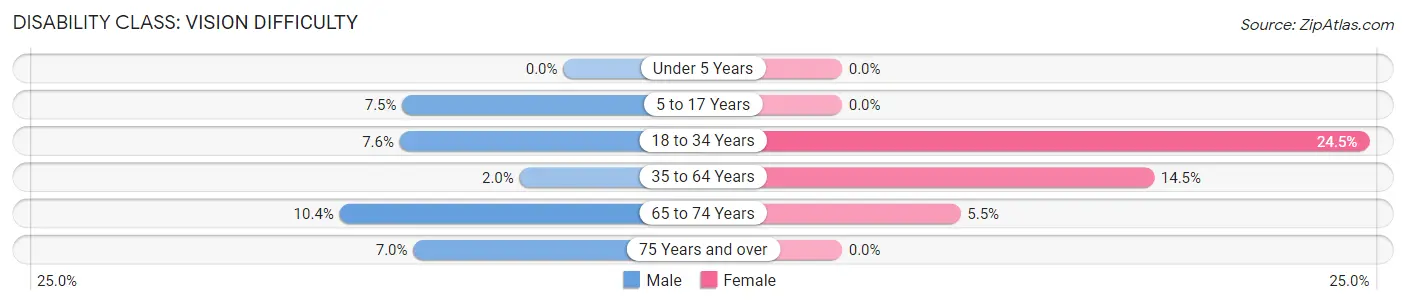
| Age Bracket | Male | Female |
| Under 5 Years | 0 (0.0%) | 0 (0.0%) |
| 5 to 17 Years | 34 (7.5%) | 0 (0.0%) |
| 18 to 34 Years | 57 (7.6%) | 149 (24.5%) |
| 35 to 64 Years | 20 (2.0%) | 131 (14.5%) |
| 65 to 74 Years | 27 (10.4%) | 21 (5.5%) |
| 75 Years and over | 8 (7.0%) | 0 (0.0%) |
Disability Class: Cognitive Difficulty
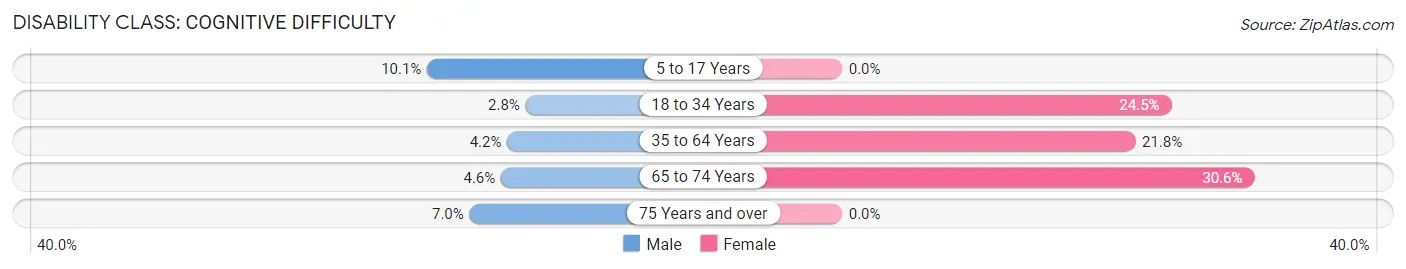
| Age Bracket | Male | Female |
| 5 to 17 Years | 46 (10.1%) | 0 (0.0%) |
| 18 to 34 Years | 21 (2.8%) | 149 (24.5%) |
| 35 to 64 Years | 41 (4.2%) | 197 (21.8%) |
| 65 to 74 Years | 12 (4.6%) | 117 (30.6%) |
| 75 Years and over | 8 (7.0%) | 0 (0.0%) |
Disability Class: Ambulatory Difficulty
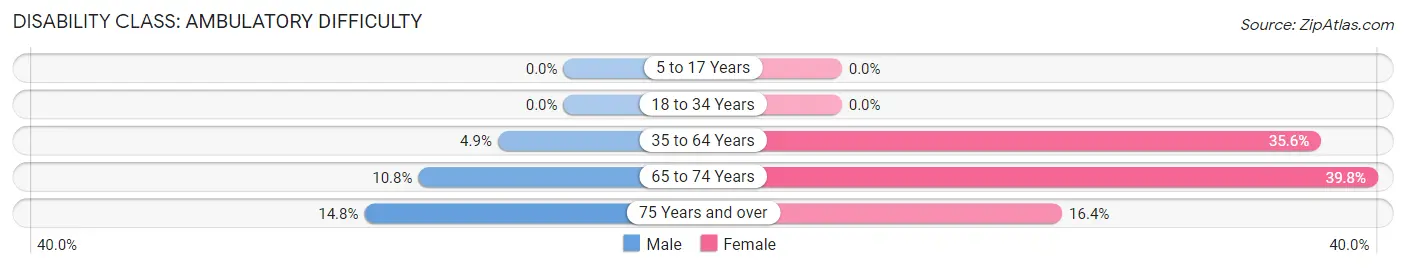
| Age Bracket | Male | Female |
| 5 to 17 Years | 0 (0.0%) | 0 (0.0%) |
| 18 to 34 Years | 0 (0.0%) | 0 (0.0%) |
| 35 to 64 Years | 48 (4.9%) | 322 (35.6%) |
| 65 to 74 Years | 28 (10.8%) | 152 (39.8%) |
| 75 Years and over | 17 (14.8%) | 9 (16.4%) |
Disability Class: Self-Care Difficulty
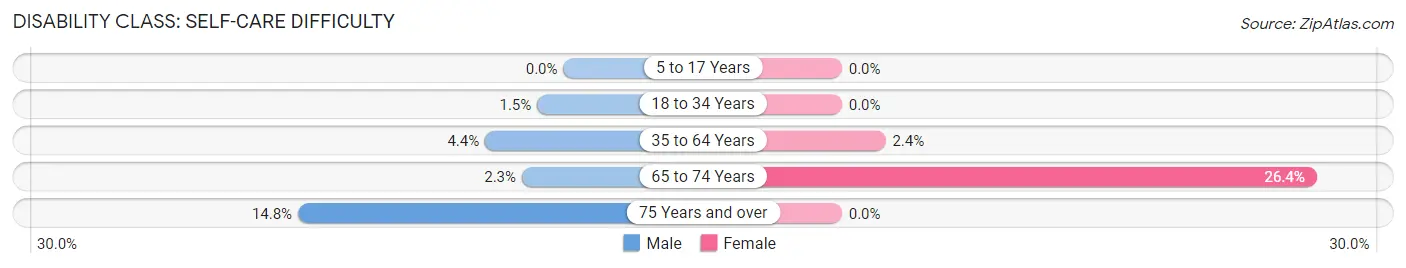
| Age Bracket | Male | Female |
| 5 to 17 Years | 0 (0.0%) | 0 (0.0%) |
| 18 to 34 Years | 11 (1.5%) | 0 (0.0%) |
| 35 to 64 Years | 43 (4.4%) | 22 (2.4%) |
| 65 to 74 Years | 6 (2.3%) | 101 (26.4%) |
| 75 Years and over | 17 (14.8%) | 0 (0.0%) |
Technology Access in Long View
Computing Device Access in Long View
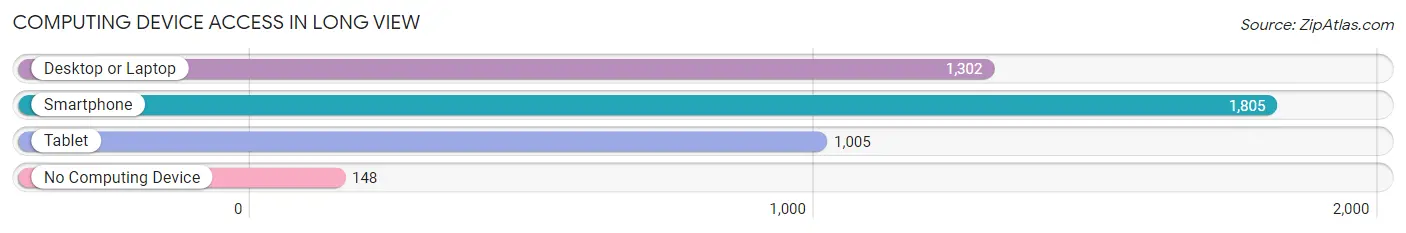
| Device Type | # Households | % Households |
| Desktop or Laptop | 1,302 | 61.9% |
| Smartphone | 1,805 | 85.9% |
| Tablet | 1,005 | 47.8% |
| No Computing Device | 148 | 7.0% |
| Total | 2,102 | 100.0% |
Internet Access in Long View
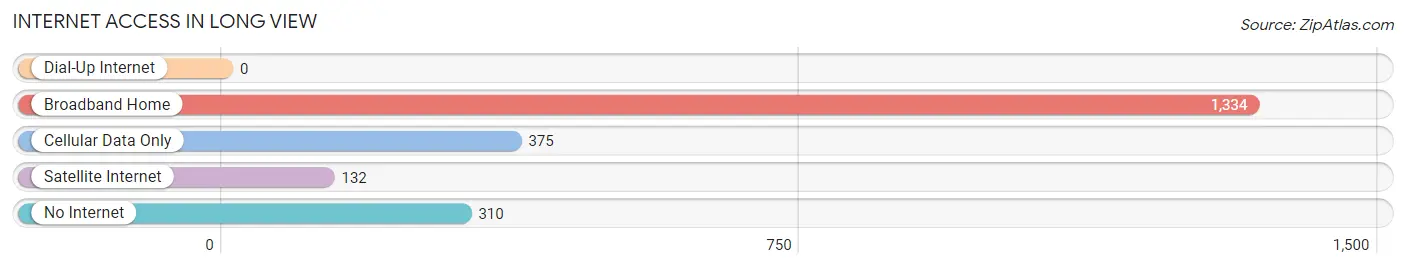
| Internet Type | # Households | % Households |
| Dial-Up Internet | 0 | 0.0% |
| Broadband Home | 1,334 | 63.5% |
| Cellular Data Only | 375 | 17.8% |
| Satellite Internet | 132 | 6.3% |
| No Internet | 310 | 14.7% |
| Total | 2,102 | 100.0% |
Long View Summary
Long View is a small town located in the foothills of the Blue Ridge Mountains in North Carolina. It is situated in the Catawba County, and is part of the Hickory-Lenoir-Morganton Metropolitan Statistical Area. The town has a population of approximately 2,000 people, and is known for its rural charm and small-town atmosphere.
History
Long View was founded in 1887 by a group of settlers from the nearby town of Hickory. The town was named after the long view of the Blue Ridge Mountains that could be seen from the area. The town was originally a farming community, and the main crops grown were corn, wheat, and tobacco. In the early 1900s, the town began to grow and develop, and by the 1920s, it had become a thriving community.
In the 1950s, the town began to experience a period of growth and development. The town was home to several businesses, including a furniture factory, a textile mill, and a canning factory. The town also had a movie theater, a bowling alley, and several restaurants.
Geography
Long View is located in the foothills of the Blue Ridge Mountains in North Carolina. The town is situated in the Catawba County, and is part of the Hickory-Lenoir-Morganton Metropolitan Statistical Area. The town is located at an elevation of 1,000 feet above sea level, and is surrounded by rolling hills and forests. The town is located approximately 30 miles from the city of Charlotte.
Economy
The economy of Long View is largely based on agriculture and tourism. The town is home to several farms, which produce a variety of crops, including corn, wheat, and tobacco. The town is also home to several small businesses, including restaurants, retail stores, and service providers. The town is also home to a furniture factory, a textile mill, and a canning factory.
Demographics
As of the 2010 census, the population of Long View was 2,000 people. The town is predominantly white, with approximately 90% of the population being Caucasian. The town also has a small African American population, with approximately 5% of the population being African American. The town also has a small Hispanic population, with approximately 2% of the population being Hispanic. The median household income in Long View is approximately $35,000, and the median home value is approximately $150,000.
Conclusion
Long View is a small town located in the foothills of the Blue Ridge Mountains in North Carolina. The town has a population of approximately 2,000 people, and is known for its rural charm and small-town atmosphere. The economy of Long View is largely based on agriculture and tourism, and the town is home to several small businesses. The town is predominantly white, with approximately 90% of the population being Caucasian. The median household income in Long View is approximately $35,000, and the median home value is approximately $150,000.
Common Questions
What is the Total Population of Long View?
Total Population of Long View is 5,029.
What is the Total Male Population of Long View?
Total Male Population of Long View is 2,815.
What is the Total Female Population of Long View?
Total Female Population of Long View is 2,214.
What is the Ratio of Males per 100 Females in Long View?
There are 127.15 Males per 100 Females in Long View.
What is the Ratio of Females per 100 Males in Long View?
There are 78.65 Females per 100 Males in Long View.
What is the Median Population Age in Long View?
Median Population Age in Long View is 38.7 Years.
What is the Average Family Size in Long View
Average Family Size in Long View is 2.9 People.
What is the Average Household Size in Long View
Average Household Size in Long View is 2.4 People.
What is Per Capita Income in Long View?
Per Capita income in Long View is $26,604.
What is the Median Family Income in Long View?
Median Family Income in Long View is $50,019.
What is the Median Household income in Long View?
Median Household Income in Long View is $44,740.
What is Income or Wage Gap in Long View?
Income or Wage Gap in Long View is 23.2%.
Women in Long View earn 76.8 cents for every dollar earned by a man.
What is Inequality or Gini Index in Long View?
Inequality or Gini Index in Long View is 0.40.
How Large is the Labor Force in Long View?
There are 2,843 People in the Labor Forcein in Long View.
What is the Percentage of People in the Labor Force in Long View?
66.4% of People are in the Labor Force in Long View.
What is the Unemployment Rate in Long View?
Unemployment Rate in Long View is 5.3%.