Ahoskie, NC
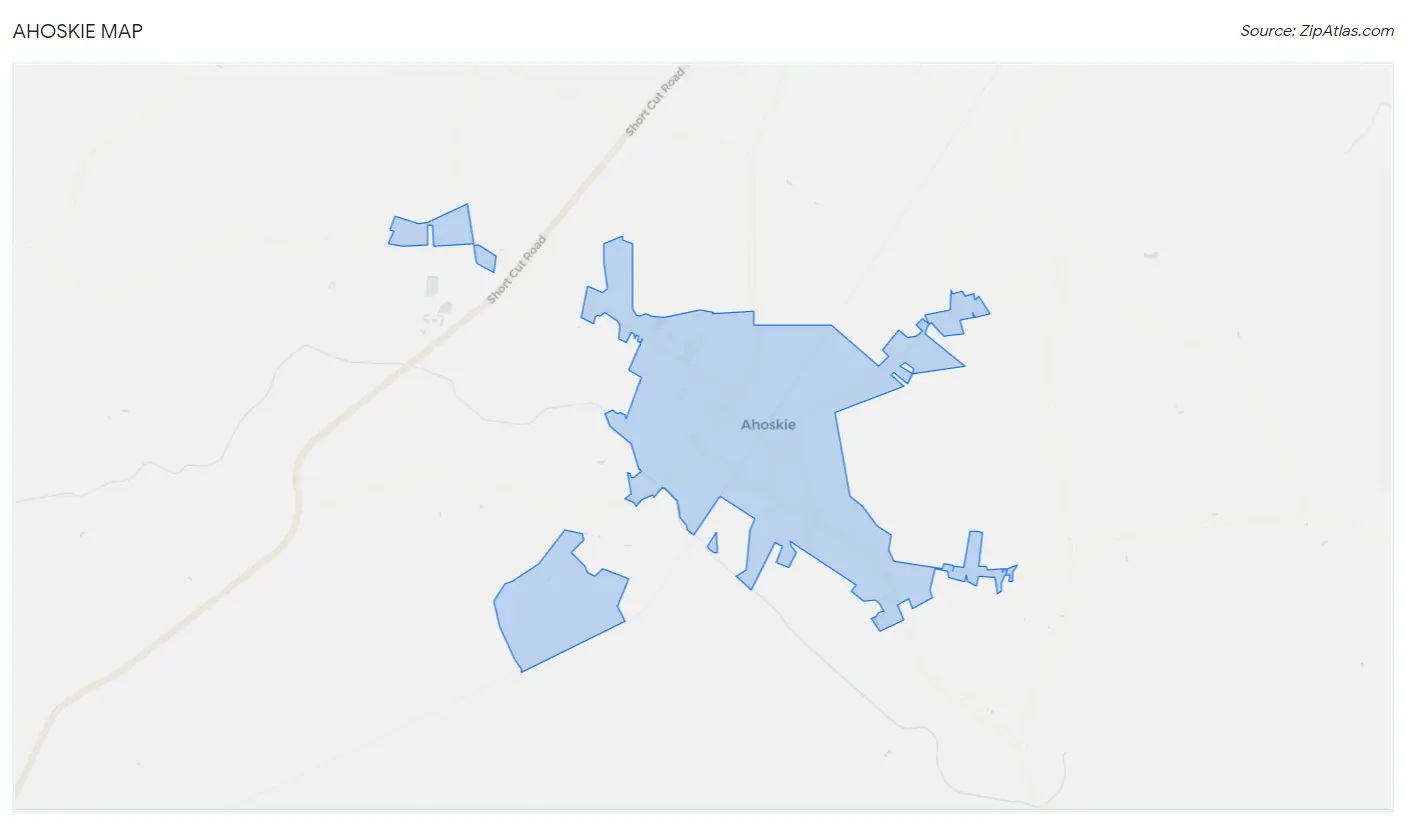
Ahoskie Map
Ahoskie Overview
4,841
TOTAL POPULATION
2,073
MALE POPULATION
2,768
FEMALE POPULATION
74.89
MALES / 100 FEMALES
133.53
FEMALES / 100 MALES
39.3
MEDIAN AGE
3.2
AVG FAMILY SIZE
2.3
AVG HOUSEHOLD SIZE
$23,170
PER CAPITA INCOME
$47,679
AVG FAMILY INCOME
$38,063
AVG HOUSEHOLD INCOME
30.8%
WAGE / INCOME GAP [ % ]
69.2¢/ $1
WAGE / INCOME GAP [ $ ]
$13,422
FAMILY INCOME DEFICIT
0.49
INEQUALITY / GINI INDEX
2,043
LABOR FORCE [ PEOPLE ]
52.6%
PERCENT IN LABOR FORCE
11.9%
UNEMPLOYMENT RATE
Ahoskie Zip Codes
Ahoskie Area Codes
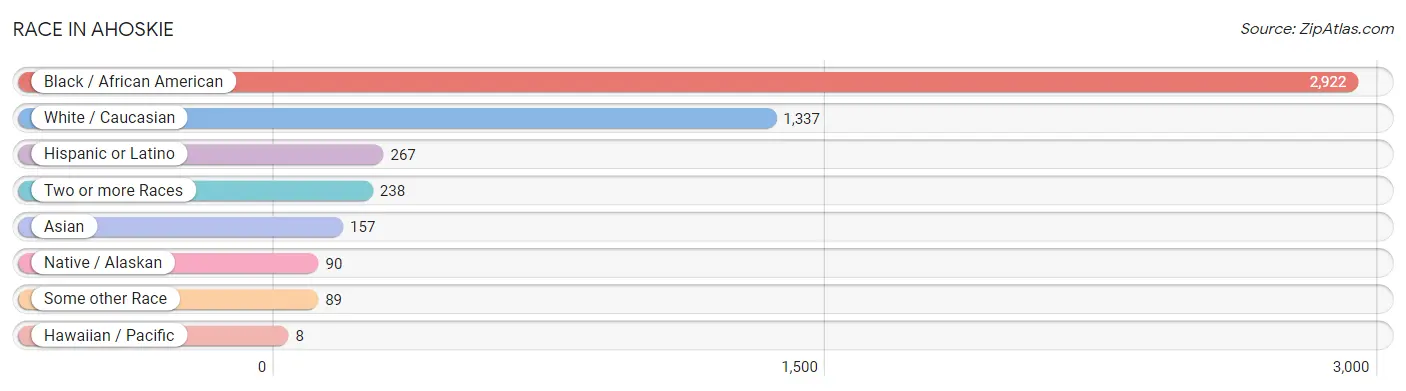
Race in Ahoskie
The most populous races in Ahoskie are Black / African American (2,922 | 60.4%), White / Caucasian (1,337 | 27.6%), and Hispanic or Latino (267 | 5.5%).
| Race | # Population | % Population |
| Asian | 157 | 3.2% |
| Black / African American | 2,922 | 60.4% |
| Hawaiian / Pacific | 8 | 0.2% |
| Hispanic or Latino | 267 | 5.5% |
| Native / Alaskan | 90 | 1.9% |
| White / Caucasian | 1,337 | 27.6% |
| Two or more Races | 238 | 4.9% |
| Some other Race | 89 | 1.8% |
| Total | 4,841 | 100.0% |
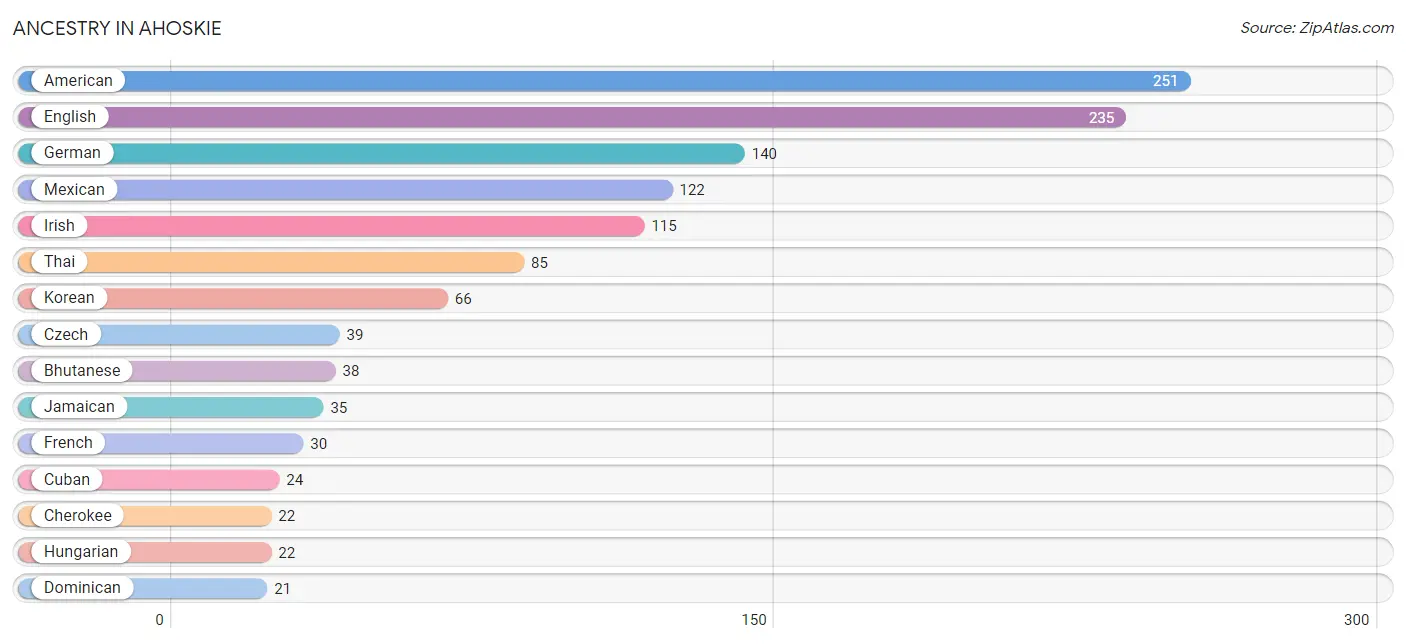
Ancestry in Ahoskie
The most populous ancestries reported in Ahoskie are American (251 | 5.2%), English (235 | 4.9%), German (140 | 2.9%), Mexican (122 | 2.5%), and Irish (115 | 2.4%), together accounting for 17.8% of all Ahoskie residents.
| Ancestry | # Population | % Population |
| African | 19 | 0.4% |
| Albanian | 1 | 0.0% |
| Aleut | 6 | 0.1% |
| American | 251 | 5.2% |
| Bangladeshi | 3 | 0.1% |
| Bhutanese | 38 | 0.8% |
| British | 9 | 0.2% |
| Burmese | 4 | 0.1% |
| Central American | 2 | 0.0% |
| Cherokee | 22 | 0.4% |
| Cuban | 24 | 0.5% |
| Czech | 39 | 0.8% |
| Czechoslovakian | 7 | 0.1% |
| Dominican | 21 | 0.4% |
| Dutch | 1 | 0.0% |
| Eastern European | 1 | 0.0% |
| English | 235 | 4.9% |
| European | 17 | 0.4% |
| French | 30 | 0.6% |
| French American Indian | 19 | 0.4% |
| French Canadian | 2 | 0.0% |
| German | 140 | 2.9% |
| Guamanian / Chamorro | 4 | 0.1% |
| Haitian | 6 | 0.1% |
| Hungarian | 22 | 0.4% |
| Indian (Asian) | 7 | 0.1% |
| Irish | 115 | 2.4% |
| Italian | 6 | 0.1% |
| Jamaican | 35 | 0.7% |
| Korean | 66 | 1.4% |
| Lumbee | 1 | 0.0% |
| Mexican | 122 | 2.5% |
| Native Hawaiian | 4 | 0.1% |
| Norwegian | 3 | 0.1% |
| Panamanian | 2 | 0.0% |
| Polish | 5 | 0.1% |
| Puerto Rican | 21 | 0.4% |
| Scotch-Irish | 11 | 0.2% |
| Scottish | 10 | 0.2% |
| South American | 6 | 0.1% |
| Sri Lankan | 5 | 0.1% |
| Subsaharan African | 19 | 0.4% |
| Thai | 85 | 1.8% |
| Trinidadian and Tobagonian | 2 | 0.0% |
| Ukrainian | 3 | 0.1% |
| Venezuelan | 6 | 0.1% |
| Welsh | 7 | 0.1% | View All 47 Rows |
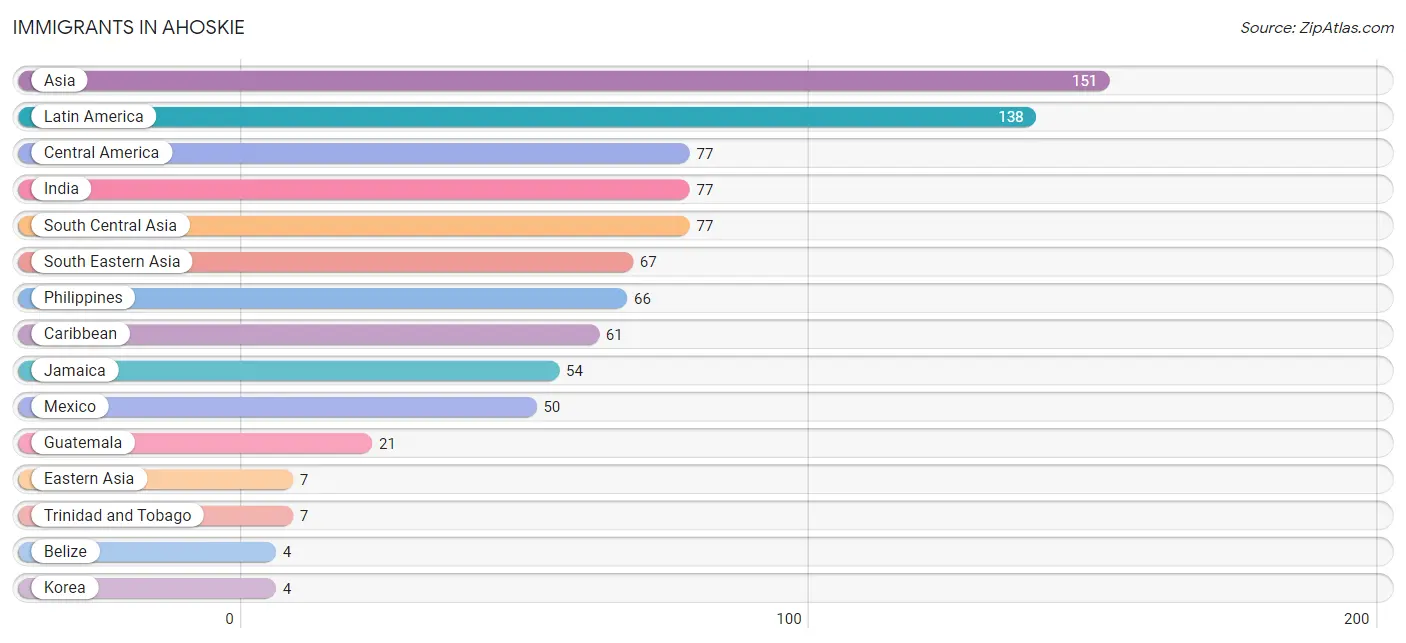
Immigrants in Ahoskie
The most numerous immigrant groups reported in Ahoskie came from Asia (151 | 3.1%), Latin America (138 | 2.9%), Central America (77 | 1.6%), India (77 | 1.6%), and South Central Asia (77 | 1.6%), together accounting for 10.7% of all Ahoskie residents.
| Immigration Origin | # Population | % Population |
| Asia | 151 | 3.1% |
| Belize | 4 | 0.1% |
| Caribbean | 61 | 1.3% |
| Central America | 77 | 1.6% |
| China | 3 | 0.1% |
| Eastern Asia | 7 | 0.1% |
| Europe | 1 | 0.0% |
| Guatemala | 21 | 0.4% |
| India | 77 | 1.6% |
| Italy | 1 | 0.0% |
| Jamaica | 54 | 1.1% |
| Korea | 4 | 0.1% |
| Latin America | 138 | 2.9% |
| Mexico | 50 | 1.0% |
| Panama | 2 | 0.0% |
| Philippines | 66 | 1.4% |
| South Central Asia | 77 | 1.6% |
| South Eastern Asia | 67 | 1.4% |
| Southern Europe | 1 | 0.0% |
| Trinidad and Tobago | 7 | 0.1% |
| Vietnam | 1 | 0.0% | View All 21 Rows |
Sex and Age in Ahoskie
Sex and Age in Ahoskie
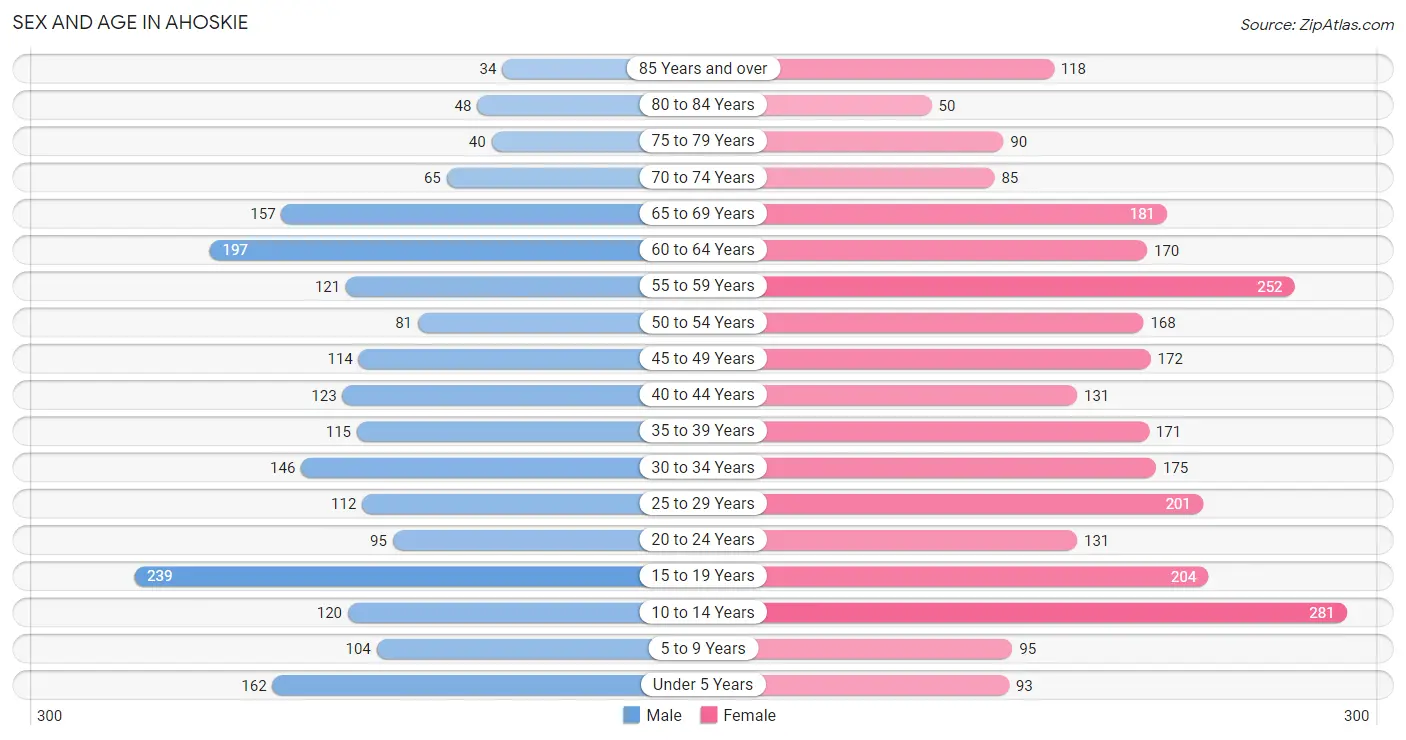
The most populous age groups in Ahoskie are 15 to 19 Years (239 | 11.5%) for men and 10 to 14 Years (281 | 10.2%) for women.
| Age Bracket | Male | Female |
| Under 5 Years | 162 (7.8%) | 93 (3.4%) |
| 5 to 9 Years | 104 (5.0%) | 95 (3.4%) |
| 10 to 14 Years | 120 (5.8%) | 281 (10.2%) |
| 15 to 19 Years | 239 (11.5%) | 204 (7.4%) |
| 20 to 24 Years | 95 (4.6%) | 131 (4.7%) |
| 25 to 29 Years | 112 (5.4%) | 201 (7.3%) |
| 30 to 34 Years | 146 (7.0%) | 175 (6.3%) |
| 35 to 39 Years | 115 (5.6%) | 171 (6.2%) |
| 40 to 44 Years | 123 (5.9%) | 131 (4.7%) |
| 45 to 49 Years | 114 (5.5%) | 172 (6.2%) |
| 50 to 54 Years | 81 (3.9%) | 168 (6.1%) |
| 55 to 59 Years | 121 (5.8%) | 252 (9.1%) |
| 60 to 64 Years | 197 (9.5%) | 170 (6.1%) |
| 65 to 69 Years | 157 (7.6%) | 181 (6.5%) |
| 70 to 74 Years | 65 (3.1%) | 85 (3.1%) |
| 75 to 79 Years | 40 (1.9%) | 90 (3.3%) |
| 80 to 84 Years | 48 (2.3%) | 50 (1.8%) |
| 85 Years and over | 34 (1.6%) | 118 (4.3%) |
| Total | 2,073 (100.0%) | 2,768 (100.0%) |
Families and Households in Ahoskie
Median Family Size in Ahoskie
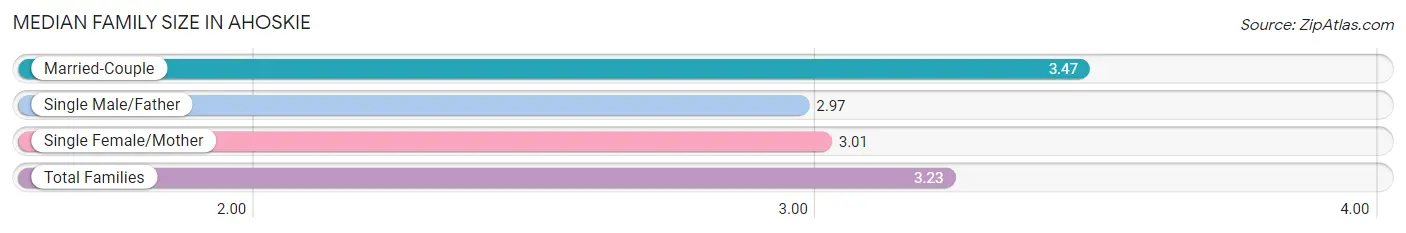
The median family size in Ahoskie is 3.23 persons per family, with married-couple families (523 | 47.8%) accounting for the largest median family size of 3.47 persons per family. On the other hand, single male/father families (59 | 5.4%) represent the smallest median family size with 2.97 persons per family.
| Family Type | # Families | Family Size |
| Married-Couple | 523 (47.8%) | 3.47 |
| Single Male/Father | 59 (5.4%) | 2.97 |
| Single Female/Mother | 512 (46.8%) | 3.01 |
| Total Families | 1,094 (100.0%) | 3.23 |
Median Household Size in Ahoskie
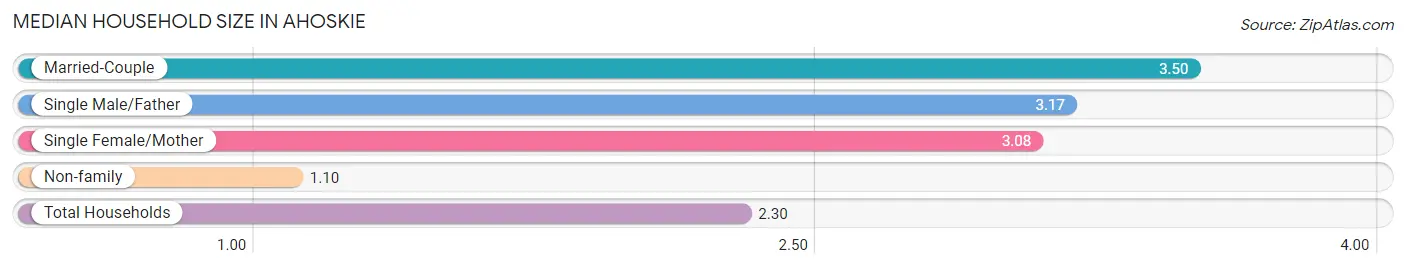
The median household size in Ahoskie is 2.30 persons per household, with married-couple households (523 | 26.2%) accounting for the largest median household size of 3.5 persons per household. non-family households (900 | 45.1%) represent the smallest median household size with 1.10 persons per household.
| Household Type | # Households | Household Size |
| Married-Couple | 523 (26.2%) | 3.50 |
| Single Male/Father | 59 (3.0%) | 3.17 |
| Single Female/Mother | 512 (25.7%) | 3.08 |
| Non-family | 900 (45.1%) | 1.10 |
| Total Households | 1,994 (100.0%) | 2.30 |
Household Size by Marriage Status in Ahoskie
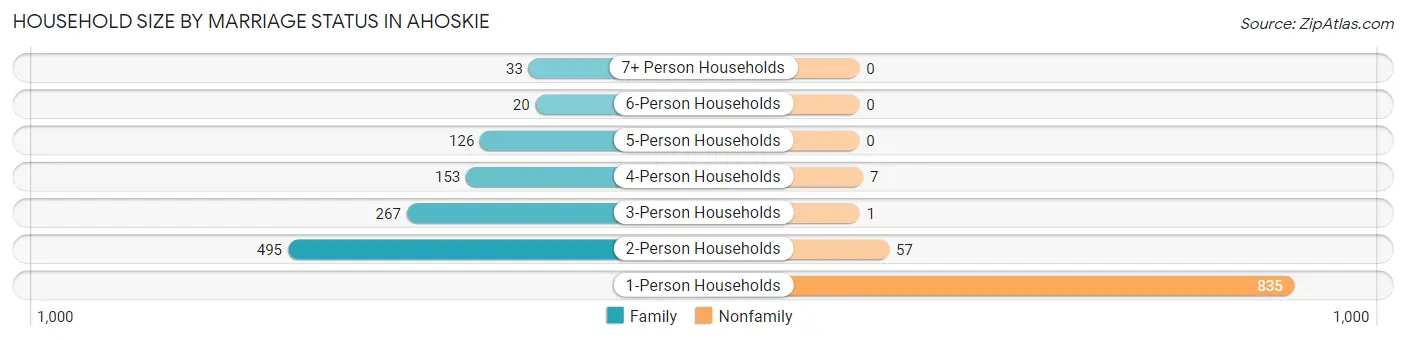
Out of a total of 1,994 households in Ahoskie, 1,094 (54.9%) are family households, while 900 (45.1%) are nonfamily households. The most numerous type of family households are 2-person households, comprising 495, and the most common type of nonfamily households are 1-person households, comprising 835.
| Household Size | Family Households | Nonfamily Households |
| 1-Person Households | - | 835 (41.9%) |
| 2-Person Households | 495 (24.8%) | 57 (2.9%) |
| 3-Person Households | 267 (13.4%) | 1 (0.1%) |
| 4-Person Households | 153 (7.7%) | 7 (0.4%) |
| 5-Person Households | 126 (6.3%) | 0 (0.0%) |
| 6-Person Households | 20 (1.0%) | 0 (0.0%) |
| 7+ Person Households | 33 (1.7%) | 0 (0.0%) |
| Total | 1,094 (54.9%) | 900 (45.1%) |
Female Fertility in Ahoskie
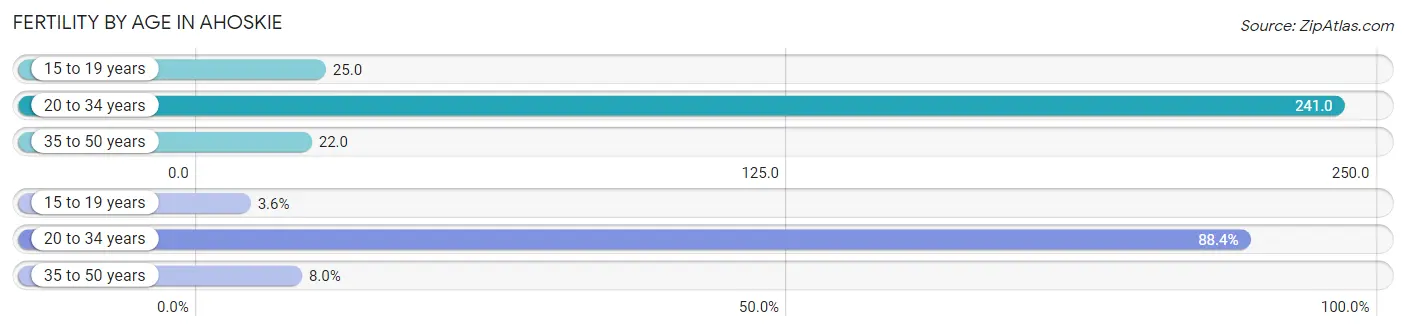
Fertility by Age in Ahoskie
Average fertility rate in Ahoskie is 115.0 births per 1,000 women. Women in the age bracket of 20 to 34 years have the highest fertility rate with 241.0 births per 1,000 women. Women in the age bracket of 20 to 34 years acount for 88.4% of all women with births.
| Age Bracket | Women with Births | Births / 1,000 Women |
| 15 to 19 years | 5 (3.6%) | 25.0 |
| 20 to 34 years | 122 (88.4%) | 241.0 |
| 35 to 50 years | 11 (8.0%) | 22.0 |
| Total | 138 (100.0%) | 115.0 |
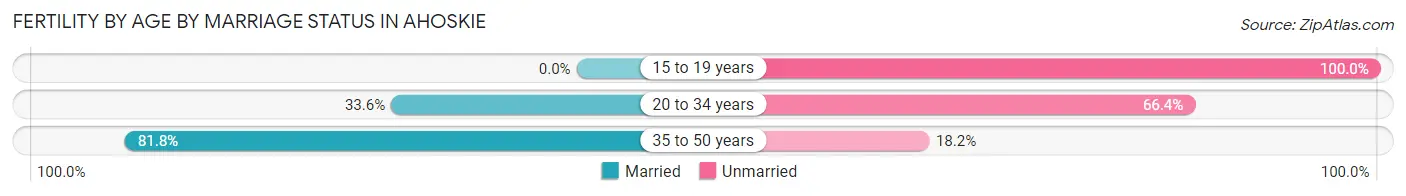
Fertility by Age by Marriage Status in Ahoskie
36.2% of women with births (138) in Ahoskie are married. The highest percentage of unmarried women with births falls into 15 to 19 years age bracket with 100.0% of them unmarried at the time of birth, while the lowest percentage of unmarried women with births belong to 35 to 50 years age bracket with 18.2% of them unmarried.
| Age Bracket | Married | Unmarried |
| 15 to 19 years | 0 (0.0%) | 5 (100.0%) |
| 20 to 34 years | 41 (33.6%) | 81 (66.4%) |
| 35 to 50 years | 9 (81.8%) | 2 (18.2%) |
| Total | 50 (36.2%) | 88 (63.8%) |
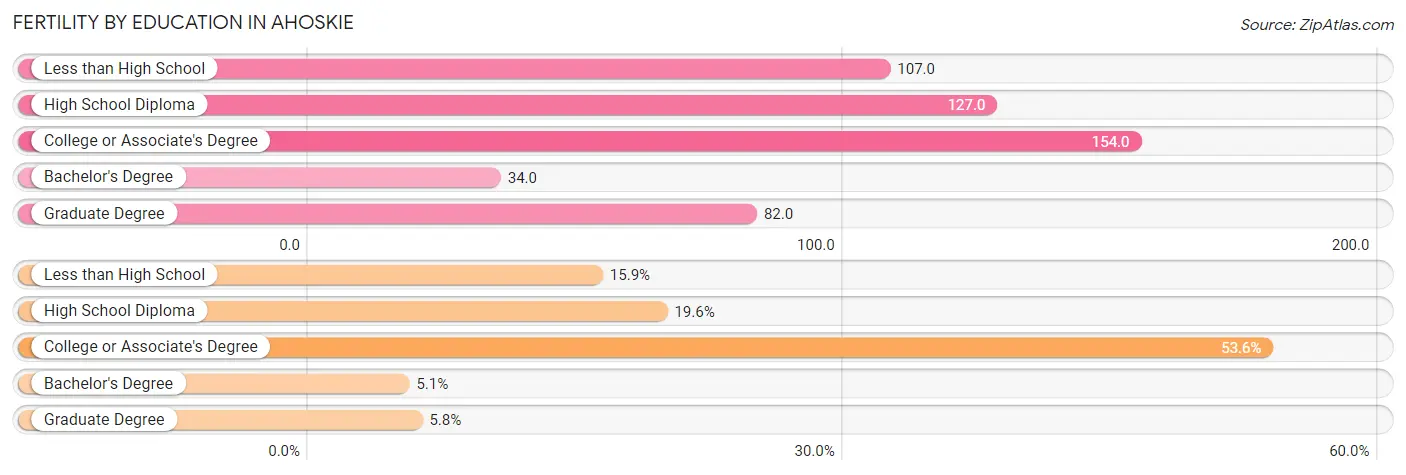
Fertility by Education in Ahoskie
Average fertility rate in Ahoskie is 115.0 births per 1,000 women. Women with the education attainment of college or associate's degree have the highest fertility rate of 154.0 births per 1,000 women, while women with the education attainment of bachelor's degree have the lowest fertility at 34.0 births per 1,000 women. Women with the education attainment of college or associate's degree represent 53.6% of all women with births.
| Educational Attainment | Women with Births | Births / 1,000 Women |
| Less than High School | 22 (15.9%) | 107.0 |
| High School Diploma | 27 (19.6%) | 127.0 |
| College or Associate's Degree | 74 (53.6%) | 154.0 |
| Bachelor's Degree | 7 (5.1%) | 34.0 |
| Graduate Degree | 8 (5.8%) | 82.0 |
| Total | 138 (100.0%) | 115.0 |
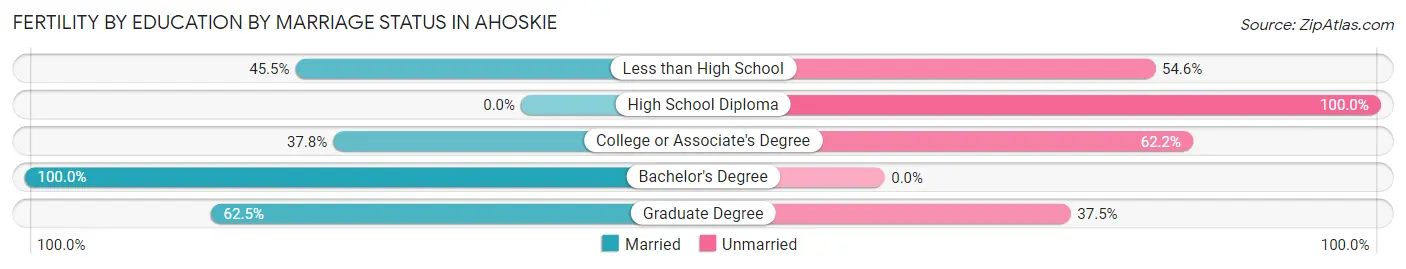
Fertility by Education by Marriage Status in Ahoskie
63.8% of women with births in Ahoskie are unmarried. Women with the educational attainment of bachelor's degree are most likely to be married with 100.0% of them married at childbirth, while women with the educational attainment of high school diploma are least likely to be married with 100.0% of them unmarried at childbirth.
| Educational Attainment | Married | Unmarried |
| Less than High School | 10 (45.5%) | 12 (54.5%) |
| High School Diploma | 0 (0.0%) | 27 (100.0%) |
| College or Associate's Degree | 28 (37.8%) | 46 (62.2%) |
| Bachelor's Degree | 7 (100.0%) | 0 (0.0%) |
| Graduate Degree | 5 (62.5%) | 3 (37.5%) |
| Total | 50 (36.2%) | 88 (63.8%) |
Income in Ahoskie
Income Overview in Ahoskie
Per Capita Income in Ahoskie is $23,170, while median incomes of families and households are $47,679 and $38,063 respectively.
| Characteristic | Number | Measure |
| Per Capita Income | 4,841 | $23,170 |
| Median Family Income | 1,094 | $47,679 |
| Mean Family Income | 1,094 | $68,784 |
| Median Household Income | 1,994 | $38,063 |
| Mean Household Income | 1,994 | $53,092 |
| Income Deficit | 1,094 | $13,422 |
| Wage / Income Gap (%) | 4,841 | 30.77% |
| Wage / Income Gap ($) | 4,841 | 69.23¢ per $1 |
| Gini / Inequality Index | 4,841 | 0.49 |
Earnings by Sex in Ahoskie
Average Earnings in Ahoskie are $32,443, $39,709 for men and $27,491 for women, a difference of 30.8%.
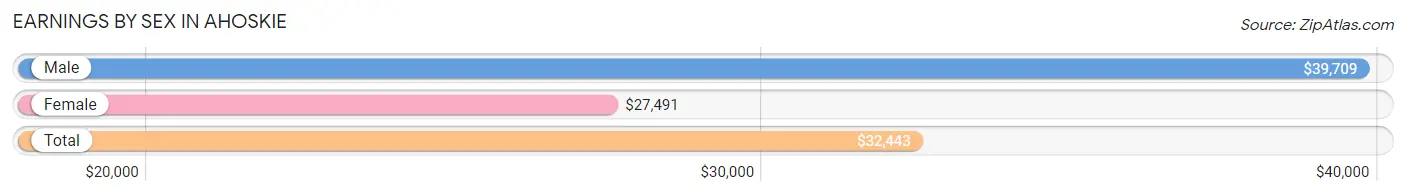
| Sex | Number | Average Earnings |
| Male | 791 (40.0%) | $39,709 |
| Female | 1,187 (60.0%) | $27,491 |
| Total | 1,978 (100.0%) | $32,443 |
Earnings by Sex by Income Bracket in Ahoskie
The most common earnings brackets in Ahoskie are $55,000 to $64,999 for men (100 | 12.6%) and $25,000 to $29,999 for women (205 | 17.3%).
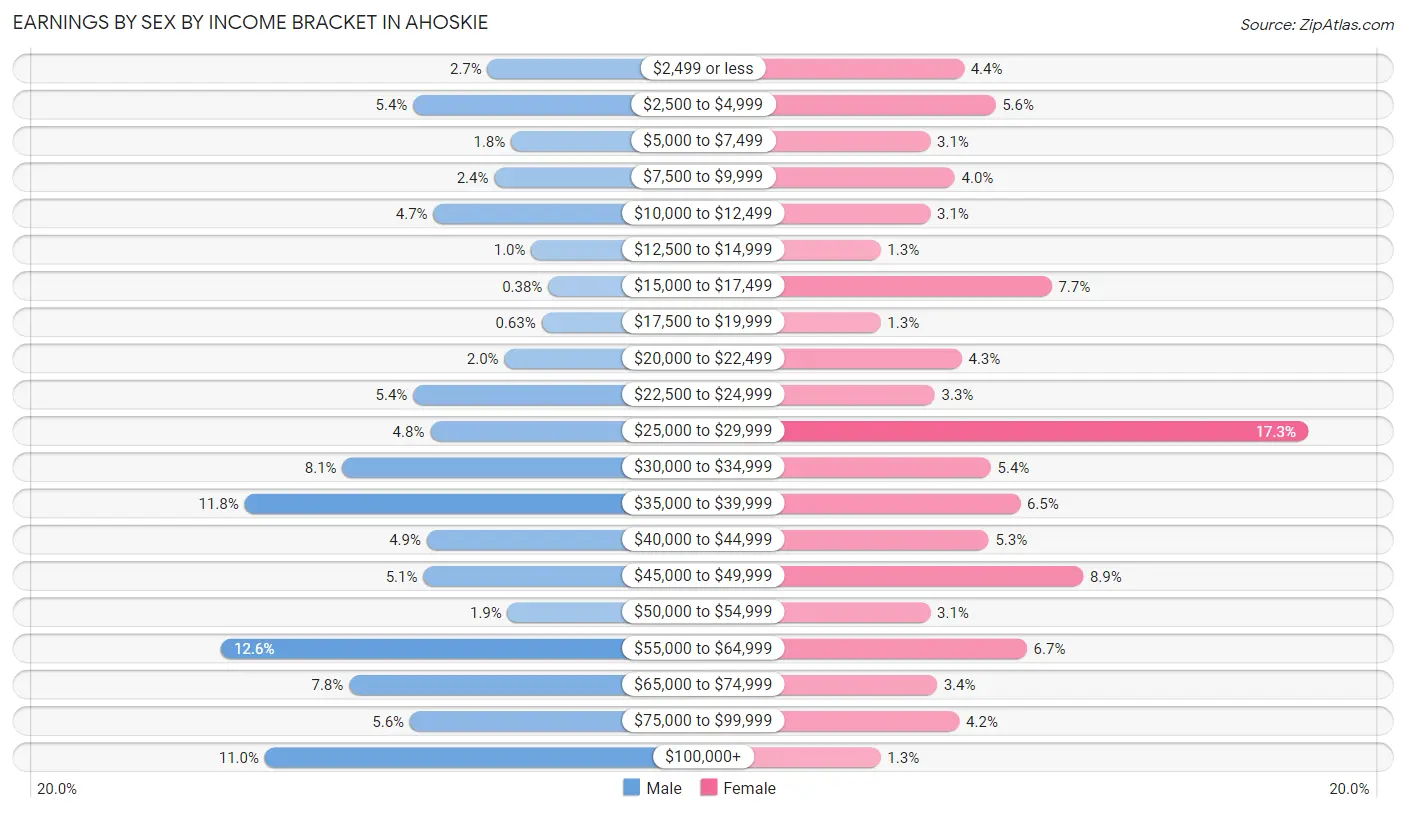
| Income | Male | Female |
| $2,499 or less | 21 (2.6%) | 52 (4.4%) |
| $2,500 to $4,999 | 43 (5.4%) | 66 (5.6%) |
| $5,000 to $7,499 | 14 (1.8%) | 37 (3.1%) |
| $7,500 to $9,999 | 19 (2.4%) | 48 (4.0%) |
| $10,000 to $12,499 | 37 (4.7%) | 37 (3.1%) |
| $12,500 to $14,999 | 8 (1.0%) | 15 (1.3%) |
| $15,000 to $17,499 | 3 (0.4%) | 91 (7.7%) |
| $17,500 to $19,999 | 5 (0.6%) | 15 (1.3%) |
| $20,000 to $22,499 | 16 (2.0%) | 51 (4.3%) |
| $22,500 to $24,999 | 43 (5.4%) | 39 (3.3%) |
| $25,000 to $29,999 | 38 (4.8%) | 205 (17.3%) |
| $30,000 to $34,999 | 64 (8.1%) | 64 (5.4%) |
| $35,000 to $39,999 | 93 (11.8%) | 77 (6.5%) |
| $40,000 to $44,999 | 39 (4.9%) | 63 (5.3%) |
| $45,000 to $49,999 | 40 (5.1%) | 105 (8.8%) |
| $50,000 to $54,999 | 15 (1.9%) | 37 (3.1%) |
| $55,000 to $64,999 | 100 (12.6%) | 80 (6.7%) |
| $65,000 to $74,999 | 62 (7.8%) | 40 (3.4%) |
| $75,000 to $99,999 | 44 (5.6%) | 50 (4.2%) |
| $100,000+ | 87 (11.0%) | 15 (1.3%) |
| Total | 791 (100.0%) | 1,187 (100.0%) |
Earnings by Sex by Educational Attainment in Ahoskie
Average earnings in Ahoskie are $43,472 for men and $28,873 for women, a difference of 33.6%. Men with an educational attainment of graduate degree enjoy the highest average annual earnings of $74,931, while those with less than high school education earn the least with $34,464. Women with an educational attainment of graduate degree earn the most with the average annual earnings of $56,534, while those with less than high school education have the smallest earnings of $16,912.
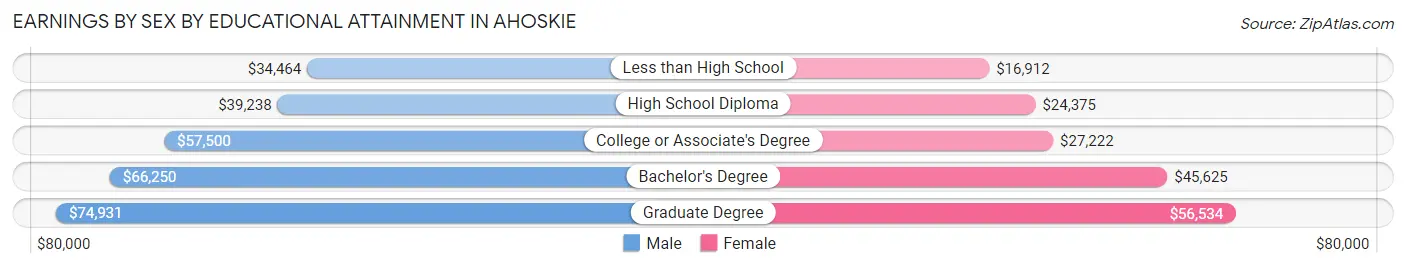
| Educational Attainment | Male Income | Female Income |
| Less than High School | $34,464 | $16,912 |
| High School Diploma | $39,238 | $24,375 |
| College or Associate's Degree | $57,500 | $27,222 |
| Bachelor's Degree | $66,250 | $45,625 |
| Graduate Degree | $74,931 | $56,534 |
| Total | $43,472 | $28,873 |
Family Income in Ahoskie
Family Income Brackets in Ahoskie
According to the Ahoskie family income data, there are 190 families falling into the $35,000 to $49,999 income range, which is the most common income bracket and makes up 17.4% of all families. Conversely, the $10,000 to $14,999 income bracket is the least frequent group with only 31 families (2.8%) belonging to this category.
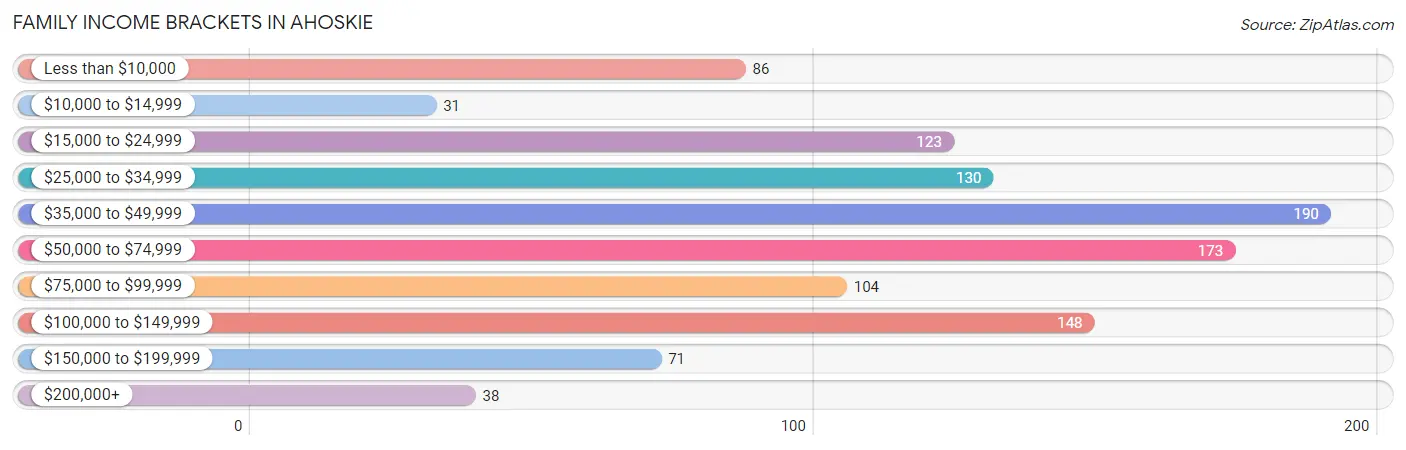
| Income Bracket | # Families | % Families |
| Less than $10,000 | 86 | 7.9% |
| $10,000 to $14,999 | 31 | 2.8% |
| $15,000 to $24,999 | 123 | 11.2% |
| $25,000 to $34,999 | 130 | 11.9% |
| $35,000 to $49,999 | 190 | 17.4% |
| $50,000 to $74,999 | 173 | 15.8% |
| $75,000 to $99,999 | 104 | 9.5% |
| $100,000 to $149,999 | 148 | 13.5% |
| $150,000 to $199,999 | 71 | 6.5% |
| $200,000+ | 38 | 3.5% |
Family Income by Famaliy Size in Ahoskie
5-person families (117 | 10.7%) account for the highest median family income in Ahoskie with $155,625 per family, while 5-person families (117 | 10.7%) have the highest median income of $31,125 per family member.
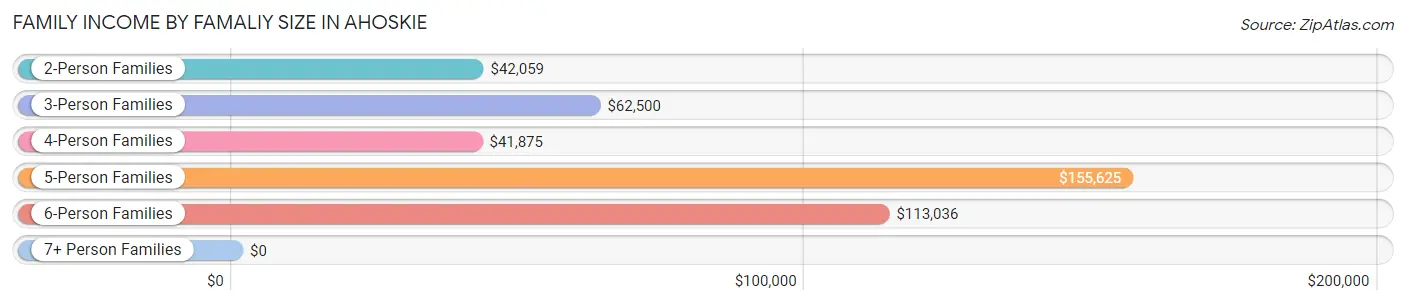
| Income Bracket | # Families | Median Income |
| 2-Person Families | 514 (47.0%) | $42,059 |
| 3-Person Families | 254 (23.2%) | $62,500 |
| 4-Person Families | 163 (14.9%) | $41,875 |
| 5-Person Families | 117 (10.7%) | $155,625 |
| 6-Person Families | 13 (1.2%) | $113,036 |
| 7+ Person Families | 33 (3.0%) | $0 |
| Total | 1,094 (100.0%) | $47,679 |
Family Income by Number of Earners in Ahoskie
The median family income in Ahoskie is $47,679, with families comprising 3+ earners (55) having the highest median family income of $111,964, while families with no earners (150) have the lowest median family income of $23,438, accounting for 5.0% and 13.7% of families, respectively.
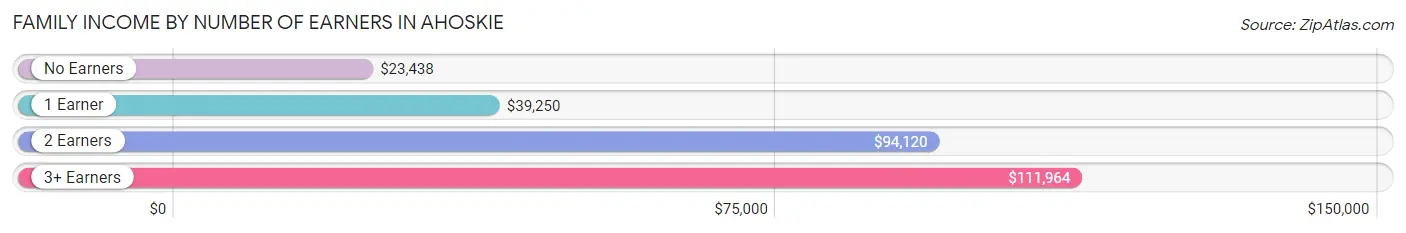
| Number of Earners | # Families | Median Income |
| No Earners | 150 (13.7%) | $23,438 |
| 1 Earner | 526 (48.1%) | $39,250 |
| 2 Earners | 363 (33.2%) | $94,120 |
| 3+ Earners | 55 (5.0%) | $111,964 |
| Total | 1,094 (100.0%) | $47,679 |
Household Income in Ahoskie
Household Income Brackets in Ahoskie
With 315 households falling in the category, the $50,000 to $74,999 income range is the most frequent in Ahoskie, accounting for 15.8% of all households. In contrast, only 42 households (2.1%) fall into the $200,000+ income bracket, making it the least populous group.
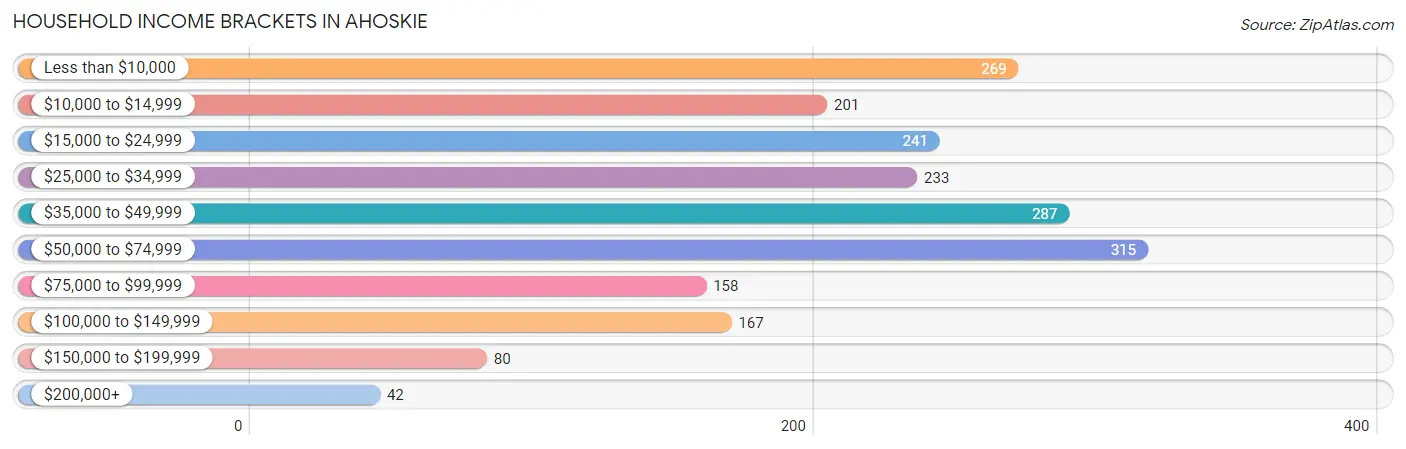
| Income Bracket | # Households | % Households |
| Less than $10,000 | 269 | 13.5% |
| $10,000 to $14,999 | 201 | 10.1% |
| $15,000 to $24,999 | 241 | 12.1% |
| $25,000 to $34,999 | 233 | 11.7% |
| $35,000 to $49,999 | 287 | 14.4% |
| $50,000 to $74,999 | 315 | 15.8% |
| $75,000 to $99,999 | 158 | 7.9% |
| $100,000 to $149,999 | 167 | 8.4% |
| $150,000 to $199,999 | 80 | 4.0% |
| $200,000+ | 42 | 2.1% |
Household Income by Householder Age in Ahoskie
The median household income in Ahoskie is $38,063, with the highest median household income of $51,146 found in the 45 to 64 years age bracket for the primary householder. A total of 763 households (38.3%) fall into this category. Meanwhile, the 65+ years age bracket for the primary householder has the lowest median household income of $28,125, with 554 households (27.8%) in this group.
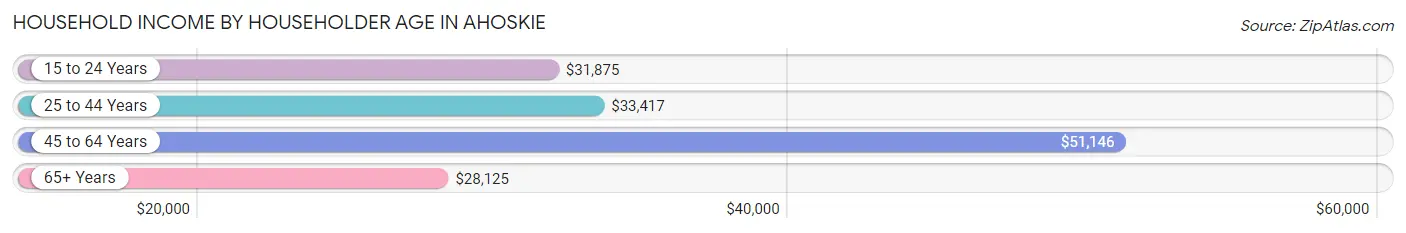
| Income Bracket | # Households | Median Income |
| 15 to 24 Years | 68 (3.4%) | $31,875 |
| 25 to 44 Years | 609 (30.5%) | $33,417 |
| 45 to 64 Years | 763 (38.3%) | $51,146 |
| 65+ Years | 554 (27.8%) | $28,125 |
| Total | 1,994 (100.0%) | $38,063 |
Poverty in Ahoskie
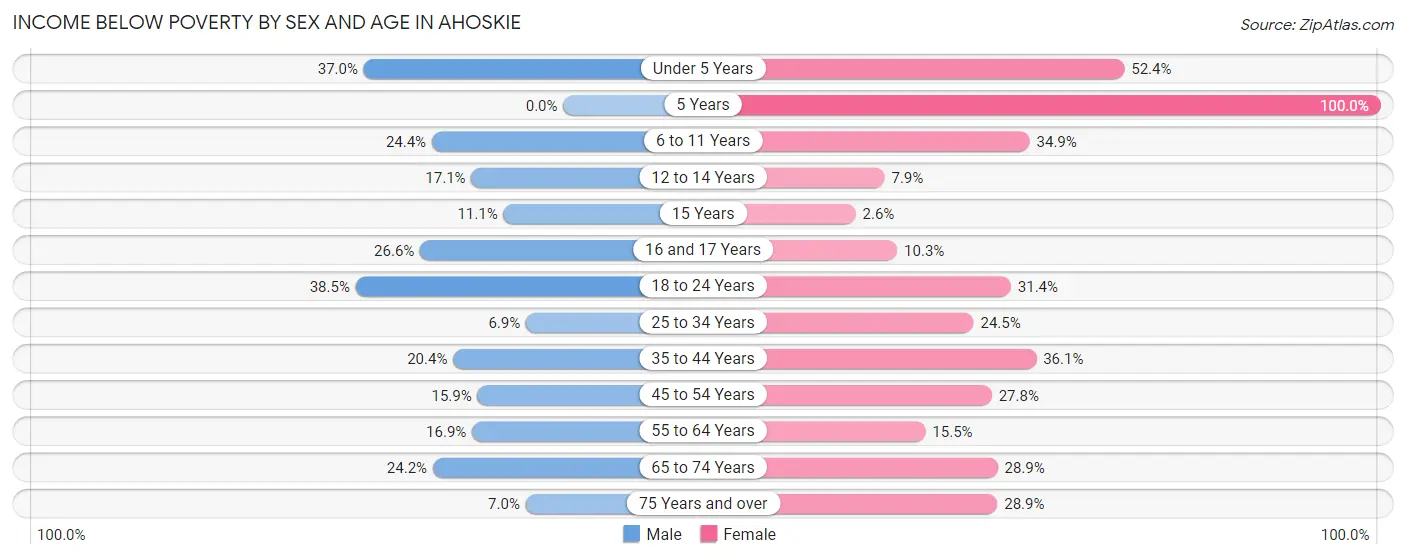
Income Below Poverty by Sex and Age in Ahoskie
With 20.7% poverty level for males and 26.2% for females among the residents of Ahoskie, 18 to 24 year old males and 5 year old females are the most vulnerable to poverty, with 74 males (38.5%) and 15 females (100.0%) in their respective age groups living below the poverty level.
| Age Bracket | Male | Female |
| Under 5 Years | 60 (37.0%) | 43 (52.4%) |
| 5 Years | 0 (0.0%) | 15 (100.0%) |
| 6 to 11 Years | 30 (24.4%) | 61 (34.9%) |
| 12 to 14 Years | 14 (17.1%) | 13 (7.9%) |
| 15 Years | 7 (11.1%) | 1 (2.6%) |
| 16 and 17 Years | 21 (26.6%) | 11 (10.3%) |
| 18 to 24 Years | 74 (38.5%) | 59 (31.4%) |
| 25 to 34 Years | 16 (6.9%) | 91 (24.5%) |
| 35 to 44 Years | 46 (20.4%) | 109 (36.1%) |
| 45 to 54 Years | 29 (15.9%) | 91 (27.8%) |
| 55 to 64 Years | 53 (16.9%) | 61 (15.5%) |
| 65 to 74 Years | 46 (24.2%) | 72 (28.9%) |
| 75 Years and over | 6 (7.0%) | 58 (28.9%) |
| Total | 402 (20.7%) | 685 (26.2%) |
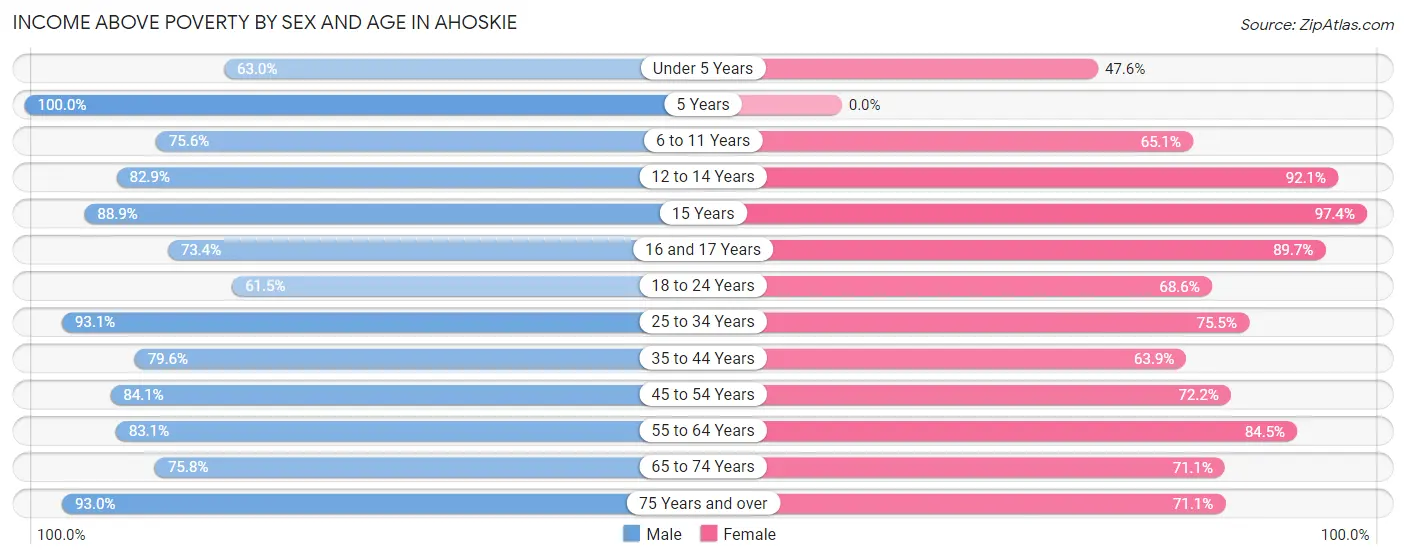
Income Above Poverty by Sex and Age in Ahoskie
According to the poverty statistics in Ahoskie, males aged 5 years and females aged 15 years are the age groups that are most secure financially, with 100.0% of males and 97.4% of females in these age groups living above the poverty line.
| Age Bracket | Male | Female |
| Under 5 Years | 102 (63.0%) | 39 (47.6%) |
| 5 Years | 12 (100.0%) | 0 (0.0%) |
| 6 to 11 Years | 93 (75.6%) | 114 (65.1%) |
| 12 to 14 Years | 68 (82.9%) | 151 (92.1%) |
| 15 Years | 56 (88.9%) | 38 (97.4%) |
| 16 and 17 Years | 58 (73.4%) | 96 (89.7%) |
| 18 to 24 Years | 118 (61.5%) | 129 (68.6%) |
| 25 to 34 Years | 215 (93.1%) | 281 (75.5%) |
| 35 to 44 Years | 179 (79.6%) | 193 (63.9%) |
| 45 to 54 Years | 153 (84.1%) | 236 (72.2%) |
| 55 to 64 Years | 260 (83.1%) | 332 (84.5%) |
| 65 to 74 Years | 144 (75.8%) | 177 (71.1%) |
| 75 Years and over | 80 (93.0%) | 143 (71.1%) |
| Total | 1,538 (79.3%) | 1,929 (73.8%) |
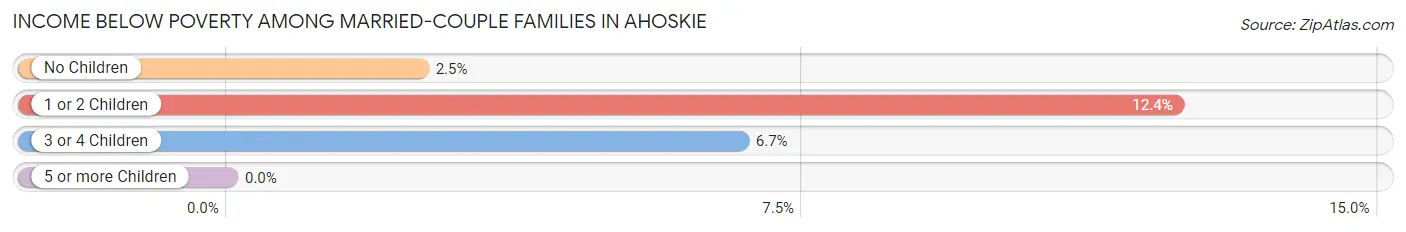
Income Below Poverty Among Married-Couple Families in Ahoskie
The poverty statistics for married-couple families in Ahoskie show that 4.8% or 25 of the total 523 families live below the poverty line. Families with 1 or 2 children have the highest poverty rate of 12.4%, comprising of 11 families. On the other hand, families with 5 or more children have the lowest poverty rate of 0.0%, which includes 0 families.
| Children | Above Poverty | Below Poverty |
| No Children | 313 (97.5%) | 8 (2.5%) |
| 1 or 2 Children | 78 (87.6%) | 11 (12.4%) |
| 3 or 4 Children | 84 (93.3%) | 6 (6.7%) |
| 5 or more Children | 23 (100.0%) | 0 (0.0%) |
| Total | 498 (95.2%) | 25 (4.8%) |
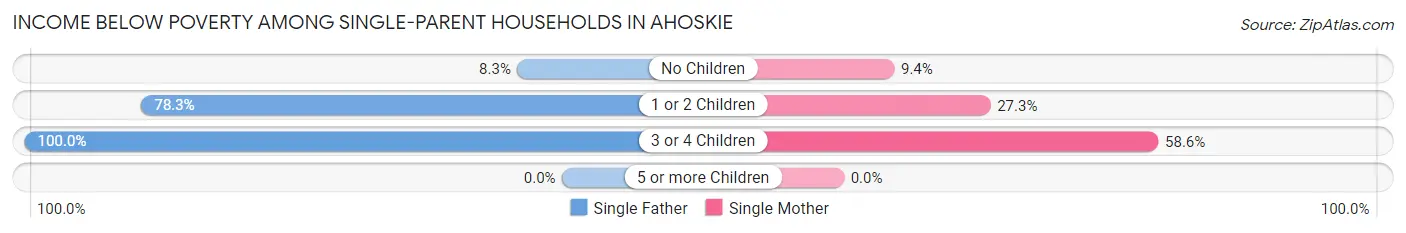
Income Below Poverty Among Single-Parent Households in Ahoskie
According to the poverty data in Ahoskie, 54.2% or 32 single-father households and 26.0% or 133 single-mother households are living below the poverty line. Among single-father households, those with 3 or 4 children have the highest poverty rate, with 12 households (100.0%) experiencing poverty. Likewise, among single-mother households, those with 3 or 4 children have the highest poverty rate, with 41 households (58.6%) falling below the poverty line.
| Children | Single Father | Single Mother |
| No Children | 2 (8.3%) | 15 (9.4%) |
| 1 or 2 Children | 18 (78.3%) | 77 (27.3%) |
| 3 or 4 Children | 12 (100.0%) | 41 (58.6%) |
| 5 or more Children | 0 (0.0%) | 0 (0.0%) |
| Total | 32 (54.2%) | 133 (26.0%) |
Income Below Poverty Among Married-Couple vs Single-Parent Households in Ahoskie
The poverty data for Ahoskie shows that 25 of the married-couple family households (4.8%) and 165 of the single-parent households (28.9%) are living below the poverty level. Within the married-couple family households, those with 1 or 2 children have the highest poverty rate, with 11 households (12.4%) falling below the poverty line. Among the single-parent households, those with 3 or 4 children have the highest poverty rate, with 53 household (64.6%) living below poverty.
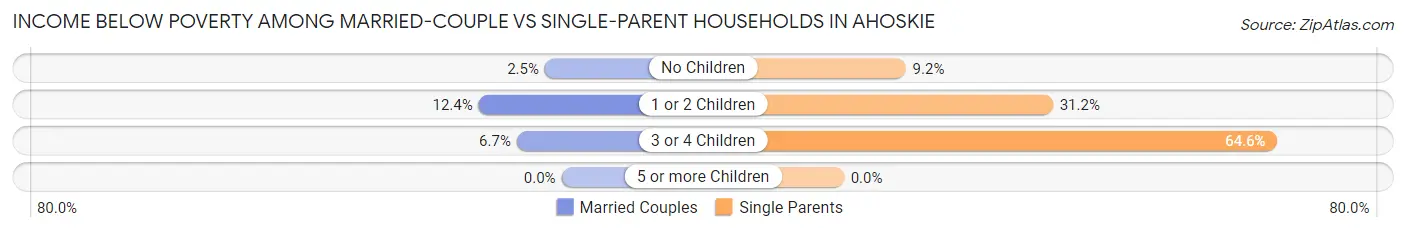
| Children | Married-Couple Families | Single-Parent Households |
| No Children | 8 (2.5%) | 17 (9.2%) |
| 1 or 2 Children | 11 (12.4%) | 95 (31.1%) |
| 3 or 4 Children | 6 (6.7%) | 53 (64.6%) |
| 5 or more Children | 0 (0.0%) | 0 (0.0%) |
| Total | 25 (4.8%) | 165 (28.9%) |
Employment Characteristics in Ahoskie
Employment by Class of Employer in Ahoskie
Among the 1,741 employed individuals in Ahoskie, private company employees (932 | 53.5%), state government employees (249 | 14.3%), and not-for-profit organizations (206 | 11.8%) make up the most common classes of employment.
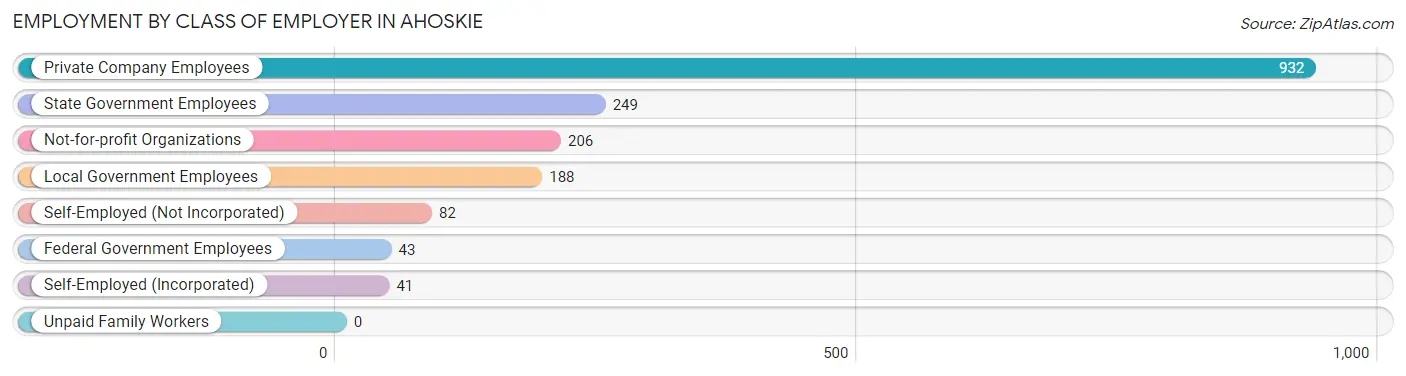
| Employer Class | # Employees | % Employees |
| Private Company Employees | 932 | 53.5% |
| Self-Employed (Incorporated) | 41 | 2.4% |
| Self-Employed (Not Incorporated) | 82 | 4.7% |
| Not-for-profit Organizations | 206 | 11.8% |
| Local Government Employees | 188 | 10.8% |
| State Government Employees | 249 | 14.3% |
| Federal Government Employees | 43 | 2.5% |
| Unpaid Family Workers | 0 | 0.0% |
| Total | 1,741 | 100.0% |
Employment Status by Age in Ahoskie
According to the labor force statistics for Ahoskie, out of the total population over 16 years of age (3,884), 52.6% or 2,043 individuals are in the labor force, with 11.9% or 243 of them unemployed. The age group with the highest labor force participation rate is 20 to 24 years, with 77.0% or 174 individuals in the labor force. Within the labor force, the 16 to 19 years age range has the highest percentage of unemployed individuals, with 59.0% or 69 of them being unemployed.
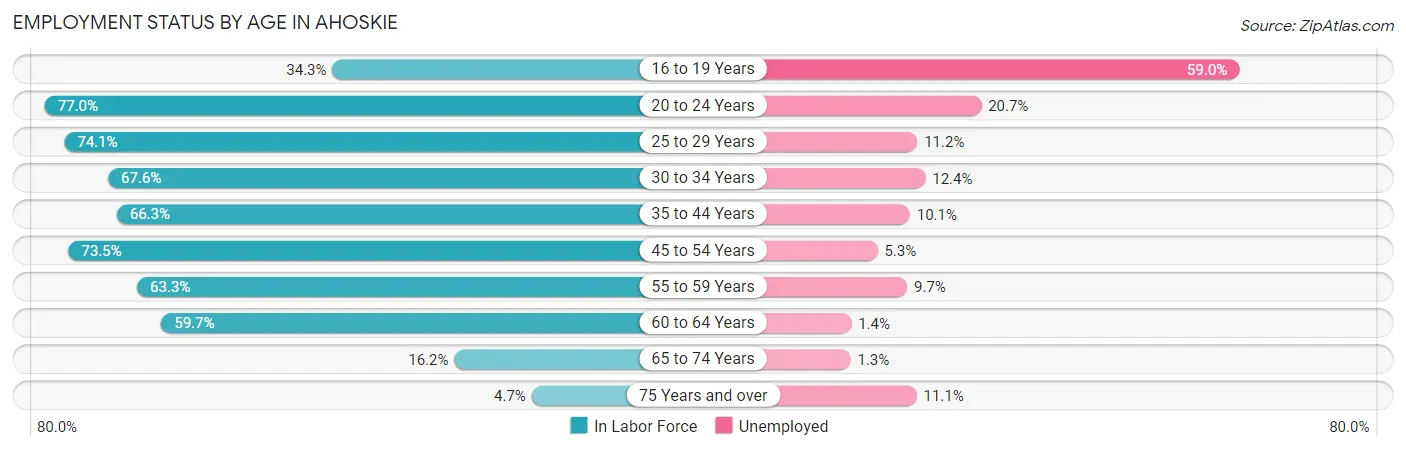
| Age Bracket | In Labor Force | Unemployed |
| 16 to 19 Years | 117 (34.3%) | 69 (59.0%) |
| 20 to 24 Years | 174 (77.0%) | 36 (20.7%) |
| 25 to 29 Years | 232 (74.1%) | 26 (11.2%) |
| 30 to 34 Years | 217 (67.6%) | 27 (12.4%) |
| 35 to 44 Years | 358 (66.3%) | 36 (10.1%) |
| 45 to 54 Years | 393 (73.5%) | 21 (5.3%) |
| 55 to 59 Years | 236 (63.3%) | 23 (9.7%) |
| 60 to 64 Years | 219 (59.7%) | 3 (1.4%) |
| 65 to 74 Years | 79 (16.2%) | 1 (1.3%) |
| 75 Years and over | 18 (4.7%) | 2 (11.1%) |
| Total | 2,043 (52.6%) | 243 (11.9%) |
Employment Status by Educational Attainment in Ahoskie
According to labor force statistics for Ahoskie, 67.6% of individuals (1,656) out of the total population between 25 and 64 years of age (2,449) are in the labor force, with 8.2% or 136 of them being unemployed. The group with the highest labor force participation rate are those with the educational attainment of bachelor's degree or higher, with 75.4% or 448 individuals in the labor force. Within the labor force, individuals with less than high school education have the highest percentage of unemployment, with 25.8% or 39 of them being unemployed.
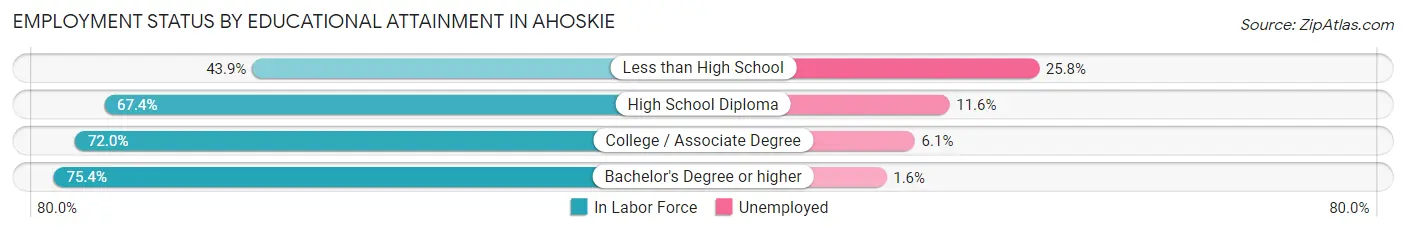
| Educational Attainment | In Labor Force | Unemployed |
| Less than High School | 151 (43.9%) | 89 (25.8%) |
| High School Diploma | 467 (67.4%) | 80 (11.6%) |
| College / Associate Degree | 589 (72.0%) | 50 (6.1%) |
| Bachelor's Degree or higher | 448 (75.4%) | 10 (1.6%) |
| Total | 1,656 (67.6%) | 201 (8.2%) |
Employment Occupations by Sex in Ahoskie
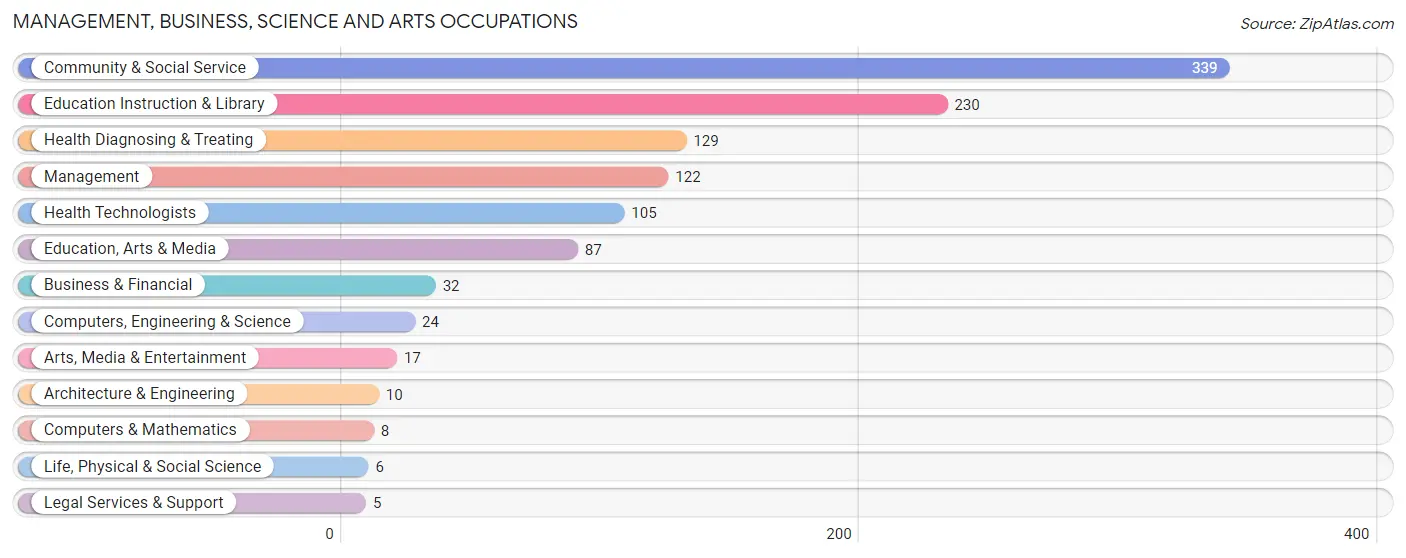
Management, Business, Science and Arts Occupations
The most common Management, Business, Science and Arts occupations in Ahoskie are Community & Social Service (339 | 18.8%), Education Instruction & Library (230 | 12.8%), Health Diagnosing & Treating (129 | 7.2%), Management (122 | 6.8%), and Health Technologists (105 | 5.8%).
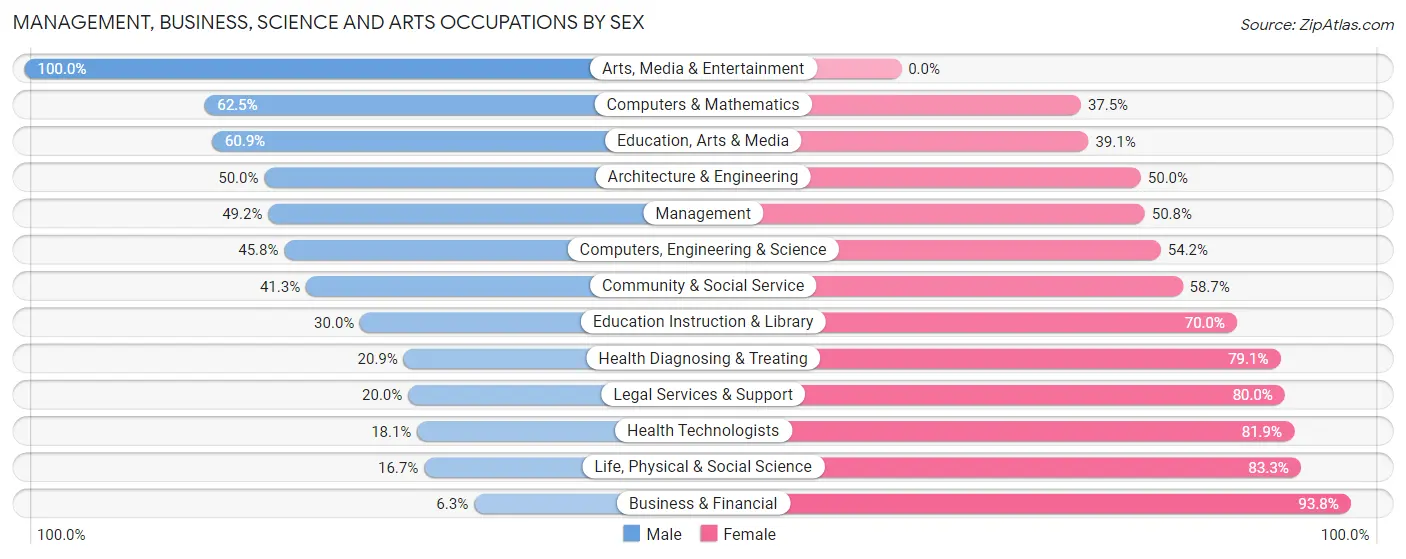
Management, Business, Science and Arts Occupations by Sex
Within the Management, Business, Science and Arts occupations in Ahoskie, the most male-oriented occupations are Arts, Media & Entertainment (100.0%), Computers & Mathematics (62.5%), and Education, Arts & Media (60.9%), while the most female-oriented occupations are Business & Financial (93.8%), Life, Physical & Social Science (83.3%), and Health Technologists (81.9%).
| Occupation | Male | Female |
| Management | 60 (49.2%) | 62 (50.8%) |
| Business & Financial | 2 (6.2%) | 30 (93.8%) |
| Computers, Engineering & Science | 11 (45.8%) | 13 (54.2%) |
| Computers & Mathematics | 5 (62.5%) | 3 (37.5%) |
| Architecture & Engineering | 5 (50.0%) | 5 (50.0%) |
| Life, Physical & Social Science | 1 (16.7%) | 5 (83.3%) |
| Community & Social Service | 140 (41.3%) | 199 (58.7%) |
| Education, Arts & Media | 53 (60.9%) | 34 (39.1%) |
| Legal Services & Support | 1 (20.0%) | 4 (80.0%) |
| Education Instruction & Library | 69 (30.0%) | 161 (70.0%) |
| Arts, Media & Entertainment | 17 (100.0%) | 0 (0.0%) |
| Health Diagnosing & Treating | 27 (20.9%) | 102 (79.1%) |
| Health Technologists | 19 (18.1%) | 86 (81.9%) |
| Total (Category) | 240 (37.1%) | 406 (62.8%) |
| Total (Overall) | 715 (39.7%) | 1,084 (60.3%) |
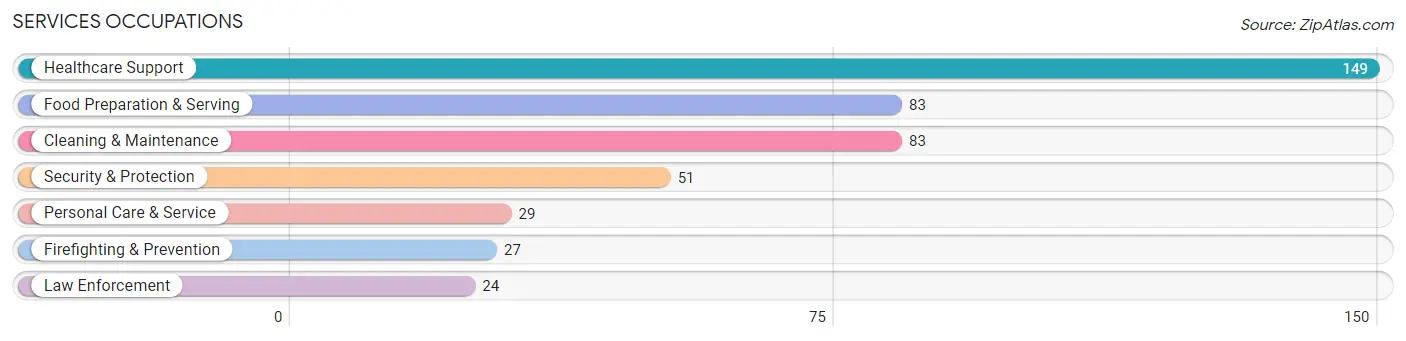
Services Occupations
The most common Services occupations in Ahoskie are Healthcare Support (149 | 8.3%), Food Preparation & Serving (83 | 4.6%), Cleaning & Maintenance (83 | 4.6%), Security & Protection (51 | 2.8%), and Personal Care & Service (29 | 1.6%).
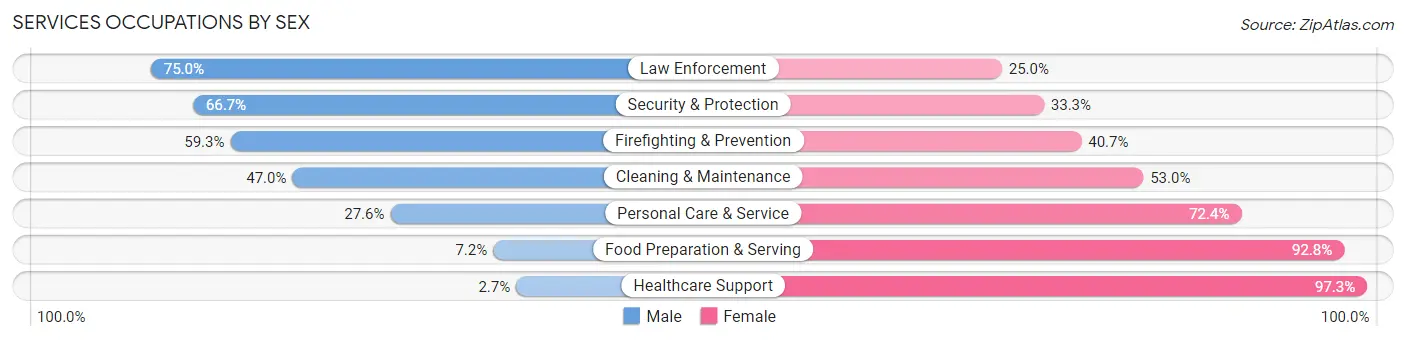
Services Occupations by Sex
Within the Services occupations in Ahoskie, the most male-oriented occupations are Law Enforcement (75.0%), Security & Protection (66.7%), and Firefighting & Prevention (59.3%), while the most female-oriented occupations are Healthcare Support (97.3%), Food Preparation & Serving (92.8%), and Personal Care & Service (72.4%).
| Occupation | Male | Female |
| Healthcare Support | 4 (2.7%) | 145 (97.3%) |
| Security & Protection | 34 (66.7%) | 17 (33.3%) |
| Firefighting & Prevention | 16 (59.3%) | 11 (40.7%) |
| Law Enforcement | 18 (75.0%) | 6 (25.0%) |
| Food Preparation & Serving | 6 (7.2%) | 77 (92.8%) |
| Cleaning & Maintenance | 39 (47.0%) | 44 (53.0%) |
| Personal Care & Service | 8 (27.6%) | 21 (72.4%) |
| Total (Category) | 91 (23.0%) | 304 (77.0%) |
| Total (Overall) | 715 (39.7%) | 1,084 (60.3%) |
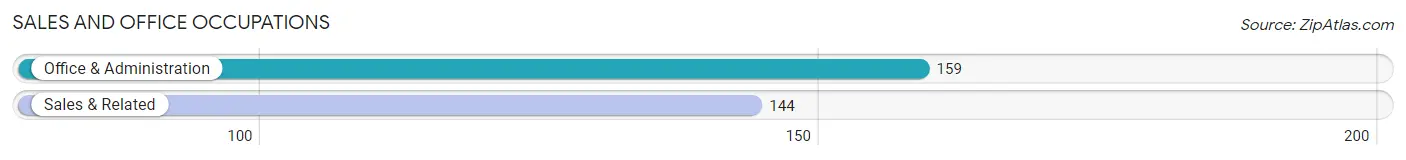
Sales and Office Occupations
The most common Sales and Office occupations in Ahoskie are Office & Administration (159 | 8.8%), and Sales & Related (144 | 8.0%).
Sales and Office Occupations by Sex
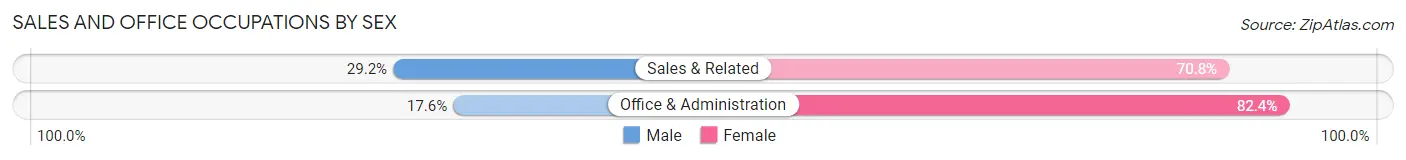
| Occupation | Male | Female |
| Sales & Related | 42 (29.2%) | 102 (70.8%) |
| Office & Administration | 28 (17.6%) | 131 (82.4%) |
| Total (Category) | 70 (23.1%) | 233 (76.9%) |
| Total (Overall) | 715 (39.7%) | 1,084 (60.3%) |
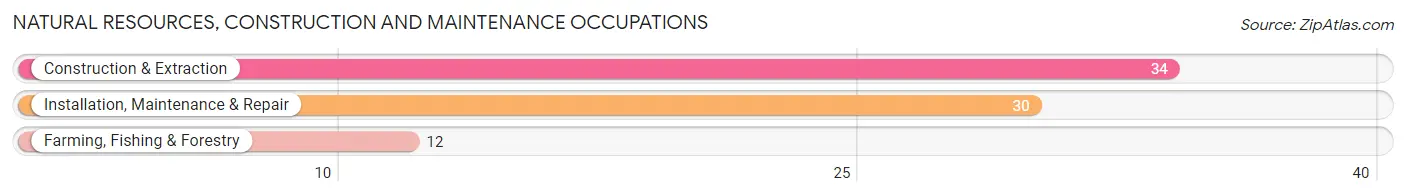
Natural Resources, Construction and Maintenance Occupations
The most common Natural Resources, Construction and Maintenance occupations in Ahoskie are Construction & Extraction (34 | 1.9%), Installation, Maintenance & Repair (30 | 1.7%), and Farming, Fishing & Forestry (12 | 0.7%).
Natural Resources, Construction and Maintenance Occupations by Sex
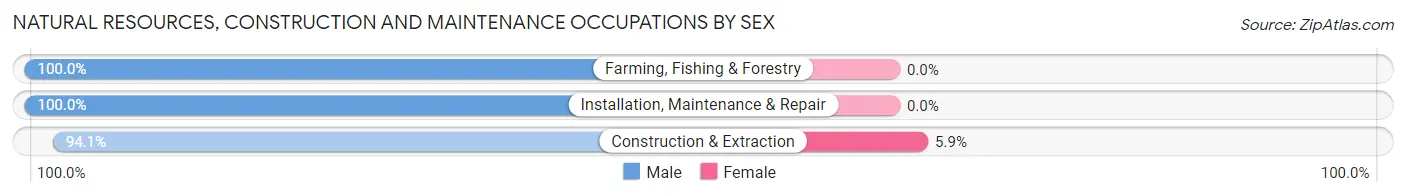
| Occupation | Male | Female |
| Farming, Fishing & Forestry | 12 (100.0%) | 0 (0.0%) |
| Construction & Extraction | 32 (94.1%) | 2 (5.9%) |
| Installation, Maintenance & Repair | 30 (100.0%) | 0 (0.0%) |
| Total (Category) | 74 (97.4%) | 2 (2.6%) |
| Total (Overall) | 715 (39.7%) | 1,084 (60.3%) |
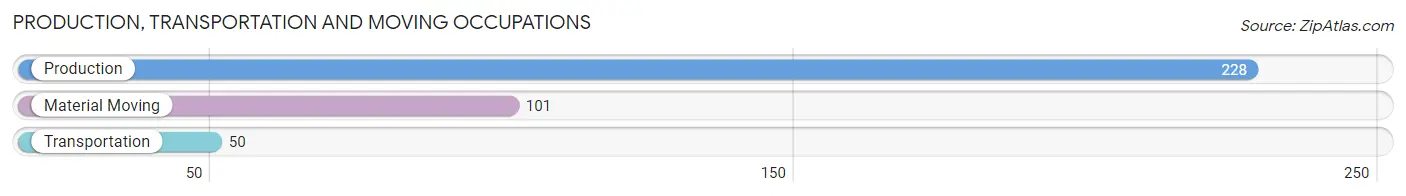
Production, Transportation and Moving Occupations
The most common Production, Transportation and Moving occupations in Ahoskie are Production (228 | 12.7%), Material Moving (101 | 5.6%), and Transportation (50 | 2.8%).
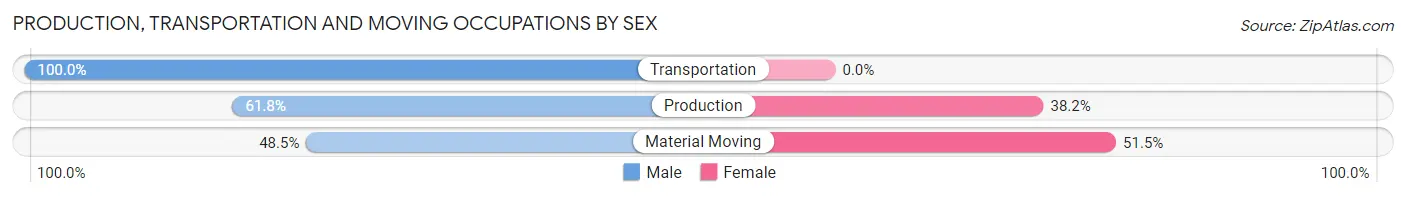
Production, Transportation and Moving Occupations by Sex
| Occupation | Male | Female |
| Production | 141 (61.8%) | 87 (38.2%) |
| Transportation | 50 (100.0%) | 0 (0.0%) |
| Material Moving | 49 (48.5%) | 52 (51.5%) |
| Total (Category) | 240 (63.3%) | 139 (36.7%) |
| Total (Overall) | 715 (39.7%) | 1,084 (60.3%) |
Employment Industries by Sex in Ahoskie
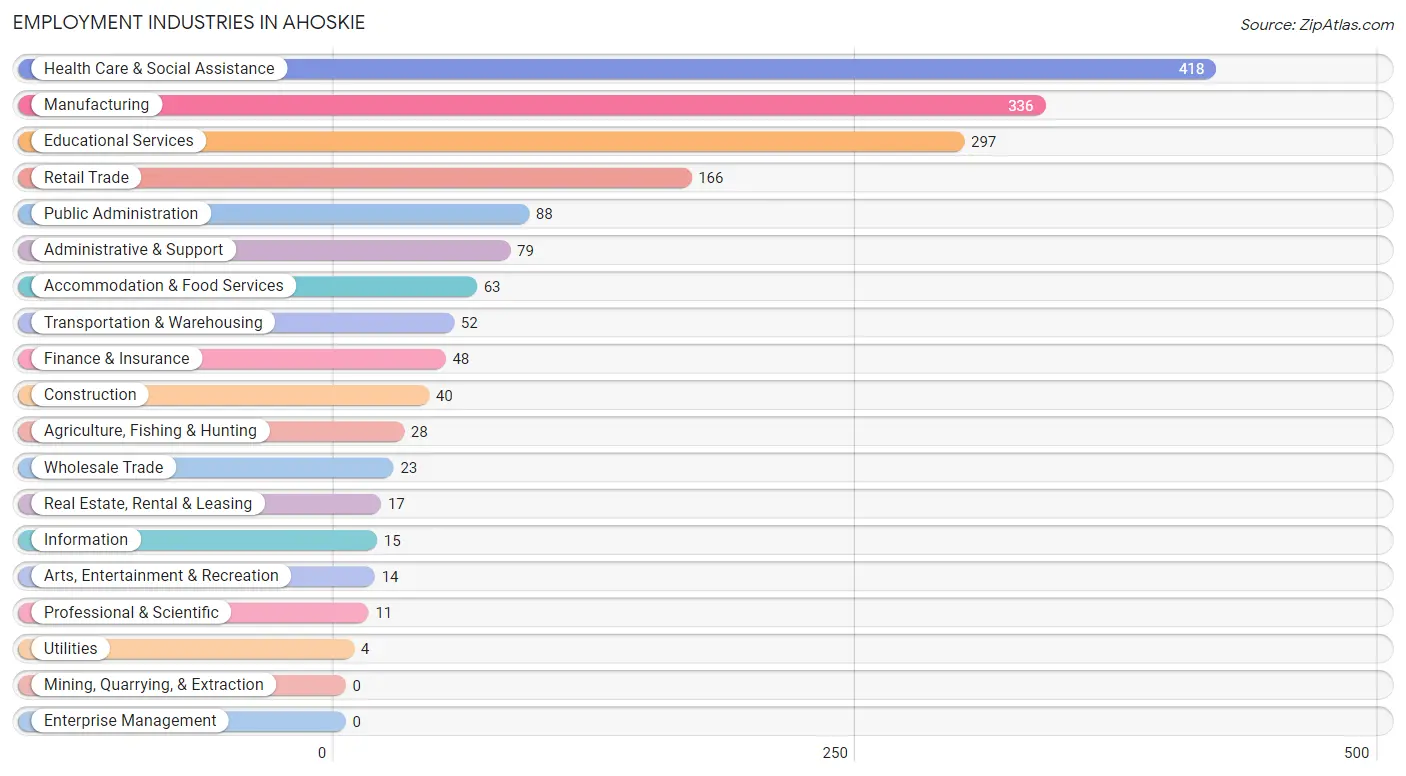
Employment Industries in Ahoskie
The major employment industries in Ahoskie include Health Care & Social Assistance (418 | 23.2%), Manufacturing (336 | 18.7%), Educational Services (297 | 16.5%), Retail Trade (166 | 9.2%), and Public Administration (88 | 4.9%).
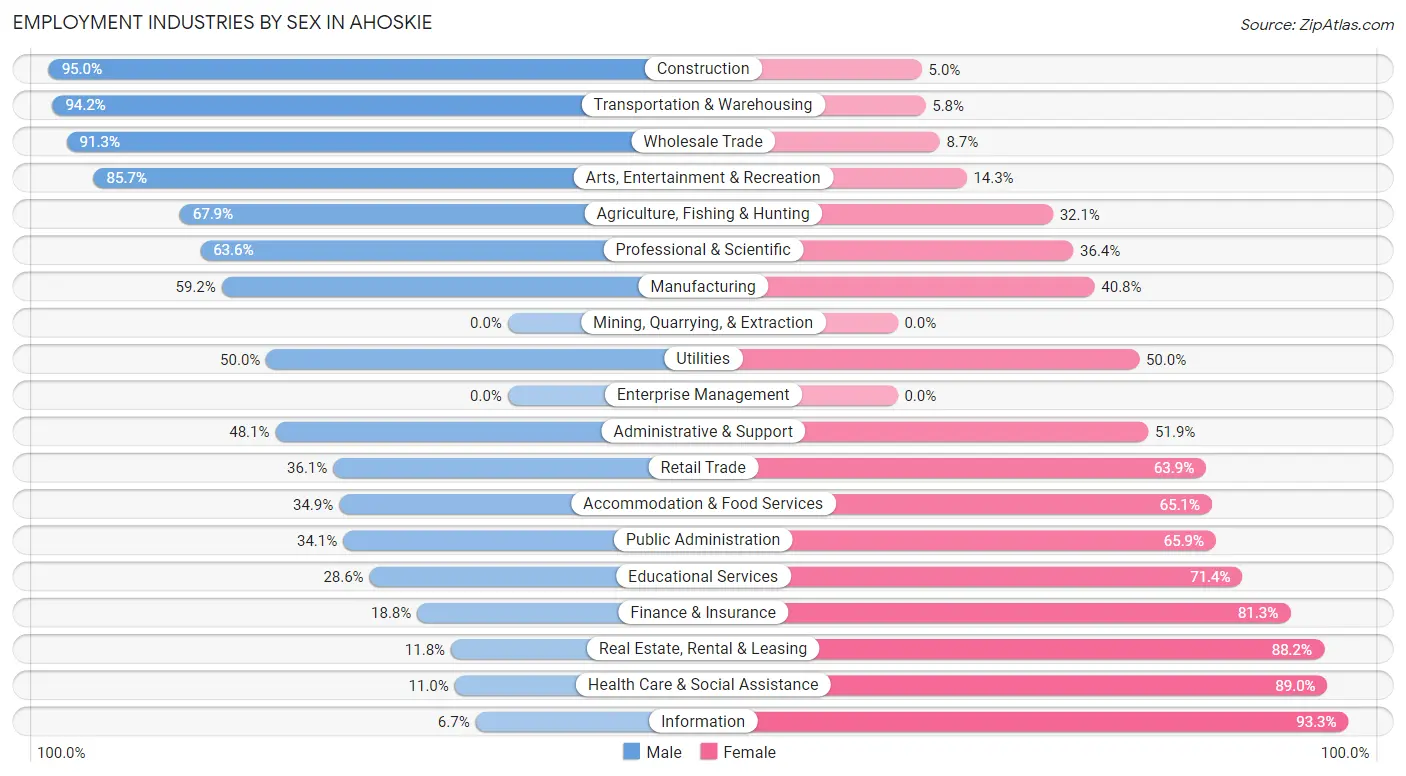
Employment Industries by Sex in Ahoskie
The Ahoskie industries that see more men than women are Construction (95.0%), Transportation & Warehousing (94.2%), and Wholesale Trade (91.3%), whereas the industries that tend to have a higher number of women are Information (93.3%), Health Care & Social Assistance (89.0%), and Real Estate, Rental & Leasing (88.2%).
| Industry | Male | Female |
| Agriculture, Fishing & Hunting | 19 (67.9%) | 9 (32.1%) |
| Mining, Quarrying, & Extraction | 0 (0.0%) | 0 (0.0%) |
| Construction | 38 (95.0%) | 2 (5.0%) |
| Manufacturing | 199 (59.2%) | 137 (40.8%) |
| Wholesale Trade | 21 (91.3%) | 2 (8.7%) |
| Retail Trade | 60 (36.1%) | 106 (63.9%) |
| Transportation & Warehousing | 49 (94.2%) | 3 (5.8%) |
| Utilities | 2 (50.0%) | 2 (50.0%) |
| Information | 1 (6.7%) | 14 (93.3%) |
| Finance & Insurance | 9 (18.8%) | 39 (81.2%) |
| Real Estate, Rental & Leasing | 2 (11.8%) | 15 (88.2%) |
| Professional & Scientific | 7 (63.6%) | 4 (36.4%) |
| Enterprise Management | 0 (0.0%) | 0 (0.0%) |
| Administrative & Support | 38 (48.1%) | 41 (51.9%) |
| Educational Services | 85 (28.6%) | 212 (71.4%) |
| Health Care & Social Assistance | 46 (11.0%) | 372 (89.0%) |
| Arts, Entertainment & Recreation | 12 (85.7%) | 2 (14.3%) |
| Accommodation & Food Services | 22 (34.9%) | 41 (65.1%) |
| Public Administration | 30 (34.1%) | 58 (65.9%) |
| Total | 715 (39.7%) | 1,084 (60.3%) |
Education in Ahoskie
School Enrollment in Ahoskie
The most common levels of schooling among the 1,187 students in Ahoskie are high school (385 | 32.4%), middle school (281 | 23.7%), and elementary school (203 | 17.1%).
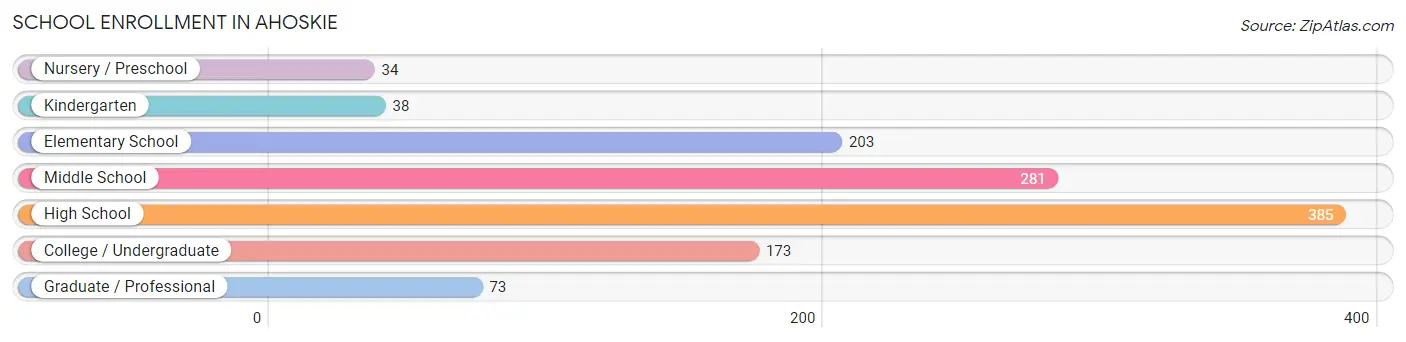
| School Level | # Students | % Students |
| Nursery / Preschool | 34 | 2.9% |
| Kindergarten | 38 | 3.2% |
| Elementary School | 203 | 17.1% |
| Middle School | 281 | 23.7% |
| High School | 385 | 32.4% |
| College / Undergraduate | 173 | 14.6% |
| Graduate / Professional | 73 | 6.1% |
| Total | 1,187 | 100.0% |
School Enrollment by Age by Funding Source in Ahoskie
Out of a total of 1,187 students who are enrolled in schools in Ahoskie, 108 (9.1%) attend a private institution, while the remaining 1,079 (90.9%) are enrolled in public schools. The age group of 25 to 34 year olds has the highest likelihood of being enrolled in private schools, with 30 (55.6% in the age bracket) enrolled. Conversely, the age group of 15 to 17 year olds has the lowest likelihood of being enrolled in a private school, with 272 (95.4% in the age bracket) attending a public institution.
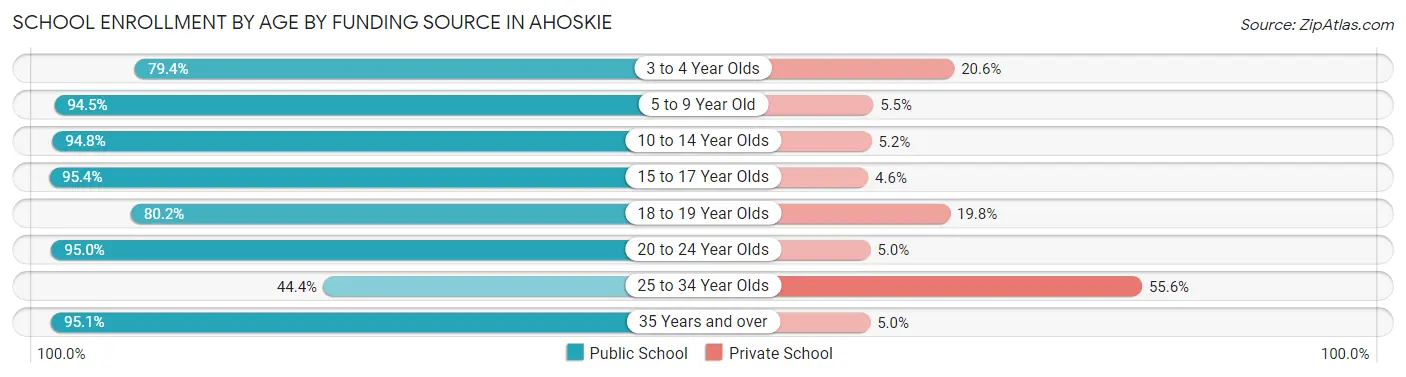
| Age Bracket | Public School | Private School |
| 3 to 4 Year Olds | 27 (79.4%) | 7 (20.6%) |
| 5 to 9 Year Old | 171 (94.5%) | 10 (5.5%) |
| 10 to 14 Year Olds | 366 (94.8%) | 20 (5.2%) |
| 15 to 17 Year Olds | 272 (95.4%) | 13 (4.6%) |
| 18 to 19 Year Olds | 85 (80.2%) | 21 (19.8%) |
| 20 to 24 Year Olds | 38 (95.0%) | 2 (5.0%) |
| 25 to 34 Year Olds | 24 (44.4%) | 30 (55.6%) |
| 35 Years and over | 96 (95.1%) | 5 (5.0%) |
| Total | 1,079 (90.9%) | 108 (9.1%) |
Educational Attainment by Field of Study in Ahoskie
Education (163 | 22.0%), arts & humanities (159 | 21.5%), business (111 | 15.0%), liberal arts & history (79 | 10.7%), and psychology (54 | 7.3%) are the most common fields of study among 741 individuals in Ahoskie who have obtained a bachelor's degree or higher.
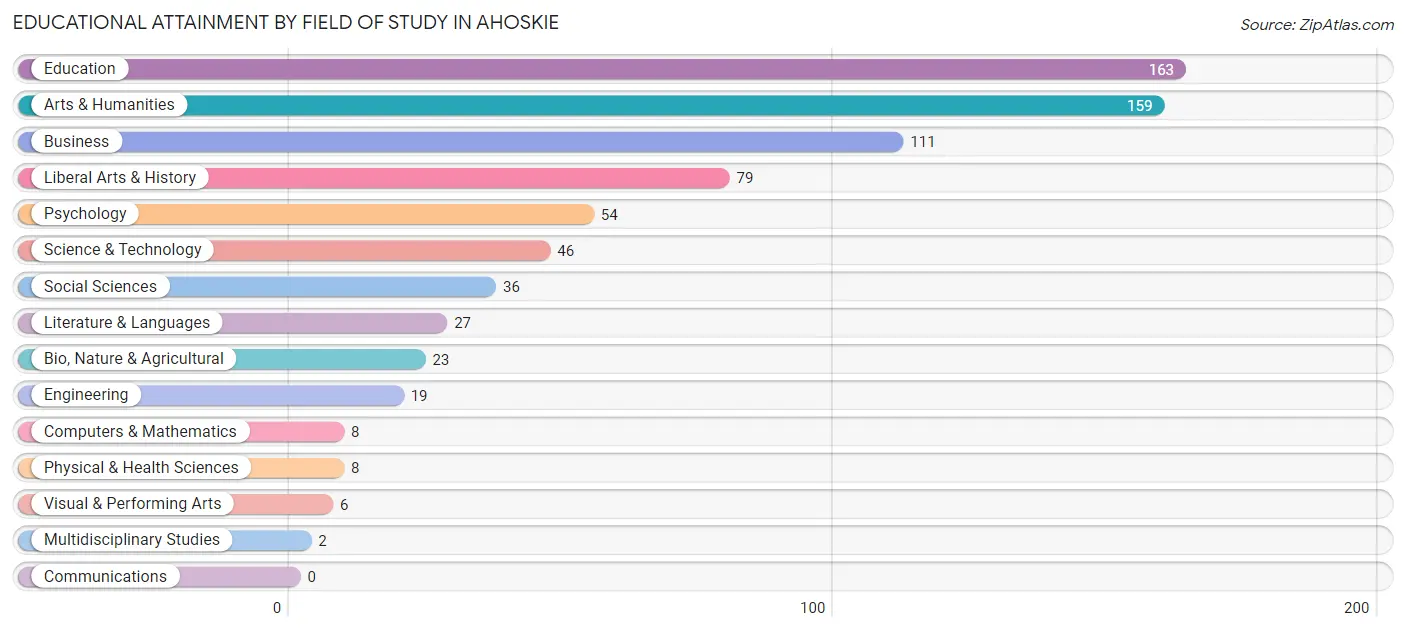
| Field of Study | # Graduates | % Graduates |
| Computers & Mathematics | 8 | 1.1% |
| Bio, Nature & Agricultural | 23 | 3.1% |
| Physical & Health Sciences | 8 | 1.1% |
| Psychology | 54 | 7.3% |
| Social Sciences | 36 | 4.9% |
| Engineering | 19 | 2.6% |
| Multidisciplinary Studies | 2 | 0.3% |
| Science & Technology | 46 | 6.2% |
| Business | 111 | 15.0% |
| Education | 163 | 22.0% |
| Literature & Languages | 27 | 3.6% |
| Liberal Arts & History | 79 | 10.7% |
| Visual & Performing Arts | 6 | 0.8% |
| Communications | 0 | 0.0% |
| Arts & Humanities | 159 | 21.5% |
| Total | 741 | 100.0% |
Transportation & Commute in Ahoskie
Vehicle Availability by Sex in Ahoskie
The most prevalent vehicle ownership categories in Ahoskie are males with 2 vehicles (206, accounting for 29.5%) and females with 2 vehicles (238, making up 19.9%).
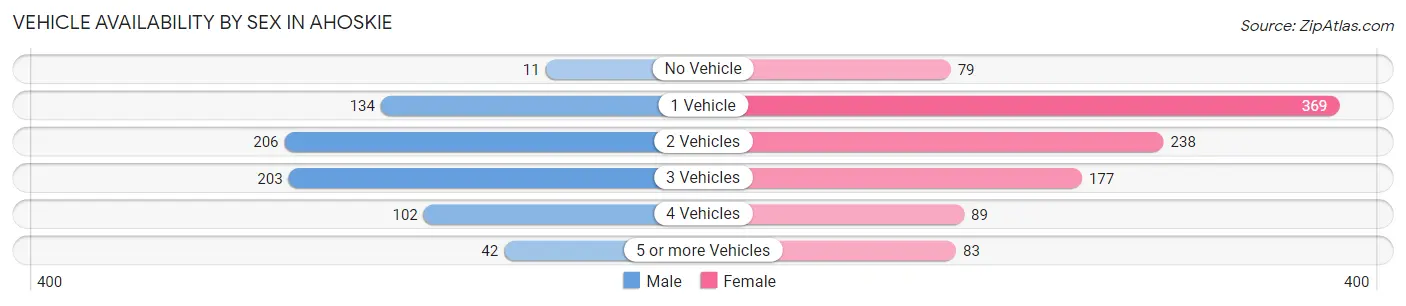
| Vehicles Available | Male | Female |
| No Vehicle | 11 (1.6%) | 79 (7.6%) |
| 1 Vehicle | 134 (19.2%) | 369 (35.6%) |
| 2 Vehicles | 206 (29.5%) | 238 (23.0%) |
| 3 Vehicles | 203 (29.1%) | 177 (17.1%) |
| 4 Vehicles | 102 (14.6%) | 89 (8.6%) |
| 5 or more Vehicles | 42 (6.0%) | 83 (8.0%) |
| Total | 698 (100.0%) | 1,035 (100.0%) |
Commute Time in Ahoskie
The most frequently occuring commute durations in Ahoskie are 5 to 9 minutes (435 commuters, 25.6%), 10 to 14 minutes (216 commuters, 12.7%), and 30 to 34 minutes (206 commuters, 12.1%).
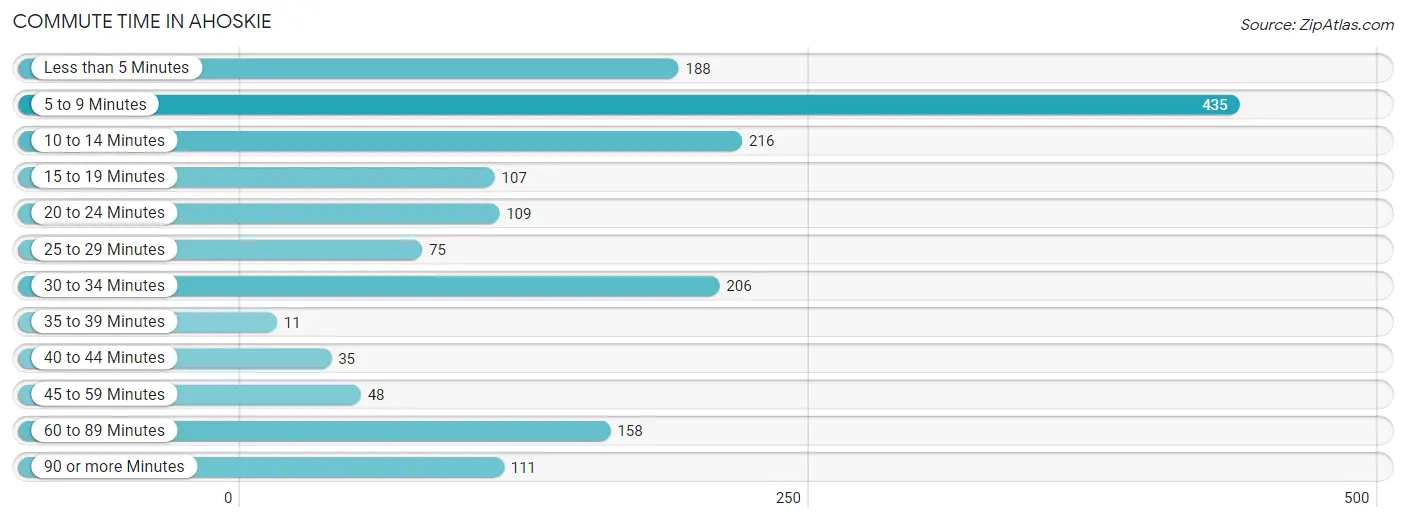
| Commute Time | # Commuters | % Commuters |
| Less than 5 Minutes | 188 | 11.1% |
| 5 to 9 Minutes | 435 | 25.6% |
| 10 to 14 Minutes | 216 | 12.7% |
| 15 to 19 Minutes | 107 | 6.3% |
| 20 to 24 Minutes | 109 | 6.4% |
| 25 to 29 Minutes | 75 | 4.4% |
| 30 to 34 Minutes | 206 | 12.1% |
| 35 to 39 Minutes | 11 | 0.6% |
| 40 to 44 Minutes | 35 | 2.1% |
| 45 to 59 Minutes | 48 | 2.8% |
| 60 to 89 Minutes | 158 | 9.3% |
| 90 or more Minutes | 111 | 6.5% |
Commute Time by Sex in Ahoskie
The most common commute times in Ahoskie are 5 to 9 minutes (193 commuters, 27.9%) for males and 5 to 9 minutes (242 commuters, 24.0%) for females.
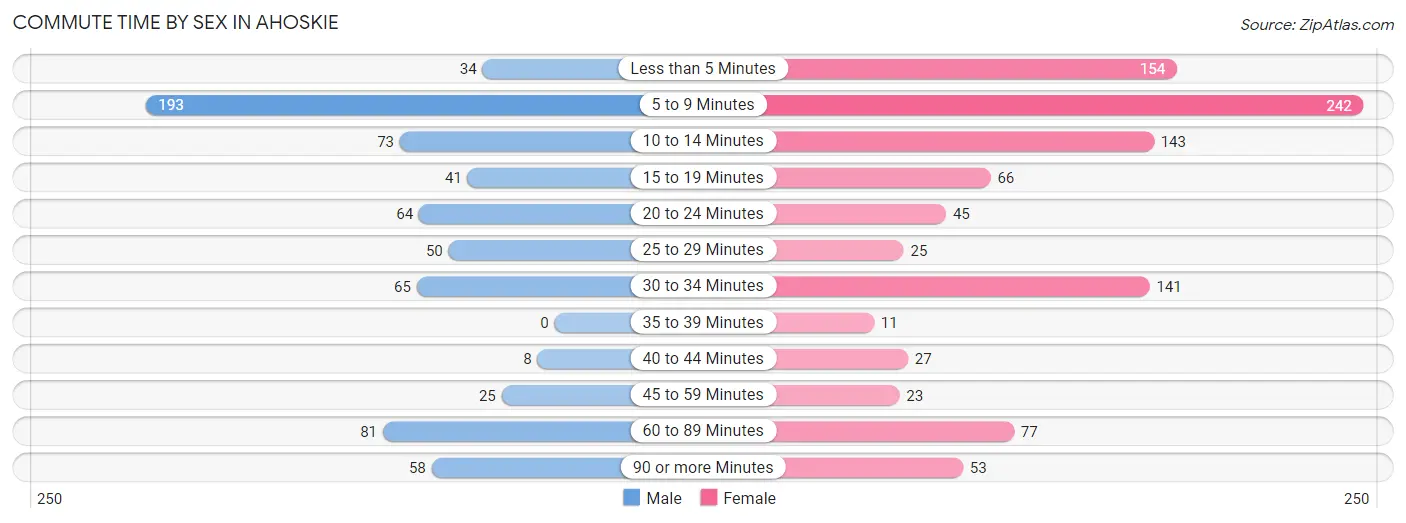
| Commute Time | Male | Female |
| Less than 5 Minutes | 34 (4.9%) | 154 (15.3%) |
| 5 to 9 Minutes | 193 (27.9%) | 242 (24.0%) |
| 10 to 14 Minutes | 73 (10.5%) | 143 (14.2%) |
| 15 to 19 Minutes | 41 (5.9%) | 66 (6.6%) |
| 20 to 24 Minutes | 64 (9.2%) | 45 (4.5%) |
| 25 to 29 Minutes | 50 (7.2%) | 25 (2.5%) |
| 30 to 34 Minutes | 65 (9.4%) | 141 (14.0%) |
| 35 to 39 Minutes | 0 (0.0%) | 11 (1.1%) |
| 40 to 44 Minutes | 8 (1.2%) | 27 (2.7%) |
| 45 to 59 Minutes | 25 (3.6%) | 23 (2.3%) |
| 60 to 89 Minutes | 81 (11.7%) | 77 (7.6%) |
| 90 or more Minutes | 58 (8.4%) | 53 (5.3%) |
Time of Departure to Work by Sex in Ahoskie
The most frequent times of departure to work in Ahoskie are 12:00 AM to 4:59 AM (121, 17.5%) for males and 7:30 AM to 7:59 AM (150, 14.9%) for females.
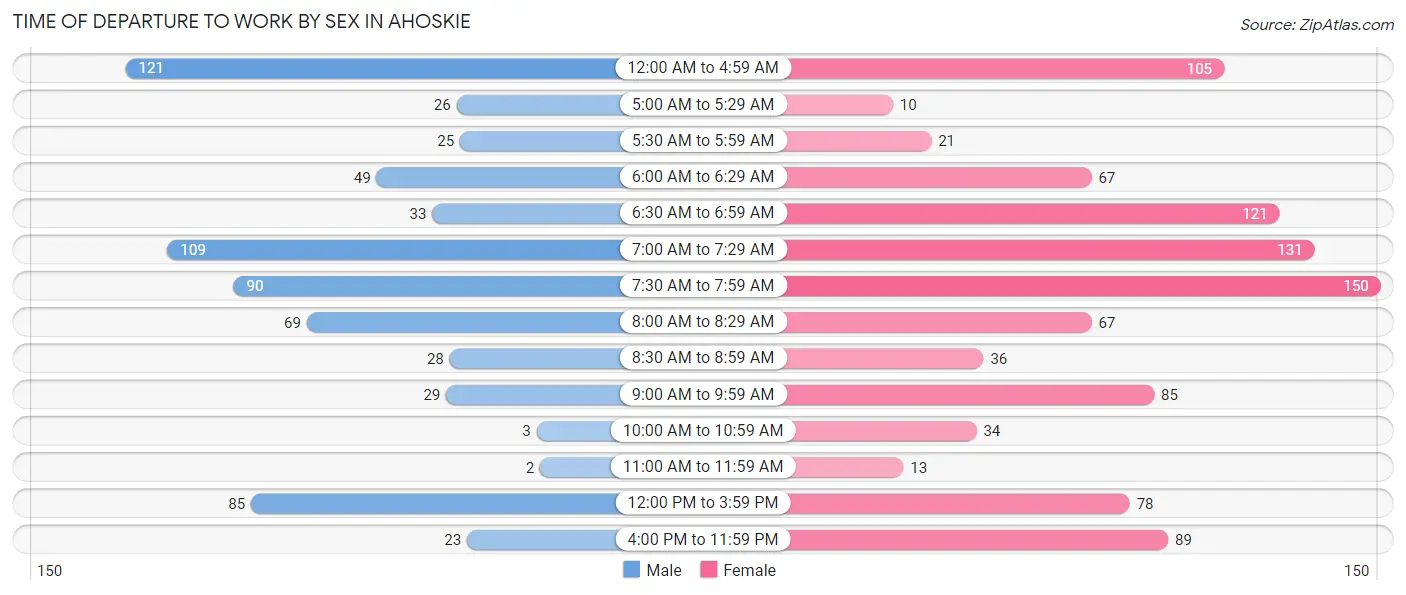
| Time of Departure | Male | Female |
| 12:00 AM to 4:59 AM | 121 (17.5%) | 105 (10.4%) |
| 5:00 AM to 5:29 AM | 26 (3.8%) | 10 (1.0%) |
| 5:30 AM to 5:59 AM | 25 (3.6%) | 21 (2.1%) |
| 6:00 AM to 6:29 AM | 49 (7.1%) | 67 (6.7%) |
| 6:30 AM to 6:59 AM | 33 (4.8%) | 121 (12.0%) |
| 7:00 AM to 7:29 AM | 109 (15.8%) | 131 (13.0%) |
| 7:30 AM to 7:59 AM | 90 (13.0%) | 150 (14.9%) |
| 8:00 AM to 8:29 AM | 69 (10.0%) | 67 (6.7%) |
| 8:30 AM to 8:59 AM | 28 (4.1%) | 36 (3.6%) |
| 9:00 AM to 9:59 AM | 29 (4.2%) | 85 (8.4%) |
| 10:00 AM to 10:59 AM | 3 (0.4%) | 34 (3.4%) |
| 11:00 AM to 11:59 AM | 2 (0.3%) | 13 (1.3%) |
| 12:00 PM to 3:59 PM | 85 (12.3%) | 78 (7.7%) |
| 4:00 PM to 11:59 PM | 23 (3.3%) | 89 (8.8%) |
| Total | 692 (100.0%) | 1,007 (100.0%) |
Housing Occupancy in Ahoskie
Occupancy by Ownership in Ahoskie
Of the total 1,994 dwellings in Ahoskie, owner-occupied units account for 804 (40.3%), while renter-occupied units make up 1,190 (59.7%).
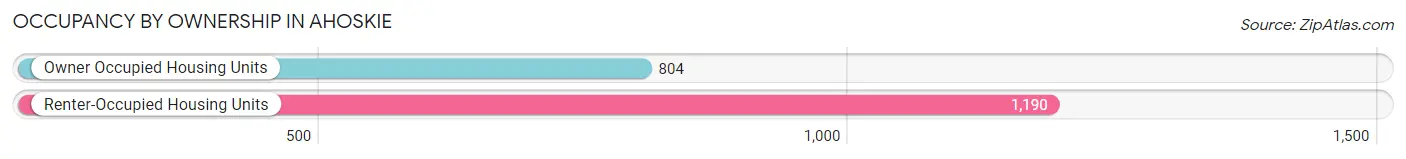
| Occupancy | # Housing Units | % Housing Units |
| Owner Occupied Housing Units | 804 | 40.3% |
| Renter-Occupied Housing Units | 1,190 | 59.7% |
| Total Occupied Housing Units | 1,994 | 100.0% |
Occupancy by Household Size in Ahoskie
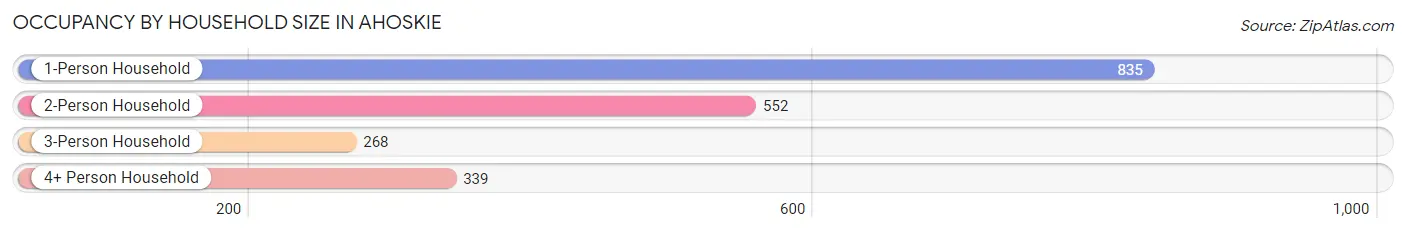
| Household Size | # Housing Units | % Housing Units |
| 1-Person Household | 835 | 41.9% |
| 2-Person Household | 552 | 27.7% |
| 3-Person Household | 268 | 13.4% |
| 4+ Person Household | 339 | 17.0% |
| Total Housing Units | 1,994 | 100.0% |
Occupancy by Ownership by Household Size in Ahoskie
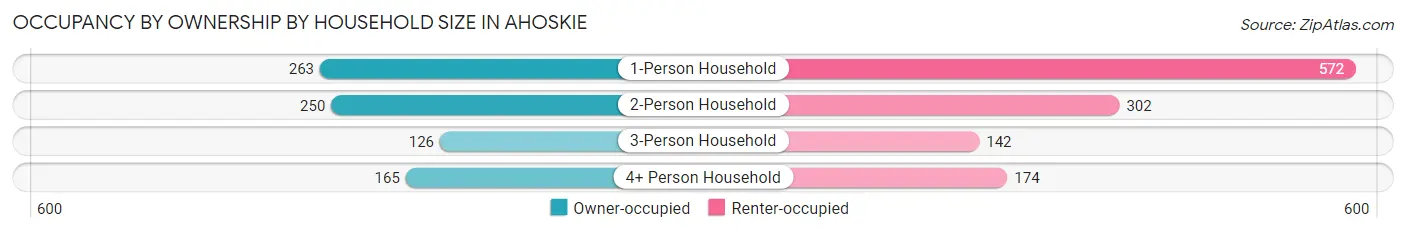
| Household Size | Owner-occupied | Renter-occupied |
| 1-Person Household | 263 (31.5%) | 572 (68.5%) |
| 2-Person Household | 250 (45.3%) | 302 (54.7%) |
| 3-Person Household | 126 (47.0%) | 142 (53.0%) |
| 4+ Person Household | 165 (48.7%) | 174 (51.3%) |
| Total Housing Units | 804 (40.3%) | 1,190 (59.7%) |
Occupancy by Educational Attainment in Ahoskie
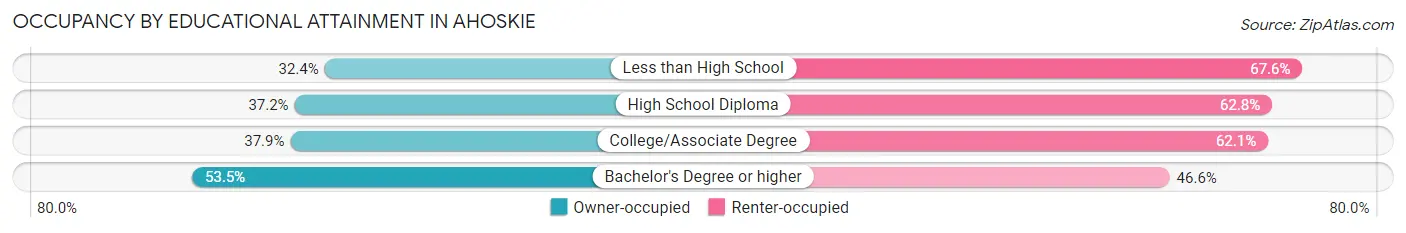
| Household Size | Owner-occupied | Renter-occupied |
| Less than High School | 107 (32.4%) | 223 (67.6%) |
| High School Diploma | 170 (37.2%) | 287 (62.8%) |
| College/Associate Degree | 287 (37.9%) | 471 (62.1%) |
| Bachelor's Degree or higher | 240 (53.4%) | 209 (46.6%) |
Occupancy by Age of Householder in Ahoskie
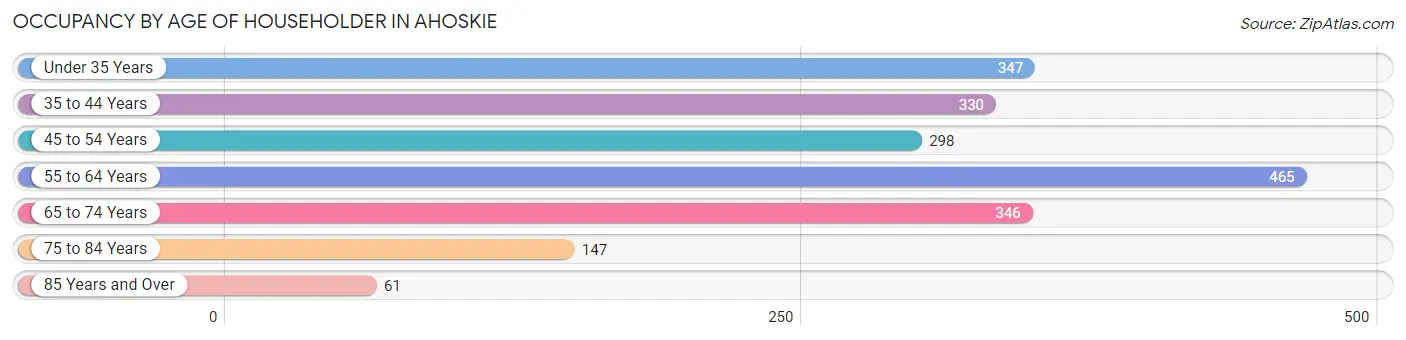
| Age Bracket | # Households | % Households |
| Under 35 Years | 347 | 17.4% |
| 35 to 44 Years | 330 | 16.6% |
| 45 to 54 Years | 298 | 14.9% |
| 55 to 64 Years | 465 | 23.3% |
| 65 to 74 Years | 346 | 17.3% |
| 75 to 84 Years | 147 | 7.4% |
| 85 Years and Over | 61 | 3.1% |
| Total | 1,994 | 100.0% |
Housing Finances in Ahoskie
Median Income by Occupancy in Ahoskie
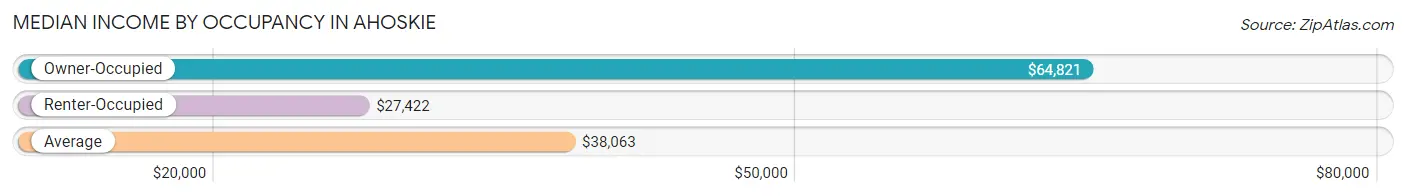
| Occupancy Type | # Households | Median Income |
| Owner-Occupied | 804 (40.3%) | $64,821 |
| Renter-Occupied | 1,190 (59.7%) | $27,422 |
| Average | 1,994 (100.0%) | $38,063 |
Occupancy by Householder Income Bracket in Ahoskie
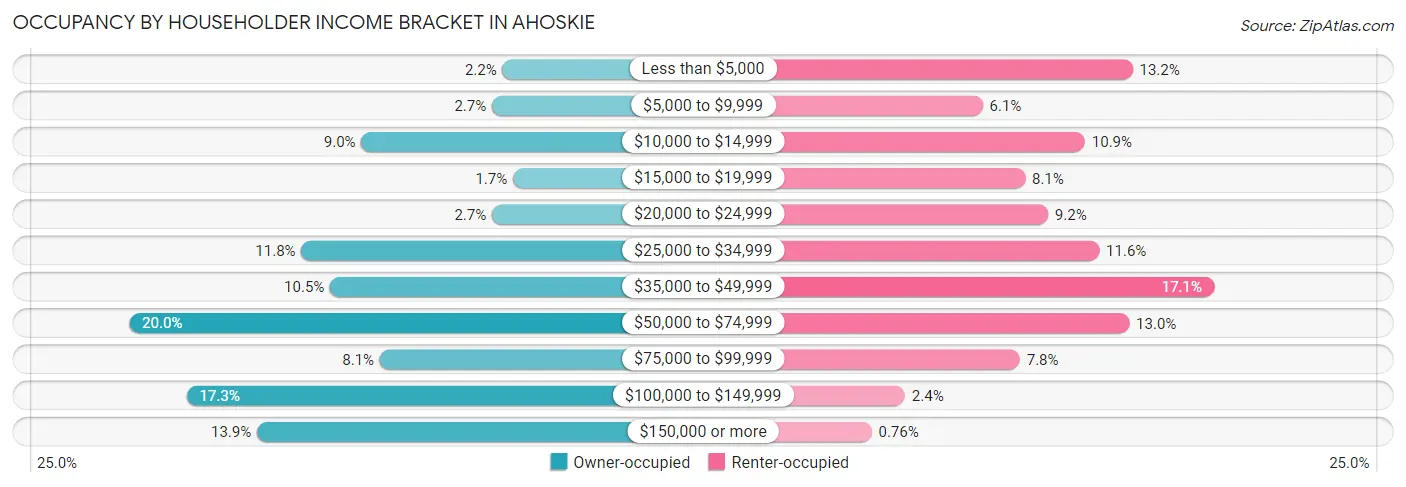
| Income Bracket | Owner-occupied | Renter-occupied |
| Less than $5,000 | 18 (2.2%) | 157 (13.2%) |
| $5,000 to $9,999 | 22 (2.7%) | 72 (6.0%) |
| $10,000 to $14,999 | 72 (9.0%) | 130 (10.9%) |
| $15,000 to $19,999 | 14 (1.7%) | 96 (8.1%) |
| $20,000 to $24,999 | 22 (2.7%) | 109 (9.2%) |
| $25,000 to $34,999 | 95 (11.8%) | 138 (11.6%) |
| $35,000 to $49,999 | 84 (10.4%) | 203 (17.1%) |
| $50,000 to $74,999 | 161 (20.0%) | 155 (13.0%) |
| $75,000 to $99,999 | 65 (8.1%) | 93 (7.8%) |
| $100,000 to $149,999 | 139 (17.3%) | 28 (2.4%) |
| $150,000 or more | 112 (13.9%) | 9 (0.8%) |
| Total | 804 (100.0%) | 1,190 (100.0%) |
Monthly Housing Cost Tiers in Ahoskie
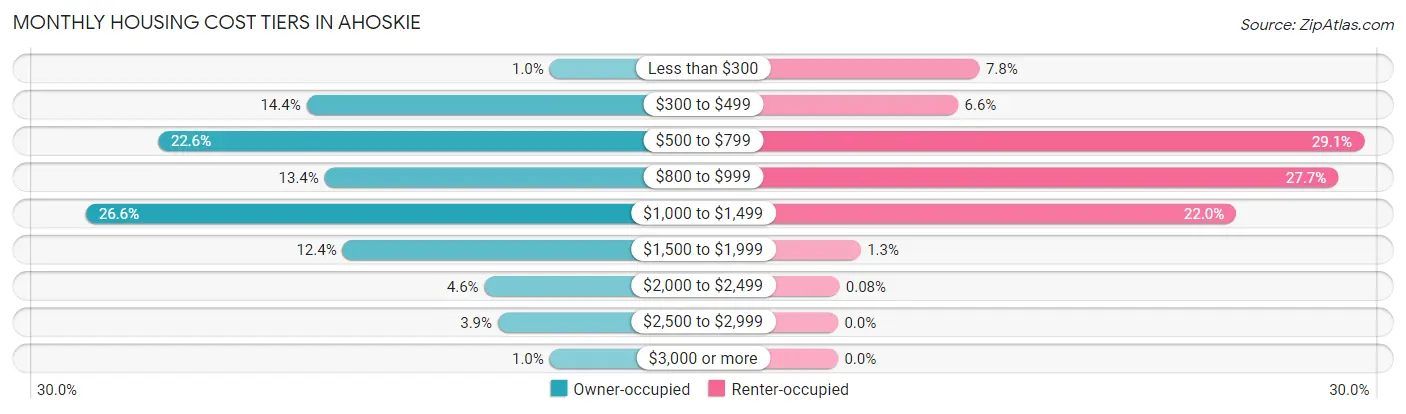
| Monthly Cost | Owner-occupied | Renter-occupied |
| Less than $300 | 8 (1.0%) | 93 (7.8%) |
| $300 to $499 | 116 (14.4%) | 79 (6.6%) |
| $500 to $799 | 182 (22.6%) | 346 (29.1%) |
| $800 to $999 | 108 (13.4%) | 329 (27.7%) |
| $1,000 to $1,499 | 214 (26.6%) | 262 (22.0%) |
| $1,500 to $1,999 | 100 (12.4%) | 15 (1.3%) |
| $2,000 to $2,499 | 37 (4.6%) | 1 (0.1%) |
| $2,500 to $2,999 | 31 (3.9%) | 0 (0.0%) |
| $3,000 or more | 8 (1.0%) | 0 (0.0%) |
| Total | 804 (100.0%) | 1,190 (100.0%) |
Physical Housing Characteristics in Ahoskie
Housing Structures in Ahoskie
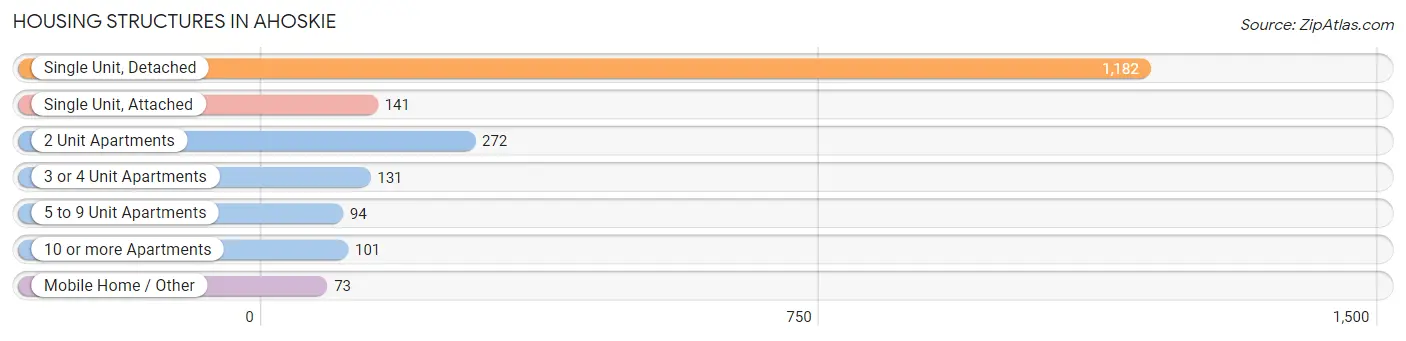
| Structure Type | # Housing Units | % Housing Units |
| Single Unit, Detached | 1,182 | 59.3% |
| Single Unit, Attached | 141 | 7.1% |
| 2 Unit Apartments | 272 | 13.6% |
| 3 or 4 Unit Apartments | 131 | 6.6% |
| 5 to 9 Unit Apartments | 94 | 4.7% |
| 10 or more Apartments | 101 | 5.1% |
| Mobile Home / Other | 73 | 3.7% |
| Total | 1,994 | 100.0% |
Housing Structures by Occupancy in Ahoskie
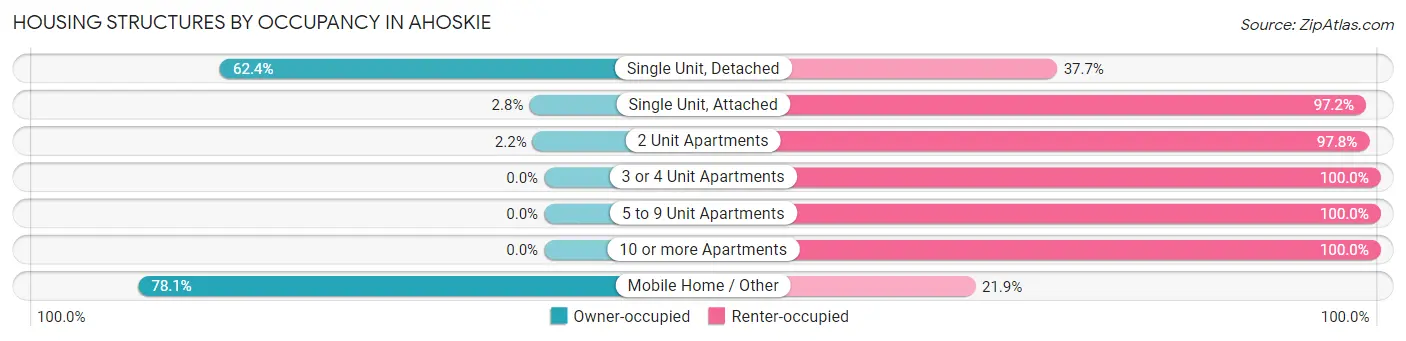
| Structure Type | Owner-occupied | Renter-occupied |
| Single Unit, Detached | 737 (62.4%) | 445 (37.7%) |
| Single Unit, Attached | 4 (2.8%) | 137 (97.2%) |
| 2 Unit Apartments | 6 (2.2%) | 266 (97.8%) |
| 3 or 4 Unit Apartments | 0 (0.0%) | 131 (100.0%) |
| 5 to 9 Unit Apartments | 0 (0.0%) | 94 (100.0%) |
| 10 or more Apartments | 0 (0.0%) | 101 (100.0%) |
| Mobile Home / Other | 57 (78.1%) | 16 (21.9%) |
| Total | 804 (40.3%) | 1,190 (59.7%) |
Housing Structures by Number of Rooms in Ahoskie
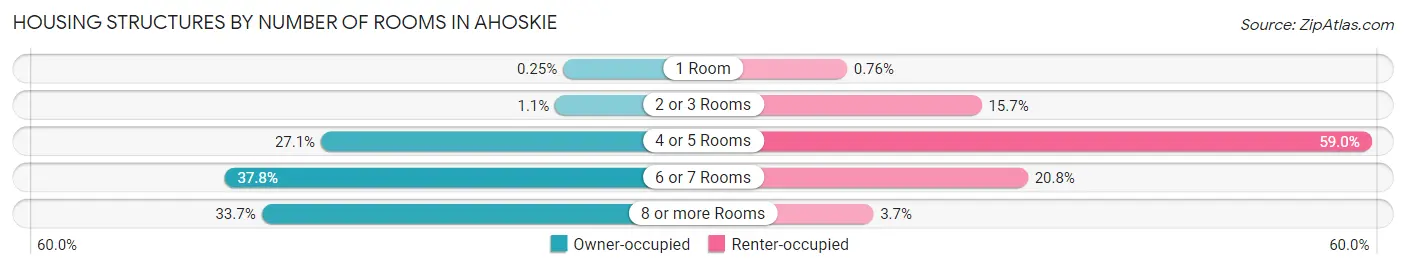
| Number of Rooms | Owner-occupied | Renter-occupied |
| 1 Room | 2 (0.3%) | 9 (0.8%) |
| 2 or 3 Rooms | 9 (1.1%) | 187 (15.7%) |
| 4 or 5 Rooms | 218 (27.1%) | 702 (59.0%) |
| 6 or 7 Rooms | 304 (37.8%) | 248 (20.8%) |
| 8 or more Rooms | 271 (33.7%) | 44 (3.7%) |
| Total | 804 (100.0%) | 1,190 (100.0%) |
Housing Structure by Heating Type in Ahoskie
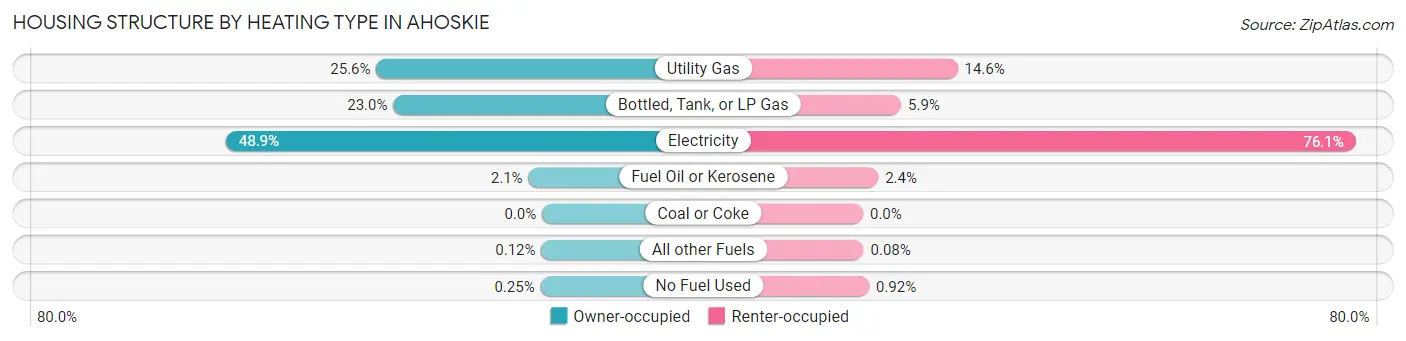
| Heating Type | Owner-occupied | Renter-occupied |
| Utility Gas | 206 (25.6%) | 174 (14.6%) |
| Bottled, Tank, or LP Gas | 185 (23.0%) | 70 (5.9%) |
| Electricity | 393 (48.9%) | 906 (76.1%) |
| Fuel Oil or Kerosene | 17 (2.1%) | 28 (2.4%) |
| Coal or Coke | 0 (0.0%) | 0 (0.0%) |
| All other Fuels | 1 (0.1%) | 1 (0.1%) |
| No Fuel Used | 2 (0.3%) | 11 (0.9%) |
| Total | 804 (100.0%) | 1,190 (100.0%) |
Household Vehicle Usage in Ahoskie
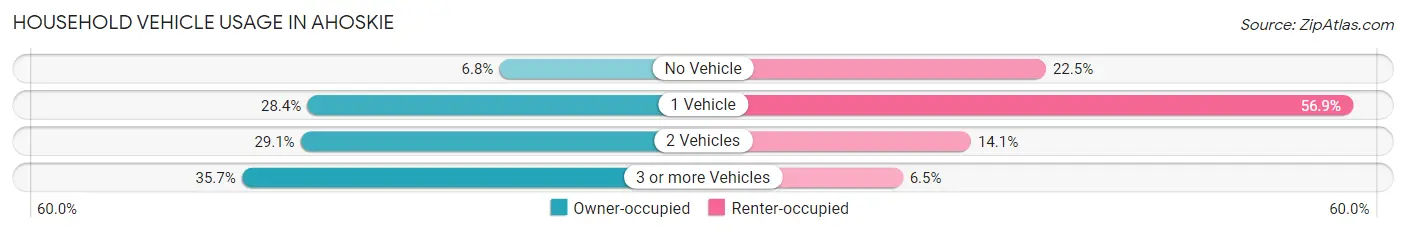
| Vehicles per Household | Owner-occupied | Renter-occupied |
| No Vehicle | 55 (6.8%) | 268 (22.5%) |
| 1 Vehicle | 228 (28.4%) | 677 (56.9%) |
| 2 Vehicles | 234 (29.1%) | 168 (14.1%) |
| 3 or more Vehicles | 287 (35.7%) | 77 (6.5%) |
| Total | 804 (100.0%) | 1,190 (100.0%) |
Real Estate & Mortgages in Ahoskie
Real Estate and Mortgage Overview in Ahoskie
| Characteristic | Without Mortgage | With Mortgage |
| Housing Units | 320 | 484 |
| Median Property Value | $97,200 | $133,500 |
| Median Household Income | $52,679 | $89 |
| Monthly Housing Costs | $554 | $8 |
| Real Estate Taxes | $1,296 | $1 |
Property Value by Mortgage Status in Ahoskie
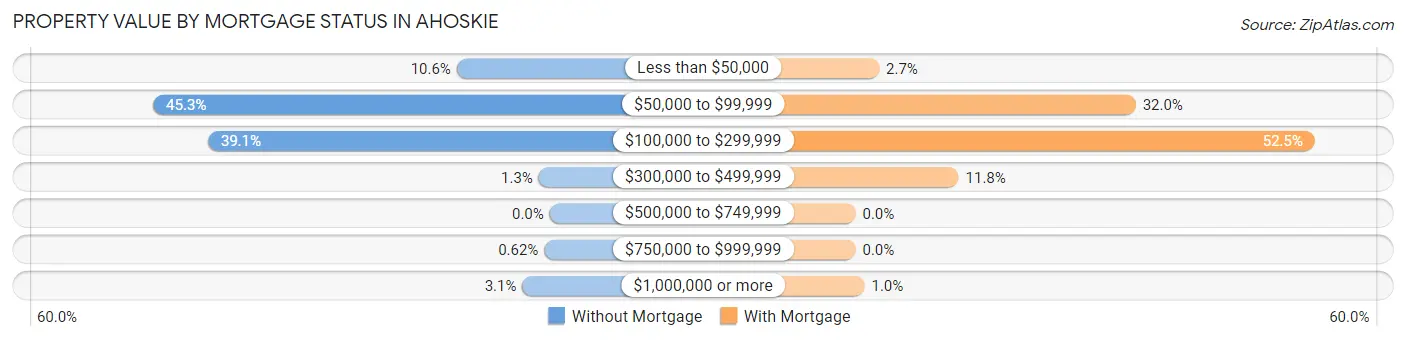
| Property Value | Without Mortgage | With Mortgage |
| Less than $50,000 | 34 (10.6%) | 13 (2.7%) |
| $50,000 to $99,999 | 145 (45.3%) | 155 (32.0%) |
| $100,000 to $299,999 | 125 (39.1%) | 254 (52.5%) |
| $300,000 to $499,999 | 4 (1.3%) | 57 (11.8%) |
| $500,000 to $749,999 | 0 (0.0%) | 0 (0.0%) |
| $750,000 to $999,999 | 2 (0.6%) | 0 (0.0%) |
| $1,000,000 or more | 10 (3.1%) | 5 (1.0%) |
| Total | 320 (100.0%) | 484 (100.0%) |
Household Income by Mortgage Status in Ahoskie
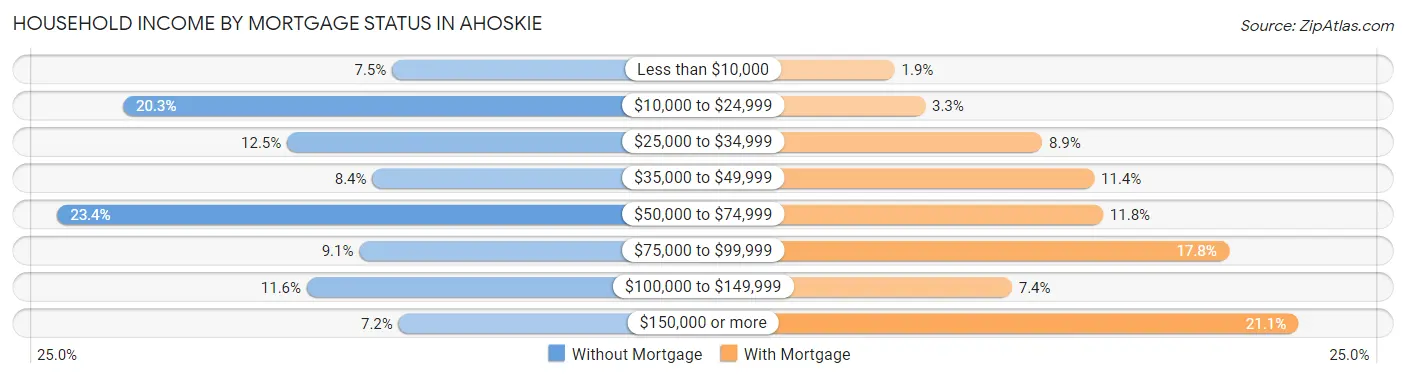
| Household Income | Without Mortgage | With Mortgage |
| Less than $10,000 | 24 (7.5%) | 9 (1.9%) |
| $10,000 to $24,999 | 65 (20.3%) | 16 (3.3%) |
| $25,000 to $34,999 | 40 (12.5%) | 43 (8.9%) |
| $35,000 to $49,999 | 27 (8.4%) | 55 (11.4%) |
| $50,000 to $74,999 | 75 (23.4%) | 57 (11.8%) |
| $75,000 to $99,999 | 29 (9.1%) | 86 (17.8%) |
| $100,000 to $149,999 | 37 (11.6%) | 36 (7.4%) |
| $150,000 or more | 23 (7.2%) | 102 (21.1%) |
| Total | 320 (100.0%) | 484 (100.0%) |
Property Value to Household Income Ratio in Ahoskie
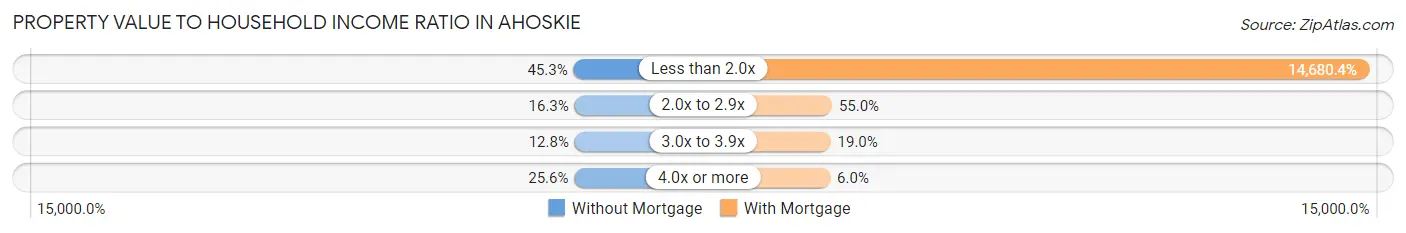
| Value-to-Income Ratio | Without Mortgage | With Mortgage |
| Less than 2.0x | 145 (45.3%) | 71,053 (14,680.4%) |
| 2.0x to 2.9x | 52 (16.3%) | 266 (55.0%) |
| 3.0x to 3.9x | 41 (12.8%) | 92 (19.0%) |
| 4.0x or more | 82 (25.6%) | 29 (6.0%) |
| Total | 320 (100.0%) | 484 (100.0%) |
Real Estate Taxes by Mortgage Status in Ahoskie
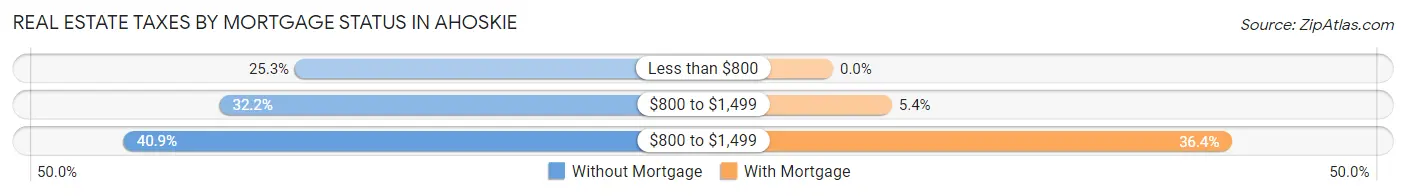
| Property Taxes | Without Mortgage | With Mortgage |
| Less than $800 | 81 (25.3%) | 0 (0.0%) |
| $800 to $1,499 | 103 (32.2%) | 26 (5.4%) |
| $800 to $1,499 | 131 (40.9%) | 176 (36.4%) |
| Total | 320 (100.0%) | 484 (100.0%) |
Health & Disability in Ahoskie
Health Insurance Coverage by Age in Ahoskie
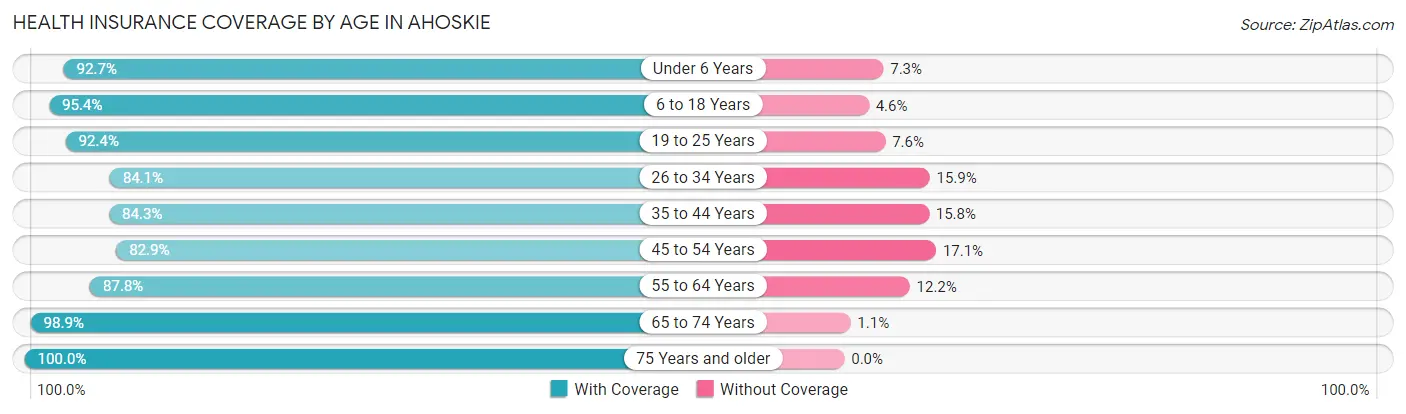
| Age Bracket | With Coverage | Without Coverage |
| Under 6 Years | 268 (92.7%) | 21 (7.3%) |
| 6 to 18 Years | 880 (95.4%) | 42 (4.6%) |
| 19 to 25 Years | 363 (92.4%) | 30 (7.6%) |
| 26 to 34 Years | 439 (84.1%) | 83 (15.9%) |
| 35 to 44 Years | 444 (84.3%) | 83 (15.8%) |
| 45 to 54 Years | 422 (82.9%) | 87 (17.1%) |
| 55 to 64 Years | 620 (87.8%) | 86 (12.2%) |
| 65 to 74 Years | 434 (98.9%) | 5 (1.1%) |
| 75 Years and older | 287 (100.0%) | 0 (0.0%) |
| Total | 4,157 (90.5%) | 437 (9.5%) |
Health Insurance Coverage by Citizenship Status in Ahoskie
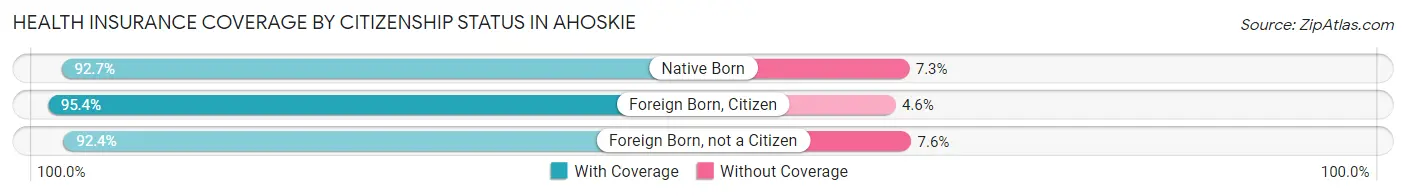
| Citizenship Status | With Coverage | Without Coverage |
| Native Born | 268 (92.7%) | 21 (7.3%) |
| Foreign Born, Citizen | 880 (95.4%) | 42 (4.6%) |
| Foreign Born, not a Citizen | 363 (92.4%) | 30 (7.6%) |
Health Insurance Coverage by Household Income in Ahoskie
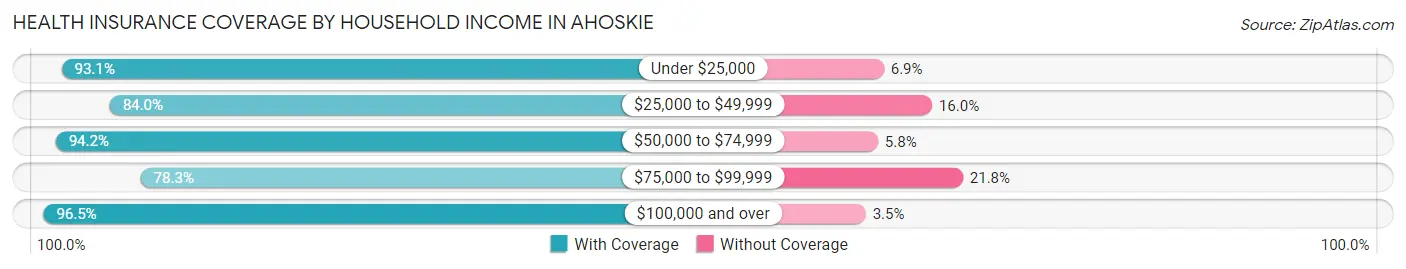
| Household Income | With Coverage | Without Coverage |
| Under $25,000 | 1,088 (93.1%) | 81 (6.9%) |
| $25,000 to $49,999 | 990 (84.0%) | 188 (16.0%) |
| $50,000 to $74,999 | 662 (94.2%) | 41 (5.8%) |
| $75,000 to $99,999 | 313 (78.2%) | 87 (21.7%) |
| $100,000 and over | 1,091 (96.5%) | 40 (3.5%) |
Public vs Private Health Insurance Coverage by Age in Ahoskie
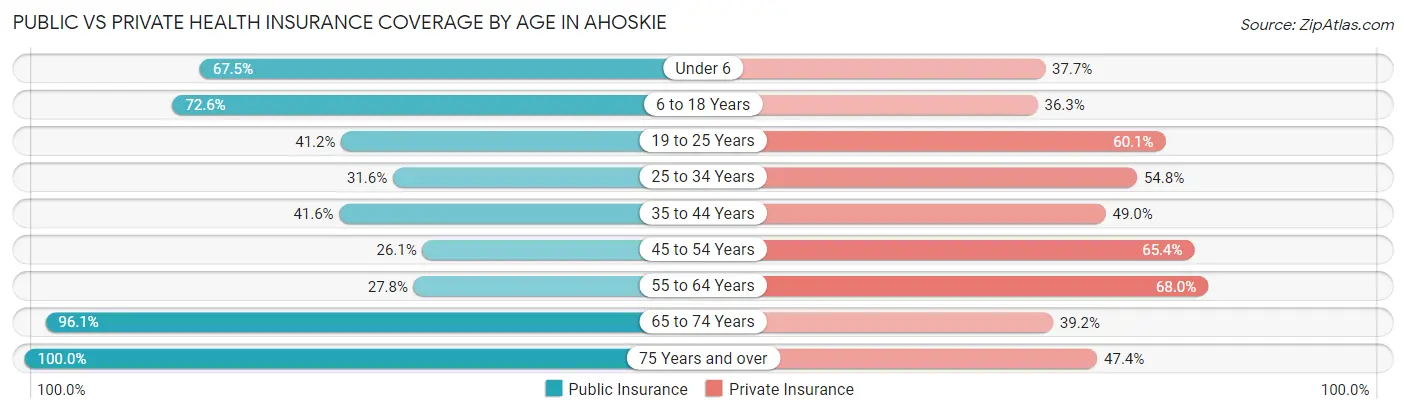
| Age Bracket | Public Insurance | Private Insurance |
| Under 6 | 195 (67.5%) | 109 (37.7%) |
| 6 to 18 Years | 669 (72.6%) | 335 (36.3%) |
| 19 to 25 Years | 162 (41.2%) | 236 (60.1%) |
| 25 to 34 Years | 165 (31.6%) | 286 (54.8%) |
| 35 to 44 Years | 219 (41.6%) | 258 (49.0%) |
| 45 to 54 Years | 133 (26.1%) | 333 (65.4%) |
| 55 to 64 Years | 196 (27.8%) | 480 (68.0%) |
| 65 to 74 Years | 422 (96.1%) | 172 (39.2%) |
| 75 Years and over | 287 (100.0%) | 136 (47.4%) |
| Total | 2,448 (53.3%) | 2,345 (51.0%) |
Disability Status by Sex by Age in Ahoskie
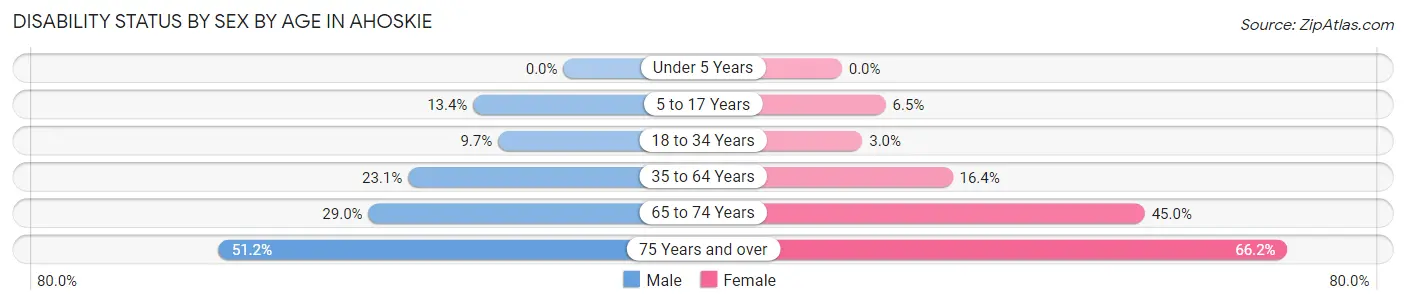
| Age Bracket | Male | Female |
| Under 5 Years | 0 (0.0%) | 0 (0.0%) |
| 5 to 17 Years | 49 (13.4%) | 34 (6.5%) |
| 18 to 34 Years | 41 (9.7%) | 17 (3.0%) |
| 35 to 64 Years | 166 (23.1%) | 168 (16.4%) |
| 65 to 74 Years | 55 (28.9%) | 112 (45.0%) |
| 75 Years and over | 44 (51.2%) | 133 (66.2%) |
Disability Class by Sex by Age in Ahoskie
Disability Class: Hearing Difficulty
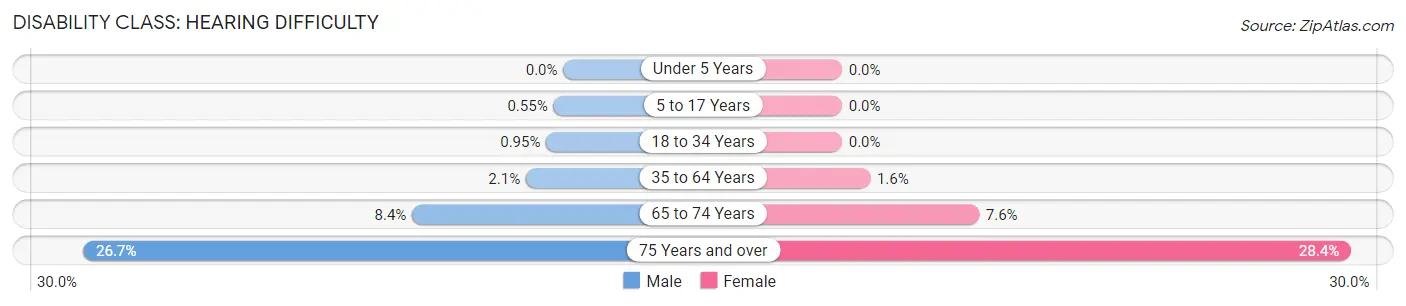
| Age Bracket | Male | Female |
| Under 5 Years | 0 (0.0%) | 0 (0.0%) |
| 5 to 17 Years | 2 (0.5%) | 0 (0.0%) |
| 18 to 34 Years | 4 (0.9%) | 0 (0.0%) |
| 35 to 64 Years | 15 (2.1%) | 16 (1.6%) |
| 65 to 74 Years | 16 (8.4%) | 19 (7.6%) |
| 75 Years and over | 23 (26.7%) | 57 (28.4%) |
Disability Class: Vision Difficulty
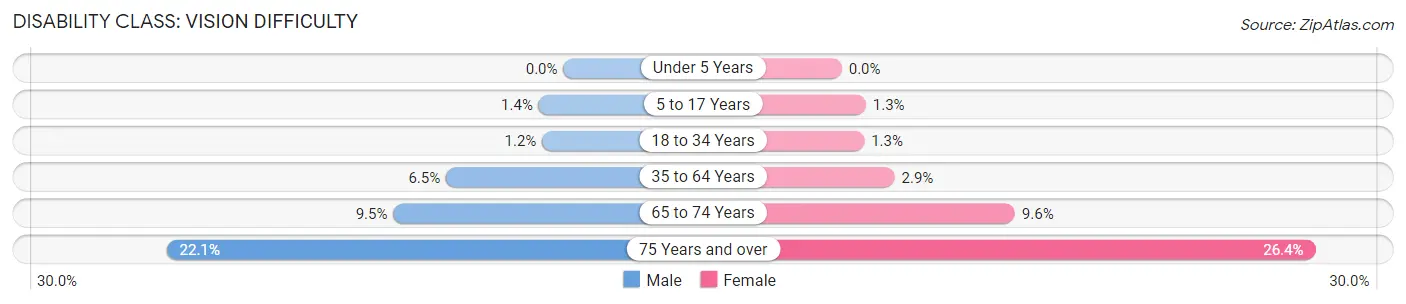
| Age Bracket | Male | Female |
| Under 5 Years | 0 (0.0%) | 0 (0.0%) |
| 5 to 17 Years | 5 (1.4%) | 7 (1.3%) |
| 18 to 34 Years | 5 (1.2%) | 7 (1.3%) |
| 35 to 64 Years | 47 (6.5%) | 30 (2.9%) |
| 65 to 74 Years | 18 (9.5%) | 24 (9.6%) |
| 75 Years and over | 19 (22.1%) | 53 (26.4%) |
Disability Class: Cognitive Difficulty
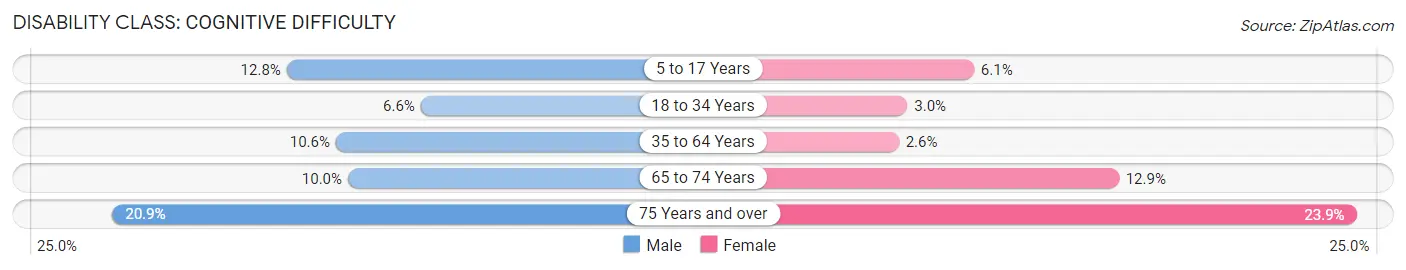
| Age Bracket | Male | Female |
| 5 to 17 Years | 47 (12.8%) | 32 (6.1%) |
| 18 to 34 Years | 28 (6.6%) | 17 (3.0%) |
| 35 to 64 Years | 76 (10.6%) | 27 (2.6%) |
| 65 to 74 Years | 19 (10.0%) | 32 (12.9%) |
| 75 Years and over | 18 (20.9%) | 48 (23.9%) |
Disability Class: Ambulatory Difficulty
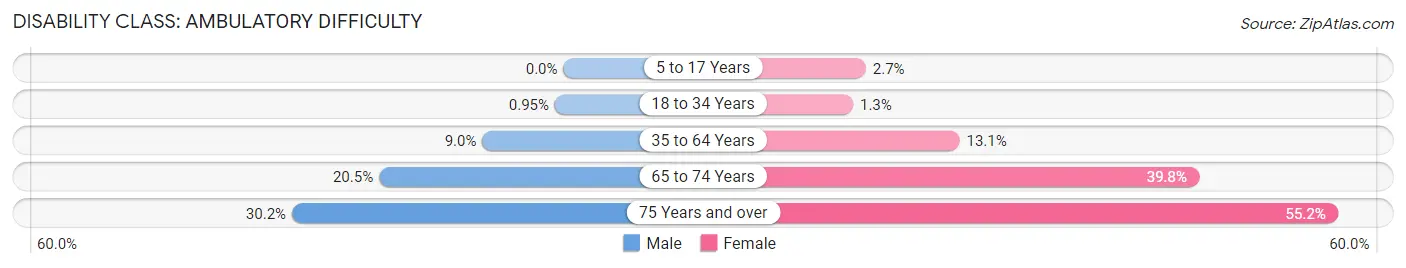
| Age Bracket | Male | Female |
| 5 to 17 Years | 0 (0.0%) | 14 (2.7%) |
| 18 to 34 Years | 4 (0.9%) | 7 (1.3%) |
| 35 to 64 Years | 65 (9.0%) | 134 (13.1%) |
| 65 to 74 Years | 39 (20.5%) | 99 (39.8%) |
| 75 Years and over | 26 (30.2%) | 111 (55.2%) |
Disability Class: Self-Care Difficulty
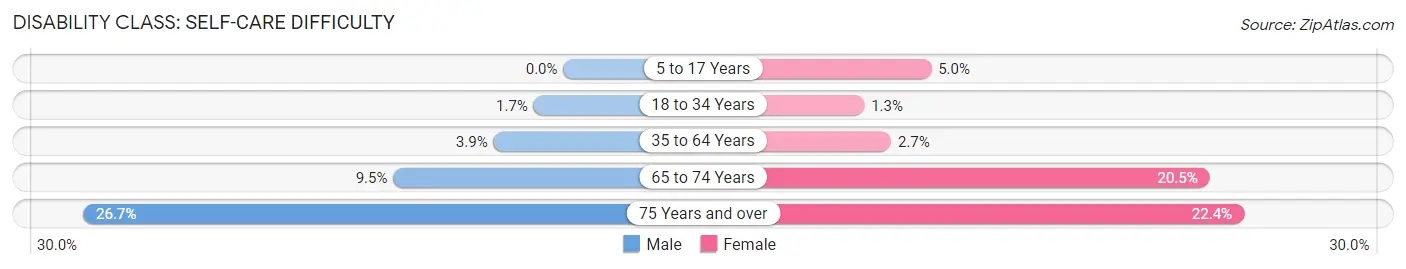
| Age Bracket | Male | Female |
| 5 to 17 Years | 0 (0.0%) | 26 (5.0%) |
| 18 to 34 Years | 7 (1.7%) | 7 (1.3%) |
| 35 to 64 Years | 28 (3.9%) | 28 (2.7%) |
| 65 to 74 Years | 18 (9.5%) | 51 (20.5%) |
| 75 Years and over | 23 (26.7%) | 45 (22.4%) |
Technology Access in Ahoskie
Computing Device Access in Ahoskie
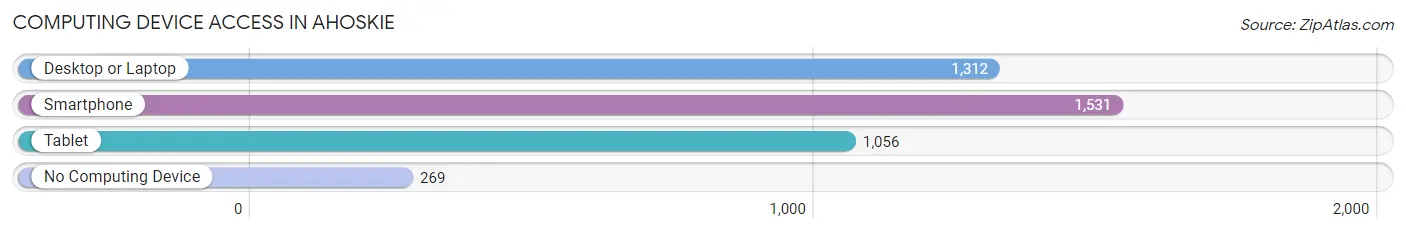
| Device Type | # Households | % Households |
| Desktop or Laptop | 1,312 | 65.8% |
| Smartphone | 1,531 | 76.8% |
| Tablet | 1,056 | 53.0% |
| No Computing Device | 269 | 13.5% |
| Total | 1,994 | 100.0% |
Internet Access in Ahoskie
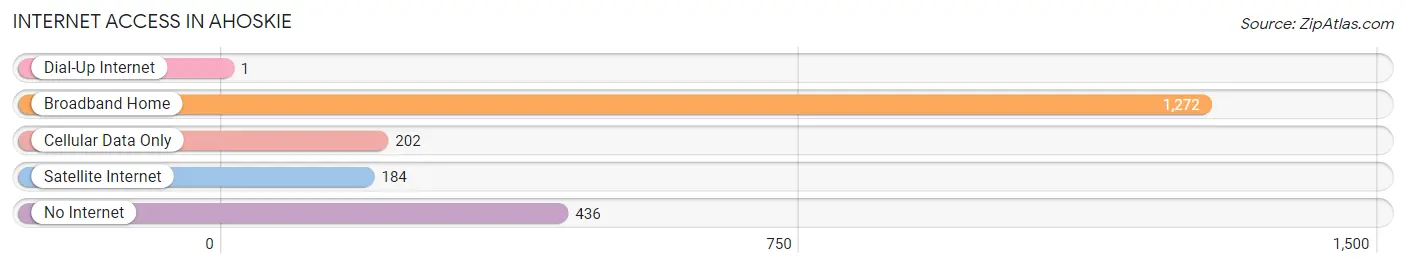
| Internet Type | # Households | % Households |
| Dial-Up Internet | 1 | 0.1% |
| Broadband Home | 1,272 | 63.8% |
| Cellular Data Only | 202 | 10.1% |
| Satellite Internet | 184 | 9.2% |
| No Internet | 436 | 21.9% |
| Total | 1,994 | 100.0% |
Ahoskie Summary
Ahoskie is a town located in Hertford County, North Carolina. It is the county seat of Hertford County and is located in the northeastern part of the state. The town was founded in 1720 and is the oldest town in the county. The population of Ahoskie was 5,039 at the 2010 census.
Geography
Ahoskie is located at 36°20'25" North, 76°59'45" West (36.340278, -76.995833). According to the United States Census Bureau, the town has a total area of 4.2 square miles (10.8 km2), all of it land.
Ahoskie is located in the Coastal Plain region of North Carolina. The terrain is generally flat, with some rolling hills. The town is located on the banks of the Cashie River, which flows through the town.
Economy
Ahoskie's economy is largely based on agriculture and manufacturing. The town is home to several large poultry processing plants, as well as a number of smaller businesses. The town is also home to a number of retail stores, including a Walmart Supercenter.
Demographics
As of the census of 2000, there were 5,039 people, 1,945 households, and 1,323 families residing in the town. The population density was 1,203.2 people per square mile (464.3/km2). There were 2,093 housing units at an average density of 497.2 per square mile (191.9/km2). The racial makeup of the town was 57.90% White, 39.90% African American, 0.20% Native American, 0.40% Asian, 0.02% Pacific Islander, 0.90% from other races, and 0.60% from two or more races. Hispanic or Latino of any race were 1.90% of the population.
There were 1,945 households, out of which 32.2% had children under the age of 18 living with them, 43.2% were married couples living together, 19.2% had a female householder with no husband present, and 33.2% were non-families. 29.2% of all households were made up of individuals, and 14.2% had someone living alone who was 65 years of age or older. The average household size was 2.50 and the average family size was 3.09.
In the town, the population was spread out, with 26.2% under the age of 18, 8.2% from 18 to 24, 27.2% from 25 to 44, 22.2% from 45 to 64, and 16.2% who were 65 years of age or older. The median age was 37 years. For every 100 females, there were 86.2 males. For every 100 females age 18 and over, there were 81.2 males.
The median income for a household in the town was $27,917, and the median income for a family was $35,938. Males had a median income of $27,917 versus $20,938 for females. The per capita income for the town was $14,945. About 17.2% of families and 20.2% of the population were below the poverty line, including 28.2% of those under age 18 and 17.2% of those age 65 or over.
Common Questions
What is the Total Population of Ahoskie?
Total Population of Ahoskie is 4,841.
What is the Total Male Population of Ahoskie?
Total Male Population of Ahoskie is 2,073.
What is the Total Female Population of Ahoskie?
Total Female Population of Ahoskie is 2,768.
What is the Ratio of Males per 100 Females in Ahoskie?
There are 74.89 Males per 100 Females in Ahoskie.
What is the Ratio of Females per 100 Males in Ahoskie?
There are 133.53 Females per 100 Males in Ahoskie.
What is the Median Population Age in Ahoskie?
Median Population Age in Ahoskie is 39.3 Years.
What is the Average Family Size in Ahoskie
Average Family Size in Ahoskie is 3.2 People.
What is the Average Household Size in Ahoskie
Average Household Size in Ahoskie is 2.3 People.
What is Per Capita Income in Ahoskie?
Per Capita income in Ahoskie is $23,170.
What is the Median Family Income in Ahoskie?
Median Family Income in Ahoskie is $47,679.
What is the Median Household income in Ahoskie?
Median Household Income in Ahoskie is $38,063.
What is Income or Wage Gap in Ahoskie?
Income or Wage Gap in Ahoskie is 30.8%.
Women in Ahoskie earn 69.2 cents for every dollar earned by a man.
What is Family Income Deficit in Ahoskie?
Family Income Deficit in Ahoskie is $13,422.
Families that are below poverty line in Ahoskie earn $13,422 less on average than the poverty threshold level.
What is Inequality or Gini Index in Ahoskie?
Inequality or Gini Index in Ahoskie is 0.49.
How Large is the Labor Force in Ahoskie?
There are 2,043 People in the Labor Forcein in Ahoskie.
What is the Percentage of People in the Labor Force in Ahoskie?
52.6% of People are in the Labor Force in Ahoskie.
What is the Unemployment Rate in Ahoskie?
Unemployment Rate in Ahoskie is 11.9%.