Spring Lake, NC
Spring Lake Map
Spring Lake Overview
11,710
TOTAL POPULATION
5,695
MALE POPULATION
6,015
FEMALE POPULATION
94.68
MALES / 100 FEMALES
105.62
FEMALES / 100 MALES
25.2
MEDIAN AGE
3.2
AVG FAMILY SIZE
2.5
AVG HOUSEHOLD SIZE
$21,891
PER CAPITA INCOME
$47,997
AVG FAMILY INCOME
$44,447
AVG HOUSEHOLD INCOME
20.5%
WAGE / INCOME GAP [ % ]
79.5¢/ $1
WAGE / INCOME GAP [ $ ]
$14,857
FAMILY INCOME DEFICIT
0.40
INEQUALITY / GINI INDEX
5,875
LABOR FORCE [ PEOPLE ]
66.8%
PERCENT IN LABOR FORCE
8.3%
UNEMPLOYMENT RATE
Spring Lake Zip Codes
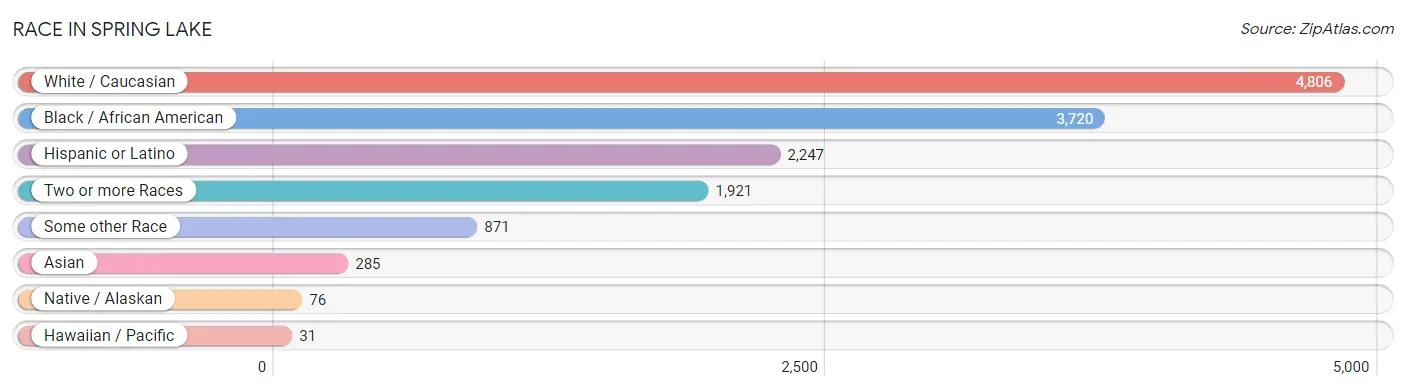
Race in Spring Lake
The most populous races in Spring Lake are White / Caucasian (4,806 | 41.0%), Black / African American (3,720 | 31.8%), and Hispanic or Latino (2,247 | 19.2%).
| Race | # Population | % Population |
| Asian | 285 | 2.4% |
| Black / African American | 3,720 | 31.8% |
| Hawaiian / Pacific | 31 | 0.3% |
| Hispanic or Latino | 2,247 | 19.2% |
| Native / Alaskan | 76 | 0.6% |
| White / Caucasian | 4,806 | 41.0% |
| Two or more Races | 1,921 | 16.4% |
| Some other Race | 871 | 7.4% |
| Total | 11,710 | 100.0% |
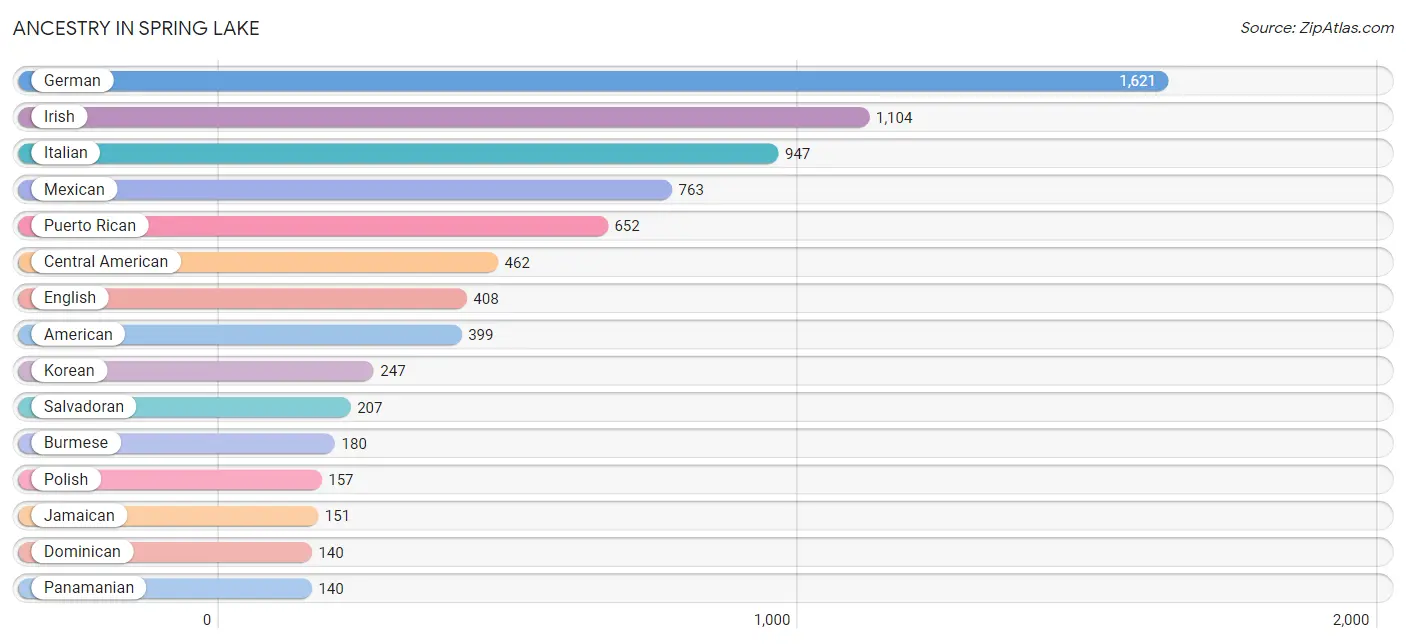
Ancestry in Spring Lake
The most populous ancestries reported in Spring Lake are German (1,621 | 13.8%), Irish (1,104 | 9.4%), Italian (947 | 8.1%), Mexican (763 | 6.5%), and Puerto Rican (652 | 5.6%), together accounting for 43.4% of all Spring Lake residents.
| Ancestry | # Population | % Population |
| African | 21 | 0.2% |
| American | 399 | 3.4% |
| Arapaho | 76 | 0.6% |
| Belgian | 15 | 0.1% |
| Bhutanese | 102 | 0.9% |
| Blackfeet | 8 | 0.1% |
| Brazilian | 63 | 0.5% |
| British | 70 | 0.6% |
| Burmese | 180 | 1.5% |
| Central American | 462 | 4.0% |
| Cherokee | 31 | 0.3% |
| Cheyenne | 13 | 0.1% |
| Chippewa | 9 | 0.1% |
| Colombian | 55 | 0.5% |
| Creek | 8 | 0.1% |
| Cuban | 61 | 0.5% |
| Delaware | 13 | 0.1% |
| Dominican | 140 | 1.2% |
| Dutch | 28 | 0.2% |
| Eastern European | 17 | 0.2% |
| Ecuadorian | 1 | 0.0% |
| English | 408 | 3.5% |
| European | 102 | 0.9% |
| French | 85 | 0.7% |
| French Canadian | 63 | 0.5% |
| German | 1,621 | 13.8% |
| Greek | 10 | 0.1% |
| Guamanian / Chamorro | 18 | 0.2% |
| Guatemalan | 52 | 0.4% |
| Honduran | 23 | 0.2% |
| Hungarian | 89 | 0.8% |
| Indian (Asian) | 84 | 0.7% |
| Irish | 1,104 | 9.4% |
| Israeli | 4 | 0.0% |
| Italian | 947 | 8.1% |
| Jamaican | 151 | 1.3% |
| Japanese | 10 | 0.1% |
| Korean | 247 | 2.1% |
| Lithuanian | 15 | 0.1% |
| Lumbee | 21 | 0.2% |
| Mexican | 763 | 6.5% |
| Mexican American Indian | 20 | 0.2% |
| Native Hawaiian | 74 | 0.6% |
| Navajo | 10 | 0.1% |
| Nicaraguan | 40 | 0.3% |
| Nigerian | 10 | 0.1% |
| Northern European | 4 | 0.0% |
| Norwegian | 42 | 0.4% |
| Panamanian | 140 | 1.2% |
| Peruvian | 16 | 0.1% |
| Polish | 157 | 1.3% |
| Portuguese | 51 | 0.4% |
| Puerto Rican | 652 | 5.6% |
| Russian | 17 | 0.2% |
| Salvadoran | 207 | 1.8% |
| Samoan | 50 | 0.4% |
| Scotch-Irish | 57 | 0.5% |
| Scottish | 115 | 1.0% |
| Sioux | 8 | 0.1% |
| Somali | 29 | 0.3% |
| South American | 105 | 0.9% |
| Spaniard | 40 | 0.3% |
| Sri Lankan | 19 | 0.2% |
| Subsaharan African | 60 | 0.5% |
| Swedish | 60 | 0.5% |
| Thai | 15 | 0.1% |
| Venezuelan | 33 | 0.3% |
| Welsh | 11 | 0.1% | View All 68 Rows |
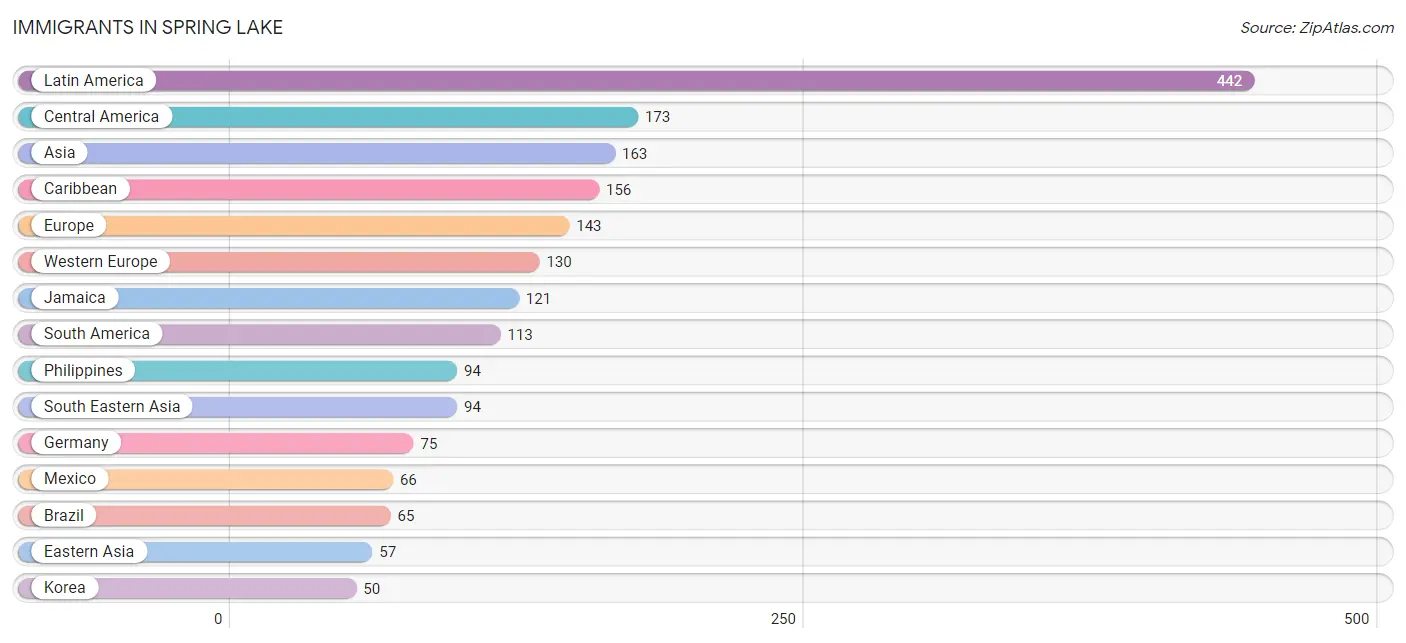
Immigrants in Spring Lake
The most numerous immigrant groups reported in Spring Lake came from Latin America (442 | 3.8%), Central America (173 | 1.5%), Asia (163 | 1.4%), Caribbean (156 | 1.3%), and Europe (143 | 1.2%), together accounting for 9.2% of all Spring Lake residents.
| Immigration Origin | # Population | % Population |
| Asia | 163 | 1.4% |
| Belgium | 15 | 0.1% |
| Brazil | 65 | 0.6% |
| Canada | 11 | 0.1% |
| Caribbean | 156 | 1.3% |
| Central America | 173 | 1.5% |
| Chile | 3 | 0.0% |
| Colombia | 44 | 0.4% |
| Dominican Republic | 35 | 0.3% |
| Eastern Asia | 57 | 0.5% |
| Eastern Europe | 13 | 0.1% |
| Ecuador | 1 | 0.0% |
| El Salvador | 43 | 0.4% |
| Europe | 143 | 1.2% |
| Fiji | 5 | 0.0% |
| France | 40 | 0.3% |
| Germany | 75 | 0.6% |
| Guatemala | 42 | 0.4% |
| Jamaica | 121 | 1.0% |
| Japan | 7 | 0.1% |
| Korea | 50 | 0.4% |
| Latin America | 442 | 3.8% |
| Mexico | 66 | 0.6% |
| Nepal | 12 | 0.1% |
| Oceania | 5 | 0.0% |
| Panama | 22 | 0.2% |
| Philippines | 94 | 0.8% |
| South America | 113 | 1.0% |
| South Central Asia | 12 | 0.1% |
| South Eastern Asia | 94 | 0.8% |
| Western Europe | 130 | 1.1% | View All 31 Rows |
Sex and Age in Spring Lake
Sex and Age in Spring Lake
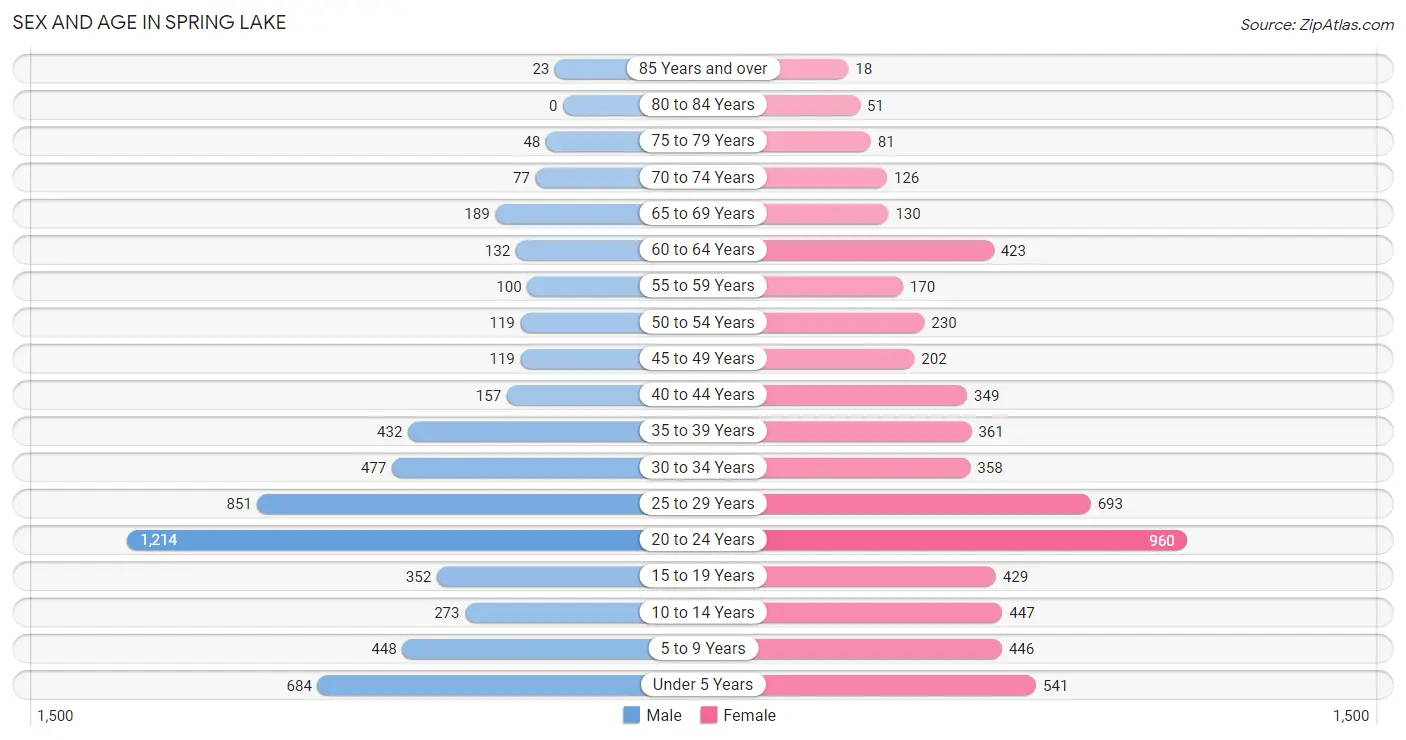
The most populous age groups in Spring Lake are 20 to 24 Years (1,214 | 21.3%) for men and 20 to 24 Years (960 | 16.0%) for women.
| Age Bracket | Male | Female |
| Under 5 Years | 684 (12.0%) | 541 (9.0%) |
| 5 to 9 Years | 448 (7.9%) | 446 (7.4%) |
| 10 to 14 Years | 273 (4.8%) | 447 (7.4%) |
| 15 to 19 Years | 352 (6.2%) | 429 (7.1%) |
| 20 to 24 Years | 1,214 (21.3%) | 960 (16.0%) |
| 25 to 29 Years | 851 (14.9%) | 693 (11.5%) |
| 30 to 34 Years | 477 (8.4%) | 358 (5.9%) |
| 35 to 39 Years | 432 (7.6%) | 361 (6.0%) |
| 40 to 44 Years | 157 (2.8%) | 349 (5.8%) |
| 45 to 49 Years | 119 (2.1%) | 202 (3.4%) |
| 50 to 54 Years | 119 (2.1%) | 230 (3.8%) |
| 55 to 59 Years | 100 (1.8%) | 170 (2.8%) |
| 60 to 64 Years | 132 (2.3%) | 423 (7.0%) |
| 65 to 69 Years | 189 (3.3%) | 130 (2.2%) |
| 70 to 74 Years | 77 (1.3%) | 126 (2.1%) |
| 75 to 79 Years | 48 (0.8%) | 81 (1.3%) |
| 80 to 84 Years | 0 (0.0%) | 51 (0.9%) |
| 85 Years and over | 23 (0.4%) | 18 (0.3%) |
| Total | 5,695 (100.0%) | 6,015 (100.0%) |
Families and Households in Spring Lake
Median Family Size in Spring Lake
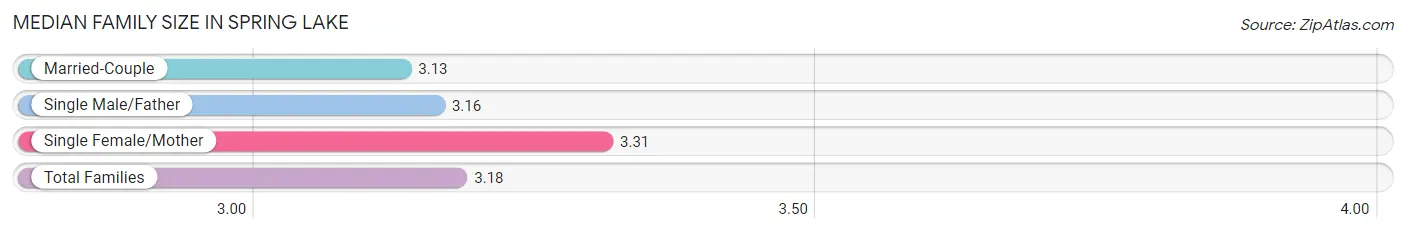
The median family size in Spring Lake is 3.18 persons per family, with single female/mother families (815 | 29.2%) accounting for the largest median family size of 3.31 persons per family. On the other hand, married-couple families (1,813 | 65.0%) represent the smallest median family size with 3.13 persons per family.
| Family Type | # Families | Family Size |
| Married-Couple | 1,813 (65.0%) | 3.13 |
| Single Male/Father | 161 (5.8%) | 3.16 |
| Single Female/Mother | 815 (29.2%) | 3.31 |
| Total Families | 2,789 (100.0%) | 3.18 |
Median Household Size in Spring Lake
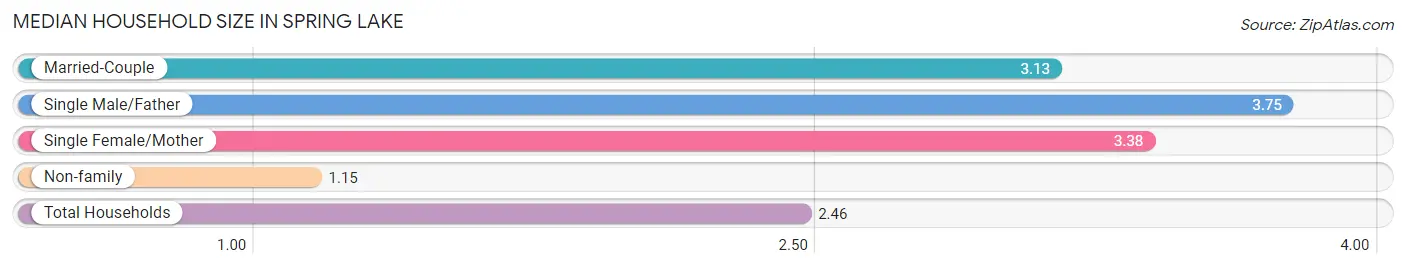
The median household size in Spring Lake is 2.46 persons per household, with single male/father households (161 | 3.6%) accounting for the largest median household size of 3.75 persons per household. non-family households (1,668 | 37.4%) represent the smallest median household size with 1.15 persons per household.
| Household Type | # Households | Household Size |
| Married-Couple | 1,813 (40.7%) | 3.13 |
| Single Male/Father | 161 (3.6%) | 3.75 |
| Single Female/Mother | 815 (18.3%) | 3.38 |
| Non-family | 1,668 (37.4%) | 1.15 |
| Total Households | 4,457 (100.0%) | 2.46 |
Household Size by Marriage Status in Spring Lake
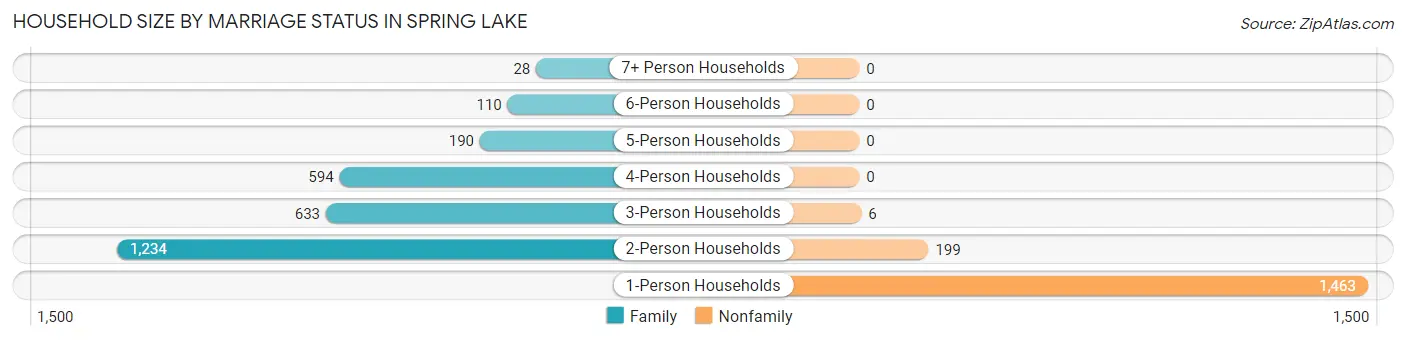
Out of a total of 4,457 households in Spring Lake, 2,789 (62.6%) are family households, while 1,668 (37.4%) are nonfamily households. The most numerous type of family households are 2-person households, comprising 1,234, and the most common type of nonfamily households are 1-person households, comprising 1,463.
| Household Size | Family Households | Nonfamily Households |
| 1-Person Households | - | 1,463 (32.8%) |
| 2-Person Households | 1,234 (27.7%) | 199 (4.5%) |
| 3-Person Households | 633 (14.2%) | 6 (0.1%) |
| 4-Person Households | 594 (13.3%) | 0 (0.0%) |
| 5-Person Households | 190 (4.3%) | 0 (0.0%) |
| 6-Person Households | 110 (2.5%) | 0 (0.0%) |
| 7+ Person Households | 28 (0.6%) | 0 (0.0%) |
| Total | 2,789 (62.6%) | 1,668 (37.4%) |
Female Fertility in Spring Lake
Fertility by Age in Spring Lake
Average fertility rate in Spring Lake is 95.0 births per 1,000 women. Women in the age bracket of 20 to 34 years have the highest fertility rate with 160.0 births per 1,000 women. Women in the age bracket of 20 to 34 years acount for 100.0% of all women with births.
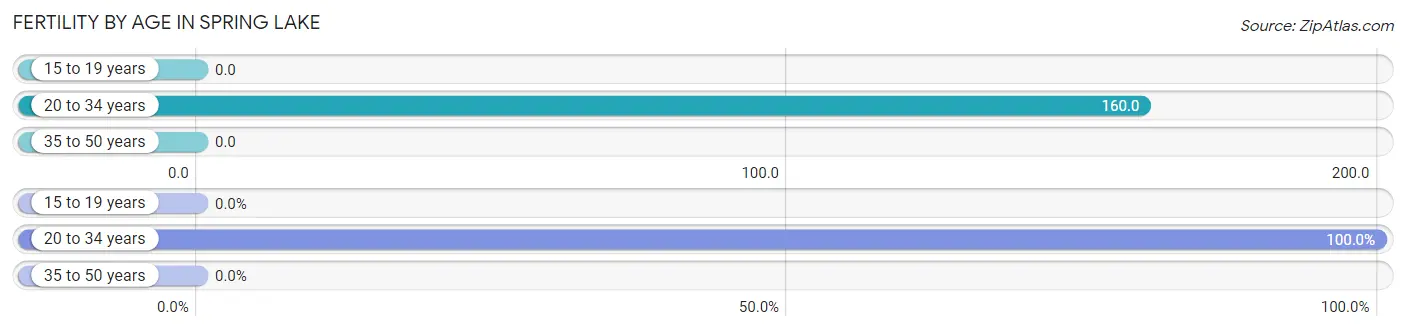
| Age Bracket | Women with Births | Births / 1,000 Women |
| 15 to 19 years | 0 (0.0%) | 0.0 |
| 20 to 34 years | 321 (100.0%) | 160.0 |
| 35 to 50 years | 0 (0.0%) | 0.0 |
| Total | 321 (100.0%) | 95.0 |
Fertility by Age by Marriage Status in Spring Lake
90.3% of women with births (321) in Spring Lake are married. The highest percentage of unmarried women with births falls into 20 to 34 years age bracket with 9.7% of them unmarried at the time of birth, while the lowest percentage of unmarried women with births belong to 20 to 34 years age bracket with 9.7% of them unmarried.
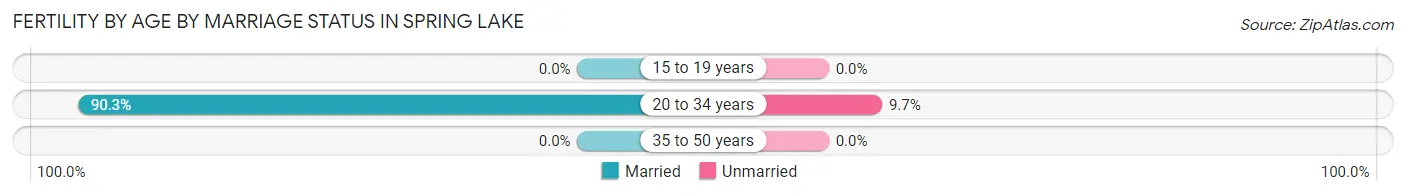
| Age Bracket | Married | Unmarried |
| 15 to 19 years | 0 (0.0%) | 0 (0.0%) |
| 20 to 34 years | 290 (90.3%) | 31 (9.7%) |
| 35 to 50 years | 0 (0.0%) | 0 (0.0%) |
| Total | 290 (90.3%) | 31 (9.7%) |
Fertility by Education in Spring Lake
Average fertility rate in Spring Lake is 95.0 births per 1,000 women. Women with the education attainment of high school diploma have the highest fertility rate of 131.0 births per 1,000 women, while women with the education attainment of graduate degree have the lowest fertility at 44.0 births per 1,000 women. Women with the education attainment of high school diploma represent 36.8% of all women with births.
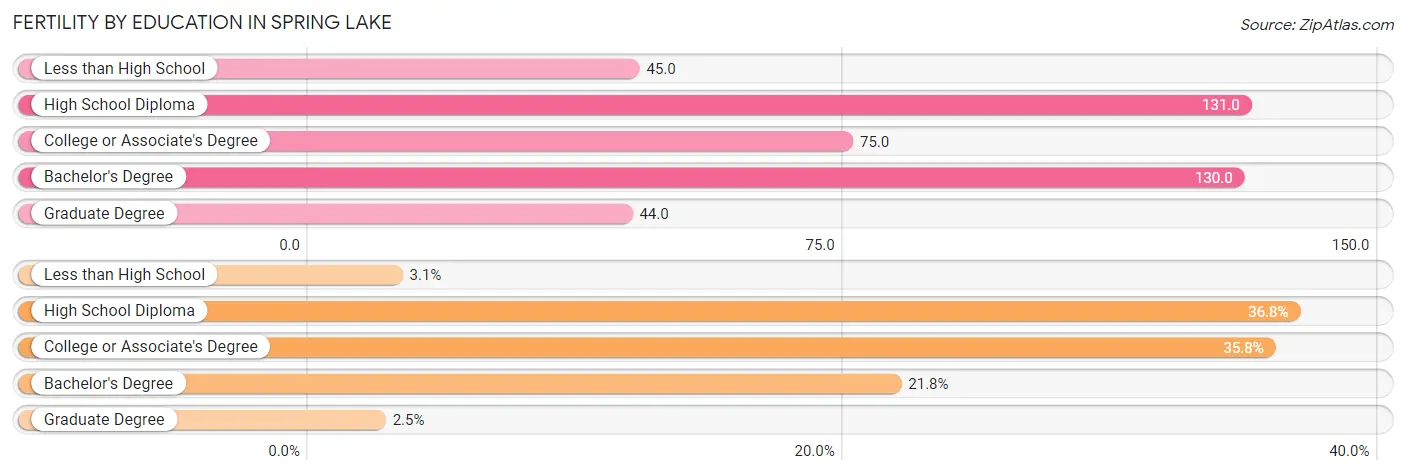
| Educational Attainment | Women with Births | Births / 1,000 Women |
| Less than High School | 10 (3.1%) | 45.0 |
| High School Diploma | 118 (36.8%) | 131.0 |
| College or Associate's Degree | 115 (35.8%) | 75.0 |
| Bachelor's Degree | 70 (21.8%) | 130.0 |
| Graduate Degree | 8 (2.5%) | 44.0 |
| Total | 321 (100.0%) | 95.0 |
Fertility by Education by Marriage Status in Spring Lake
9.7% of women with births in Spring Lake are unmarried. Women with the educational attainment of college or associate's degree are most likely to be married with 100.0% of them married at childbirth, while women with the educational attainment of less than high school are least likely to be married with 100.0% of them unmarried at childbirth.
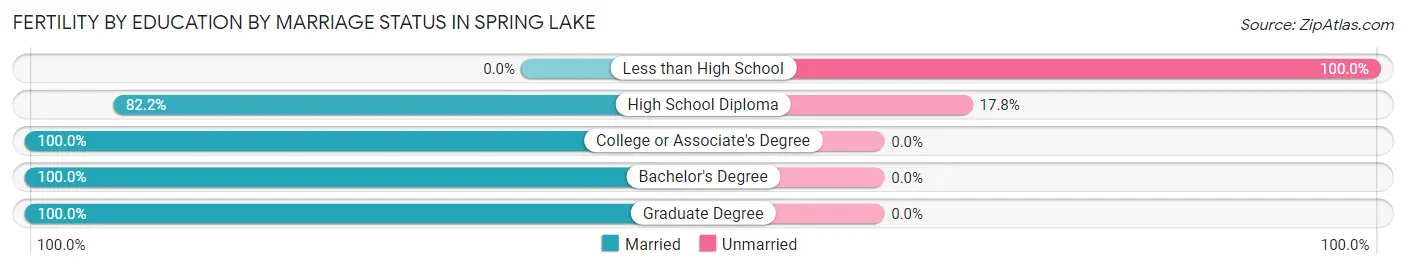
| Educational Attainment | Married | Unmarried |
| Less than High School | 0 (0.0%) | 10 (100.0%) |
| High School Diploma | 97 (82.2%) | 21 (17.8%) |
| College or Associate's Degree | 115 (100.0%) | 0 (0.0%) |
| Bachelor's Degree | 70 (100.0%) | 0 (0.0%) |
| Graduate Degree | 8 (100.0%) | 0 (0.0%) |
| Total | 290 (90.3%) | 31 (9.7%) |
Income in Spring Lake
Income Overview in Spring Lake
Per Capita Income in Spring Lake is $21,891, while median incomes of families and households are $47,997 and $44,447 respectively.
| Characteristic | Number | Measure |
| Per Capita Income | 11,710 | $21,891 |
| Median Family Income | 2,789 | $47,997 |
| Mean Family Income | 2,789 | $54,986 |
| Median Household Income | 4,457 | $44,447 |
| Mean Household Income | 4,457 | $50,881 |
| Income Deficit | 2,789 | $14,857 |
| Wage / Income Gap (%) | 11,710 | 20.55% |
| Wage / Income Gap ($) | 11,710 | 79.45¢ per $1 |
| Gini / Inequality Index | 11,710 | 0.40 |
Earnings by Sex in Spring Lake
Average Earnings in Spring Lake are $33,064, $35,412 for men and $28,136 for women, a difference of 20.5%.
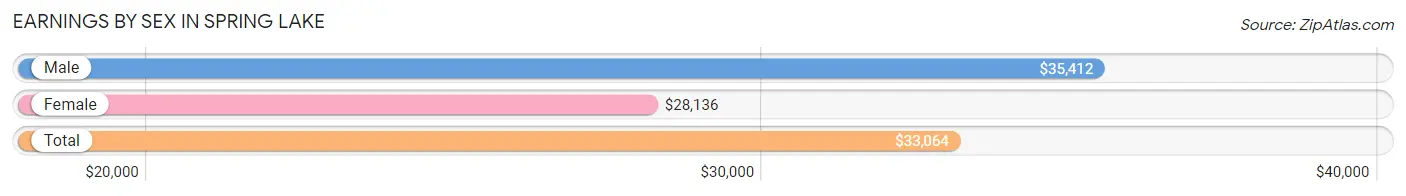
| Sex | Number | Average Earnings |
| Male | 3,402 (56.1%) | $35,412 |
| Female | 2,666 (43.9%) | $28,136 |
| Total | 6,068 (100.0%) | $33,064 |
Earnings by Sex by Income Bracket in Spring Lake
The most common earnings brackets in Spring Lake are $25,000 to $29,999 for men (514 | 15.1%) and $25,000 to $29,999 for women (454 | 17.0%).
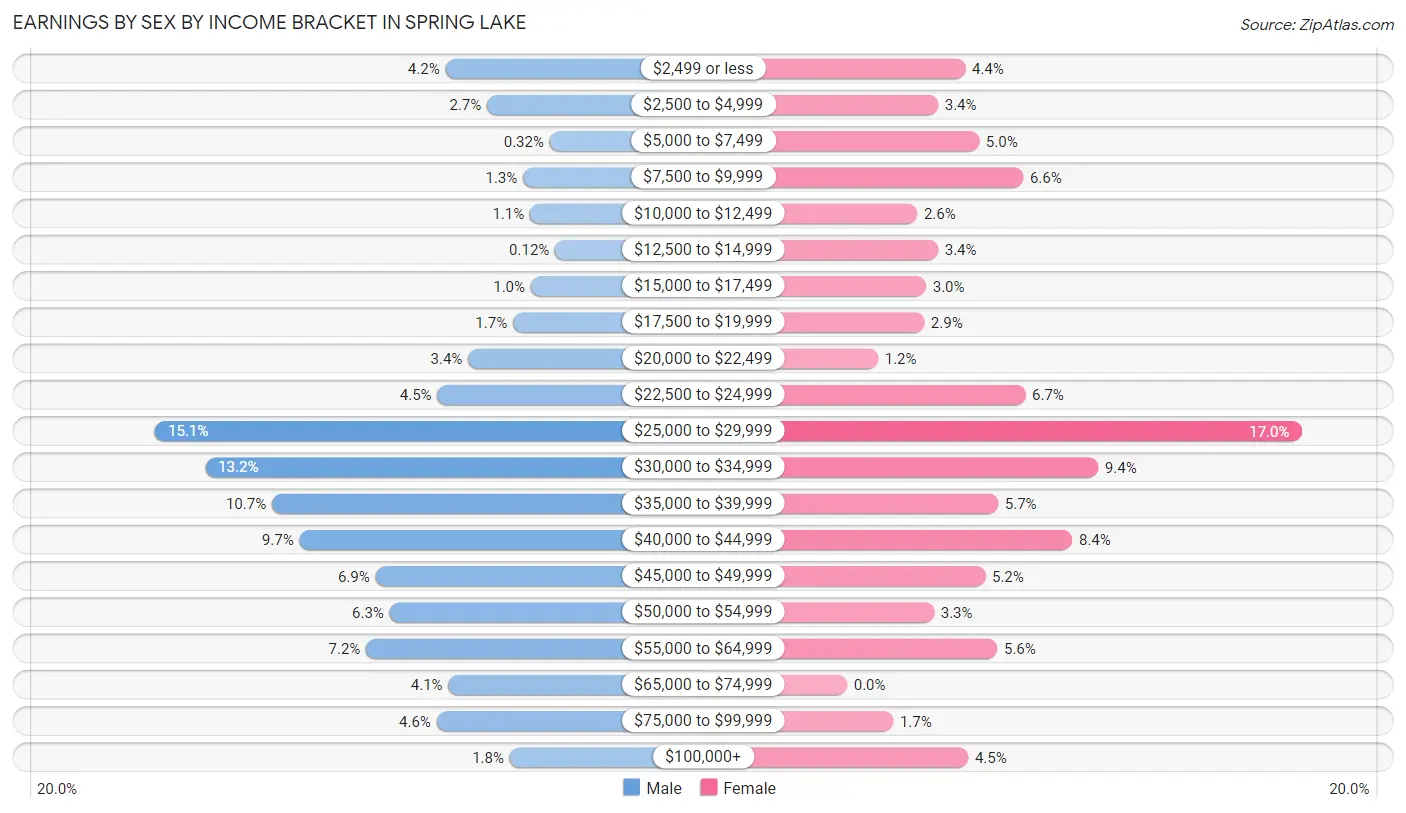
| Income | Male | Female |
| $2,499 or less | 144 (4.2%) | 118 (4.4%) |
| $2,500 to $4,999 | 91 (2.7%) | 91 (3.4%) |
| $5,000 to $7,499 | 11 (0.3%) | 132 (5.0%) |
| $7,500 to $9,999 | 45 (1.3%) | 176 (6.6%) |
| $10,000 to $12,499 | 36 (1.1%) | 70 (2.6%) |
| $12,500 to $14,999 | 4 (0.1%) | 91 (3.4%) |
| $15,000 to $17,499 | 35 (1.0%) | 79 (3.0%) |
| $17,500 to $19,999 | 58 (1.7%) | 77 (2.9%) |
| $20,000 to $22,499 | 115 (3.4%) | 31 (1.2%) |
| $22,500 to $24,999 | 154 (4.5%) | 178 (6.7%) |
| $25,000 to $29,999 | 514 (15.1%) | 454 (17.0%) |
| $30,000 to $34,999 | 450 (13.2%) | 251 (9.4%) |
| $35,000 to $39,999 | 365 (10.7%) | 151 (5.7%) |
| $40,000 to $44,999 | 330 (9.7%) | 225 (8.4%) |
| $45,000 to $49,999 | 233 (6.9%) | 138 (5.2%) |
| $50,000 to $54,999 | 215 (6.3%) | 87 (3.3%) |
| $55,000 to $64,999 | 245 (7.2%) | 150 (5.6%) |
| $65,000 to $74,999 | 140 (4.1%) | 0 (0.0%) |
| $75,000 to $99,999 | 155 (4.6%) | 46 (1.7%) |
| $100,000+ | 62 (1.8%) | 121 (4.5%) |
| Total | 3,402 (100.0%) | 2,666 (100.0%) |
Earnings by Sex by Educational Attainment in Spring Lake
Average earnings in Spring Lake are $40,838 for men and $32,680 for women, a difference of 20.0%. Men with an educational attainment of graduate degree enjoy the highest average annual earnings of $51,711, while those with bachelor's degree education earn the least with $37,056. Women with an educational attainment of graduate degree earn the most with the average annual earnings of $55,735, while those with high school diploma education have the smallest earnings of $19,551.
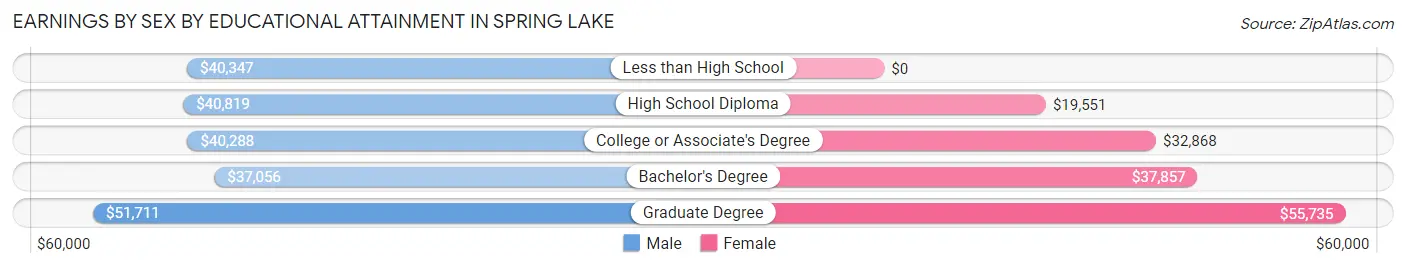
| Educational Attainment | Male Income | Female Income |
| Less than High School | $40,347 | $0 |
| High School Diploma | $40,819 | $19,551 |
| College or Associate's Degree | $40,288 | $32,868 |
| Bachelor's Degree | $37,056 | $37,857 |
| Graduate Degree | $51,711 | $55,735 |
| Total | $40,838 | $32,680 |
Family Income in Spring Lake
Family Income Brackets in Spring Lake
According to the Spring Lake family income data, there are 747 families falling into the $50,000 to $74,999 income range, which is the most common income bracket and makes up 26.8% of all families. Conversely, the $150,000 to $199,999 income bracket is the least frequent group with only 36 families (1.3%) belonging to this category.
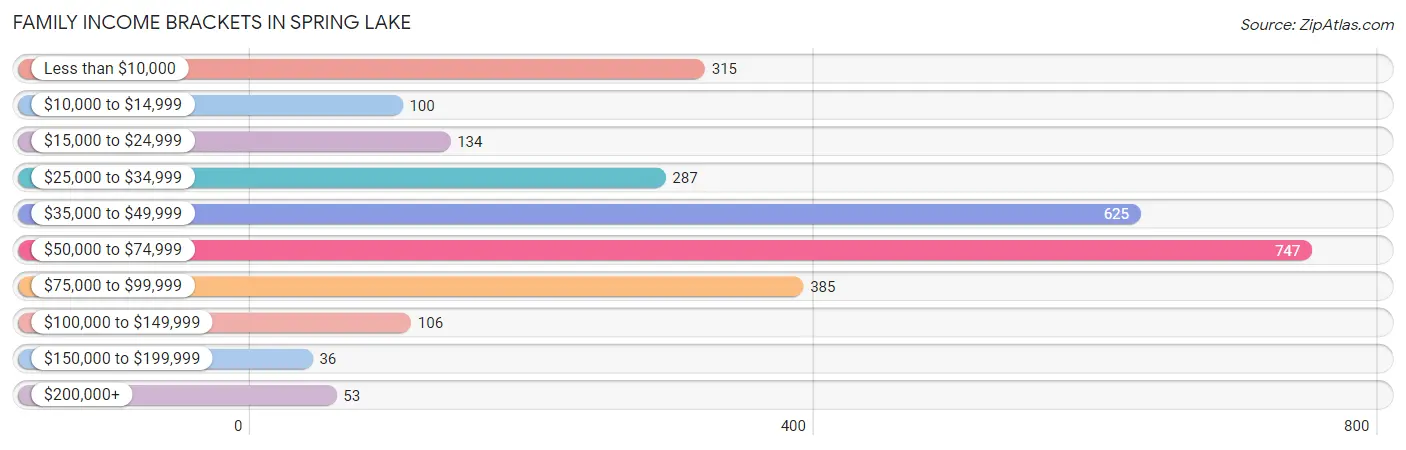
| Income Bracket | # Families | % Families |
| Less than $10,000 | 315 | 11.3% |
| $10,000 to $14,999 | 100 | 3.6% |
| $15,000 to $24,999 | 134 | 4.8% |
| $25,000 to $34,999 | 287 | 10.3% |
| $35,000 to $49,999 | 625 | 22.4% |
| $50,000 to $74,999 | 747 | 26.8% |
| $75,000 to $99,999 | 385 | 13.8% |
| $100,000 to $149,999 | 106 | 3.8% |
| $150,000 to $199,999 | 36 | 1.3% |
| $200,000+ | 53 | 1.9% |
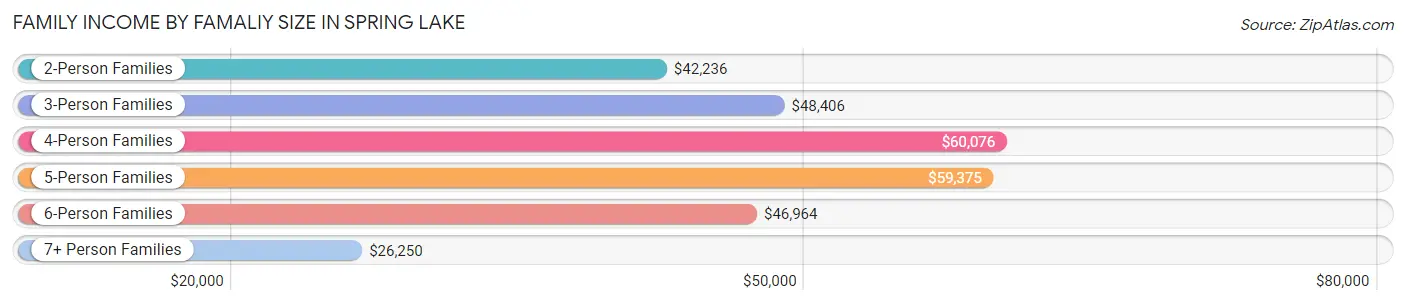
Family Income by Famaliy Size in Spring Lake
4-person families (525 | 18.8%) account for the highest median family income in Spring Lake with $60,076 per family, while 2-person families (1,289 | 46.2%) have the highest median income of $21,118 per family member.
| Income Bracket | # Families | Median Income |
| 2-Person Families | 1,289 (46.2%) | $42,236 |
| 3-Person Families | 647 (23.2%) | $48,406 |
| 4-Person Families | 525 (18.8%) | $60,076 |
| 5-Person Families | 235 (8.4%) | $59,375 |
| 6-Person Families | 65 (2.3%) | $46,964 |
| 7+ Person Families | 28 (1.0%) | $26,250 |
| Total | 2,789 (100.0%) | $47,997 |
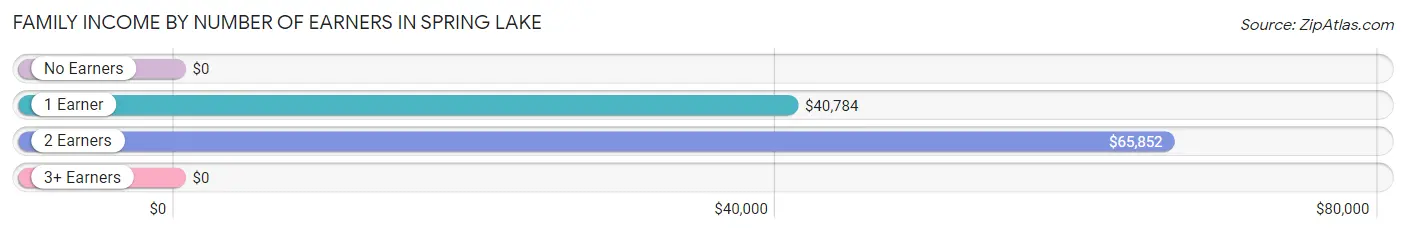
Family Income by Number of Earners in Spring Lake
| Number of Earners | # Families | Median Income |
| No Earners | 433 (15.5%) | $0 |
| 1 Earner | 1,111 (39.8%) | $40,784 |
| 2 Earners | 1,174 (42.1%) | $65,852 |
| 3+ Earners | 71 (2.5%) | $0 |
| Total | 2,789 (100.0%) | $47,997 |
Household Income in Spring Lake
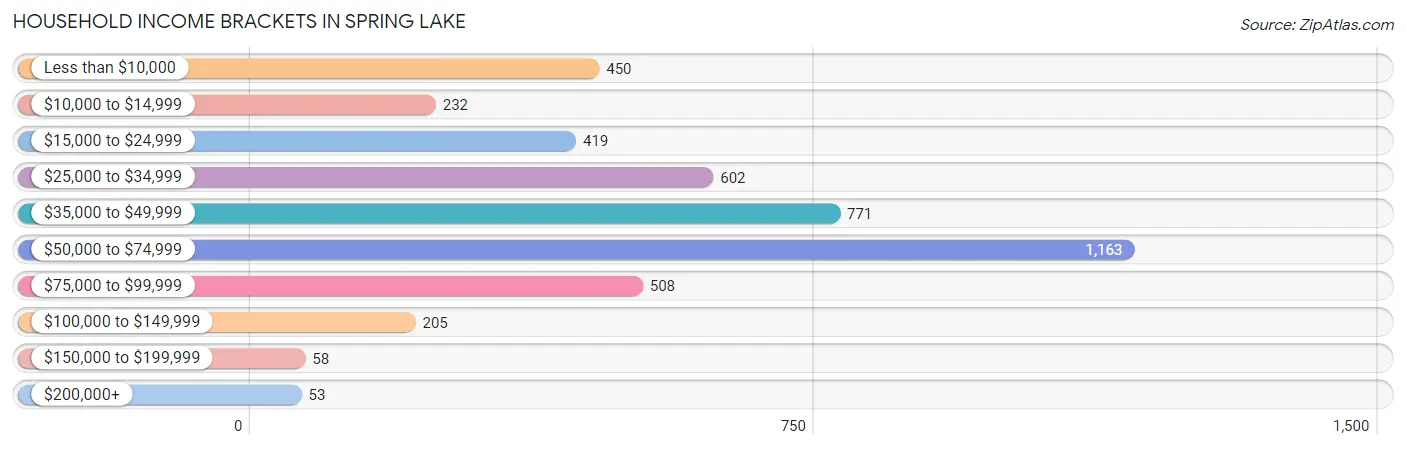
Household Income Brackets in Spring Lake
With 1,163 households falling in the category, the $50,000 to $74,999 income range is the most frequent in Spring Lake, accounting for 26.1% of all households. In contrast, only 53 households (1.2%) fall into the $200,000+ income bracket, making it the least populous group.
| Income Bracket | # Households | % Households |
| Less than $10,000 | 450 | 10.1% |
| $10,000 to $14,999 | 232 | 5.2% |
| $15,000 to $24,999 | 419 | 9.4% |
| $25,000 to $34,999 | 602 | 13.5% |
| $35,000 to $49,999 | 771 | 17.3% |
| $50,000 to $74,999 | 1,163 | 26.1% |
| $75,000 to $99,999 | 508 | 11.4% |
| $100,000 to $149,999 | 205 | 4.6% |
| $150,000 to $199,999 | 58 | 1.3% |
| $200,000+ | 53 | 1.2% |
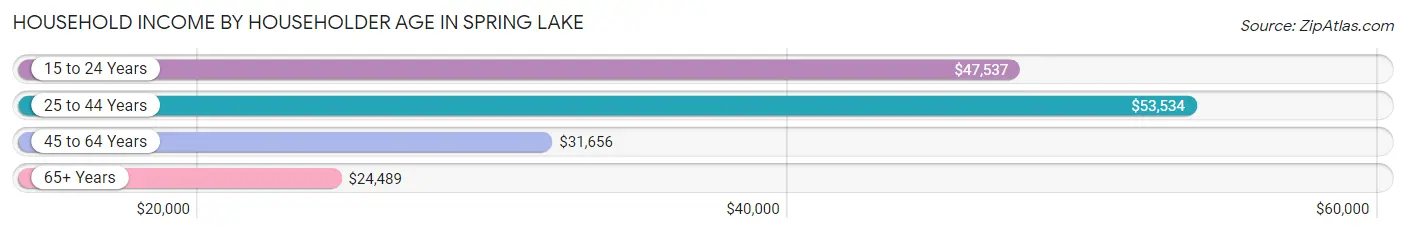
Household Income by Householder Age in Spring Lake
The median household income in Spring Lake is $44,447, with the highest median household income of $53,534 found in the 25 to 44 years age bracket for the primary householder. A total of 2,136 households (47.9%) fall into this category. Meanwhile, the 65+ years age bracket for the primary householder has the lowest median household income of $24,489, with 475 households (10.7%) in this group.
| Income Bracket | # Households | Median Income |
| 15 to 24 Years | 933 (20.9%) | $47,537 |
| 25 to 44 Years | 2,136 (47.9%) | $53,534 |
| 45 to 64 Years | 913 (20.5%) | $31,656 |
| 65+ Years | 475 (10.7%) | $24,489 |
| Total | 4,457 (100.0%) | $44,447 |
Poverty in Spring Lake
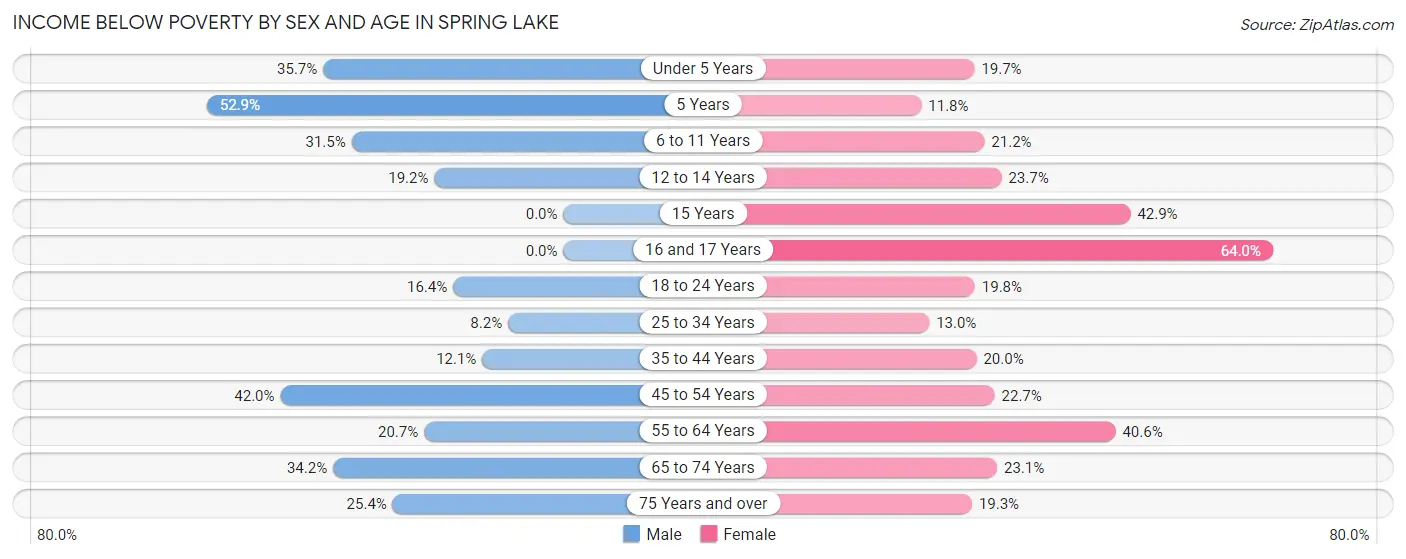
Income Below Poverty by Sex and Age in Spring Lake
With 20.7% poverty level for males and 22.0% for females among the residents of Spring Lake, 5 year old males and 16 and 17 year old females are the most vulnerable to poverty, with 18 males (52.9%) and 64 females (64.0%) in their respective age groups living below the poverty level.
| Age Bracket | Male | Female |
| Under 5 Years | 244 (35.7%) | 105 (19.7%) |
| 5 Years | 18 (52.9%) | 17 (11.8%) |
| 6 to 11 Years | 178 (31.5%) | 97 (21.2%) |
| 12 to 14 Years | 23 (19.2%) | 69 (23.7%) |
| 15 Years | 0 (0.0%) | 15 (42.9%) |
| 16 and 17 Years | 0 (0.0%) | 64 (64.0%) |
| 18 to 24 Years | 153 (16.4%) | 231 (19.8%) |
| 25 to 34 Years | 94 (8.2%) | 136 (13.0%) |
| 35 to 44 Years | 71 (12.0%) | 142 (20.0%) |
| 45 to 54 Years | 100 (42.0%) | 98 (22.7%) |
| 55 to 64 Years | 48 (20.7%) | 241 (40.6%) |
| 65 to 74 Years | 91 (34.2%) | 59 (23.1%) |
| 75 Years and over | 18 (25.4%) | 29 (19.3%) |
| Total | 1,038 (20.7%) | 1,303 (22.0%) |
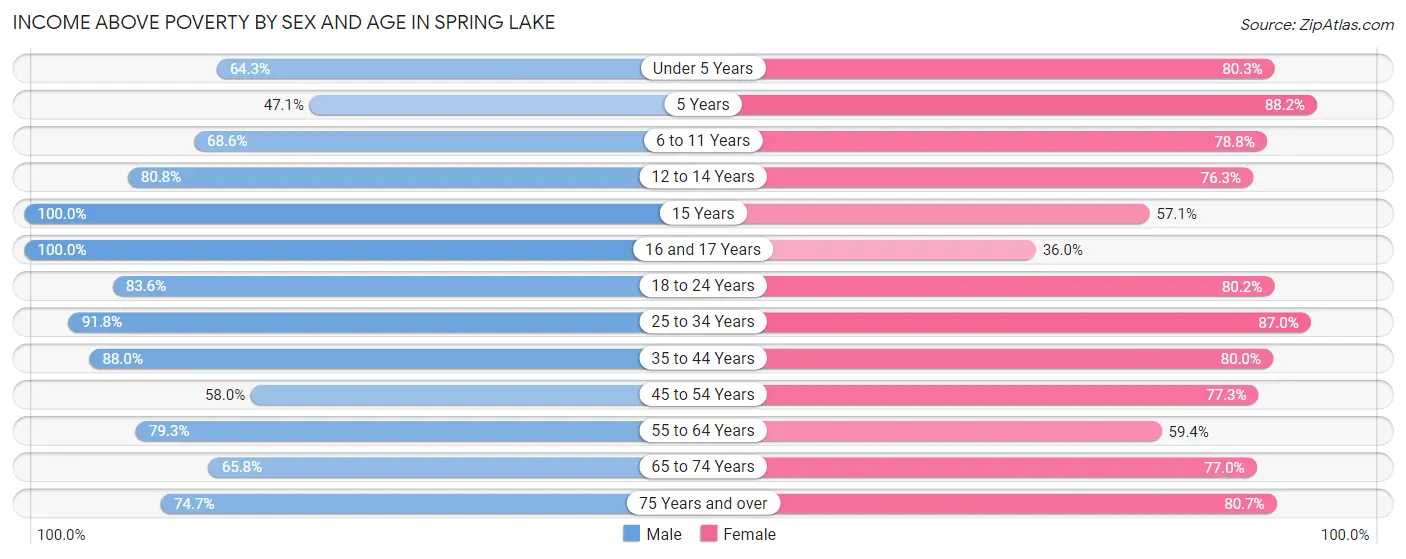
Income Above Poverty by Sex and Age in Spring Lake
According to the poverty statistics in Spring Lake, males aged 15 years and females aged 5 years are the age groups that are most secure financially, with 100.0% of males and 88.2% of females in these age groups living above the poverty line.
| Age Bracket | Male | Female |
| Under 5 Years | 440 (64.3%) | 428 (80.3%) |
| 5 Years | 16 (47.1%) | 127 (88.2%) |
| 6 to 11 Years | 388 (68.5%) | 361 (78.8%) |
| 12 to 14 Years | 97 (80.8%) | 222 (76.3%) |
| 15 Years | 41 (100.0%) | 20 (57.1%) |
| 16 and 17 Years | 106 (100.0%) | 36 (36.0%) |
| 18 to 24 Years | 781 (83.6%) | 938 (80.2%) |
| 25 to 34 Years | 1,050 (91.8%) | 912 (87.0%) |
| 35 to 44 Years | 518 (87.9%) | 568 (80.0%) |
| 45 to 54 Years | 138 (58.0%) | 334 (77.3%) |
| 55 to 64 Years | 184 (79.3%) | 352 (59.4%) |
| 65 to 74 Years | 175 (65.8%) | 197 (76.9%) |
| 75 Years and over | 53 (74.7%) | 121 (80.7%) |
| Total | 3,987 (79.3%) | 4,616 (78.0%) |
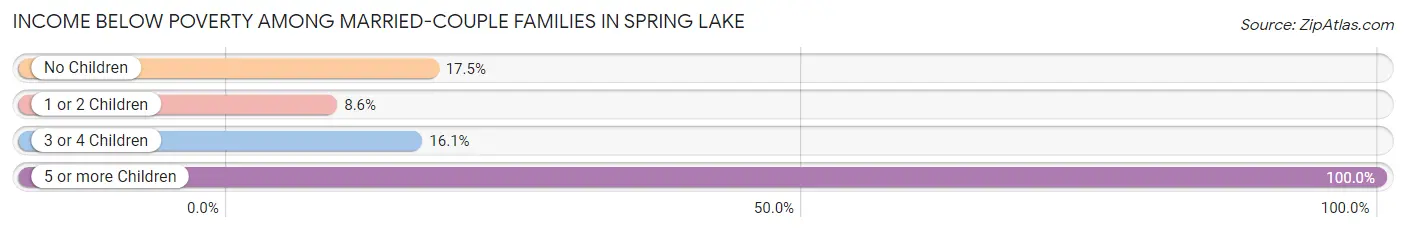
Income Below Poverty Among Married-Couple Families in Spring Lake
The poverty statistics for married-couple families in Spring Lake show that 14.6% or 264 of the total 1,813 families live below the poverty line. Families with 5 or more children have the highest poverty rate of 100.0%, comprising of 12 families. On the other hand, families with 1 or 2 children have the lowest poverty rate of 8.6%, which includes 59 families.
| Children | Above Poverty | Below Poverty |
| No Children | 789 (82.5%) | 167 (17.5%) |
| 1 or 2 Children | 624 (91.4%) | 59 (8.6%) |
| 3 or 4 Children | 136 (84.0%) | 26 (16.1%) |
| 5 or more Children | 0 (0.0%) | 12 (100.0%) |
| Total | 1,549 (85.4%) | 264 (14.6%) |
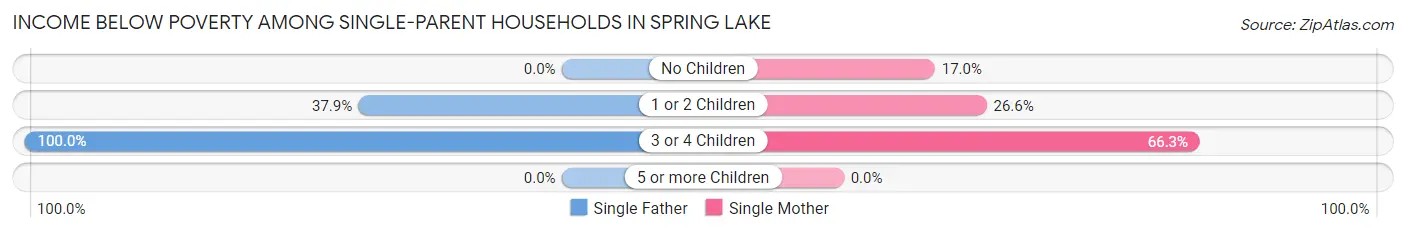
Income Below Poverty Among Single-Parent Households in Spring Lake
According to the poverty data in Spring Lake, 30.4% or 49 single-father households and 29.0% or 236 single-mother households are living below the poverty line. Among single-father households, those with 3 or 4 children have the highest poverty rate, with 13 households (100.0%) experiencing poverty. Likewise, among single-mother households, those with 3 or 4 children have the highest poverty rate, with 67 households (66.3%) falling below the poverty line.
| Children | Single Father | Single Mother |
| No Children | 0 (0.0%) | 37 (17.0%) |
| 1 or 2 Children | 36 (37.9%) | 132 (26.6%) |
| 3 or 4 Children | 13 (100.0%) | 67 (66.3%) |
| 5 or more Children | 0 (0.0%) | 0 (0.0%) |
| Total | 49 (30.4%) | 236 (29.0%) |
Income Below Poverty Among Married-Couple vs Single-Parent Households in Spring Lake
The poverty data for Spring Lake shows that 264 of the married-couple family households (14.6%) and 285 of the single-parent households (29.2%) are living below the poverty level. Within the married-couple family households, those with 5 or more children have the highest poverty rate, with 12 households (100.0%) falling below the poverty line. Among the single-parent households, those with 3 or 4 children have the highest poverty rate, with 80 household (70.2%) living below poverty.
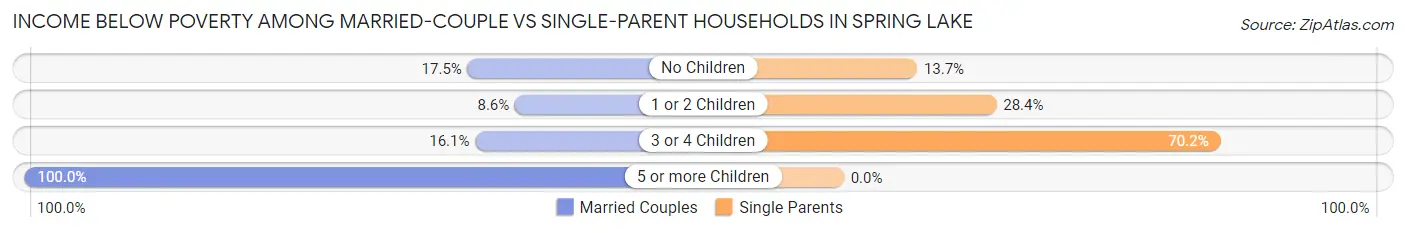
| Children | Married-Couple Families | Single-Parent Households |
| No Children | 167 (17.5%) | 37 (13.7%) |
| 1 or 2 Children | 59 (8.6%) | 168 (28.4%) |
| 3 or 4 Children | 26 (16.1%) | 80 (70.2%) |
| 5 or more Children | 12 (100.0%) | 0 (0.0%) |
| Total | 264 (14.6%) | 285 (29.2%) |
Employment Characteristics in Spring Lake
Employment by Class of Employer in Spring Lake
Among the 5,449 employed individuals in Spring Lake, federal government employees (2,656 | 48.7%), private company employees (2,241 | 41.1%), and local government employees (170 | 3.1%) make up the most common classes of employment.
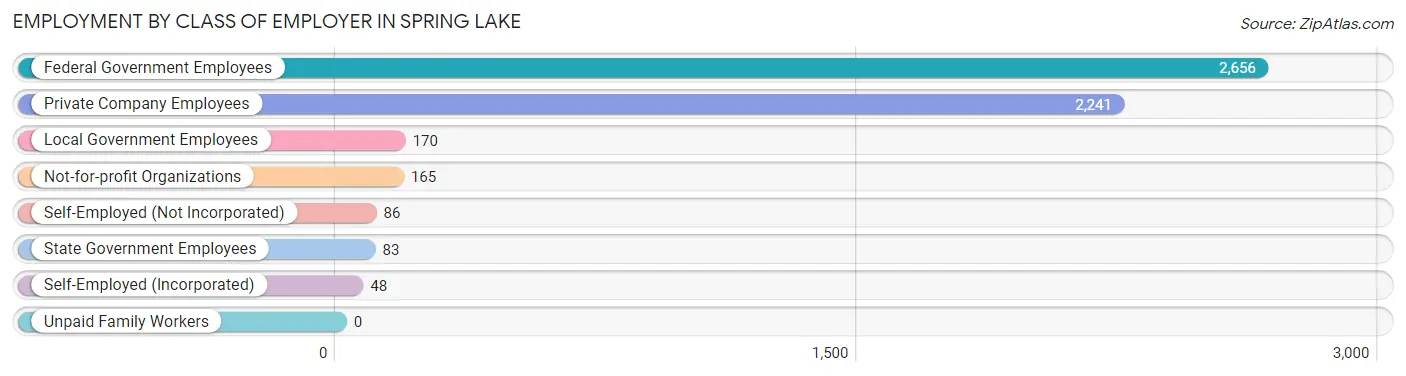
| Employer Class | # Employees | % Employees |
| Private Company Employees | 2,241 | 41.1% |
| Self-Employed (Incorporated) | 48 | 0.9% |
| Self-Employed (Not Incorporated) | 86 | 1.6% |
| Not-for-profit Organizations | 165 | 3.0% |
| Local Government Employees | 170 | 3.1% |
| State Government Employees | 83 | 1.5% |
| Federal Government Employees | 2,656 | 48.7% |
| Unpaid Family Workers | 0 | 0.0% |
| Total | 5,449 | 100.0% |
Employment Status by Age in Spring Lake
According to the labor force statistics for Spring Lake, out of the total population over 16 years of age (8,795), 66.8% or 5,875 individuals are in the labor force, with 8.3% or 488 of them unemployed. The age group with the highest labor force participation rate is 25 to 29 years, with 84.8% or 1,309 individuals in the labor force. Within the labor force, the 25 to 29 years age range has the highest percentage of unemployed individuals, with 14.6% or 191 of them being unemployed.
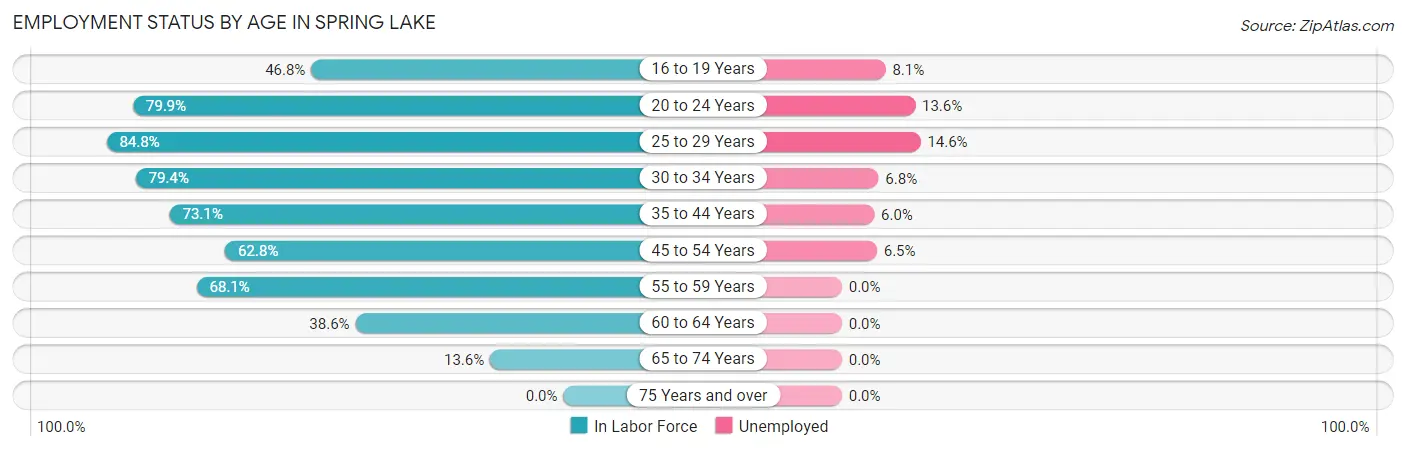
| Age Bracket | In Labor Force | Unemployed |
| 16 to 19 Years | 330 (46.8%) | 27 (8.1%) |
| 20 to 24 Years | 1,737 (79.9%) | 236 (13.6%) |
| 25 to 29 Years | 1,309 (84.8%) | 191 (14.6%) |
| 30 to 34 Years | 663 (79.4%) | 45 (6.8%) |
| 35 to 44 Years | 950 (73.1%) | 57 (6.0%) |
| 45 to 54 Years | 421 (62.8%) | 27 (6.5%) |
| 55 to 59 Years | 184 (68.1%) | 0 (0.0%) |
| 60 to 64 Years | 214 (38.6%) | 0 (0.0%) |
| 65 to 74 Years | 71 (13.6%) | 0 (0.0%) |
| 75 Years and over | 0 (0.0%) | 0 (0.0%) |
| Total | 5,875 (66.8%) | 488 (8.3%) |
Employment Status by Educational Attainment in Spring Lake
According to labor force statistics for Spring Lake, 72.3% of individuals (3,740) out of the total population between 25 and 64 years of age (5,173) are in the labor force, with 7.3% or 273 of them being unemployed. The group with the highest labor force participation rate are those with the educational attainment of bachelor's degree or higher, with 81.4% or 1,227 individuals in the labor force. Within the labor force, individuals with high school diploma education have the highest percentage of unemployment, with 12.5% or 86 of them being unemployed.
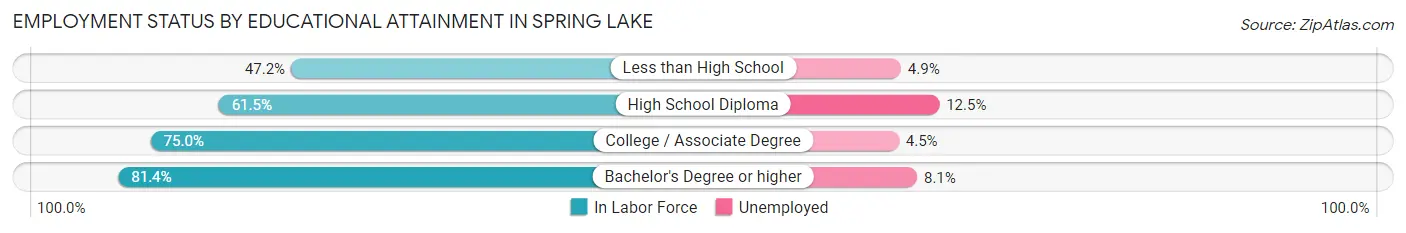
| Educational Attainment | In Labor Force | Unemployed |
| Less than High School | 143 (47.2%) | 15 (4.9%) |
| High School Diploma | 689 (61.5%) | 140 (12.5%) |
| College / Associate Degree | 1,682 (75.0%) | 101 (4.5%) |
| Bachelor's Degree or higher | 1,227 (81.4%) | 122 (8.1%) |
| Total | 3,740 (72.3%) | 378 (7.3%) |
Employment Occupations by Sex in Spring Lake
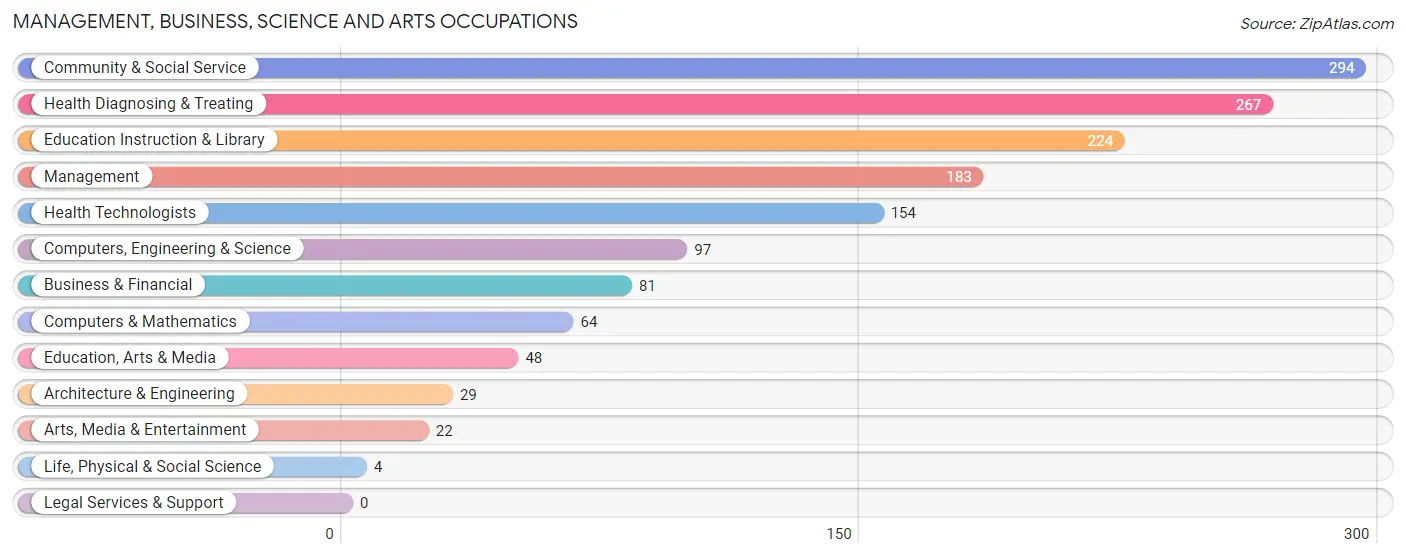
Management, Business, Science and Arts Occupations
The most common Management, Business, Science and Arts occupations in Spring Lake are Community & Social Service (294 | 9.0%), Health Diagnosing & Treating (267 | 8.2%), Education Instruction & Library (224 | 6.9%), Management (183 | 5.6%), and Health Technologists (154 | 4.7%).
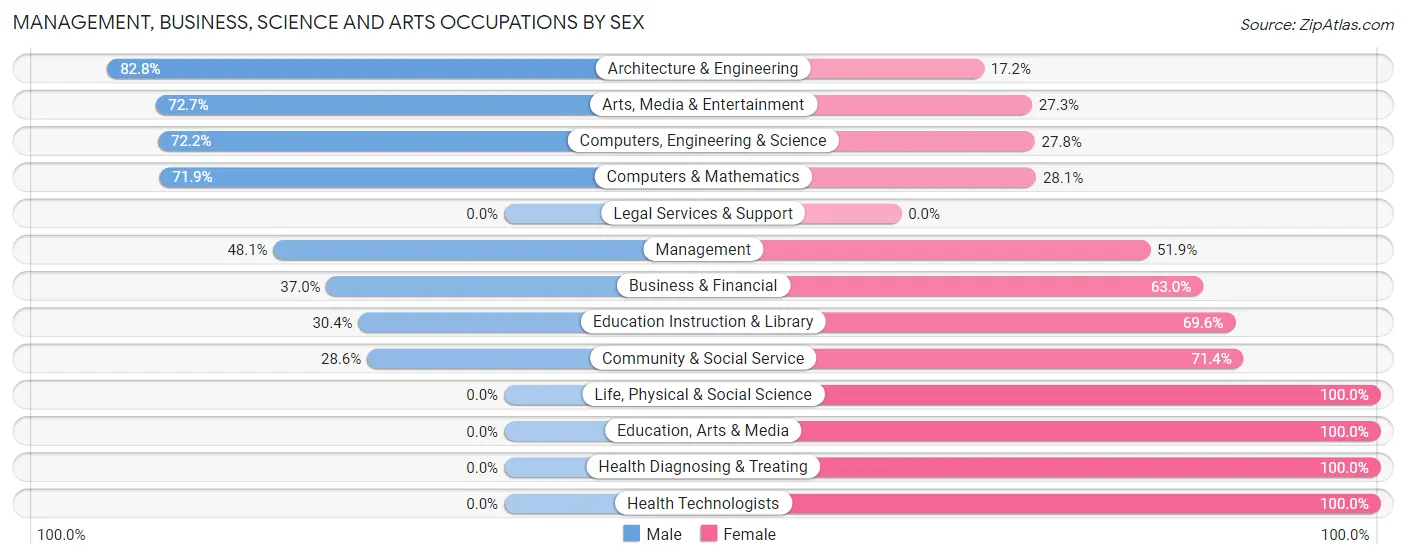
Management, Business, Science and Arts Occupations by Sex
Within the Management, Business, Science and Arts occupations in Spring Lake, the most male-oriented occupations are Architecture & Engineering (82.8%), Arts, Media & Entertainment (72.7%), and Computers, Engineering & Science (72.2%), while the most female-oriented occupations are Life, Physical & Social Science (100.0%), Education, Arts & Media (100.0%), and Health Diagnosing & Treating (100.0%).
| Occupation | Male | Female |
| Management | 88 (48.1%) | 95 (51.9%) |
| Business & Financial | 30 (37.0%) | 51 (63.0%) |
| Computers, Engineering & Science | 70 (72.2%) | 27 (27.8%) |
| Computers & Mathematics | 46 (71.9%) | 18 (28.1%) |
| Architecture & Engineering | 24 (82.8%) | 5 (17.2%) |
| Life, Physical & Social Science | 0 (0.0%) | 4 (100.0%) |
| Community & Social Service | 84 (28.6%) | 210 (71.4%) |
| Education, Arts & Media | 0 (0.0%) | 48 (100.0%) |
| Legal Services & Support | 0 (0.0%) | 0 (0.0%) |
| Education Instruction & Library | 68 (30.4%) | 156 (69.6%) |
| Arts, Media & Entertainment | 16 (72.7%) | 6 (27.3%) |
| Health Diagnosing & Treating | 0 (0.0%) | 267 (100.0%) |
| Health Technologists | 0 (0.0%) | 154 (100.0%) |
| Total (Category) | 272 (29.5%) | 650 (70.5%) |
| Total (Overall) | 1,251 (38.5%) | 1,998 (61.5%) |
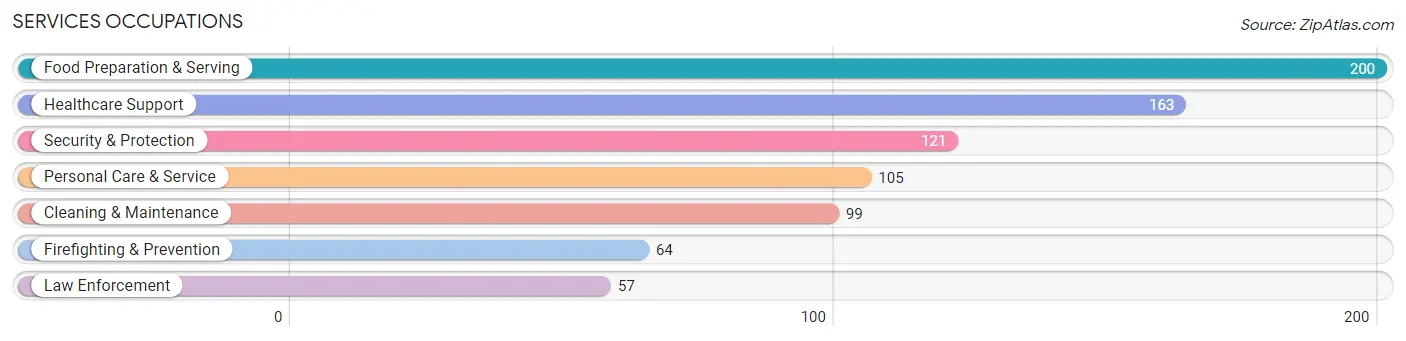
Services Occupations
The most common Services occupations in Spring Lake are Food Preparation & Serving (200 | 6.2%), Healthcare Support (163 | 5.0%), Security & Protection (121 | 3.7%), Personal Care & Service (105 | 3.2%), and Cleaning & Maintenance (99 | 3.0%).
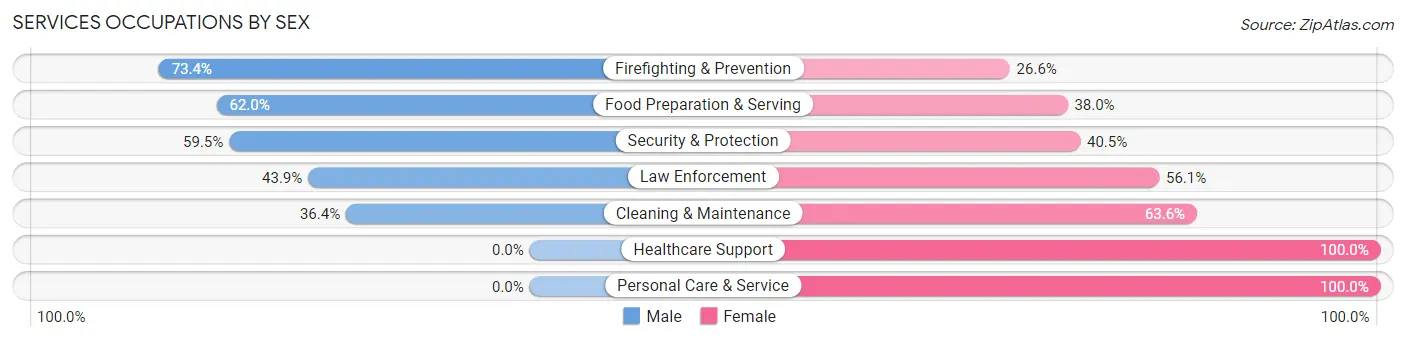
Services Occupations by Sex
Within the Services occupations in Spring Lake, the most male-oriented occupations are Firefighting & Prevention (73.4%), Food Preparation & Serving (62.0%), and Security & Protection (59.5%), while the most female-oriented occupations are Healthcare Support (100.0%), Personal Care & Service (100.0%), and Cleaning & Maintenance (63.6%).
| Occupation | Male | Female |
| Healthcare Support | 0 (0.0%) | 163 (100.0%) |
| Security & Protection | 72 (59.5%) | 49 (40.5%) |
| Firefighting & Prevention | 47 (73.4%) | 17 (26.6%) |
| Law Enforcement | 25 (43.9%) | 32 (56.1%) |
| Food Preparation & Serving | 124 (62.0%) | 76 (38.0%) |
| Cleaning & Maintenance | 36 (36.4%) | 63 (63.6%) |
| Personal Care & Service | 0 (0.0%) | 105 (100.0%) |
| Total (Category) | 232 (33.7%) | 456 (66.3%) |
| Total (Overall) | 1,251 (38.5%) | 1,998 (61.5%) |
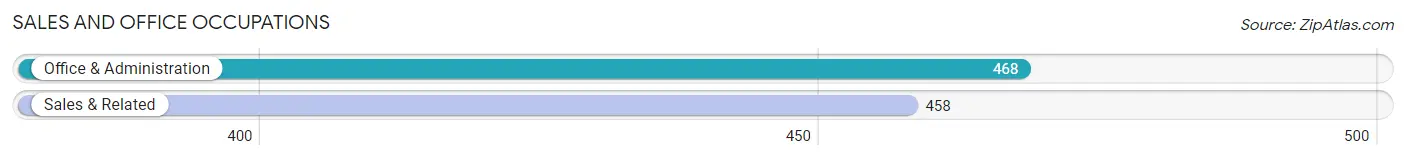
Sales and Office Occupations
The most common Sales and Office occupations in Spring Lake are Office & Administration (468 | 14.4%), and Sales & Related (458 | 14.1%).
Sales and Office Occupations by Sex
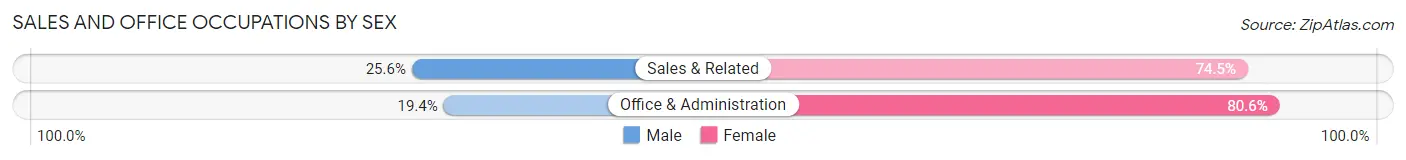
| Occupation | Male | Female |
| Sales & Related | 117 (25.6%) | 341 (74.5%) |
| Office & Administration | 91 (19.4%) | 377 (80.6%) |
| Total (Category) | 208 (22.5%) | 718 (77.5%) |
| Total (Overall) | 1,251 (38.5%) | 1,998 (61.5%) |
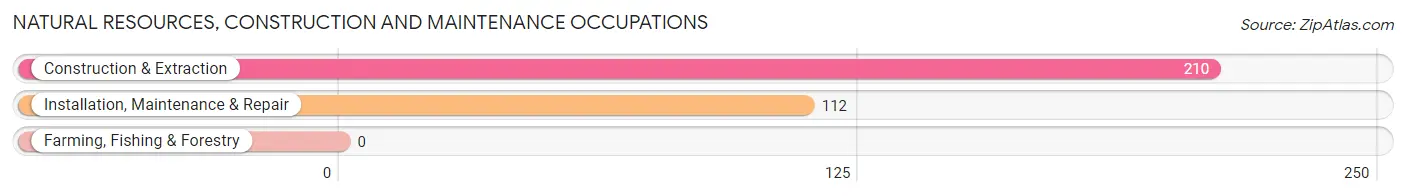
Natural Resources, Construction and Maintenance Occupations
The most common Natural Resources, Construction and Maintenance occupations in Spring Lake are Construction & Extraction (210 | 6.5%), and Installation, Maintenance & Repair (112 | 3.5%).
Natural Resources, Construction and Maintenance Occupations by Sex
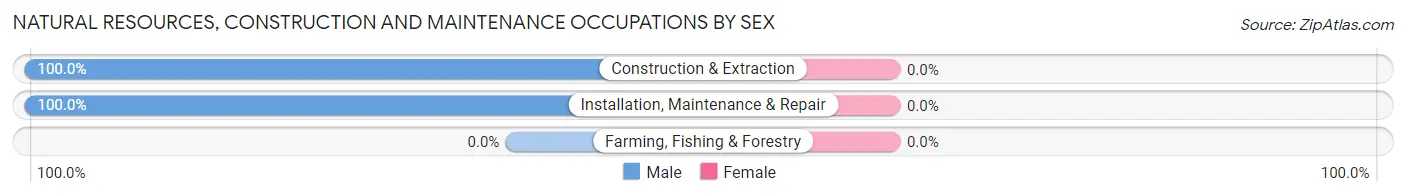
| Occupation | Male | Female |
| Farming, Fishing & Forestry | 0 (0.0%) | 0 (0.0%) |
| Construction & Extraction | 210 (100.0%) | 0 (0.0%) |
| Installation, Maintenance & Repair | 112 (100.0%) | 0 (0.0%) |
| Total (Category) | 322 (100.0%) | 0 (0.0%) |
| Total (Overall) | 1,251 (38.5%) | 1,998 (61.5%) |
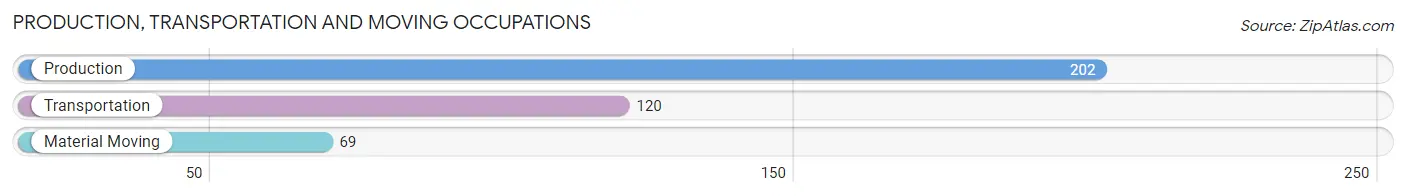
Production, Transportation and Moving Occupations
The most common Production, Transportation and Moving occupations in Spring Lake are Production (202 | 6.2%), Transportation (120 | 3.7%), and Material Moving (69 | 2.1%).
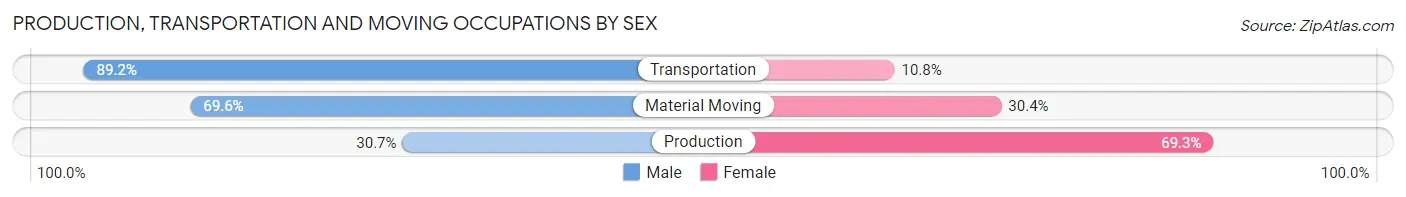
Production, Transportation and Moving Occupations by Sex
| Occupation | Male | Female |
| Production | 62 (30.7%) | 140 (69.3%) |
| Transportation | 107 (89.2%) | 13 (10.8%) |
| Material Moving | 48 (69.6%) | 21 (30.4%) |
| Total (Category) | 217 (55.5%) | 174 (44.5%) |
| Total (Overall) | 1,251 (38.5%) | 1,998 (61.5%) |
Employment Industries by Sex in Spring Lake
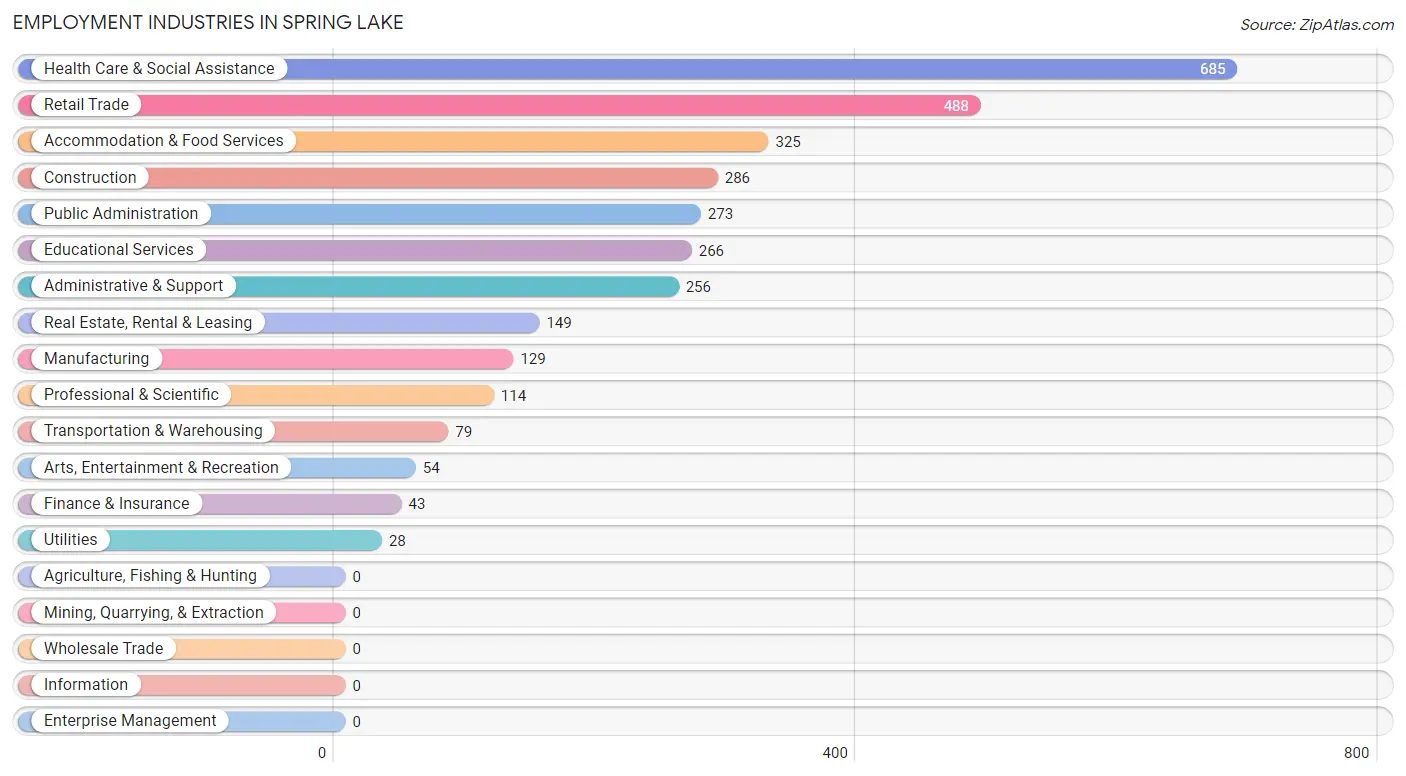
Employment Industries in Spring Lake
The major employment industries in Spring Lake include Health Care & Social Assistance (685 | 21.1%), Retail Trade (488 | 15.0%), Accommodation & Food Services (325 | 10.0%), Construction (286 | 8.8%), and Public Administration (273 | 8.4%).
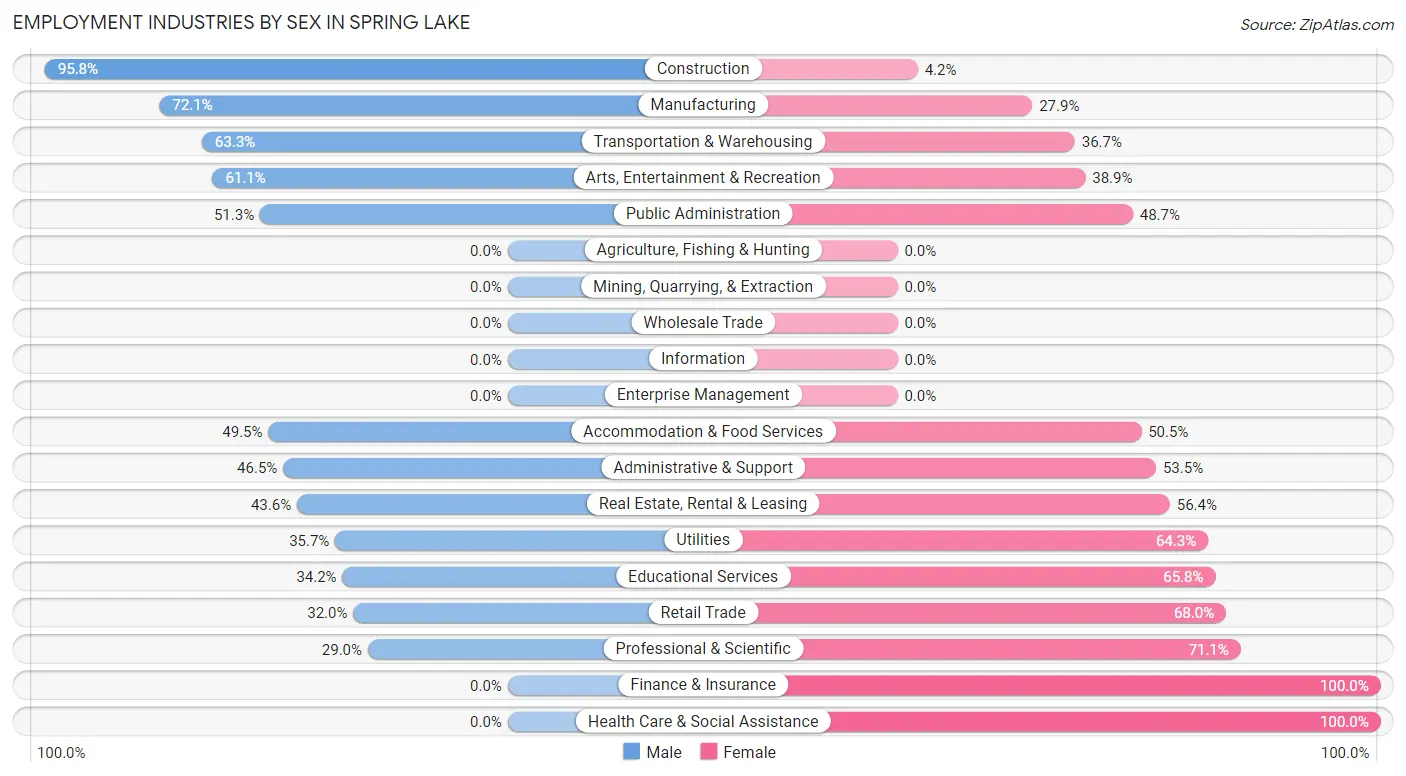
Employment Industries by Sex in Spring Lake
The Spring Lake industries that see more men than women are Construction (95.8%), Manufacturing (72.1%), and Transportation & Warehousing (63.3%), whereas the industries that tend to have a higher number of women are Finance & Insurance (100.0%), Health Care & Social Assistance (100.0%), and Professional & Scientific (71.1%).
| Industry | Male | Female |
| Agriculture, Fishing & Hunting | 0 (0.0%) | 0 (0.0%) |
| Mining, Quarrying, & Extraction | 0 (0.0%) | 0 (0.0%) |
| Construction | 274 (95.8%) | 12 (4.2%) |
| Manufacturing | 93 (72.1%) | 36 (27.9%) |
| Wholesale Trade | 0 (0.0%) | 0 (0.0%) |
| Retail Trade | 156 (32.0%) | 332 (68.0%) |
| Transportation & Warehousing | 50 (63.3%) | 29 (36.7%) |
| Utilities | 10 (35.7%) | 18 (64.3%) |
| Information | 0 (0.0%) | 0 (0.0%) |
| Finance & Insurance | 0 (0.0%) | 43 (100.0%) |
| Real Estate, Rental & Leasing | 65 (43.6%) | 84 (56.4%) |
| Professional & Scientific | 33 (28.9%) | 81 (71.1%) |
| Enterprise Management | 0 (0.0%) | 0 (0.0%) |
| Administrative & Support | 119 (46.5%) | 137 (53.5%) |
| Educational Services | 91 (34.2%) | 175 (65.8%) |
| Health Care & Social Assistance | 0 (0.0%) | 685 (100.0%) |
| Arts, Entertainment & Recreation | 33 (61.1%) | 21 (38.9%) |
| Accommodation & Food Services | 161 (49.5%) | 164 (50.5%) |
| Public Administration | 140 (51.3%) | 133 (48.7%) |
| Total | 1,251 (38.5%) | 1,998 (61.5%) |
Education in Spring Lake
School Enrollment in Spring Lake
The most common levels of schooling among the 3,428 students in Spring Lake are college / undergraduate (1,191 | 34.7%), elementary school (657 | 19.2%), and middle school (547 | 16.0%).
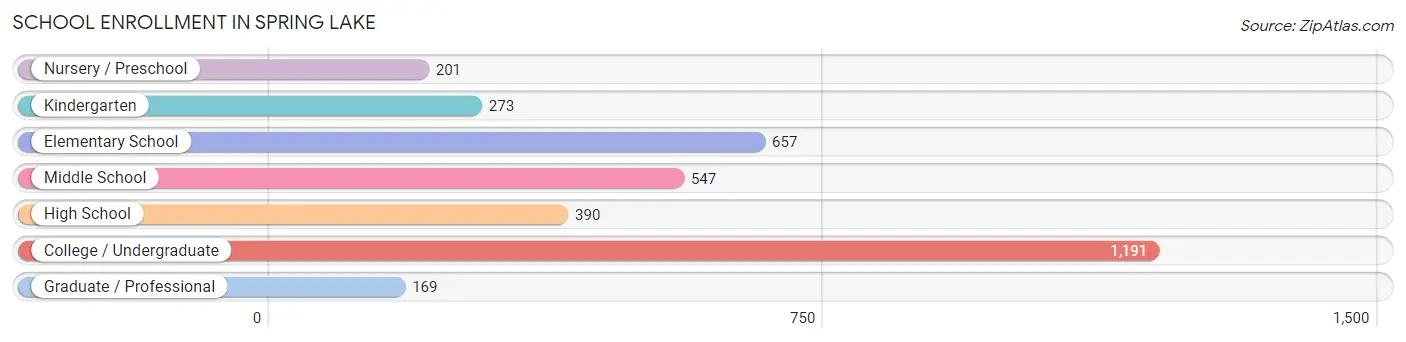
| School Level | # Students | % Students |
| Nursery / Preschool | 201 | 5.9% |
| Kindergarten | 273 | 8.0% |
| Elementary School | 657 | 19.2% |
| Middle School | 547 | 16.0% |
| High School | 390 | 11.4% |
| College / Undergraduate | 1,191 | 34.7% |
| Graduate / Professional | 169 | 4.9% |
| Total | 3,428 | 100.0% |
School Enrollment by Age by Funding Source in Spring Lake
Out of a total of 3,428 students who are enrolled in schools in Spring Lake, 425 (12.4%) attend a private institution, while the remaining 3,003 (87.6%) are enrolled in public schools. The age group of 25 to 34 year olds has the highest likelihood of being enrolled in private schools, with 102 (26.3% in the age bracket) enrolled. Conversely, the age group of 3 to 4 year olds has the lowest likelihood of being enrolled in a private school, with 168 (100.0% in the age bracket) attending a public institution.
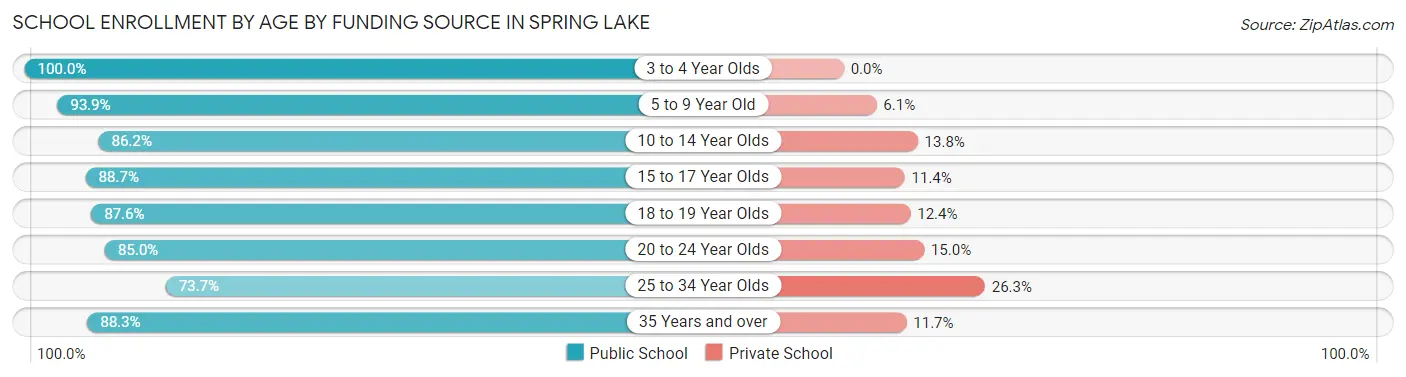
| Age Bracket | Public School | Private School |
| 3 to 4 Year Olds | 168 (100.0%) | 0 (0.0%) |
| 5 to 9 Year Old | 801 (93.9%) | 52 (6.1%) |
| 10 to 14 Year Olds | 613 (86.2%) | 98 (13.8%) |
| 15 to 17 Year Olds | 250 (88.6%) | 32 (11.4%) |
| 18 to 19 Year Olds | 120 (87.6%) | 17 (12.4%) |
| 20 to 24 Year Olds | 523 (85.0%) | 92 (15.0%) |
| 25 to 34 Year Olds | 286 (73.7%) | 102 (26.3%) |
| 35 Years and over | 242 (88.3%) | 32 (11.7%) |
| Total | 3,003 (87.6%) | 425 (12.4%) |
Educational Attainment by Field of Study in Spring Lake
Arts & humanities (442 | 25.4%), business (236 | 13.6%), education (227 | 13.1%), psychology (221 | 12.7%), and social sciences (145 | 8.3%) are the most common fields of study among 1,738 individuals in Spring Lake who have obtained a bachelor's degree or higher.
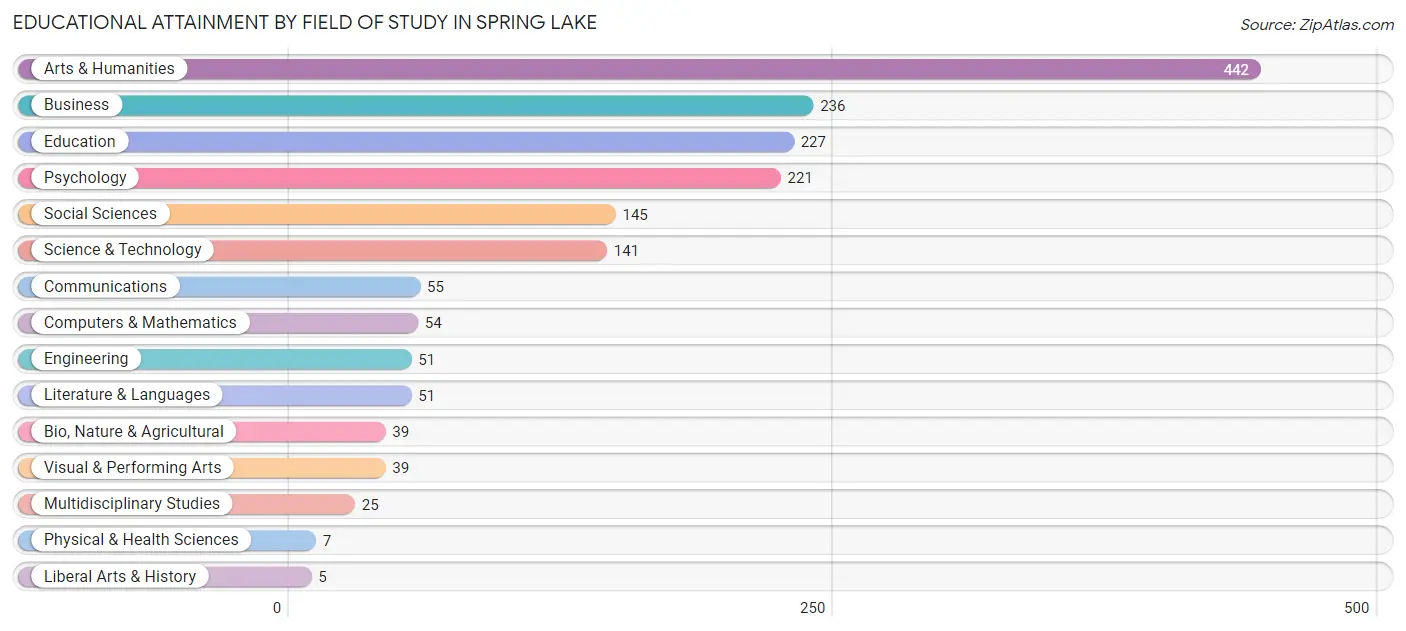
| Field of Study | # Graduates | % Graduates |
| Computers & Mathematics | 54 | 3.1% |
| Bio, Nature & Agricultural | 39 | 2.2% |
| Physical & Health Sciences | 7 | 0.4% |
| Psychology | 221 | 12.7% |
| Social Sciences | 145 | 8.3% |
| Engineering | 51 | 2.9% |
| Multidisciplinary Studies | 25 | 1.4% |
| Science & Technology | 141 | 8.1% |
| Business | 236 | 13.6% |
| Education | 227 | 13.1% |
| Literature & Languages | 51 | 2.9% |
| Liberal Arts & History | 5 | 0.3% |
| Visual & Performing Arts | 39 | 2.2% |
| Communications | 55 | 3.2% |
| Arts & Humanities | 442 | 25.4% |
| Total | 1,738 | 100.0% |
Transportation & Commute in Spring Lake
Vehicle Availability by Sex in Spring Lake
The most prevalent vehicle ownership categories in Spring Lake are males with 2 vehicles (1,327, accounting for 50.8%) and females with 2 vehicles (1,056, making up 63.9%).
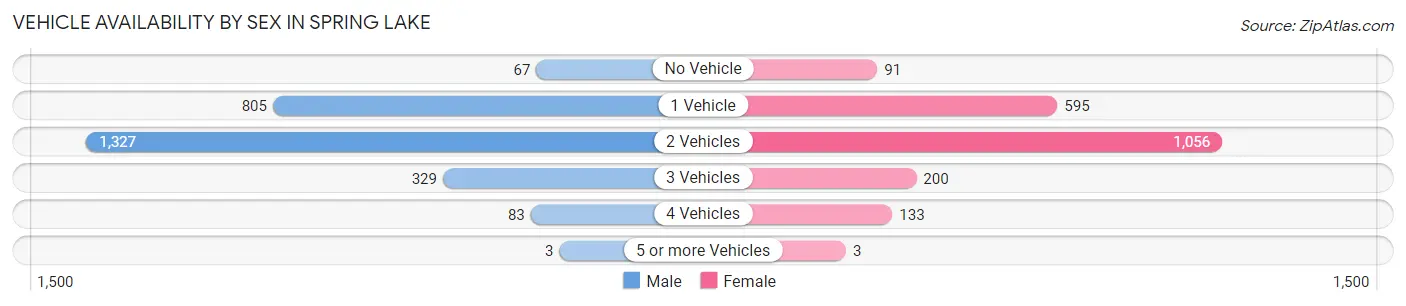
| Vehicles Available | Male | Female |
| No Vehicle | 67 (2.6%) | 91 (4.4%) |
| 1 Vehicle | 805 (30.8%) | 595 (28.6%) |
| 2 Vehicles | 1,327 (50.8%) | 1,056 (50.8%) |
| 3 Vehicles | 329 (12.6%) | 200 (9.6%) |
| 4 Vehicles | 83 (3.2%) | 133 (6.4%) |
| 5 or more Vehicles | 3 (0.1%) | 3 (0.1%) |
| Total | 2,614 (100.0%) | 2,078 (100.0%) |
Commute Time in Spring Lake
The most frequently occuring commute durations in Spring Lake are 15 to 19 minutes (1,209 commuters, 23.0%), 10 to 14 minutes (1,006 commuters, 19.2%), and 20 to 24 minutes (748 commuters, 14.2%).
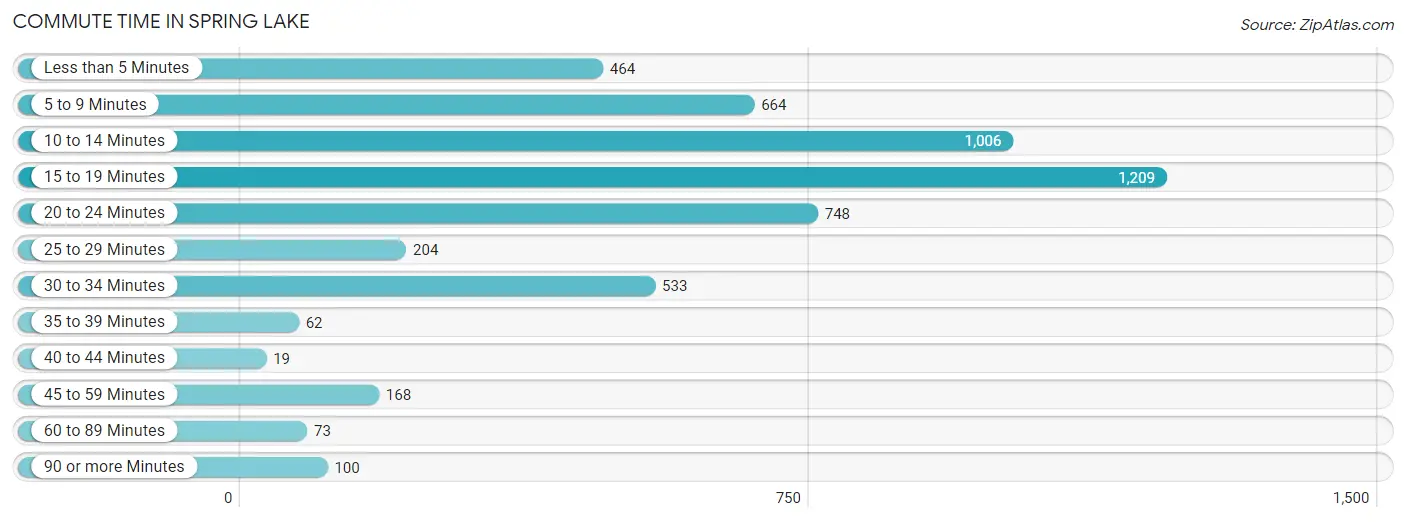
| Commute Time | # Commuters | % Commuters |
| Less than 5 Minutes | 464 | 8.8% |
| 5 to 9 Minutes | 664 | 12.7% |
| 10 to 14 Minutes | 1,006 | 19.2% |
| 15 to 19 Minutes | 1,209 | 23.0% |
| 20 to 24 Minutes | 748 | 14.2% |
| 25 to 29 Minutes | 204 | 3.9% |
| 30 to 34 Minutes | 533 | 10.2% |
| 35 to 39 Minutes | 62 | 1.2% |
| 40 to 44 Minutes | 19 | 0.4% |
| 45 to 59 Minutes | 168 | 3.2% |
| 60 to 89 Minutes | 73 | 1.4% |
| 90 or more Minutes | 100 | 1.9% |
Commute Time by Sex in Spring Lake
The most common commute times in Spring Lake are 15 to 19 minutes (733 commuters, 22.9%) for males and 15 to 19 minutes (476 commuters, 23.2%) for females.
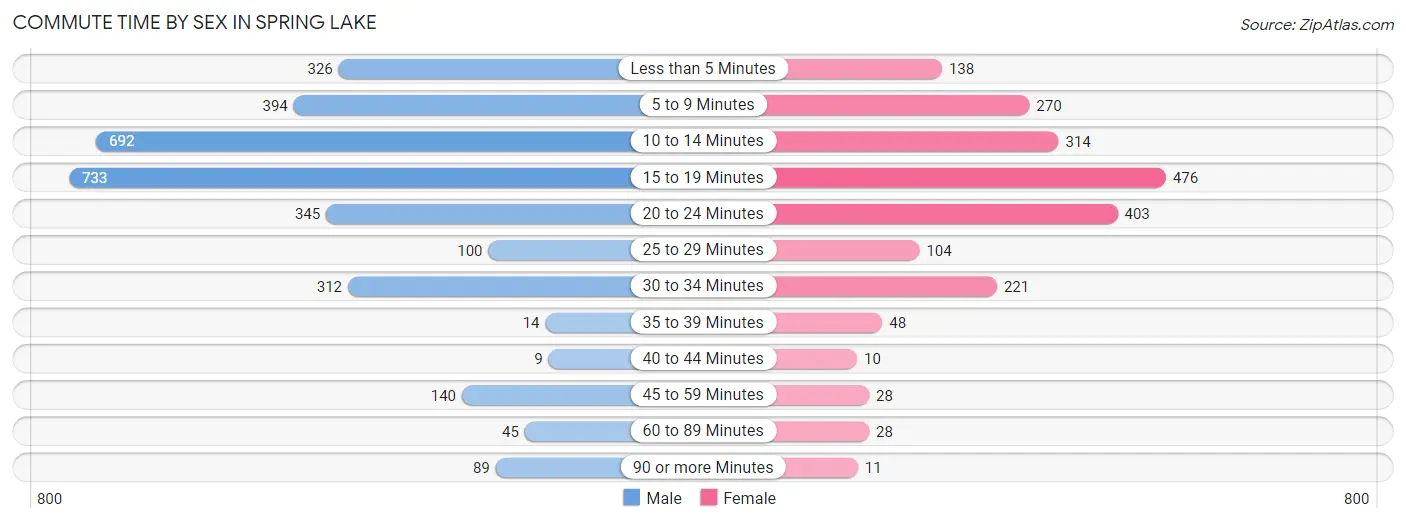
| Commute Time | Male | Female |
| Less than 5 Minutes | 326 (10.2%) | 138 (6.7%) |
| 5 to 9 Minutes | 394 (12.3%) | 270 (13.2%) |
| 10 to 14 Minutes | 692 (21.6%) | 314 (15.3%) |
| 15 to 19 Minutes | 733 (22.9%) | 476 (23.2%) |
| 20 to 24 Minutes | 345 (10.8%) | 403 (19.7%) |
| 25 to 29 Minutes | 100 (3.1%) | 104 (5.1%) |
| 30 to 34 Minutes | 312 (9.8%) | 221 (10.8%) |
| 35 to 39 Minutes | 14 (0.4%) | 48 (2.3%) |
| 40 to 44 Minutes | 9 (0.3%) | 10 (0.5%) |
| 45 to 59 Minutes | 140 (4.4%) | 28 (1.4%) |
| 60 to 89 Minutes | 45 (1.4%) | 28 (1.4%) |
| 90 or more Minutes | 89 (2.8%) | 11 (0.5%) |
Time of Departure to Work by Sex in Spring Lake
The most frequent times of departure to work in Spring Lake are 6:30 AM to 6:59 AM (589, 18.4%) for males and 7:00 AM to 7:29 AM (340, 16.6%) for females.
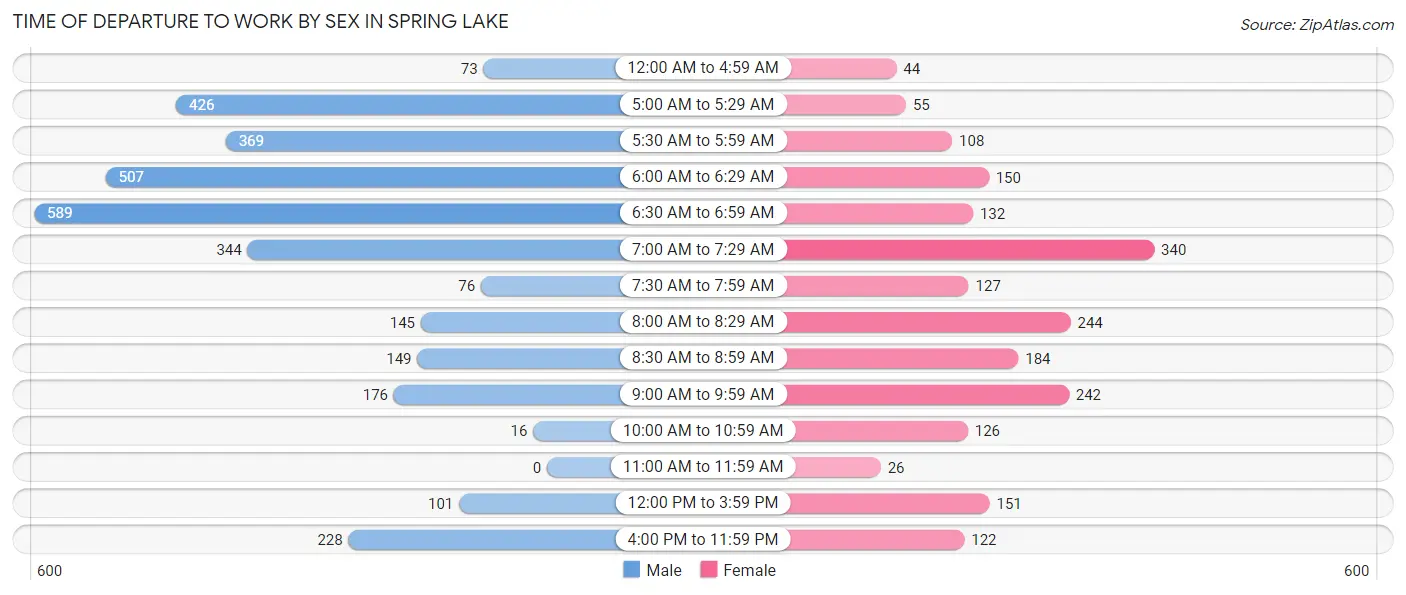
| Time of Departure | Male | Female |
| 12:00 AM to 4:59 AM | 73 (2.3%) | 44 (2.1%) |
| 5:00 AM to 5:29 AM | 426 (13.3%) | 55 (2.7%) |
| 5:30 AM to 5:59 AM | 369 (11.5%) | 108 (5.3%) |
| 6:00 AM to 6:29 AM | 507 (15.9%) | 150 (7.3%) |
| 6:30 AM to 6:59 AM | 589 (18.4%) | 132 (6.4%) |
| 7:00 AM to 7:29 AM | 344 (10.7%) | 340 (16.6%) |
| 7:30 AM to 7:59 AM | 76 (2.4%) | 127 (6.2%) |
| 8:00 AM to 8:29 AM | 145 (4.5%) | 244 (11.9%) |
| 8:30 AM to 8:59 AM | 149 (4.7%) | 184 (9.0%) |
| 9:00 AM to 9:59 AM | 176 (5.5%) | 242 (11.8%) |
| 10:00 AM to 10:59 AM | 16 (0.5%) | 126 (6.1%) |
| 11:00 AM to 11:59 AM | 0 (0.0%) | 26 (1.3%) |
| 12:00 PM to 3:59 PM | 101 (3.2%) | 151 (7.4%) |
| 4:00 PM to 11:59 PM | 228 (7.1%) | 122 (5.9%) |
| Total | 3,199 (100.0%) | 2,051 (100.0%) |
Housing Occupancy in Spring Lake
Occupancy by Ownership in Spring Lake
Of the total 4,457 dwellings in Spring Lake, owner-occupied units account for 985 (22.1%), while renter-occupied units make up 3,472 (77.9%).
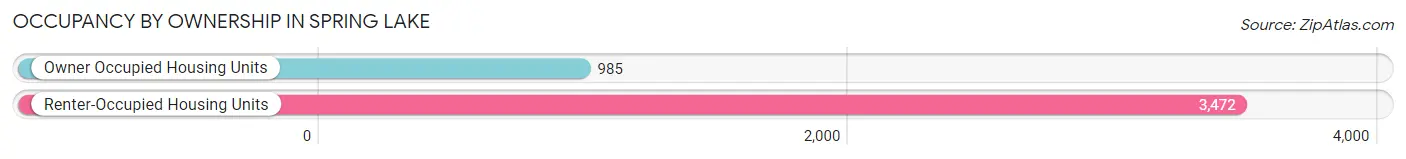
| Occupancy | # Housing Units | % Housing Units |
| Owner Occupied Housing Units | 985 | 22.1% |
| Renter-Occupied Housing Units | 3,472 | 77.9% |
| Total Occupied Housing Units | 4,457 | 100.0% |
Occupancy by Household Size in Spring Lake
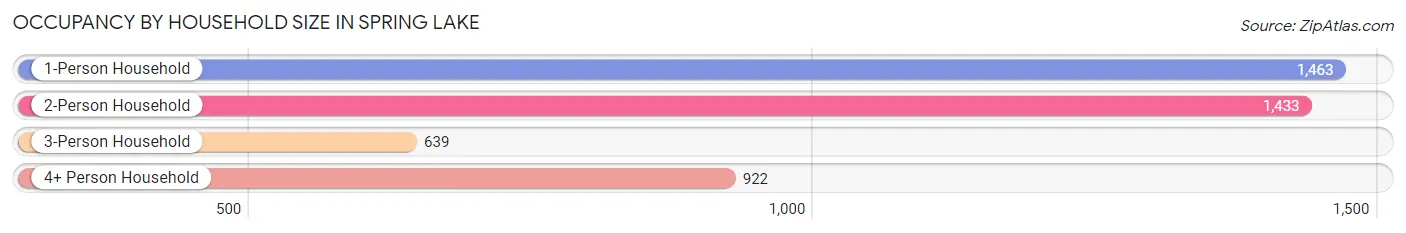
| Household Size | # Housing Units | % Housing Units |
| 1-Person Household | 1,463 | 32.8% |
| 2-Person Household | 1,433 | 32.2% |
| 3-Person Household | 639 | 14.3% |
| 4+ Person Household | 922 | 20.7% |
| Total Housing Units | 4,457 | 100.0% |
Occupancy by Ownership by Household Size in Spring Lake
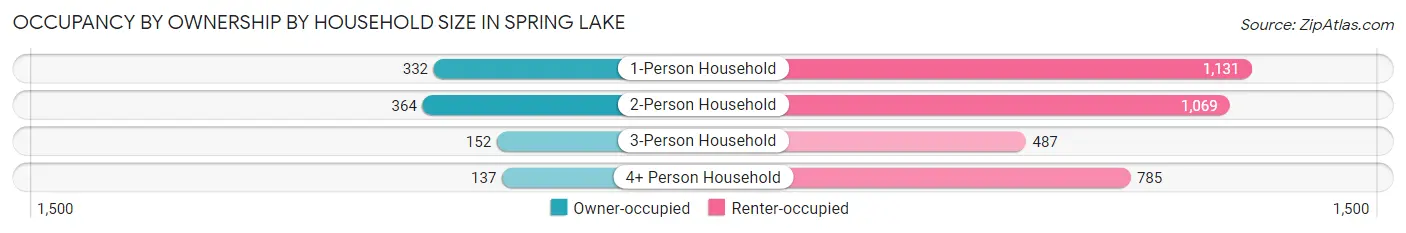
| Household Size | Owner-occupied | Renter-occupied |
| 1-Person Household | 332 (22.7%) | 1,131 (77.3%) |
| 2-Person Household | 364 (25.4%) | 1,069 (74.6%) |
| 3-Person Household | 152 (23.8%) | 487 (76.2%) |
| 4+ Person Household | 137 (14.9%) | 785 (85.1%) |
| Total Housing Units | 985 (22.1%) | 3,472 (77.9%) |
Occupancy by Educational Attainment in Spring Lake
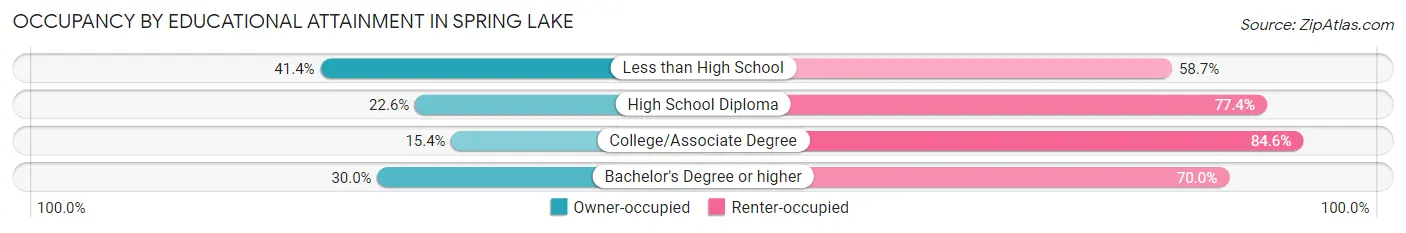
| Household Size | Owner-occupied | Renter-occupied |
| Less than High School | 86 (41.3%) | 122 (58.7%) |
| High School Diploma | 255 (22.6%) | 875 (77.4%) |
| College/Associate Degree | 307 (15.4%) | 1,690 (84.6%) |
| Bachelor's Degree or higher | 337 (30.0%) | 785 (70.0%) |
Occupancy by Age of Householder in Spring Lake
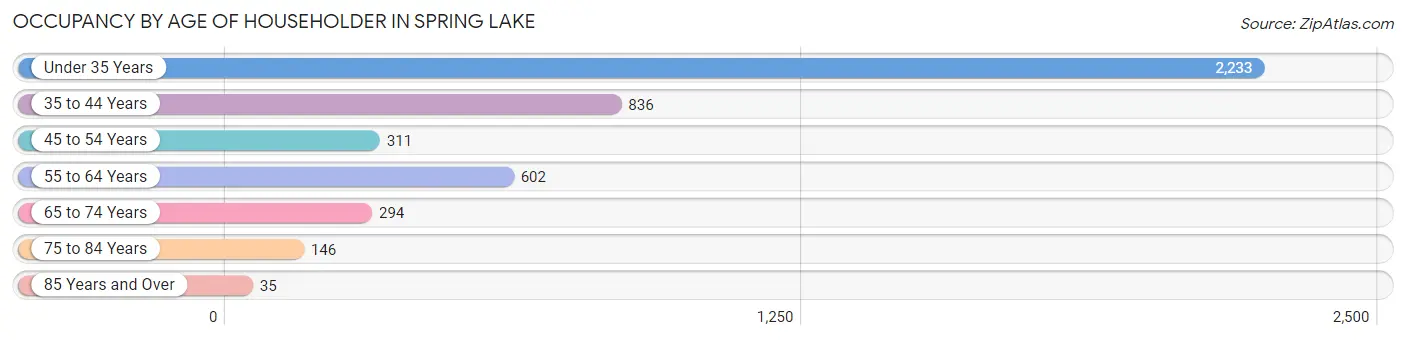
| Age Bracket | # Households | % Households |
| Under 35 Years | 2,233 | 50.1% |
| 35 to 44 Years | 836 | 18.8% |
| 45 to 54 Years | 311 | 7.0% |
| 55 to 64 Years | 602 | 13.5% |
| 65 to 74 Years | 294 | 6.6% |
| 75 to 84 Years | 146 | 3.3% |
| 85 Years and Over | 35 | 0.8% |
| Total | 4,457 | 100.0% |
Housing Finances in Spring Lake
Median Income by Occupancy in Spring Lake
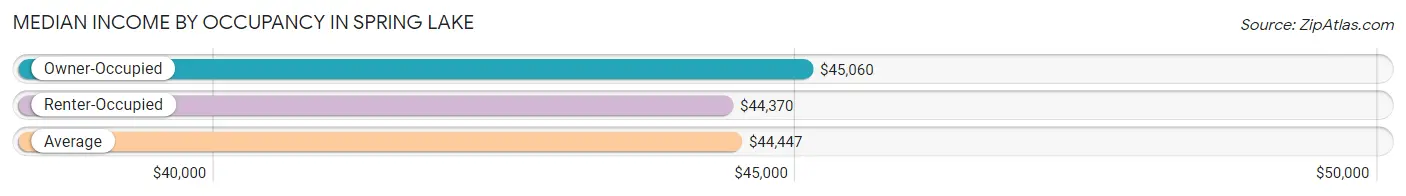
| Occupancy Type | # Households | Median Income |
| Owner-Occupied | 985 (22.1%) | $45,060 |
| Renter-Occupied | 3,472 (77.9%) | $44,370 |
| Average | 4,457 (100.0%) | $44,447 |
Occupancy by Householder Income Bracket in Spring Lake
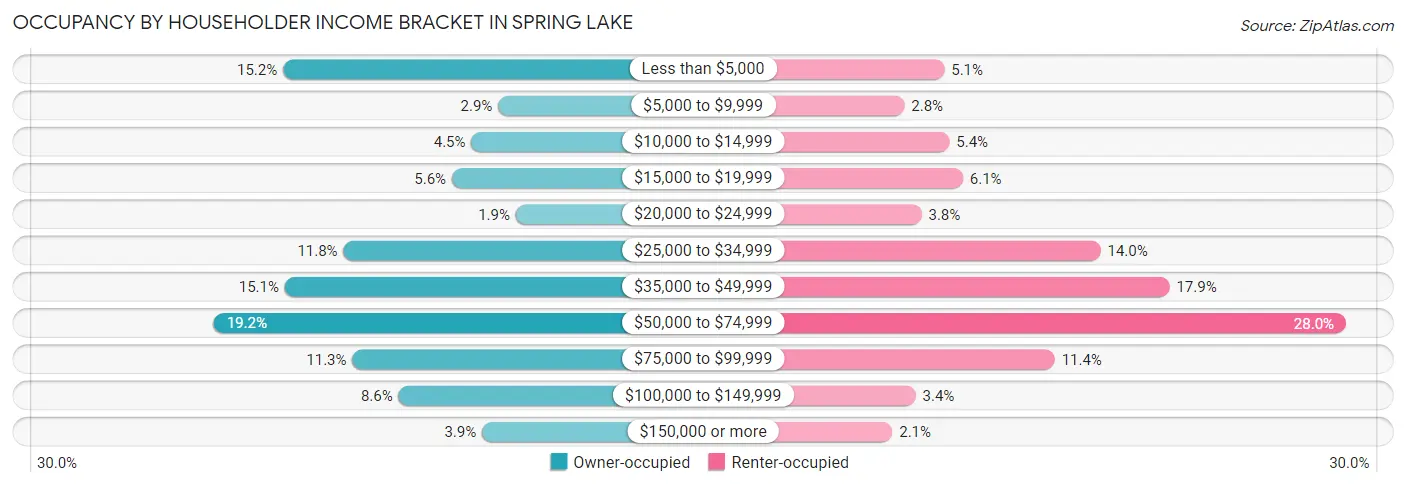
| Income Bracket | Owner-occupied | Renter-occupied |
| Less than $5,000 | 150 (15.2%) | 176 (5.1%) |
| $5,000 to $9,999 | 29 (2.9%) | 97 (2.8%) |
| $10,000 to $14,999 | 44 (4.5%) | 186 (5.4%) |
| $15,000 to $19,999 | 55 (5.6%) | 213 (6.1%) |
| $20,000 to $24,999 | 19 (1.9%) | 131 (3.8%) |
| $25,000 to $34,999 | 116 (11.8%) | 486 (14.0%) |
| $35,000 to $49,999 | 149 (15.1%) | 623 (17.9%) |
| $50,000 to $74,999 | 189 (19.2%) | 973 (28.0%) |
| $75,000 to $99,999 | 111 (11.3%) | 395 (11.4%) |
| $100,000 to $149,999 | 85 (8.6%) | 119 (3.4%) |
| $150,000 or more | 38 (3.9%) | 73 (2.1%) |
| Total | 985 (100.0%) | 3,472 (100.0%) |
Monthly Housing Cost Tiers in Spring Lake
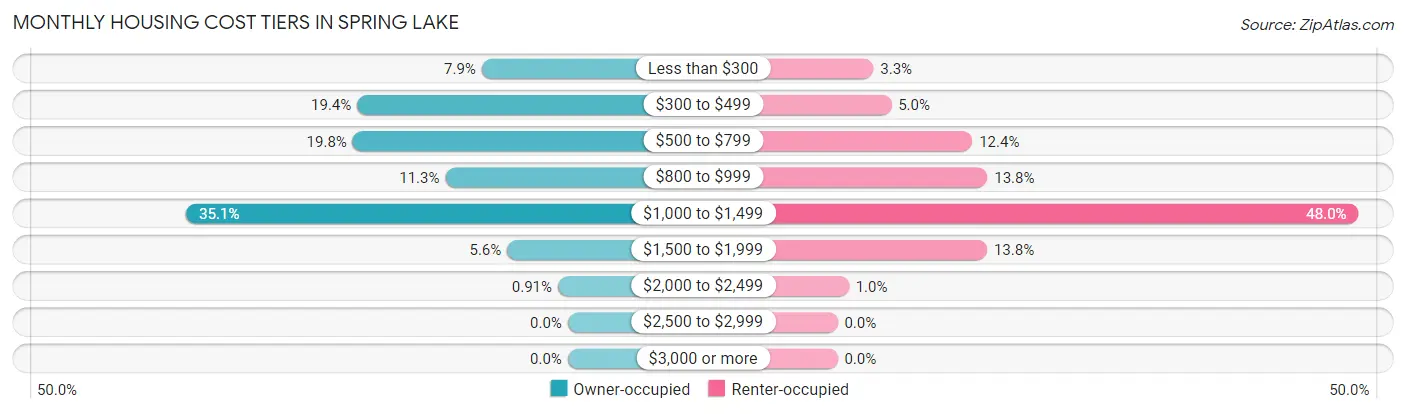
| Monthly Cost | Owner-occupied | Renter-occupied |
| Less than $300 | 78 (7.9%) | 115 (3.3%) |
| $300 to $499 | 191 (19.4%) | 172 (5.0%) |
| $500 to $799 | 195 (19.8%) | 431 (12.4%) |
| $800 to $999 | 111 (11.3%) | 479 (13.8%) |
| $1,000 to $1,499 | 346 (35.1%) | 1,665 (48.0%) |
| $1,500 to $1,999 | 55 (5.6%) | 478 (13.8%) |
| $2,000 to $2,499 | 9 (0.9%) | 36 (1.0%) |
| $2,500 to $2,999 | 0 (0.0%) | 0 (0.0%) |
| $3,000 or more | 0 (0.0%) | 0 (0.0%) |
| Total | 985 (100.0%) | 3,472 (100.0%) |
Physical Housing Characteristics in Spring Lake
Housing Structures in Spring Lake
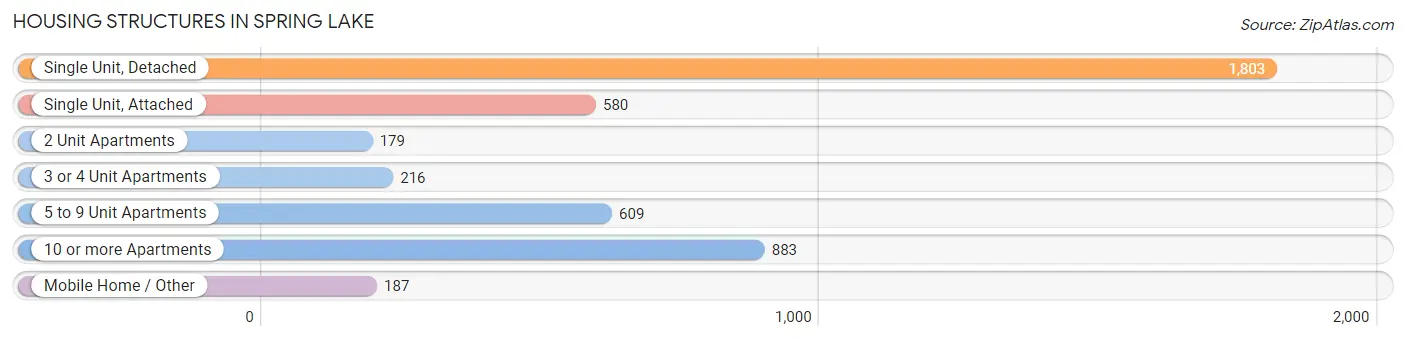
| Structure Type | # Housing Units | % Housing Units |
| Single Unit, Detached | 1,803 | 40.5% |
| Single Unit, Attached | 580 | 13.0% |
| 2 Unit Apartments | 179 | 4.0% |
| 3 or 4 Unit Apartments | 216 | 4.9% |
| 5 to 9 Unit Apartments | 609 | 13.7% |
| 10 or more Apartments | 883 | 19.8% |
| Mobile Home / Other | 187 | 4.2% |
| Total | 4,457 | 100.0% |
Housing Structures by Occupancy in Spring Lake
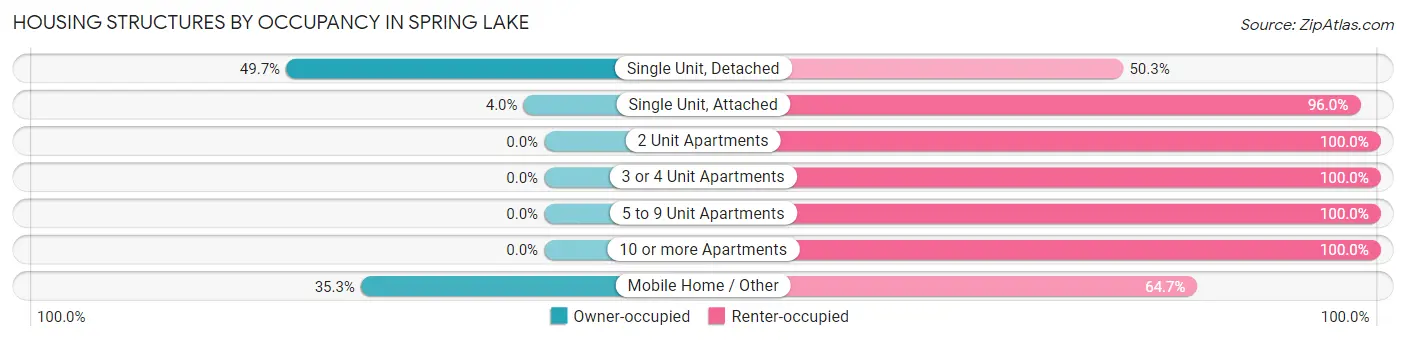
| Structure Type | Owner-occupied | Renter-occupied |
| Single Unit, Detached | 896 (49.7%) | 907 (50.3%) |
| Single Unit, Attached | 23 (4.0%) | 557 (96.0%) |
| 2 Unit Apartments | 0 (0.0%) | 179 (100.0%) |
| 3 or 4 Unit Apartments | 0 (0.0%) | 216 (100.0%) |
| 5 to 9 Unit Apartments | 0 (0.0%) | 609 (100.0%) |
| 10 or more Apartments | 0 (0.0%) | 883 (100.0%) |
| Mobile Home / Other | 66 (35.3%) | 121 (64.7%) |
| Total | 985 (22.1%) | 3,472 (77.9%) |
Housing Structures by Number of Rooms in Spring Lake
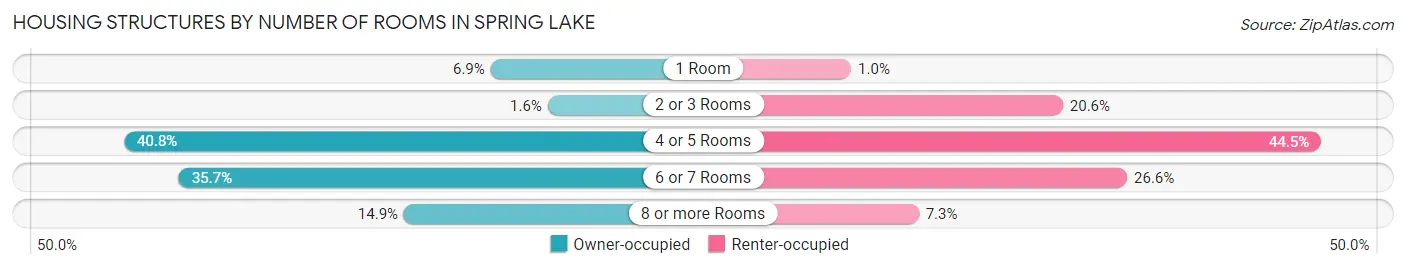
| Number of Rooms | Owner-occupied | Renter-occupied |
| 1 Room | 68 (6.9%) | 36 (1.0%) |
| 2 or 3 Rooms | 16 (1.6%) | 716 (20.6%) |
| 4 or 5 Rooms | 402 (40.8%) | 1,545 (44.5%) |
| 6 or 7 Rooms | 352 (35.7%) | 922 (26.6%) |
| 8 or more Rooms | 147 (14.9%) | 253 (7.3%) |
| Total | 985 (100.0%) | 3,472 (100.0%) |
Housing Structure by Heating Type in Spring Lake
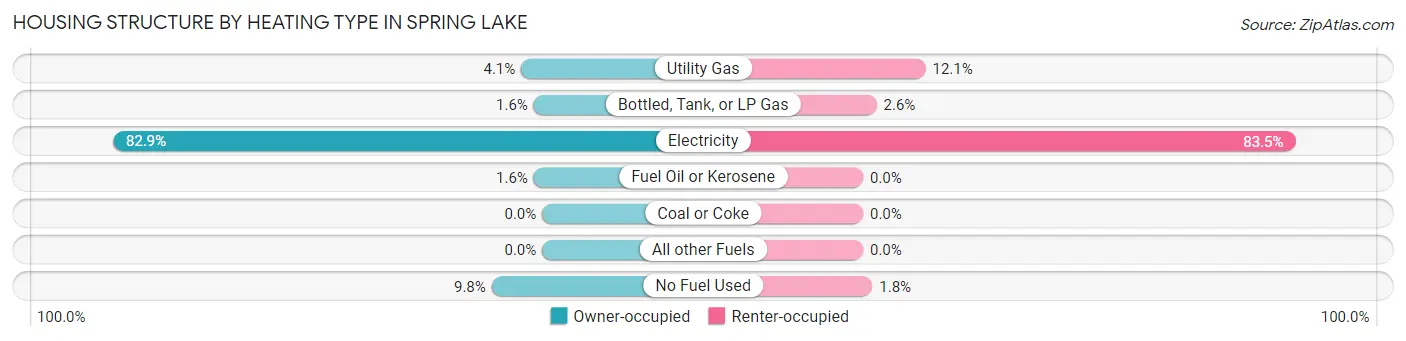
| Heating Type | Owner-occupied | Renter-occupied |
| Utility Gas | 40 (4.1%) | 419 (12.1%) |
| Bottled, Tank, or LP Gas | 16 (1.6%) | 91 (2.6%) |
| Electricity | 817 (82.9%) | 2,900 (83.5%) |
| Fuel Oil or Kerosene | 16 (1.6%) | 0 (0.0%) |
| Coal or Coke | 0 (0.0%) | 0 (0.0%) |
| All other Fuels | 0 (0.0%) | 0 (0.0%) |
| No Fuel Used | 96 (9.8%) | 62 (1.8%) |
| Total | 985 (100.0%) | 3,472 (100.0%) |
Household Vehicle Usage in Spring Lake
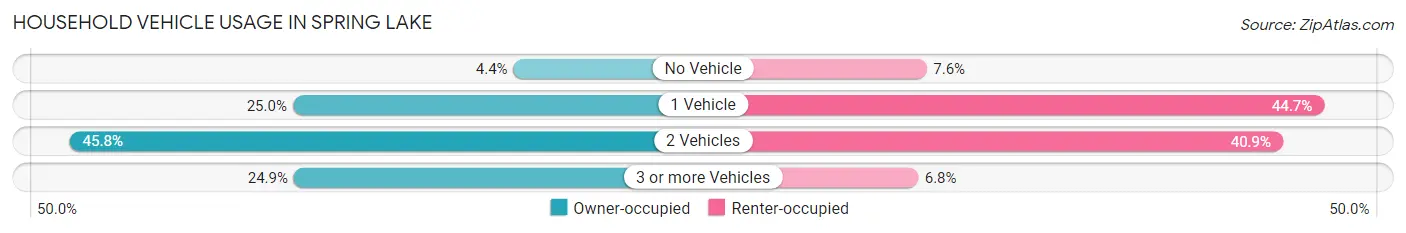
| Vehicles per Household | Owner-occupied | Renter-occupied |
| No Vehicle | 43 (4.4%) | 264 (7.6%) |
| 1 Vehicle | 246 (25.0%) | 1,553 (44.7%) |
| 2 Vehicles | 451 (45.8%) | 1,419 (40.9%) |
| 3 or more Vehicles | 245 (24.9%) | 236 (6.8%) |
| Total | 985 (100.0%) | 3,472 (100.0%) |
Real Estate & Mortgages in Spring Lake
Real Estate and Mortgage Overview in Spring Lake
| Characteristic | Without Mortgage | With Mortgage |
| Housing Units | 308 | 677 |
| Median Property Value | $93,900 | $119,800 |
| Median Household Income | $20,000 | $27 |
| Monthly Housing Costs | $336 | $0 |
| Real Estate Taxes | $1,209 | $12 |
Property Value by Mortgage Status in Spring Lake
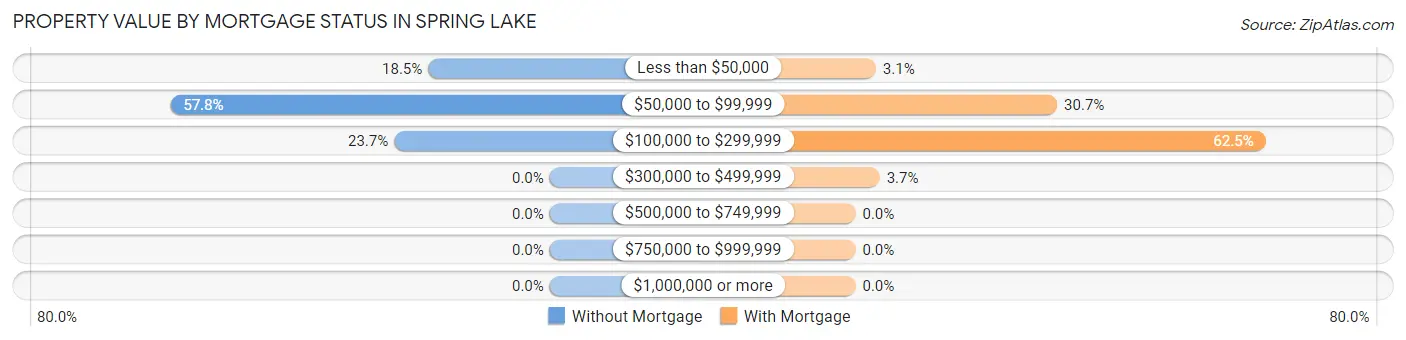
| Property Value | Without Mortgage | With Mortgage |
| Less than $50,000 | 57 (18.5%) | 21 (3.1%) |
| $50,000 to $99,999 | 178 (57.8%) | 208 (30.7%) |
| $100,000 to $299,999 | 73 (23.7%) | 423 (62.5%) |
| $300,000 to $499,999 | 0 (0.0%) | 25 (3.7%) |
| $500,000 to $749,999 | 0 (0.0%) | 0 (0.0%) |
| $750,000 to $999,999 | 0 (0.0%) | 0 (0.0%) |
| $1,000,000 or more | 0 (0.0%) | 0 (0.0%) |
| Total | 308 (100.0%) | 677 (100.0%) |
Household Income by Mortgage Status in Spring Lake
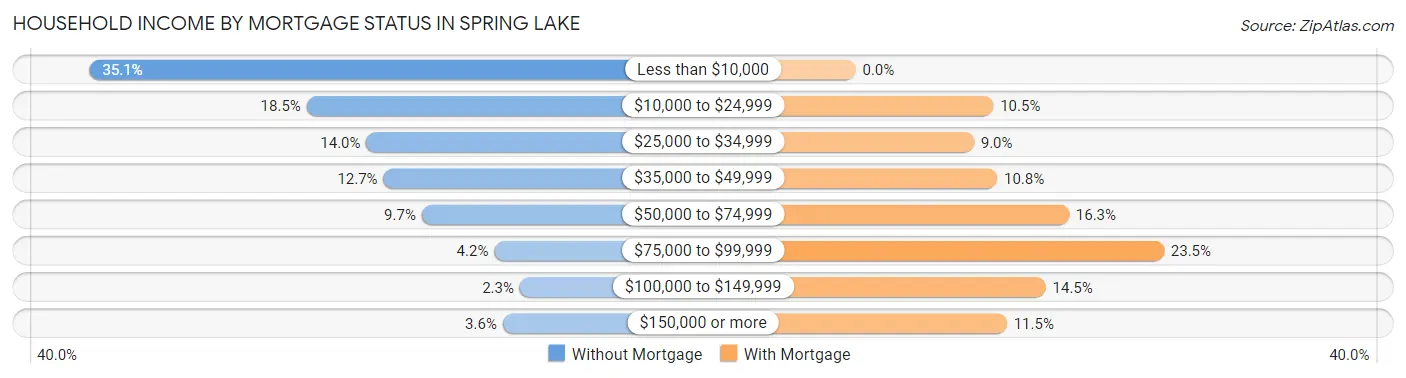
| Household Income | Without Mortgage | With Mortgage |
| Less than $10,000 | 108 (35.1%) | 0 (0.0%) |
| $10,000 to $24,999 | 57 (18.5%) | 71 (10.5%) |
| $25,000 to $34,999 | 43 (14.0%) | 61 (9.0%) |
| $35,000 to $49,999 | 39 (12.7%) | 73 (10.8%) |
| $50,000 to $74,999 | 30 (9.7%) | 110 (16.3%) |
| $75,000 to $99,999 | 13 (4.2%) | 159 (23.5%) |
| $100,000 to $149,999 | 7 (2.3%) | 98 (14.5%) |
| $150,000 or more | 11 (3.6%) | 78 (11.5%) |
| Total | 308 (100.0%) | 677 (100.0%) |
Property Value to Household Income Ratio in Spring Lake
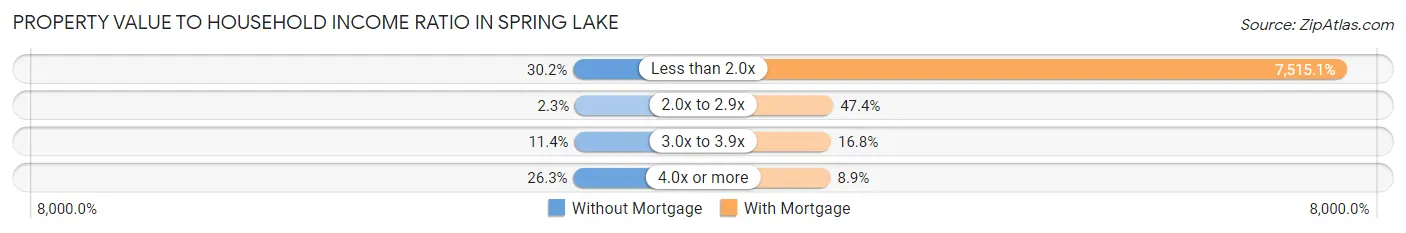
| Value-to-Income Ratio | Without Mortgage | With Mortgage |
| Less than 2.0x | 93 (30.2%) | 50,877 (7,515.1%) |
| 2.0x to 2.9x | 7 (2.3%) | 321 (47.4%) |
| 3.0x to 3.9x | 35 (11.4%) | 114 (16.8%) |
| 4.0x or more | 81 (26.3%) | 60 (8.9%) |
| Total | 308 (100.0%) | 677 (100.0%) |
Real Estate Taxes by Mortgage Status in Spring Lake
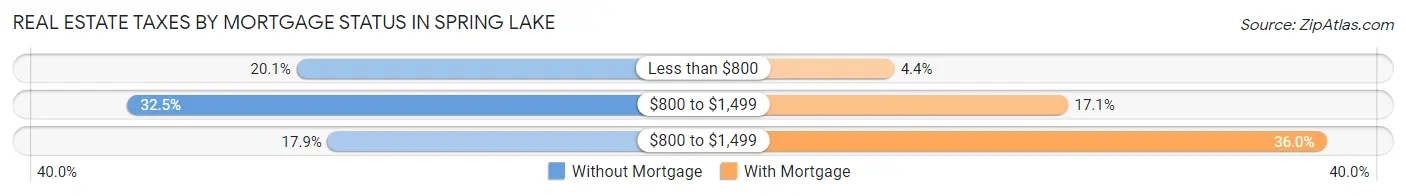
| Property Taxes | Without Mortgage | With Mortgage |
| Less than $800 | 62 (20.1%) | 30 (4.4%) |
| $800 to $1,499 | 100 (32.5%) | 116 (17.1%) |
| $800 to $1,499 | 55 (17.9%) | 244 (36.0%) |
| Total | 308 (100.0%) | 677 (100.0%) |
Health & Disability in Spring Lake
Health Insurance Coverage by Age in Spring Lake
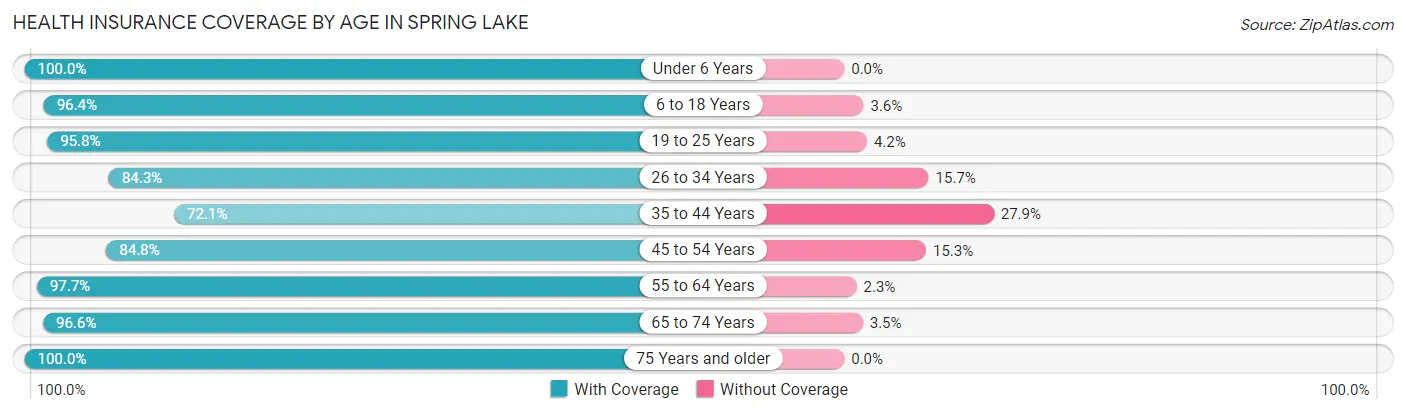
| Age Bracket | With Coverage | Without Coverage |
| Under 6 Years | 1,403 (100.0%) | 0 (0.0%) |
| 6 to 18 Years | 1,888 (96.4%) | 70 (3.6%) |
| 19 to 25 Years | 1,357 (95.8%) | 60 (4.2%) |
| 26 to 34 Years | 1,055 (84.3%) | 197 (15.7%) |
| 35 to 44 Years | 802 (72.1%) | 310 (27.9%) |
| 45 to 54 Years | 550 (84.8%) | 99 (15.2%) |
| 55 to 64 Years | 806 (97.7%) | 19 (2.3%) |
| 65 to 74 Years | 504 (96.6%) | 18 (3.5%) |
| 75 Years and older | 221 (100.0%) | 0 (0.0%) |
| Total | 8,586 (91.7%) | 773 (8.3%) |
Health Insurance Coverage by Citizenship Status in Spring Lake
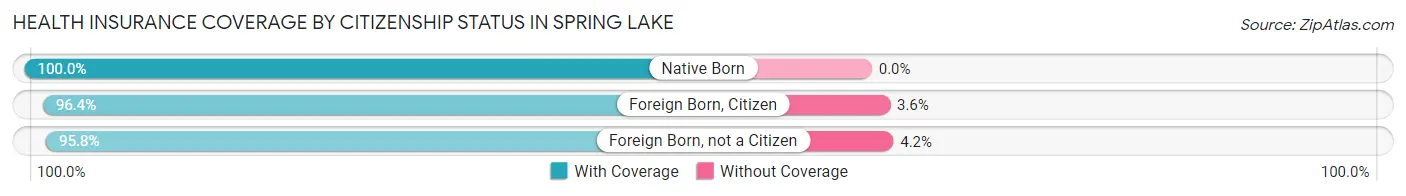
| Citizenship Status | With Coverage | Without Coverage |
| Native Born | 1,403 (100.0%) | 0 (0.0%) |
| Foreign Born, Citizen | 1,888 (96.4%) | 70 (3.6%) |
| Foreign Born, not a Citizen | 1,357 (95.8%) | 60 (4.2%) |
Health Insurance Coverage by Household Income in Spring Lake
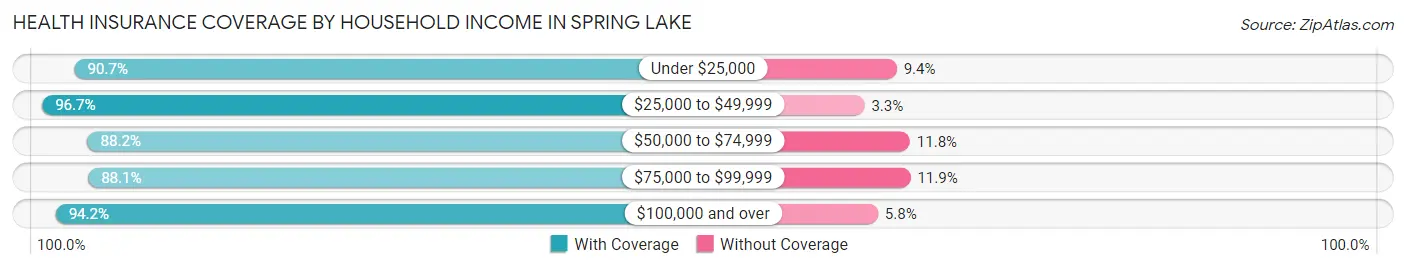
| Household Income | With Coverage | Without Coverage |
| Under $25,000 | 2,008 (90.6%) | 207 (9.3%) |
| $25,000 to $49,999 | 2,628 (96.7%) | 90 (3.3%) |
| $50,000 to $74,999 | 2,096 (88.2%) | 281 (11.8%) |
| $75,000 to $99,999 | 1,063 (88.1%) | 144 (11.9%) |
| $100,000 and over | 791 (94.2%) | 49 (5.8%) |
Public vs Private Health Insurance Coverage by Age in Spring Lake
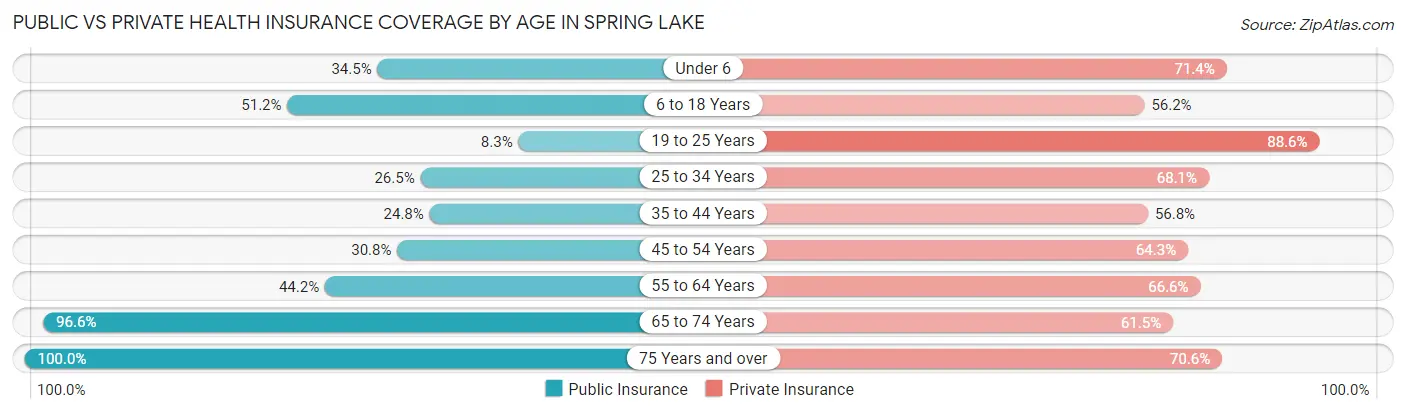
| Age Bracket | Public Insurance | Private Insurance |
| Under 6 | 484 (34.5%) | 1,002 (71.4%) |
| 6 to 18 Years | 1,003 (51.2%) | 1,100 (56.2%) |
| 19 to 25 Years | 118 (8.3%) | 1,256 (88.6%) |
| 25 to 34 Years | 332 (26.5%) | 853 (68.1%) |
| 35 to 44 Years | 276 (24.8%) | 632 (56.8%) |
| 45 to 54 Years | 200 (30.8%) | 417 (64.2%) |
| 55 to 64 Years | 365 (44.2%) | 549 (66.5%) |
| 65 to 74 Years | 504 (96.6%) | 321 (61.5%) |
| 75 Years and over | 221 (100.0%) | 156 (70.6%) |
| Total | 3,503 (37.4%) | 6,286 (67.2%) |
Disability Status by Sex by Age in Spring Lake
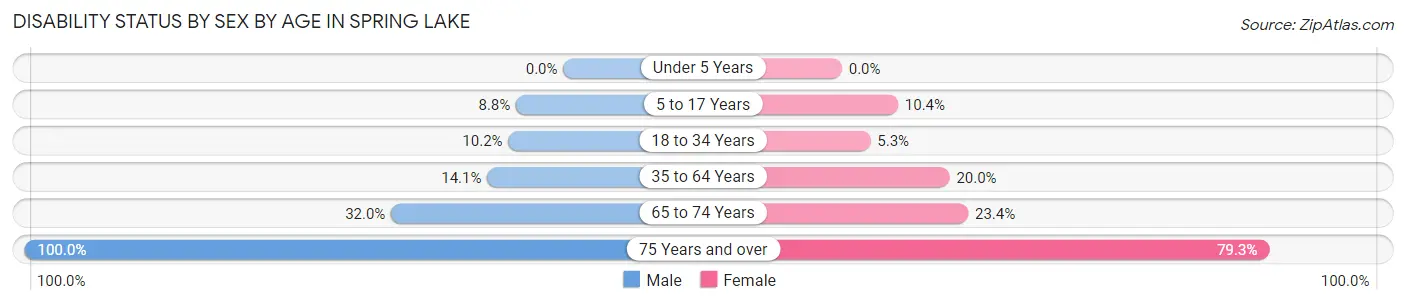
| Age Bracket | Male | Female |
| Under 5 Years | 0 (0.0%) | 0 (0.0%) |
| 5 to 17 Years | 76 (8.8%) | 107 (10.4%) |
| 18 to 34 Years | 87 (10.2%) | 109 (5.3%) |
| 35 to 64 Years | 124 (14.1%) | 341 (20.0%) |
| 65 to 74 Years | 85 (32.0%) | 60 (23.4%) |
| 75 Years and over | 71 (100.0%) | 119 (79.3%) |
Disability Class by Sex by Age in Spring Lake
Disability Class: Hearing Difficulty
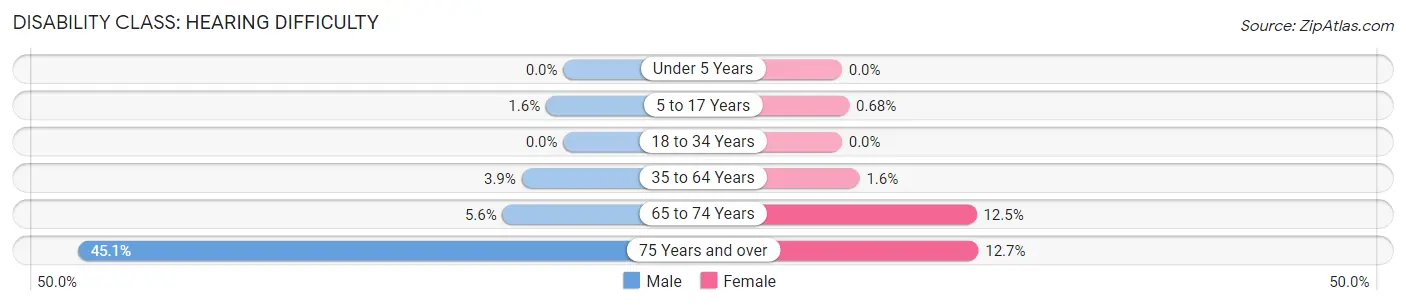
| Age Bracket | Male | Female |
| Under 5 Years | 0 (0.0%) | 0 (0.0%) |
| 5 to 17 Years | 14 (1.6%) | 7 (0.7%) |
| 18 to 34 Years | 0 (0.0%) | 0 (0.0%) |
| 35 to 64 Years | 34 (3.9%) | 28 (1.6%) |
| 65 to 74 Years | 15 (5.6%) | 32 (12.5%) |
| 75 Years and over | 32 (45.1%) | 19 (12.7%) |
Disability Class: Vision Difficulty
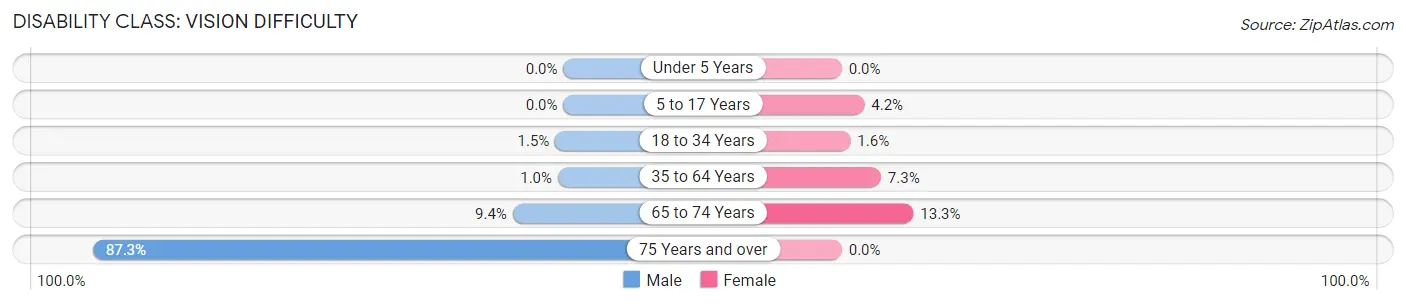
| Age Bracket | Male | Female |
| Under 5 Years | 0 (0.0%) | 0 (0.0%) |
| 5 to 17 Years | 0 (0.0%) | 43 (4.2%) |
| 18 to 34 Years | 13 (1.5%) | 33 (1.6%) |
| 35 to 64 Years | 9 (1.0%) | 124 (7.3%) |
| 65 to 74 Years | 25 (9.4%) | 34 (13.3%) |
| 75 Years and over | 62 (87.3%) | 0 (0.0%) |
Disability Class: Cognitive Difficulty
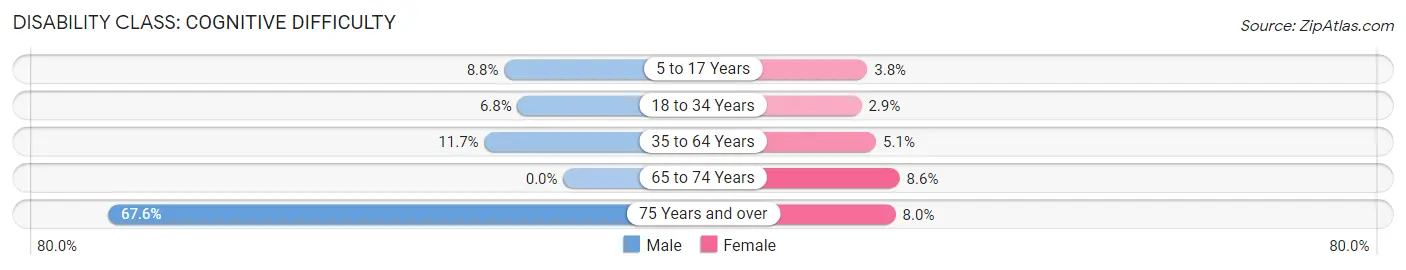
| Age Bracket | Male | Female |
| 5 to 17 Years | 76 (8.8%) | 39 (3.8%) |
| 18 to 34 Years | 58 (6.8%) | 60 (2.9%) |
| 35 to 64 Years | 103 (11.7%) | 87 (5.1%) |
| 65 to 74 Years | 0 (0.0%) | 22 (8.6%) |
| 75 Years and over | 48 (67.6%) | 12 (8.0%) |
Disability Class: Ambulatory Difficulty
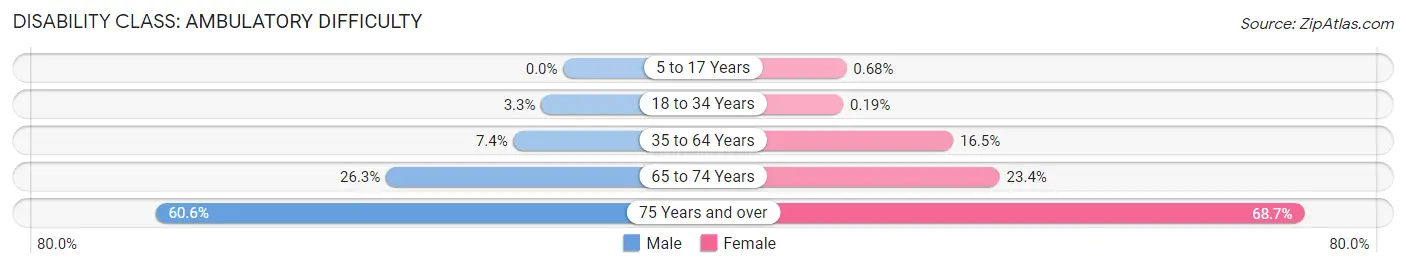
| Age Bracket | Male | Female |
| 5 to 17 Years | 0 (0.0%) | 7 (0.7%) |
| 18 to 34 Years | 28 (3.3%) | 4 (0.2%) |
| 35 to 64 Years | 65 (7.4%) | 282 (16.5%) |
| 65 to 74 Years | 70 (26.3%) | 60 (23.4%) |
| 75 Years and over | 43 (60.6%) | 103 (68.7%) |
Disability Class: Self-Care Difficulty
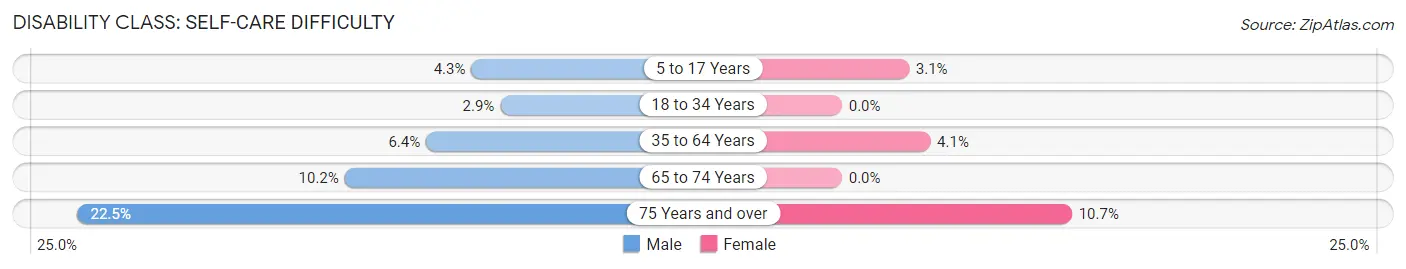
| Age Bracket | Male | Female |
| 5 to 17 Years | 37 (4.3%) | 32 (3.1%) |
| 18 to 34 Years | 25 (2.9%) | 0 (0.0%) |
| 35 to 64 Years | 56 (6.4%) | 70 (4.1%) |
| 65 to 74 Years | 27 (10.2%) | 0 (0.0%) |
| 75 Years and over | 16 (22.5%) | 16 (10.7%) |
Technology Access in Spring Lake
Computing Device Access in Spring Lake
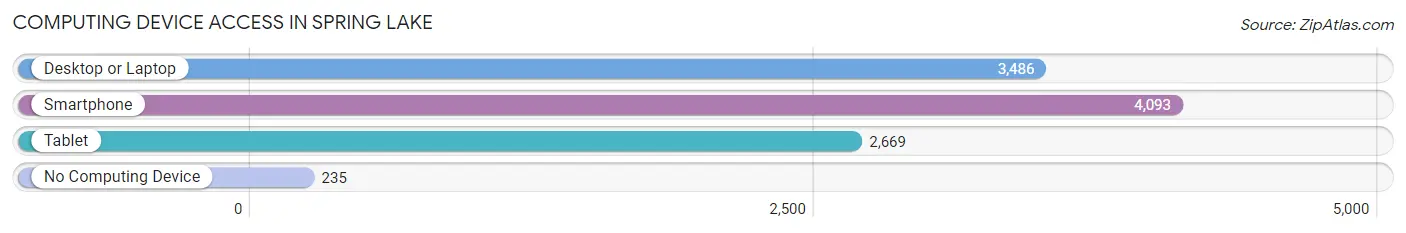
| Device Type | # Households | % Households |
| Desktop or Laptop | 3,486 | 78.2% |
| Smartphone | 4,093 | 91.8% |
| Tablet | 2,669 | 59.9% |
| No Computing Device | 235 | 5.3% |
| Total | 4,457 | 100.0% |
Internet Access in Spring Lake
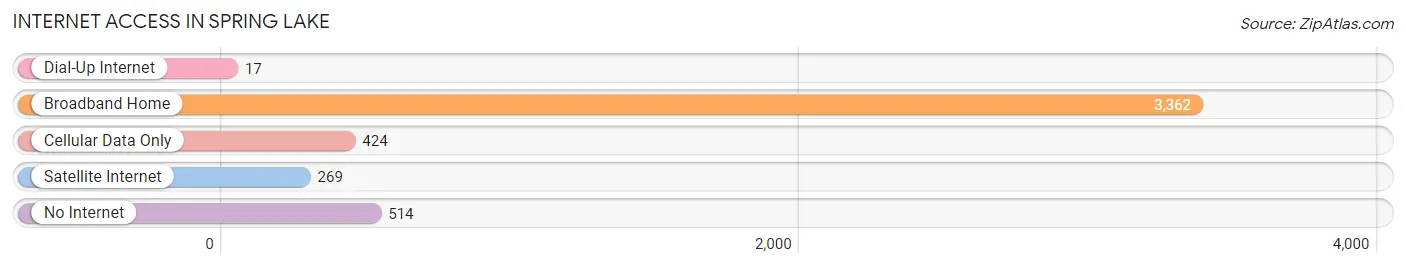
| Internet Type | # Households | % Households |
| Dial-Up Internet | 17 | 0.4% |
| Broadband Home | 3,362 | 75.4% |
| Cellular Data Only | 424 | 9.5% |
| Satellite Internet | 269 | 6.0% |
| No Internet | 514 | 11.5% |
| Total | 4,457 | 100.0% |
Spring Lake Summary
History
Spring Lake is a town located in Cumberland County, North Carolina. It is situated approximately 10 miles south of Fayetteville and is part of the Fayetteville Metropolitan Statistical Area. The town was originally known as “Spring Hill” and was established in 1887. The name was changed to Spring Lake in 1895 when the town was incorporated.
The town was originally a farming community and was home to many small farms. The town was also home to a number of small businesses, including a general store, a blacksmith shop, and a sawmill. The town was also home to a number of churches, including the Spring Lake Methodist Church, which was established in 1887.
In the early 1900s, the town began to grow and develop. The town was home to a number of businesses, including a hotel, a bank, and a movie theater. The town was also home to a number of schools, including Spring Lake High School, which was established in 1912.
In the 1950s, the town began to experience a period of growth and development. The town was home to a number of businesses, including a grocery store, a hardware store, and a number of restaurants. The town was also home to a number of churches, including the Spring Lake Baptist Church, which was established in 1952.
In the late 1960s, the town began to experience a period of decline. Many of the businesses in the town closed and the population began to decline. In the 1970s, the town began to experience a period of revitalization. The town was home to a number of businesses, including a shopping center, a movie theater, and a number of restaurants. The town was also home to a number of churches, including the Spring Lake Presbyterian Church, which was established in 1975.
Geography
Spring Lake is located in Cumberland County, North Carolina. The town is situated approximately 10 miles south of Fayetteville and is part of the Fayetteville Metropolitan Statistical Area. The town is located on the banks of the Cape Fear River and is surrounded by a number of small lakes and ponds. The town is located in a rural area and is home to a number of farms and small businesses.
The town has a total area of 4.2 square miles, all of which is land. The town has a humid subtropical climate, with hot, humid summers and mild winters. The average temperature in the summer is around 80 degrees Fahrenheit and the average temperature in the winter is around 50 degrees Fahrenheit.
Economy
The economy of Spring Lake is largely based on agriculture and small businesses. The town is home to a number of farms, including dairy farms, poultry farms, and vegetable farms. The town is also home to a number of small businesses, including restaurants, retail stores, and service businesses.
The town is also home to a number of manufacturing businesses, including a furniture factory and a textile mill. The town is also home to a number of government offices, including the Cumberland County Courthouse and the Spring Lake Police Department.
Demographics
As of the 2010 census, the population of Spring Lake was 8,722. The population is largely white, with African Americans making up approximately 10% of the population. The median household income in the town is $37,945 and the median home value is $117,400. The town has a poverty rate of 17.3%.
The town is home to a number of churches, including the Spring Lake Methodist Church, the Spring Lake Baptist Church, and the Spring Lake Presbyterian Church. The town is also home to a number of schools, including Spring Lake High School and Spring Lake Elementary School.
Common Questions
What is the Total Population of Spring Lake?
Total Population of Spring Lake is 11,710.
What is the Total Male Population of Spring Lake?
Total Male Population of Spring Lake is 5,695.
What is the Total Female Population of Spring Lake?
Total Female Population of Spring Lake is 6,015.
What is the Ratio of Males per 100 Females in Spring Lake?
There are 94.68 Males per 100 Females in Spring Lake.
What is the Ratio of Females per 100 Males in Spring Lake?
There are 105.62 Females per 100 Males in Spring Lake.
What is the Median Population Age in Spring Lake?
Median Population Age in Spring Lake is 25.2 Years.
What is the Average Family Size in Spring Lake
Average Family Size in Spring Lake is 3.2 People.
What is the Average Household Size in Spring Lake
Average Household Size in Spring Lake is 2.5 People.
What is Per Capita Income in Spring Lake?
Per Capita income in Spring Lake is $21,891.
What is the Median Family Income in Spring Lake?
Median Family Income in Spring Lake is $47,997.
What is the Median Household income in Spring Lake?
Median Household Income in Spring Lake is $44,447.
What is Income or Wage Gap in Spring Lake?
Income or Wage Gap in Spring Lake is 20.5%.
Women in Spring Lake earn 79.5 cents for every dollar earned by a man.
What is Family Income Deficit in Spring Lake?
Family Income Deficit in Spring Lake is $14,857.
Families that are below poverty line in Spring Lake earn $14,857 less on average than the poverty threshold level.
What is Inequality or Gini Index in Spring Lake?
Inequality or Gini Index in Spring Lake is 0.40.
How Large is the Labor Force in Spring Lake?
There are 5,875 People in the Labor Forcein in Spring Lake.
What is the Percentage of People in the Labor Force in Spring Lake?
66.8% of People are in the Labor Force in Spring Lake.
What is the Unemployment Rate in Spring Lake?
Unemployment Rate in Spring Lake is 8.3%.