Connelly Springs, NC
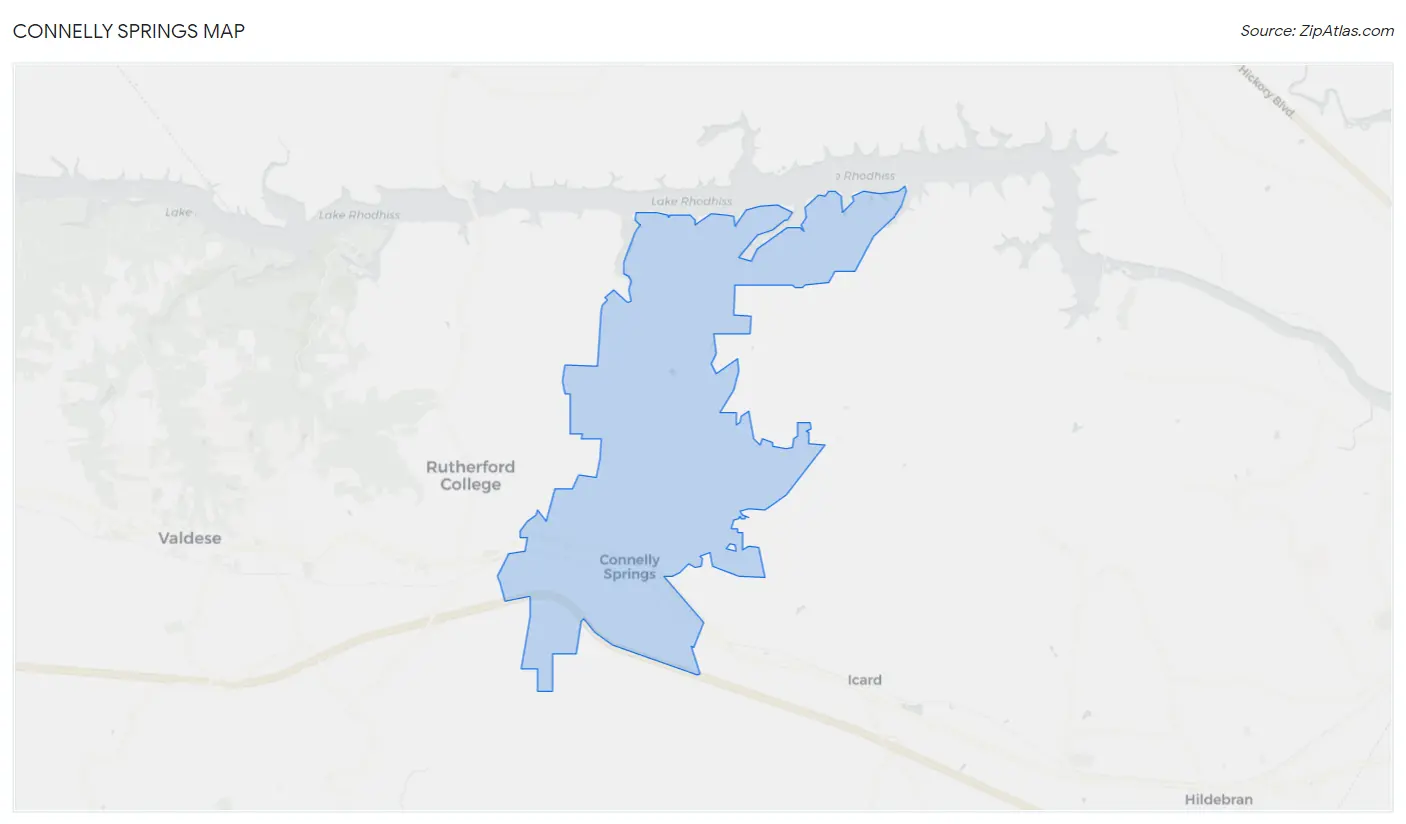
Connelly Springs Map
Connelly Springs Overview
2,355
TOTAL POPULATION
1,278
MALE POPULATION
1,077
FEMALE POPULATION
118.66
MALES / 100 FEMALES
84.27
FEMALES / 100 MALES
44.3
MEDIAN AGE
2.9
AVG FAMILY SIZE
2.6
AVG HOUSEHOLD SIZE
$36,742
PER CAPITA INCOME
$69,643
AVG FAMILY INCOME
$63,963
AVG HOUSEHOLD INCOME
29.7%
WAGE / INCOME GAP [ % ]
70.3¢/ $1
WAGE / INCOME GAP [ $ ]
$9,235
FAMILY INCOME DEFICIT
0.50
INEQUALITY / GINI INDEX
877
LABOR FORCE [ PEOPLE ]
44.9%
PERCENT IN LABOR FORCE
6.8%
UNEMPLOYMENT RATE
Connelly Springs Zip Codes
Connelly Springs Area Codes
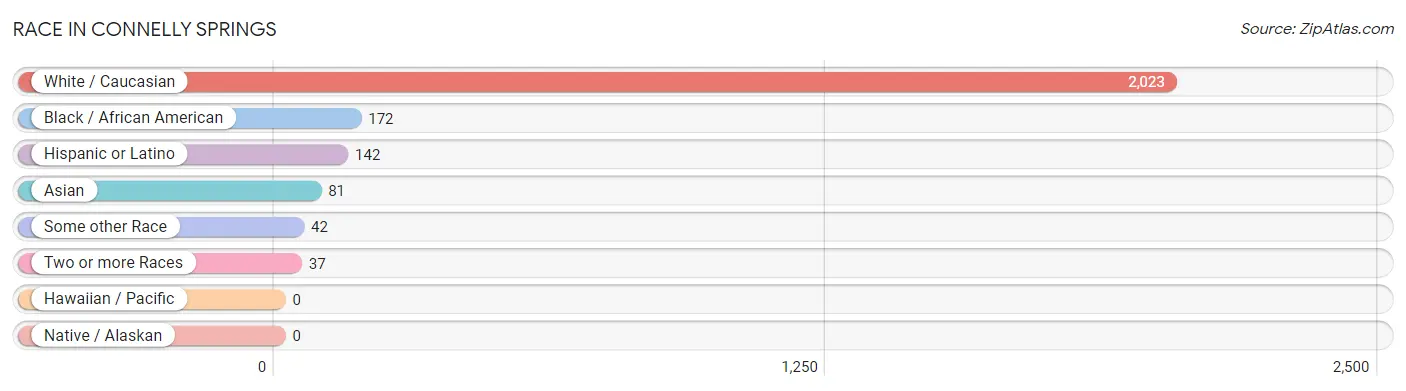
Race in Connelly Springs
The most populous races in Connelly Springs are White / Caucasian (2,023 | 85.9%), Black / African American (172 | 7.3%), and Hispanic or Latino (142 | 6.0%).
| Race | # Population | % Population |
| Asian | 81 | 3.4% |
| Black / African American | 172 | 7.3% |
| Hawaiian / Pacific | 0 | 0.0% |
| Hispanic or Latino | 142 | 6.0% |
| Native / Alaskan | 0 | 0.0% |
| White / Caucasian | 2,023 | 85.9% |
| Two or more Races | 37 | 1.6% |
| Some other Race | 42 | 1.8% |
| Total | 2,355 | 100.0% |
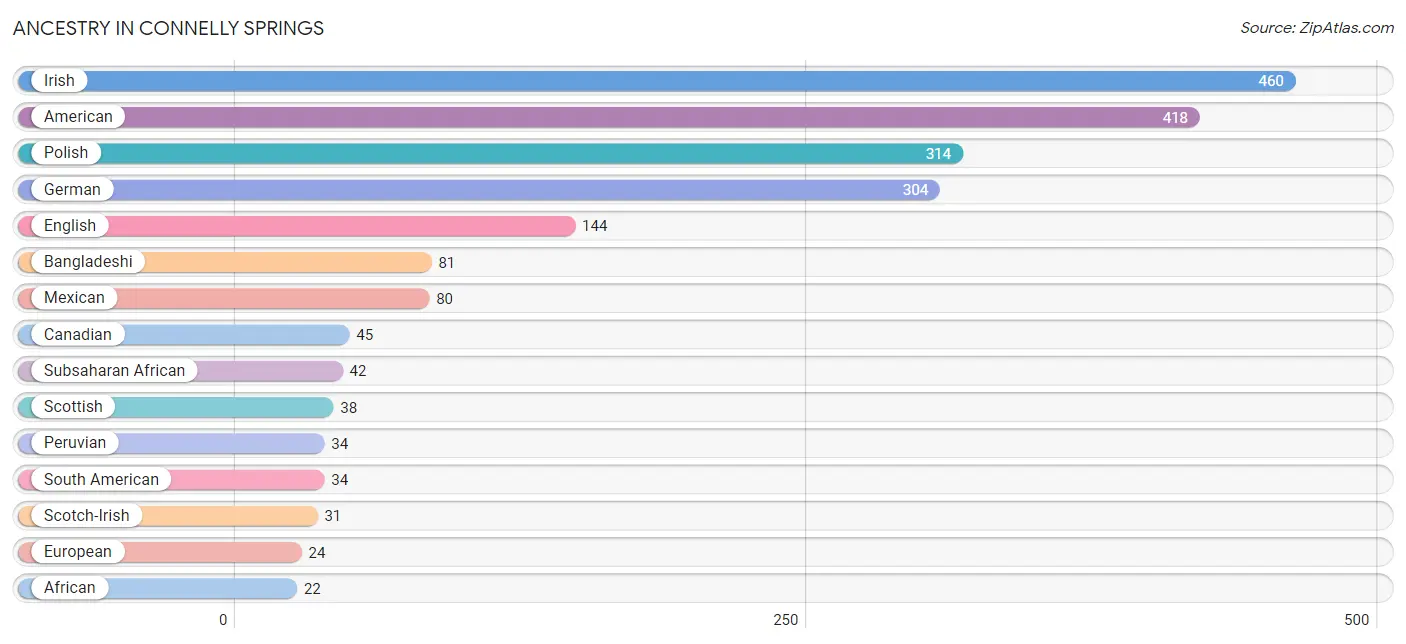
Ancestry in Connelly Springs
The most populous ancestries reported in Connelly Springs are Irish (460 | 19.5%), American (418 | 17.7%), Polish (314 | 13.3%), German (304 | 12.9%), and English (144 | 6.1%), together accounting for 69.6% of all Connelly Springs residents.
| Ancestry | # Population | % Population |
| African | 22 | 0.9% |
| American | 418 | 17.7% |
| Bangladeshi | 81 | 3.4% |
| Canadian | 45 | 1.9% |
| Dutch | 11 | 0.5% |
| English | 144 | 6.1% |
| European | 24 | 1.0% |
| French | 7 | 0.3% |
| French Canadian | 8 | 0.3% |
| German | 304 | 12.9% |
| Greek | 6 | 0.3% |
| Hungarian | 6 | 0.3% |
| Irish | 460 | 19.5% |
| Italian | 21 | 0.9% |
| Korean | 8 | 0.3% |
| Mexican | 80 | 3.4% |
| Nigerian | 20 | 0.9% |
| Norwegian | 11 | 0.5% |
| Peruvian | 34 | 1.4% |
| Polish | 314 | 13.3% |
| Puerto Rican | 9 | 0.4% |
| Scotch-Irish | 31 | 1.3% |
| Scottish | 38 | 1.6% |
| South American | 34 | 1.4% |
| Spanish | 11 | 0.5% |
| Subsaharan African | 42 | 1.8% |
| Swedish | 14 | 0.6% |
| Welsh | 7 | 0.3% | View All 28 Rows |
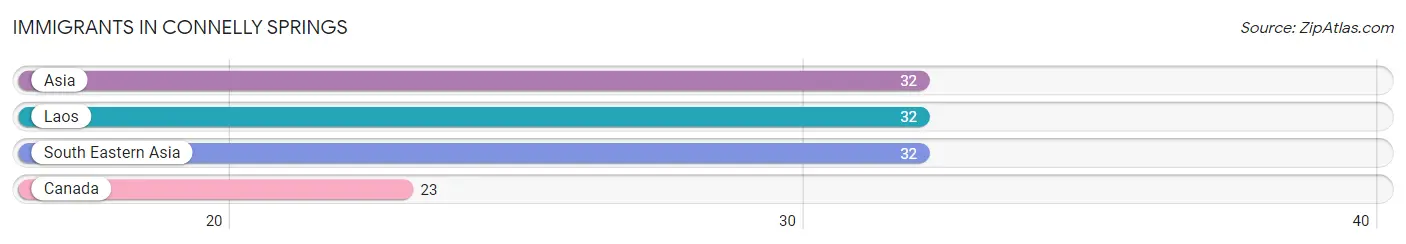
Immigrants in Connelly Springs
The most numerous immigrant groups reported in Connelly Springs came from Asia (32 | 1.4%), Laos (32 | 1.4%), South Eastern Asia (32 | 1.4%), and Canada (23 | 1.0%), together accounting for 5.1% of all Connelly Springs residents.
| Immigration Origin | # Population | % Population |
| Asia | 32 | 1.4% |
| Canada | 23 | 1.0% |
| Laos | 32 | 1.4% |
| South Eastern Asia | 32 | 1.4% | View All 4 Rows |
Sex and Age in Connelly Springs
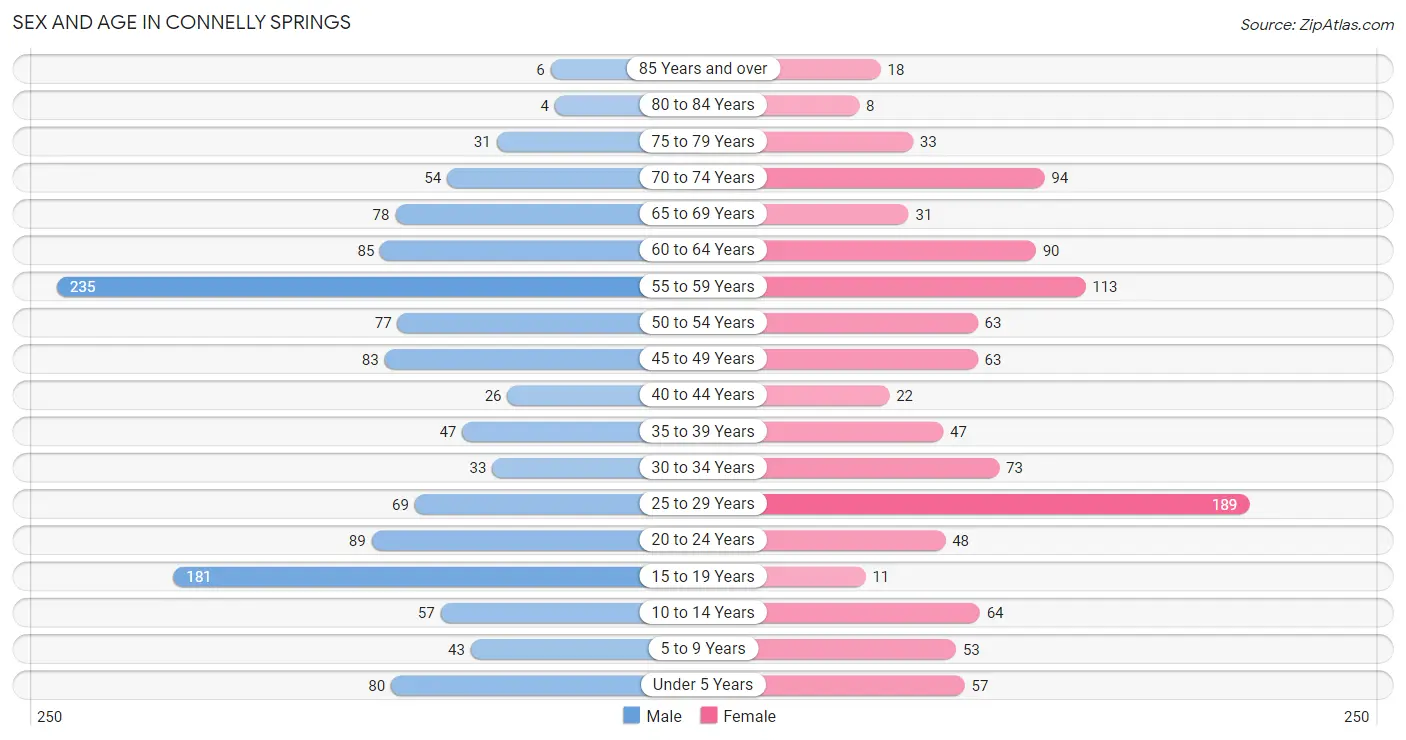
Sex and Age in Connelly Springs
The most populous age groups in Connelly Springs are 55 to 59 Years (235 | 18.4%) for men and 25 to 29 Years (189 | 17.5%) for women.
| Age Bracket | Male | Female |
| Under 5 Years | 80 (6.3%) | 57 (5.3%) |
| 5 to 9 Years | 43 (3.4%) | 53 (4.9%) |
| 10 to 14 Years | 57 (4.5%) | 64 (5.9%) |
| 15 to 19 Years | 181 (14.2%) | 11 (1.0%) |
| 20 to 24 Years | 89 (7.0%) | 48 (4.5%) |
| 25 to 29 Years | 69 (5.4%) | 189 (17.5%) |
| 30 to 34 Years | 33 (2.6%) | 73 (6.8%) |
| 35 to 39 Years | 47 (3.7%) | 47 (4.4%) |
| 40 to 44 Years | 26 (2.0%) | 22 (2.0%) |
| 45 to 49 Years | 83 (6.5%) | 63 (5.9%) |
| 50 to 54 Years | 77 (6.0%) | 63 (5.9%) |
| 55 to 59 Years | 235 (18.4%) | 113 (10.5%) |
| 60 to 64 Years | 85 (6.7%) | 90 (8.4%) |
| 65 to 69 Years | 78 (6.1%) | 31 (2.9%) |
| 70 to 74 Years | 54 (4.2%) | 94 (8.7%) |
| 75 to 79 Years | 31 (2.4%) | 33 (3.1%) |
| 80 to 84 Years | 4 (0.3%) | 8 (0.7%) |
| 85 Years and over | 6 (0.5%) | 18 (1.7%) |
| Total | 1,278 (100.0%) | 1,077 (100.0%) |
Families and Households in Connelly Springs
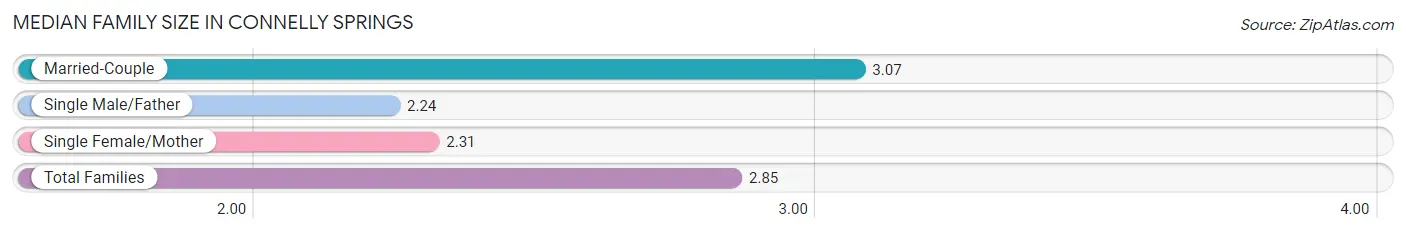
Median Family Size in Connelly Springs
The median family size in Connelly Springs is 2.85 persons per family, with married-couple families (506 | 72.3%) accounting for the largest median family size of 3.07 persons per family. On the other hand, single male/father families (113 | 16.1%) represent the smallest median family size with 2.24 persons per family.
| Family Type | # Families | Family Size |
| Married-Couple | 506 (72.3%) | 3.07 |
| Single Male/Father | 113 (16.1%) | 2.24 |
| Single Female/Mother | 81 (11.6%) | 2.31 |
| Total Families | 700 (100.0%) | 2.85 |
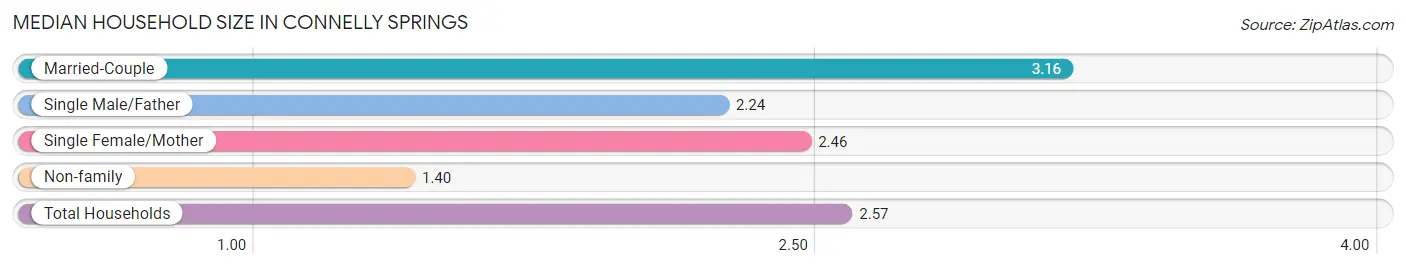
Median Household Size in Connelly Springs
The median household size in Connelly Springs is 2.57 persons per household, with married-couple households (506 | 55.2%) accounting for the largest median household size of 3.16 persons per household. non-family households (216 | 23.6%) represent the smallest median household size with 1.40 persons per household.
| Household Type | # Households | Household Size |
| Married-Couple | 506 (55.2%) | 3.16 |
| Single Male/Father | 113 (12.3%) | 2.24 |
| Single Female/Mother | 81 (8.8%) | 2.46 |
| Non-family | 216 (23.6%) | 1.40 |
| Total Households | 916 (100.0%) | 2.57 |
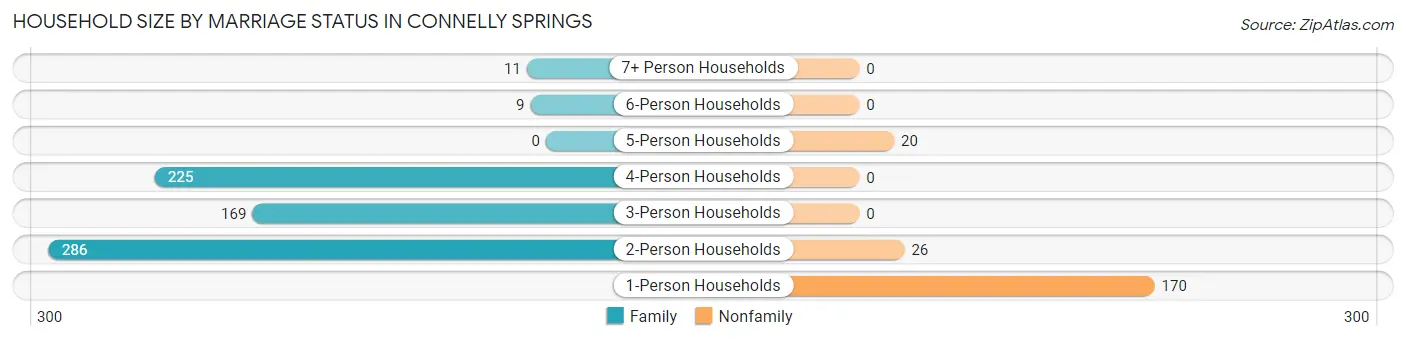
Household Size by Marriage Status in Connelly Springs
Out of a total of 916 households in Connelly Springs, 700 (76.4%) are family households, while 216 (23.6%) are nonfamily households. The most numerous type of family households are 2-person households, comprising 286, and the most common type of nonfamily households are 1-person households, comprising 170.
| Household Size | Family Households | Nonfamily Households |
| 1-Person Households | - | 170 (18.6%) |
| 2-Person Households | 286 (31.2%) | 26 (2.8%) |
| 3-Person Households | 169 (18.4%) | 0 (0.0%) |
| 4-Person Households | 225 (24.6%) | 0 (0.0%) |
| 5-Person Households | 0 (0.0%) | 20 (2.2%) |
| 6-Person Households | 9 (1.0%) | 0 (0.0%) |
| 7+ Person Households | 11 (1.2%) | 0 (0.0%) |
| Total | 700 (76.4%) | 216 (23.6%) |
Female Fertility in Connelly Springs
Fertility by Age in Connelly Springs
Average fertility rate in Connelly Springs is 92.0 births per 1,000 women. Women in the age bracket of 35 to 50 years have the highest fertility rate with 97.0 births per 1,000 women. Women in the age bracket of 20 to 34 years acount for 65.9% of all women with births.
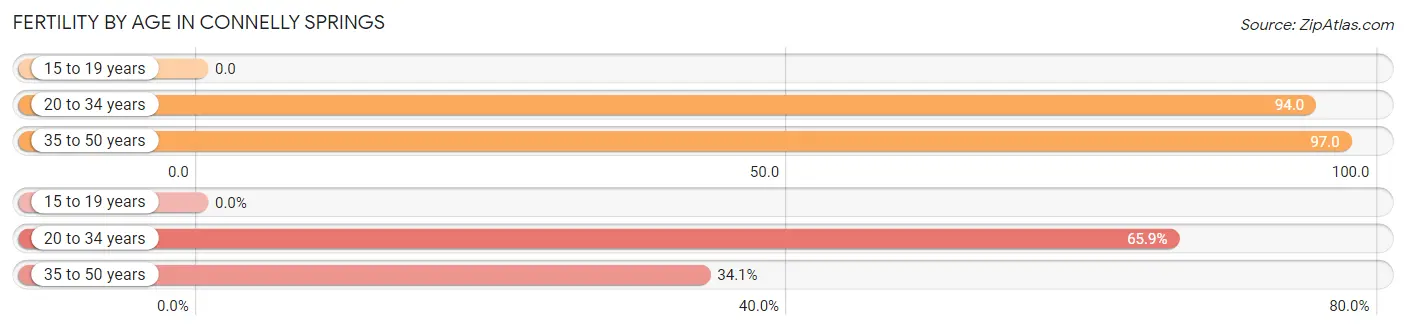
| Age Bracket | Women with Births | Births / 1,000 Women |
| 15 to 19 years | 0 (0.0%) | 0.0 |
| 20 to 34 years | 29 (65.9%) | 94.0 |
| 35 to 50 years | 15 (34.1%) | 97.0 |
| Total | 44 (100.0%) | 92.0 |
Fertility by Age by Marriage Status in Connelly Springs
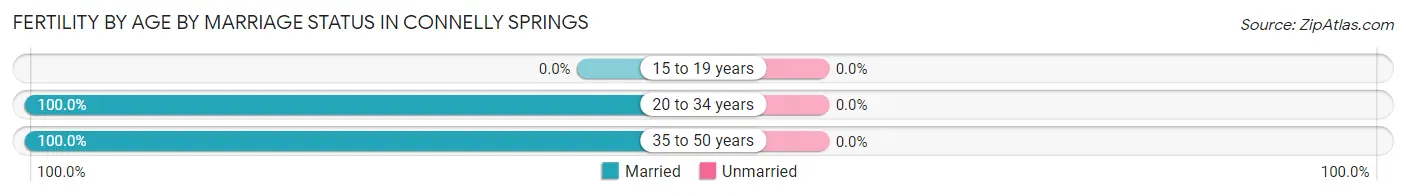
| Age Bracket | Married | Unmarried |
| 15 to 19 years | 0 (0.0%) | 0 (0.0%) |
| 20 to 34 years | 29 (100.0%) | 0 (0.0%) |
| 35 to 50 years | 15 (100.0%) | 0 (0.0%) |
| Total | 44 (100.0%) | 0 (0.0%) |
Fertility by Education in Connelly Springs
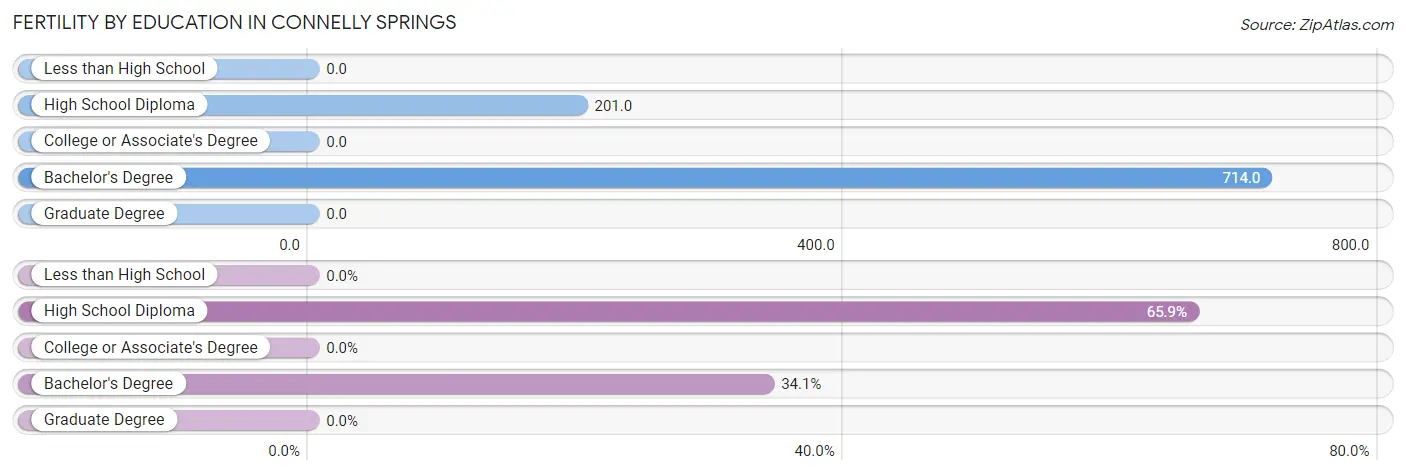
| Educational Attainment | Women with Births | Births / 1,000 Women |
| Less than High School | 0 (0.0%) | 0.0 |
| High School Diploma | 29 (65.9%) | 201.0 |
| College or Associate's Degree | 0 (0.0%) | 0.0 |
| Bachelor's Degree | 15 (34.1%) | 714.0 |
| Graduate Degree | 0 (0.0%) | 0.0 |
| Total | 44 (100.0%) | 92.0 |
Fertility by Education by Marriage Status in Connelly Springs
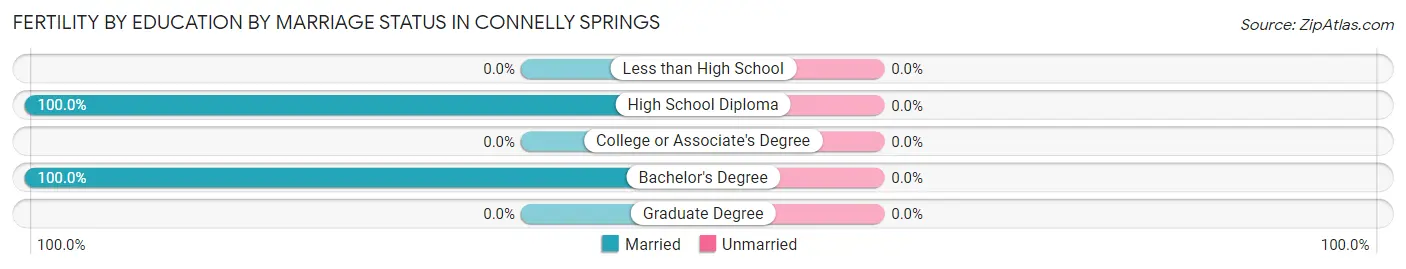
| Educational Attainment | Married | Unmarried |
| Less than High School | 0 (0.0%) | 0 (0.0%) |
| High School Diploma | 29 (100.0%) | 0 (0.0%) |
| College or Associate's Degree | 0 (0.0%) | 0 (0.0%) |
| Bachelor's Degree | 15 (100.0%) | 0 (0.0%) |
| Graduate Degree | 0 (0.0%) | 0 (0.0%) |
| Total | 44 (100.0%) | 0 (0.0%) |
Income in Connelly Springs
Income Overview in Connelly Springs
Per Capita Income in Connelly Springs is $36,742, while median incomes of families and households are $69,643 and $63,963 respectively.
| Characteristic | Number | Measure |
| Per Capita Income | 2,355 | $36,742 |
| Median Family Income | 700 | $69,643 |
| Mean Family Income | 700 | $94,264 |
| Median Household Income | 916 | $63,963 |
| Mean Household Income | 916 | $97,199 |
| Income Deficit | 700 | $9,235 |
| Wage / Income Gap (%) | 2,355 | 29.72% |
| Wage / Income Gap ($) | 2,355 | 70.28¢ per $1 |
| Gini / Inequality Index | 2,355 | 0.50 |
Earnings by Sex in Connelly Springs
Average Earnings in Connelly Springs are $35,543, $45,789 for men and $32,179 for women, a difference of 29.7%.
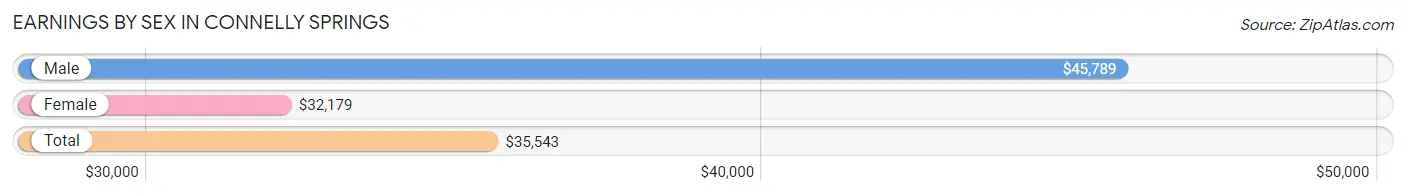
| Sex | Number | Average Earnings |
| Male | 608 (66.2%) | $45,789 |
| Female | 310 (33.8%) | $32,179 |
| Total | 918 (100.0%) | $35,543 |
Earnings by Sex by Income Bracket in Connelly Springs
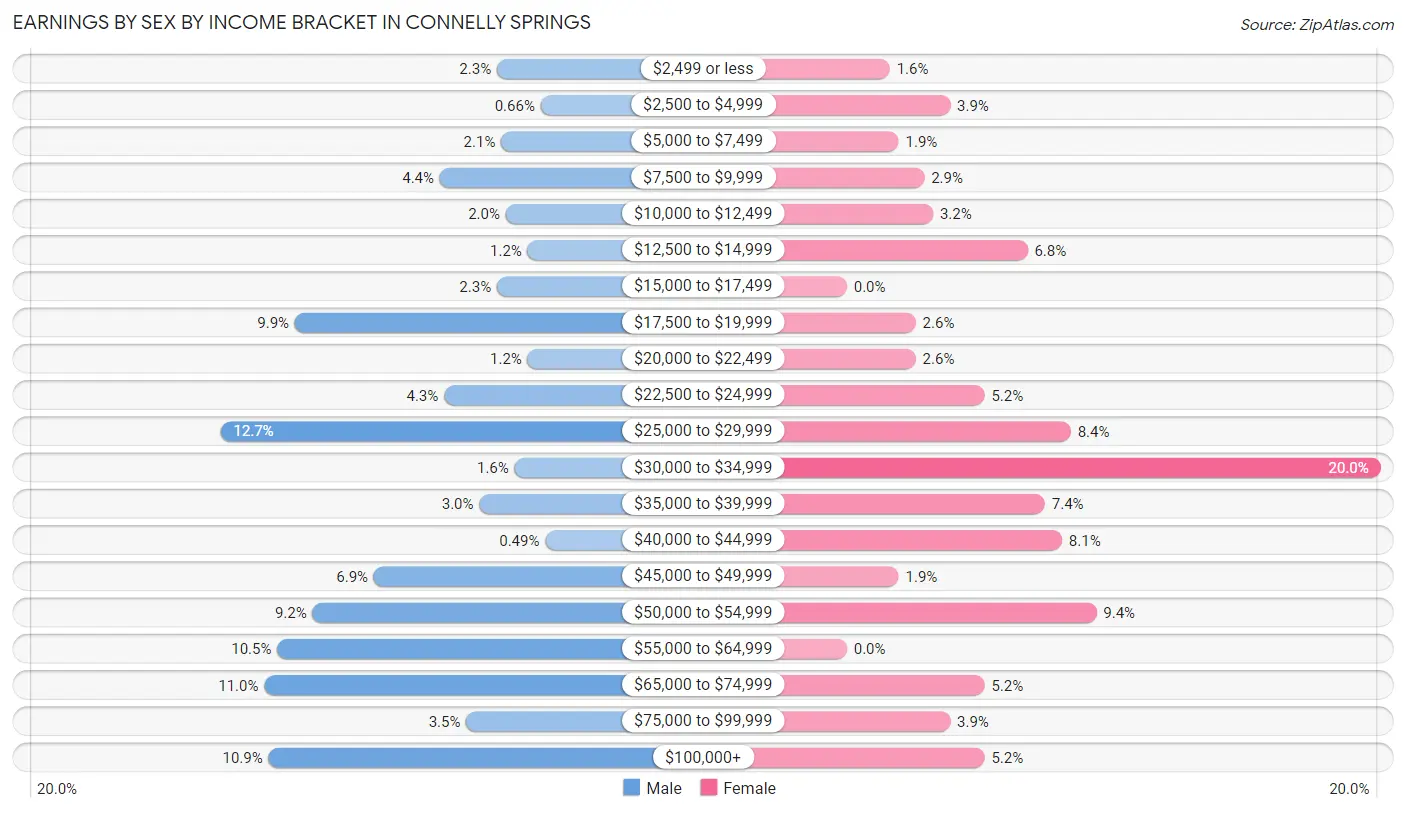
The most common earnings brackets in Connelly Springs are $25,000 to $29,999 for men (77 | 12.7%) and $30,000 to $34,999 for women (62 | 20.0%).
| Income | Male | Female |
| $2,499 or less | 14 (2.3%) | 5 (1.6%) |
| $2,500 to $4,999 | 4 (0.7%) | 12 (3.9%) |
| $5,000 to $7,499 | 13 (2.1%) | 6 (1.9%) |
| $7,500 to $9,999 | 27 (4.4%) | 9 (2.9%) |
| $10,000 to $12,499 | 12 (2.0%) | 10 (3.2%) |
| $12,500 to $14,999 | 7 (1.1%) | 21 (6.8%) |
| $15,000 to $17,499 | 14 (2.3%) | 0 (0.0%) |
| $17,500 to $19,999 | 60 (9.9%) | 8 (2.6%) |
| $20,000 to $22,499 | 7 (1.1%) | 8 (2.6%) |
| $22,500 to $24,999 | 26 (4.3%) | 16 (5.2%) |
| $25,000 to $29,999 | 77 (12.7%) | 26 (8.4%) |
| $30,000 to $34,999 | 10 (1.6%) | 62 (20.0%) |
| $35,000 to $39,999 | 18 (3.0%) | 23 (7.4%) |
| $40,000 to $44,999 | 3 (0.5%) | 25 (8.1%) |
| $45,000 to $49,999 | 42 (6.9%) | 6 (1.9%) |
| $50,000 to $54,999 | 56 (9.2%) | 29 (9.3%) |
| $55,000 to $64,999 | 64 (10.5%) | 0 (0.0%) |
| $65,000 to $74,999 | 67 (11.0%) | 16 (5.2%) |
| $75,000 to $99,999 | 21 (3.5%) | 12 (3.9%) |
| $100,000+ | 66 (10.9%) | 16 (5.2%) |
| Total | 608 (100.0%) | 310 (100.0%) |
Earnings by Sex by Educational Attainment in Connelly Springs
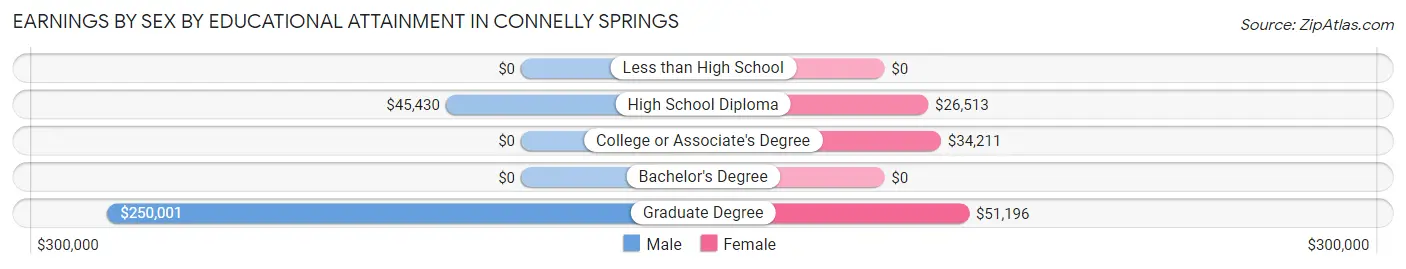
Average earnings in Connelly Springs are $46,250 for men and $33,424 for women, a difference of 27.7%. Men with an educational attainment of graduate degree enjoy the highest average annual earnings of $250,001, while those with high school diploma education earn the least with $45,430. Women with an educational attainment of graduate degree earn the most with the average annual earnings of $51,196, while those with high school diploma education have the smallest earnings of $26,513.
| Educational Attainment | Male Income | Female Income |
| Less than High School | - | - |
| High School Diploma | $45,430 | $26,513 |
| College or Associate's Degree | - | - |
| Bachelor's Degree | - | - |
| Graduate Degree | $250,001 | $51,196 |
| Total | $46,250 | $33,424 |
Family Income in Connelly Springs
Family Income Brackets in Connelly Springs
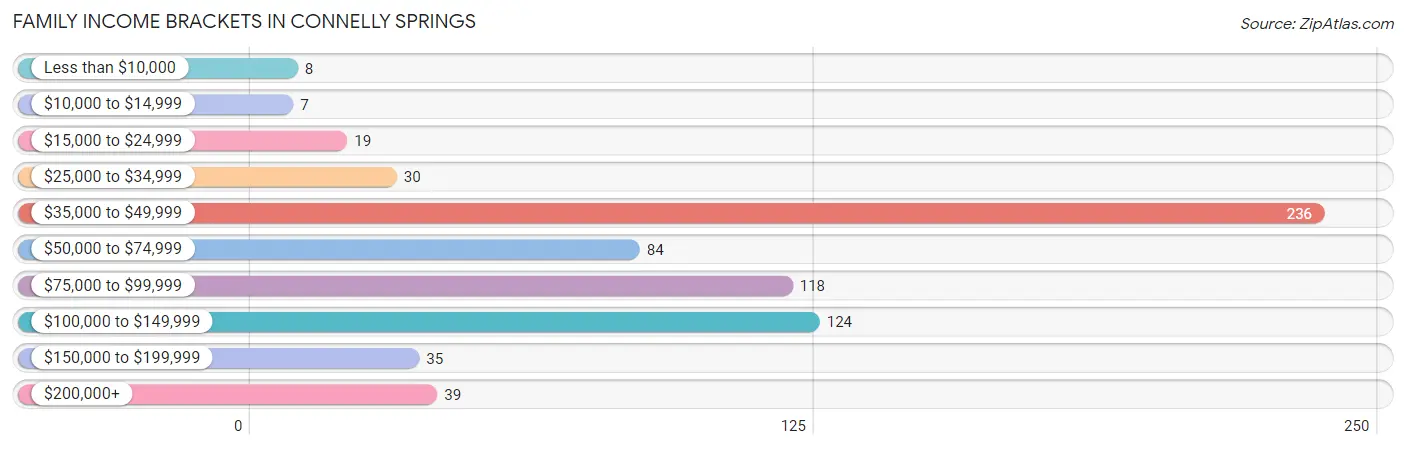
According to the Connelly Springs family income data, there are 236 families falling into the $35,000 to $49,999 income range, which is the most common income bracket and makes up 33.7% of all families. Conversely, the $10,000 to $14,999 income bracket is the least frequent group with only 7 families (1.0%) belonging to this category.
| Income Bracket | # Families | % Families |
| Less than $10,000 | 8 | 1.1% |
| $10,000 to $14,999 | 7 | 1.0% |
| $15,000 to $24,999 | 19 | 2.7% |
| $25,000 to $34,999 | 30 | 4.3% |
| $35,000 to $49,999 | 236 | 33.7% |
| $50,000 to $74,999 | 84 | 12.0% |
| $75,000 to $99,999 | 118 | 16.9% |
| $100,000 to $149,999 | 124 | 17.7% |
| $150,000 to $199,999 | 35 | 5.0% |
| $200,000+ | 39 | 5.6% |
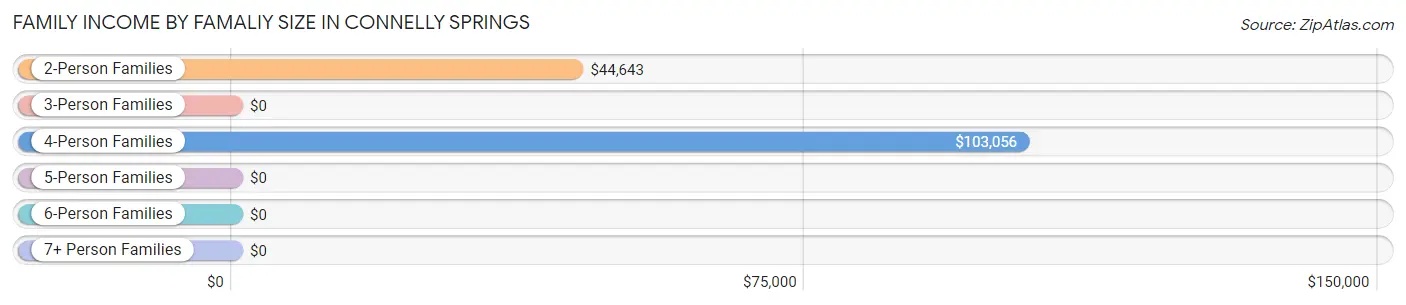
Family Income by Famaliy Size in Connelly Springs
4-person families (222 | 31.7%) account for the highest median family income in Connelly Springs with $103,056 per family, while 4-person families (222 | 31.7%) have the highest median income of $25,764 per family member.
| Income Bracket | # Families | Median Income |
| 2-Person Families | 292 (41.7%) | $44,643 |
| 3-Person Families | 175 (25.0%) | $0 |
| 4-Person Families | 222 (31.7%) | $103,056 |
| 5-Person Families | 0 (0.0%) | $0 |
| 6-Person Families | 0 (0.0%) | $0 |
| 7+ Person Families | 11 (1.6%) | $0 |
| Total | 700 (100.0%) | $69,643 |
Family Income by Number of Earners in Connelly Springs
The median family income in Connelly Springs is $69,643, with families comprising 3+ earners (37) having the highest median family income of $98,274, while families with no earners (182) have the lowest median family income of $48,594, accounting for 5.3% and 26.0% of families, respectively.
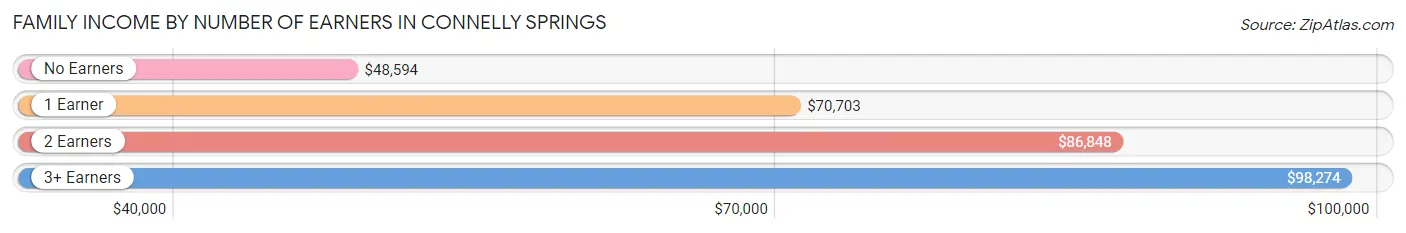
| Number of Earners | # Families | Median Income |
| No Earners | 182 (26.0%) | $48,594 |
| 1 Earner | 299 (42.7%) | $70,703 |
| 2 Earners | 182 (26.0%) | $86,848 |
| 3+ Earners | 37 (5.3%) | $98,274 |
| Total | 700 (100.0%) | $69,643 |
Household Income in Connelly Springs
Household Income Brackets in Connelly Springs
With 250 households falling in the category, the $35,000 to $49,999 income range is the most frequent in Connelly Springs, accounting for 27.3% of all households. In contrast, only 28 households (3.1%) fall into the less than $10,000 income bracket, making it the least populous group.
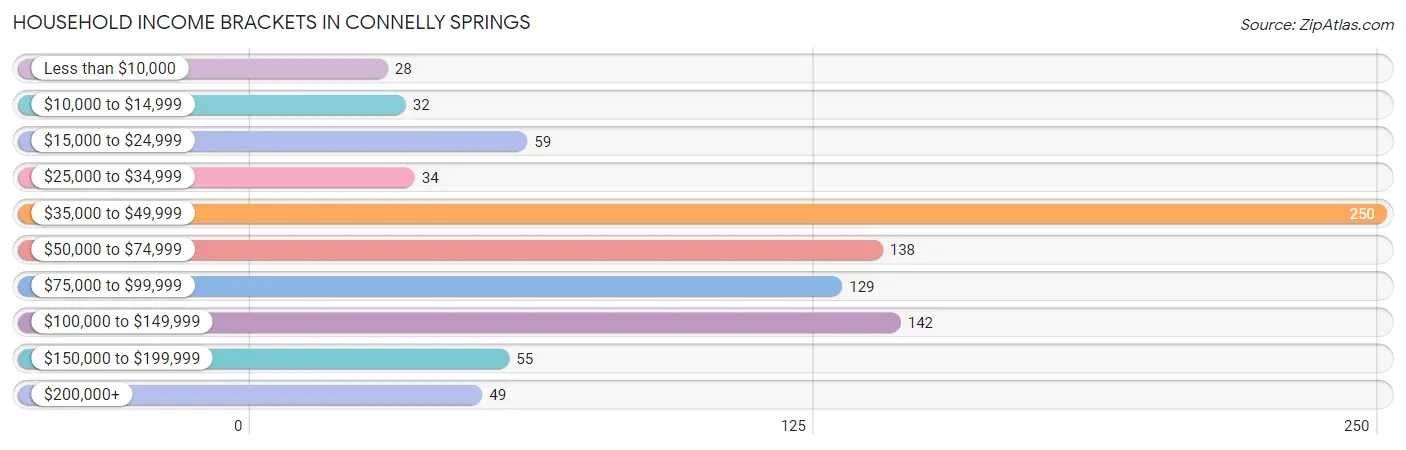
| Income Bracket | # Households | % Households |
| Less than $10,000 | 28 | 3.1% |
| $10,000 to $14,999 | 32 | 3.5% |
| $15,000 to $24,999 | 59 | 6.4% |
| $25,000 to $34,999 | 34 | 3.7% |
| $35,000 to $49,999 | 250 | 27.3% |
| $50,000 to $74,999 | 138 | 15.1% |
| $75,000 to $99,999 | 129 | 14.1% |
| $100,000 to $149,999 | 142 | 15.5% |
| $150,000 to $199,999 | 55 | 6.0% |
| $200,000+ | 49 | 5.3% |
Household Income by Householder Age in Connelly Springs
The median household income in Connelly Springs is $63,963, with the highest median household income of $85,652 found in the 15 to 24 years age bracket for the primary householder. A total of 34 households (3.7%) fall into this category. Meanwhile, the 65+ years age bracket for the primary householder has the lowest median household income of $61,083, with 245 households (26.8%) in this group.
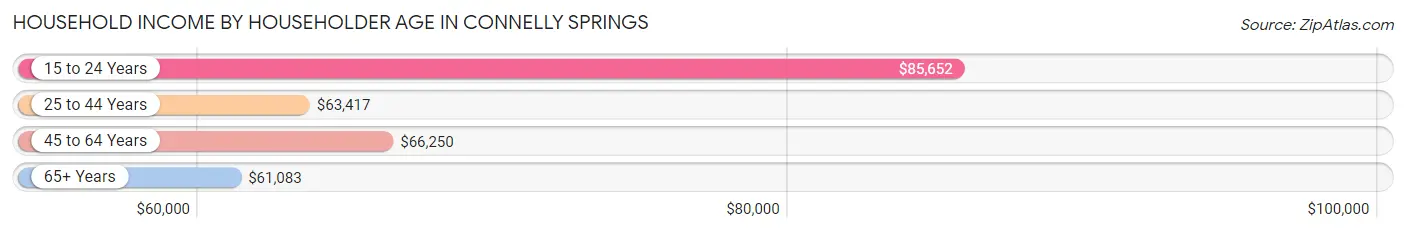
| Income Bracket | # Households | Median Income |
| 15 to 24 Years | 34 (3.7%) | $85,652 |
| 25 to 44 Years | 127 (13.9%) | $63,417 |
| 45 to 64 Years | 510 (55.7%) | $66,250 |
| 65+ Years | 245 (26.8%) | $61,083 |
| Total | 916 (100.0%) | $63,963 |
Poverty in Connelly Springs
Income Below Poverty by Sex and Age in Connelly Springs
With 8.6% poverty level for males and 8.1% for females among the residents of Connelly Springs, 25 to 34 year old males and 35 to 44 year old females are the most vulnerable to poverty, with 40 males (39.2%) and 12 females (17.4%) in their respective age groups living below the poverty level.
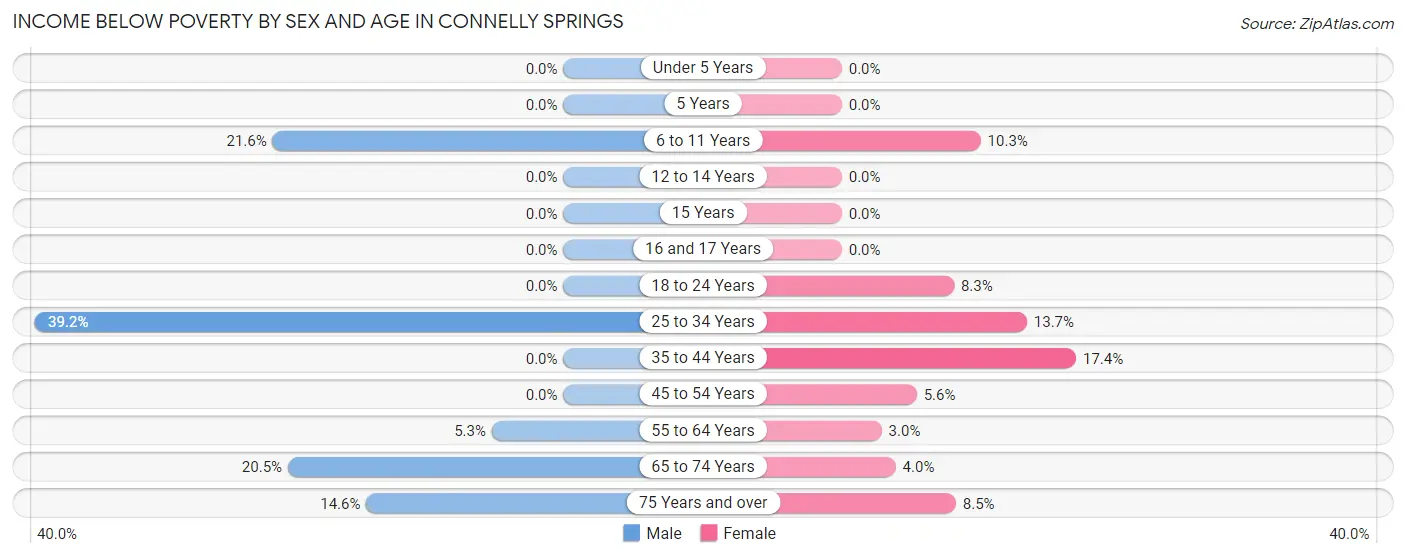
| Age Bracket | Male | Female |
| Under 5 Years | 0 (0.0%) | 0 (0.0%) |
| 5 Years | 0 (0.0%) | 0 (0.0%) |
| 6 to 11 Years | 19 (21.6%) | 10 (10.3%) |
| 12 to 14 Years | 0 (0.0%) | 0 (0.0%) |
| 15 Years | 0 (0.0%) | 0 (0.0%) |
| 16 and 17 Years | 0 (0.0%) | 0 (0.0%) |
| 18 to 24 Years | 0 (0.0%) | 4 (8.3%) |
| 25 to 34 Years | 40 (39.2%) | 36 (13.7%) |
| 35 to 44 Years | 0 (0.0%) | 12 (17.4%) |
| 45 to 54 Years | 0 (0.0%) | 7 (5.6%) |
| 55 to 64 Years | 17 (5.3%) | 6 (3.0%) |
| 65 to 74 Years | 27 (20.4%) | 5 (4.0%) |
| 75 Years and over | 6 (14.6%) | 5 (8.5%) |
| Total | 109 (8.6%) | 85 (8.1%) |
Income Above Poverty by Sex and Age in Connelly Springs
According to the poverty statistics in Connelly Springs, males aged under 5 years and females aged under 5 years are the age groups that are most secure financially, with 100.0% of males and 100.0% of females in these age groups living above the poverty line.
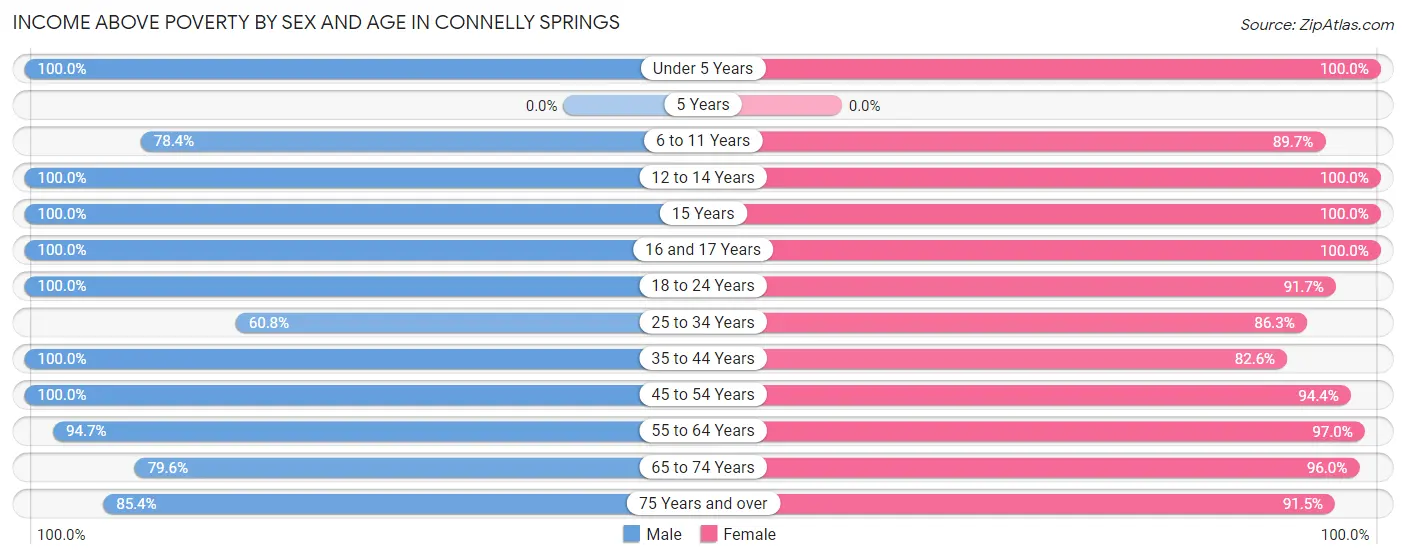
| Age Bracket | Male | Female |
| Under 5 Years | 68 (100.0%) | 40 (100.0%) |
| 5 Years | 0 (0.0%) | 0 (0.0%) |
| 6 to 11 Years | 69 (78.4%) | 87 (89.7%) |
| 12 to 14 Years | 12 (100.0%) | 9 (100.0%) |
| 15 Years | 42 (100.0%) | 5 (100.0%) |
| 16 and 17 Years | 28 (100.0%) | 6 (100.0%) |
| 18 to 24 Years | 200 (100.0%) | 44 (91.7%) |
| 25 to 34 Years | 62 (60.8%) | 226 (86.3%) |
| 35 to 44 Years | 73 (100.0%) | 57 (82.6%) |
| 45 to 54 Years | 160 (100.0%) | 119 (94.4%) |
| 55 to 64 Years | 303 (94.7%) | 197 (97.0%) |
| 65 to 74 Years | 105 (79.5%) | 120 (96.0%) |
| 75 Years and over | 35 (85.4%) | 54 (91.5%) |
| Total | 1,157 (91.4%) | 964 (91.9%) |
Income Below Poverty Among Married-Couple Families in Connelly Springs
The poverty statistics for married-couple families in Connelly Springs show that 6.7% or 34 of the total 506 families live below the poverty line. Families with 1 or 2 children have the highest poverty rate of 12.4%, comprising of 19 families. On the other hand, families with 5 or more children have the lowest poverty rate of 0.0%, which includes 0 families.
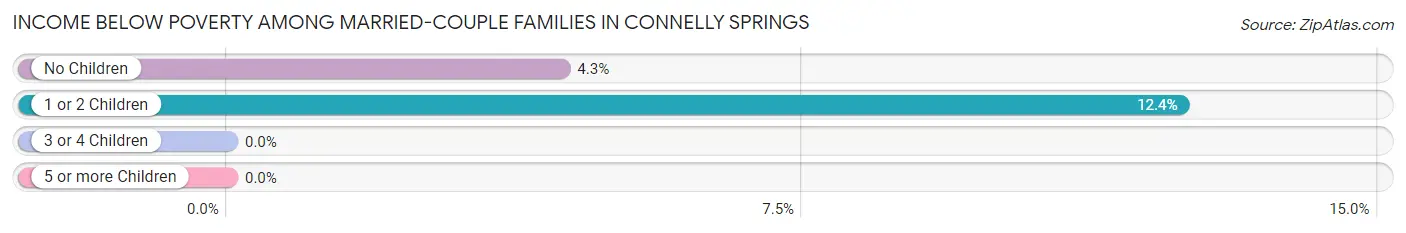
| Children | Above Poverty | Below Poverty |
| No Children | 331 (95.7%) | 15 (4.3%) |
| 1 or 2 Children | 134 (87.6%) | 19 (12.4%) |
| 3 or 4 Children | 0 (0.0%) | 0 (0.0%) |
| 5 or more Children | 7 (100.0%) | 0 (0.0%) |
| Total | 472 (93.3%) | 34 (6.7%) |
Income Below Poverty Among Single-Parent Households in Connelly Springs
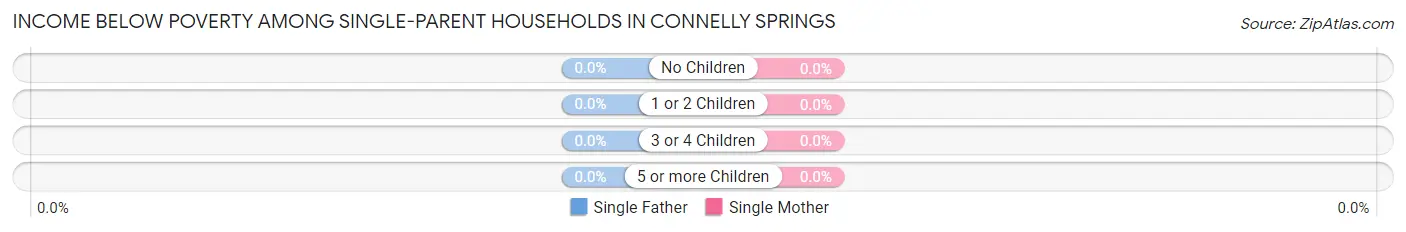
| Children | Single Father | Single Mother |
| No Children | 0 (0.0%) | 0 (0.0%) |
| 1 or 2 Children | 0 (0.0%) | 0 (0.0%) |
| 3 or 4 Children | 0 (0.0%) | 0 (0.0%) |
| 5 or more Children | 0 (0.0%) | 0 (0.0%) |
| Total | 0 (0.0%) | 0 (0.0%) |
Income Below Poverty Among Married-Couple vs Single-Parent Households in Connelly Springs
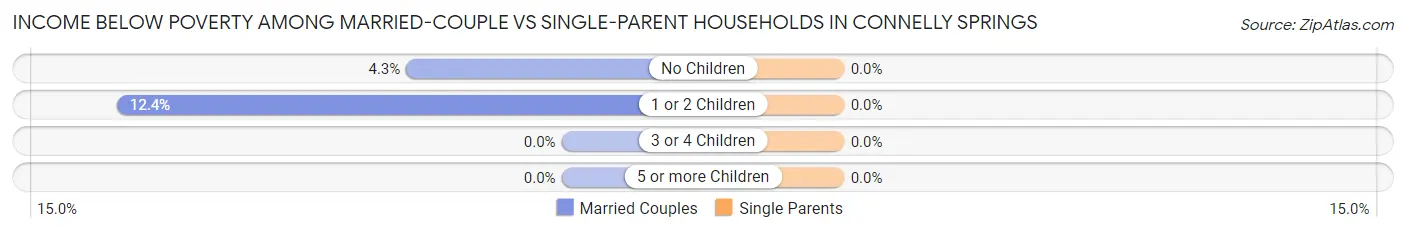
| Children | Married-Couple Families | Single-Parent Households |
| No Children | 15 (4.3%) | 0 (0.0%) |
| 1 or 2 Children | 19 (12.4%) | 0 (0.0%) |
| 3 or 4 Children | 0 (0.0%) | 0 (0.0%) |
| 5 or more Children | 0 (0.0%) | 0 (0.0%) |
| Total | 34 (6.7%) | 0 (0.0%) |
Employment Characteristics in Connelly Springs
Employment by Class of Employer in Connelly Springs
Among the 783 employed individuals in Connelly Springs, private company employees (600 | 76.6%), local government employees (80 | 10.2%), and not-for-profit organizations (63 | 8.1%) make up the most common classes of employment.
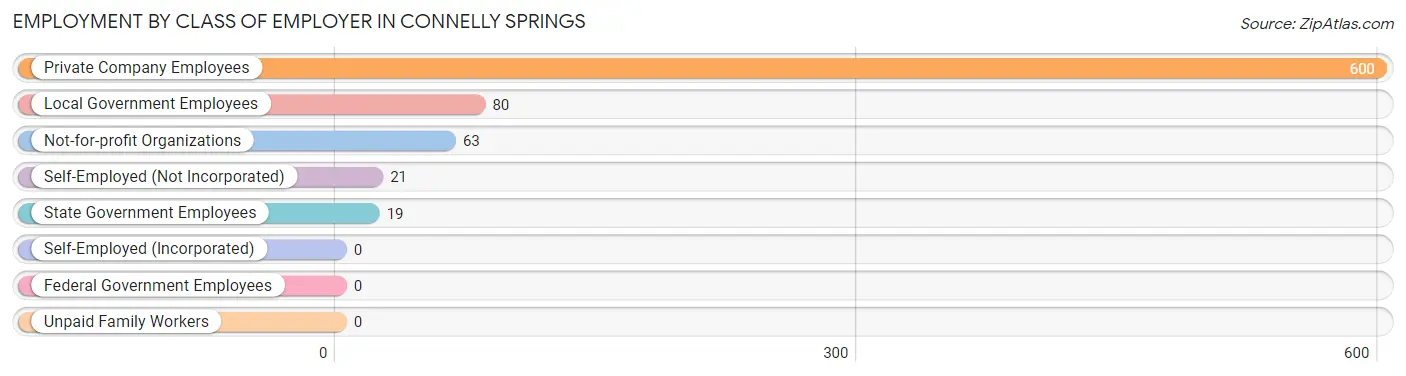
| Employer Class | # Employees | % Employees |
| Private Company Employees | 600 | 76.6% |
| Self-Employed (Incorporated) | 0 | 0.0% |
| Self-Employed (Not Incorporated) | 21 | 2.7% |
| Not-for-profit Organizations | 63 | 8.1% |
| Local Government Employees | 80 | 10.2% |
| State Government Employees | 19 | 2.4% |
| Federal Government Employees | 0 | 0.0% |
| Unpaid Family Workers | 0 | 0.0% |
| Total | 783 | 100.0% |
Employment Status by Age in Connelly Springs
According to the labor force statistics for Connelly Springs, out of the total population over 16 years of age (1,954), 44.9% or 877 individuals are in the labor force, with 6.8% or 60 of them unemployed. The age group with the highest labor force participation rate is 20 to 24 years, with 84.7% or 116 individuals in the labor force. Within the labor force, the 45 to 54 years age range has the highest percentage of unemployed individuals, with 25.2% or 53 of them being unemployed.
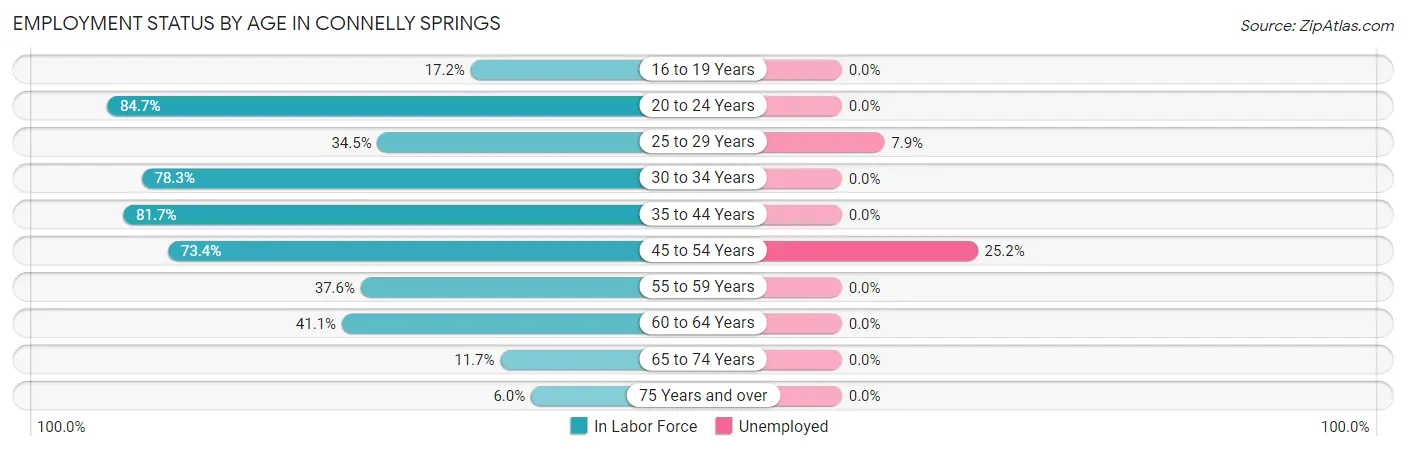
| Age Bracket | In Labor Force | Unemployed |
| 16 to 19 Years | 25 (17.2%) | 0 (0.0%) |
| 20 to 24 Years | 116 (84.7%) | 0 (0.0%) |
| 25 to 29 Years | 89 (34.5%) | 7 (7.9%) |
| 30 to 34 Years | 83 (78.3%) | 0 (0.0%) |
| 35 to 44 Years | 116 (81.7%) | 0 (0.0%) |
| 45 to 54 Years | 210 (73.4%) | 53 (25.2%) |
| 55 to 59 Years | 131 (37.6%) | 0 (0.0%) |
| 60 to 64 Years | 72 (41.1%) | 0 (0.0%) |
| 65 to 74 Years | 30 (11.7%) | 0 (0.0%) |
| 75 Years and over | 6 (6.0%) | 0 (0.0%) |
| Total | 877 (44.9%) | 60 (6.8%) |
Employment Status by Educational Attainment in Connelly Springs
According to labor force statistics for Connelly Springs, 53.3% of individuals (701) out of the total population between 25 and 64 years of age (1,315) are in the labor force, with 8.6% or 60 of them being unemployed. The group with the highest labor force participation rate are those with the educational attainment of bachelor's degree or higher, with 82.9% or 184 individuals in the labor force. Within the labor force, individuals with college / associate degree education have the highest percentage of unemployment, with 28.7% or 39 of them being unemployed.
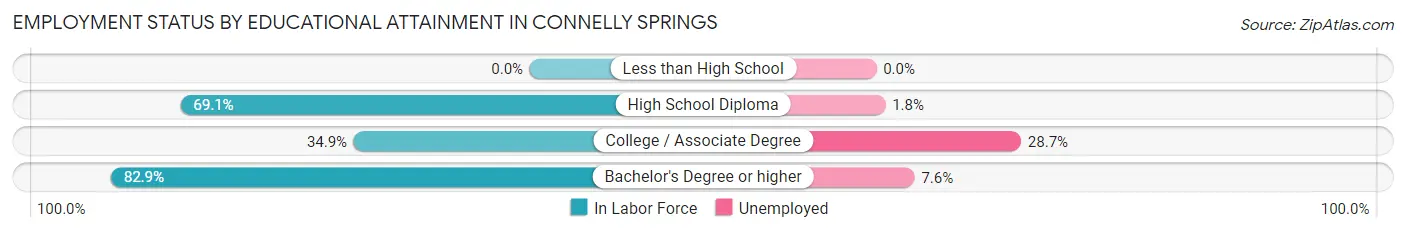
| Educational Attainment | In Labor Force | Unemployed |
| Less than High School | 0 (0.0%) | 0 (0.0%) |
| High School Diploma | 381 (69.1%) | 10 (1.8%) |
| College / Associate Degree | 136 (34.9%) | 112 (28.7%) |
| Bachelor's Degree or higher | 184 (82.9%) | 17 (7.6%) |
| Total | 701 (53.3%) | 113 (8.6%) |
Employment Occupations by Sex in Connelly Springs
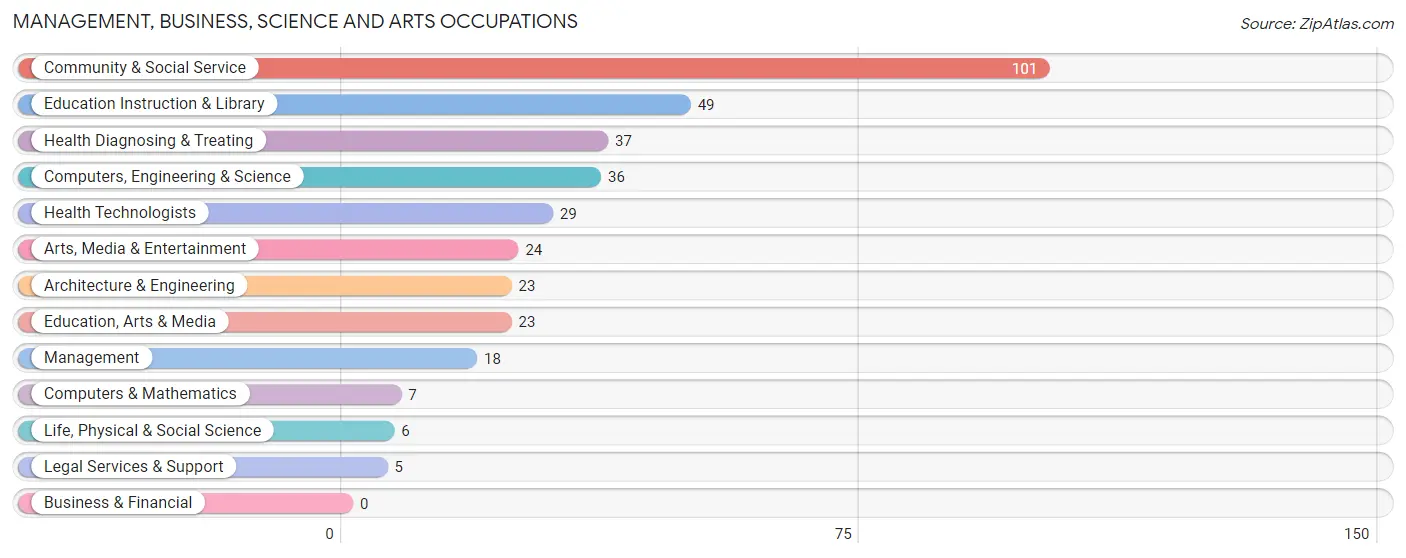
Management, Business, Science and Arts Occupations
The most common Management, Business, Science and Arts occupations in Connelly Springs are Community & Social Service (101 | 12.3%), Education Instruction & Library (49 | 6.0%), Health Diagnosing & Treating (37 | 4.5%), Computers, Engineering & Science (36 | 4.4%), and Health Technologists (29 | 3.5%).
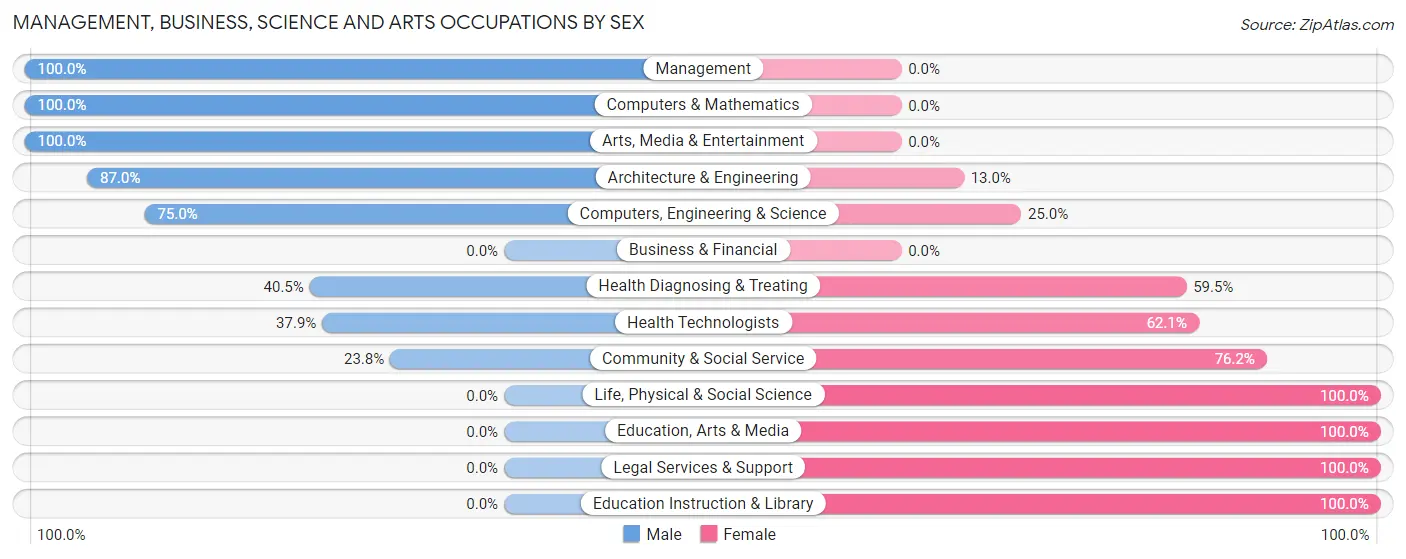
Management, Business, Science and Arts Occupations by Sex
Within the Management, Business, Science and Arts occupations in Connelly Springs, the most male-oriented occupations are Management (100.0%), Computers & Mathematics (100.0%), and Arts, Media & Entertainment (100.0%), while the most female-oriented occupations are Life, Physical & Social Science (100.0%), Education, Arts & Media (100.0%), and Legal Services & Support (100.0%).
| Occupation | Male | Female |
| Management | 18 (100.0%) | 0 (0.0%) |
| Business & Financial | 0 (0.0%) | 0 (0.0%) |
| Computers, Engineering & Science | 27 (75.0%) | 9 (25.0%) |
| Computers & Mathematics | 7 (100.0%) | 0 (0.0%) |
| Architecture & Engineering | 20 (87.0%) | 3 (13.0%) |
| Life, Physical & Social Science | 0 (0.0%) | 6 (100.0%) |
| Community & Social Service | 24 (23.8%) | 77 (76.2%) |
| Education, Arts & Media | 0 (0.0%) | 23 (100.0%) |
| Legal Services & Support | 0 (0.0%) | 5 (100.0%) |
| Education Instruction & Library | 0 (0.0%) | 49 (100.0%) |
| Arts, Media & Entertainment | 24 (100.0%) | 0 (0.0%) |
| Health Diagnosing & Treating | 15 (40.5%) | 22 (59.5%) |
| Health Technologists | 11 (37.9%) | 18 (62.1%) |
| Total (Category) | 84 (43.8%) | 108 (56.2%) |
| Total (Overall) | 508 (62.1%) | 310 (37.9%) |
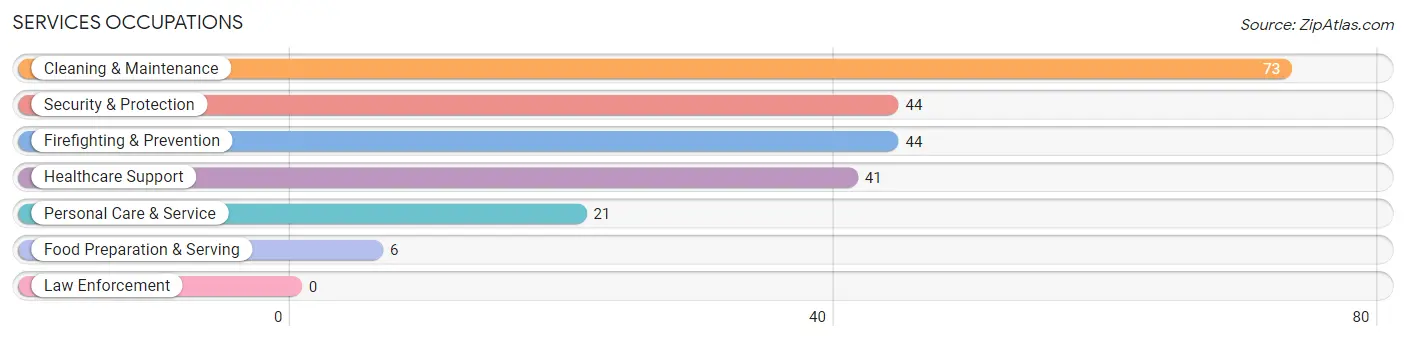
Services Occupations
The most common Services occupations in Connelly Springs are Cleaning & Maintenance (73 | 8.9%), Security & Protection (44 | 5.4%), Firefighting & Prevention (44 | 5.4%), Healthcare Support (41 | 5.0%), and Personal Care & Service (21 | 2.6%).
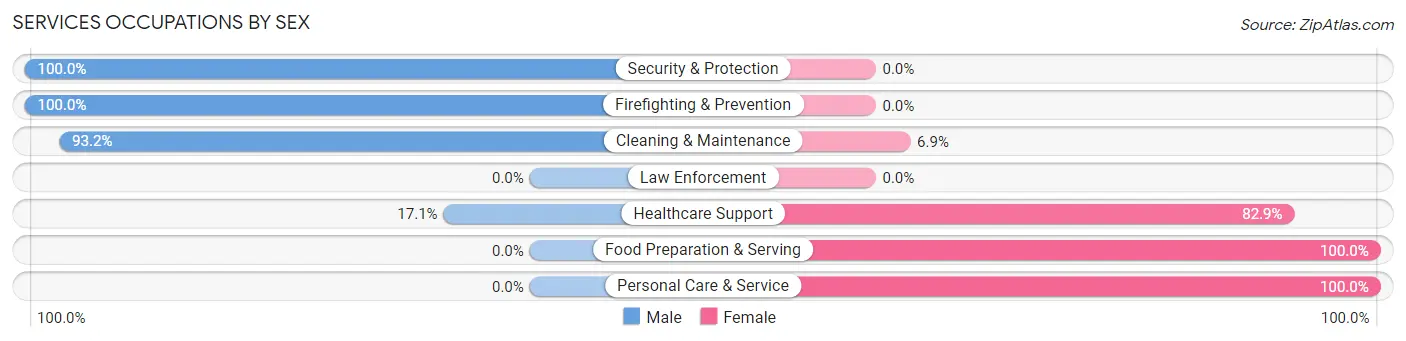
Services Occupations by Sex
Within the Services occupations in Connelly Springs, the most male-oriented occupations are Security & Protection (100.0%), Firefighting & Prevention (100.0%), and Cleaning & Maintenance (93.1%), while the most female-oriented occupations are Food Preparation & Serving (100.0%), Personal Care & Service (100.0%), and Healthcare Support (82.9%).
| Occupation | Male | Female |
| Healthcare Support | 7 (17.1%) | 34 (82.9%) |
| Security & Protection | 44 (100.0%) | 0 (0.0%) |
| Firefighting & Prevention | 44 (100.0%) | 0 (0.0%) |
| Law Enforcement | 0 (0.0%) | 0 (0.0%) |
| Food Preparation & Serving | 0 (0.0%) | 6 (100.0%) |
| Cleaning & Maintenance | 68 (93.1%) | 5 (6.9%) |
| Personal Care & Service | 0 (0.0%) | 21 (100.0%) |
| Total (Category) | 119 (64.3%) | 66 (35.7%) |
| Total (Overall) | 508 (62.1%) | 310 (37.9%) |
Sales and Office Occupations
The most common Sales and Office occupations in Connelly Springs are Office & Administration (136 | 16.6%), and Sales & Related (62 | 7.6%).
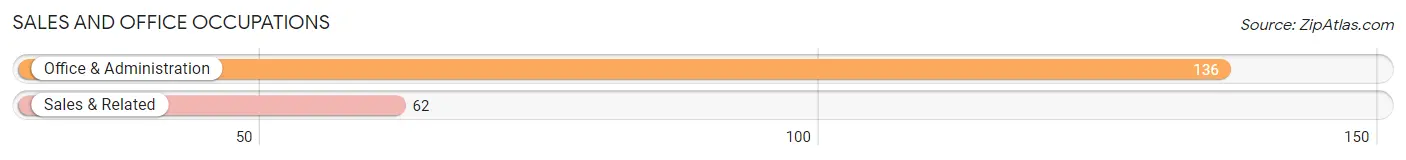
Sales and Office Occupations by Sex
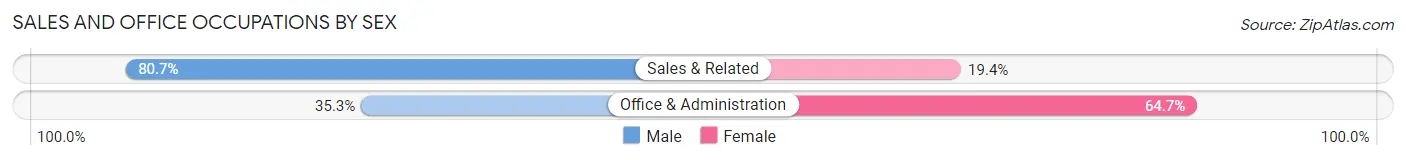
| Occupation | Male | Female |
| Sales & Related | 50 (80.6%) | 12 (19.4%) |
| Office & Administration | 48 (35.3%) | 88 (64.7%) |
| Total (Category) | 98 (49.5%) | 100 (50.5%) |
| Total (Overall) | 508 (62.1%) | 310 (37.9%) |
Natural Resources, Construction and Maintenance Occupations
The most common Natural Resources, Construction and Maintenance occupations in Connelly Springs are Construction & Extraction (38 | 4.6%), and Installation, Maintenance & Repair (17 | 2.1%).
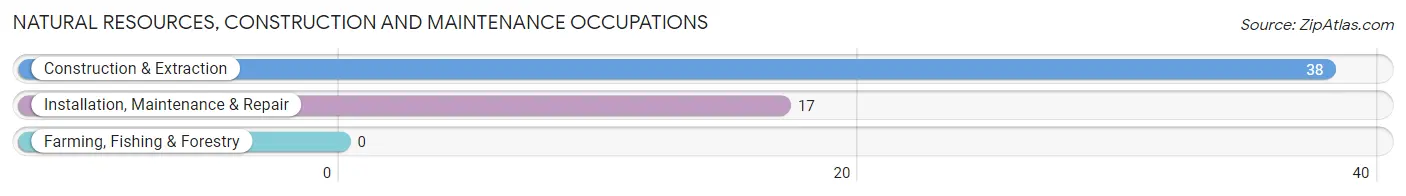
Natural Resources, Construction and Maintenance Occupations by Sex
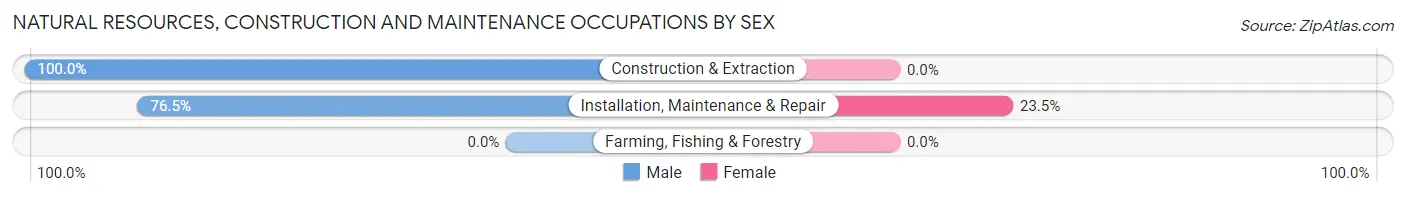
| Occupation | Male | Female |
| Farming, Fishing & Forestry | 0 (0.0%) | 0 (0.0%) |
| Construction & Extraction | 38 (100.0%) | 0 (0.0%) |
| Installation, Maintenance & Repair | 13 (76.5%) | 4 (23.5%) |
| Total (Category) | 51 (92.7%) | 4 (7.3%) |
| Total (Overall) | 508 (62.1%) | 310 (37.9%) |
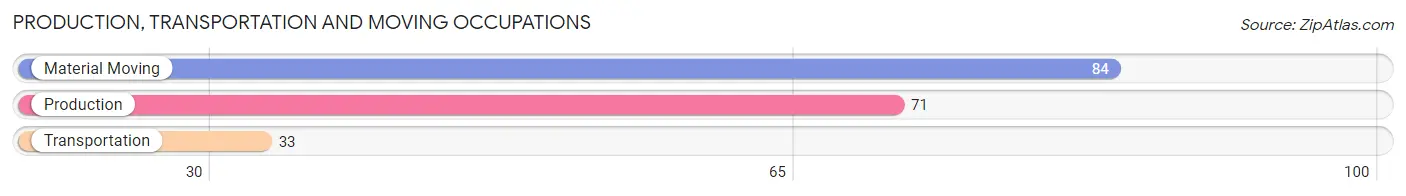
Production, Transportation and Moving Occupations
The most common Production, Transportation and Moving occupations in Connelly Springs are Material Moving (84 | 10.3%), Production (71 | 8.7%), and Transportation (33 | 4.0%).
Production, Transportation and Moving Occupations by Sex
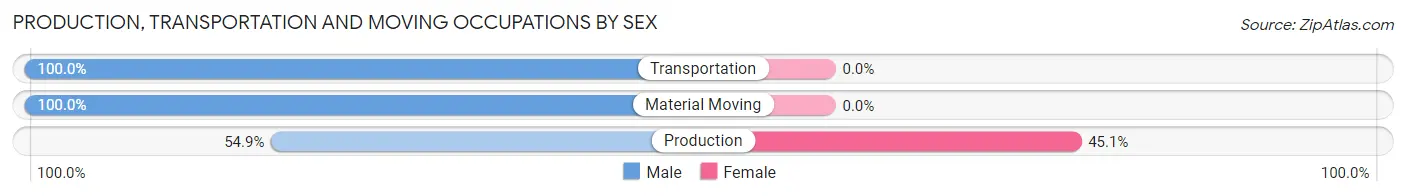
| Occupation | Male | Female |
| Production | 39 (54.9%) | 32 (45.1%) |
| Transportation | 33 (100.0%) | 0 (0.0%) |
| Material Moving | 84 (100.0%) | 0 (0.0%) |
| Total (Category) | 156 (83.0%) | 32 (17.0%) |
| Total (Overall) | 508 (62.1%) | 310 (37.9%) |
Employment Industries by Sex in Connelly Springs
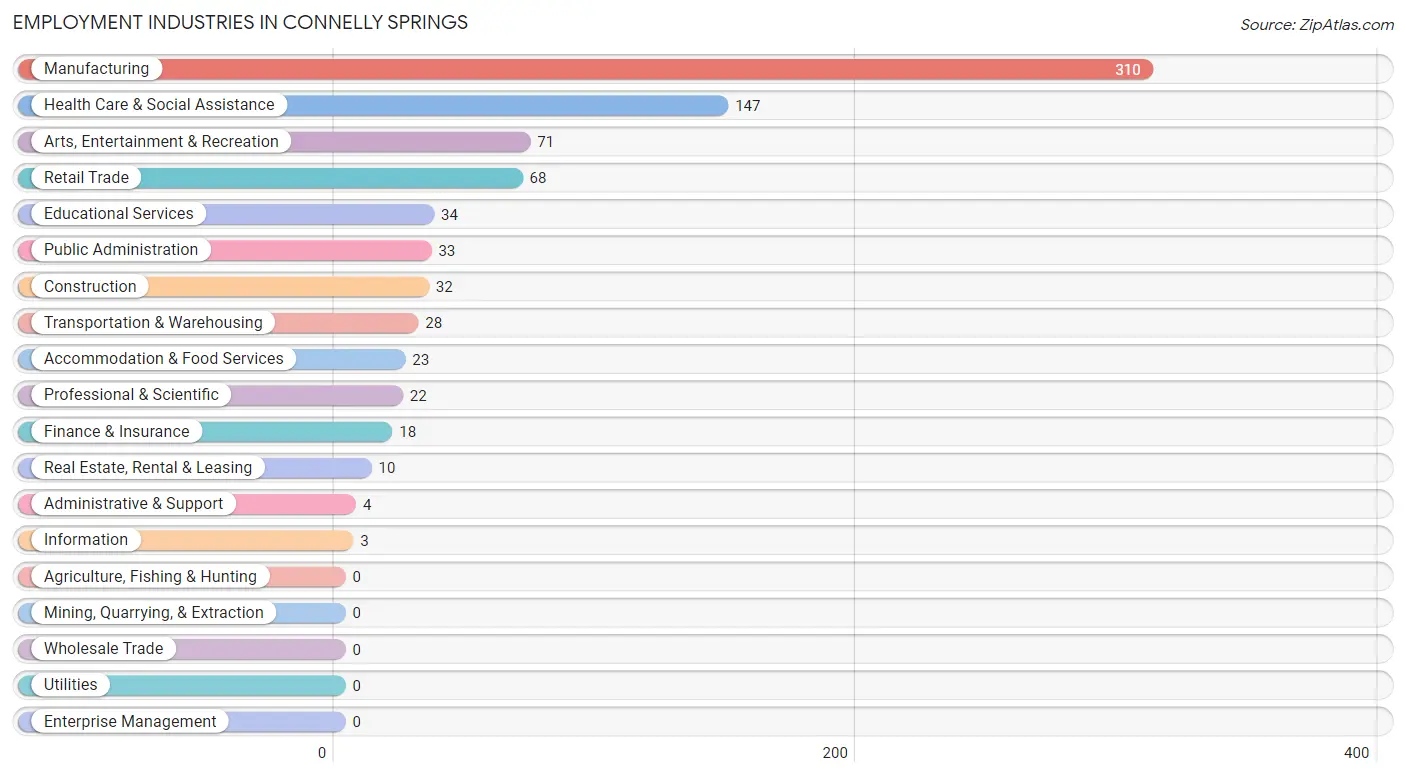
Employment Industries in Connelly Springs
The major employment industries in Connelly Springs include Manufacturing (310 | 37.9%), Health Care & Social Assistance (147 | 18.0%), Arts, Entertainment & Recreation (71 | 8.7%), Retail Trade (68 | 8.3%), and Educational Services (34 | 4.2%).
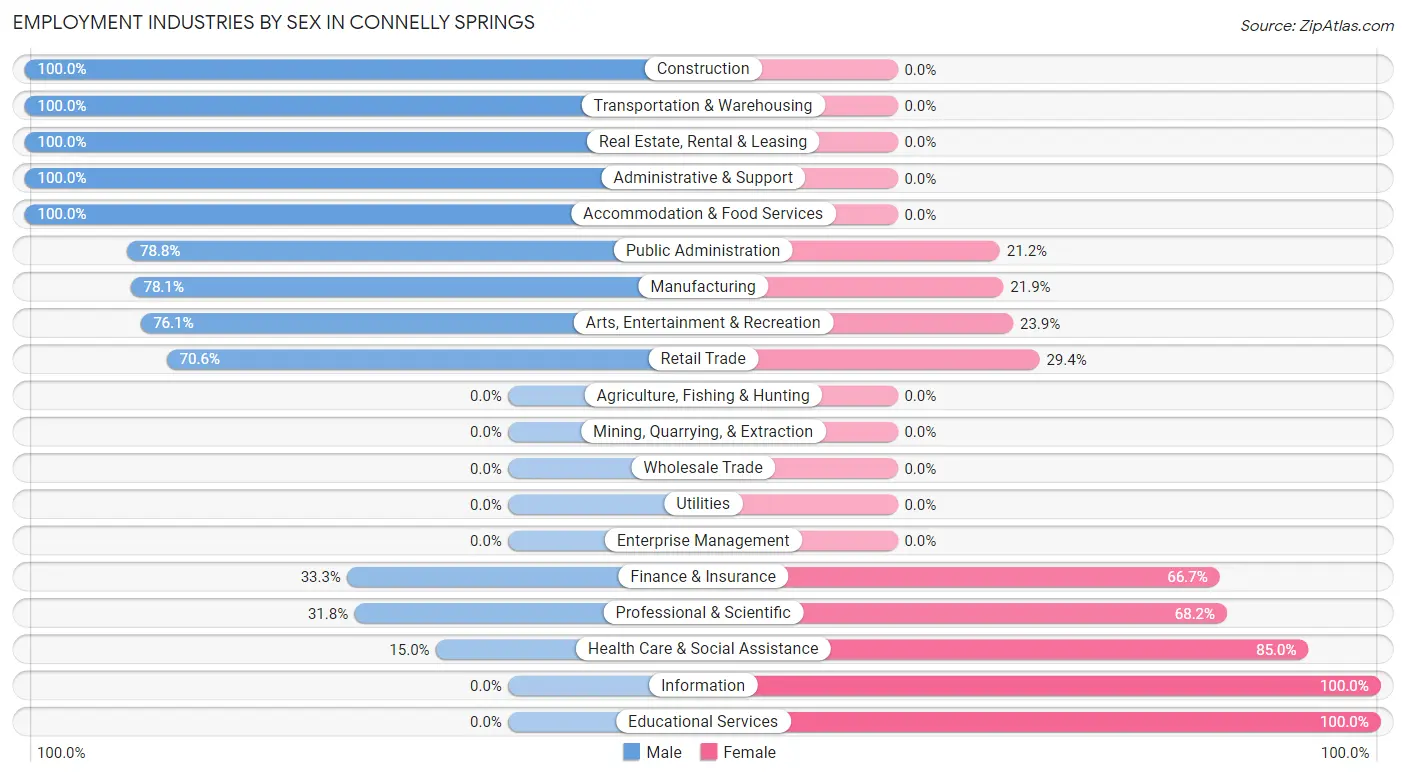
Employment Industries by Sex in Connelly Springs
The Connelly Springs industries that see more men than women are Construction (100.0%), Transportation & Warehousing (100.0%), and Real Estate, Rental & Leasing (100.0%), whereas the industries that tend to have a higher number of women are Information (100.0%), Educational Services (100.0%), and Health Care & Social Assistance (85.0%).
| Industry | Male | Female |
| Agriculture, Fishing & Hunting | 0 (0.0%) | 0 (0.0%) |
| Mining, Quarrying, & Extraction | 0 (0.0%) | 0 (0.0%) |
| Construction | 32 (100.0%) | 0 (0.0%) |
| Manufacturing | 242 (78.1%) | 68 (21.9%) |
| Wholesale Trade | 0 (0.0%) | 0 (0.0%) |
| Retail Trade | 48 (70.6%) | 20 (29.4%) |
| Transportation & Warehousing | 28 (100.0%) | 0 (0.0%) |
| Utilities | 0 (0.0%) | 0 (0.0%) |
| Information | 0 (0.0%) | 3 (100.0%) |
| Finance & Insurance | 6 (33.3%) | 12 (66.7%) |
| Real Estate, Rental & Leasing | 10 (100.0%) | 0 (0.0%) |
| Professional & Scientific | 7 (31.8%) | 15 (68.2%) |
| Enterprise Management | 0 (0.0%) | 0 (0.0%) |
| Administrative & Support | 4 (100.0%) | 0 (0.0%) |
| Educational Services | 0 (0.0%) | 34 (100.0%) |
| Health Care & Social Assistance | 22 (15.0%) | 125 (85.0%) |
| Arts, Entertainment & Recreation | 54 (76.1%) | 17 (23.9%) |
| Accommodation & Food Services | 23 (100.0%) | 0 (0.0%) |
| Public Administration | 26 (78.8%) | 7 (21.2%) |
| Total | 508 (62.1%) | 310 (37.9%) |
Education in Connelly Springs
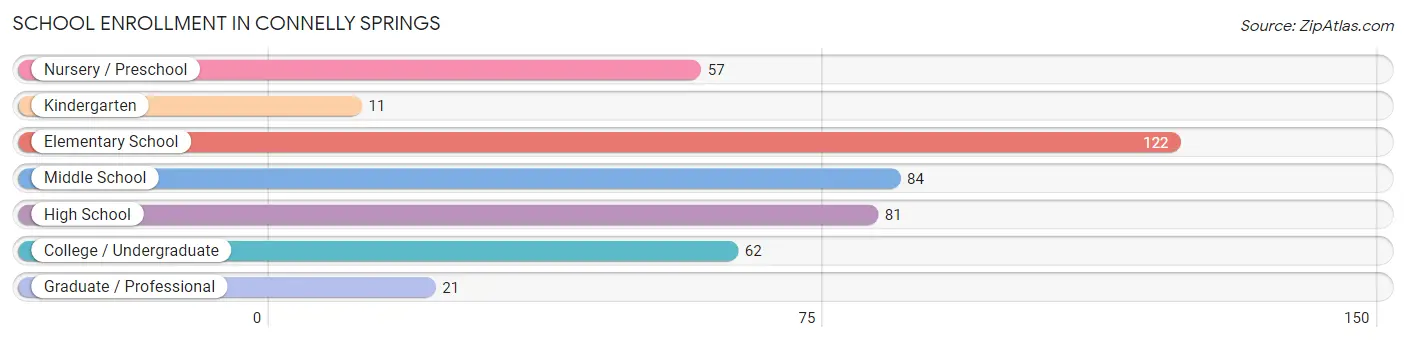
School Enrollment in Connelly Springs
The most common levels of schooling among the 438 students in Connelly Springs are elementary school (122 | 27.9%), middle school (84 | 19.2%), and high school (81 | 18.5%).
| School Level | # Students | % Students |
| Nursery / Preschool | 57 | 13.0% |
| Kindergarten | 11 | 2.5% |
| Elementary School | 122 | 27.9% |
| Middle School | 84 | 19.2% |
| High School | 81 | 18.5% |
| College / Undergraduate | 62 | 14.2% |
| Graduate / Professional | 21 | 4.8% |
| Total | 438 | 100.0% |
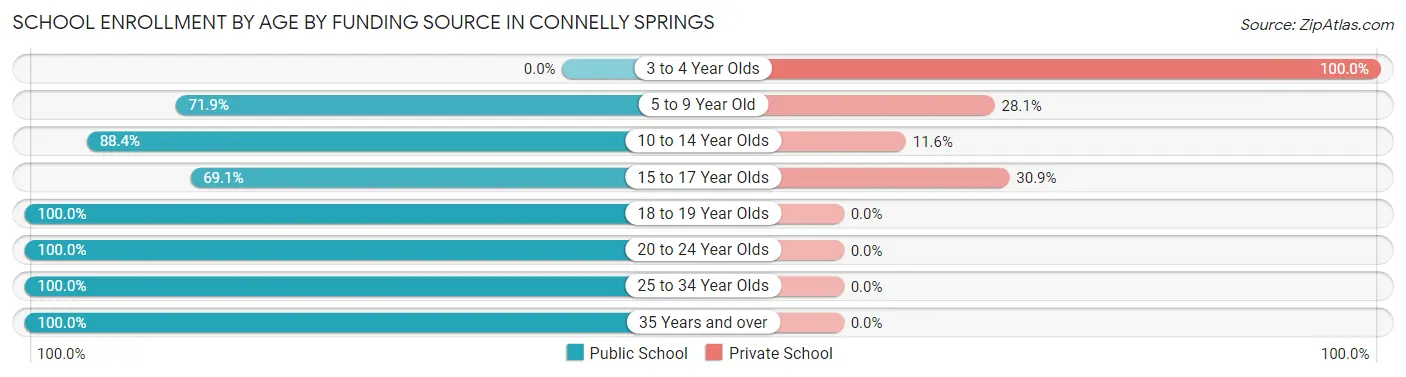
School Enrollment by Age by Funding Source in Connelly Springs
Out of a total of 438 students who are enrolled in schools in Connelly Springs, 123 (28.1%) attend a private institution, while the remaining 315 (71.9%) are enrolled in public schools. The age group of 3 to 4 year olds has the highest likelihood of being enrolled in private schools, with 57 (100.0% in the age bracket) enrolled. Conversely, the age group of 18 to 19 year olds has the lowest likelihood of being enrolled in a private school, with 9 (100.0% in the age bracket) attending a public institution.
| Age Bracket | Public School | Private School |
| 3 to 4 Year Olds | 0 (0.0%) | 57 (100.0%) |
| 5 to 9 Year Old | 69 (71.9%) | 27 (28.1%) |
| 10 to 14 Year Olds | 107 (88.4%) | 14 (11.6%) |
| 15 to 17 Year Olds | 56 (69.1%) | 25 (30.9%) |
| 18 to 19 Year Olds | 9 (100.0%) | 0 (0.0%) |
| 20 to 24 Year Olds | 25 (100.0%) | 0 (0.0%) |
| 25 to 34 Year Olds | 13 (100.0%) | 0 (0.0%) |
| 35 Years and over | 36 (100.0%) | 0 (0.0%) |
| Total | 315 (71.9%) | 123 (28.1%) |
Educational Attainment by Field of Study in Connelly Springs
Business (64 | 22.7%), education (48 | 17.0%), science & technology (31 | 11.0%), computers & mathematics (29 | 10.3%), and arts & humanities (23 | 8.2%) are the most common fields of study among 282 individuals in Connelly Springs who have obtained a bachelor's degree or higher.
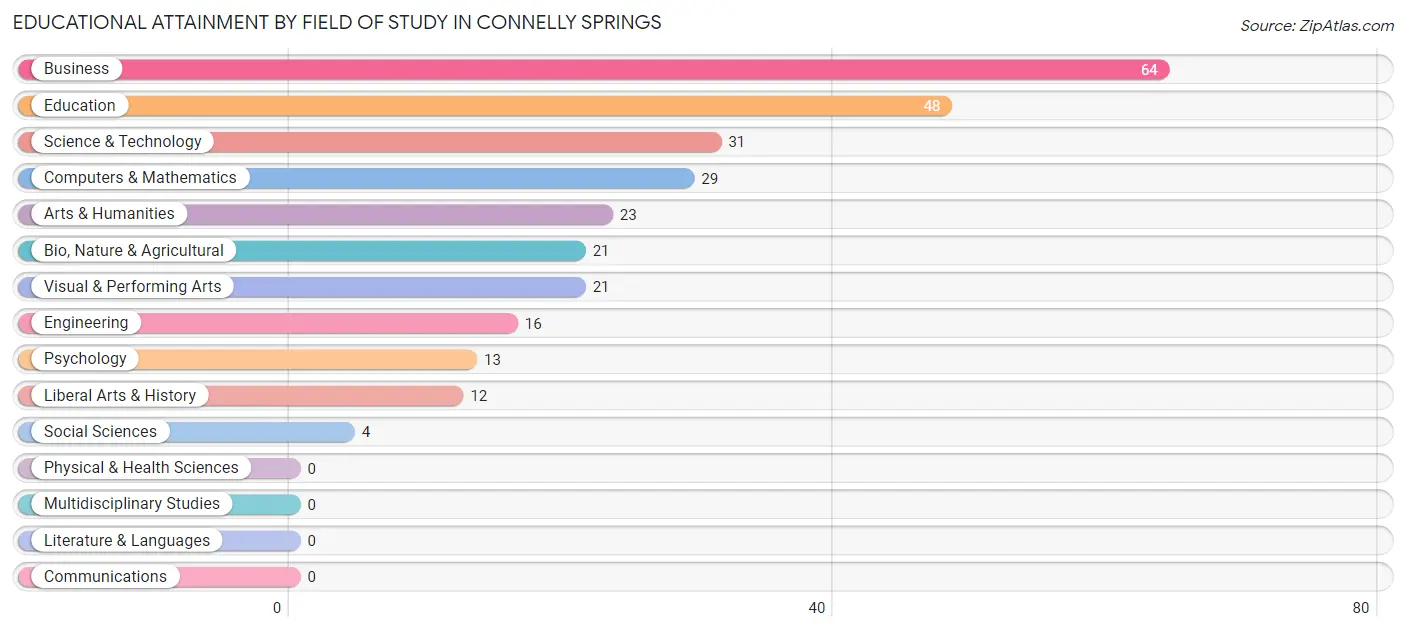
| Field of Study | # Graduates | % Graduates |
| Computers & Mathematics | 29 | 10.3% |
| Bio, Nature & Agricultural | 21 | 7.4% |
| Physical & Health Sciences | 0 | 0.0% |
| Psychology | 13 | 4.6% |
| Social Sciences | 4 | 1.4% |
| Engineering | 16 | 5.7% |
| Multidisciplinary Studies | 0 | 0.0% |
| Science & Technology | 31 | 11.0% |
| Business | 64 | 22.7% |
| Education | 48 | 17.0% |
| Literature & Languages | 0 | 0.0% |
| Liberal Arts & History | 12 | 4.3% |
| Visual & Performing Arts | 21 | 7.4% |
| Communications | 0 | 0.0% |
| Arts & Humanities | 23 | 8.2% |
| Total | 282 | 100.0% |
Transportation & Commute in Connelly Springs
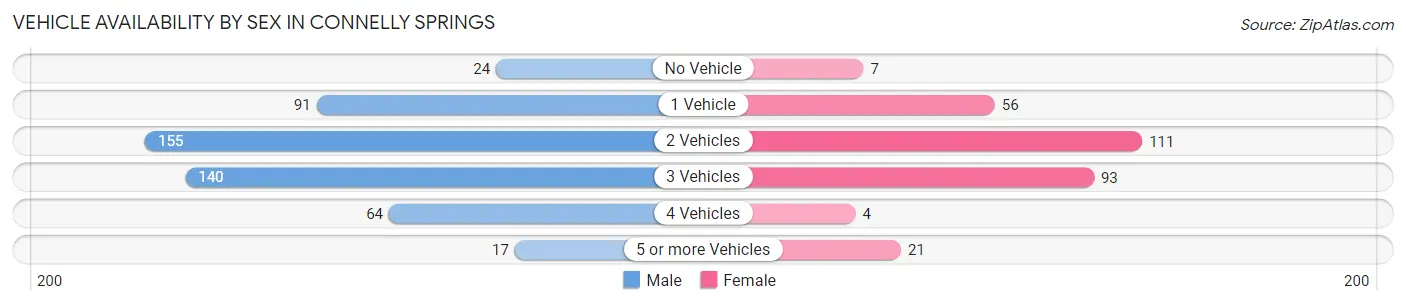
Vehicle Availability by Sex in Connelly Springs
The most prevalent vehicle ownership categories in Connelly Springs are males with 2 vehicles (155, accounting for 31.6%) and females with 2 vehicles (111, making up 53.1%).
| Vehicles Available | Male | Female |
| No Vehicle | 24 (4.9%) | 7 (2.4%) |
| 1 Vehicle | 91 (18.5%) | 56 (19.2%) |
| 2 Vehicles | 155 (31.6%) | 111 (38.0%) |
| 3 Vehicles | 140 (28.5%) | 93 (31.9%) |
| 4 Vehicles | 64 (13.0%) | 4 (1.4%) |
| 5 or more Vehicles | 17 (3.5%) | 21 (7.2%) |
| Total | 491 (100.0%) | 292 (100.0%) |
Commute Time in Connelly Springs
The most frequently occuring commute durations in Connelly Springs are 10 to 14 minutes (178 commuters, 24.3%), 15 to 19 minutes (144 commuters, 19.7%), and 20 to 24 minutes (118 commuters, 16.1%).
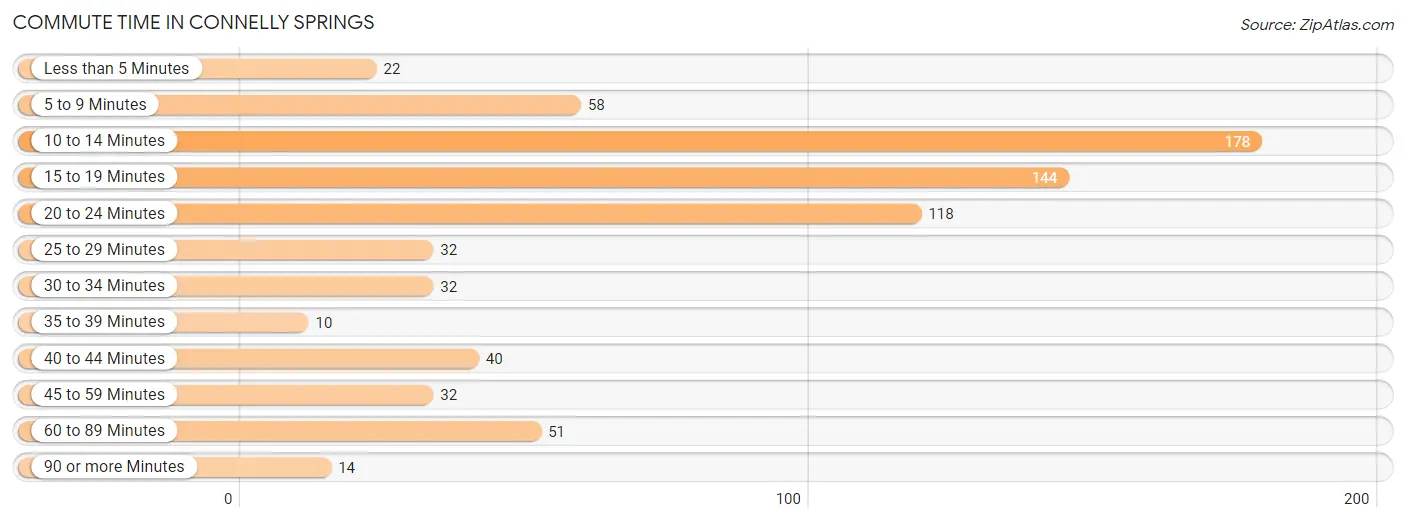
| Commute Time | # Commuters | % Commuters |
| Less than 5 Minutes | 22 | 3.0% |
| 5 to 9 Minutes | 58 | 7.9% |
| 10 to 14 Minutes | 178 | 24.3% |
| 15 to 19 Minutes | 144 | 19.7% |
| 20 to 24 Minutes | 118 | 16.1% |
| 25 to 29 Minutes | 32 | 4.4% |
| 30 to 34 Minutes | 32 | 4.4% |
| 35 to 39 Minutes | 10 | 1.4% |
| 40 to 44 Minutes | 40 | 5.5% |
| 45 to 59 Minutes | 32 | 4.4% |
| 60 to 89 Minutes | 51 | 7.0% |
| 90 or more Minutes | 14 | 1.9% |
Commute Time by Sex in Connelly Springs
The most common commute times in Connelly Springs are 15 to 19 minutes (115 commuters, 23.8%) for males and 20 to 24 minutes (68 commuters, 27.5%) for females.
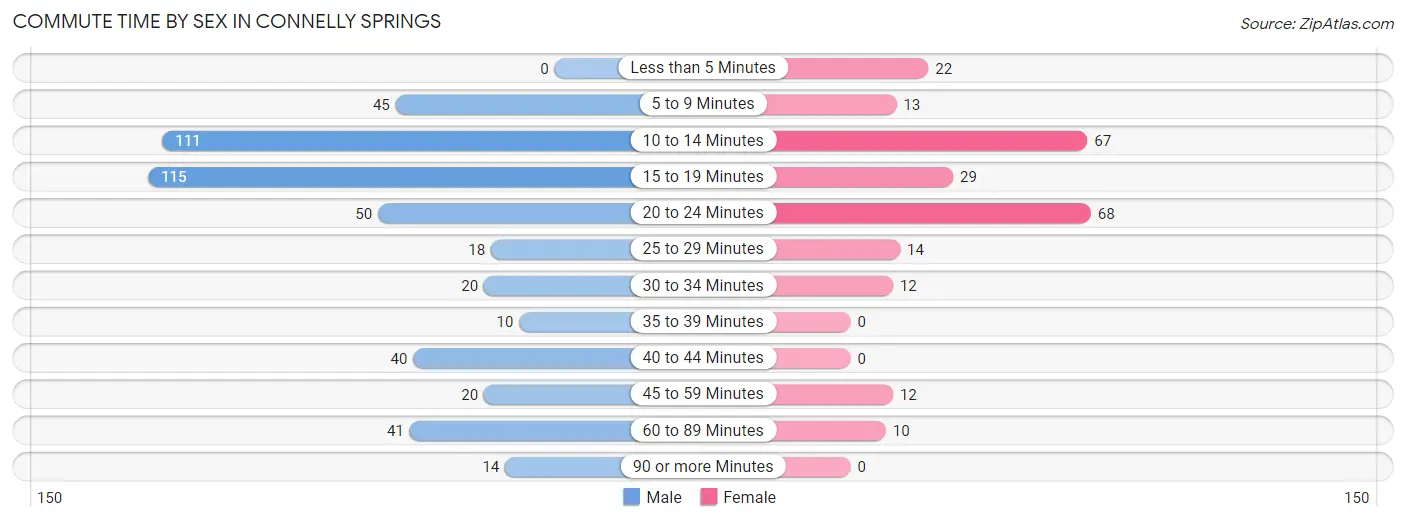
| Commute Time | Male | Female |
| Less than 5 Minutes | 0 (0.0%) | 22 (8.9%) |
| 5 to 9 Minutes | 45 (9.3%) | 13 (5.3%) |
| 10 to 14 Minutes | 111 (22.9%) | 67 (27.1%) |
| 15 to 19 Minutes | 115 (23.8%) | 29 (11.7%) |
| 20 to 24 Minutes | 50 (10.3%) | 68 (27.5%) |
| 25 to 29 Minutes | 18 (3.7%) | 14 (5.7%) |
| 30 to 34 Minutes | 20 (4.1%) | 12 (4.9%) |
| 35 to 39 Minutes | 10 (2.1%) | 0 (0.0%) |
| 40 to 44 Minutes | 40 (8.3%) | 0 (0.0%) |
| 45 to 59 Minutes | 20 (4.1%) | 12 (4.9%) |
| 60 to 89 Minutes | 41 (8.5%) | 10 (4.1%) |
| 90 or more Minutes | 14 (2.9%) | 0 (0.0%) |
Time of Departure to Work by Sex in Connelly Springs
The most frequent times of departure to work in Connelly Springs are 6:30 AM to 6:59 AM (90, 18.6%) for males and 7:30 AM to 7:59 AM (54, 21.9%) for females.
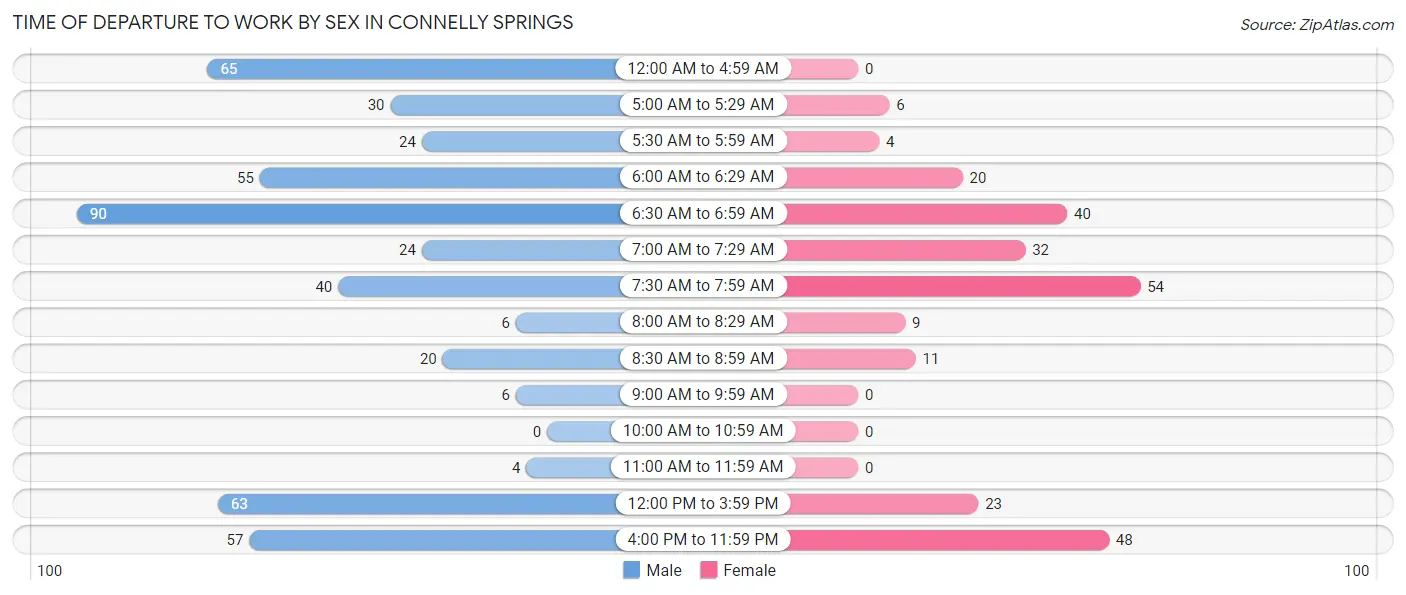
| Time of Departure | Male | Female |
| 12:00 AM to 4:59 AM | 65 (13.4%) | 0 (0.0%) |
| 5:00 AM to 5:29 AM | 30 (6.2%) | 6 (2.4%) |
| 5:30 AM to 5:59 AM | 24 (5.0%) | 4 (1.6%) |
| 6:00 AM to 6:29 AM | 55 (11.4%) | 20 (8.1%) |
| 6:30 AM to 6:59 AM | 90 (18.6%) | 40 (16.2%) |
| 7:00 AM to 7:29 AM | 24 (5.0%) | 32 (13.0%) |
| 7:30 AM to 7:59 AM | 40 (8.3%) | 54 (21.9%) |
| 8:00 AM to 8:29 AM | 6 (1.2%) | 9 (3.6%) |
| 8:30 AM to 8:59 AM | 20 (4.1%) | 11 (4.4%) |
| 9:00 AM to 9:59 AM | 6 (1.2%) | 0 (0.0%) |
| 10:00 AM to 10:59 AM | 0 (0.0%) | 0 (0.0%) |
| 11:00 AM to 11:59 AM | 4 (0.8%) | 0 (0.0%) |
| 12:00 PM to 3:59 PM | 63 (13.0%) | 23 (9.3%) |
| 4:00 PM to 11:59 PM | 57 (11.8%) | 48 (19.4%) |
| Total | 484 (100.0%) | 247 (100.0%) |
Housing Occupancy in Connelly Springs
Occupancy by Ownership in Connelly Springs
Of the total 916 dwellings in Connelly Springs, owner-occupied units account for 587 (64.1%), while renter-occupied units make up 329 (35.9%).
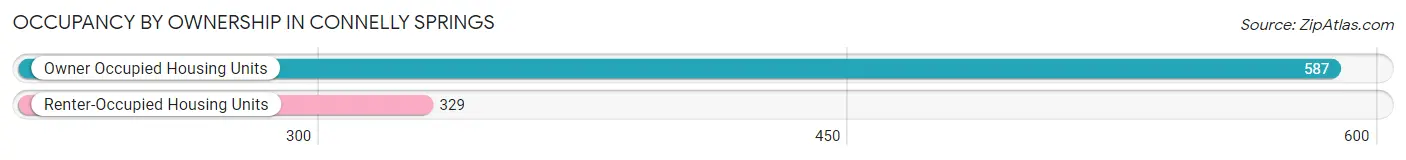
| Occupancy | # Housing Units | % Housing Units |
| Owner Occupied Housing Units | 587 | 64.1% |
| Renter-Occupied Housing Units | 329 | 35.9% |
| Total Occupied Housing Units | 916 | 100.0% |
Occupancy by Household Size in Connelly Springs
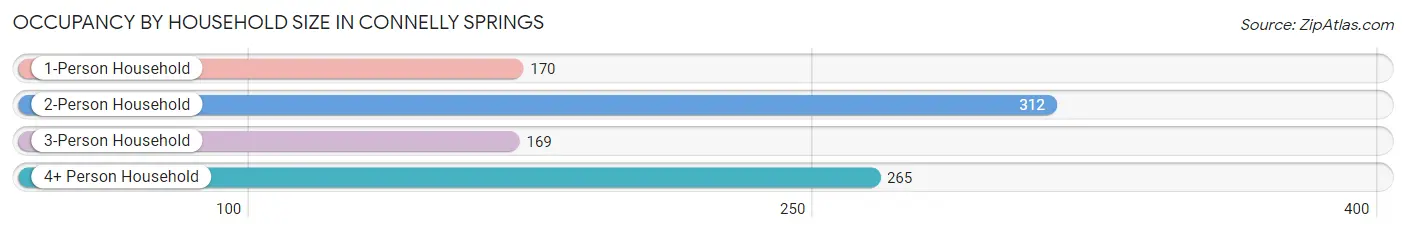
| Household Size | # Housing Units | % Housing Units |
| 1-Person Household | 170 | 18.6% |
| 2-Person Household | 312 | 34.1% |
| 3-Person Household | 169 | 18.4% |
| 4+ Person Household | 265 | 28.9% |
| Total Housing Units | 916 | 100.0% |
Occupancy by Ownership by Household Size in Connelly Springs
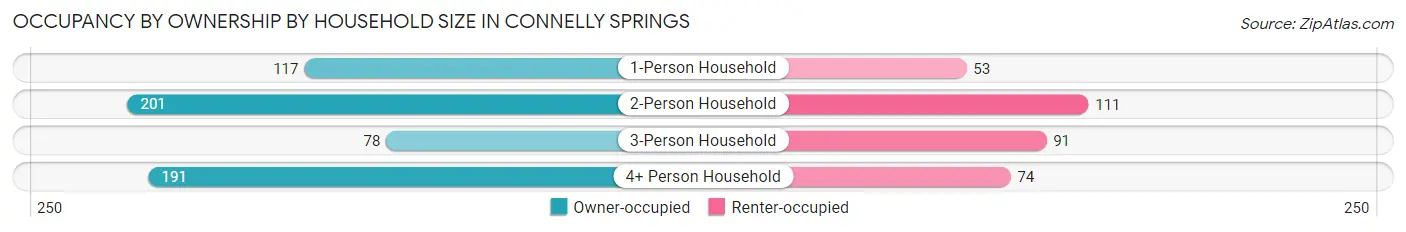
| Household Size | Owner-occupied | Renter-occupied |
| 1-Person Household | 117 (68.8%) | 53 (31.2%) |
| 2-Person Household | 201 (64.4%) | 111 (35.6%) |
| 3-Person Household | 78 (46.2%) | 91 (53.8%) |
| 4+ Person Household | 191 (72.1%) | 74 (27.9%) |
| Total Housing Units | 587 (64.1%) | 329 (35.9%) |
Occupancy by Educational Attainment in Connelly Springs
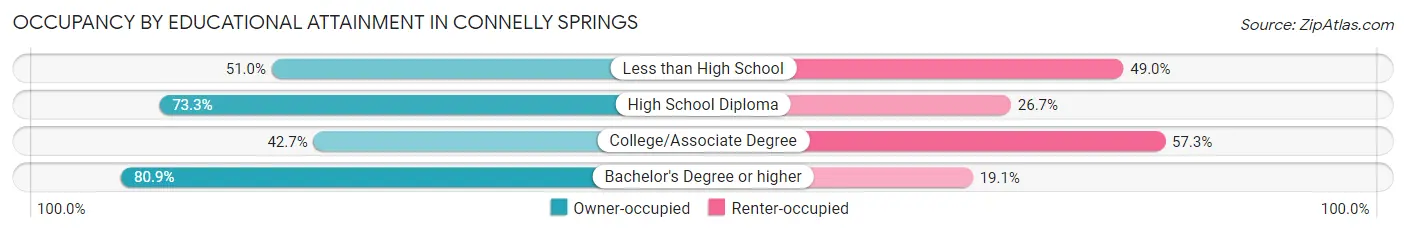
| Household Size | Owner-occupied | Renter-occupied |
| Less than High School | 77 (51.0%) | 74 (49.0%) |
| High School Diploma | 291 (73.3%) | 106 (26.7%) |
| College/Associate Degree | 88 (42.7%) | 118 (57.3%) |
| Bachelor's Degree or higher | 131 (80.9%) | 31 (19.1%) |
Occupancy by Age of Householder in Connelly Springs
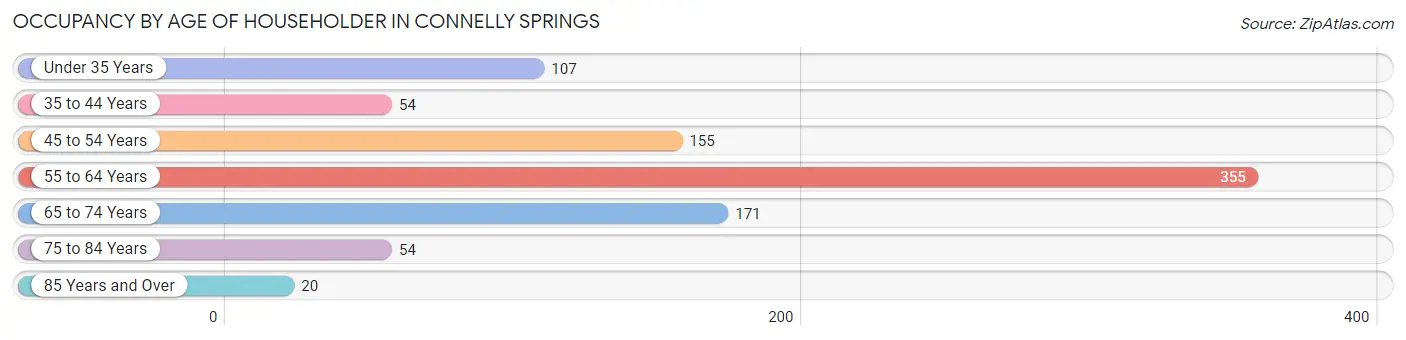
| Age Bracket | # Households | % Households |
| Under 35 Years | 107 | 11.7% |
| 35 to 44 Years | 54 | 5.9% |
| 45 to 54 Years | 155 | 16.9% |
| 55 to 64 Years | 355 | 38.8% |
| 65 to 74 Years | 171 | 18.7% |
| 75 to 84 Years | 54 | 5.9% |
| 85 Years and Over | 20 | 2.2% |
| Total | 916 | 100.0% |
Housing Finances in Connelly Springs
Median Income by Occupancy in Connelly Springs
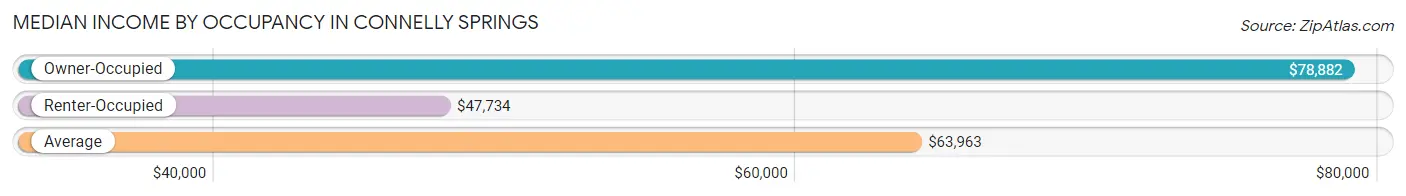
| Occupancy Type | # Households | Median Income |
| Owner-Occupied | 587 (64.1%) | $78,882 |
| Renter-Occupied | 329 (35.9%) | $47,734 |
| Average | 916 (100.0%) | $63,963 |
Occupancy by Householder Income Bracket in Connelly Springs
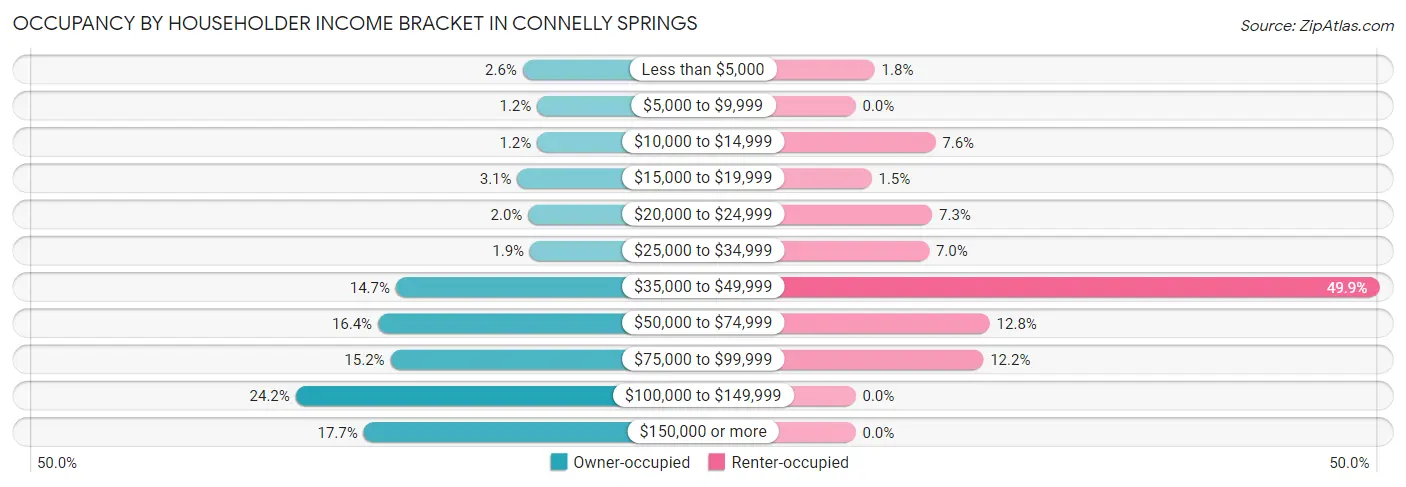
| Income Bracket | Owner-occupied | Renter-occupied |
| Less than $5,000 | 15 (2.6%) | 6 (1.8%) |
| $5,000 to $9,999 | 7 (1.2%) | 0 (0.0%) |
| $10,000 to $14,999 | 7 (1.2%) | 25 (7.6%) |
| $15,000 to $19,999 | 18 (3.1%) | 5 (1.5%) |
| $20,000 to $24,999 | 12 (2.0%) | 24 (7.3%) |
| $25,000 to $34,999 | 11 (1.9%) | 23 (7.0%) |
| $35,000 to $49,999 | 86 (14.6%) | 164 (49.8%) |
| $50,000 to $74,999 | 96 (16.4%) | 42 (12.8%) |
| $75,000 to $99,999 | 89 (15.2%) | 40 (12.2%) |
| $100,000 to $149,999 | 142 (24.2%) | 0 (0.0%) |
| $150,000 or more | 104 (17.7%) | 0 (0.0%) |
| Total | 587 (100.0%) | 329 (100.0%) |
Monthly Housing Cost Tiers in Connelly Springs
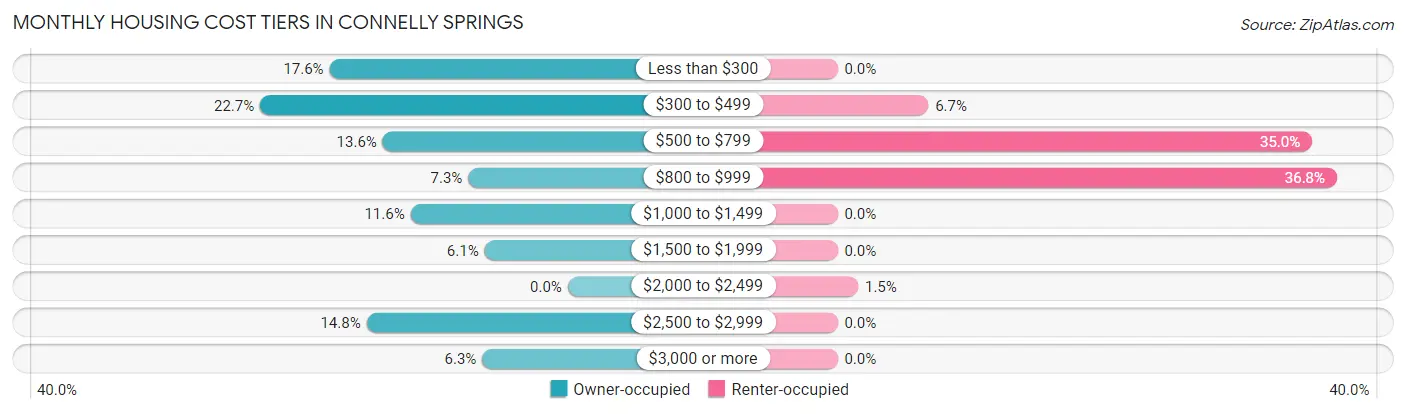
| Monthly Cost | Owner-occupied | Renter-occupied |
| Less than $300 | 103 (17.5%) | 0 (0.0%) |
| $300 to $499 | 133 (22.7%) | 22 (6.7%) |
| $500 to $799 | 80 (13.6%) | 115 (34.9%) |
| $800 to $999 | 43 (7.3%) | 121 (36.8%) |
| $1,000 to $1,499 | 68 (11.6%) | 0 (0.0%) |
| $1,500 to $1,999 | 36 (6.1%) | 0 (0.0%) |
| $2,000 to $2,499 | 0 (0.0%) | 5 (1.5%) |
| $2,500 to $2,999 | 87 (14.8%) | 0 (0.0%) |
| $3,000 or more | 37 (6.3%) | 0 (0.0%) |
| Total | 587 (100.0%) | 329 (100.0%) |
Physical Housing Characteristics in Connelly Springs
Housing Structures in Connelly Springs
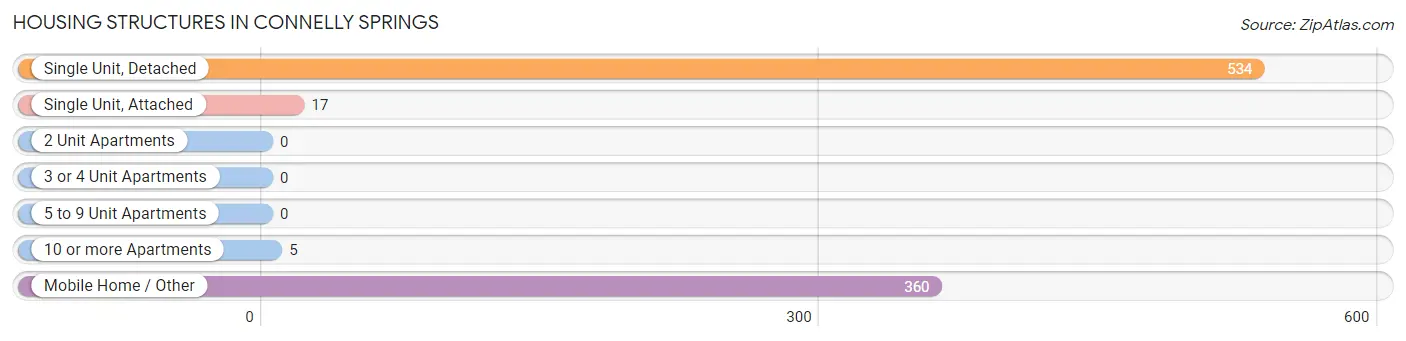
| Structure Type | # Housing Units | % Housing Units |
| Single Unit, Detached | 534 | 58.3% |
| Single Unit, Attached | 17 | 1.9% |
| 2 Unit Apartments | 0 | 0.0% |
| 3 or 4 Unit Apartments | 0 | 0.0% |
| 5 to 9 Unit Apartments | 0 | 0.0% |
| 10 or more Apartments | 5 | 0.5% |
| Mobile Home / Other | 360 | 39.3% |
| Total | 916 | 100.0% |
Housing Structures by Occupancy in Connelly Springs
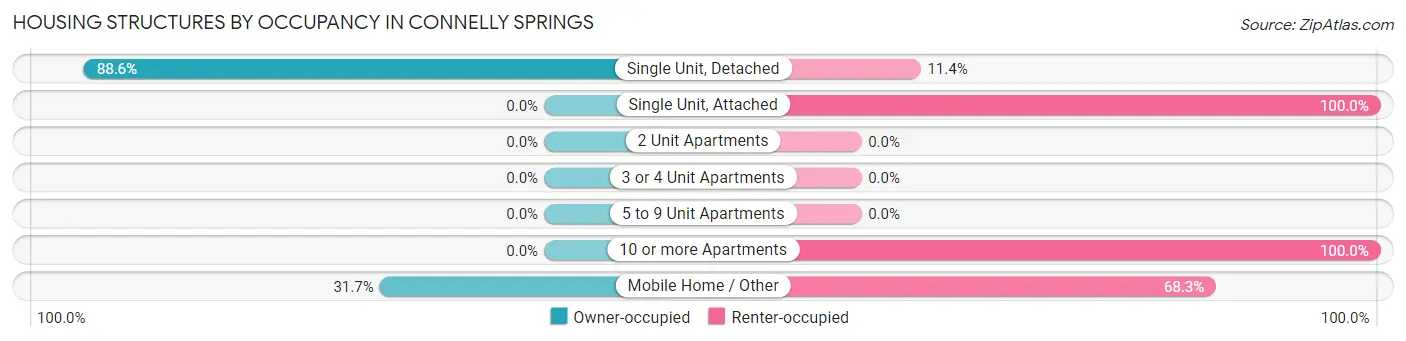
| Structure Type | Owner-occupied | Renter-occupied |
| Single Unit, Detached | 473 (88.6%) | 61 (11.4%) |
| Single Unit, Attached | 0 (0.0%) | 17 (100.0%) |
| 2 Unit Apartments | 0 (0.0%) | 0 (0.0%) |
| 3 or 4 Unit Apartments | 0 (0.0%) | 0 (0.0%) |
| 5 to 9 Unit Apartments | 0 (0.0%) | 0 (0.0%) |
| 10 or more Apartments | 0 (0.0%) | 5 (100.0%) |
| Mobile Home / Other | 114 (31.7%) | 246 (68.3%) |
| Total | 587 (64.1%) | 329 (35.9%) |
Housing Structures by Number of Rooms in Connelly Springs
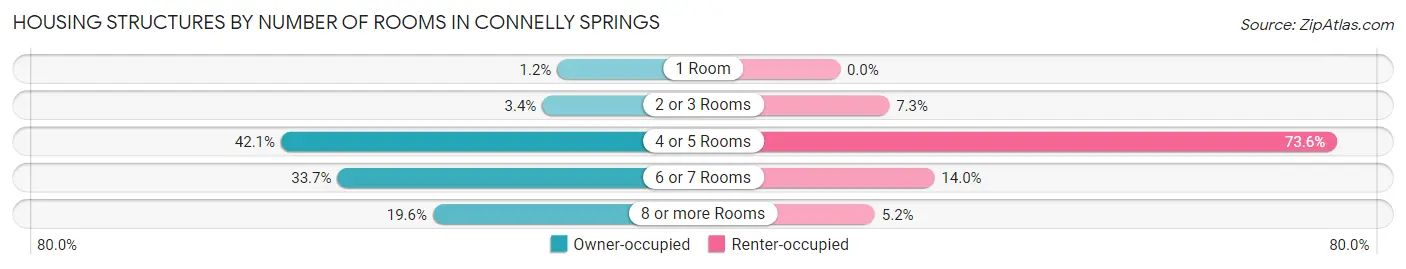
| Number of Rooms | Owner-occupied | Renter-occupied |
| 1 Room | 7 (1.2%) | 0 (0.0%) |
| 2 or 3 Rooms | 20 (3.4%) | 24 (7.3%) |
| 4 or 5 Rooms | 247 (42.1%) | 242 (73.6%) |
| 6 or 7 Rooms | 198 (33.7%) | 46 (14.0%) |
| 8 or more Rooms | 115 (19.6%) | 17 (5.2%) |
| Total | 587 (100.0%) | 329 (100.0%) |
Housing Structure by Heating Type in Connelly Springs
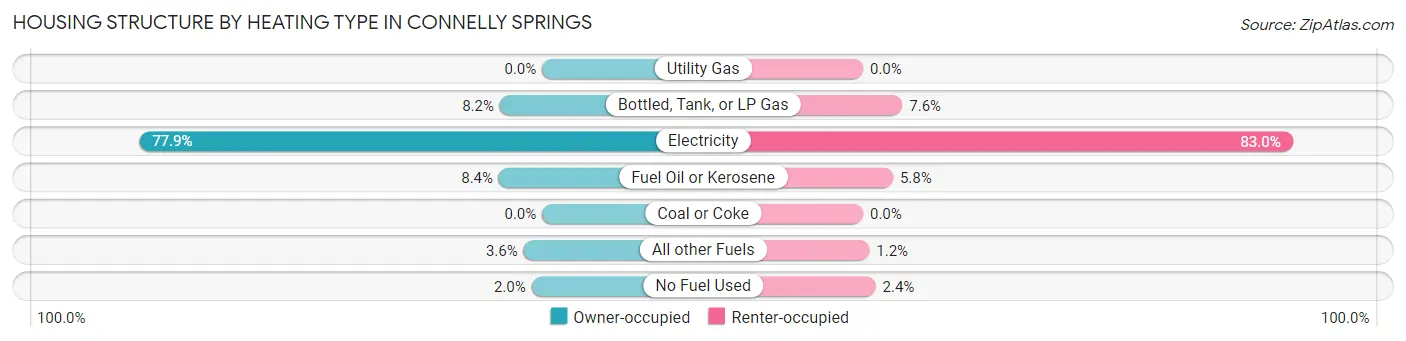
| Heating Type | Owner-occupied | Renter-occupied |
| Utility Gas | 0 (0.0%) | 0 (0.0%) |
| Bottled, Tank, or LP Gas | 48 (8.2%) | 25 (7.6%) |
| Electricity | 457 (77.8%) | 273 (83.0%) |
| Fuel Oil or Kerosene | 49 (8.4%) | 19 (5.8%) |
| Coal or Coke | 0 (0.0%) | 0 (0.0%) |
| All other Fuels | 21 (3.6%) | 4 (1.2%) |
| No Fuel Used | 12 (2.0%) | 8 (2.4%) |
| Total | 587 (100.0%) | 329 (100.0%) |
Household Vehicle Usage in Connelly Springs
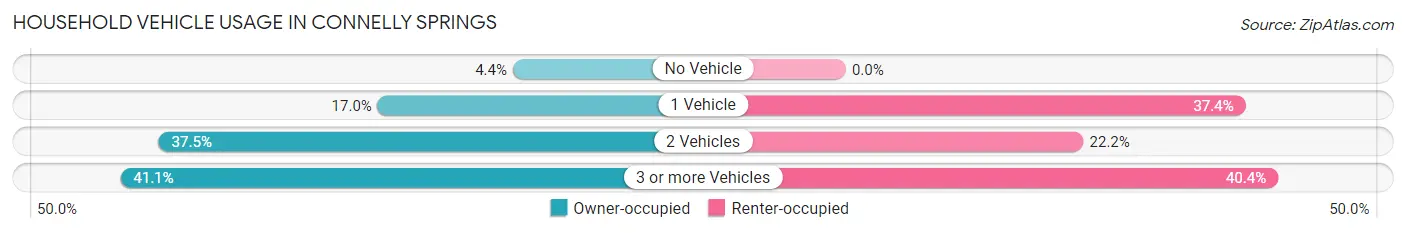
| Vehicles per Household | Owner-occupied | Renter-occupied |
| No Vehicle | 26 (4.4%) | 0 (0.0%) |
| 1 Vehicle | 100 (17.0%) | 123 (37.4%) |
| 2 Vehicles | 220 (37.5%) | 73 (22.2%) |
| 3 or more Vehicles | 241 (41.1%) | 133 (40.4%) |
| Total | 587 (100.0%) | 329 (100.0%) |
Real Estate & Mortgages in Connelly Springs
Real Estate and Mortgage Overview in Connelly Springs
| Characteristic | Without Mortgage | With Mortgage |
| Housing Units | 253 | 334 |
| Median Property Value | $107,500 | $0 |
| Median Household Income | $68,594 | $86 |
| Monthly Housing Costs | $345 | $37 |
| Real Estate Taxes | $667 | $7 |
Property Value by Mortgage Status in Connelly Springs
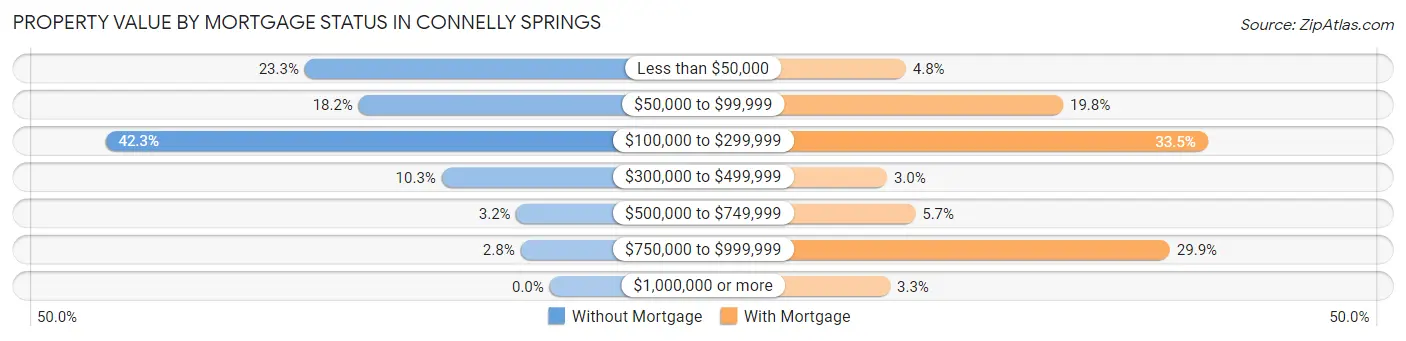
| Property Value | Without Mortgage | With Mortgage |
| Less than $50,000 | 59 (23.3%) | 16 (4.8%) |
| $50,000 to $99,999 | 46 (18.2%) | 66 (19.8%) |
| $100,000 to $299,999 | 107 (42.3%) | 112 (33.5%) |
| $300,000 to $499,999 | 26 (10.3%) | 10 (3.0%) |
| $500,000 to $749,999 | 8 (3.2%) | 19 (5.7%) |
| $750,000 to $999,999 | 7 (2.8%) | 100 (29.9%) |
| $1,000,000 or more | 0 (0.0%) | 11 (3.3%) |
| Total | 253 (100.0%) | 334 (100.0%) |
Household Income by Mortgage Status in Connelly Springs
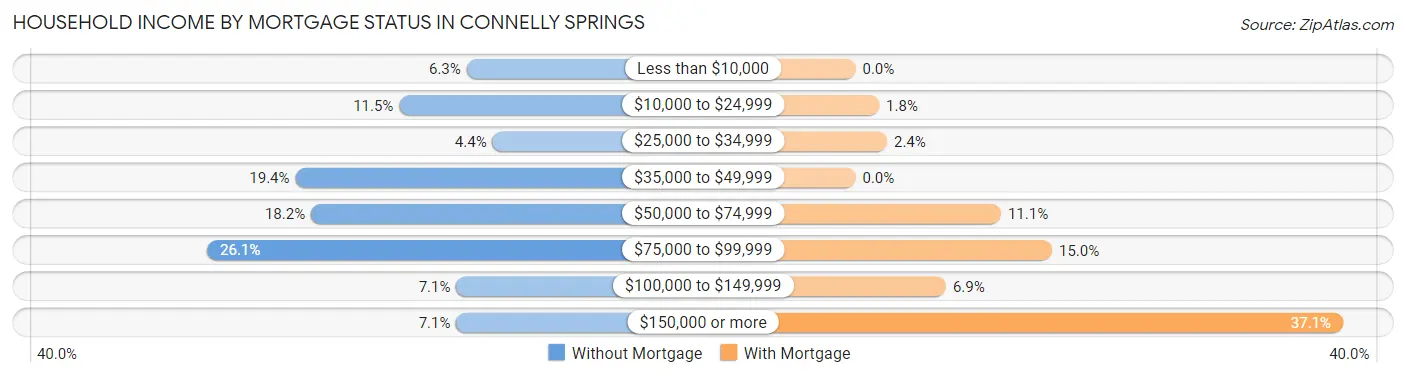
| Household Income | Without Mortgage | With Mortgage |
| Less than $10,000 | 16 (6.3%) | 0 (0.0%) |
| $10,000 to $24,999 | 29 (11.5%) | 6 (1.8%) |
| $25,000 to $34,999 | 11 (4.3%) | 8 (2.4%) |
| $35,000 to $49,999 | 49 (19.4%) | 0 (0.0%) |
| $50,000 to $74,999 | 46 (18.2%) | 37 (11.1%) |
| $75,000 to $99,999 | 66 (26.1%) | 50 (15.0%) |
| $100,000 to $149,999 | 18 (7.1%) | 23 (6.9%) |
| $150,000 or more | 18 (7.1%) | 124 (37.1%) |
| Total | 253 (100.0%) | 334 (100.0%) |
Property Value to Household Income Ratio in Connelly Springs
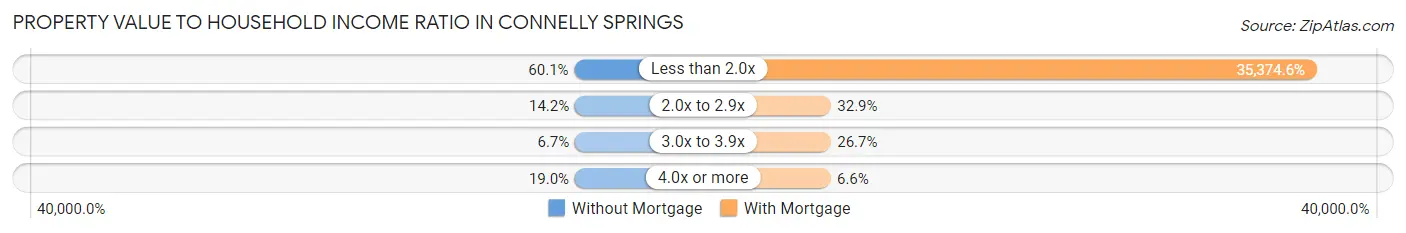
| Value-to-Income Ratio | Without Mortgage | With Mortgage |
| Less than 2.0x | 152 (60.1%) | 118,151 (35,374.5%) |
| 2.0x to 2.9x | 36 (14.2%) | 110 (32.9%) |
| 3.0x to 3.9x | 17 (6.7%) | 89 (26.7%) |
| 4.0x or more | 48 (19.0%) | 22 (6.6%) |
| Total | 253 (100.0%) | 334 (100.0%) |
Real Estate Taxes by Mortgage Status in Connelly Springs
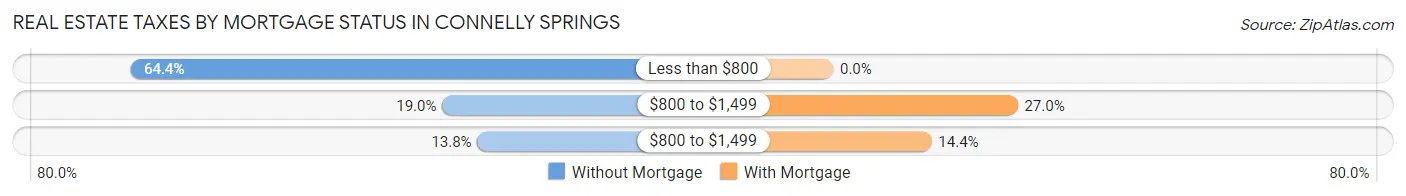
| Property Taxes | Without Mortgage | With Mortgage |
| Less than $800 | 163 (64.4%) | 0 (0.0%) |
| $800 to $1,499 | 48 (19.0%) | 90 (27.0%) |
| $800 to $1,499 | 35 (13.8%) | 48 (14.4%) |
| Total | 253 (100.0%) | 334 (100.0%) |
Health & Disability in Connelly Springs
Health Insurance Coverage by Age in Connelly Springs
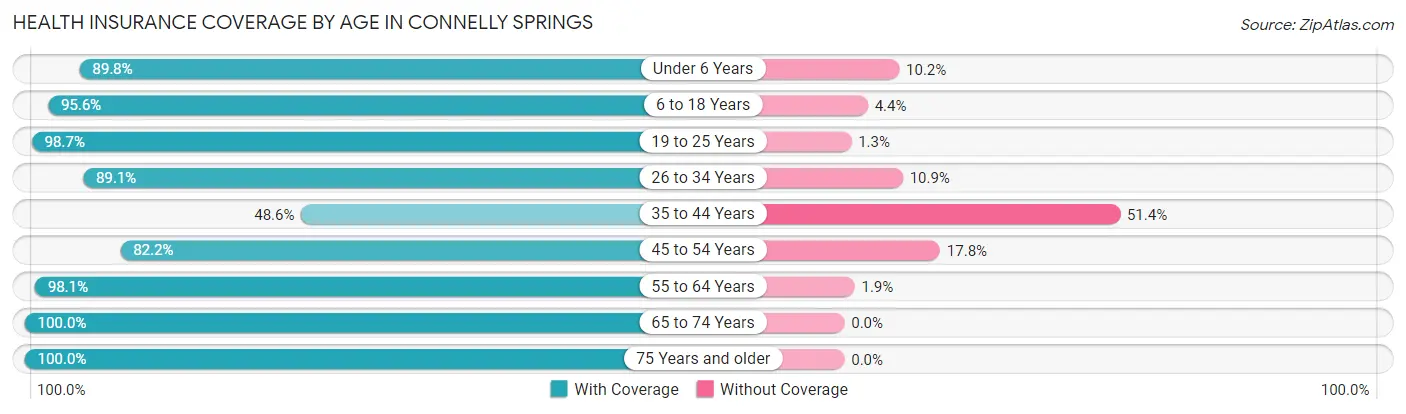
| Age Bracket | With Coverage | Without Coverage |
| Under 6 Years | 123 (89.8%) | 14 (10.2%) |
| 6 to 18 Years | 285 (95.6%) | 13 (4.4%) |
| 19 to 25 Years | 305 (98.7%) | 4 (1.3%) |
| 26 to 34 Years | 270 (89.1%) | 33 (10.9%) |
| 35 to 44 Years | 69 (48.6%) | 73 (51.4%) |
| 45 to 54 Years | 235 (82.2%) | 51 (17.8%) |
| 55 to 64 Years | 513 (98.1%) | 10 (1.9%) |
| 65 to 74 Years | 257 (100.0%) | 0 (0.0%) |
| 75 Years and older | 100 (100.0%) | 0 (0.0%) |
| Total | 2,157 (91.6%) | 198 (8.4%) |
Health Insurance Coverage by Citizenship Status in Connelly Springs
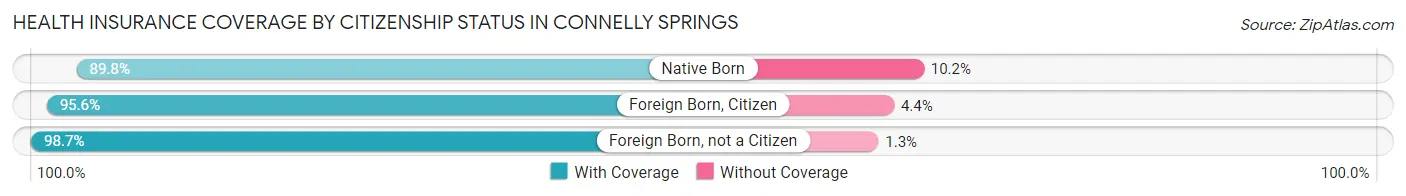
| Citizenship Status | With Coverage | Without Coverage |
| Native Born | 123 (89.8%) | 14 (10.2%) |
| Foreign Born, Citizen | 285 (95.6%) | 13 (4.4%) |
| Foreign Born, not a Citizen | 305 (98.7%) | 4 (1.3%) |
Health Insurance Coverage by Household Income in Connelly Springs
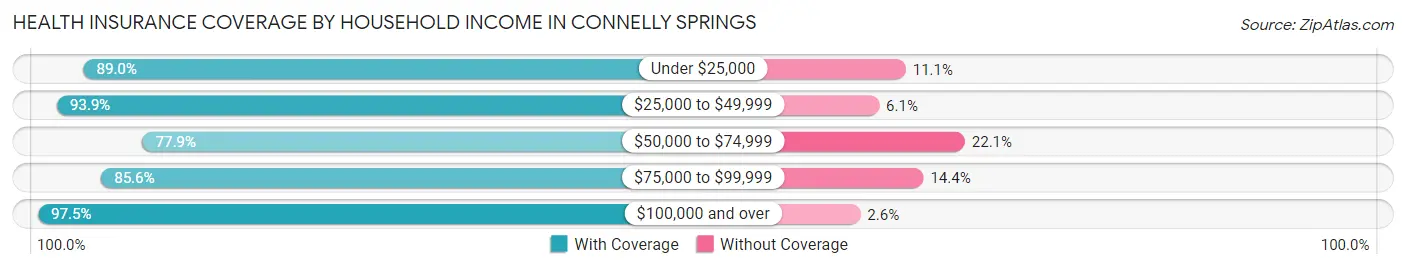
| Household Income | With Coverage | Without Coverage |
| Under $25,000 | 161 (88.9%) | 20 (11.1%) |
| $25,000 to $49,999 | 543 (93.9%) | 35 (6.1%) |
| $50,000 to $74,999 | 250 (77.9%) | 71 (22.1%) |
| $75,000 to $99,999 | 286 (85.6%) | 48 (14.4%) |
| $100,000 and over | 917 (97.5%) | 24 (2.5%) |
Public vs Private Health Insurance Coverage by Age in Connelly Springs
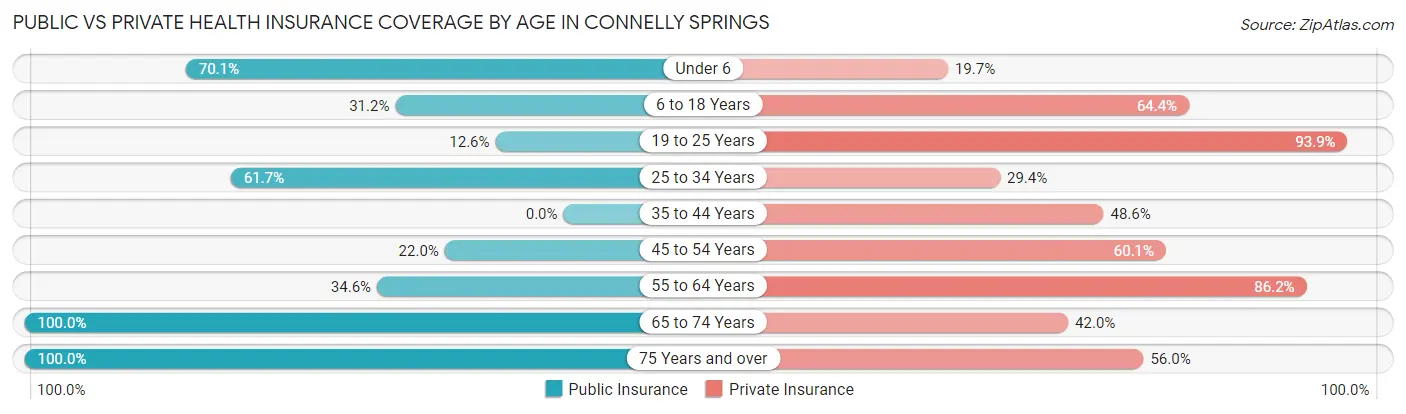
| Age Bracket | Public Insurance | Private Insurance |
| Under 6 | 96 (70.1%) | 27 (19.7%) |
| 6 to 18 Years | 93 (31.2%) | 192 (64.4%) |
| 19 to 25 Years | 39 (12.6%) | 290 (93.9%) |
| 25 to 34 Years | 187 (61.7%) | 89 (29.4%) |
| 35 to 44 Years | 0 (0.0%) | 69 (48.6%) |
| 45 to 54 Years | 63 (22.0%) | 172 (60.1%) |
| 55 to 64 Years | 181 (34.6%) | 451 (86.2%) |
| 65 to 74 Years | 257 (100.0%) | 108 (42.0%) |
| 75 Years and over | 100 (100.0%) | 56 (56.0%) |
| Total | 1,016 (43.1%) | 1,454 (61.7%) |
Disability Status by Sex by Age in Connelly Springs
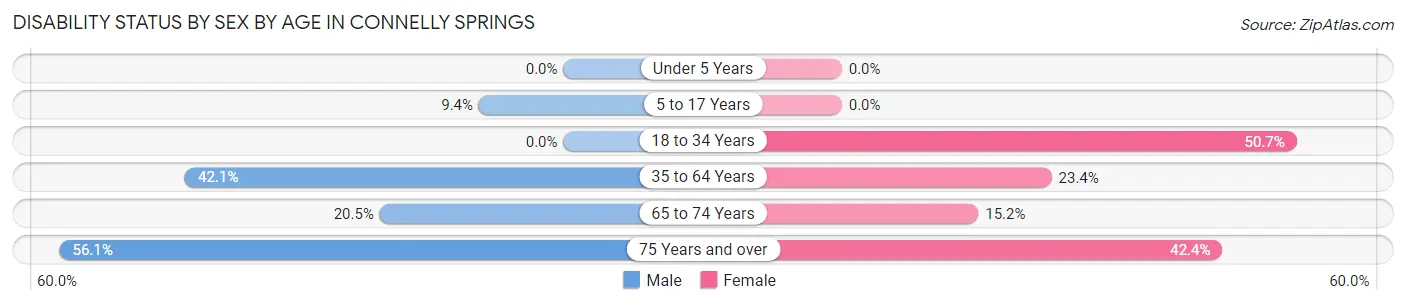
| Age Bracket | Male | Female |
| Under 5 Years | 0 (0.0%) | 0 (0.0%) |
| 5 to 17 Years | 16 (9.4%) | 0 (0.0%) |
| 18 to 34 Years | 0 (0.0%) | 157 (50.6%) |
| 35 to 64 Years | 233 (42.1%) | 93 (23.4%) |
| 65 to 74 Years | 27 (20.4%) | 19 (15.2%) |
| 75 Years and over | 23 (56.1%) | 25 (42.4%) |
Disability Class by Sex by Age in Connelly Springs
Disability Class: Hearing Difficulty
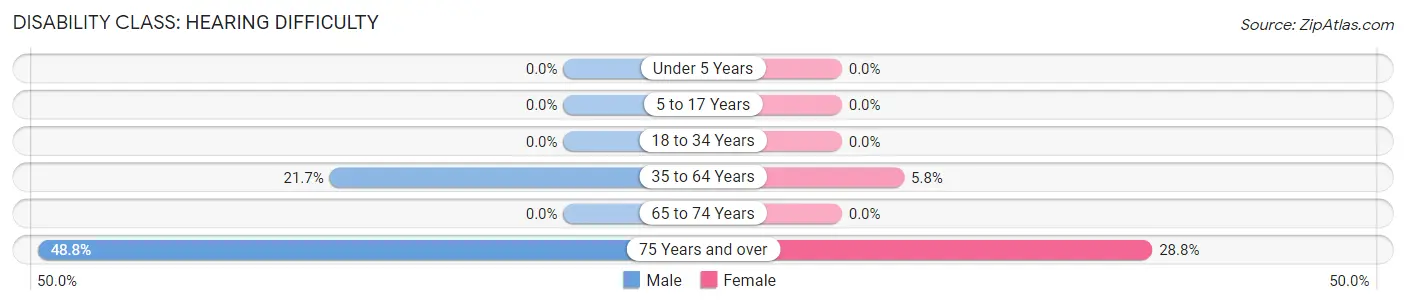
| Age Bracket | Male | Female |
| Under 5 Years | 0 (0.0%) | 0 (0.0%) |
| 5 to 17 Years | 0 (0.0%) | 0 (0.0%) |
| 18 to 34 Years | 0 (0.0%) | 0 (0.0%) |
| 35 to 64 Years | 120 (21.7%) | 23 (5.8%) |
| 65 to 74 Years | 0 (0.0%) | 0 (0.0%) |
| 75 Years and over | 20 (48.8%) | 17 (28.8%) |
Disability Class: Vision Difficulty
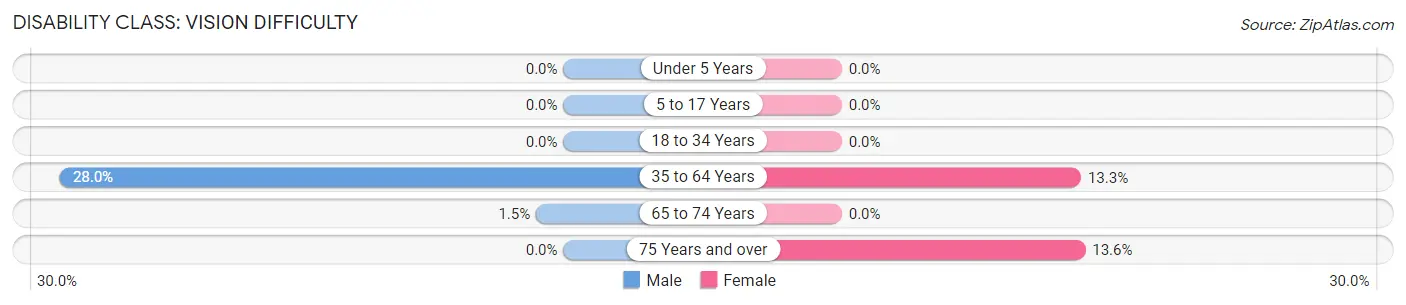
| Age Bracket | Male | Female |
| Under 5 Years | 0 (0.0%) | 0 (0.0%) |
| 5 to 17 Years | 0 (0.0%) | 0 (0.0%) |
| 18 to 34 Years | 0 (0.0%) | 0 (0.0%) |
| 35 to 64 Years | 155 (28.0%) | 53 (13.3%) |
| 65 to 74 Years | 2 (1.5%) | 0 (0.0%) |
| 75 Years and over | 0 (0.0%) | 8 (13.6%) |
Disability Class: Cognitive Difficulty
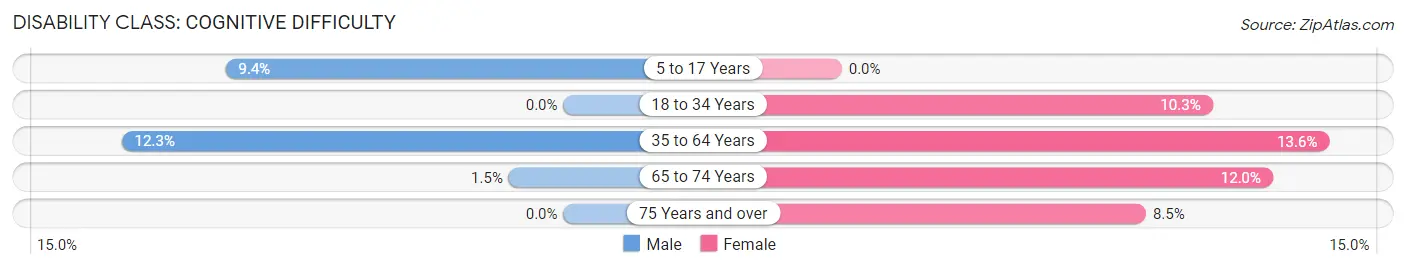
| Age Bracket | Male | Female |
| 5 to 17 Years | 16 (9.4%) | 0 (0.0%) |
| 18 to 34 Years | 0 (0.0%) | 32 (10.3%) |
| 35 to 64 Years | 68 (12.3%) | 54 (13.6%) |
| 65 to 74 Years | 2 (1.5%) | 15 (12.0%) |
| 75 Years and over | 0 (0.0%) | 5 (8.5%) |
Disability Class: Ambulatory Difficulty
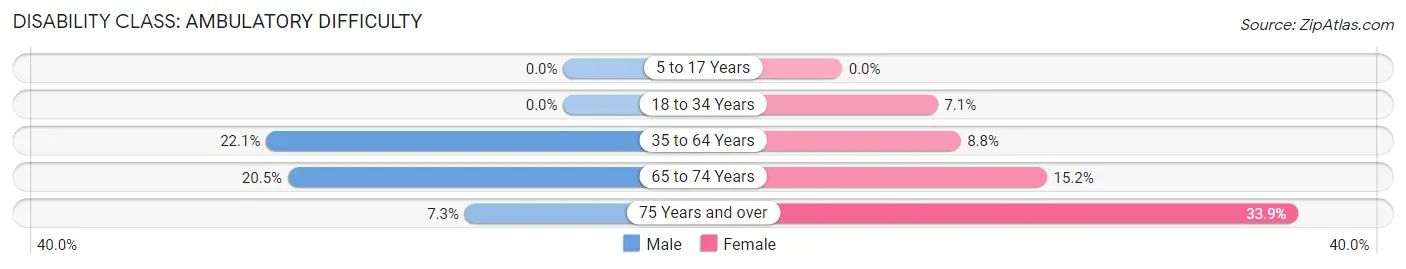
| Age Bracket | Male | Female |
| 5 to 17 Years | 0 (0.0%) | 0 (0.0%) |
| 18 to 34 Years | 0 (0.0%) | 22 (7.1%) |
| 35 to 64 Years | 122 (22.1%) | 35 (8.8%) |
| 65 to 74 Years | 27 (20.4%) | 19 (15.2%) |
| 75 Years and over | 3 (7.3%) | 20 (33.9%) |
Disability Class: Self-Care Difficulty
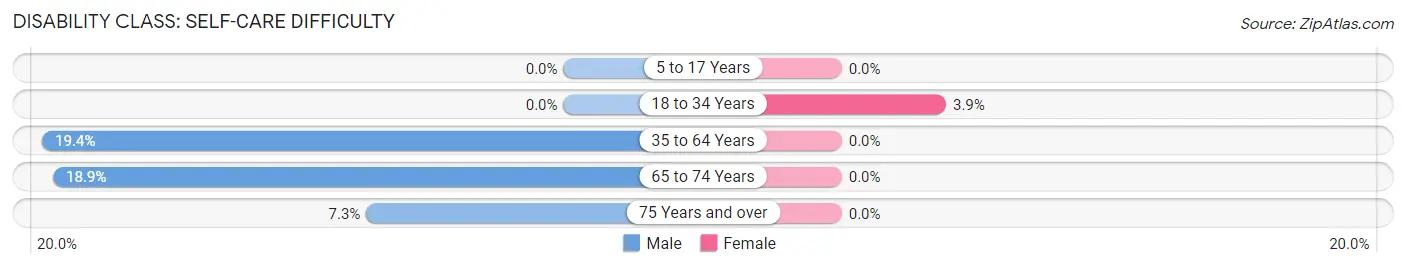
| Age Bracket | Male | Female |
| 5 to 17 Years | 0 (0.0%) | 0 (0.0%) |
| 18 to 34 Years | 0 (0.0%) | 12 (3.9%) |
| 35 to 64 Years | 107 (19.4%) | 0 (0.0%) |
| 65 to 74 Years | 25 (18.9%) | 0 (0.0%) |
| 75 Years and over | 3 (7.3%) | 0 (0.0%) |
Technology Access in Connelly Springs
Computing Device Access in Connelly Springs
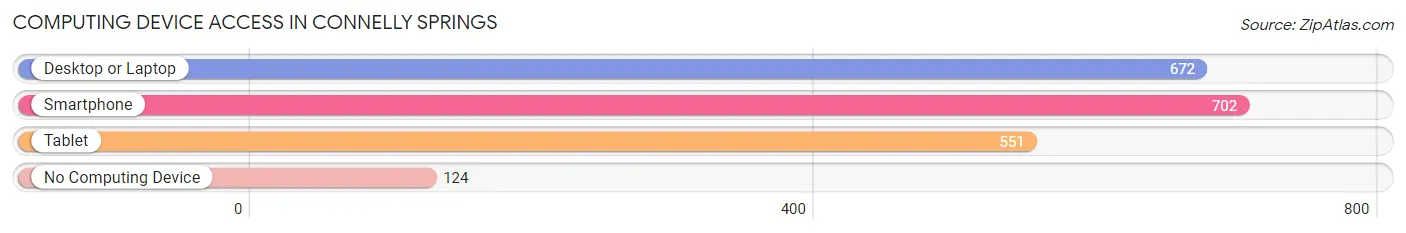
| Device Type | # Households | % Households |
| Desktop or Laptop | 672 | 73.4% |
| Smartphone | 702 | 76.6% |
| Tablet | 551 | 60.2% |
| No Computing Device | 124 | 13.5% |
| Total | 916 | 100.0% |
Internet Access in Connelly Springs
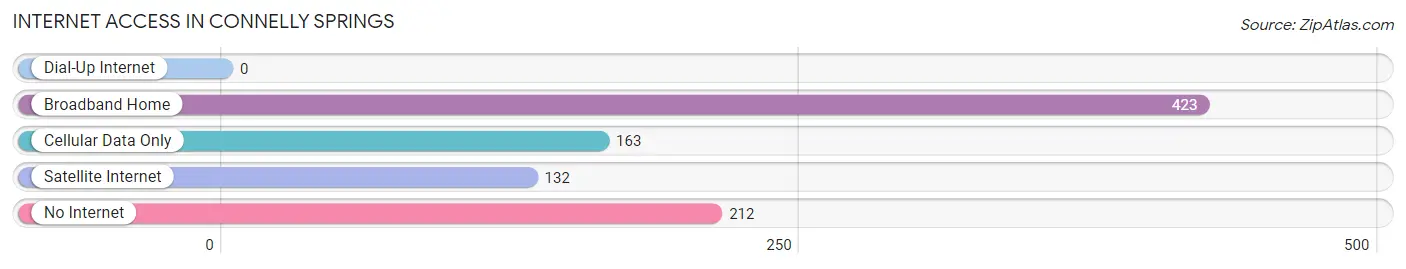
| Internet Type | # Households | % Households |
| Dial-Up Internet | 0 | 0.0% |
| Broadband Home | 423 | 46.2% |
| Cellular Data Only | 163 | 17.8% |
| Satellite Internet | 132 | 14.4% |
| No Internet | 212 | 23.1% |
| Total | 916 | 100.0% |
Connelly Springs Summary
Connelly Springs is a small town located in Burke County, North Carolina. It is situated in the foothills of the Blue Ridge Mountains, about 20 miles east of Hickory. The town was founded in 1887 and named after the Connelly family, who were early settlers in the area. The population of Connelly Springs was 1,845 at the 2010 census.
Geography
Connelly Springs is located at 35°45'25" North, 81°30'45" West (35.7569, -81.5125). It is situated in the foothills of the Blue Ridge Mountains, about 20 miles east of Hickory. The town is located in the Catawba River Valley, and is surrounded by rolling hills and forests. The town is situated at an elevation of 1,000 feet above sea level.
The climate in Connelly Springs is mild and humid. Summers are hot and humid, with temperatures reaching into the 90s. Winters are mild, with temperatures rarely dropping below freezing. The average annual precipitation is 44 inches.
Economy
The economy of Connelly Springs is largely based on agriculture and manufacturing. The town is home to several small businesses, including a furniture factory, a sawmill, and a textile mill. The town also has a number of retail stores, restaurants, and other services.
The town is also home to a number of tourist attractions, including the Catawba River, the Blue Ridge Parkway, and the Linville Gorge. The town is also home to a number of historic sites, including the Connelly Springs Historic District, the Connelly Springs Presbyterian Church, and the Connelly Springs Cemetery.
Demographics
As of the 2010 census, the population of Connelly Springs was 1,845. The racial makeup of the town was 94.3% White, 2.3% African American, 0.3% Native American, 0.7% Asian, 0.1% Pacific Islander, 1.2% from other races, and 1.2% from two or more races. Hispanic or Latino of any race were 2.7% of the population.
The median income for a household in Connelly Springs was $35,938, and the median income for a family was $41,250. The per capita income for the town was $17,845. About 11.3% of families and 14.2% of the population were below the poverty line, including 19.2% of those under age 18 and 8.3% of those age 65 or over.
Education
Connelly Springs is served by the Burke County Public Schools system. The town is home to Connelly Springs Elementary School, which serves students in grades K-5. The town is also home to East Burke High School, which serves students in grades 9-12.
Conclusion
Connelly Springs is a small town located in Burke County, North Carolina. It is situated in the foothills of the Blue Ridge Mountains, about 20 miles east of Hickory. The town was founded in 1887 and named after the Connelly family, who were early settlers in the area. The population of Connelly Springs was 1,845 at the 2010 census. The economy of Connelly Springs is largely based on agriculture and manufacturing, and the town is home to several tourist attractions. The town is served by the Burke County Public Schools system, and is home to Connelly Springs Elementary School and East Burke High School.
Common Questions
What is the Total Population of Connelly Springs?
Total Population of Connelly Springs is 2,355.
What is the Total Male Population of Connelly Springs?
Total Male Population of Connelly Springs is 1,278.
What is the Total Female Population of Connelly Springs?
Total Female Population of Connelly Springs is 1,077.
What is the Ratio of Males per 100 Females in Connelly Springs?
There are 118.66 Males per 100 Females in Connelly Springs.
What is the Ratio of Females per 100 Males in Connelly Springs?
There are 84.27 Females per 100 Males in Connelly Springs.
What is the Median Population Age in Connelly Springs?
Median Population Age in Connelly Springs is 44.3 Years.
What is the Average Family Size in Connelly Springs
Average Family Size in Connelly Springs is 2.9 People.
What is the Average Household Size in Connelly Springs
Average Household Size in Connelly Springs is 2.6 People.
What is Per Capita Income in Connelly Springs?
Per Capita income in Connelly Springs is $36,742.
What is the Median Family Income in Connelly Springs?
Median Family Income in Connelly Springs is $69,643.
What is the Median Household income in Connelly Springs?
Median Household Income in Connelly Springs is $63,963.
What is Income or Wage Gap in Connelly Springs?
Income or Wage Gap in Connelly Springs is 29.7%.
Women in Connelly Springs earn 70.3 cents for every dollar earned by a man.
What is Family Income Deficit in Connelly Springs?
Family Income Deficit in Connelly Springs is $9,235.
Families that are below poverty line in Connelly Springs earn $9,235 less on average than the poverty threshold level.
What is Inequality or Gini Index in Connelly Springs?
Inequality or Gini Index in Connelly Springs is 0.50.
How Large is the Labor Force in Connelly Springs?
There are 877 People in the Labor Forcein in Connelly Springs.
What is the Percentage of People in the Labor Force in Connelly Springs?
44.9% of People are in the Labor Force in Connelly Springs.
What is the Unemployment Rate in Connelly Springs?
Unemployment Rate in Connelly Springs is 6.8%.