Bonnetsville, NC
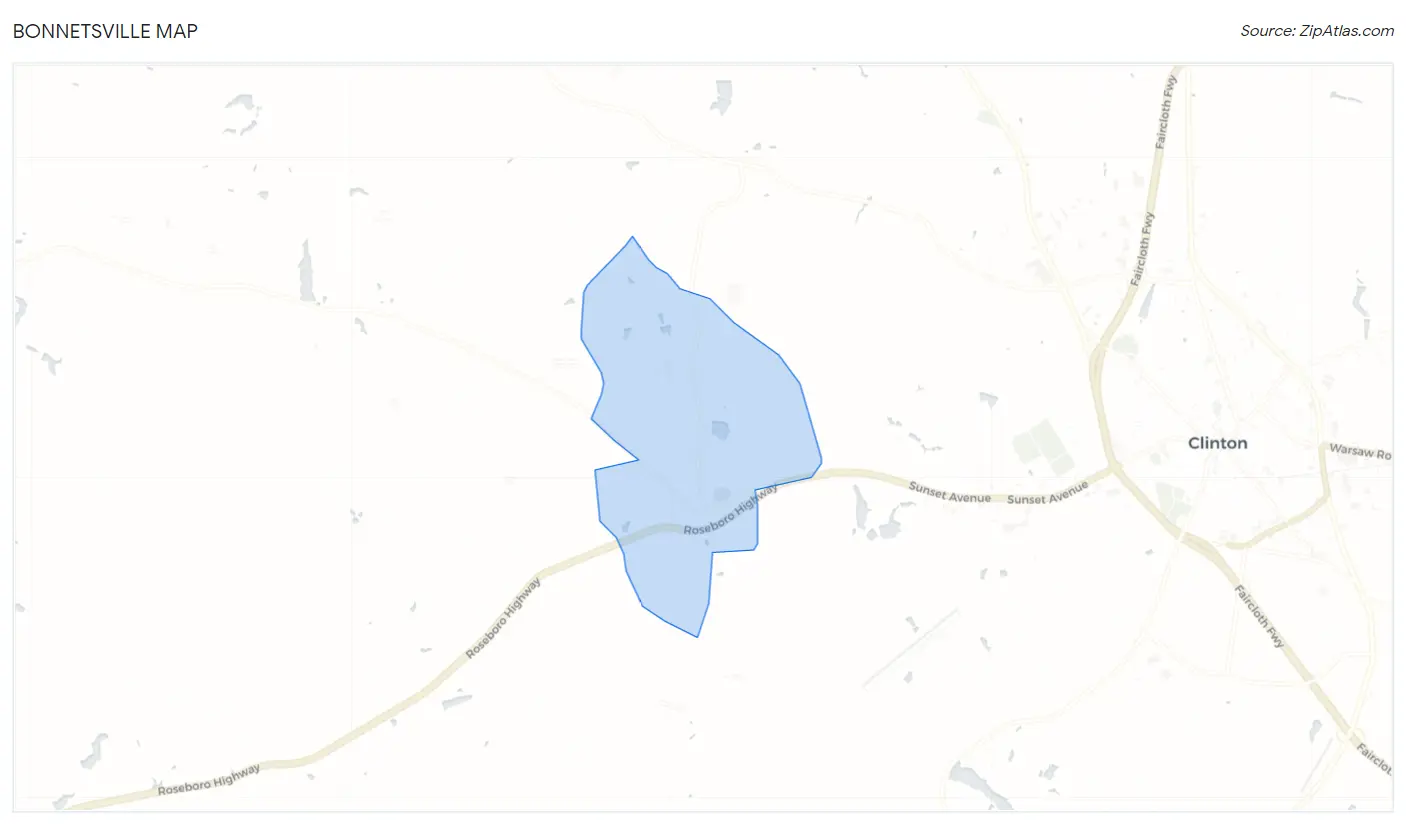
Bonnetsville Map
Bonnetsville Overview
1,297
TOTAL POPULATION
644
MALE POPULATION
653
FEMALE POPULATION
98.62
MALES / 100 FEMALES
101.40
FEMALES / 100 MALES
15.8
MEDIAN AGE
4.5
AVG FAMILY SIZE
3.8
AVG HOUSEHOLD SIZE
$10,851
PER CAPITA INCOME
$41,135
AVG HOUSEHOLD INCOME
58.9%
WAGE / INCOME GAP [ % ]
41.1¢/ $1
WAGE / INCOME GAP [ $ ]
0.34
INEQUALITY / GINI INDEX
381
LABOR FORCE [ PEOPLE ]
60.1%
PERCENT IN LABOR FORCE
4.5%
UNEMPLOYMENT RATE
Race in Bonnetsville
The most populous races in Bonnetsville are White / Caucasian (985 | 75.9%), Hispanic or Latino (291 | 22.4%), and Black / African American (121 | 9.3%).
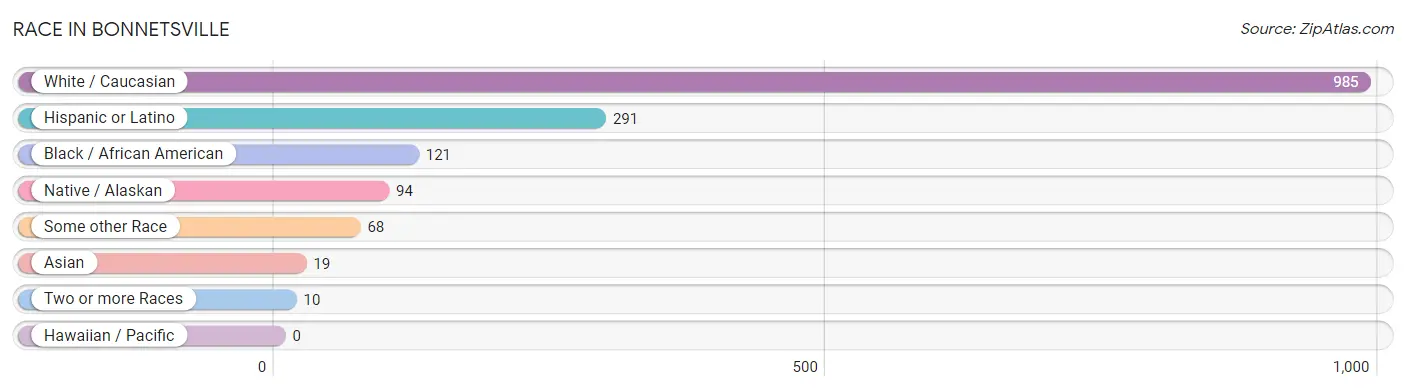
| Race | # Population | % Population |
| Asian | 19 | 1.5% |
| Black / African American | 121 | 9.3% |
| Hawaiian / Pacific | 0 | 0.0% |
| Hispanic or Latino | 291 | 22.4% |
| Native / Alaskan | 94 | 7.2% |
| White / Caucasian | 985 | 75.9% |
| Two or more Races | 10 | 0.8% |
| Some other Race | 68 | 5.2% |
| Total | 1,297 | 100.0% |
Ancestry in Bonnetsville
The most populous ancestries reported in Bonnetsville are Mexican (230 | 17.7%), Lumbee (94 | 7.2%), English (47 | 3.6%), Sri Lankan (19 | 1.5%), and Irish (14 | 1.1%), together accounting for 31.1% of all Bonnetsville residents.
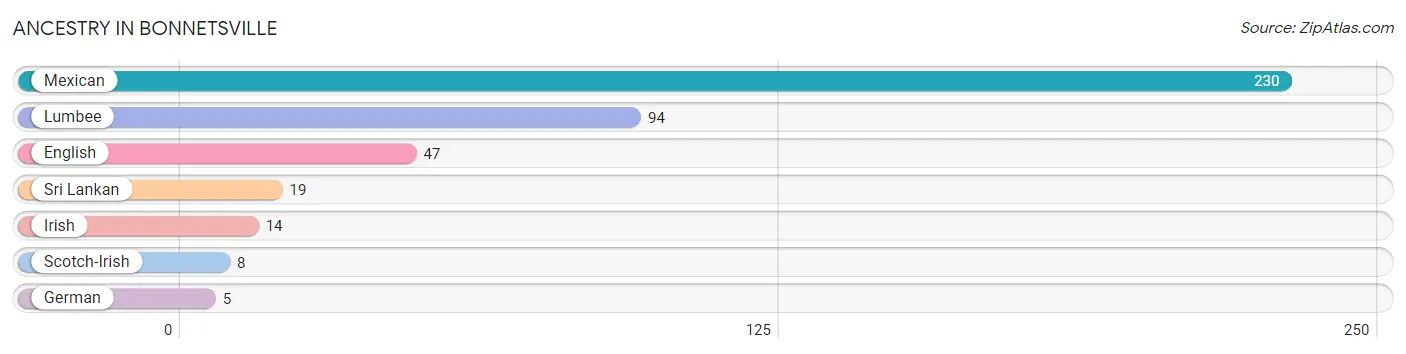
| Ancestry | # Population | % Population |
| English | 47 | 3.6% |
| German | 5 | 0.4% |
| Irish | 14 | 1.1% |
| Lumbee | 94 | 7.2% |
| Mexican | 230 | 17.7% |
| Scotch-Irish | 8 | 0.6% |
| Sri Lankan | 19 | 1.5% | View All 7 Rows |
Immigrants in Bonnetsville
The most numerous immigrant groups reported in Bonnetsville came from Central America (128 | 9.9%), Latin America (128 | 9.9%), Mexico (94 | 7.2%), Honduras (34 | 2.6%), and Asia (19 | 1.5%), together accounting for 31.1% of all Bonnetsville residents.
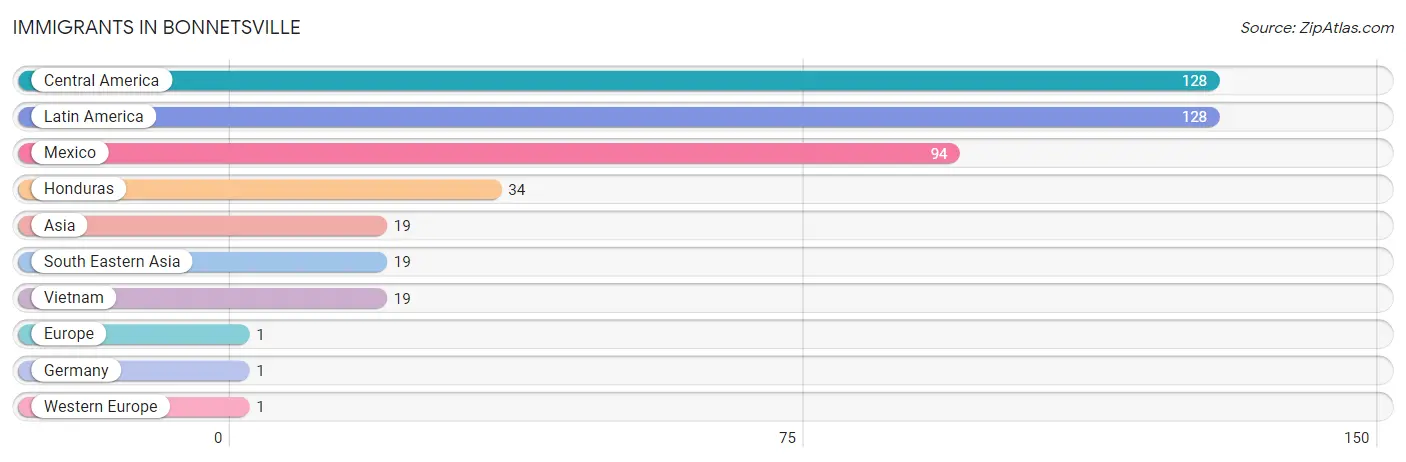
| Immigration Origin | # Population | % Population |
| Asia | 19 | 1.5% |
| Central America | 128 | 9.9% |
| Europe | 1 | 0.1% |
| Germany | 1 | 0.1% |
| Honduras | 34 | 2.6% |
| Latin America | 128 | 9.9% |
| Mexico | 94 | 7.2% |
| South Eastern Asia | 19 | 1.5% |
| Vietnam | 19 | 1.5% |
| Western Europe | 1 | 0.1% | View All 10 Rows |
Sex and Age in Bonnetsville
Sex and Age in Bonnetsville
The most populous age groups in Bonnetsville are 10 to 14 Years (351 | 54.5%) for men and 5 to 9 Years (151 | 23.1%) for women.
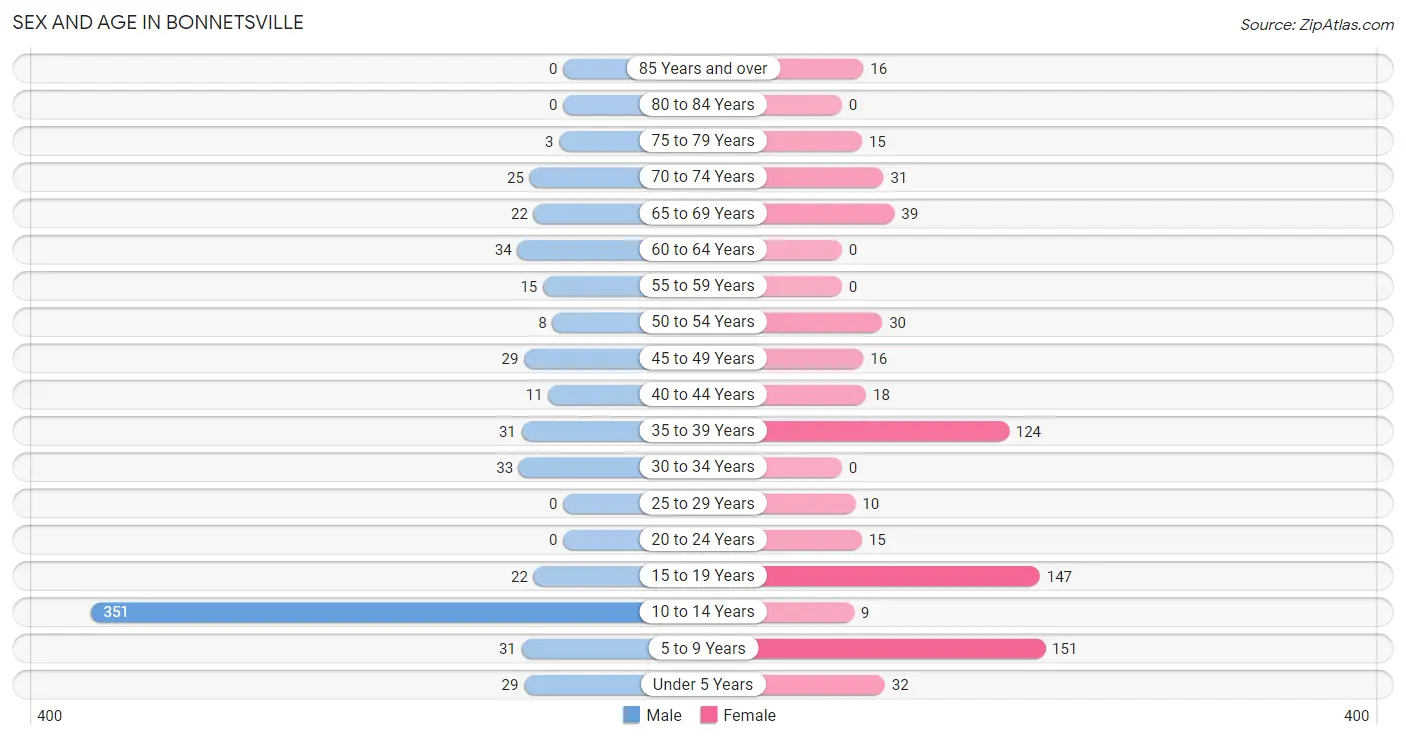
| Age Bracket | Male | Female |
| Under 5 Years | 29 (4.5%) | 32 (4.9%) |
| 5 to 9 Years | 31 (4.8%) | 151 (23.1%) |
| 10 to 14 Years | 351 (54.5%) | 9 (1.4%) |
| 15 to 19 Years | 22 (3.4%) | 147 (22.5%) |
| 20 to 24 Years | 0 (0.0%) | 15 (2.3%) |
| 25 to 29 Years | 0 (0.0%) | 10 (1.5%) |
| 30 to 34 Years | 33 (5.1%) | 0 (0.0%) |
| 35 to 39 Years | 31 (4.8%) | 124 (19.0%) |
| 40 to 44 Years | 11 (1.7%) | 18 (2.8%) |
| 45 to 49 Years | 29 (4.5%) | 16 (2.5%) |
| 50 to 54 Years | 8 (1.2%) | 30 (4.6%) |
| 55 to 59 Years | 15 (2.3%) | 0 (0.0%) |
| 60 to 64 Years | 34 (5.3%) | 0 (0.0%) |
| 65 to 69 Years | 22 (3.4%) | 39 (6.0%) |
| 70 to 74 Years | 25 (3.9%) | 31 (4.8%) |
| 75 to 79 Years | 3 (0.5%) | 15 (2.3%) |
| 80 to 84 Years | 0 (0.0%) | 0 (0.0%) |
| 85 Years and over | 0 (0.0%) | 16 (2.5%) |
| Total | 644 (100.0%) | 653 (100.0%) |
Families and Households in Bonnetsville
Median Family Size in Bonnetsville
The median family size in Bonnetsville is 4.48 persons per family, with single female/mother families (115 | 45.8%) accounting for the largest median family size of 5.73 persons per family. On the other hand, married-couple families (60 | 23.9%) represent the smallest median family size with 3.30 persons per family.
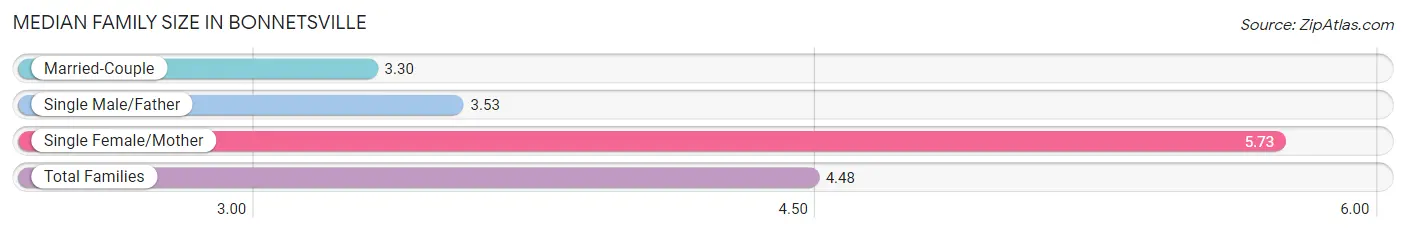
| Family Type | # Families | Family Size |
| Married-Couple | 60 (23.9%) | 3.30 |
| Single Male/Father | 76 (30.3%) | 3.53 |
| Single Female/Mother | 115 (45.8%) | 5.73 |
| Total Families | 251 (100.0%) | 4.48 |
Median Household Size in Bonnetsville
The median household size in Bonnetsville is 3.82 persons per household, with single female/mother households (115 | 33.9%) accounting for the largest median household size of 5.83 persons per household. non-family households (88 | 26.0%) represent the smallest median household size with 1.60 persons per household.
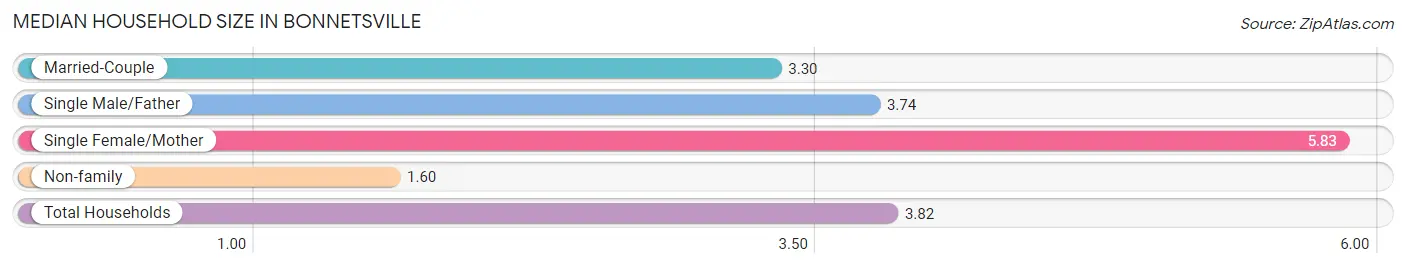
| Household Type | # Households | Household Size |
| Married-Couple | 60 (17.7%) | 3.30 |
| Single Male/Father | 76 (22.4%) | 3.74 |
| Single Female/Mother | 115 (33.9%) | 5.83 |
| Non-family | 88 (26.0%) | 1.60 |
| Total Households | 339 (100.0%) | 3.82 |
Household Size by Marriage Status in Bonnetsville
Out of a total of 339 households in Bonnetsville, 251 (74.0%) are family households, while 88 (26.0%) are nonfamily households. The most numerous type of family households are 7+ person households, comprising 95, and the most common type of nonfamily households are 2-person households, comprising 61.
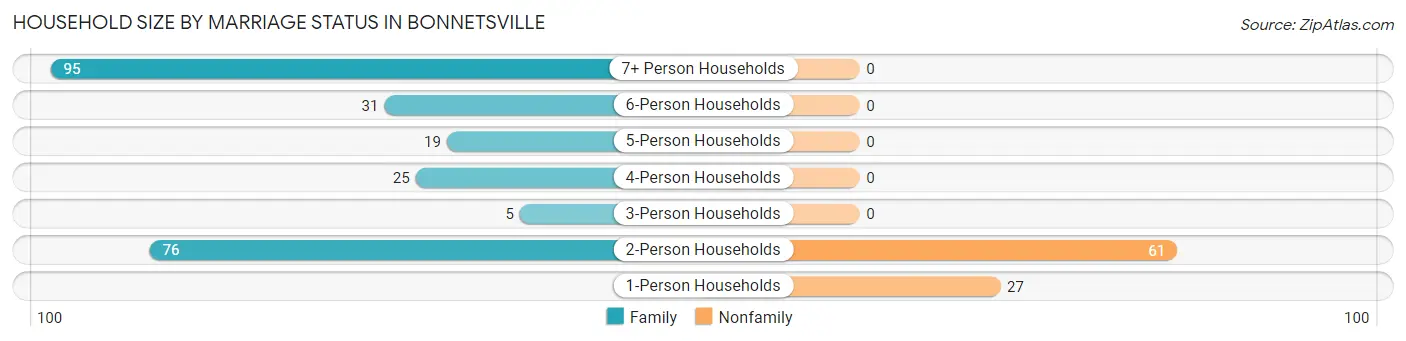
| Household Size | Family Households | Nonfamily Households |
| 1-Person Households | - | 27 (8.0%) |
| 2-Person Households | 76 (22.4%) | 61 (18.0%) |
| 3-Person Households | 5 (1.5%) | 0 (0.0%) |
| 4-Person Households | 25 (7.4%) | 0 (0.0%) |
| 5-Person Households | 19 (5.6%) | 0 (0.0%) |
| 6-Person Households | 31 (9.1%) | 0 (0.0%) |
| 7+ Person Households | 95 (28.0%) | 0 (0.0%) |
| Total | 251 (74.0%) | 88 (26.0%) |
Female Fertility in Bonnetsville
Fertility by Age in Bonnetsville
| Age Bracket | Women with Births | Births / 1,000 Women |
| 15 to 19 years | 0 (0.0%) | 0.0 |
| 20 to 34 years | 0 (0.0%) | 0.0 |
| 35 to 50 years | 0 (0.0%) | 0.0 |
| Total | 0 (0.0%) | 0.0 |
Fertility by Age by Marriage Status in Bonnetsville
| Age Bracket | Married | Unmarried |
| 15 to 19 years | 0 (0.0%) | 0 (0.0%) |
| 20 to 34 years | 0 (0.0%) | 0 (0.0%) |
| 35 to 50 years | 0 (0.0%) | 0 (0.0%) |
| Total | 0 (0.0%) | 0 (0.0%) |
Fertility by Education in Bonnetsville
| Educational Attainment | Women with Births | Births / 1,000 Women |
| Less than High School | 0 (0.0%) | 0.0 |
| High School Diploma | 0 (0.0%) | 0.0 |
| College or Associate's Degree | 0 (0.0%) | 0.0 |
| Bachelor's Degree | 0 (0.0%) | 0.0 |
| Graduate Degree | 0 (0.0%) | 0.0 |
| Total | 0 (0.0%) | 0.0 |
Fertility by Education by Marriage Status in Bonnetsville
| Educational Attainment | Married | Unmarried |
| Less than High School | 0 (0.0%) | 0 (0.0%) |
| High School Diploma | 0 (0.0%) | 0 (0.0%) |
| College or Associate's Degree | 0 (0.0%) | 0 (0.0%) |
| Bachelor's Degree | 0 (0.0%) | 0 (0.0%) |
| Graduate Degree | 0 (0.0%) | 0 (0.0%) |
| Total | 0 (0.0%) | 0 (0.0%) |
Income in Bonnetsville
Income Overview in Bonnetsville
| Characteristic | Number | Measure |
| Per Capita Income | 1,297 | $10,851 |
| Median Family Income | 251 | $0 |
| Mean Family Income | 251 | $42,871 |
| Median Household Income | 339 | $41,135 |
| Mean Household Income | 339 | $43,158 |
| Income Deficit | 251 | $0 |
| Wage / Income Gap (%) | 1,297 | 58.90% |
| Wage / Income Gap ($) | 1,297 | 41.10¢ per $1 |
| Gini / Inequality Index | 1,297 | 0.34 |
Earnings by Sex in Bonnetsville
Average Earnings in Bonnetsville are $23,068, $40,242 for men and $16,539 for women, a difference of 58.9%.
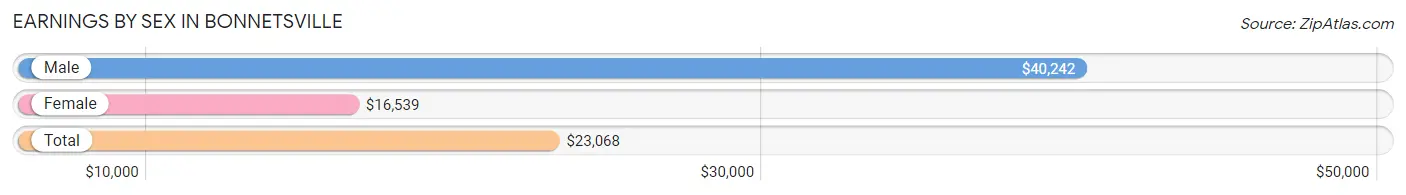
| Sex | Number | Average Earnings |
| Male | 150 (39.8%) | $40,242 |
| Female | 227 (60.2%) | $16,539 |
| Total | 377 (100.0%) | $23,068 |
Earnings by Sex by Income Bracket in Bonnetsville
The most common earnings brackets in Bonnetsville are $50,000 to $54,999 for men (33 | 22.0%) and $15,000 to $17,499 for women (95 | 41.8%).
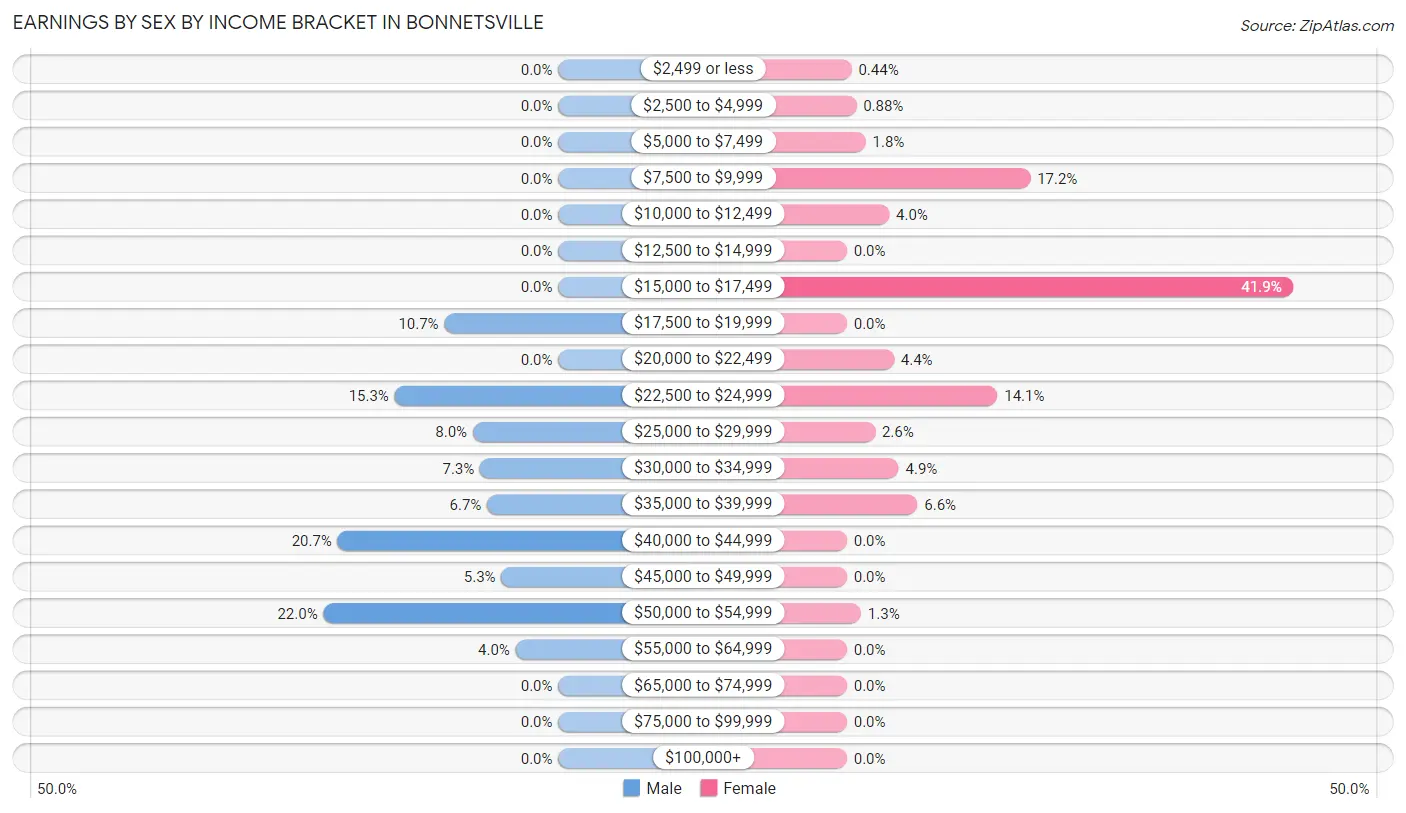
| Income | Male | Female |
| $2,499 or less | 0 (0.0%) | 1 (0.4%) |
| $2,500 to $4,999 | 0 (0.0%) | 2 (0.9%) |
| $5,000 to $7,499 | 0 (0.0%) | 4 (1.8%) |
| $7,500 to $9,999 | 0 (0.0%) | 39 (17.2%) |
| $10,000 to $12,499 | 0 (0.0%) | 9 (4.0%) |
| $12,500 to $14,999 | 0 (0.0%) | 0 (0.0%) |
| $15,000 to $17,499 | 0 (0.0%) | 95 (41.8%) |
| $17,500 to $19,999 | 16 (10.7%) | 0 (0.0%) |
| $20,000 to $22,499 | 0 (0.0%) | 10 (4.4%) |
| $22,500 to $24,999 | 23 (15.3%) | 32 (14.1%) |
| $25,000 to $29,999 | 12 (8.0%) | 6 (2.6%) |
| $30,000 to $34,999 | 11 (7.3%) | 11 (4.9%) |
| $35,000 to $39,999 | 10 (6.7%) | 15 (6.6%) |
| $40,000 to $44,999 | 31 (20.7%) | 0 (0.0%) |
| $45,000 to $49,999 | 8 (5.3%) | 0 (0.0%) |
| $50,000 to $54,999 | 33 (22.0%) | 3 (1.3%) |
| $55,000 to $64,999 | 6 (4.0%) | 0 (0.0%) |
| $65,000 to $74,999 | 0 (0.0%) | 0 (0.0%) |
| $75,000 to $99,999 | 0 (0.0%) | 0 (0.0%) |
| $100,000+ | 0 (0.0%) | 0 (0.0%) |
| Total | 150 (100.0%) | 227 (100.0%) |
Earnings by Sex by Educational Attainment in Bonnetsville
Average earnings in Bonnetsville are $40,242 for men and $16,684 for women, a difference of 58.5%. Men with an educational attainment of college or associate's degree enjoy the highest average annual earnings of $51,136, while those with less than high school education earn the least with $40,484. Women with an educational attainment of college or associate's degree earn the most with the average annual earnings of $16,539, while those with college or associate's degree education have the smallest earnings of $16,539.
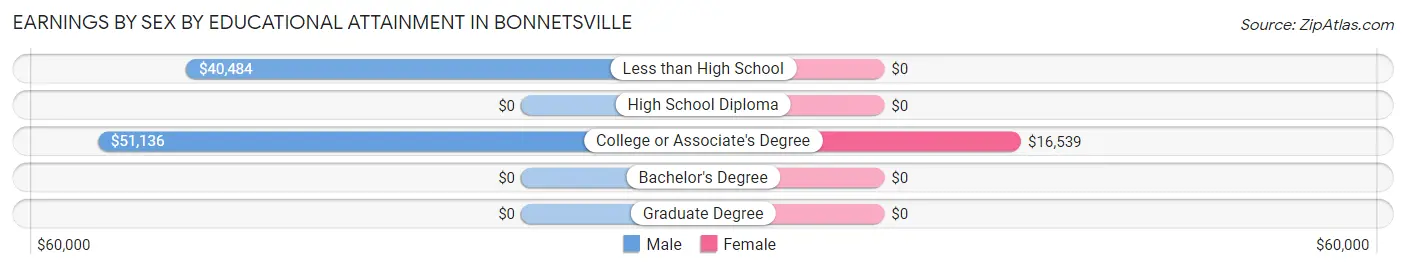
| Educational Attainment | Male Income | Female Income |
| Less than High School | $40,484 | $0 |
| High School Diploma | - | - |
| College or Associate's Degree | $51,136 | $16,539 |
| Bachelor's Degree | - | - |
| Graduate Degree | - | - |
| Total | $40,242 | $16,684 |
Family Income in Bonnetsville
Family Income Brackets in Bonnetsville
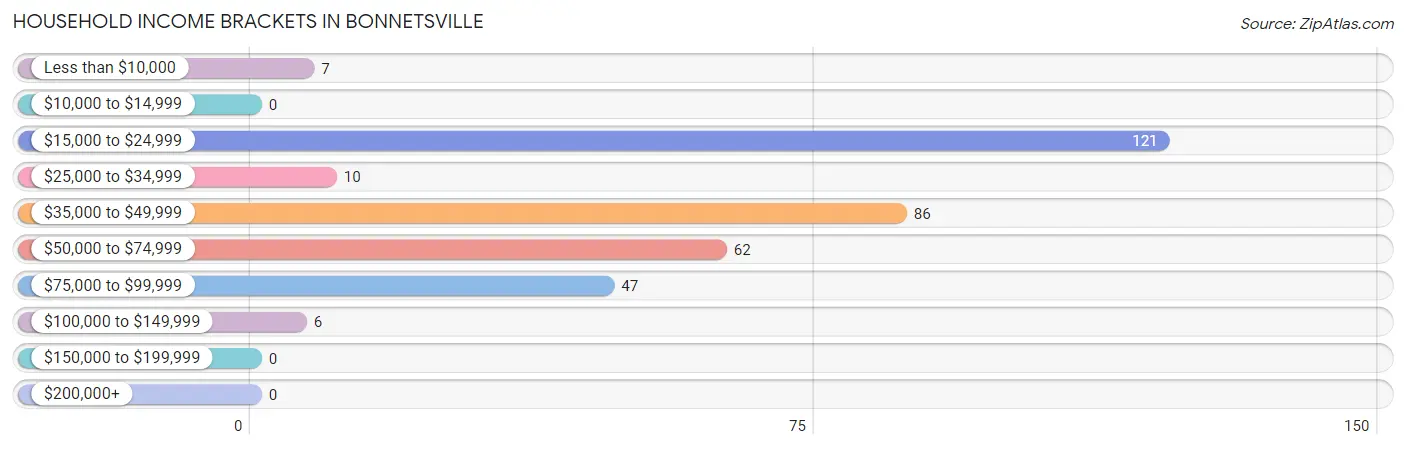
According to the Bonnetsville family income data, there are 103 families falling into the $15,000 to $24,999 income range, which is the most common income bracket and makes up 41.0% of all families.
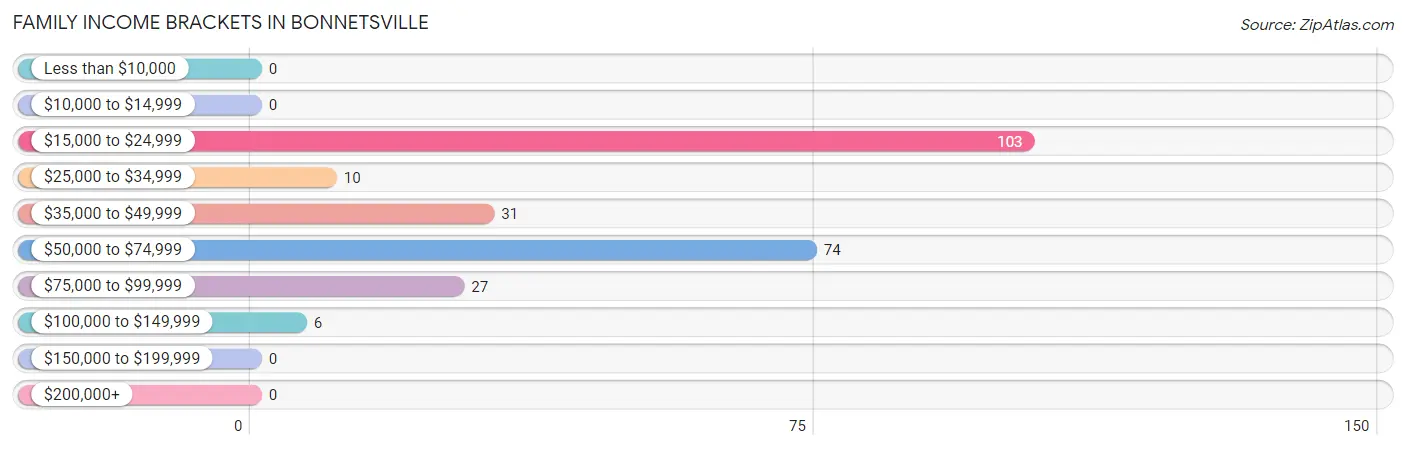
| Income Bracket | # Families | % Families |
| Less than $10,000 | 0 | 0.0% |
| $10,000 to $14,999 | 0 | 0.0% |
| $15,000 to $24,999 | 103 | 41.0% |
| $25,000 to $34,999 | 10 | 4.0% |
| $35,000 to $49,999 | 31 | 12.4% |
| $50,000 to $74,999 | 74 | 29.5% |
| $75,000 to $99,999 | 27 | 10.8% |
| $100,000 to $149,999 | 6 | 2.4% |
| $150,000 to $199,999 | 0 | 0.0% |
| $200,000+ | 0 | 0.0% |
Family Income by Famaliy Size in Bonnetsville
2-person families (76 | 30.3%) account for the highest median family income in Bonnetsville with $59,621 per family, while 2-person families (76 | 30.3%) have the highest median income of $29,810 per family member.
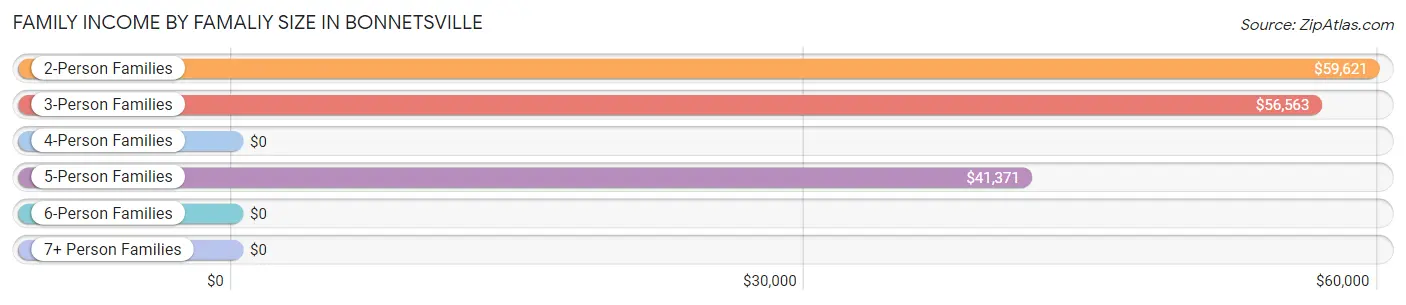
| Income Bracket | # Families | Median Income |
| 2-Person Families | 76 (30.3%) | $59,621 |
| 3-Person Families | 25 (10.0%) | $56,563 |
| 4-Person Families | 5 (2.0%) | $0 |
| 5-Person Families | 50 (19.9%) | $41,371 |
| 6-Person Families | 0 (0.0%) | $0 |
| 7+ Person Families | 95 (37.9%) | $0 |
| Total | 251 (100.0%) | $0 |
Family Income by Number of Earners in Bonnetsville
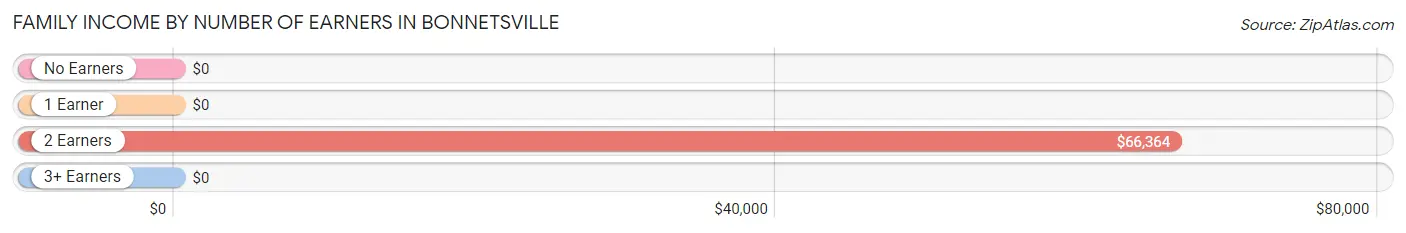
| Number of Earners | # Families | Median Income |
| No Earners | 20 (8.0%) | $0 |
| 1 Earner | 194 (77.3%) | $0 |
| 2 Earners | 32 (12.8%) | $66,364 |
| 3+ Earners | 5 (2.0%) | $0 |
| Total | 251 (100.0%) | $0 |
Household Income in Bonnetsville
Household Income Brackets in Bonnetsville
With 121 households falling in the category, the $15,000 to $24,999 income range is the most frequent in Bonnetsville, accounting for 35.7% of all households.
| Income Bracket | # Households | % Households |
| Less than $10,000 | 7 | 2.1% |
| $10,000 to $14,999 | 0 | 0.0% |
| $15,000 to $24,999 | 121 | 35.7% |
| $25,000 to $34,999 | 10 | 2.9% |
| $35,000 to $49,999 | 86 | 25.4% |
| $50,000 to $74,999 | 62 | 18.3% |
| $75,000 to $99,999 | 47 | 13.9% |
| $100,000 to $149,999 | 6 | 1.8% |
| $150,000 to $199,999 | 0 | 0.0% |
| $200,000+ | 0 | 0.0% |
Household Income by Householder Age in Bonnetsville
The median household income in Bonnetsville is $41,135, with the highest median household income of $81,146 found in the 65+ years age bracket for the primary householder. A total of 69 households (20.3%) fall into this category.
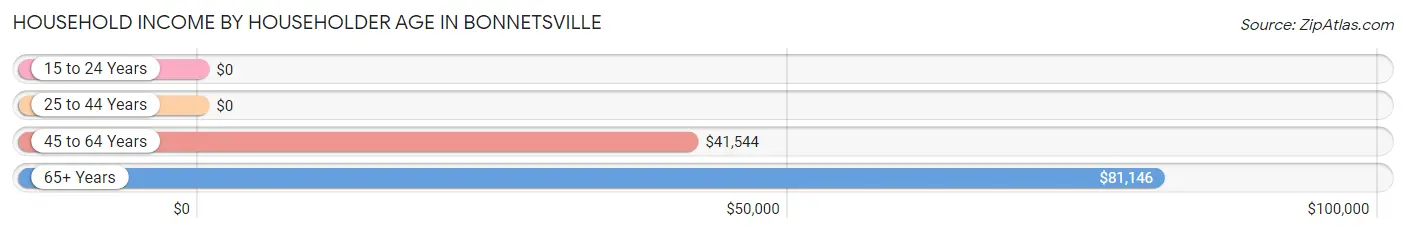
| Income Bracket | # Households | Median Income |
| 15 to 24 Years | 0 (0.0%) | $0 |
| 25 to 44 Years | 180 (53.1%) | $0 |
| 45 to 64 Years | 90 (26.6%) | $41,544 |
| 65+ Years | 69 (20.3%) | $81,146 |
| Total | 339 (100.0%) | $41,135 |
Poverty in Bonnetsville
Income Below Poverty by Sex and Age in Bonnetsville
With 40.7% poverty level for males and 65.2% for females among the residents of Bonnetsville, 12 to 14 year old males and 6 to 11 year old females are the most vulnerable to poverty, with 157 males (85.3%) and 156 females (100.0%) in their respective age groups living below the poverty level.
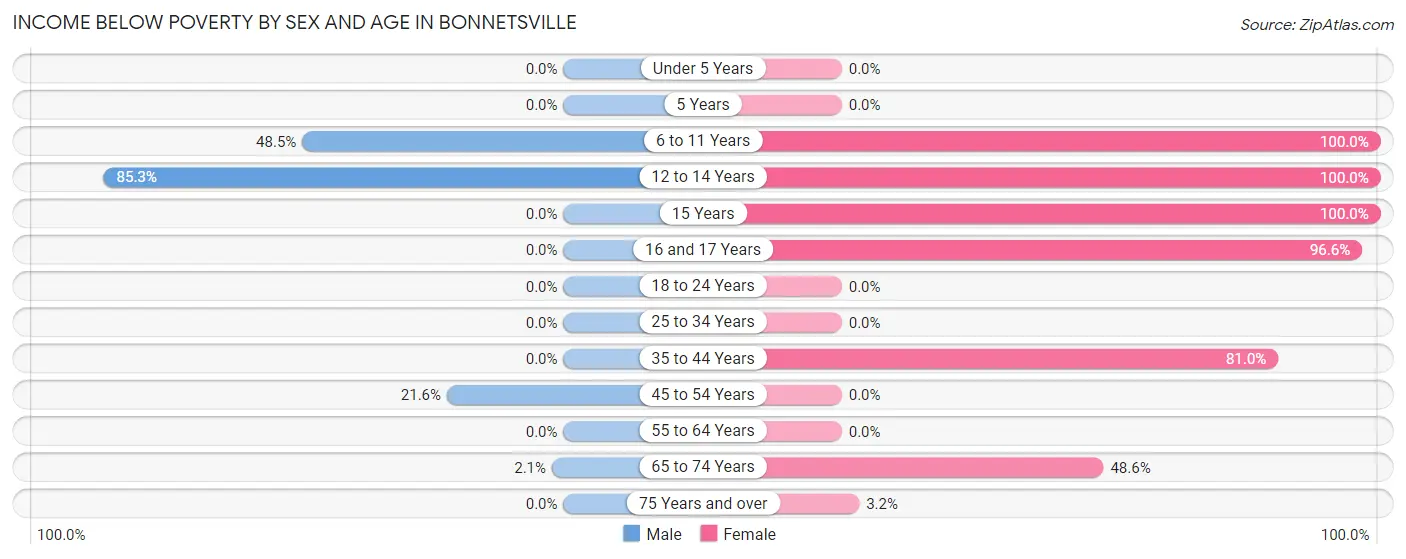
| Age Bracket | Male | Female |
| Under 5 Years | 0 (0.0%) | 0 (0.0%) |
| 5 Years | 0 (0.0%) | 0 (0.0%) |
| 6 to 11 Years | 96 (48.5%) | 156 (100.0%) |
| 12 to 14 Years | 157 (85.3%) | 4 (100.0%) |
| 15 Years | 0 (0.0%) | 60 (100.0%) |
| 16 and 17 Years | 0 (0.0%) | 56 (96.6%) |
| 18 to 24 Years | 0 (0.0%) | 0 (0.0%) |
| 25 to 34 Years | 0 (0.0%) | 0 (0.0%) |
| 35 to 44 Years | 0 (0.0%) | 115 (81.0%) |
| 45 to 54 Years | 8 (21.6%) | 0 (0.0%) |
| 55 to 64 Years | 0 (0.0%) | 0 (0.0%) |
| 65 to 74 Years | 1 (2.1%) | 34 (48.6%) |
| 75 Years and over | 0 (0.0%) | 1 (3.2%) |
| Total | 262 (40.7%) | 426 (65.2%) |
Income Above Poverty by Sex and Age in Bonnetsville
According to the poverty statistics in Bonnetsville, males aged under 5 years and females aged under 5 years are the age groups that are most secure financially, with 100.0% of males and 100.0% of females in these age groups living above the poverty line.
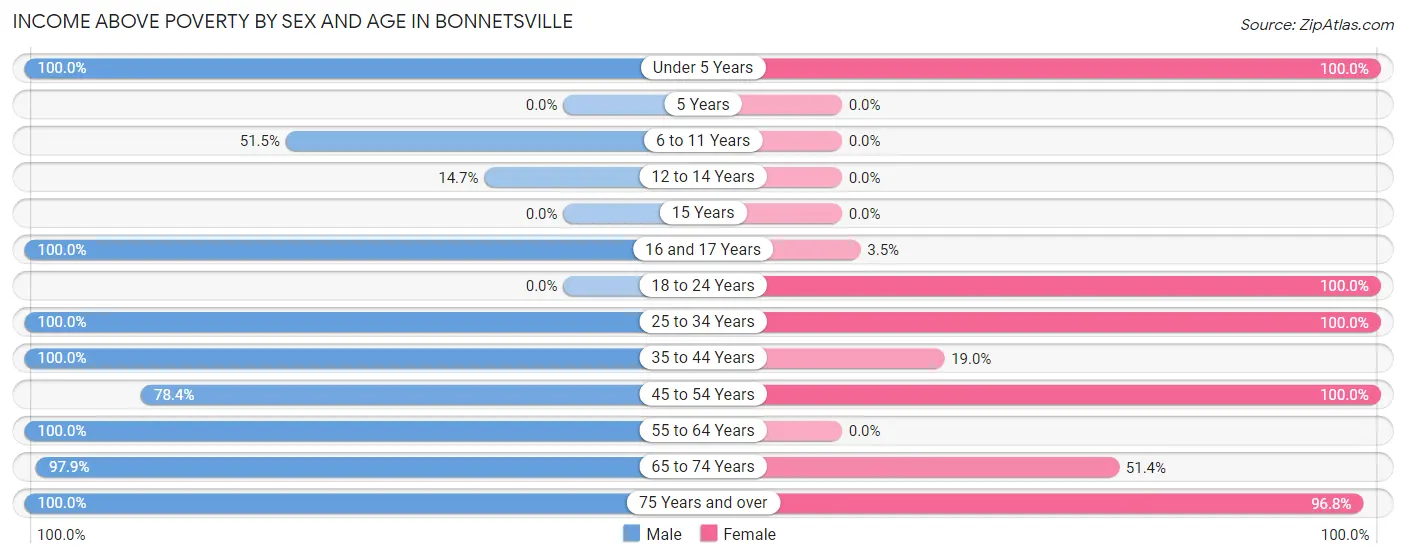
| Age Bracket | Male | Female |
| Under 5 Years | 29 (100.0%) | 32 (100.0%) |
| 5 Years | 0 (0.0%) | 0 (0.0%) |
| 6 to 11 Years | 102 (51.5%) | 0 (0.0%) |
| 12 to 14 Years | 27 (14.7%) | 0 (0.0%) |
| 15 Years | 0 (0.0%) | 0 (0.0%) |
| 16 and 17 Years | 22 (100.0%) | 2 (3.5%) |
| 18 to 24 Years | 0 (0.0%) | 44 (100.0%) |
| 25 to 34 Years | 33 (100.0%) | 10 (100.0%) |
| 35 to 44 Years | 42 (100.0%) | 27 (19.0%) |
| 45 to 54 Years | 29 (78.4%) | 46 (100.0%) |
| 55 to 64 Years | 49 (100.0%) | 0 (0.0%) |
| 65 to 74 Years | 46 (97.9%) | 36 (51.4%) |
| 75 Years and over | 3 (100.0%) | 30 (96.8%) |
| Total | 382 (59.3%) | 227 (34.8%) |
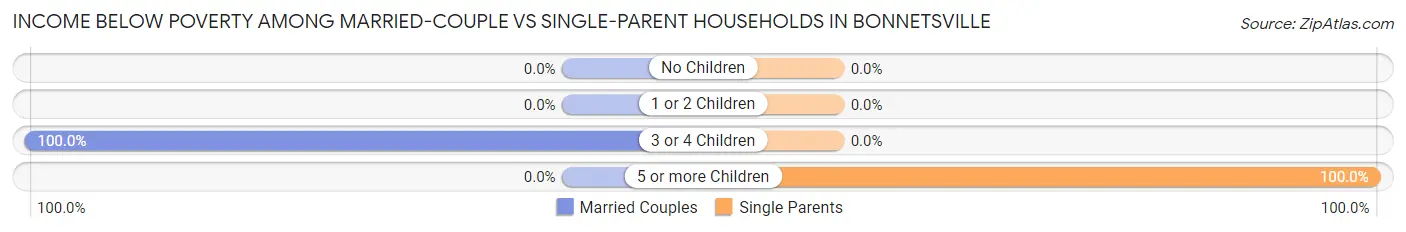
Income Below Poverty Among Married-Couple Families in Bonnetsville
The poverty statistics for married-couple families in Bonnetsville show that 13.3% or 8 of the total 60 families live below the poverty line. Families with 3 or 4 children have the highest poverty rate of 100.0%, comprising of 8 families. On the other hand, families with no children have the lowest poverty rate of 0.0%, which includes 0 families.
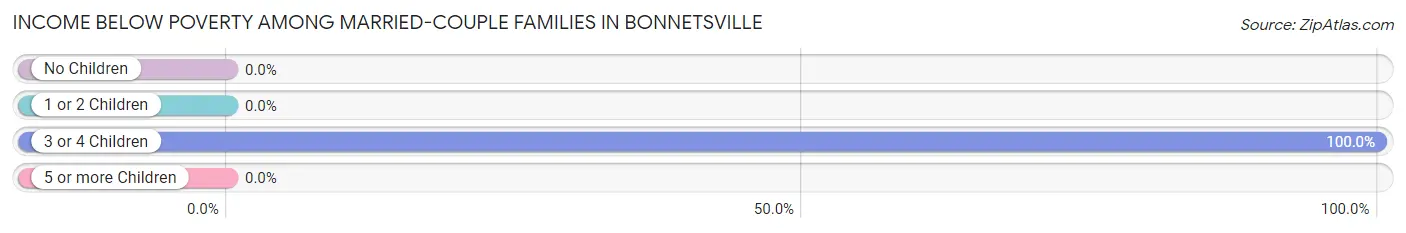
| Children | Above Poverty | Below Poverty |
| No Children | 36 (100.0%) | 0 (0.0%) |
| 1 or 2 Children | 16 (100.0%) | 0 (0.0%) |
| 3 or 4 Children | 0 (0.0%) | 8 (100.0%) |
| 5 or more Children | 0 (0.0%) | 0 (0.0%) |
| Total | 52 (86.7%) | 8 (13.3%) |
Income Below Poverty Among Single-Parent Households in Bonnetsville
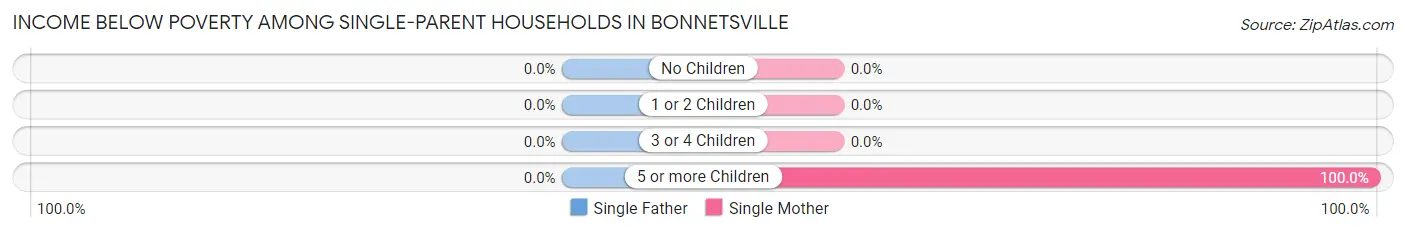
| Children | Single Father | Single Mother |
| No Children | 0 (0.0%) | 0 (0.0%) |
| 1 or 2 Children | 0 (0.0%) | 0 (0.0%) |
| 3 or 4 Children | 0 (0.0%) | 0 (0.0%) |
| 5 or more Children | 0 (0.0%) | 95 (100.0%) |
| Total | 0 (0.0%) | 95 (82.6%) |
Income Below Poverty Among Married-Couple vs Single-Parent Households in Bonnetsville
The poverty data for Bonnetsville shows that 8 of the married-couple family households (13.3%) and 95 of the single-parent households (49.7%) are living below the poverty level. Within the married-couple family households, those with 3 or 4 children have the highest poverty rate, with 8 households (100.0%) falling below the poverty line. Among the single-parent households, those with 5 or more children have the highest poverty rate, with 95 household (100.0%) living below poverty.
| Children | Married-Couple Families | Single-Parent Households |
| No Children | 0 (0.0%) | 0 (0.0%) |
| 1 or 2 Children | 0 (0.0%) | 0 (0.0%) |
| 3 or 4 Children | 8 (100.0%) | 0 (0.0%) |
| 5 or more Children | 0 (0.0%) | 95 (100.0%) |
| Total | 8 (13.3%) | 95 (49.7%) |
Employment Characteristics in Bonnetsville
Employment by Class of Employer in Bonnetsville
Among the 363 employed individuals in Bonnetsville, private company employees (167 | 46.0%), not-for-profit organizations (128 | 35.3%), and self-employed (not incorporated) (27 | 7.4%) make up the most common classes of employment.
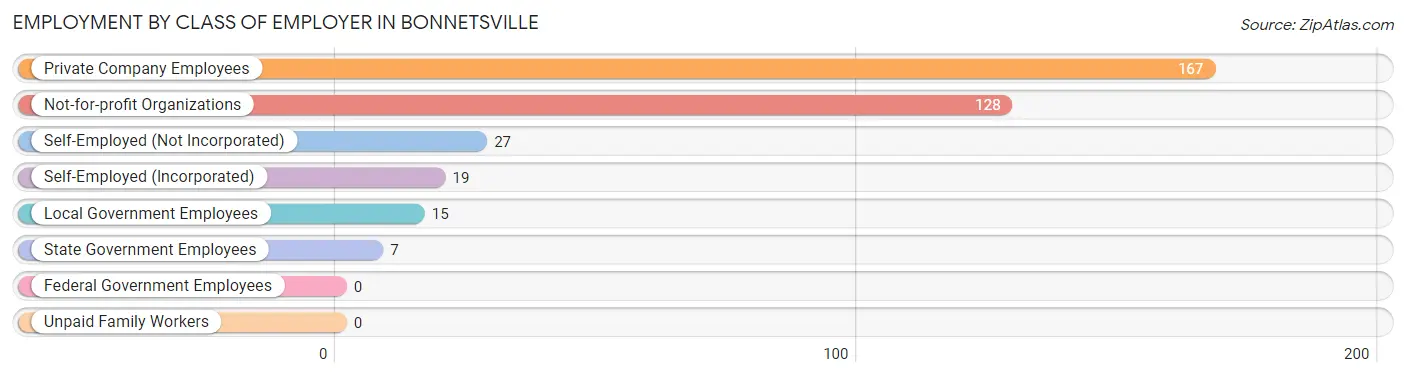
| Employer Class | # Employees | % Employees |
| Private Company Employees | 167 | 46.0% |
| Self-Employed (Incorporated) | 19 | 5.2% |
| Self-Employed (Not Incorporated) | 27 | 7.4% |
| Not-for-profit Organizations | 128 | 35.3% |
| Local Government Employees | 15 | 4.1% |
| State Government Employees | 7 | 1.9% |
| Federal Government Employees | 0 | 0.0% |
| Unpaid Family Workers | 0 | 0.0% |
| Total | 363 | 100.0% |
Employment Status by Age in Bonnetsville
According to the labor force statistics for Bonnetsville, out of the total population over 16 years of age (634), 60.1% or 381 individuals are in the labor force, with 4.5% or 17 of them unemployed. The age group with the highest labor force participation rate is 20 to 24 years, with 100.0% or 15 individuals in the labor force. Within the labor force, the 35 to 44 years age range has the highest percentage of unemployed individuals, with 10.1% or 17 of them being unemployed.
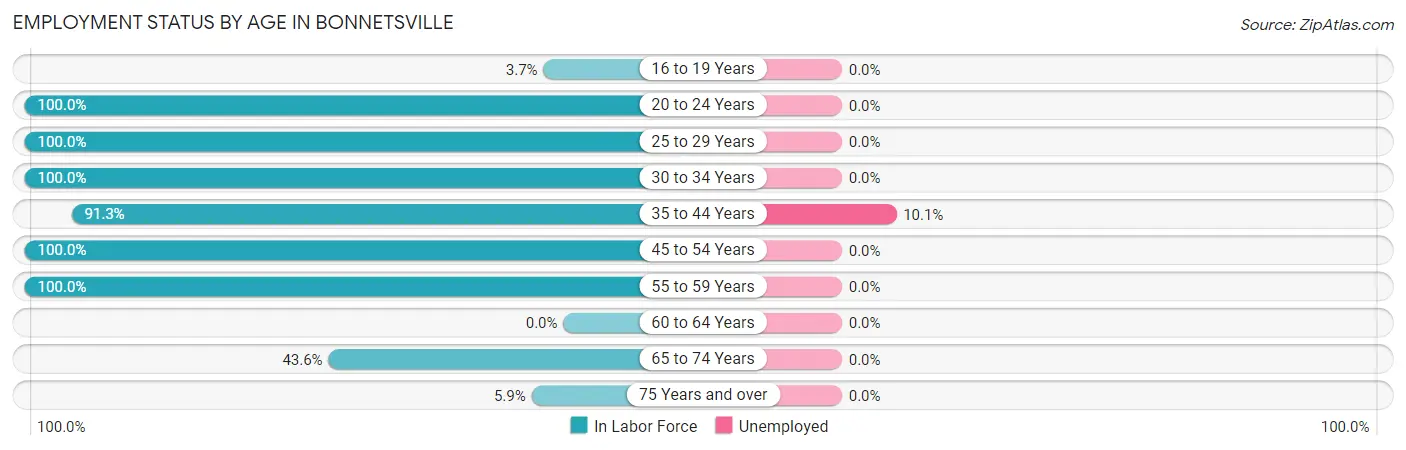
| Age Bracket | In Labor Force | Unemployed |
| 16 to 19 Years | 4 (3.7%) | 0 (0.0%) |
| 20 to 24 Years | 15 (100.0%) | 0 (0.0%) |
| 25 to 29 Years | 10 (100.0%) | 0 (0.0%) |
| 30 to 34 Years | 33 (100.0%) | 0 (0.0%) |
| 35 to 44 Years | 168 (91.3%) | 17 (10.1%) |
| 45 to 54 Years | 83 (100.0%) | 0 (0.0%) |
| 55 to 59 Years | 15 (100.0%) | 0 (0.0%) |
| 60 to 64 Years | 0 (0.0%) | 0 (0.0%) |
| 65 to 74 Years | 51 (43.6%) | 0 (0.0%) |
| 75 Years and over | 2 (5.9%) | 0 (0.0%) |
| Total | 381 (60.1%) | 17 (4.5%) |
Employment Status by Educational Attainment in Bonnetsville
According to labor force statistics for Bonnetsville, 86.1% of individuals (309) out of the total population between 25 and 64 years of age (359) are in the labor force, with 5.5% or 17 of them being unemployed. The group with the highest labor force participation rate are those with the educational attainment of less than high school, with 100.0% or 65 individuals in the labor force. Within the labor force, individuals with high school diploma education have the highest percentage of unemployment, with 21.0% or 13 of them being unemployed.
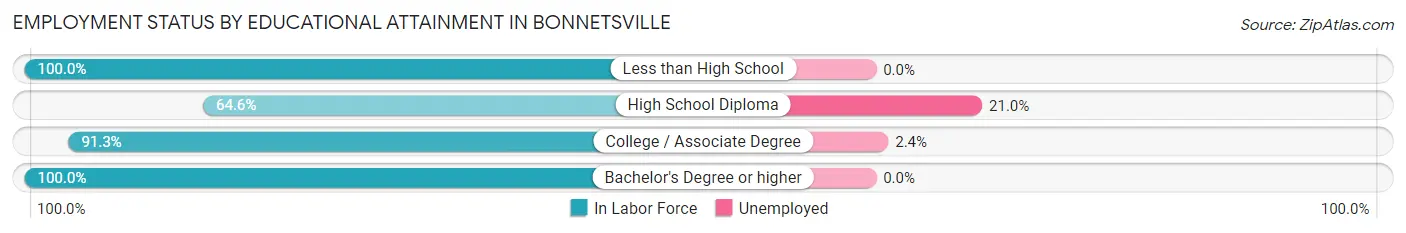
| Educational Attainment | In Labor Force | Unemployed |
| Less than High School | 65 (100.0%) | 0 (0.0%) |
| High School Diploma | 62 (64.6%) | 20 (21.0%) |
| College / Associate Degree | 167 (91.3%) | 4 (2.4%) |
| Bachelor's Degree or higher | 15 (100.0%) | 0 (0.0%) |
| Total | 309 (86.1%) | 20 (5.5%) |
Employment Occupations by Sex in Bonnetsville
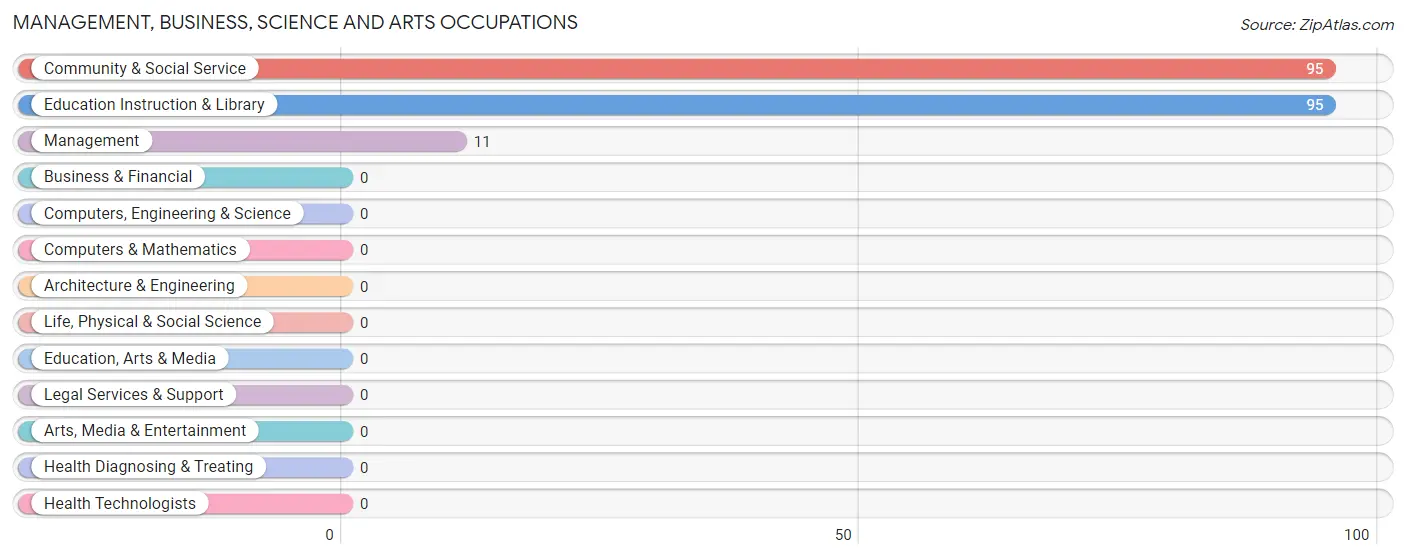
Management, Business, Science and Arts Occupations
The most common Management, Business, Science and Arts occupations in Bonnetsville are Community & Social Service (95 | 26.1%), Education Instruction & Library (95 | 26.1%), and Management (11 | 3.0%).
Management, Business, Science and Arts Occupations by Sex
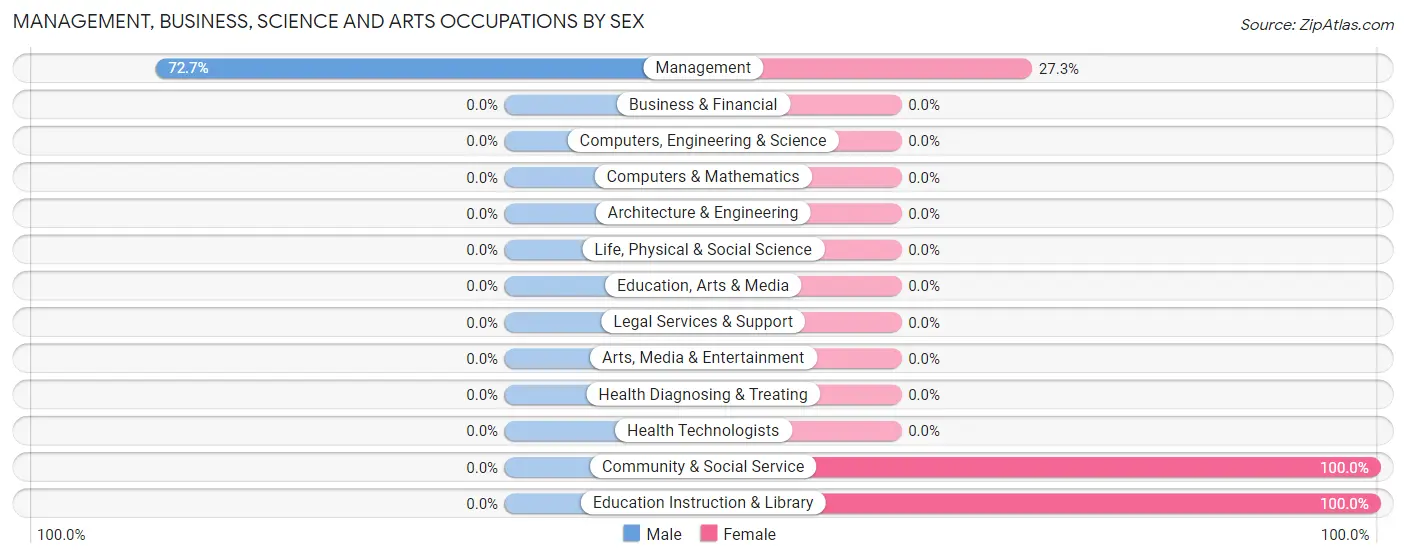
| Occupation | Male | Female |
| Management | 8 (72.7%) | 3 (27.3%) |
| Business & Financial | 0 (0.0%) | 0 (0.0%) |
| Computers, Engineering & Science | 0 (0.0%) | 0 (0.0%) |
| Computers & Mathematics | 0 (0.0%) | 0 (0.0%) |
| Architecture & Engineering | 0 (0.0%) | 0 (0.0%) |
| Life, Physical & Social Science | 0 (0.0%) | 0 (0.0%) |
| Community & Social Service | 0 (0.0%) | 95 (100.0%) |
| Education, Arts & Media | 0 (0.0%) | 0 (0.0%) |
| Legal Services & Support | 0 (0.0%) | 0 (0.0%) |
| Education Instruction & Library | 0 (0.0%) | 95 (100.0%) |
| Arts, Media & Entertainment | 0 (0.0%) | 0 (0.0%) |
| Health Diagnosing & Treating | 0 (0.0%) | 0 (0.0%) |
| Health Technologists | 0 (0.0%) | 0 (0.0%) |
| Total (Category) | 8 (7.5%) | 98 (92.4%) |
| Total (Overall) | 149 (40.9%) | 215 (59.1%) |
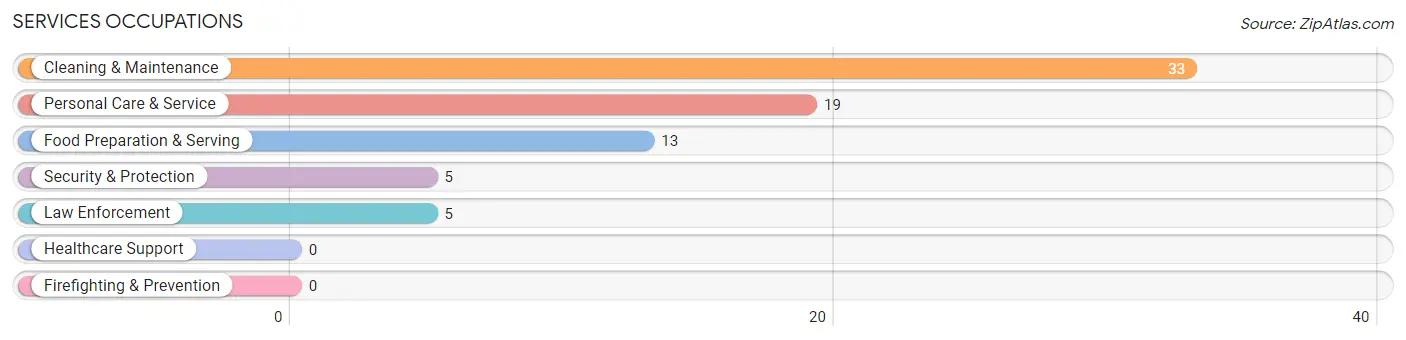
Services Occupations
The most common Services occupations in Bonnetsville are Cleaning & Maintenance (33 | 9.1%), Personal Care & Service (19 | 5.2%), Food Preparation & Serving (13 | 3.6%), Security & Protection (5 | 1.4%), and Law Enforcement (5 | 1.4%).
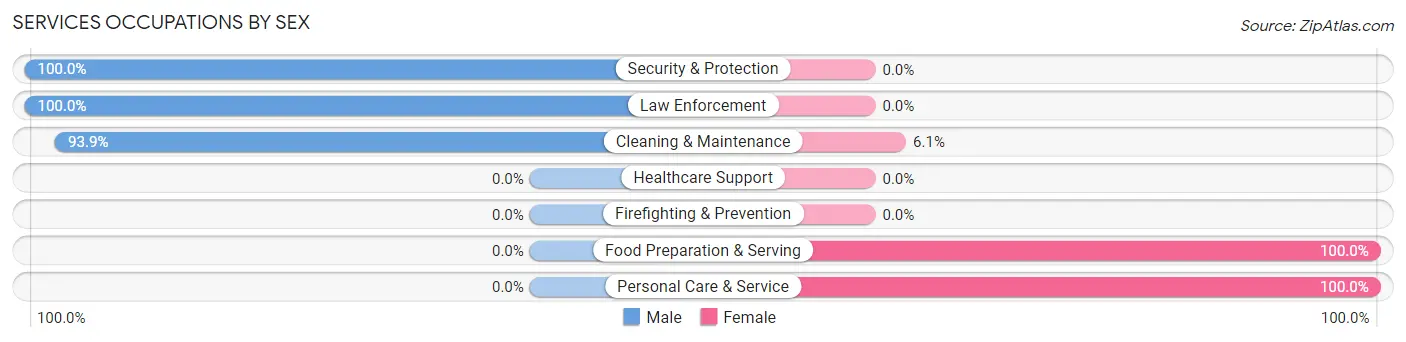
Services Occupations by Sex
Within the Services occupations in Bonnetsville, the most male-oriented occupations are Security & Protection (100.0%), Law Enforcement (100.0%), and Cleaning & Maintenance (93.9%), while the most female-oriented occupations are Food Preparation & Serving (100.0%), Personal Care & Service (100.0%), and Cleaning & Maintenance (6.1%).
| Occupation | Male | Female |
| Healthcare Support | 0 (0.0%) | 0 (0.0%) |
| Security & Protection | 5 (100.0%) | 0 (0.0%) |
| Firefighting & Prevention | 0 (0.0%) | 0 (0.0%) |
| Law Enforcement | 5 (100.0%) | 0 (0.0%) |
| Food Preparation & Serving | 0 (0.0%) | 13 (100.0%) |
| Cleaning & Maintenance | 31 (93.9%) | 2 (6.1%) |
| Personal Care & Service | 0 (0.0%) | 19 (100.0%) |
| Total (Category) | 36 (51.4%) | 34 (48.6%) |
| Total (Overall) | 149 (40.9%) | 215 (59.1%) |
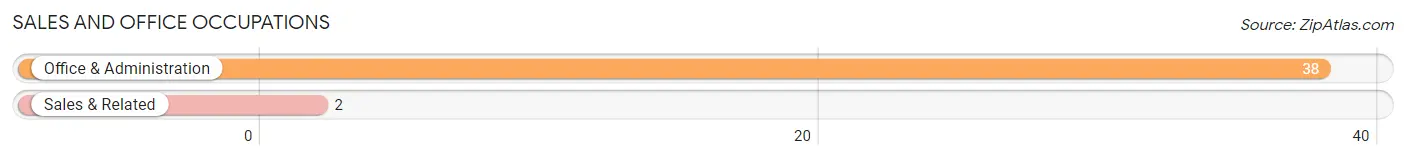
Sales and Office Occupations
The most common Sales and Office occupations in Bonnetsville are Office & Administration (38 | 10.4%), and Sales & Related (2 | 0.5%).
Sales and Office Occupations by Sex
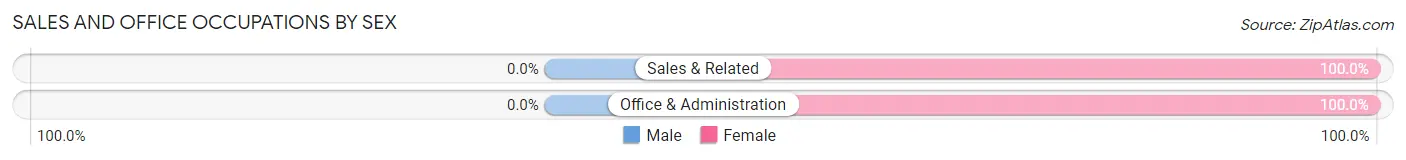
| Occupation | Male | Female |
| Sales & Related | 0 (0.0%) | 2 (100.0%) |
| Office & Administration | 0 (0.0%) | 38 (100.0%) |
| Total (Category) | 0 (0.0%) | 40 (100.0%) |
| Total (Overall) | 149 (40.9%) | 215 (59.1%) |
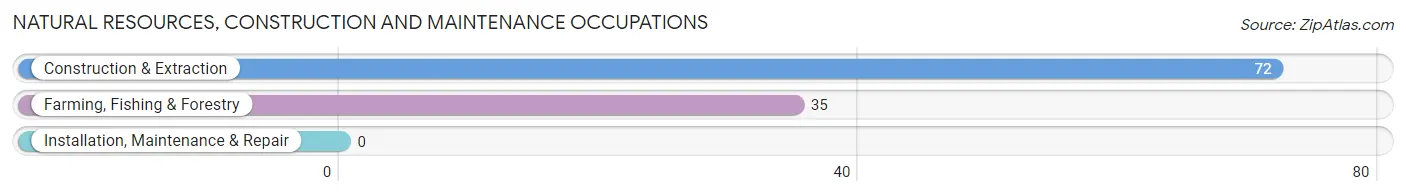
Natural Resources, Construction and Maintenance Occupations
The most common Natural Resources, Construction and Maintenance occupations in Bonnetsville are Construction & Extraction (72 | 19.8%), and Farming, Fishing & Forestry (35 | 9.6%).
Natural Resources, Construction and Maintenance Occupations by Sex
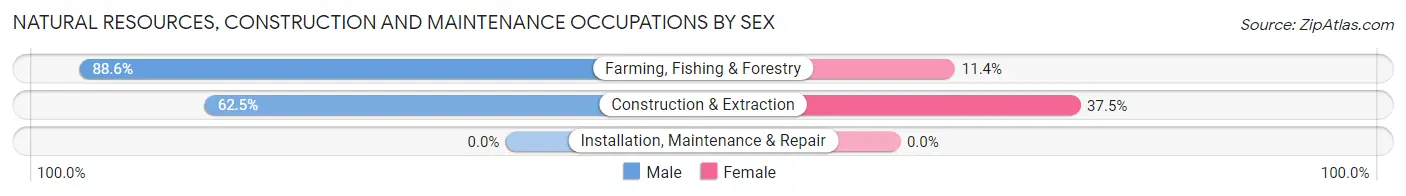
| Occupation | Male | Female |
| Farming, Fishing & Forestry | 31 (88.6%) | 4 (11.4%) |
| Construction & Extraction | 45 (62.5%) | 27 (37.5%) |
| Installation, Maintenance & Repair | 0 (0.0%) | 0 (0.0%) |
| Total (Category) | 76 (71.0%) | 31 (29.0%) |
| Total (Overall) | 149 (40.9%) | 215 (59.1%) |
Production, Transportation and Moving Occupations
The most common Production, Transportation and Moving occupations in Bonnetsville are Production (31 | 8.5%), and Material Moving (10 | 2.8%).
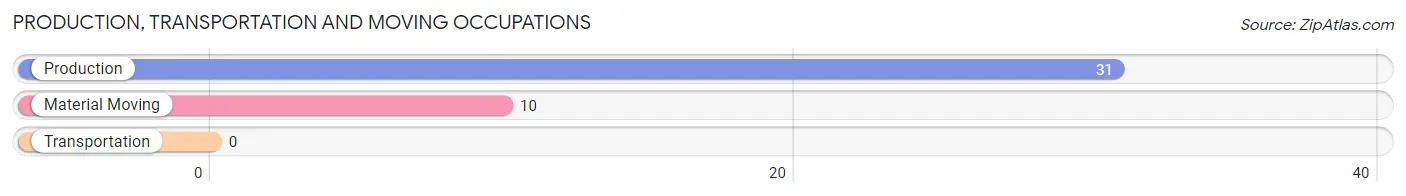
Production, Transportation and Moving Occupations by Sex
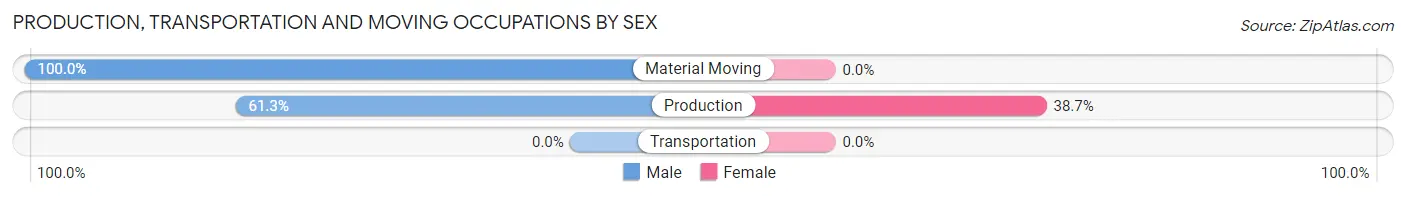
| Occupation | Male | Female |
| Production | 19 (61.3%) | 12 (38.7%) |
| Transportation | 0 (0.0%) | 0 (0.0%) |
| Material Moving | 10 (100.0%) | 0 (0.0%) |
| Total (Category) | 29 (70.7%) | 12 (29.3%) |
| Total (Overall) | 149 (40.9%) | 215 (59.1%) |
Employment Industries by Sex in Bonnetsville
Employment Industries in Bonnetsville
The major employment industries in Bonnetsville include Health Care & Social Assistance (130 | 35.7%), Construction (72 | 19.8%), Agriculture, Fishing & Hunting (46 | 12.6%), Manufacturing (30 | 8.2%), and Public Administration (20 | 5.5%).
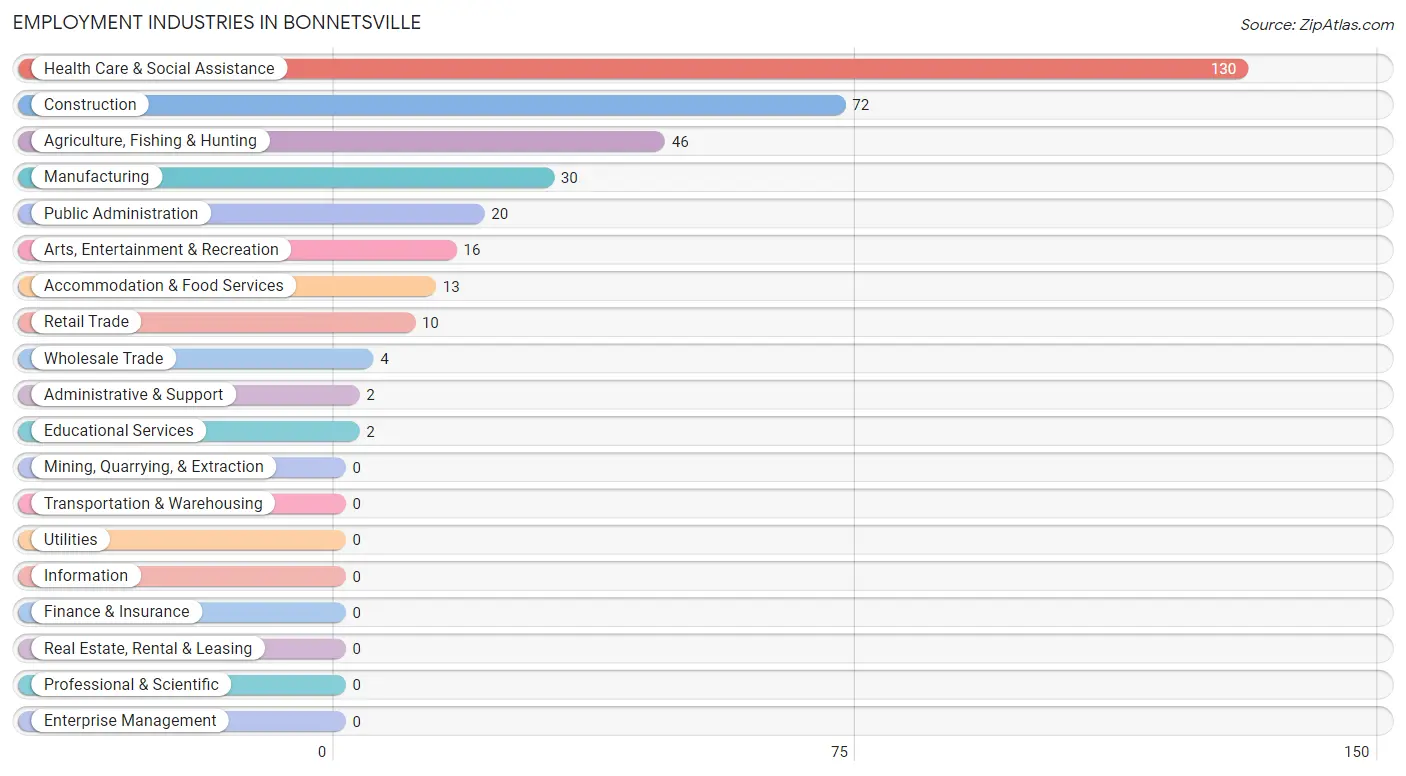
Employment Industries by Sex in Bonnetsville
The Bonnetsville industries that see more men than women are Retail Trade (100.0%), Arts, Entertainment & Recreation (100.0%), and Agriculture, Fishing & Hunting (84.8%), whereas the industries that tend to have a higher number of women are Wholesale Trade (100.0%), Administrative & Support (100.0%), and Educational Services (100.0%).
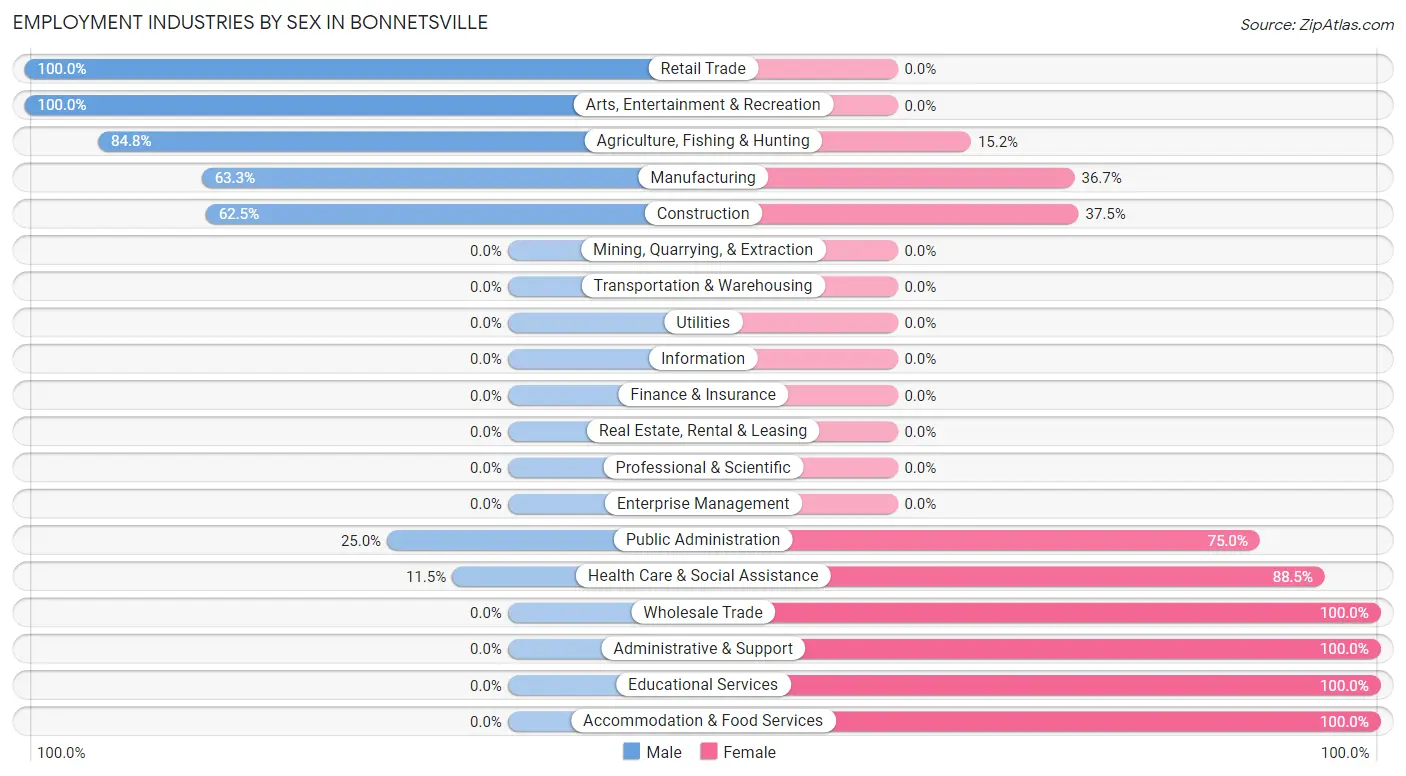
| Industry | Male | Female |
| Agriculture, Fishing & Hunting | 39 (84.8%) | 7 (15.2%) |
| Mining, Quarrying, & Extraction | 0 (0.0%) | 0 (0.0%) |
| Construction | 45 (62.5%) | 27 (37.5%) |
| Manufacturing | 19 (63.3%) | 11 (36.7%) |
| Wholesale Trade | 0 (0.0%) | 4 (100.0%) |
| Retail Trade | 10 (100.0%) | 0 (0.0%) |
| Transportation & Warehousing | 0 (0.0%) | 0 (0.0%) |
| Utilities | 0 (0.0%) | 0 (0.0%) |
| Information | 0 (0.0%) | 0 (0.0%) |
| Finance & Insurance | 0 (0.0%) | 0 (0.0%) |
| Real Estate, Rental & Leasing | 0 (0.0%) | 0 (0.0%) |
| Professional & Scientific | 0 (0.0%) | 0 (0.0%) |
| Enterprise Management | 0 (0.0%) | 0 (0.0%) |
| Administrative & Support | 0 (0.0%) | 2 (100.0%) |
| Educational Services | 0 (0.0%) | 2 (100.0%) |
| Health Care & Social Assistance | 15 (11.5%) | 115 (88.5%) |
| Arts, Entertainment & Recreation | 16 (100.0%) | 0 (0.0%) |
| Accommodation & Food Services | 0 (0.0%) | 13 (100.0%) |
| Public Administration | 5 (25.0%) | 15 (75.0%) |
| Total | 149 (40.9%) | 215 (59.1%) |
Education in Bonnetsville
School Enrollment in Bonnetsville
The most common levels of schooling among the 786 students in Bonnetsville are middle school (360 | 45.8%), elementary school (182 | 23.2%), and high school (180 | 22.9%).
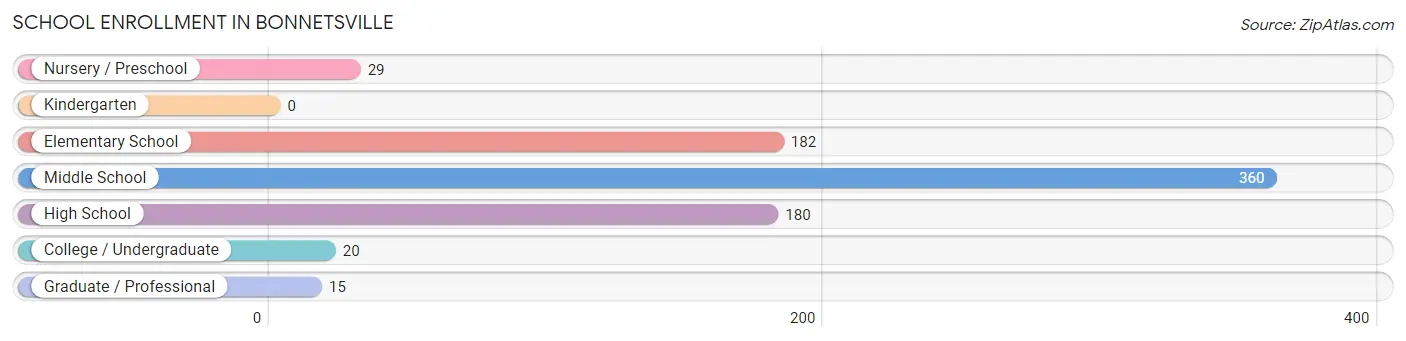
| School Level | # Students | % Students |
| Nursery / Preschool | 29 | 3.7% |
| Kindergarten | 0 | 0.0% |
| Elementary School | 182 | 23.2% |
| Middle School | 360 | 45.8% |
| High School | 180 | 22.9% |
| College / Undergraduate | 20 | 2.5% |
| Graduate / Professional | 15 | 1.9% |
| Total | 786 | 100.0% |
School Enrollment by Age by Funding Source in Bonnetsville
Out of a total of 786 students who are enrolled in schools in Bonnetsville, 4 (0.5%) attend a private institution, while the remaining 782 (99.5%) are enrolled in public schools. The age group of 10 to 14 year olds has the highest likelihood of being enrolled in private schools, with 4 (1.1% in the age bracket) enrolled. Conversely, the age group of 3 to 4 year olds has the lowest likelihood of being enrolled in a private school, with 29 (100.0% in the age bracket) attending a public institution.
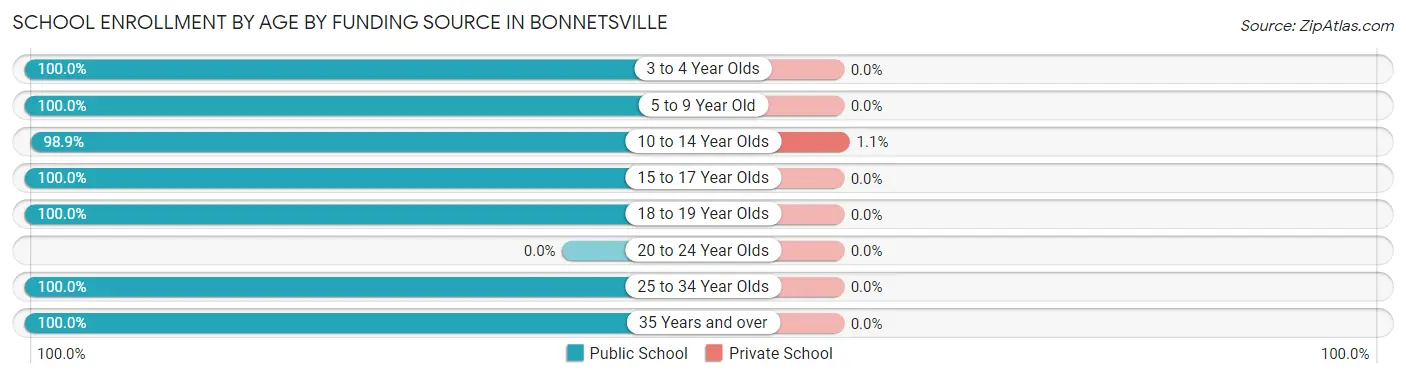
| Age Bracket | Public School | Private School |
| 3 to 4 Year Olds | 29 (100.0%) | 0 (0.0%) |
| 5 to 9 Year Old | 182 (100.0%) | 0 (0.0%) |
| 10 to 14 Year Olds | 356 (98.9%) | 4 (1.1%) |
| 15 to 17 Year Olds | 140 (100.0%) | 0 (0.0%) |
| 18 to 19 Year Olds | 29 (100.0%) | 0 (0.0%) |
| 20 to 24 Year Olds | 0 (0.0%) | 0 (0.0%) |
| 25 to 34 Year Olds | 10 (100.0%) | 0 (0.0%) |
| 35 Years and over | 36 (100.0%) | 0 (0.0%) |
| Total | 782 (99.5%) | 4 (0.5%) |
Educational Attainment by Field of Study in Bonnetsville
Bio, nature & agricultural (15 | 60.0%), and business (10 | 40.0%) are the most common fields of study among 25 individuals in Bonnetsville who have obtained a bachelor's degree or higher.
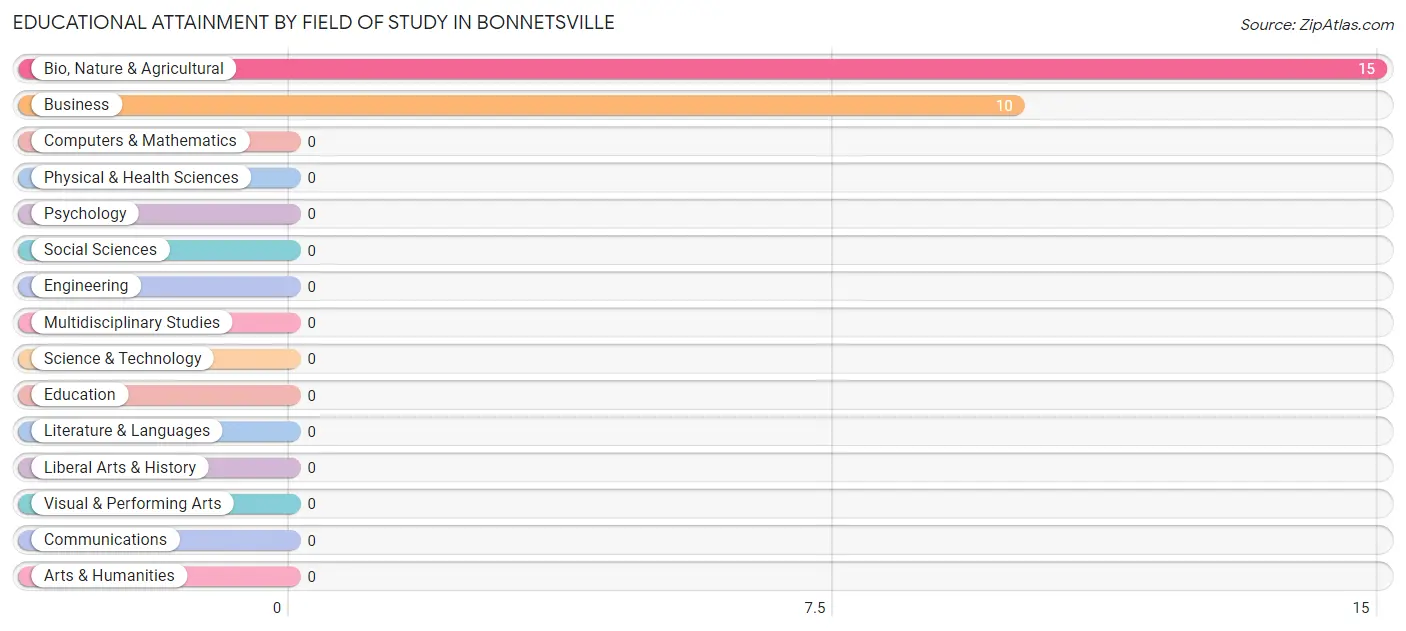
| Field of Study | # Graduates | % Graduates |
| Computers & Mathematics | 0 | 0.0% |
| Bio, Nature & Agricultural | 15 | 60.0% |
| Physical & Health Sciences | 0 | 0.0% |
| Psychology | 0 | 0.0% |
| Social Sciences | 0 | 0.0% |
| Engineering | 0 | 0.0% |
| Multidisciplinary Studies | 0 | 0.0% |
| Science & Technology | 0 | 0.0% |
| Business | 10 | 40.0% |
| Education | 0 | 0.0% |
| Literature & Languages | 0 | 0.0% |
| Liberal Arts & History | 0 | 0.0% |
| Visual & Performing Arts | 0 | 0.0% |
| Communications | 0 | 0.0% |
| Arts & Humanities | 0 | 0.0% |
| Total | 25 | 100.0% |
Transportation & Commute in Bonnetsville
Vehicle Availability by Sex in Bonnetsville
The most prevalent vehicle ownership categories in Bonnetsville are males with 1 vehicle (49, accounting for 32.9%) and females with 1 vehicle (0, making up 22.9%).
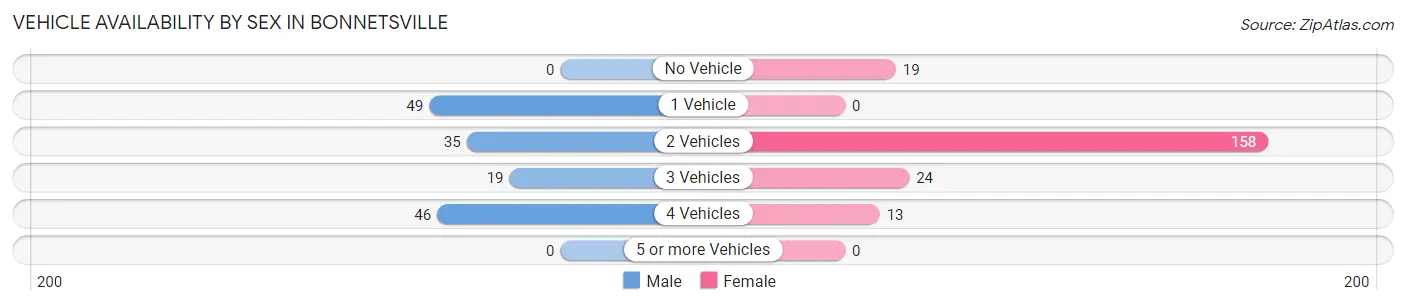
| Vehicles Available | Male | Female |
| No Vehicle | 0 (0.0%) | 19 (8.9%) |
| 1 Vehicle | 49 (32.9%) | 0 (0.0%) |
| 2 Vehicles | 35 (23.5%) | 158 (73.8%) |
| 3 Vehicles | 19 (12.8%) | 24 (11.2%) |
| 4 Vehicles | 46 (30.9%) | 13 (6.1%) |
| 5 or more Vehicles | 0 (0.0%) | 0 (0.0%) |
| Total | 149 (100.0%) | 214 (100.0%) |
Commute Time in Bonnetsville
The most frequently occuring commute durations in Bonnetsville are 15 to 19 minutes (193 commuters, 53.2%), 20 to 24 minutes (63 commuters, 17.4%), and 10 to 14 minutes (62 commuters, 17.1%).
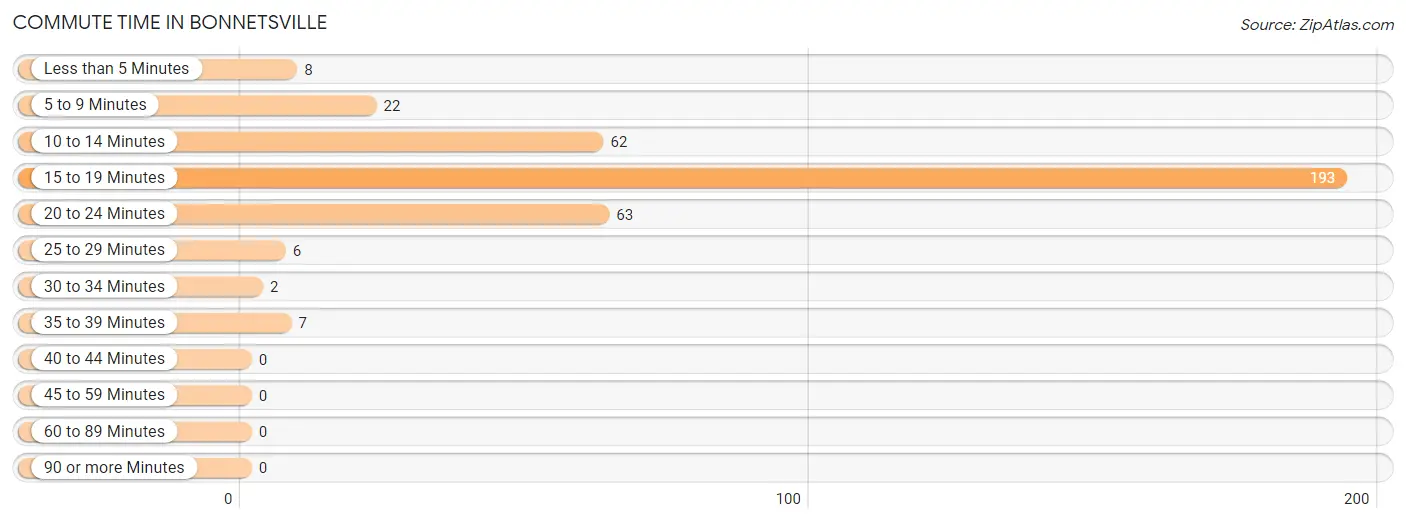
| Commute Time | # Commuters | % Commuters |
| Less than 5 Minutes | 8 | 2.2% |
| 5 to 9 Minutes | 22 | 6.1% |
| 10 to 14 Minutes | 62 | 17.1% |
| 15 to 19 Minutes | 193 | 53.2% |
| 20 to 24 Minutes | 63 | 17.4% |
| 25 to 29 Minutes | 6 | 1.7% |
| 30 to 34 Minutes | 2 | 0.5% |
| 35 to 39 Minutes | 7 | 1.9% |
| 40 to 44 Minutes | 0 | 0.0% |
| 45 to 59 Minutes | 0 | 0.0% |
| 60 to 89 Minutes | 0 | 0.0% |
| 90 or more Minutes | 0 | 0.0% |
Commute Time by Sex in Bonnetsville
The most common commute times in Bonnetsville are 15 to 19 minutes (64 commuters, 42.9%) for males and 15 to 19 minutes (129 commuters, 60.3%) for females.
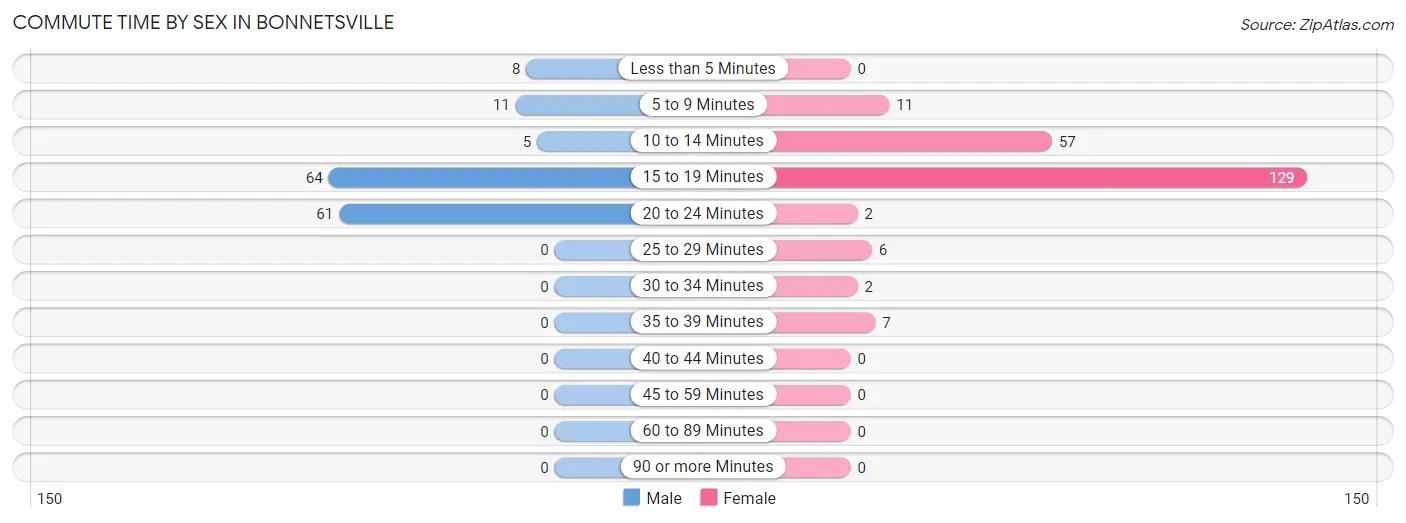
| Commute Time | Male | Female |
| Less than 5 Minutes | 8 (5.4%) | 0 (0.0%) |
| 5 to 9 Minutes | 11 (7.4%) | 11 (5.1%) |
| 10 to 14 Minutes | 5 (3.4%) | 57 (26.6%) |
| 15 to 19 Minutes | 64 (42.9%) | 129 (60.3%) |
| 20 to 24 Minutes | 61 (40.9%) | 2 (0.9%) |
| 25 to 29 Minutes | 0 (0.0%) | 6 (2.8%) |
| 30 to 34 Minutes | 0 (0.0%) | 2 (0.9%) |
| 35 to 39 Minutes | 0 (0.0%) | 7 (3.3%) |
| 40 to 44 Minutes | 0 (0.0%) | 0 (0.0%) |
| 45 to 59 Minutes | 0 (0.0%) | 0 (0.0%) |
| 60 to 89 Minutes | 0 (0.0%) | 0 (0.0%) |
| 90 or more Minutes | 0 (0.0%) | 0 (0.0%) |
Time of Departure to Work by Sex in Bonnetsville
The most frequent times of departure to work in Bonnetsville are 7:00 AM to 7:29 AM (85, 57.1%) for males and 5:00 AM to 5:29 AM (122, 57.0%) for females.
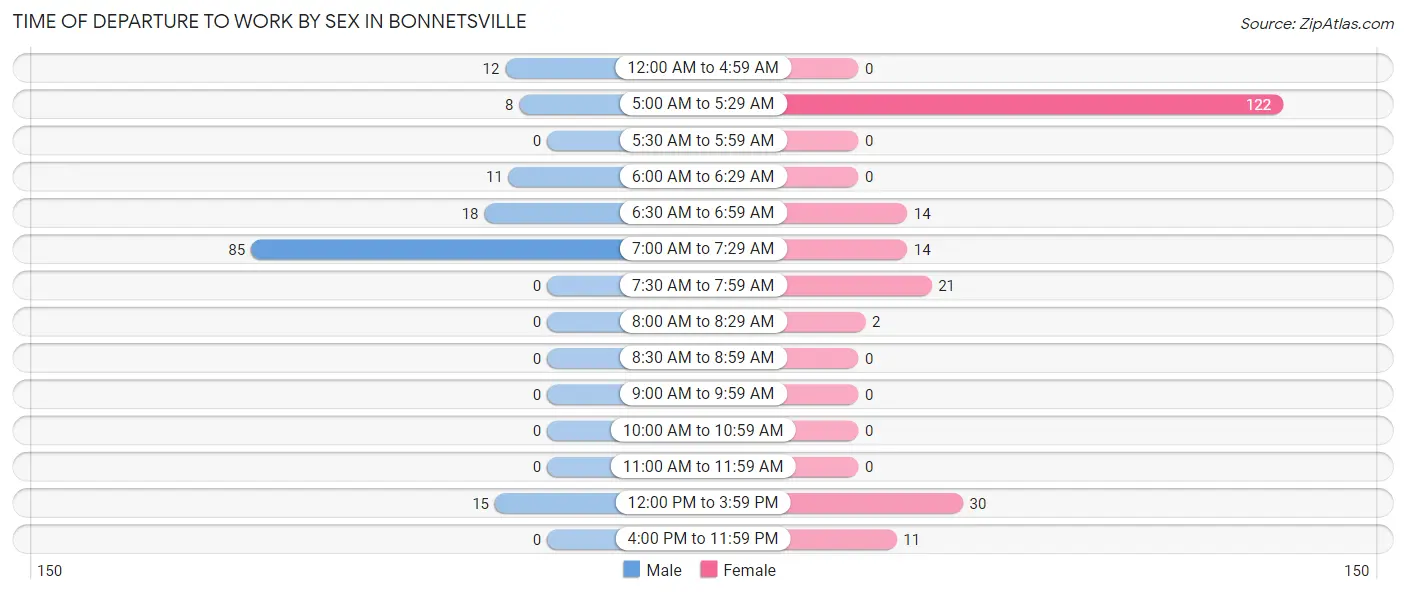
| Time of Departure | Male | Female |
| 12:00 AM to 4:59 AM | 12 (8.1%) | 0 (0.0%) |
| 5:00 AM to 5:29 AM | 8 (5.4%) | 122 (57.0%) |
| 5:30 AM to 5:59 AM | 0 (0.0%) | 0 (0.0%) |
| 6:00 AM to 6:29 AM | 11 (7.4%) | 0 (0.0%) |
| 6:30 AM to 6:59 AM | 18 (12.1%) | 14 (6.5%) |
| 7:00 AM to 7:29 AM | 85 (57.1%) | 14 (6.5%) |
| 7:30 AM to 7:59 AM | 0 (0.0%) | 21 (9.8%) |
| 8:00 AM to 8:29 AM | 0 (0.0%) | 2 (0.9%) |
| 8:30 AM to 8:59 AM | 0 (0.0%) | 0 (0.0%) |
| 9:00 AM to 9:59 AM | 0 (0.0%) | 0 (0.0%) |
| 10:00 AM to 10:59 AM | 0 (0.0%) | 0 (0.0%) |
| 11:00 AM to 11:59 AM | 0 (0.0%) | 0 (0.0%) |
| 12:00 PM to 3:59 PM | 15 (10.1%) | 30 (14.0%) |
| 4:00 PM to 11:59 PM | 0 (0.0%) | 11 (5.1%) |
| Total | 149 (100.0%) | 214 (100.0%) |
Housing Occupancy in Bonnetsville
Occupancy by Ownership in Bonnetsville
Of the total 339 dwellings in Bonnetsville, owner-occupied units account for 161 (47.5%), while renter-occupied units make up 178 (52.5%).
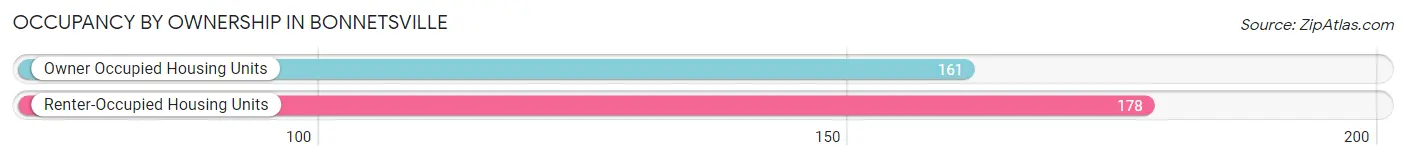
| Occupancy | # Housing Units | % Housing Units |
| Owner Occupied Housing Units | 161 | 47.5% |
| Renter-Occupied Housing Units | 178 | 52.5% |
| Total Occupied Housing Units | 339 | 100.0% |
Occupancy by Household Size in Bonnetsville
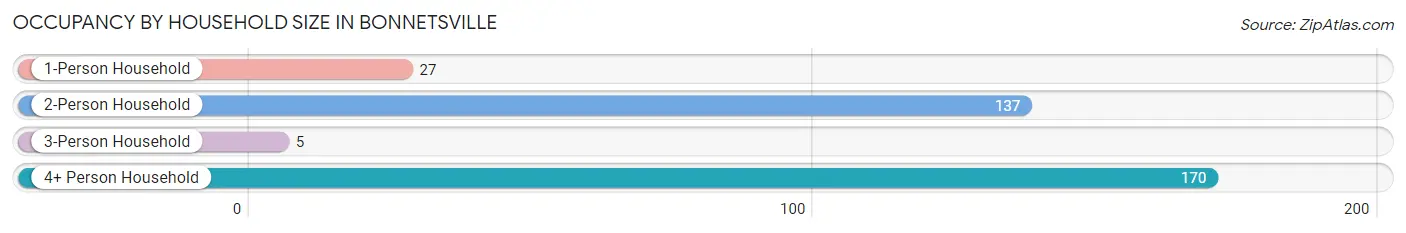
| Household Size | # Housing Units | % Housing Units |
| 1-Person Household | 27 | 8.0% |
| 2-Person Household | 137 | 40.4% |
| 3-Person Household | 5 | 1.5% |
| 4+ Person Household | 170 | 50.1% |
| Total Housing Units | 339 | 100.0% |
Occupancy by Ownership by Household Size in Bonnetsville
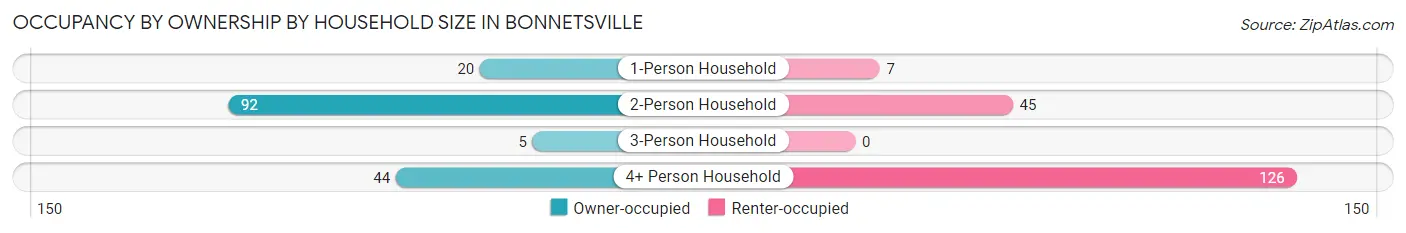
| Household Size | Owner-occupied | Renter-occupied |
| 1-Person Household | 20 (74.1%) | 7 (25.9%) |
| 2-Person Household | 92 (67.1%) | 45 (32.9%) |
| 3-Person Household | 5 (100.0%) | 0 (0.0%) |
| 4+ Person Household | 44 (25.9%) | 126 (74.1%) |
| Total Housing Units | 161 (47.5%) | 178 (52.5%) |
Occupancy by Educational Attainment in Bonnetsville
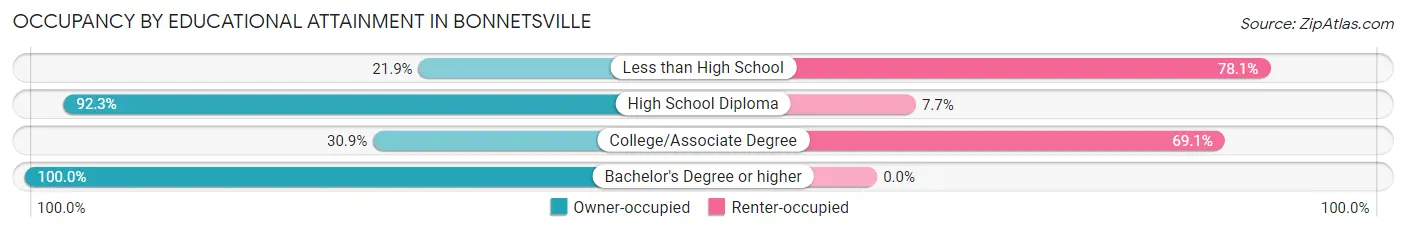
| Household Size | Owner-occupied | Renter-occupied |
| Less than High School | 16 (21.9%) | 57 (78.1%) |
| High School Diploma | 84 (92.3%) | 7 (7.7%) |
| College/Associate Degree | 51 (30.9%) | 114 (69.1%) |
| Bachelor's Degree or higher | 10 (100.0%) | 0 (0.0%) |
Occupancy by Age of Householder in Bonnetsville
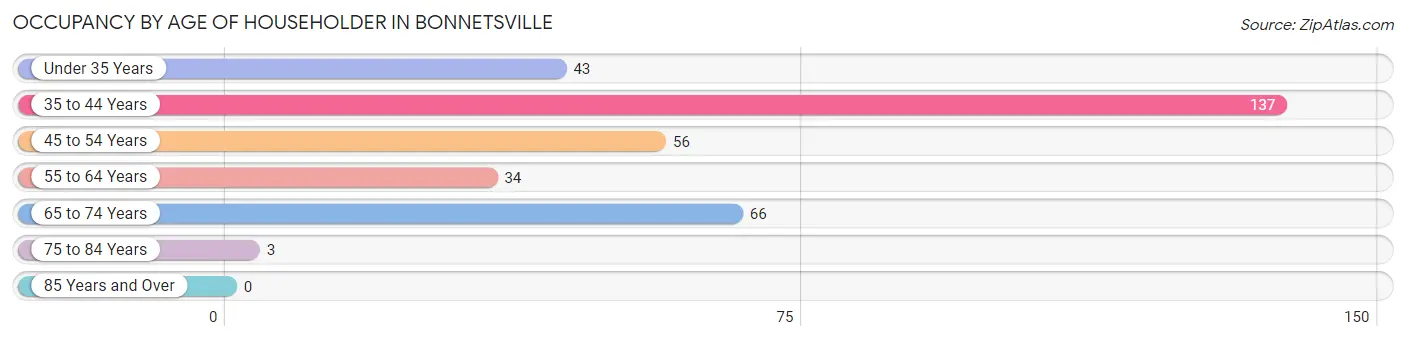
| Age Bracket | # Households | % Households |
| Under 35 Years | 43 | 12.7% |
| 35 to 44 Years | 137 | 40.4% |
| 45 to 54 Years | 56 | 16.5% |
| 55 to 64 Years | 34 | 10.0% |
| 65 to 74 Years | 66 | 19.5% |
| 75 to 84 Years | 3 | 0.9% |
| 85 Years and Over | 0 | 0.0% |
| Total | 339 | 100.0% |
Housing Finances in Bonnetsville
Median Income by Occupancy in Bonnetsville
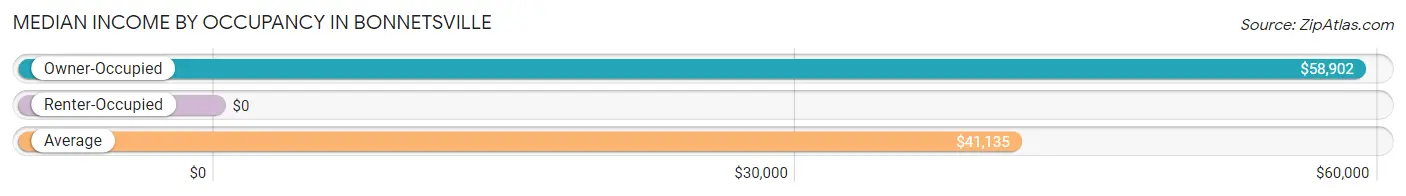
| Occupancy Type | # Households | Median Income |
| Owner-Occupied | 161 (47.5%) | $58,902 |
| Renter-Occupied | 178 (52.5%) | $0 |
| Average | 339 (100.0%) | $41,135 |
Occupancy by Householder Income Bracket in Bonnetsville
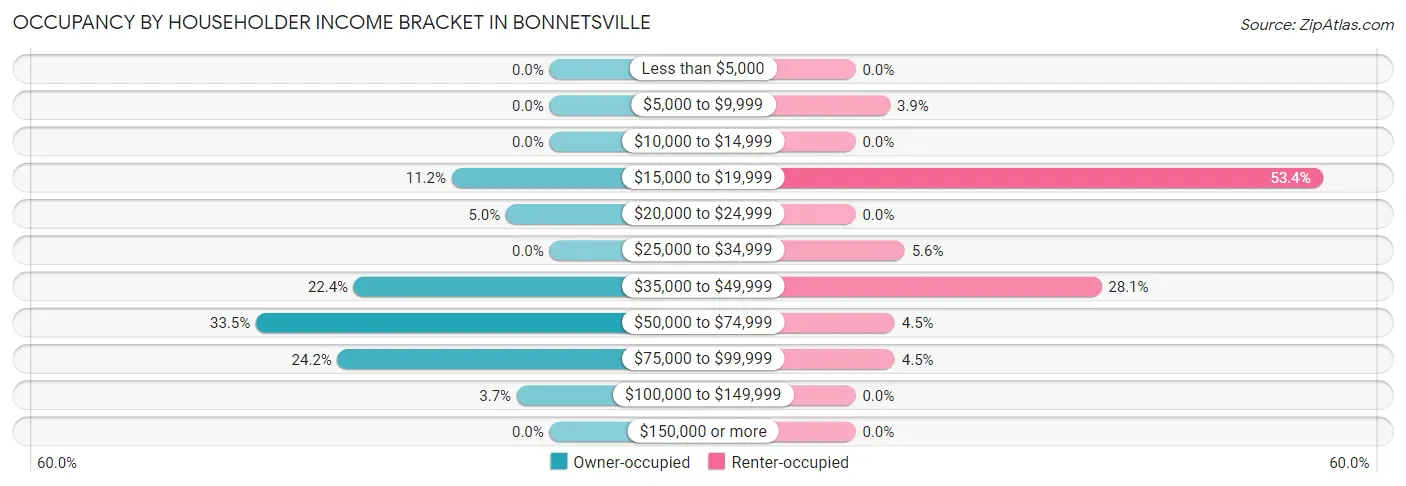
| Income Bracket | Owner-occupied | Renter-occupied |
| Less than $5,000 | 0 (0.0%) | 0 (0.0%) |
| $5,000 to $9,999 | 0 (0.0%) | 7 (3.9%) |
| $10,000 to $14,999 | 0 (0.0%) | 0 (0.0%) |
| $15,000 to $19,999 | 18 (11.2%) | 95 (53.4%) |
| $20,000 to $24,999 | 8 (5.0%) | 0 (0.0%) |
| $25,000 to $34,999 | 0 (0.0%) | 10 (5.6%) |
| $35,000 to $49,999 | 36 (22.4%) | 50 (28.1%) |
| $50,000 to $74,999 | 54 (33.5%) | 8 (4.5%) |
| $75,000 to $99,999 | 39 (24.2%) | 8 (4.5%) |
| $100,000 to $149,999 | 6 (3.7%) | 0 (0.0%) |
| $150,000 or more | 0 (0.0%) | 0 (0.0%) |
| Total | 161 (100.0%) | 178 (100.0%) |
Monthly Housing Cost Tiers in Bonnetsville
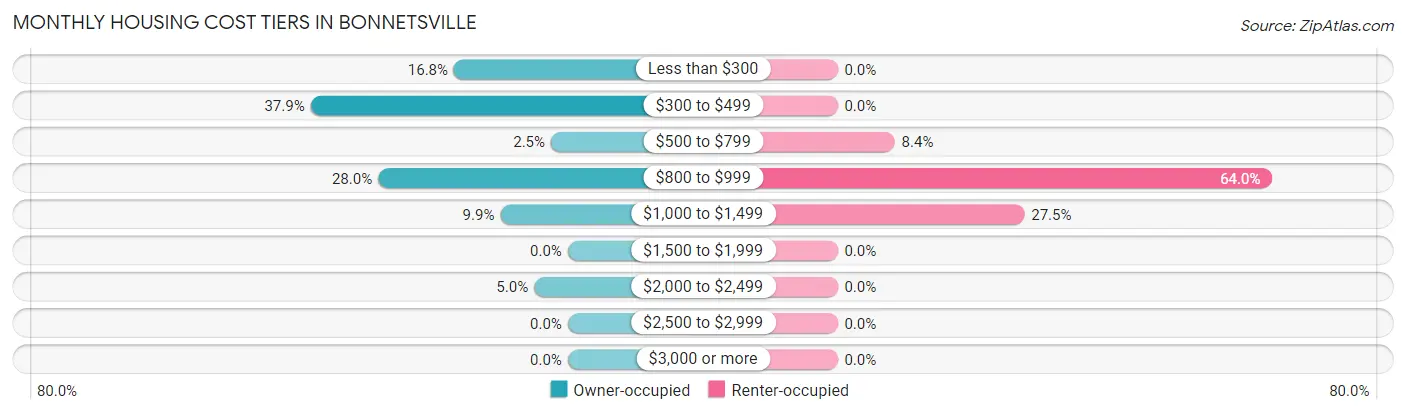
| Monthly Cost | Owner-occupied | Renter-occupied |
| Less than $300 | 27 (16.8%) | 0 (0.0%) |
| $300 to $499 | 61 (37.9%) | 0 (0.0%) |
| $500 to $799 | 4 (2.5%) | 15 (8.4%) |
| $800 to $999 | 45 (28.0%) | 114 (64.0%) |
| $1,000 to $1,499 | 16 (9.9%) | 49 (27.5%) |
| $1,500 to $1,999 | 0 (0.0%) | 0 (0.0%) |
| $2,000 to $2,499 | 8 (5.0%) | 0 (0.0%) |
| $2,500 to $2,999 | 0 (0.0%) | 0 (0.0%) |
| $3,000 or more | 0 (0.0%) | 0 (0.0%) |
| Total | 161 (100.0%) | 178 (100.0%) |
Physical Housing Characteristics in Bonnetsville
Housing Structures in Bonnetsville
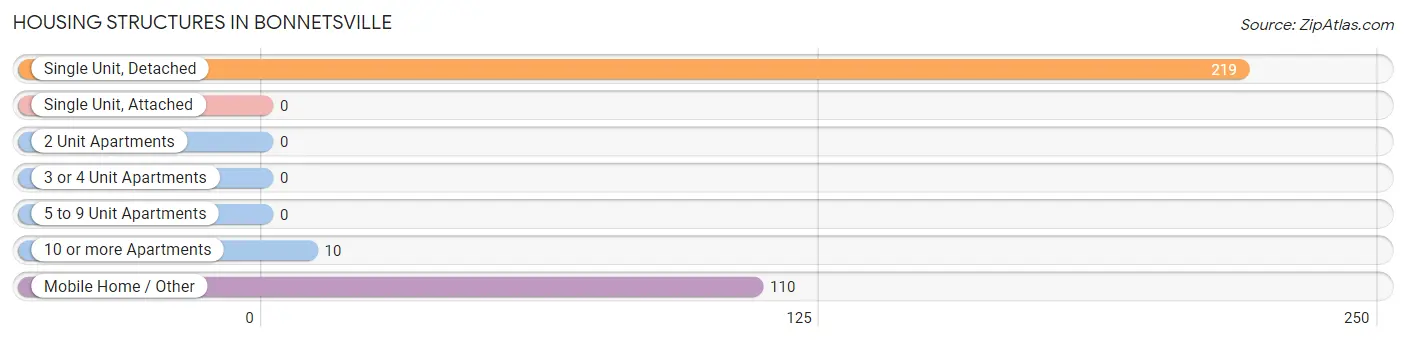
| Structure Type | # Housing Units | % Housing Units |
| Single Unit, Detached | 219 | 64.6% |
| Single Unit, Attached | 0 | 0.0% |
| 2 Unit Apartments | 0 | 0.0% |
| 3 or 4 Unit Apartments | 0 | 0.0% |
| 5 to 9 Unit Apartments | 0 | 0.0% |
| 10 or more Apartments | 10 | 2.9% |
| Mobile Home / Other | 110 | 32.5% |
| Total | 339 | 100.0% |
Housing Structures by Occupancy in Bonnetsville
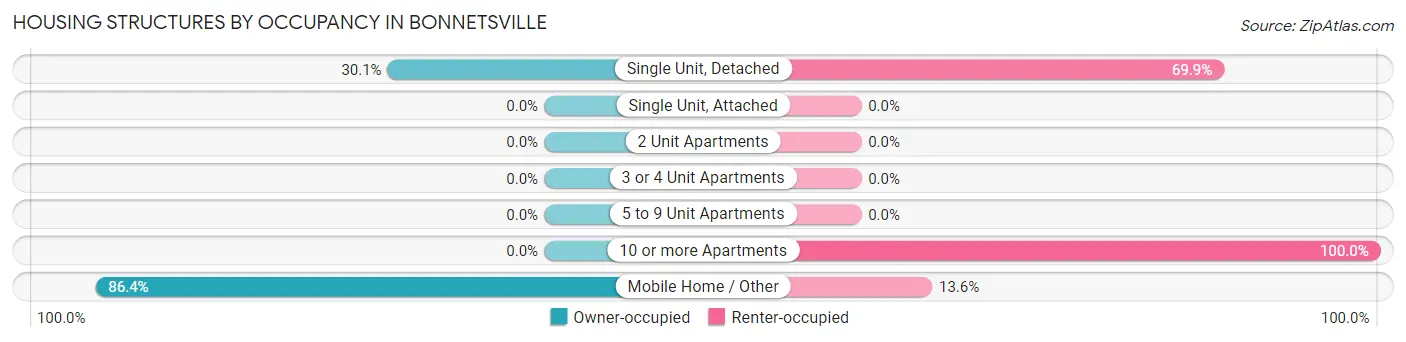
| Structure Type | Owner-occupied | Renter-occupied |
| Single Unit, Detached | 66 (30.1%) | 153 (69.9%) |
| Single Unit, Attached | 0 (0.0%) | 0 (0.0%) |
| 2 Unit Apartments | 0 (0.0%) | 0 (0.0%) |
| 3 or 4 Unit Apartments | 0 (0.0%) | 0 (0.0%) |
| 5 to 9 Unit Apartments | 0 (0.0%) | 0 (0.0%) |
| 10 or more Apartments | 0 (0.0%) | 10 (100.0%) |
| Mobile Home / Other | 95 (86.4%) | 15 (13.6%) |
| Total | 161 (47.5%) | 178 (52.5%) |
Housing Structures by Number of Rooms in Bonnetsville
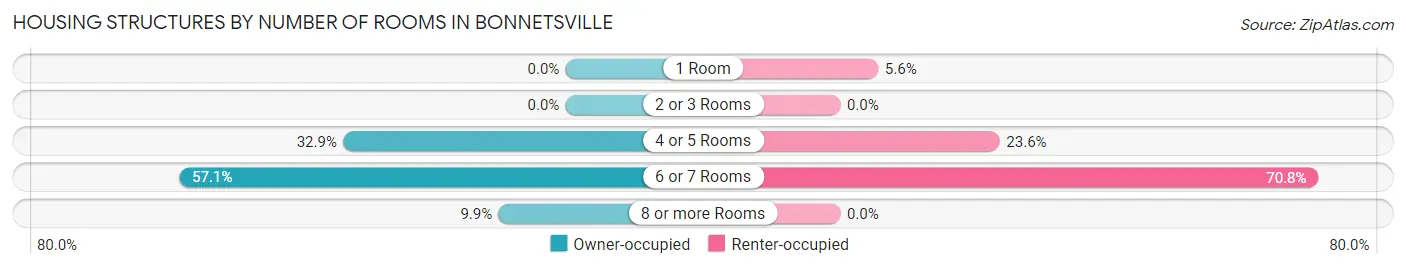
| Number of Rooms | Owner-occupied | Renter-occupied |
| 1 Room | 0 (0.0%) | 10 (5.6%) |
| 2 or 3 Rooms | 0 (0.0%) | 0 (0.0%) |
| 4 or 5 Rooms | 53 (32.9%) | 42 (23.6%) |
| 6 or 7 Rooms | 92 (57.1%) | 126 (70.8%) |
| 8 or more Rooms | 16 (9.9%) | 0 (0.0%) |
| Total | 161 (100.0%) | 178 (100.0%) |
Housing Structure by Heating Type in Bonnetsville
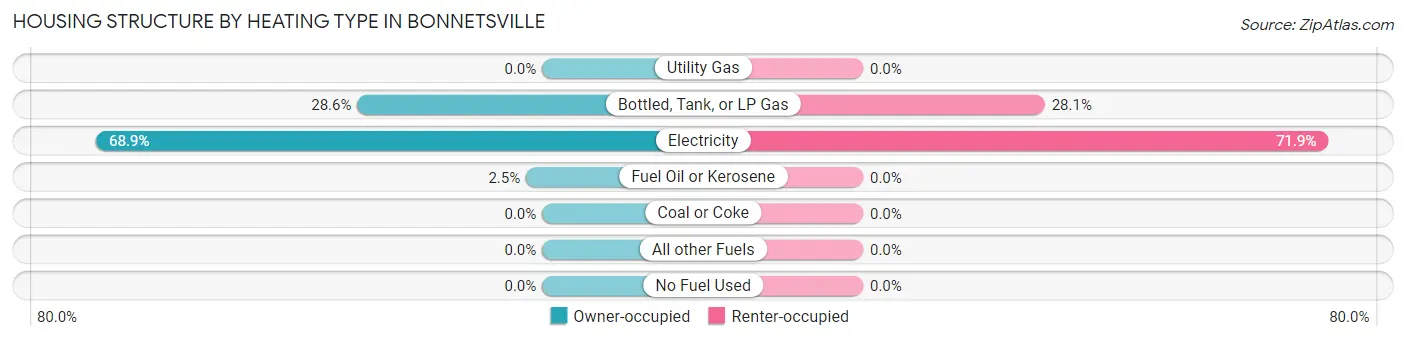
| Heating Type | Owner-occupied | Renter-occupied |
| Utility Gas | 0 (0.0%) | 0 (0.0%) |
| Bottled, Tank, or LP Gas | 46 (28.6%) | 50 (28.1%) |
| Electricity | 111 (68.9%) | 128 (71.9%) |
| Fuel Oil or Kerosene | 4 (2.5%) | 0 (0.0%) |
| Coal or Coke | 0 (0.0%) | 0 (0.0%) |
| All other Fuels | 0 (0.0%) | 0 (0.0%) |
| No Fuel Used | 0 (0.0%) | 0 (0.0%) |
| Total | 161 (100.0%) | 178 (100.0%) |
Household Vehicle Usage in Bonnetsville
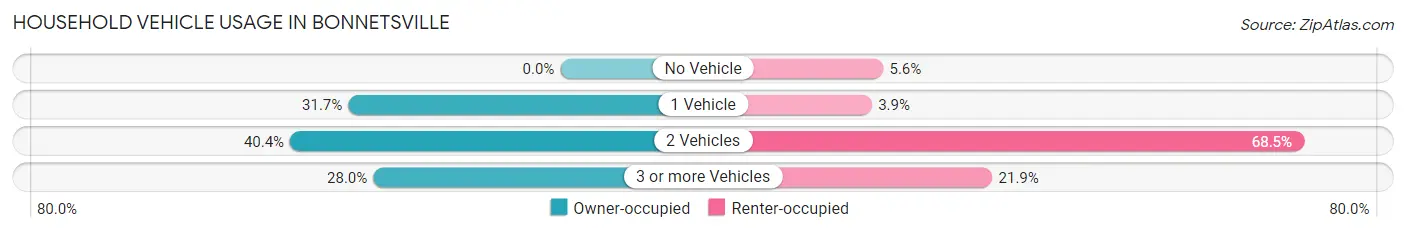
| Vehicles per Household | Owner-occupied | Renter-occupied |
| No Vehicle | 0 (0.0%) | 10 (5.6%) |
| 1 Vehicle | 51 (31.7%) | 7 (3.9%) |
| 2 Vehicles | 65 (40.4%) | 122 (68.5%) |
| 3 or more Vehicles | 45 (28.0%) | 39 (21.9%) |
| Total | 161 (100.0%) | 178 (100.0%) |
Real Estate & Mortgages in Bonnetsville
Real Estate and Mortgage Overview in Bonnetsville
| Characteristic | Without Mortgage | With Mortgage |
| Housing Units | 90 | 71 |
| Median Property Value | $135,800 | $100,400 |
| Median Household Income | - | - |
| Monthly Housing Costs | $345 | $0 |
| Real Estate Taxes | $760 | $0 |
Property Value by Mortgage Status in Bonnetsville
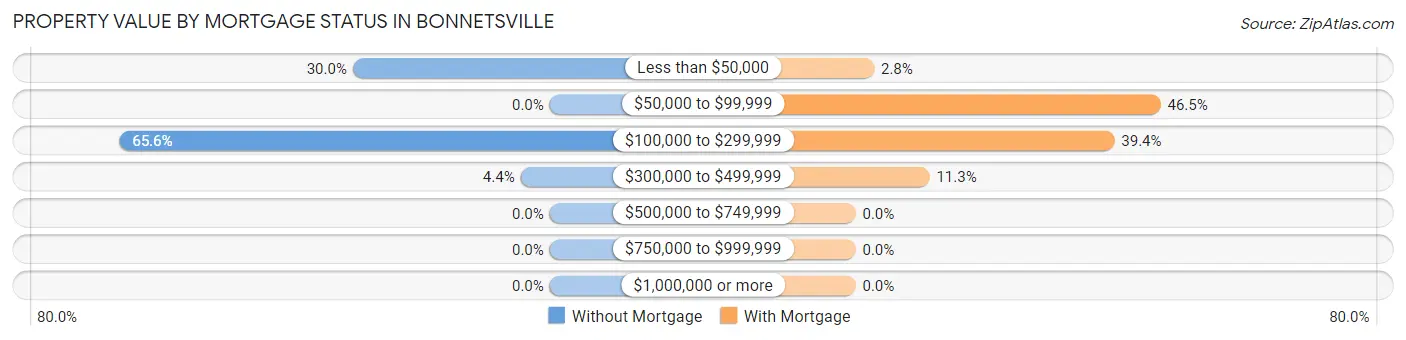
| Property Value | Without Mortgage | With Mortgage |
| Less than $50,000 | 27 (30.0%) | 2 (2.8%) |
| $50,000 to $99,999 | 0 (0.0%) | 33 (46.5%) |
| $100,000 to $299,999 | 59 (65.6%) | 28 (39.4%) |
| $300,000 to $499,999 | 4 (4.4%) | 8 (11.3%) |
| $500,000 to $749,999 | 0 (0.0%) | 0 (0.0%) |
| $750,000 to $999,999 | 0 (0.0%) | 0 (0.0%) |
| $1,000,000 or more | 0 (0.0%) | 0 (0.0%) |
| Total | 90 (100.0%) | 71 (100.0%) |
Household Income by Mortgage Status in Bonnetsville
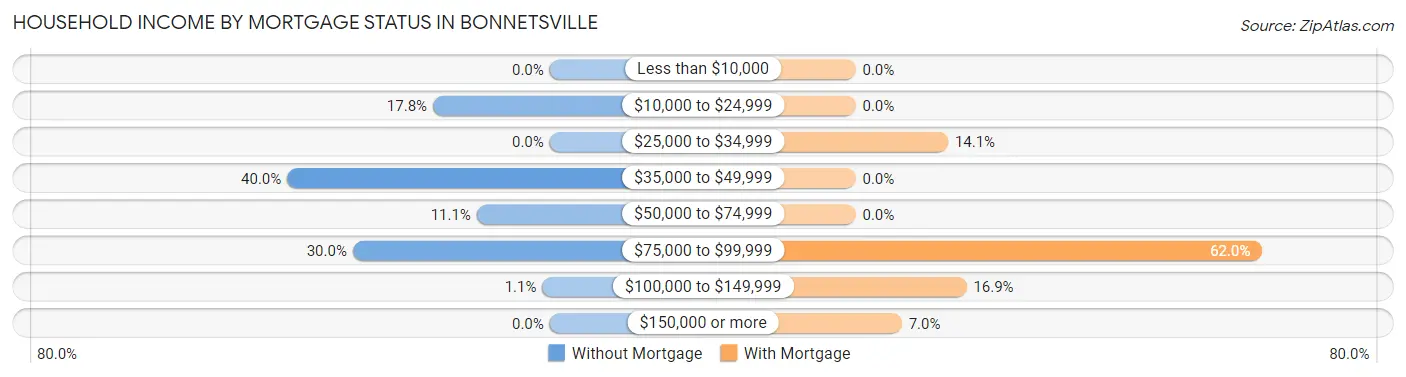
| Household Income | Without Mortgage | With Mortgage |
| Less than $10,000 | 0 (0.0%) | 0 (0.0%) |
| $10,000 to $24,999 | 16 (17.8%) | 0 (0.0%) |
| $25,000 to $34,999 | 0 (0.0%) | 10 (14.1%) |
| $35,000 to $49,999 | 36 (40.0%) | 0 (0.0%) |
| $50,000 to $74,999 | 10 (11.1%) | 0 (0.0%) |
| $75,000 to $99,999 | 27 (30.0%) | 44 (62.0%) |
| $100,000 to $149,999 | 1 (1.1%) | 12 (16.9%) |
| $150,000 or more | 0 (0.0%) | 5 (7.0%) |
| Total | 90 (100.0%) | 71 (100.0%) |
Property Value to Household Income Ratio in Bonnetsville
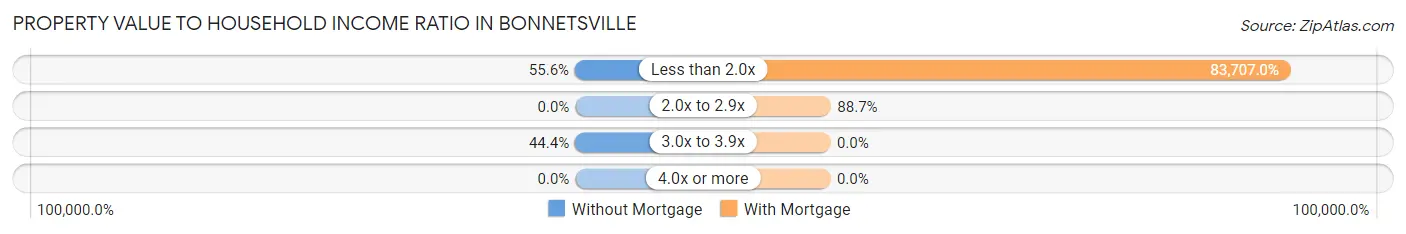
| Value-to-Income Ratio | Without Mortgage | With Mortgage |
| Less than 2.0x | 50 (55.6%) | 59,432 (83,707.0%) |
| 2.0x to 2.9x | 0 (0.0%) | 63 (88.7%) |
| 3.0x to 3.9x | 40 (44.4%) | 0 (0.0%) |
| 4.0x or more | 0 (0.0%) | 0 (0.0%) |
| Total | 90 (100.0%) | 71 (100.0%) |
Real Estate Taxes by Mortgage Status in Bonnetsville
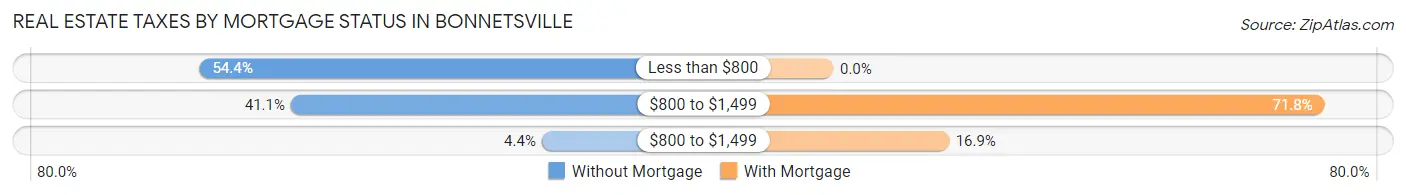
| Property Taxes | Without Mortgage | With Mortgage |
| Less than $800 | 49 (54.4%) | 0 (0.0%) |
| $800 to $1,499 | 37 (41.1%) | 51 (71.8%) |
| $800 to $1,499 | 4 (4.4%) | 12 (16.9%) |
| Total | 90 (100.0%) | 71 (100.0%) |
Health & Disability in Bonnetsville
Health Insurance Coverage by Age in Bonnetsville
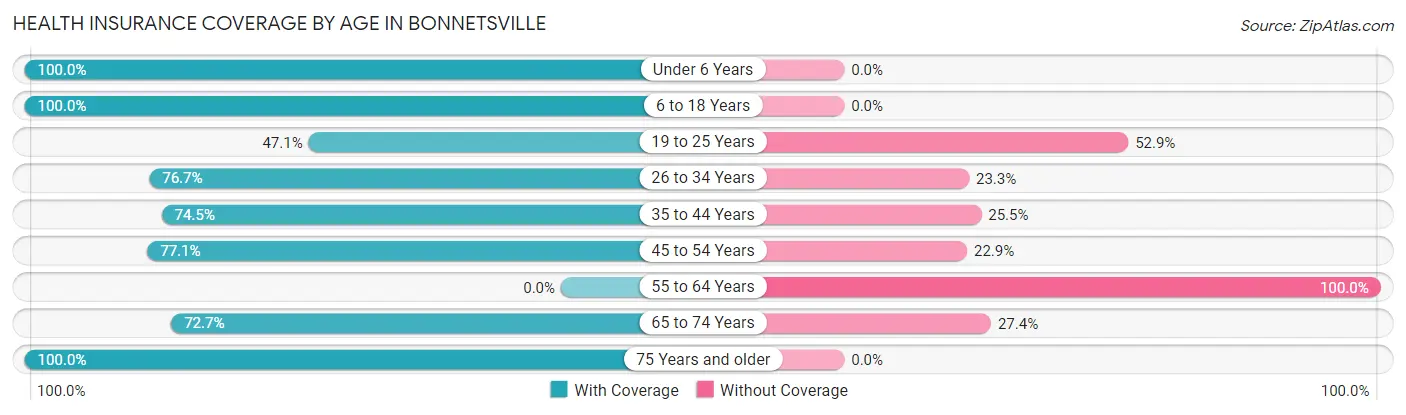
| Age Bracket | With Coverage | Without Coverage |
| Under 6 Years | 61 (100.0%) | 0 (0.0%) |
| 6 to 18 Years | 709 (100.0%) | 0 (0.0%) |
| 19 to 25 Years | 8 (47.1%) | 9 (52.9%) |
| 26 to 34 Years | 33 (76.7%) | 10 (23.3%) |
| 35 to 44 Years | 137 (74.5%) | 47 (25.5%) |
| 45 to 54 Years | 64 (77.1%) | 19 (22.9%) |
| 55 to 64 Years | 0 (0.0%) | 49 (100.0%) |
| 65 to 74 Years | 85 (72.7%) | 32 (27.4%) |
| 75 Years and older | 34 (100.0%) | 0 (0.0%) |
| Total | 1,131 (87.2%) | 166 (12.8%) |
Health Insurance Coverage by Citizenship Status in Bonnetsville
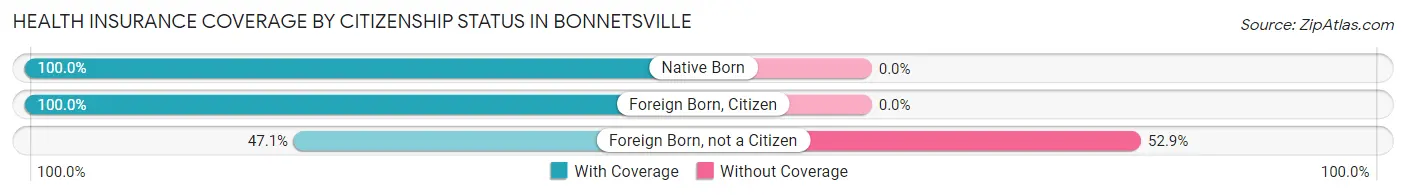
| Citizenship Status | With Coverage | Without Coverage |
| Native Born | 61 (100.0%) | 0 (0.0%) |
| Foreign Born, Citizen | 709 (100.0%) | 0 (0.0%) |
| Foreign Born, not a Citizen | 8 (47.1%) | 9 (52.9%) |
Health Insurance Coverage by Household Income in Bonnetsville
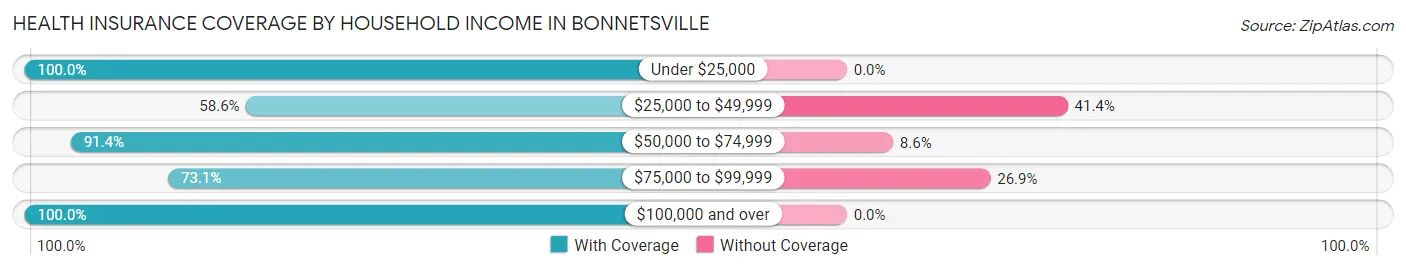
| Household Income | With Coverage | Without Coverage |
| Under $25,000 | 661 (100.0%) | 0 (0.0%) |
| $25,000 to $49,999 | 163 (58.6%) | 115 (41.4%) |
| $50,000 to $74,999 | 201 (91.4%) | 19 (8.6%) |
| $75,000 to $99,999 | 87 (73.1%) | 32 (26.9%) |
| $100,000 and over | 16 (100.0%) | 0 (0.0%) |
Public vs Private Health Insurance Coverage by Age in Bonnetsville
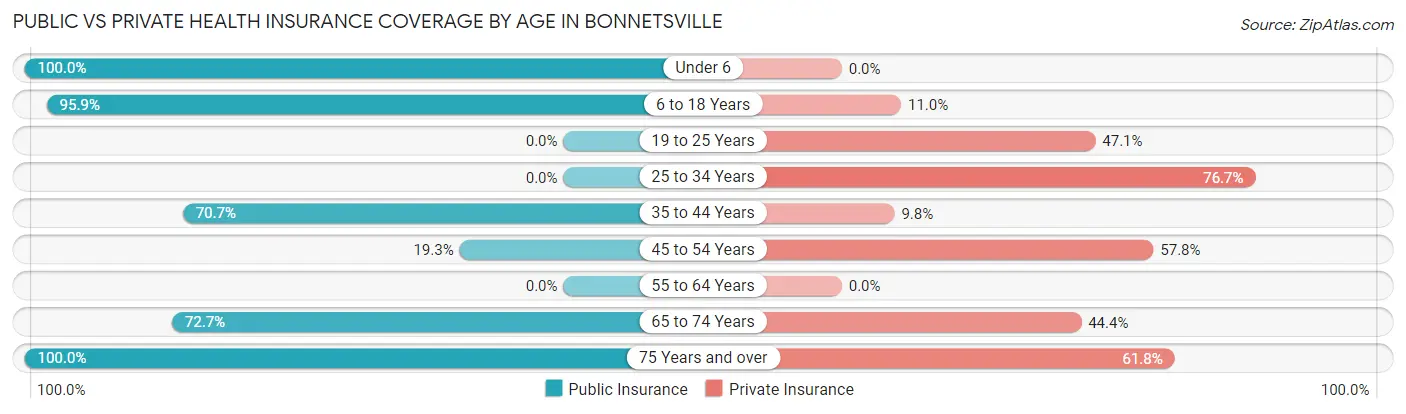
| Age Bracket | Public Insurance | Private Insurance |
| Under 6 | 61 (100.0%) | 0 (0.0%) |
| 6 to 18 Years | 680 (95.9%) | 78 (11.0%) |
| 19 to 25 Years | 0 (0.0%) | 8 (47.1%) |
| 25 to 34 Years | 0 (0.0%) | 33 (76.7%) |
| 35 to 44 Years | 130 (70.7%) | 18 (9.8%) |
| 45 to 54 Years | 16 (19.3%) | 48 (57.8%) |
| 55 to 64 Years | 0 (0.0%) | 0 (0.0%) |
| 65 to 74 Years | 85 (72.7%) | 52 (44.4%) |
| 75 Years and over | 34 (100.0%) | 21 (61.8%) |
| Total | 1,006 (77.6%) | 258 (19.9%) |
Disability Status by Sex by Age in Bonnetsville
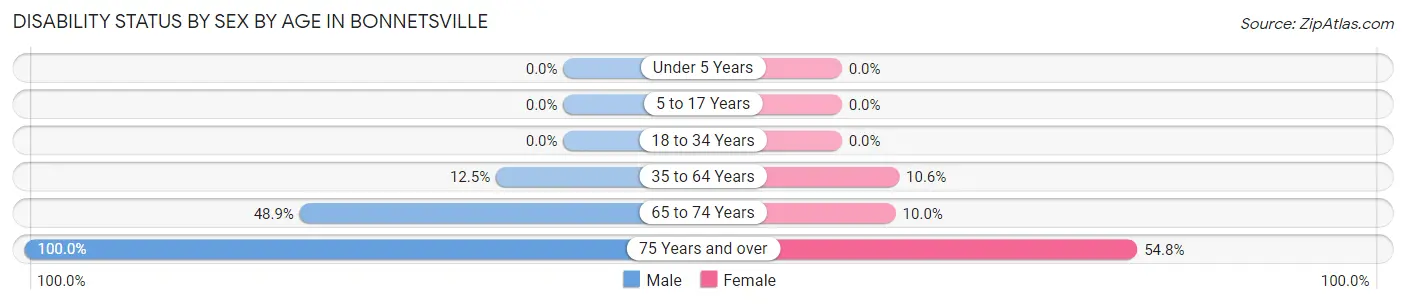
| Age Bracket | Male | Female |
| Under 5 Years | 0 (0.0%) | 0 (0.0%) |
| 5 to 17 Years | 0 (0.0%) | 0 (0.0%) |
| 18 to 34 Years | 0 (0.0%) | 0 (0.0%) |
| 35 to 64 Years | 16 (12.5%) | 20 (10.6%) |
| 65 to 74 Years | 23 (48.9%) | 7 (10.0%) |
| 75 Years and over | 3 (100.0%) | 17 (54.8%) |
Disability Class by Sex by Age in Bonnetsville
Disability Class: Hearing Difficulty
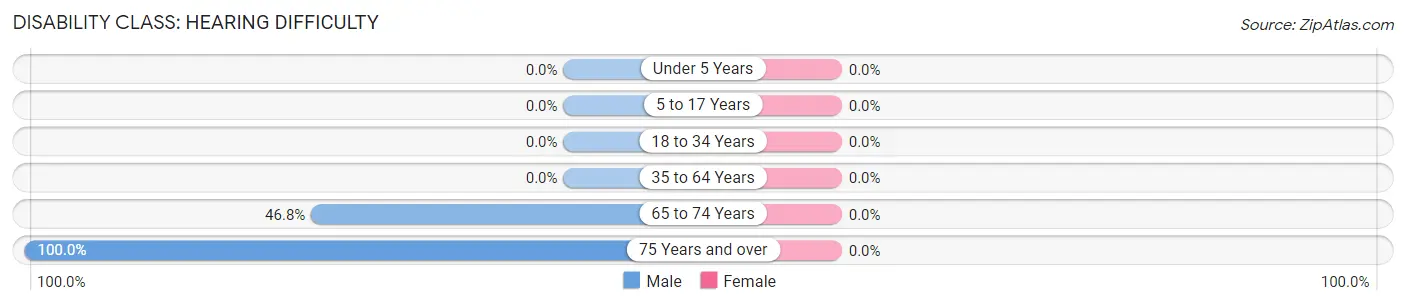
| Age Bracket | Male | Female |
| Under 5 Years | 0 (0.0%) | 0 (0.0%) |
| 5 to 17 Years | 0 (0.0%) | 0 (0.0%) |
| 18 to 34 Years | 0 (0.0%) | 0 (0.0%) |
| 35 to 64 Years | 0 (0.0%) | 0 (0.0%) |
| 65 to 74 Years | 22 (46.8%) | 0 (0.0%) |
| 75 Years and over | 3 (100.0%) | 0 (0.0%) |
Disability Class: Vision Difficulty
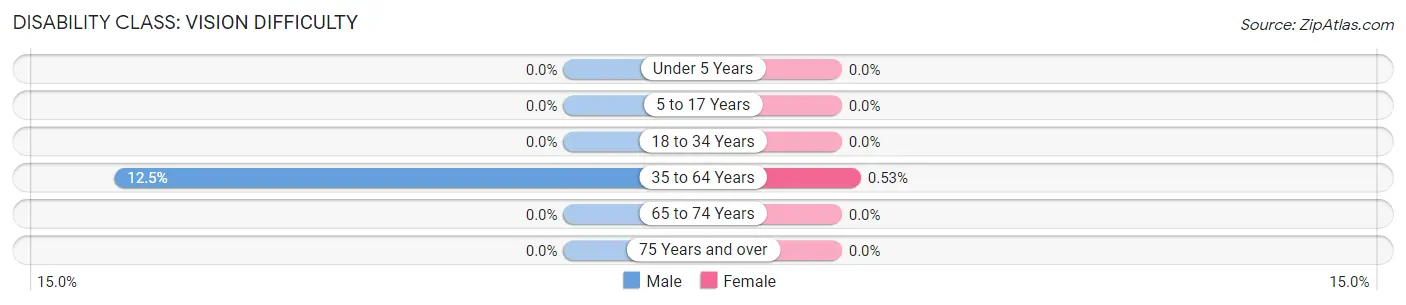
| Age Bracket | Male | Female |
| Under 5 Years | 0 (0.0%) | 0 (0.0%) |
| 5 to 17 Years | 0 (0.0%) | 0 (0.0%) |
| 18 to 34 Years | 0 (0.0%) | 0 (0.0%) |
| 35 to 64 Years | 16 (12.5%) | 1 (0.5%) |
| 65 to 74 Years | 0 (0.0%) | 0 (0.0%) |
| 75 Years and over | 0 (0.0%) | 0 (0.0%) |
Disability Class: Cognitive Difficulty
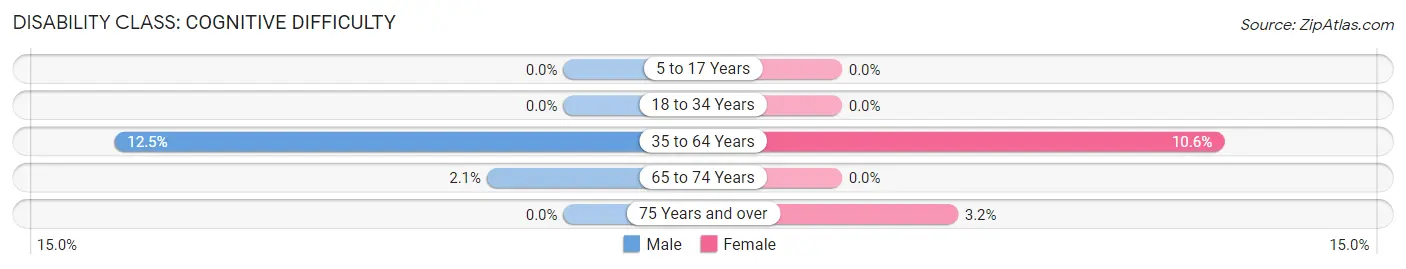
| Age Bracket | Male | Female |
| 5 to 17 Years | 0 (0.0%) | 0 (0.0%) |
| 18 to 34 Years | 0 (0.0%) | 0 (0.0%) |
| 35 to 64 Years | 16 (12.5%) | 20 (10.6%) |
| 65 to 74 Years | 1 (2.1%) | 0 (0.0%) |
| 75 Years and over | 0 (0.0%) | 1 (3.2%) |
Disability Class: Ambulatory Difficulty
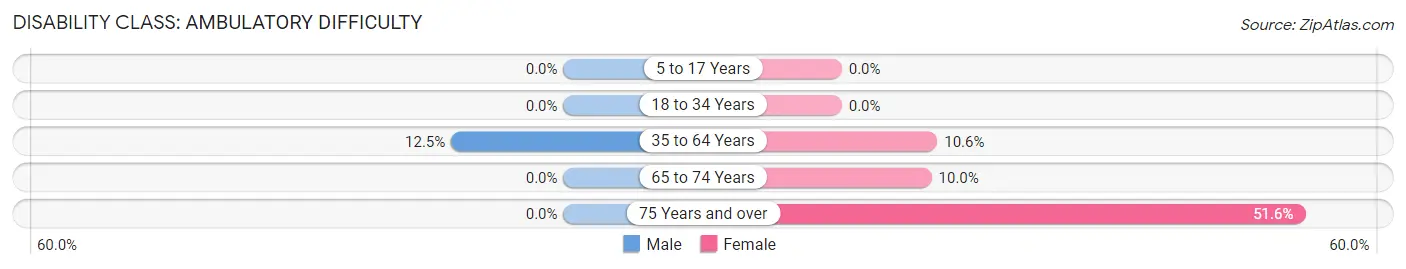
| Age Bracket | Male | Female |
| 5 to 17 Years | 0 (0.0%) | 0 (0.0%) |
| 18 to 34 Years | 0 (0.0%) | 0 (0.0%) |
| 35 to 64 Years | 16 (12.5%) | 20 (10.6%) |
| 65 to 74 Years | 0 (0.0%) | 7 (10.0%) |
| 75 Years and over | 0 (0.0%) | 16 (51.6%) |
Disability Class: Self-Care Difficulty
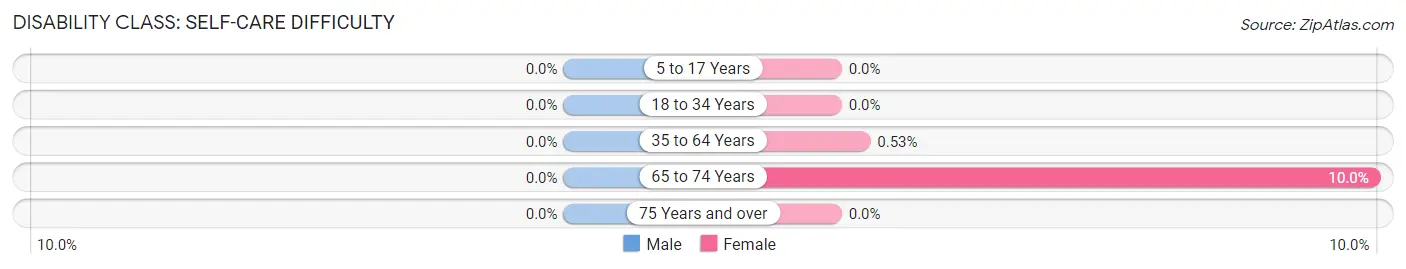
| Age Bracket | Male | Female |
| 5 to 17 Years | 0 (0.0%) | 0 (0.0%) |
| 18 to 34 Years | 0 (0.0%) | 0 (0.0%) |
| 35 to 64 Years | 0 (0.0%) | 1 (0.5%) |
| 65 to 74 Years | 0 (0.0%) | 7 (10.0%) |
| 75 Years and over | 0 (0.0%) | 0 (0.0%) |
Technology Access in Bonnetsville
Computing Device Access in Bonnetsville
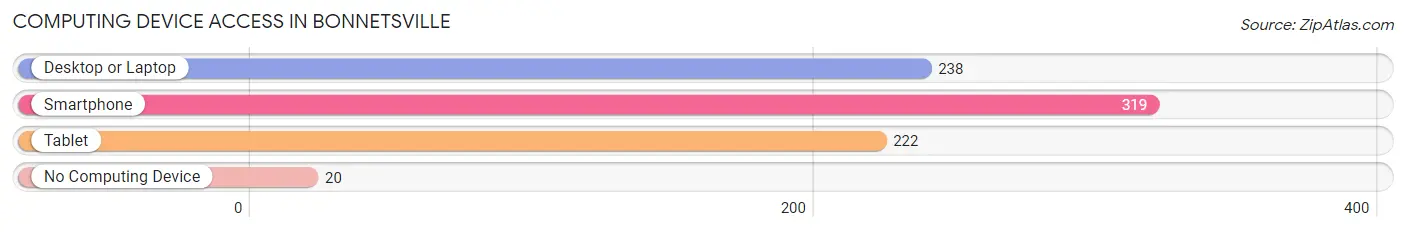
| Device Type | # Households | % Households |
| Desktop or Laptop | 238 | 70.2% |
| Smartphone | 319 | 94.1% |
| Tablet | 222 | 65.5% |
| No Computing Device | 20 | 5.9% |
| Total | 339 | 100.0% |
Internet Access in Bonnetsville
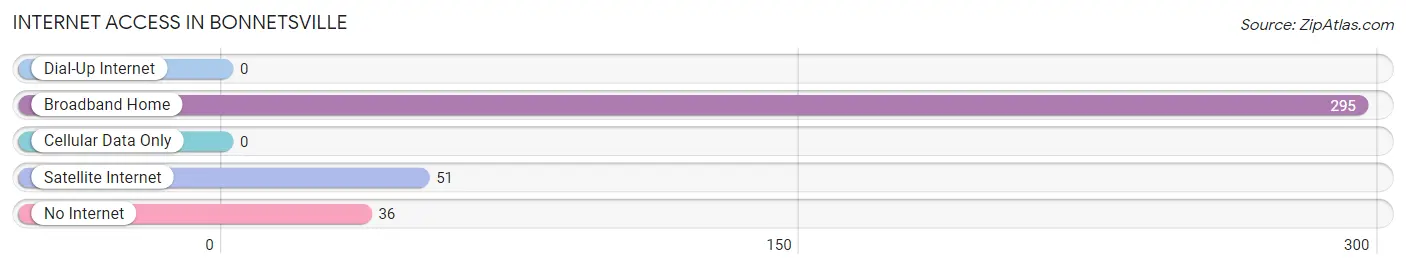
| Internet Type | # Households | % Households |
| Dial-Up Internet | 0 | 0.0% |
| Broadband Home | 295 | 87.0% |
| Cellular Data Only | 0 | 0.0% |
| Satellite Internet | 51 | 15.0% |
| No Internet | 36 | 10.6% |
| Total | 339 | 100.0% |
Bonnetsville Summary
History
Bonnetsville is a small unincorporated community located in the northeastern corner of North Carolina, in the county of Robeson. It is situated on the banks of the Lumber River, and is part of the Lumberton Metropolitan Statistical Area. The area was first settled in the late 1700s by a group of Scottish immigrants, who named the area after their homeland. The town was officially incorporated in 1887, and has since grown to become a small but vibrant community.
The town has a rich history, and has been home to many notable figures throughout its history. One of the most famous residents was the Reverend William Barber, who was a prominent leader in the civil rights movement. He was born in Bonnetsville in 1855, and was a major figure in the fight for racial equality in the South. He was also a leader in the North Carolina NAACP, and was instrumental in the passage of the Voting Rights Act of 1965.
Geography
Bonnetsville is located in the northeastern corner of North Carolina, in the county of Robeson. It is situated on the banks of the Lumber River, and is part of the Lumberton Metropolitan Statistical Area. The town is located in a rural area, and is surrounded by forests and farmland. The climate in the area is humid subtropical, with hot summers and mild winters.
The town is located near several major highways, including Interstate 95, US Highway 74, and US Highway 301. The nearest major cities are Fayetteville, Raleigh, and Wilmington. The nearest airport is the Fayetteville Regional Airport, which is located about 40 miles away.
Economy
Bonnetsville is a small, rural community, and the economy is largely based on agriculture and forestry. The town is home to several small businesses, including a grocery store, a hardware store, and a few restaurants. The town also has a few small manufacturing plants, which produce furniture, textiles, and other products.
The town is also home to a few small farms, which produce a variety of crops, including corn, soybeans, and cotton. The town is also home to a few small logging companies, which harvest timber from the surrounding forests.
Demographics
As of the 2010 census, the population of Bonnetsville was 1,845. The racial makeup of the town was 79.3% White, 17.2% African American, 0.7% Native American, 0.3% Asian, 0.1% Pacific Islander, and 2.4% from other races. The median household income was $30,938, and the median family income was $37,813. The per capita income was $15,845.
Conclusion
Bonnetsville is a small, rural community located in the northeastern corner of North Carolina. It has a rich history, and has been home to many notable figures throughout its history. The town is largely based on agriculture and forestry, and is home to several small businesses. The population of Bonnetsville is 1,845, and the median household income is $30,938.
Common Questions
What is the Total Population of Bonnetsville?
Total Population of Bonnetsville is 1,297.
What is the Total Male Population of Bonnetsville?
Total Male Population of Bonnetsville is 644.
What is the Total Female Population of Bonnetsville?
Total Female Population of Bonnetsville is 653.
What is the Ratio of Males per 100 Females in Bonnetsville?
There are 98.62 Males per 100 Females in Bonnetsville.
What is the Ratio of Females per 100 Males in Bonnetsville?
There are 101.40 Females per 100 Males in Bonnetsville.
What is the Median Population Age in Bonnetsville?
Median Population Age in Bonnetsville is 15.8 Years.
What is the Average Family Size in Bonnetsville
Average Family Size in Bonnetsville is 4.5 People.
What is the Average Household Size in Bonnetsville
Average Household Size in Bonnetsville is 3.8 People.
What is Per Capita Income in Bonnetsville?
Per Capita income in Bonnetsville is $10,851.
What is the Median Household income in Bonnetsville?
Median Household Income in Bonnetsville is $41,135.
What is Income or Wage Gap in Bonnetsville?
Income or Wage Gap in Bonnetsville is 58.9%.
Women in Bonnetsville earn 41.1 cents for every dollar earned by a man.
What is Inequality or Gini Index in Bonnetsville?
Inequality or Gini Index in Bonnetsville is 0.34.
How Large is the Labor Force in Bonnetsville?
There are 381 People in the Labor Forcein in Bonnetsville.
What is the Percentage of People in the Labor Force in Bonnetsville?
60.1% of People are in the Labor Force in Bonnetsville.
What is the Unemployment Rate in Bonnetsville?
Unemployment Rate in Bonnetsville is 4.5%.