Edneyville, NC
Edneyville Map
Edneyville Overview
2,829
TOTAL POPULATION
1,409
MALE POPULATION
1,420
FEMALE POPULATION
99.23
MALES / 100 FEMALES
100.78
FEMALES / 100 MALES
35.3
MEDIAN AGE
3.0
AVG FAMILY SIZE
2.8
AVG HOUSEHOLD SIZE
$30,059
PER CAPITA INCOME
$61,400
AVG FAMILY INCOME
$61,600
AVG HOUSEHOLD INCOME
54.6%
WAGE / INCOME GAP [ % ]
45.4¢/ $1
WAGE / INCOME GAP [ $ ]
0.44
INEQUALITY / GINI INDEX
1,597
LABOR FORCE [ PEOPLE ]
75.0%
PERCENT IN LABOR FORCE
1.0%
UNEMPLOYMENT RATE
Edneyville Area Codes
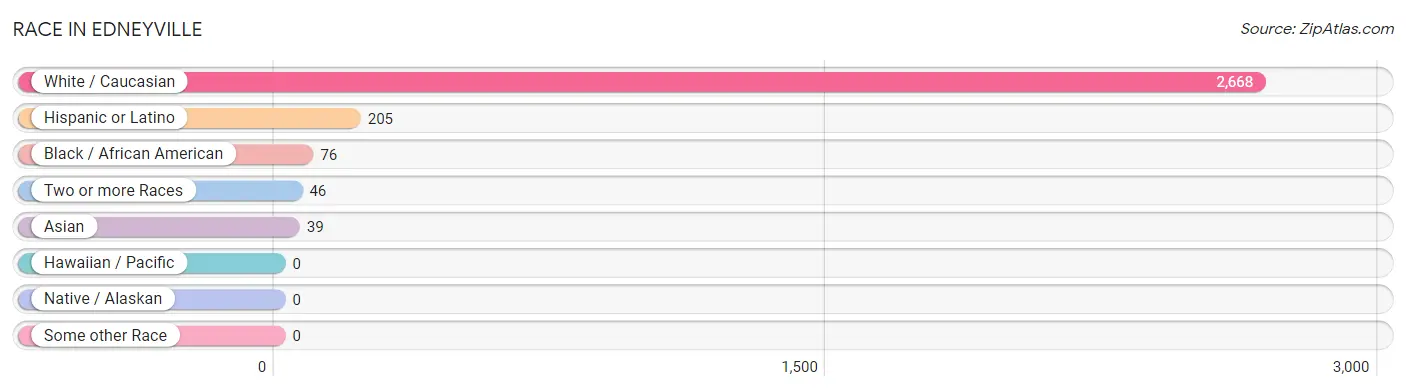
Race in Edneyville
The most populous races in Edneyville are White / Caucasian (2,668 | 94.3%), Hispanic or Latino (205 | 7.2%), and Black / African American (76 | 2.7%).
| Race | # Population | % Population |
| Asian | 39 | 1.4% |
| Black / African American | 76 | 2.7% |
| Hawaiian / Pacific | 0 | 0.0% |
| Hispanic or Latino | 205 | 7.2% |
| Native / Alaskan | 0 | 0.0% |
| White / Caucasian | 2,668 | 94.3% |
| Two or more Races | 46 | 1.6% |
| Some other Race | 0 | 0.0% |
| Total | 2,829 | 100.0% |
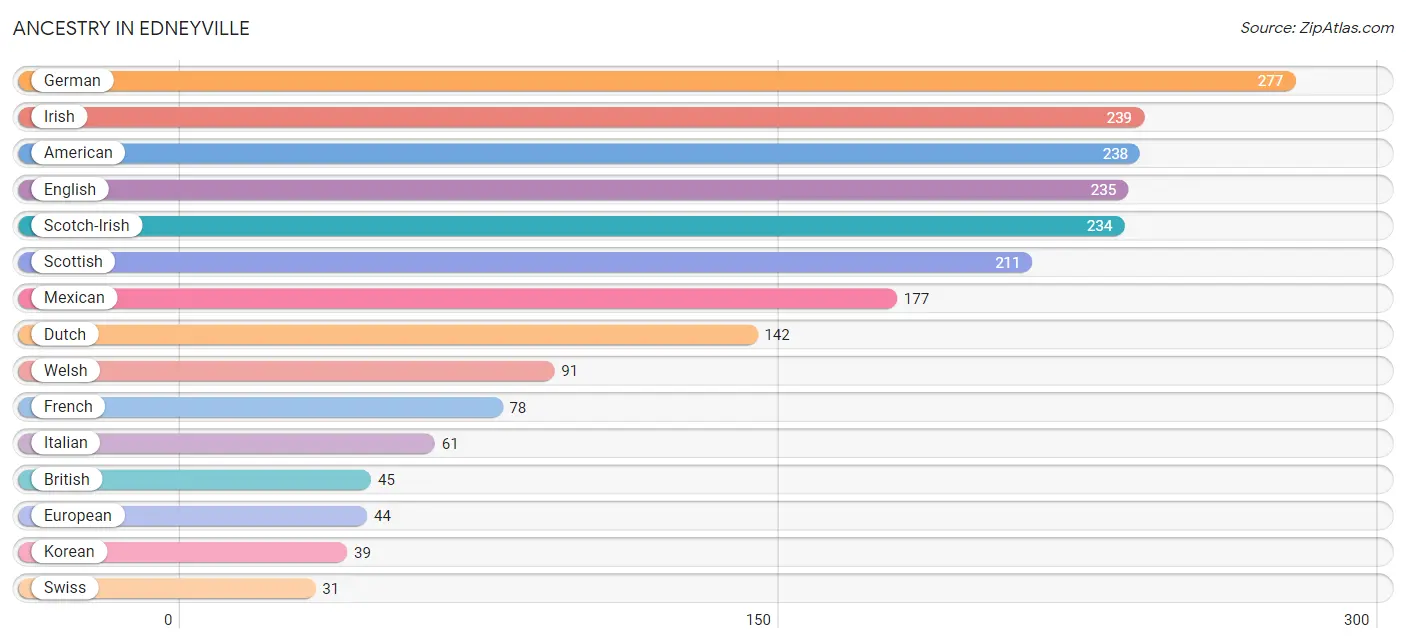
Ancestry in Edneyville
The most populous ancestries reported in Edneyville are German (277 | 9.8%), Irish (239 | 8.5%), American (238 | 8.4%), English (235 | 8.3%), and Scotch-Irish (234 | 8.3%), together accounting for 43.2% of all Edneyville residents.
| Ancestry | # Population | % Population |
| American | 238 | 8.4% |
| British | 45 | 1.6% |
| Cajun | 8 | 0.3% |
| Dutch | 142 | 5.0% |
| Eastern European | 8 | 0.3% |
| English | 235 | 8.3% |
| European | 44 | 1.6% |
| French | 78 | 2.8% |
| German | 277 | 9.8% |
| Greek | 5 | 0.2% |
| Hungarian | 16 | 0.6% |
| Irish | 239 | 8.5% |
| Italian | 61 | 2.2% |
| Kenyan | 23 | 0.8% |
| Korean | 39 | 1.4% |
| Lithuanian | 28 | 1.0% |
| Mexican | 177 | 6.3% |
| Northern European | 16 | 0.6% |
| Norwegian | 12 | 0.4% |
| Pennsylvania German | 10 | 0.4% |
| Scotch-Irish | 234 | 8.3% |
| Scottish | 211 | 7.5% |
| Subsaharan African | 23 | 0.8% |
| Swedish | 6 | 0.2% |
| Swiss | 31 | 1.1% |
| Welsh | 91 | 3.2% | View All 26 Rows |
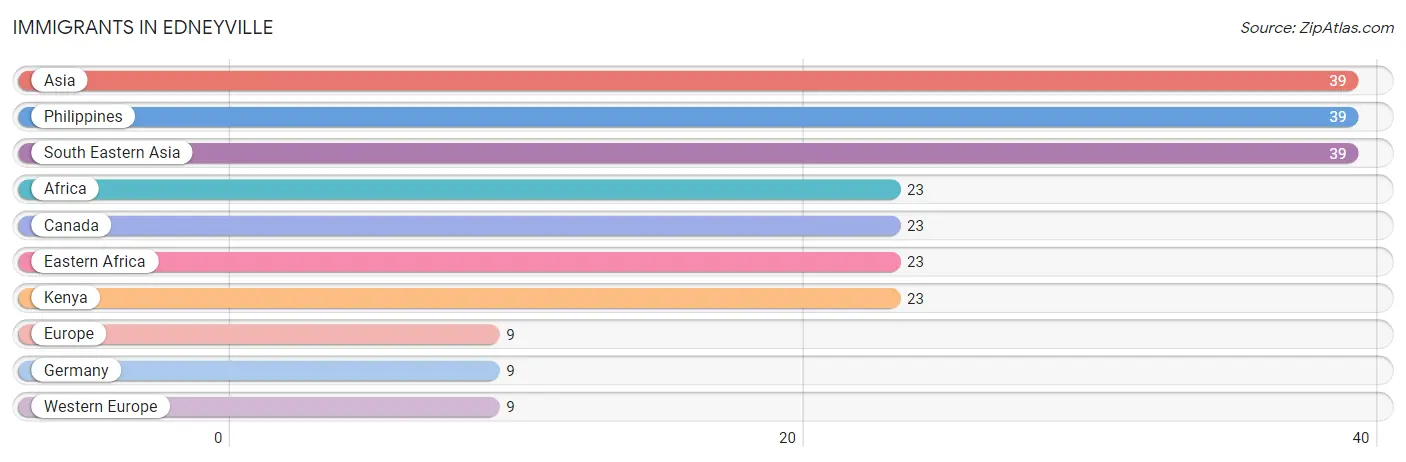
Immigrants in Edneyville
The most numerous immigrant groups reported in Edneyville came from Asia (39 | 1.4%), Philippines (39 | 1.4%), South Eastern Asia (39 | 1.4%), Africa (23 | 0.8%), and Canada (23 | 0.8%), together accounting for 5.8% of all Edneyville residents.
| Immigration Origin | # Population | % Population |
| Africa | 23 | 0.8% |
| Asia | 39 | 1.4% |
| Canada | 23 | 0.8% |
| Eastern Africa | 23 | 0.8% |
| Europe | 9 | 0.3% |
| Germany | 9 | 0.3% |
| Kenya | 23 | 0.8% |
| Philippines | 39 | 1.4% |
| South Eastern Asia | 39 | 1.4% |
| Western Europe | 9 | 0.3% | View All 10 Rows |
Sex and Age in Edneyville
Sex and Age in Edneyville
The most populous age groups in Edneyville are 5 to 9 Years (200 | 14.2%) for men and 5 to 9 Years (141 | 9.9%) for women.
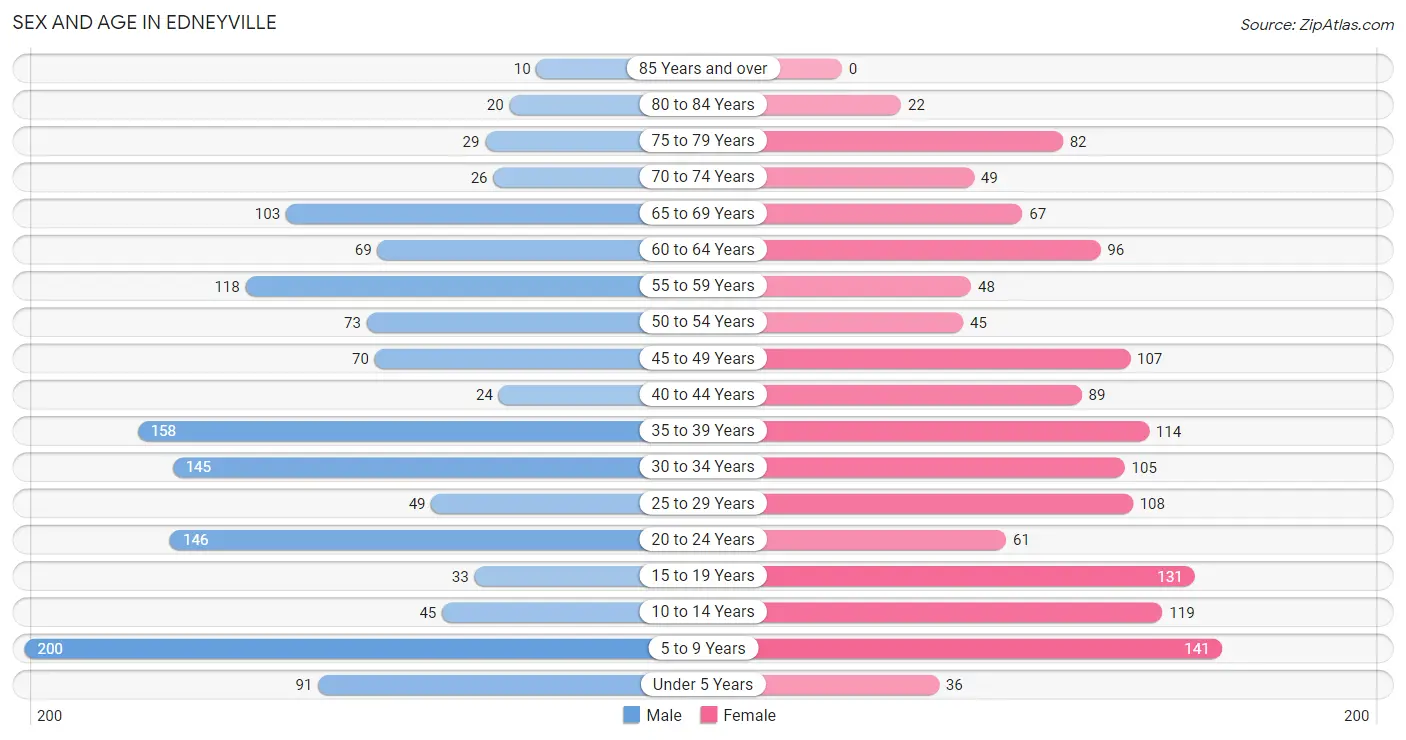
| Age Bracket | Male | Female |
| Under 5 Years | 91 (6.5%) | 36 (2.5%) |
| 5 to 9 Years | 200 (14.2%) | 141 (9.9%) |
| 10 to 14 Years | 45 (3.2%) | 119 (8.4%) |
| 15 to 19 Years | 33 (2.3%) | 131 (9.2%) |
| 20 to 24 Years | 146 (10.4%) | 61 (4.3%) |
| 25 to 29 Years | 49 (3.5%) | 108 (7.6%) |
| 30 to 34 Years | 145 (10.3%) | 105 (7.4%) |
| 35 to 39 Years | 158 (11.2%) | 114 (8.0%) |
| 40 to 44 Years | 24 (1.7%) | 89 (6.3%) |
| 45 to 49 Years | 70 (5.0%) | 107 (7.5%) |
| 50 to 54 Years | 73 (5.2%) | 45 (3.2%) |
| 55 to 59 Years | 118 (8.4%) | 48 (3.4%) |
| 60 to 64 Years | 69 (4.9%) | 96 (6.8%) |
| 65 to 69 Years | 103 (7.3%) | 67 (4.7%) |
| 70 to 74 Years | 26 (1.8%) | 49 (3.5%) |
| 75 to 79 Years | 29 (2.1%) | 82 (5.8%) |
| 80 to 84 Years | 20 (1.4%) | 22 (1.5%) |
| 85 Years and over | 10 (0.7%) | 0 (0.0%) |
| Total | 1,409 (100.0%) | 1,420 (100.0%) |
Families and Households in Edneyville
Median Family Size in Edneyville
The median family size in Edneyville is 2.97 persons per family, with married-couple families (517 | 68.2%) accounting for the largest median family size of 3.06 persons per family. On the other hand, single male/father families (79 | 10.4%) represent the smallest median family size with 2.57 persons per family.
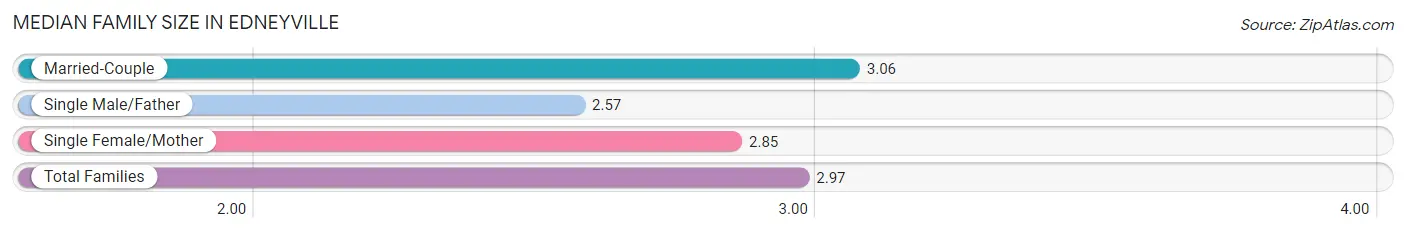
| Family Type | # Families | Family Size |
| Married-Couple | 517 (68.2%) | 3.06 |
| Single Male/Father | 79 (10.4%) | 2.57 |
| Single Female/Mother | 162 (21.4%) | 2.85 |
| Total Families | 758 (100.0%) | 2.97 |
Median Household Size in Edneyville
The median household size in Edneyville is 2.75 persons per household, with single female/mother households (162 | 15.7%) accounting for the largest median household size of 3.59 persons per household. non-family households (272 | 26.4%) represent the smallest median household size with 1.33 persons per household.
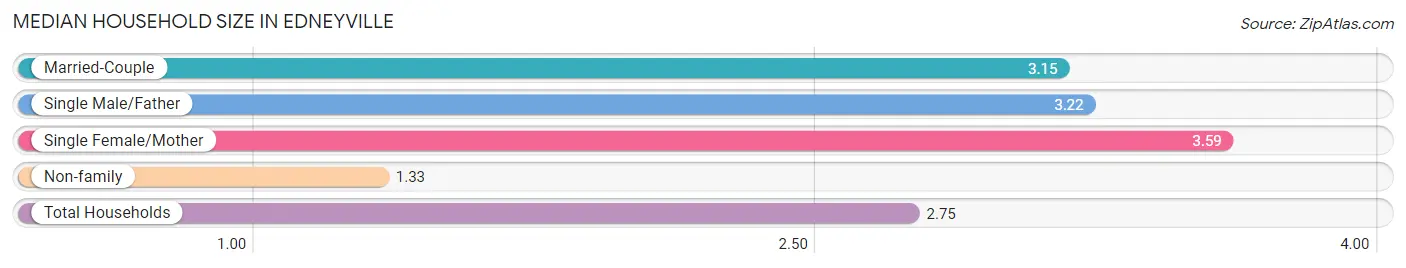
| Household Type | # Households | Household Size |
| Married-Couple | 517 (50.2%) | 3.15 |
| Single Male/Father | 79 (7.7%) | 3.22 |
| Single Female/Mother | 162 (15.7%) | 3.59 |
| Non-family | 272 (26.4%) | 1.33 |
| Total Households | 1,030 (100.0%) | 2.75 |
Household Size by Marriage Status in Edneyville
Out of a total of 1,030 households in Edneyville, 758 (73.6%) are family households, while 272 (26.4%) are nonfamily households. The most numerous type of family households are 2-person households, comprising 294, and the most common type of nonfamily households are 1-person households, comprising 198.
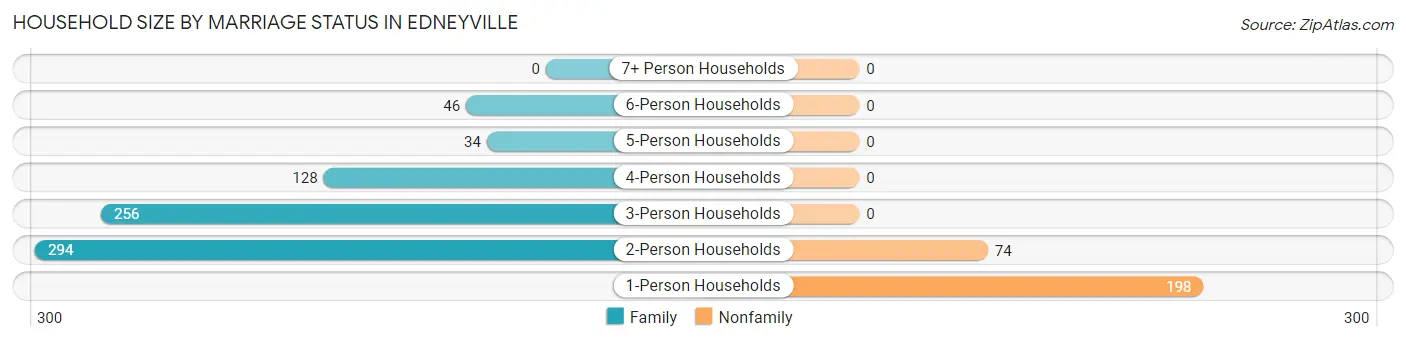
| Household Size | Family Households | Nonfamily Households |
| 1-Person Households | - | 198 (19.2%) |
| 2-Person Households | 294 (28.5%) | 74 (7.2%) |
| 3-Person Households | 256 (24.8%) | 0 (0.0%) |
| 4-Person Households | 128 (12.4%) | 0 (0.0%) |
| 5-Person Households | 34 (3.3%) | 0 (0.0%) |
| 6-Person Households | 46 (4.5%) | 0 (0.0%) |
| 7+ Person Households | 0 (0.0%) | 0 (0.0%) |
| Total | 758 (73.6%) | 272 (26.4%) |
Female Fertility in Edneyville
Fertility by Age in Edneyville
| Age Bracket | Women with Births | Births / 1,000 Women |
| 15 to 19 years | 0 (0.0%) | 0.0 |
| 20 to 34 years | 0 (0.0%) | 0.0 |
| 35 to 50 years | 0 (0.0%) | 0.0 |
| Total | 0 (0.0%) | 0.0 |
Fertility by Age by Marriage Status in Edneyville
| Age Bracket | Married | Unmarried |
| 15 to 19 years | 0 (0.0%) | 0 (0.0%) |
| 20 to 34 years | 0 (0.0%) | 0 (0.0%) |
| 35 to 50 years | 0 (0.0%) | 0 (0.0%) |
| Total | 0 (0.0%) | 0 (0.0%) |
Fertility by Education in Edneyville
| Educational Attainment | Women with Births | Births / 1,000 Women |
| Less than High School | 0 (0.0%) | 0.0 |
| High School Diploma | 0 (0.0%) | 0.0 |
| College or Associate's Degree | 0 (0.0%) | 0.0 |
| Bachelor's Degree | 0 (0.0%) | 0.0 |
| Graduate Degree | 0 (0.0%) | 0.0 |
| Total | 0 (0.0%) | 0.0 |
Fertility by Education by Marriage Status in Edneyville
| Educational Attainment | Married | Unmarried |
| Less than High School | 0 (0.0%) | 0 (0.0%) |
| High School Diploma | 0 (0.0%) | 0 (0.0%) |
| College or Associate's Degree | 0 (0.0%) | 0 (0.0%) |
| Bachelor's Degree | 0 (0.0%) | 0 (0.0%) |
| Graduate Degree | 0 (0.0%) | 0 (0.0%) |
| Total | 0 (0.0%) | 0 (0.0%) |
Income in Edneyville
Income Overview in Edneyville
Per Capita Income in Edneyville is $30,059, while median incomes of families and households are $61,400 and $61,600 respectively.
| Characteristic | Number | Measure |
| Per Capita Income | 2,829 | $30,059 |
| Median Family Income | 758 | $61,400 |
| Mean Family Income | 758 | $81,943 |
| Median Household Income | 1,030 | $61,600 |
| Mean Household Income | 1,030 | $78,190 |
| Income Deficit | 758 | $0 |
| Wage / Income Gap (%) | 2,829 | 54.57% |
| Wage / Income Gap ($) | 2,829 | 45.43¢ per $1 |
| Gini / Inequality Index | 2,829 | 0.44 |
Earnings by Sex in Edneyville
Average Earnings in Edneyville are $32,940, $48,966 for men and $22,244 for women, a difference of 54.6%.
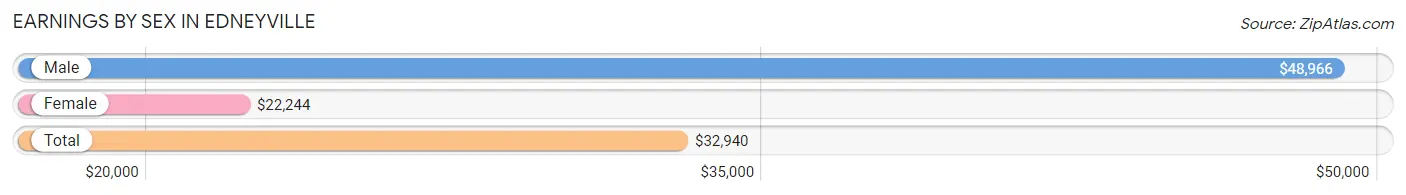
| Sex | Number | Average Earnings |
| Male | 859 (52.8%) | $48,966 |
| Female | 768 (47.2%) | $22,244 |
| Total | 1,627 (100.0%) | $32,940 |
Earnings by Sex by Income Bracket in Edneyville
The most common earnings brackets in Edneyville are $65,000 to $74,999 for men (144 | 16.8%) and $10,000 to $12,499 for women (128 | 16.7%).
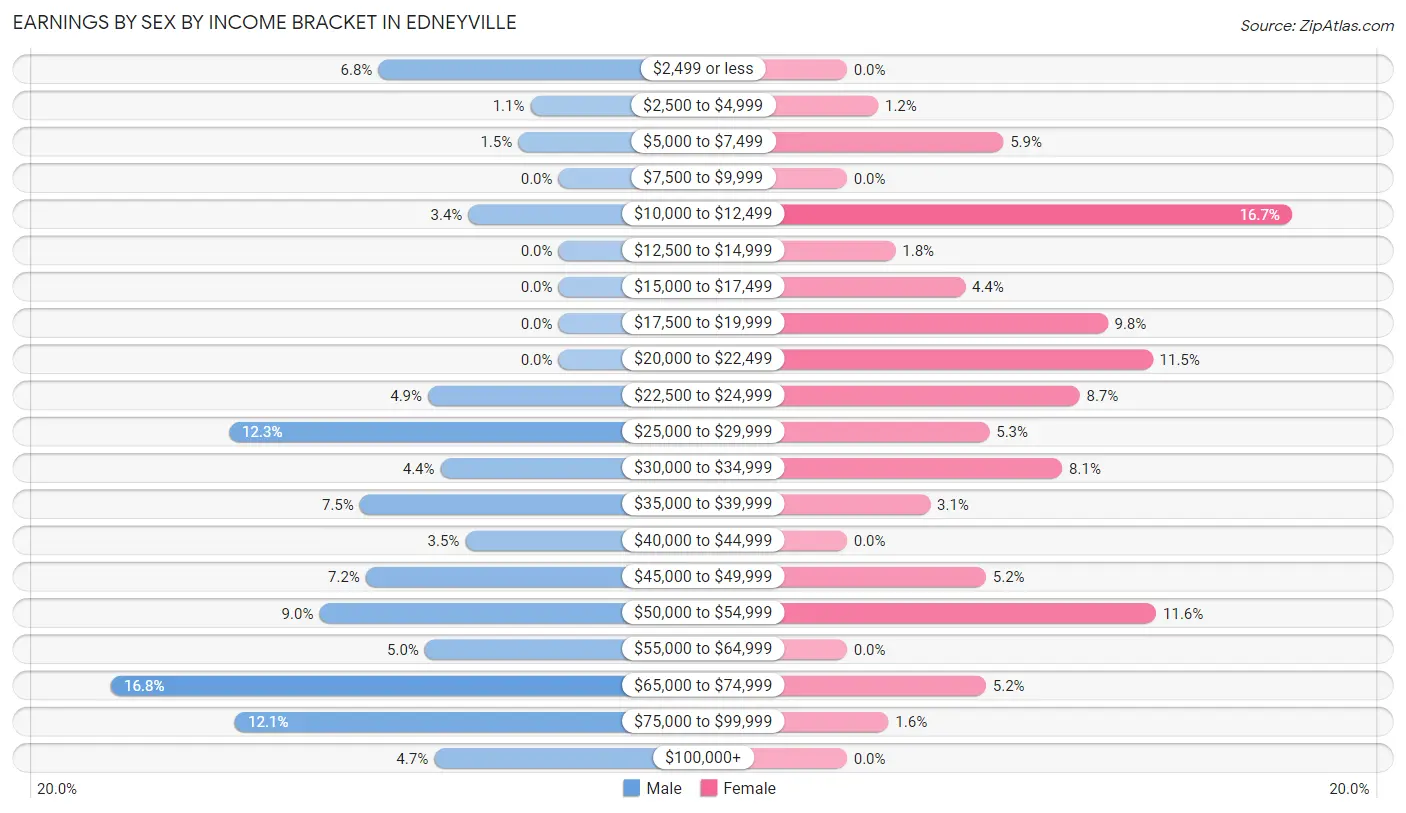
| Income | Male | Female |
| $2,499 or less | 58 (6.8%) | 0 (0.0%) |
| $2,500 to $4,999 | 9 (1.1%) | 9 (1.2%) |
| $5,000 to $7,499 | 13 (1.5%) | 45 (5.9%) |
| $7,500 to $9,999 | 0 (0.0%) | 0 (0.0%) |
| $10,000 to $12,499 | 29 (3.4%) | 128 (16.7%) |
| $12,500 to $14,999 | 0 (0.0%) | 14 (1.8%) |
| $15,000 to $17,499 | 0 (0.0%) | 34 (4.4%) |
| $17,500 to $19,999 | 0 (0.0%) | 75 (9.8%) |
| $20,000 to $22,499 | 0 (0.0%) | 88 (11.5%) |
| $22,500 to $24,999 | 42 (4.9%) | 67 (8.7%) |
| $25,000 to $29,999 | 106 (12.3%) | 41 (5.3%) |
| $30,000 to $34,999 | 38 (4.4%) | 62 (8.1%) |
| $35,000 to $39,999 | 64 (7.4%) | 24 (3.1%) |
| $40,000 to $44,999 | 30 (3.5%) | 0 (0.0%) |
| $45,000 to $49,999 | 62 (7.2%) | 40 (5.2%) |
| $50,000 to $54,999 | 77 (9.0%) | 89 (11.6%) |
| $55,000 to $64,999 | 43 (5.0%) | 0 (0.0%) |
| $65,000 to $74,999 | 144 (16.8%) | 40 (5.2%) |
| $75,000 to $99,999 | 104 (12.1%) | 12 (1.6%) |
| $100,000+ | 40 (4.7%) | 0 (0.0%) |
| Total | 859 (100.0%) | 768 (100.0%) |
Earnings by Sex by Educational Attainment in Edneyville
Average earnings in Edneyville are $48,966 for men and $23,545 for women, a difference of 51.9%. Men with an educational attainment of college or associate's degree enjoy the highest average annual earnings of $73,556, while those with less than high school education earn the least with $33,750. Women with an educational attainment of bachelor's degree earn the most with the average annual earnings of $52,750, while those with college or associate's degree education have the smallest earnings of $21,595.
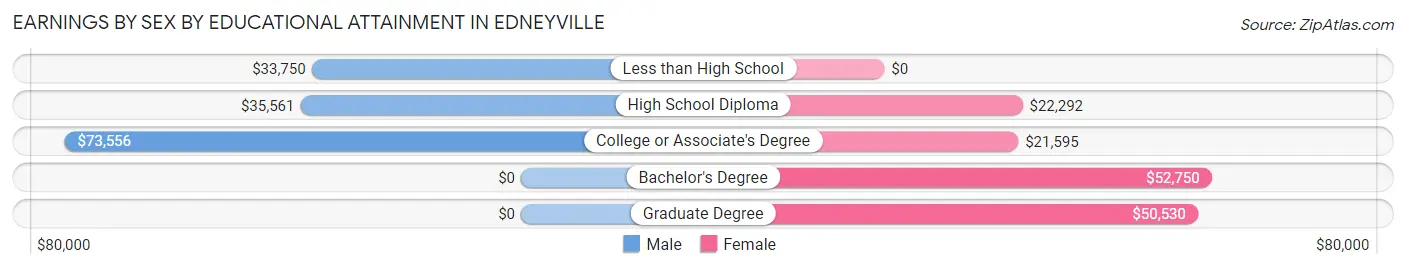
| Educational Attainment | Male Income | Female Income |
| Less than High School | $33,750 | $0 |
| High School Diploma | $35,561 | $22,292 |
| College or Associate's Degree | $73,556 | $21,595 |
| Bachelor's Degree | - | - |
| Graduate Degree | - | - |
| Total | $48,966 | $23,545 |
Family Income in Edneyville
Family Income Brackets in Edneyville
According to the Edneyville family income data, there are 125 families falling into the $50,000 to $74,999 income range, which is the most common income bracket and makes up 16.5% of all families. Conversely, the $25,000 to $34,999 income bracket is the least frequent group with only 35 families (4.6%) belonging to this category.
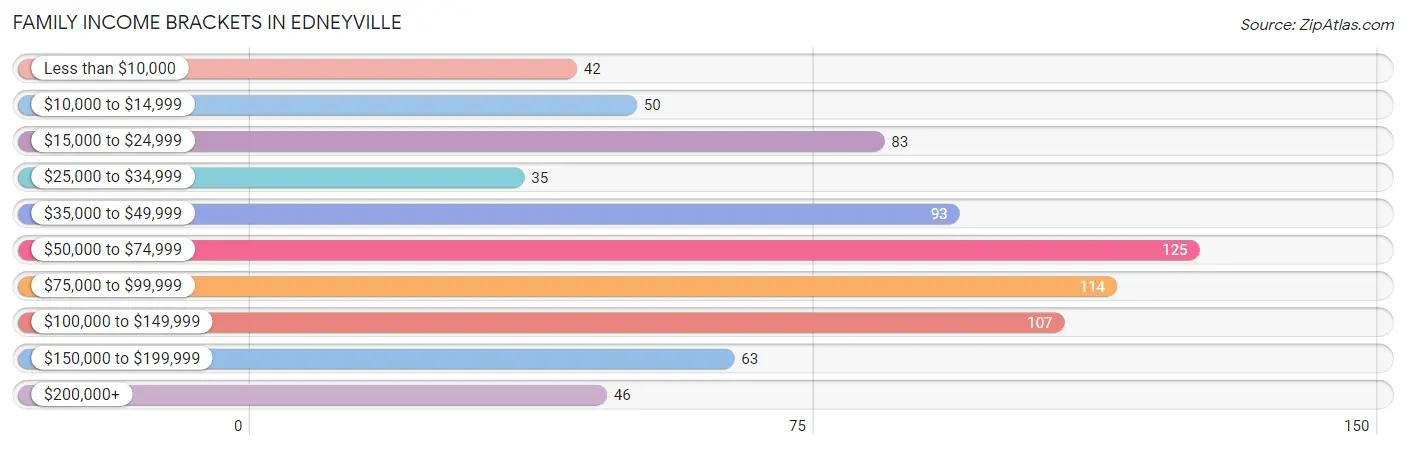
| Income Bracket | # Families | % Families |
| Less than $10,000 | 42 | 5.5% |
| $10,000 to $14,999 | 50 | 6.6% |
| $15,000 to $24,999 | 83 | 10.9% |
| $25,000 to $34,999 | 35 | 4.6% |
| $35,000 to $49,999 | 93 | 12.3% |
| $50,000 to $74,999 | 125 | 16.5% |
| $75,000 to $99,999 | 114 | 15.0% |
| $100,000 to $149,999 | 107 | 14.1% |
| $150,000 to $199,999 | 63 | 8.3% |
| $200,000+ | 46 | 6.1% |
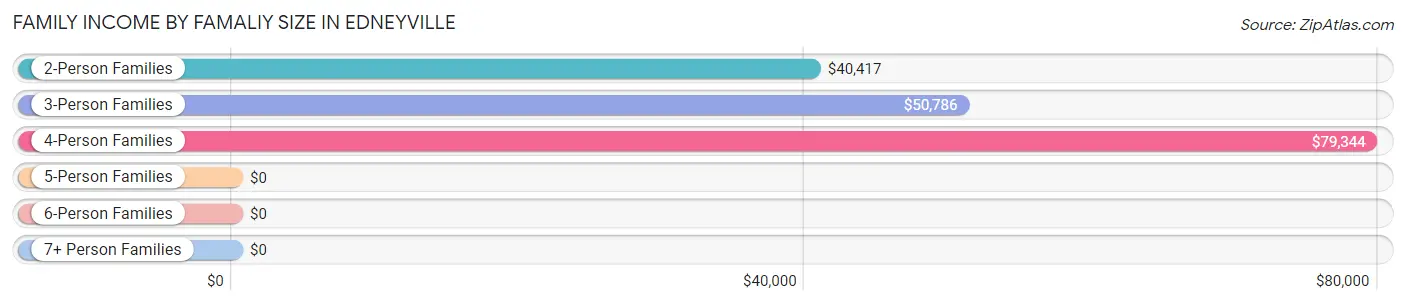
Family Income by Famaliy Size in Edneyville
4-person families (109 | 14.4%) account for the highest median family income in Edneyville with $79,344 per family, while 2-person families (369 | 48.7%) have the highest median income of $20,208 per family member.
| Income Bracket | # Families | Median Income |
| 2-Person Families | 369 (48.7%) | $40,417 |
| 3-Person Families | 224 (29.5%) | $50,786 |
| 4-Person Families | 109 (14.4%) | $79,344 |
| 5-Person Families | 44 (5.8%) | $0 |
| 6-Person Families | 12 (1.6%) | $0 |
| 7+ Person Families | 0 (0.0%) | $0 |
| Total | 758 (100.0%) | $61,400 |
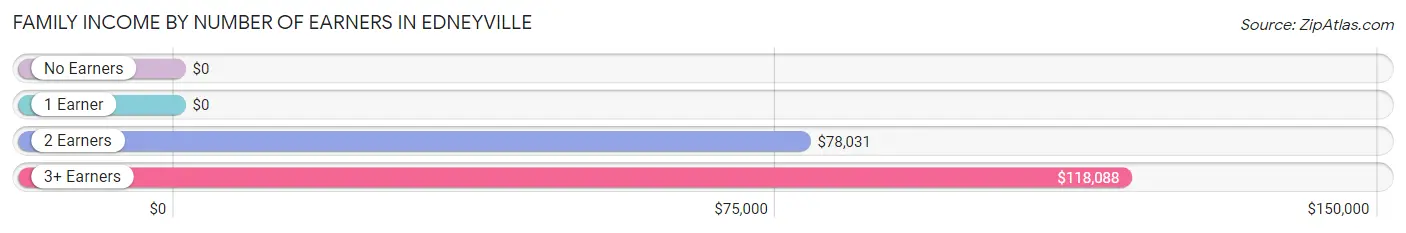
Family Income by Number of Earners in Edneyville
| Number of Earners | # Families | Median Income |
| No Earners | 110 (14.5%) | $0 |
| 1 Earner | 281 (37.1%) | $0 |
| 2 Earners | 235 (31.0%) | $78,031 |
| 3+ Earners | 132 (17.4%) | $118,088 |
| Total | 758 (100.0%) | $61,400 |
Household Income in Edneyville
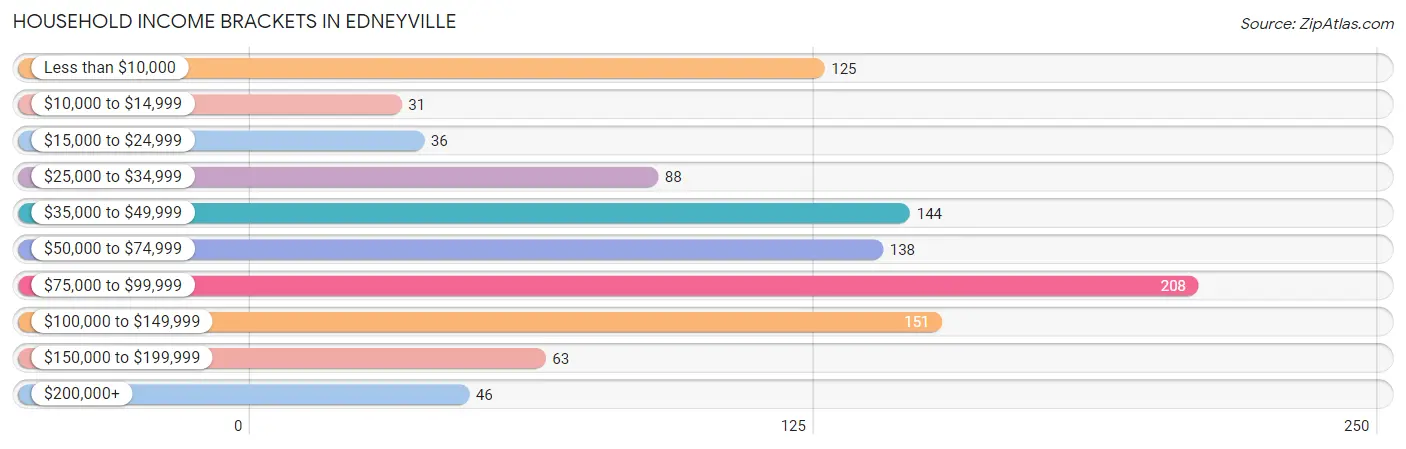
Household Income Brackets in Edneyville
With 208 households falling in the category, the $75,000 to $99,999 income range is the most frequent in Edneyville, accounting for 20.2% of all households. In contrast, only 31 households (3.0%) fall into the $10,000 to $14,999 income bracket, making it the least populous group.
| Income Bracket | # Households | % Households |
| Less than $10,000 | 125 | 12.1% |
| $10,000 to $14,999 | 31 | 3.0% |
| $15,000 to $24,999 | 36 | 3.5% |
| $25,000 to $34,999 | 88 | 8.5% |
| $35,000 to $49,999 | 144 | 14.0% |
| $50,000 to $74,999 | 138 | 13.4% |
| $75,000 to $99,999 | 208 | 20.2% |
| $100,000 to $149,999 | 151 | 14.7% |
| $150,000 to $199,999 | 63 | 6.1% |
| $200,000+ | 46 | 4.5% |
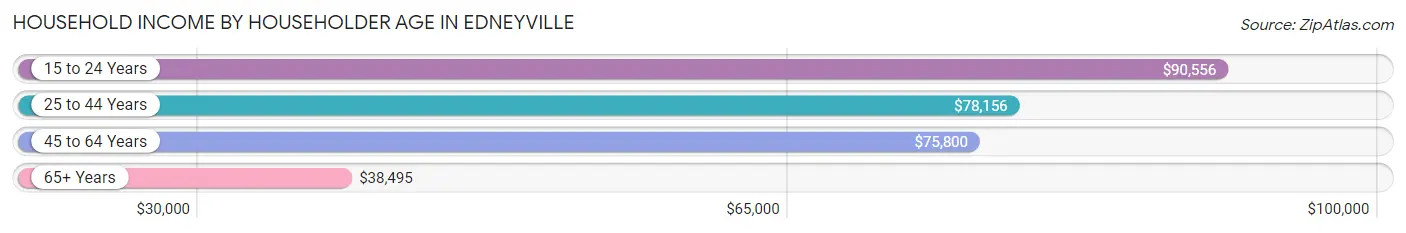
Household Income by Householder Age in Edneyville
The median household income in Edneyville is $61,600, with the highest median household income of $90,556 found in the 15 to 24 years age bracket for the primary householder. A total of 24 households (2.3%) fall into this category. Meanwhile, the 65+ years age bracket for the primary householder has the lowest median household income of $38,495, with 277 households (26.9%) in this group.
| Income Bracket | # Households | Median Income |
| 15 to 24 Years | 24 (2.3%) | $90,556 |
| 25 to 44 Years | 357 (34.7%) | $78,156 |
| 45 to 64 Years | 372 (36.1%) | $75,800 |
| 65+ Years | 277 (26.9%) | $38,495 |
| Total | 1,030 (100.0%) | $61,600 |
Poverty in Edneyville
Income Below Poverty by Sex and Age in Edneyville
With 17.7% poverty level for males and 23.0% for females among the residents of Edneyville, 15 year old males and 6 to 11 year old females are the most vulnerable to poverty, with 33 males (100.0%) and 70 females (45.5%) in their respective age groups living below the poverty level.
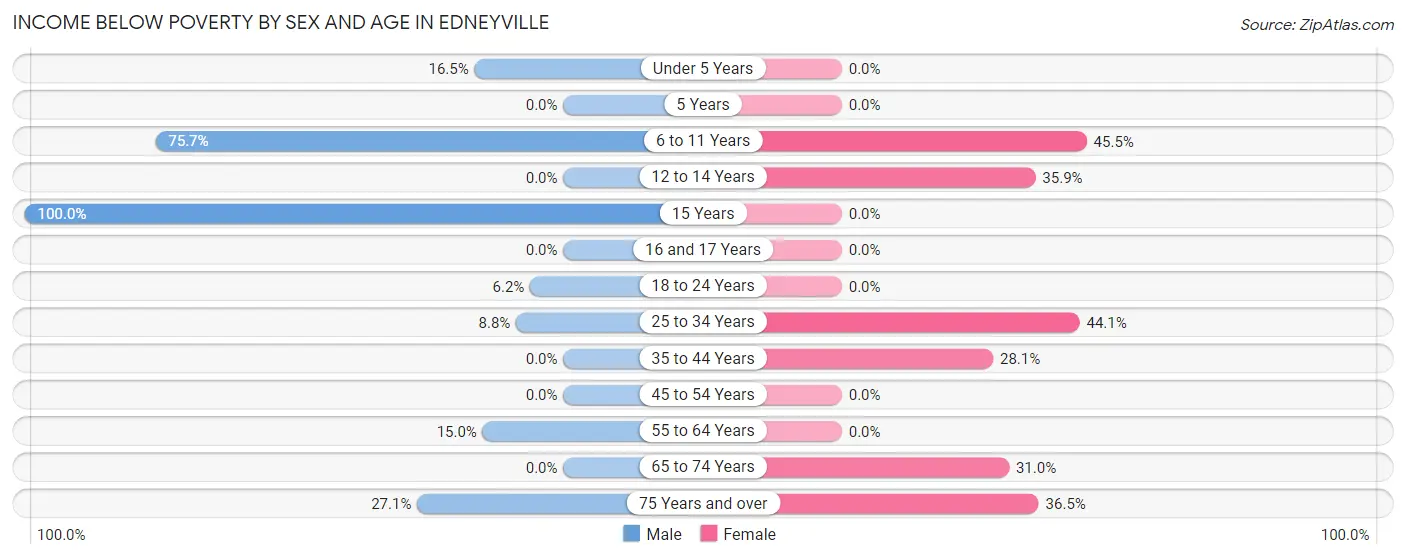
| Age Bracket | Male | Female |
| Under 5 Years | 15 (16.5%) | 0 (0.0%) |
| 5 Years | 0 (0.0%) | 0 (0.0%) |
| 6 to 11 Years | 131 (75.7%) | 70 (45.5%) |
| 12 to 14 Years | 0 (0.0%) | 23 (35.9%) |
| 15 Years | 33 (100.0%) | 0 (0.0%) |
| 16 and 17 Years | 0 (0.0%) | 0 (0.0%) |
| 18 to 24 Years | 9 (6.2%) | 0 (0.0%) |
| 25 to 34 Years | 17 (8.8%) | 94 (44.1%) |
| 35 to 44 Years | 0 (0.0%) | 57 (28.1%) |
| 45 to 54 Years | 0 (0.0%) | 0 (0.0%) |
| 55 to 64 Years | 28 (15.0%) | 0 (0.0%) |
| 65 to 74 Years | 0 (0.0%) | 36 (31.0%) |
| 75 Years and over | 16 (27.1%) | 38 (36.5%) |
| Total | 249 (17.7%) | 318 (23.0%) |
Income Above Poverty by Sex and Age in Edneyville
According to the poverty statistics in Edneyville, males aged 5 years and females aged 5 years are the age groups that are most secure financially, with 100.0% of males and 100.0% of females in these age groups living above the poverty line.
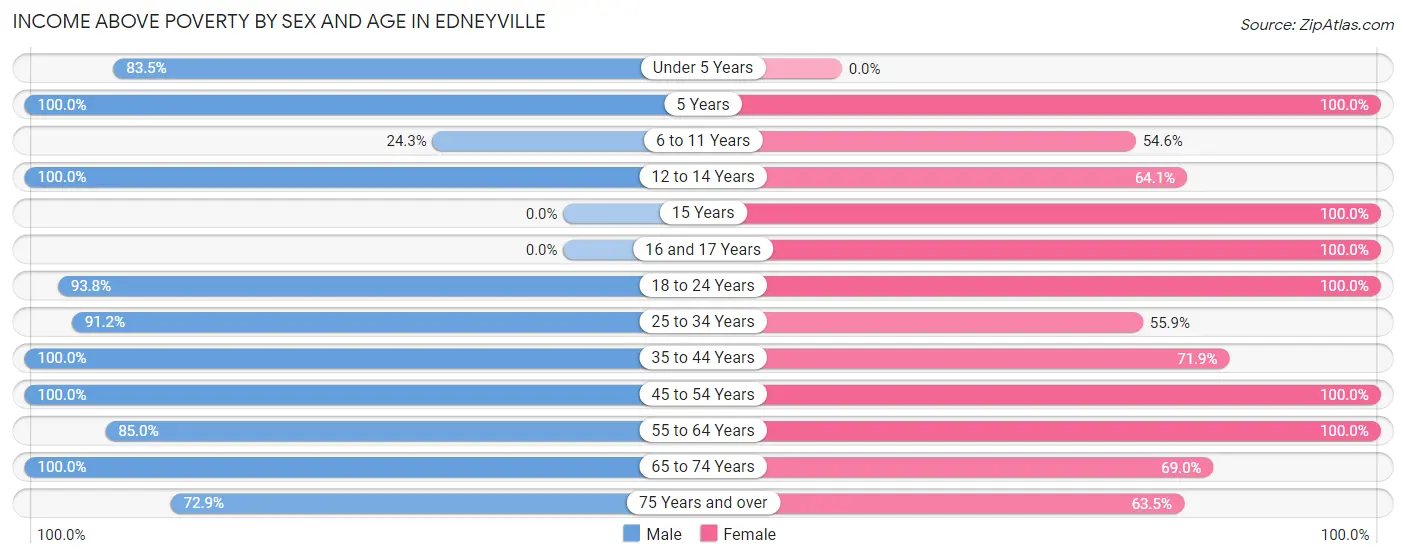
| Age Bracket | Male | Female |
| Under 5 Years | 76 (83.5%) | 0 (0.0%) |
| 5 Years | 57 (100.0%) | 42 (100.0%) |
| 6 to 11 Years | 42 (24.3%) | 84 (54.5%) |
| 12 to 14 Years | 15 (100.0%) | 41 (64.1%) |
| 15 Years | 0 (0.0%) | 35 (100.0%) |
| 16 and 17 Years | 0 (0.0%) | 55 (100.0%) |
| 18 to 24 Years | 137 (93.8%) | 102 (100.0%) |
| 25 to 34 Years | 177 (91.2%) | 119 (55.9%) |
| 35 to 44 Years | 182 (100.0%) | 146 (71.9%) |
| 45 to 54 Years | 143 (100.0%) | 152 (100.0%) |
| 55 to 64 Years | 159 (85.0%) | 144 (100.0%) |
| 65 to 74 Years | 129 (100.0%) | 80 (69.0%) |
| 75 Years and over | 43 (72.9%) | 66 (63.5%) |
| Total | 1,160 (82.3%) | 1,066 (77.0%) |
Income Below Poverty Among Married-Couple Families in Edneyville
The poverty statistics for married-couple families in Edneyville show that 3.1% or 16 of the total 517 families live below the poverty line. Families with no children have the highest poverty rate of 5.1%, comprising of 16 families. On the other hand, families with 1 or 2 children have the lowest poverty rate of 0.0%, which includes 0 families.
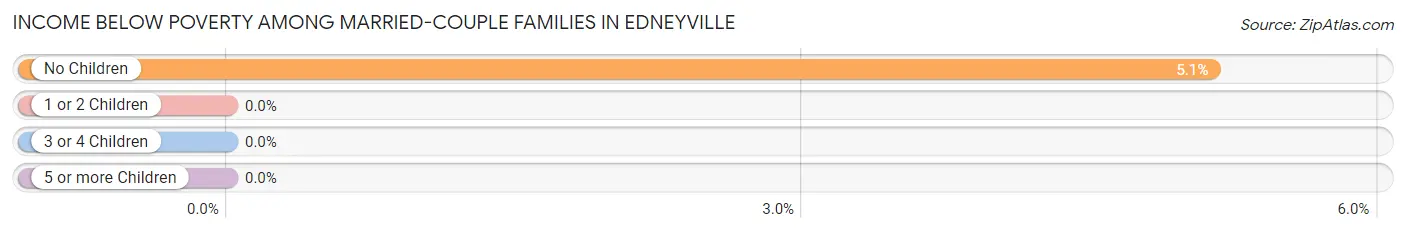
| Children | Above Poverty | Below Poverty |
| No Children | 296 (94.9%) | 16 (5.1%) |
| 1 or 2 Children | 195 (100.0%) | 0 (0.0%) |
| 3 or 4 Children | 10 (100.0%) | 0 (0.0%) |
| 5 or more Children | 0 (0.0%) | 0 (0.0%) |
| Total | 501 (96.9%) | 16 (3.1%) |
Income Below Poverty Among Single-Parent Households in Edneyville
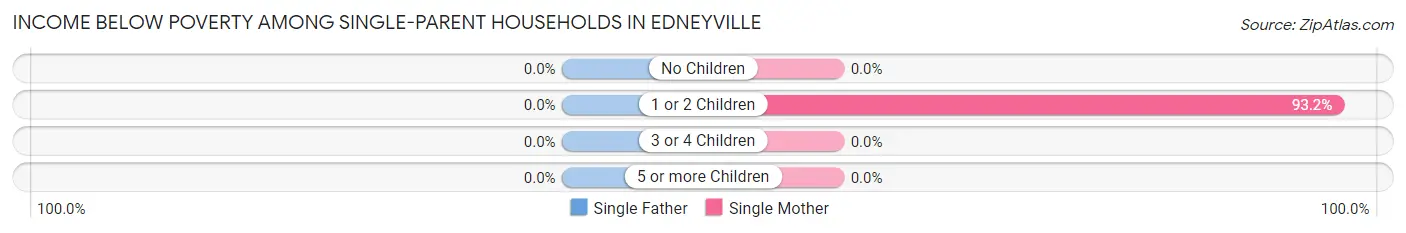
| Children | Single Father | Single Mother |
| No Children | 0 (0.0%) | 0 (0.0%) |
| 1 or 2 Children | 0 (0.0%) | 151 (93.2%) |
| 3 or 4 Children | 0 (0.0%) | 0 (0.0%) |
| 5 or more Children | 0 (0.0%) | 0 (0.0%) |
| Total | 0 (0.0%) | 151 (93.2%) |
Income Below Poverty Among Married-Couple vs Single-Parent Households in Edneyville
The poverty data for Edneyville shows that 16 of the married-couple family households (3.1%) and 151 of the single-parent households (62.7%) are living below the poverty level. Within the married-couple family households, those with no children have the highest poverty rate, with 16 households (5.1%) falling below the poverty line. Among the single-parent households, those with 1 or 2 children have the highest poverty rate, with 151 household (81.2%) living below poverty.
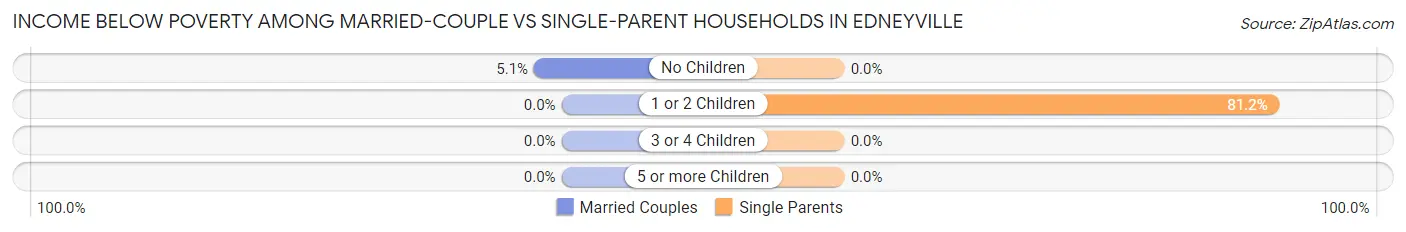
| Children | Married-Couple Families | Single-Parent Households |
| No Children | 16 (5.1%) | 0 (0.0%) |
| 1 or 2 Children | 0 (0.0%) | 151 (81.2%) |
| 3 or 4 Children | 0 (0.0%) | 0 (0.0%) |
| 5 or more Children | 0 (0.0%) | 0 (0.0%) |
| Total | 16 (3.1%) | 151 (62.7%) |
Employment Characteristics in Edneyville
Employment by Class of Employer in Edneyville
Among the 1,569 employed individuals in Edneyville, private company employees (1,014 | 64.6%), local government employees (233 | 14.8%), and self-employed (not incorporated) (119 | 7.6%) make up the most common classes of employment.
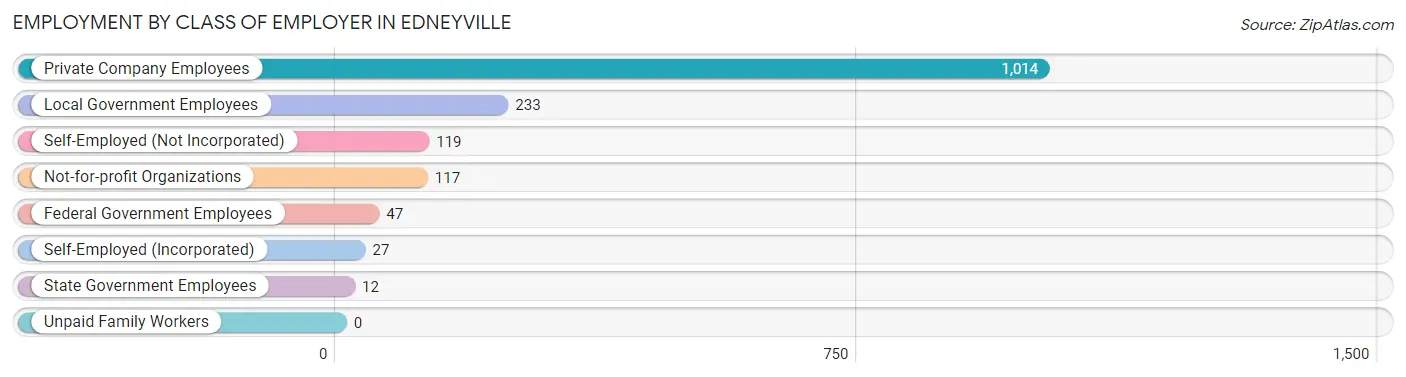
| Employer Class | # Employees | % Employees |
| Private Company Employees | 1,014 | 64.6% |
| Self-Employed (Incorporated) | 27 | 1.7% |
| Self-Employed (Not Incorporated) | 119 | 7.6% |
| Not-for-profit Organizations | 117 | 7.5% |
| Local Government Employees | 233 | 14.8% |
| State Government Employees | 12 | 0.8% |
| Federal Government Employees | 47 | 3.0% |
| Unpaid Family Workers | 0 | 0.0% |
| Total | 1,569 | 100.0% |
Employment Status by Age in Edneyville
According to the labor force statistics for Edneyville, out of the total population over 16 years of age (2,129), 75.0% or 1,597 individuals are in the labor force, with 1.0% or 16 of them unemployed. The age group with the highest labor force participation rate is 20 to 24 years, with 100.0% or 207 individuals in the labor force. Within the labor force, the 75 years and over age range has the highest percentage of unemployed individuals, with 100.0% or 7 of them being unemployed.
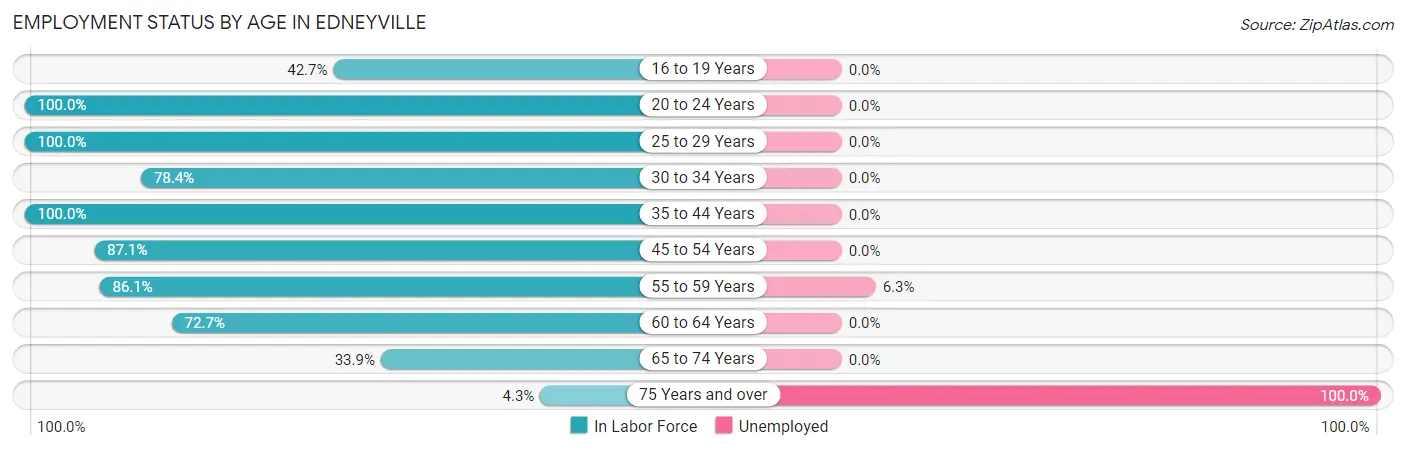
| Age Bracket | In Labor Force | Unemployed |
| 16 to 19 Years | 41 (42.7%) | 0 (0.0%) |
| 20 to 24 Years | 207 (100.0%) | 0 (0.0%) |
| 25 to 29 Years | 157 (100.0%) | 0 (0.0%) |
| 30 to 34 Years | 196 (78.4%) | 0 (0.0%) |
| 35 to 44 Years | 385 (100.0%) | 0 (0.0%) |
| 45 to 54 Years | 257 (87.1%) | 0 (0.0%) |
| 55 to 59 Years | 143 (86.1%) | 9 (6.3%) |
| 60 to 64 Years | 120 (72.7%) | 0 (0.0%) |
| 65 to 74 Years | 83 (33.9%) | 0 (0.0%) |
| 75 Years and over | 7 (4.3%) | 7 (100.0%) |
| Total | 1,597 (75.0%) | 16 (1.0%) |
Employment Status by Educational Attainment in Edneyville
According to labor force statistics for Edneyville, 88.7% of individuals (1,258) out of the total population between 25 and 64 years of age (1,418) are in the labor force, with 0.7% or 9 of them being unemployed. The group with the highest labor force participation rate are those with the educational attainment of less than high school, with 100.0% or 61 individuals in the labor force. Within the labor force, individuals with high school diploma education have the highest percentage of unemployment, with 2.7% or 9 of them being unemployed.
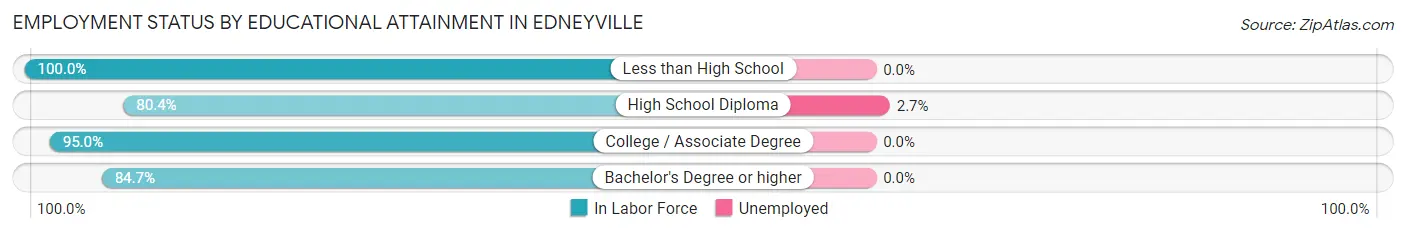
| Educational Attainment | In Labor Force | Unemployed |
| Less than High School | 61 (100.0%) | 0 (0.0%) |
| High School Diploma | 333 (80.4%) | 11 (2.7%) |
| College / Associate Degree | 604 (95.0%) | 0 (0.0%) |
| Bachelor's Degree or higher | 260 (84.7%) | 0 (0.0%) |
| Total | 1,258 (88.7%) | 10 (0.7%) |
Employment Occupations by Sex in Edneyville
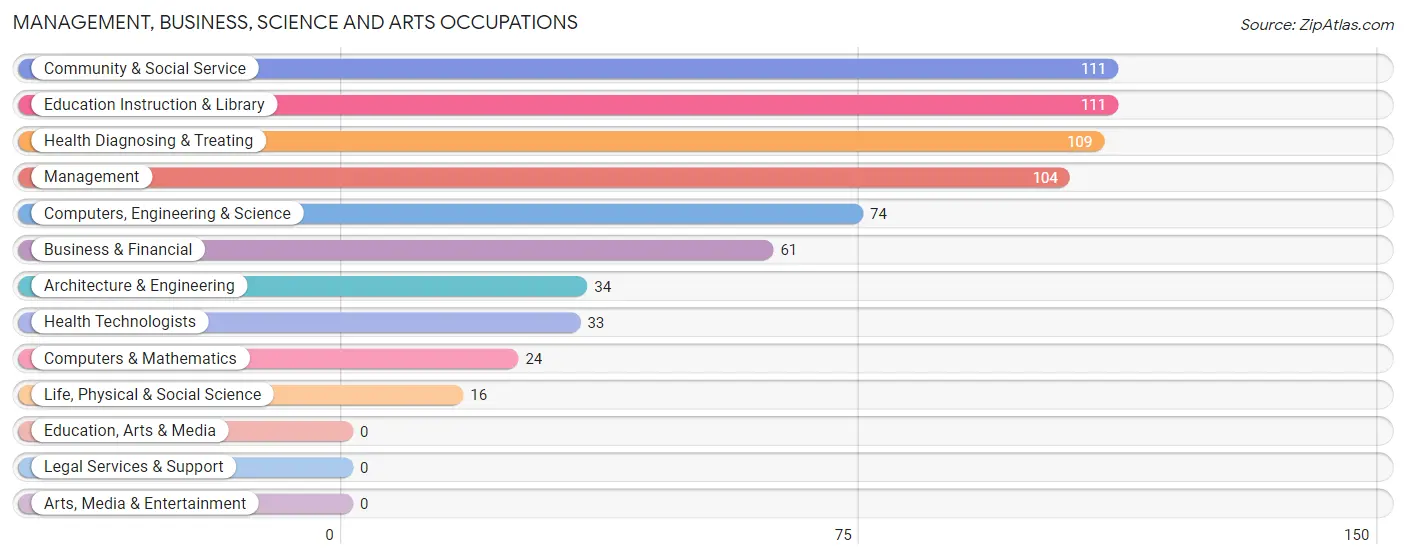
Management, Business, Science and Arts Occupations
The most common Management, Business, Science and Arts occupations in Edneyville are Community & Social Service (111 | 7.0%), Education Instruction & Library (111 | 7.0%), Health Diagnosing & Treating (109 | 6.9%), Management (104 | 6.6%), and Computers, Engineering & Science (74 | 4.7%).
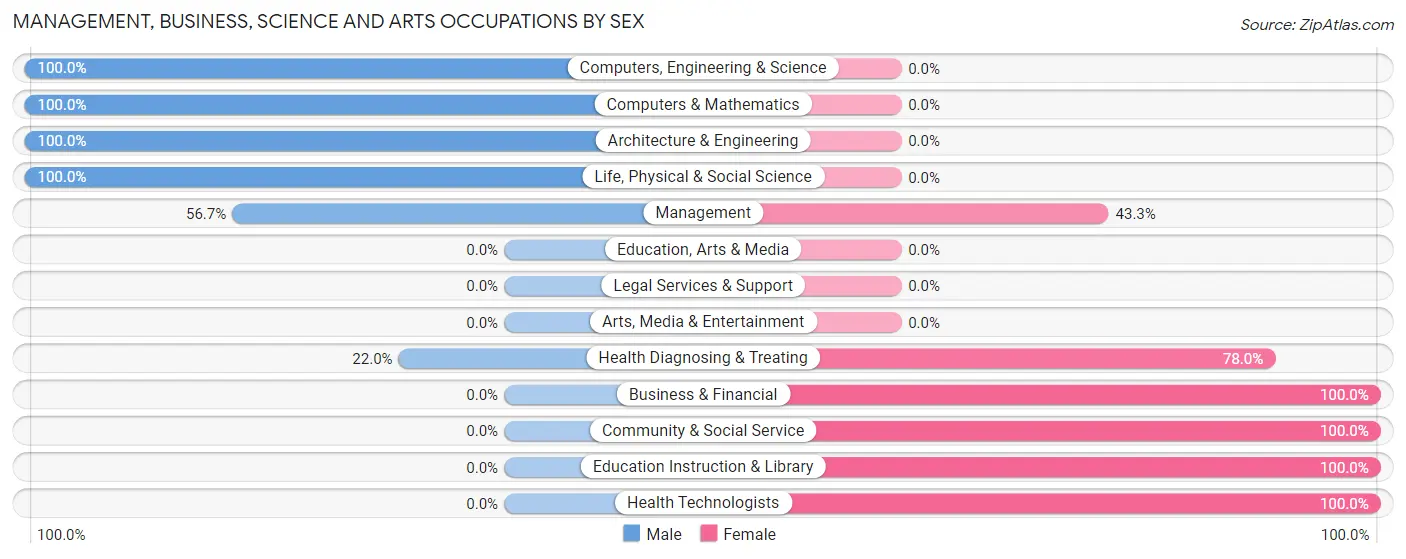
Management, Business, Science and Arts Occupations by Sex
Within the Management, Business, Science and Arts occupations in Edneyville, the most male-oriented occupations are Computers, Engineering & Science (100.0%), Computers & Mathematics (100.0%), and Architecture & Engineering (100.0%), while the most female-oriented occupations are Business & Financial (100.0%), Community & Social Service (100.0%), and Education Instruction & Library (100.0%).
| Occupation | Male | Female |
| Management | 59 (56.7%) | 45 (43.3%) |
| Business & Financial | 0 (0.0%) | 61 (100.0%) |
| Computers, Engineering & Science | 74 (100.0%) | 0 (0.0%) |
| Computers & Mathematics | 24 (100.0%) | 0 (0.0%) |
| Architecture & Engineering | 34 (100.0%) | 0 (0.0%) |
| Life, Physical & Social Science | 16 (100.0%) | 0 (0.0%) |
| Community & Social Service | 0 (0.0%) | 111 (100.0%) |
| Education, Arts & Media | 0 (0.0%) | 0 (0.0%) |
| Legal Services & Support | 0 (0.0%) | 0 (0.0%) |
| Education Instruction & Library | 0 (0.0%) | 111 (100.0%) |
| Arts, Media & Entertainment | 0 (0.0%) | 0 (0.0%) |
| Health Diagnosing & Treating | 24 (22.0%) | 85 (78.0%) |
| Health Technologists | 0 (0.0%) | 33 (100.0%) |
| Total (Category) | 157 (34.2%) | 302 (65.8%) |
| Total (Overall) | 821 (52.0%) | 759 (48.0%) |
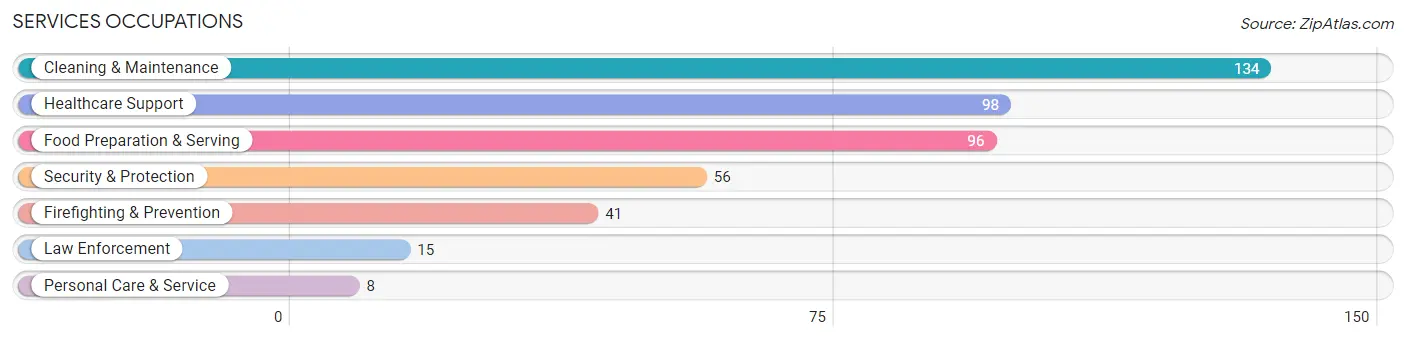
Services Occupations
The most common Services occupations in Edneyville are Cleaning & Maintenance (134 | 8.5%), Healthcare Support (98 | 6.2%), Food Preparation & Serving (96 | 6.1%), Security & Protection (56 | 3.5%), and Firefighting & Prevention (41 | 2.6%).
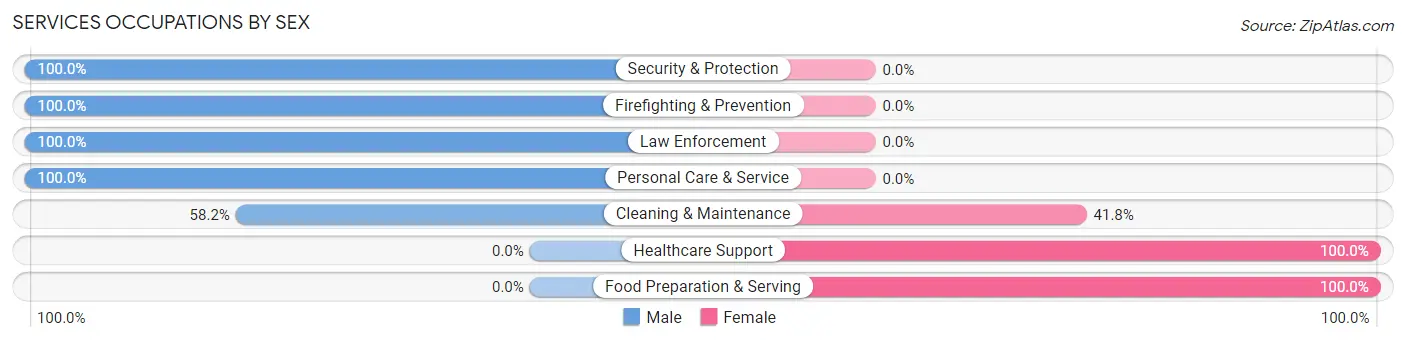
Services Occupations by Sex
Within the Services occupations in Edneyville, the most male-oriented occupations are Security & Protection (100.0%), Firefighting & Prevention (100.0%), and Law Enforcement (100.0%), while the most female-oriented occupations are Healthcare Support (100.0%), Food Preparation & Serving (100.0%), and Cleaning & Maintenance (41.8%).
| Occupation | Male | Female |
| Healthcare Support | 0 (0.0%) | 98 (100.0%) |
| Security & Protection | 56 (100.0%) | 0 (0.0%) |
| Firefighting & Prevention | 41 (100.0%) | 0 (0.0%) |
| Law Enforcement | 15 (100.0%) | 0 (0.0%) |
| Food Preparation & Serving | 0 (0.0%) | 96 (100.0%) |
| Cleaning & Maintenance | 78 (58.2%) | 56 (41.8%) |
| Personal Care & Service | 8 (100.0%) | 0 (0.0%) |
| Total (Category) | 142 (36.2%) | 250 (63.8%) |
| Total (Overall) | 821 (52.0%) | 759 (48.0%) |
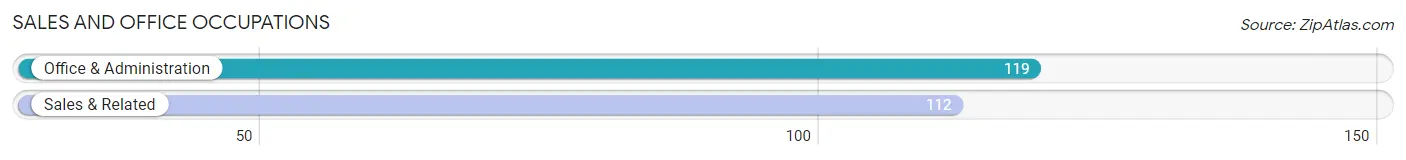
Sales and Office Occupations
The most common Sales and Office occupations in Edneyville are Office & Administration (119 | 7.5%), and Sales & Related (112 | 7.1%).
Sales and Office Occupations by Sex
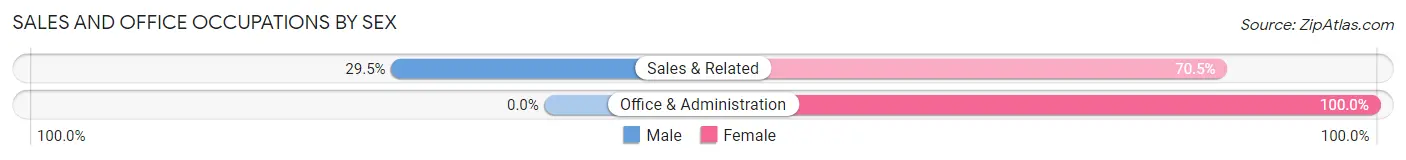
| Occupation | Male | Female |
| Sales & Related | 33 (29.5%) | 79 (70.5%) |
| Office & Administration | 0 (0.0%) | 119 (100.0%) |
| Total (Category) | 33 (14.3%) | 198 (85.7%) |
| Total (Overall) | 821 (52.0%) | 759 (48.0%) |
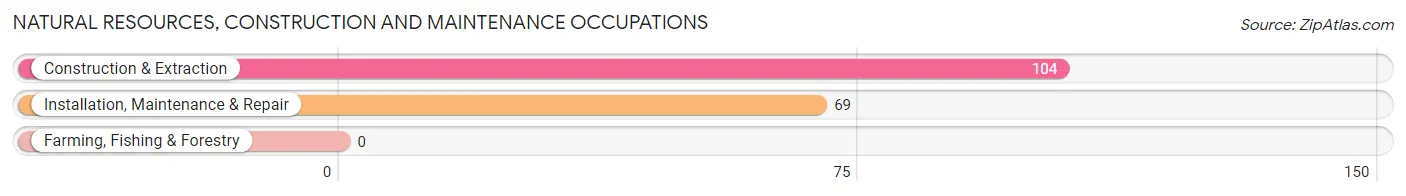
Natural Resources, Construction and Maintenance Occupations
The most common Natural Resources, Construction and Maintenance occupations in Edneyville are Construction & Extraction (104 | 6.6%), and Installation, Maintenance & Repair (69 | 4.4%).
Natural Resources, Construction and Maintenance Occupations by Sex
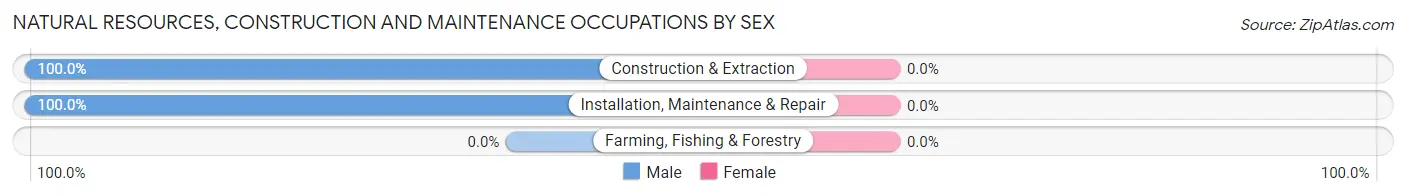
| Occupation | Male | Female |
| Farming, Fishing & Forestry | 0 (0.0%) | 0 (0.0%) |
| Construction & Extraction | 104 (100.0%) | 0 (0.0%) |
| Installation, Maintenance & Repair | 69 (100.0%) | 0 (0.0%) |
| Total (Category) | 173 (100.0%) | 0 (0.0%) |
| Total (Overall) | 821 (52.0%) | 759 (48.0%) |
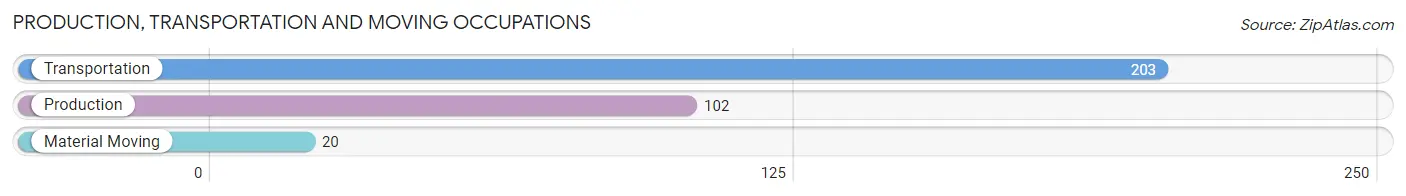
Production, Transportation and Moving Occupations
The most common Production, Transportation and Moving occupations in Edneyville are Transportation (203 | 12.9%), Production (102 | 6.5%), and Material Moving (20 | 1.3%).
Production, Transportation and Moving Occupations by Sex
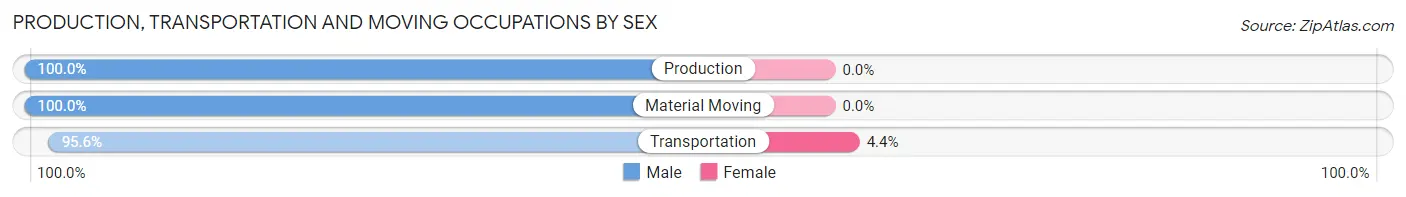
| Occupation | Male | Female |
| Production | 102 (100.0%) | 0 (0.0%) |
| Transportation | 194 (95.6%) | 9 (4.4%) |
| Material Moving | 20 (100.0%) | 0 (0.0%) |
| Total (Category) | 316 (97.2%) | 9 (2.8%) |
| Total (Overall) | 821 (52.0%) | 759 (48.0%) |
Employment Industries by Sex in Edneyville
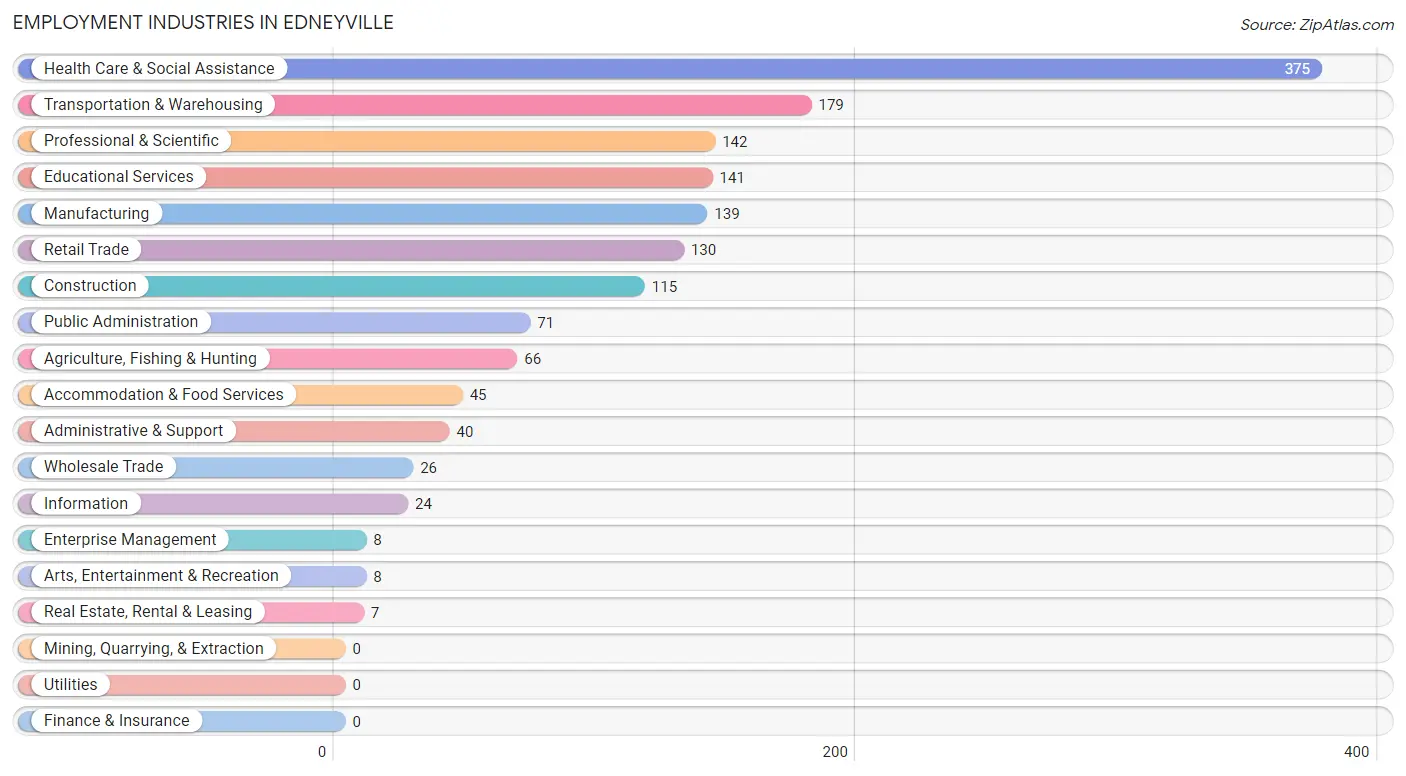
Employment Industries in Edneyville
The major employment industries in Edneyville include Health Care & Social Assistance (375 | 23.7%), Transportation & Warehousing (179 | 11.3%), Professional & Scientific (142 | 9.0%), Educational Services (141 | 8.9%), and Manufacturing (139 | 8.8%).
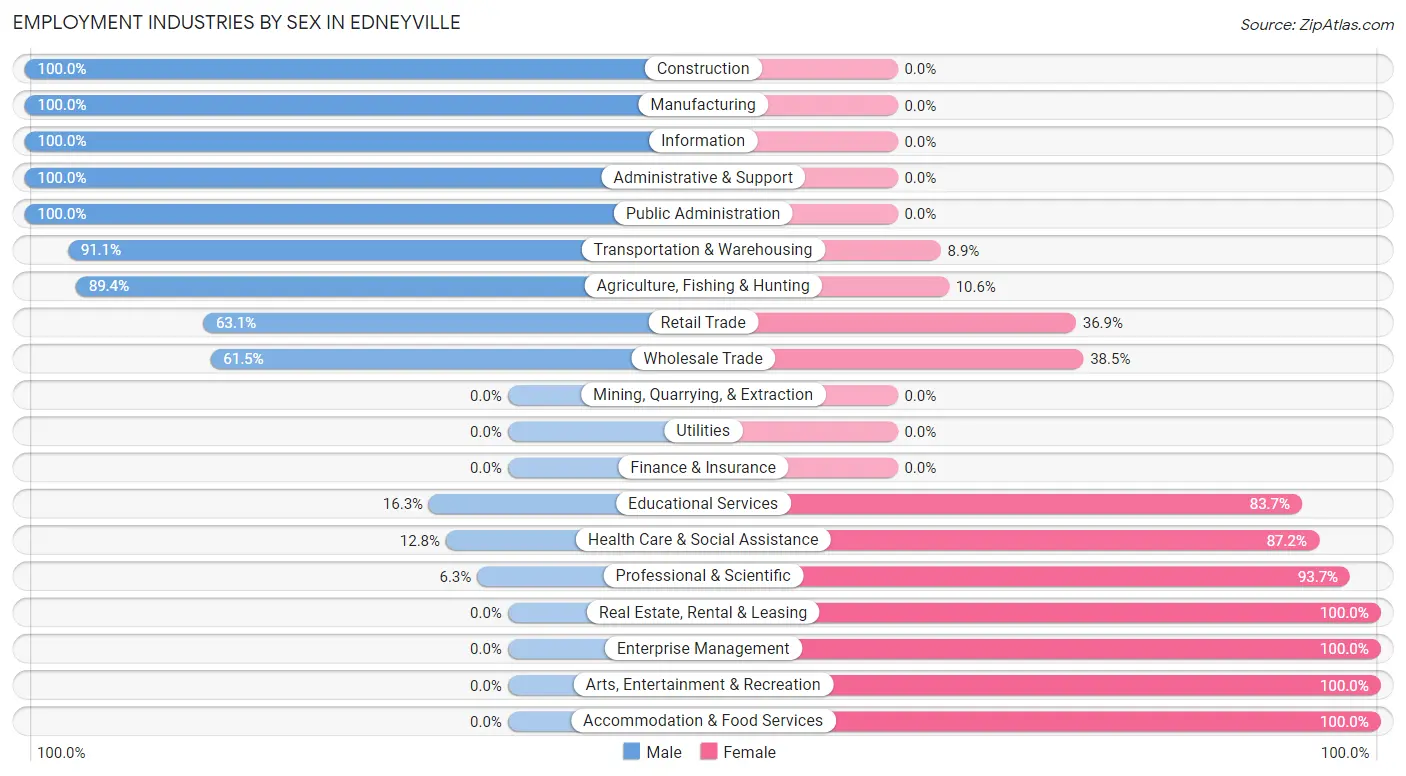
Employment Industries by Sex in Edneyville
The Edneyville industries that see more men than women are Construction (100.0%), Manufacturing (100.0%), and Information (100.0%), whereas the industries that tend to have a higher number of women are Real Estate, Rental & Leasing (100.0%), Enterprise Management (100.0%), and Arts, Entertainment & Recreation (100.0%).
| Industry | Male | Female |
| Agriculture, Fishing & Hunting | 59 (89.4%) | 7 (10.6%) |
| Mining, Quarrying, & Extraction | 0 (0.0%) | 0 (0.0%) |
| Construction | 115 (100.0%) | 0 (0.0%) |
| Manufacturing | 139 (100.0%) | 0 (0.0%) |
| Wholesale Trade | 16 (61.5%) | 10 (38.5%) |
| Retail Trade | 82 (63.1%) | 48 (36.9%) |
| Transportation & Warehousing | 163 (91.1%) | 16 (8.9%) |
| Utilities | 0 (0.0%) | 0 (0.0%) |
| Information | 24 (100.0%) | 0 (0.0%) |
| Finance & Insurance | 0 (0.0%) | 0 (0.0%) |
| Real Estate, Rental & Leasing | 0 (0.0%) | 7 (100.0%) |
| Professional & Scientific | 9 (6.3%) | 133 (93.7%) |
| Enterprise Management | 0 (0.0%) | 8 (100.0%) |
| Administrative & Support | 40 (100.0%) | 0 (0.0%) |
| Educational Services | 23 (16.3%) | 118 (83.7%) |
| Health Care & Social Assistance | 48 (12.8%) | 327 (87.2%) |
| Arts, Entertainment & Recreation | 0 (0.0%) | 8 (100.0%) |
| Accommodation & Food Services | 0 (0.0%) | 45 (100.0%) |
| Public Administration | 71 (100.0%) | 0 (0.0%) |
| Total | 821 (52.0%) | 759 (48.0%) |
Education in Edneyville
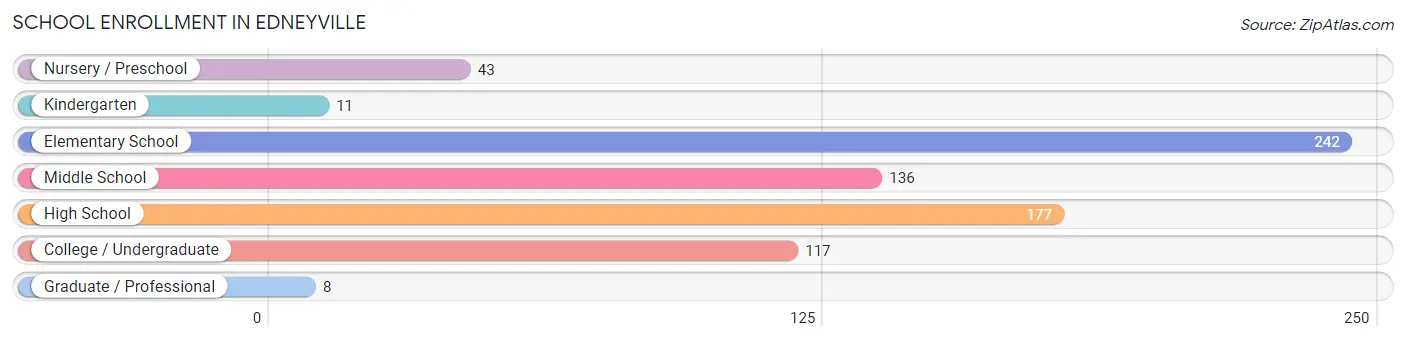
School Enrollment in Edneyville
The most common levels of schooling among the 734 students in Edneyville are elementary school (242 | 33.0%), high school (177 | 24.1%), and middle school (136 | 18.5%).
| School Level | # Students | % Students |
| Nursery / Preschool | 43 | 5.9% |
| Kindergarten | 11 | 1.5% |
| Elementary School | 242 | 33.0% |
| Middle School | 136 | 18.5% |
| High School | 177 | 24.1% |
| College / Undergraduate | 117 | 15.9% |
| Graduate / Professional | 8 | 1.1% |
| Total | 734 | 100.0% |
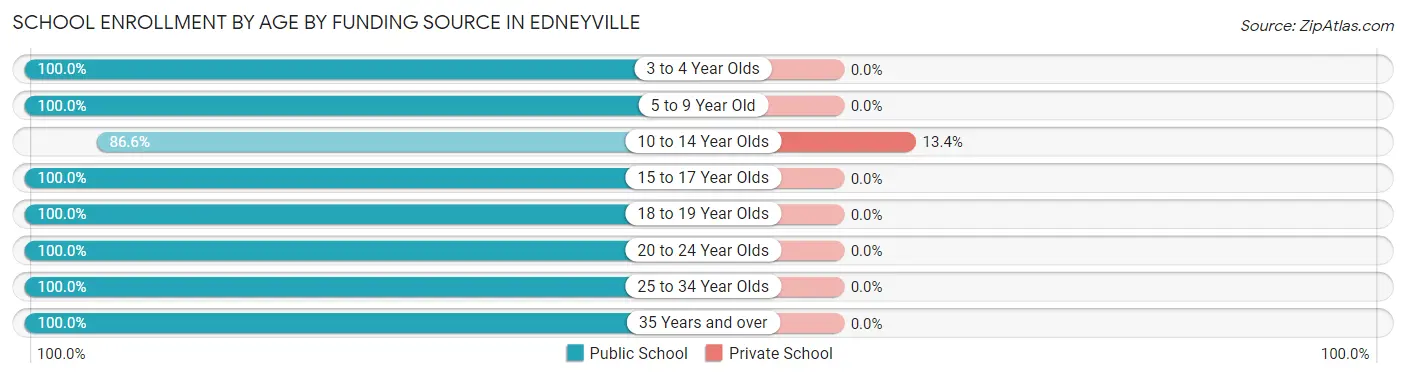
School Enrollment by Age by Funding Source in Edneyville
Out of a total of 734 students who are enrolled in schools in Edneyville, 22 (3.0%) attend a private institution, while the remaining 712 (97.0%) are enrolled in public schools. The age group of 10 to 14 year olds has the highest likelihood of being enrolled in private schools, with 22 (13.4% in the age bracket) enrolled. Conversely, the age group of 3 to 4 year olds has the lowest likelihood of being enrolled in a private school, with 9 (100.0% in the age bracket) attending a public institution.
| Age Bracket | Public School | Private School |
| 3 to 4 Year Olds | 9 (100.0%) | 0 (0.0%) |
| 5 to 9 Year Old | 287 (100.0%) | 0 (0.0%) |
| 10 to 14 Year Olds | 142 (86.6%) | 22 (13.4%) |
| 15 to 17 Year Olds | 123 (100.0%) | 0 (0.0%) |
| 18 to 19 Year Olds | 41 (100.0%) | 0 (0.0%) |
| 20 to 24 Year Olds | 5 (100.0%) | 0 (0.0%) |
| 25 to 34 Year Olds | 68 (100.0%) | 0 (0.0%) |
| 35 Years and over | 37 (100.0%) | 0 (0.0%) |
| Total | 712 (97.0%) | 22 (3.0%) |
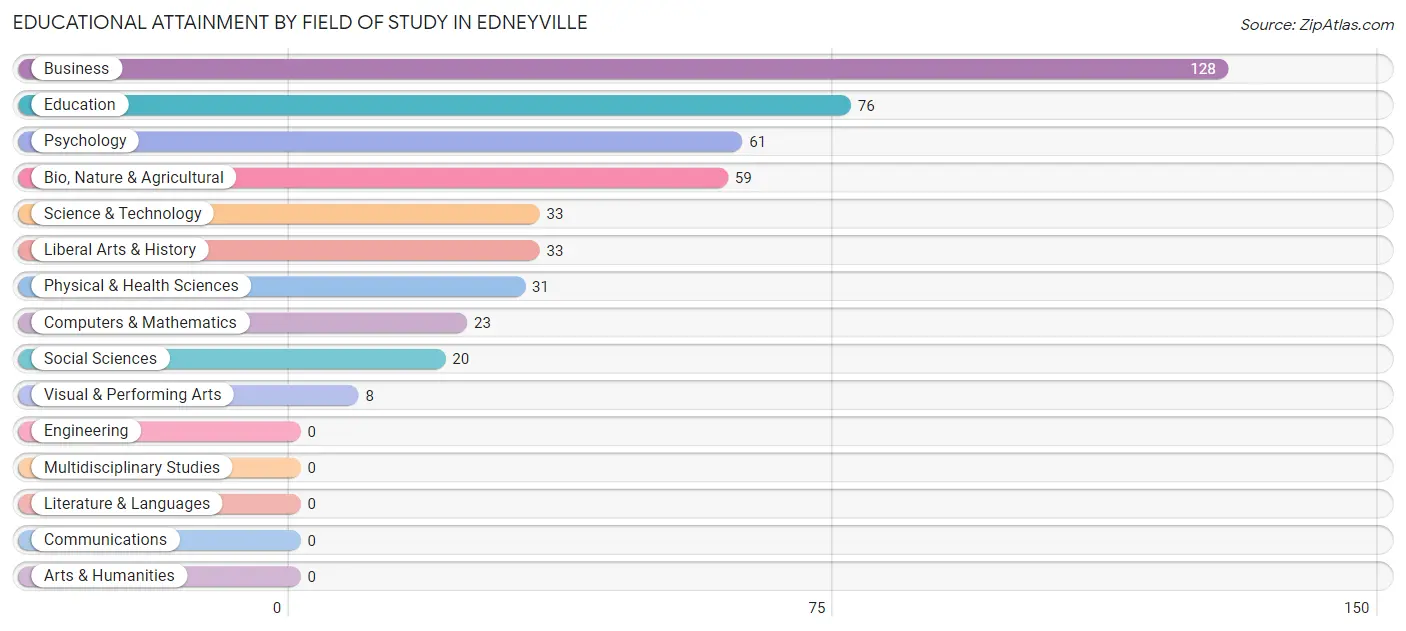
Educational Attainment by Field of Study in Edneyville
Business (128 | 27.1%), education (76 | 16.1%), psychology (61 | 12.9%), bio, nature & agricultural (59 | 12.5%), and science & technology (33 | 7.0%) are the most common fields of study among 472 individuals in Edneyville who have obtained a bachelor's degree or higher.
| Field of Study | # Graduates | % Graduates |
| Computers & Mathematics | 23 | 4.9% |
| Bio, Nature & Agricultural | 59 | 12.5% |
| Physical & Health Sciences | 31 | 6.6% |
| Psychology | 61 | 12.9% |
| Social Sciences | 20 | 4.2% |
| Engineering | 0 | 0.0% |
| Multidisciplinary Studies | 0 | 0.0% |
| Science & Technology | 33 | 7.0% |
| Business | 128 | 27.1% |
| Education | 76 | 16.1% |
| Literature & Languages | 0 | 0.0% |
| Liberal Arts & History | 33 | 7.0% |
| Visual & Performing Arts | 8 | 1.7% |
| Communications | 0 | 0.0% |
| Arts & Humanities | 0 | 0.0% |
| Total | 472 | 100.0% |
Transportation & Commute in Edneyville
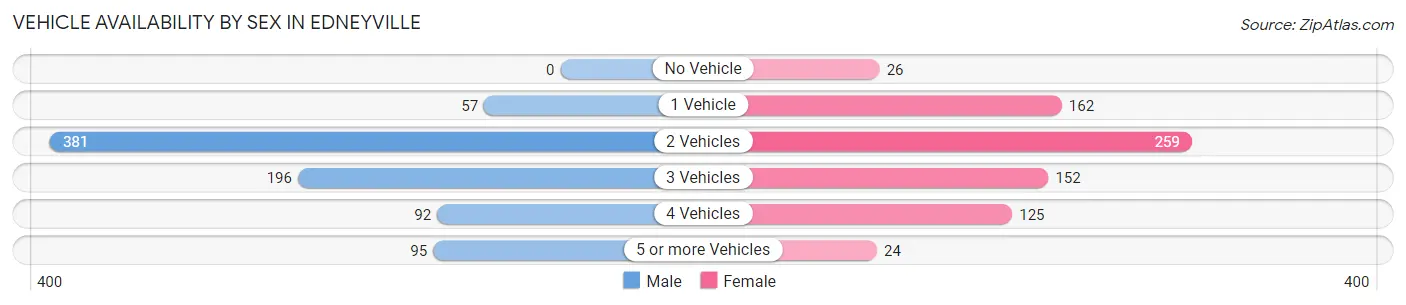
Vehicle Availability by Sex in Edneyville
The most prevalent vehicle ownership categories in Edneyville are males with 2 vehicles (381, accounting for 46.4%) and females with 2 vehicles (259, making up 50.9%).
| Vehicles Available | Male | Female |
| No Vehicle | 0 (0.0%) | 26 (3.5%) |
| 1 Vehicle | 57 (6.9%) | 162 (21.7%) |
| 2 Vehicles | 381 (46.4%) | 259 (34.6%) |
| 3 Vehicles | 196 (23.9%) | 152 (20.3%) |
| 4 Vehicles | 92 (11.2%) | 125 (16.7%) |
| 5 or more Vehicles | 95 (11.6%) | 24 (3.2%) |
| Total | 821 (100.0%) | 748 (100.0%) |
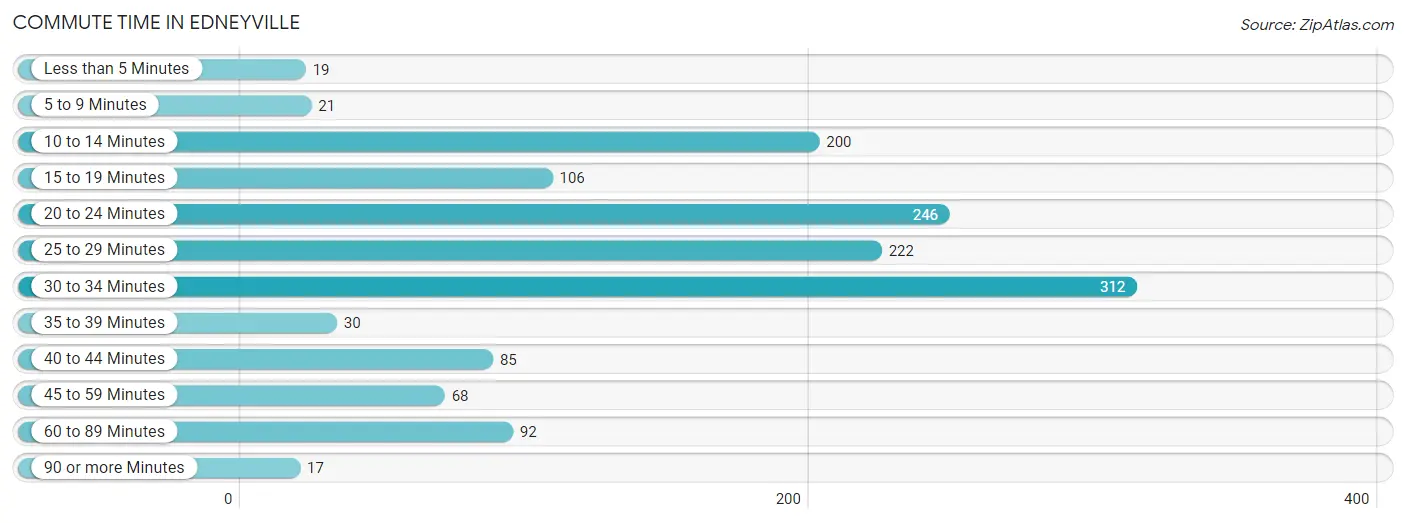
Commute Time in Edneyville
The most frequently occuring commute durations in Edneyville are 30 to 34 minutes (312 commuters, 22.0%), 20 to 24 minutes (246 commuters, 17.3%), and 25 to 29 minutes (222 commuters, 15.7%).
| Commute Time | # Commuters | % Commuters |
| Less than 5 Minutes | 19 | 1.3% |
| 5 to 9 Minutes | 21 | 1.5% |
| 10 to 14 Minutes | 200 | 14.1% |
| 15 to 19 Minutes | 106 | 7.5% |
| 20 to 24 Minutes | 246 | 17.3% |
| 25 to 29 Minutes | 222 | 15.7% |
| 30 to 34 Minutes | 312 | 22.0% |
| 35 to 39 Minutes | 30 | 2.1% |
| 40 to 44 Minutes | 85 | 6.0% |
| 45 to 59 Minutes | 68 | 4.8% |
| 60 to 89 Minutes | 92 | 6.5% |
| 90 or more Minutes | 17 | 1.2% |
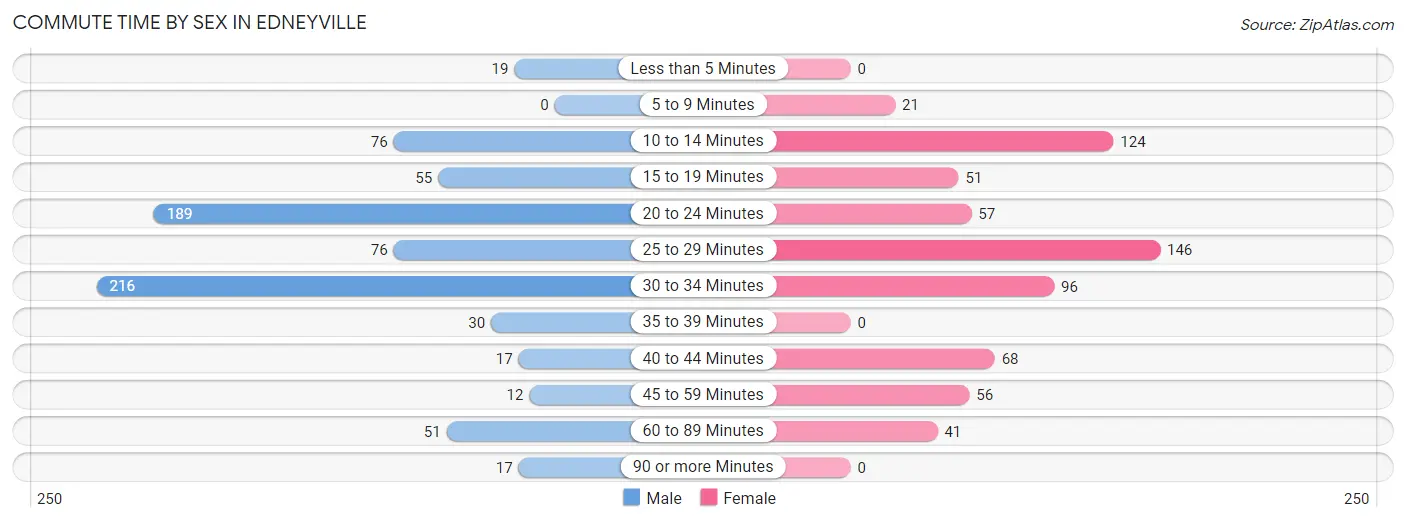
Commute Time by Sex in Edneyville
The most common commute times in Edneyville are 30 to 34 minutes (216 commuters, 28.5%) for males and 25 to 29 minutes (146 commuters, 22.1%) for females.
| Commute Time | Male | Female |
| Less than 5 Minutes | 19 (2.5%) | 0 (0.0%) |
| 5 to 9 Minutes | 0 (0.0%) | 21 (3.2%) |
| 10 to 14 Minutes | 76 (10.0%) | 124 (18.8%) |
| 15 to 19 Minutes | 55 (7.3%) | 51 (7.7%) |
| 20 to 24 Minutes | 189 (24.9%) | 57 (8.6%) |
| 25 to 29 Minutes | 76 (10.0%) | 146 (22.1%) |
| 30 to 34 Minutes | 216 (28.5%) | 96 (14.5%) |
| 35 to 39 Minutes | 30 (4.0%) | 0 (0.0%) |
| 40 to 44 Minutes | 17 (2.2%) | 68 (10.3%) |
| 45 to 59 Minutes | 12 (1.6%) | 56 (8.5%) |
| 60 to 89 Minutes | 51 (6.7%) | 41 (6.2%) |
| 90 or more Minutes | 17 (2.2%) | 0 (0.0%) |
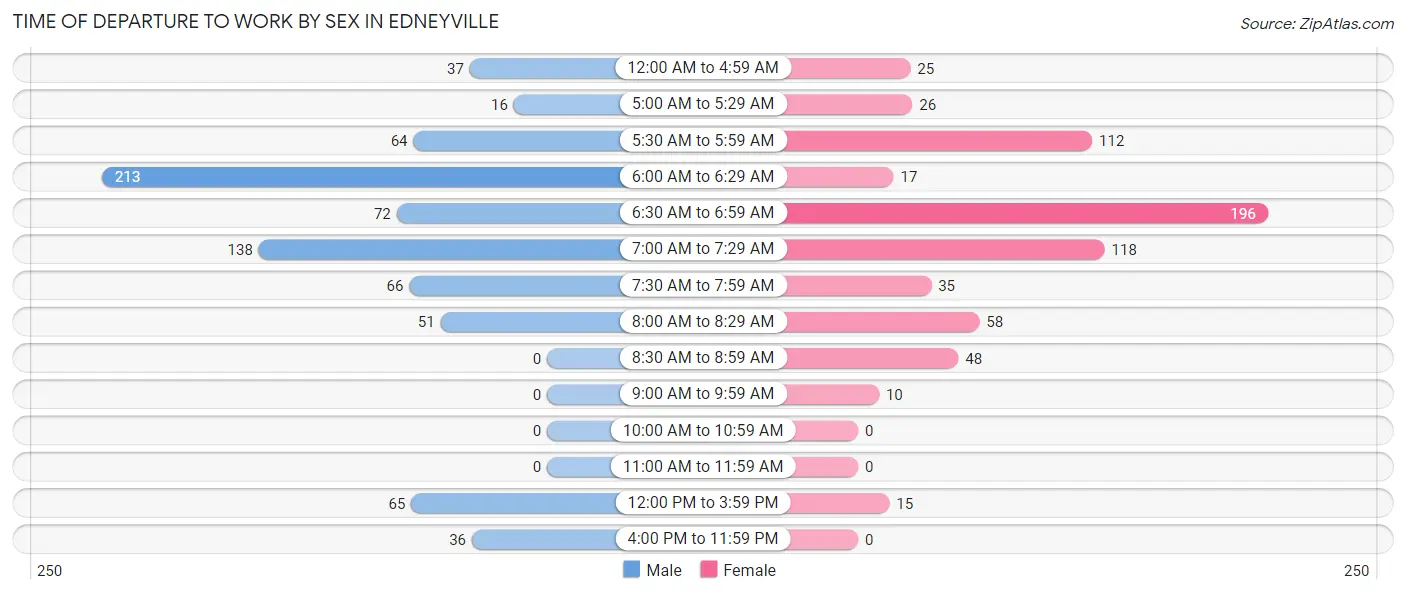
Time of Departure to Work by Sex in Edneyville
The most frequent times of departure to work in Edneyville are 6:00 AM to 6:29 AM (213, 28.1%) for males and 6:30 AM to 6:59 AM (196, 29.7%) for females.
| Time of Departure | Male | Female |
| 12:00 AM to 4:59 AM | 37 (4.9%) | 25 (3.8%) |
| 5:00 AM to 5:29 AM | 16 (2.1%) | 26 (3.9%) |
| 5:30 AM to 5:59 AM | 64 (8.4%) | 112 (17.0%) |
| 6:00 AM to 6:29 AM | 213 (28.1%) | 17 (2.6%) |
| 6:30 AM to 6:59 AM | 72 (9.5%) | 196 (29.7%) |
| 7:00 AM to 7:29 AM | 138 (18.2%) | 118 (17.9%) |
| 7:30 AM to 7:59 AM | 66 (8.7%) | 35 (5.3%) |
| 8:00 AM to 8:29 AM | 51 (6.7%) | 58 (8.8%) |
| 8:30 AM to 8:59 AM | 0 (0.0%) | 48 (7.3%) |
| 9:00 AM to 9:59 AM | 0 (0.0%) | 10 (1.5%) |
| 10:00 AM to 10:59 AM | 0 (0.0%) | 0 (0.0%) |
| 11:00 AM to 11:59 AM | 0 (0.0%) | 0 (0.0%) |
| 12:00 PM to 3:59 PM | 65 (8.6%) | 15 (2.3%) |
| 4:00 PM to 11:59 PM | 36 (4.8%) | 0 (0.0%) |
| Total | 758 (100.0%) | 660 (100.0%) |
Housing Occupancy in Edneyville
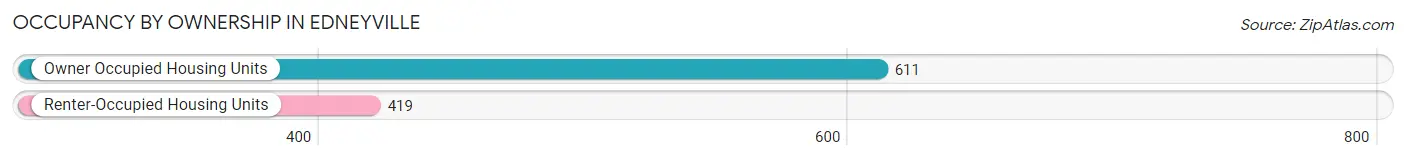
Occupancy by Ownership in Edneyville
Of the total 1,030 dwellings in Edneyville, owner-occupied units account for 611 (59.3%), while renter-occupied units make up 419 (40.7%).
| Occupancy | # Housing Units | % Housing Units |
| Owner Occupied Housing Units | 611 | 59.3% |
| Renter-Occupied Housing Units | 419 | 40.7% |
| Total Occupied Housing Units | 1,030 | 100.0% |
Occupancy by Household Size in Edneyville
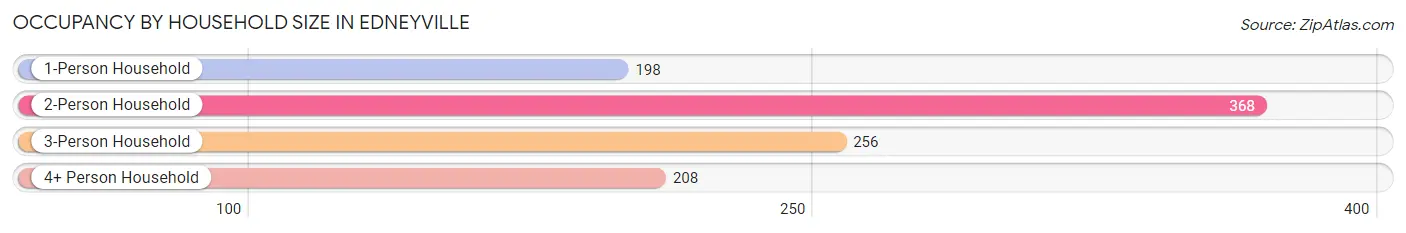
| Household Size | # Housing Units | % Housing Units |
| 1-Person Household | 198 | 19.2% |
| 2-Person Household | 368 | 35.7% |
| 3-Person Household | 256 | 24.8% |
| 4+ Person Household | 208 | 20.2% |
| Total Housing Units | 1,030 | 100.0% |
Occupancy by Ownership by Household Size in Edneyville
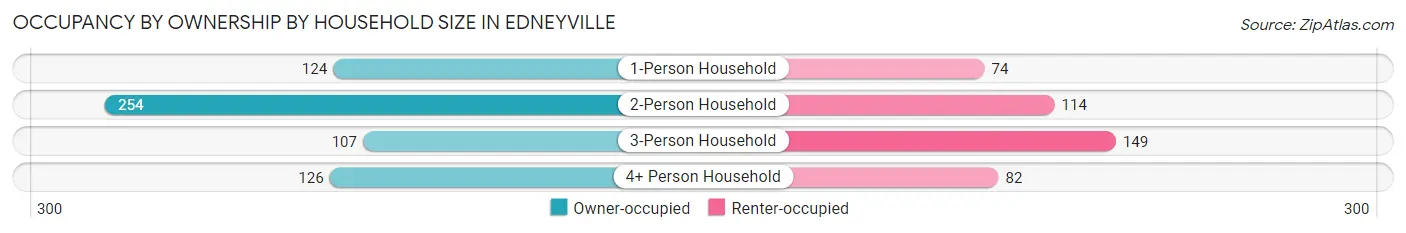
| Household Size | Owner-occupied | Renter-occupied |
| 1-Person Household | 124 (62.6%) | 74 (37.4%) |
| 2-Person Household | 254 (69.0%) | 114 (31.0%) |
| 3-Person Household | 107 (41.8%) | 149 (58.2%) |
| 4+ Person Household | 126 (60.6%) | 82 (39.4%) |
| Total Housing Units | 611 (59.3%) | 419 (40.7%) |
Occupancy by Educational Attainment in Edneyville
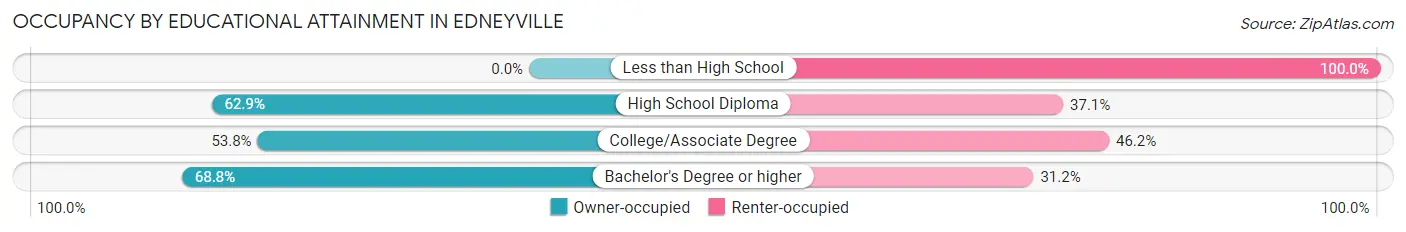
| Household Size | Owner-occupied | Renter-occupied |
| Less than High School | 0 (0.0%) | 30 (100.0%) |
| High School Diploma | 197 (62.9%) | 116 (37.1%) |
| College/Associate Degree | 211 (53.8%) | 181 (46.2%) |
| Bachelor's Degree or higher | 203 (68.8%) | 92 (31.2%) |
Occupancy by Age of Householder in Edneyville
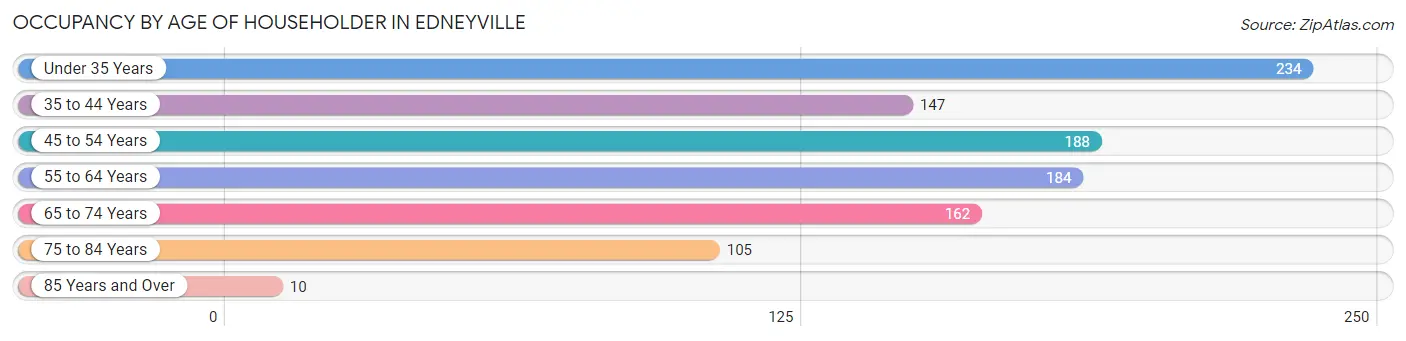
| Age Bracket | # Households | % Households |
| Under 35 Years | 234 | 22.7% |
| 35 to 44 Years | 147 | 14.3% |
| 45 to 54 Years | 188 | 18.2% |
| 55 to 64 Years | 184 | 17.9% |
| 65 to 74 Years | 162 | 15.7% |
| 75 to 84 Years | 105 | 10.2% |
| 85 Years and Over | 10 | 1.0% |
| Total | 1,030 | 100.0% |
Housing Finances in Edneyville
Median Income by Occupancy in Edneyville
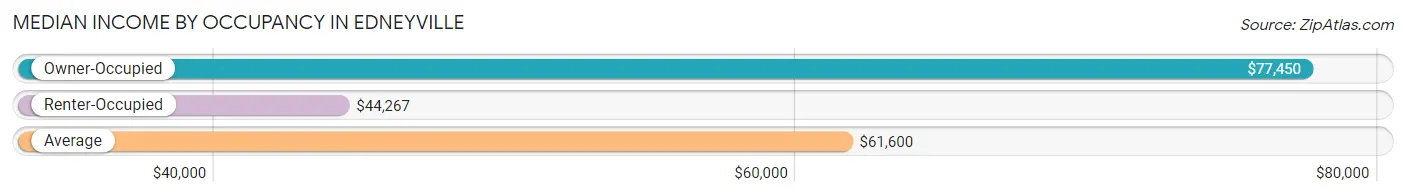
| Occupancy Type | # Households | Median Income |
| Owner-Occupied | 611 (59.3%) | $77,450 |
| Renter-Occupied | 419 (40.7%) | $44,267 |
| Average | 1,030 (100.0%) | $61,600 |
Occupancy by Householder Income Bracket in Edneyville
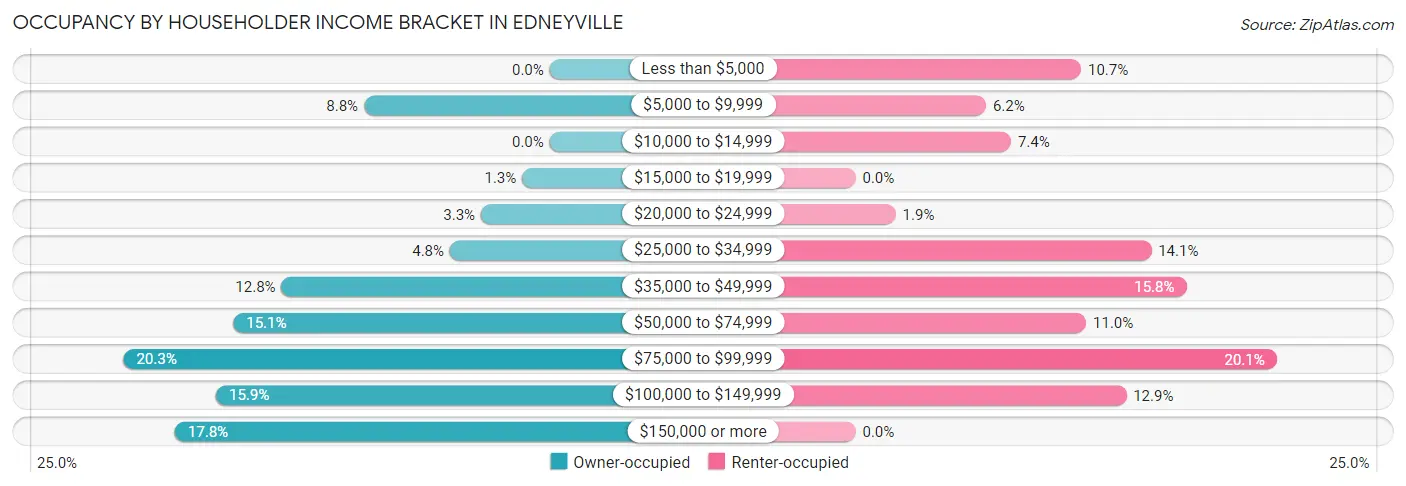
| Income Bracket | Owner-occupied | Renter-occupied |
| Less than $5,000 | 0 (0.0%) | 45 (10.7%) |
| $5,000 to $9,999 | 54 (8.8%) | 26 (6.2%) |
| $10,000 to $14,999 | 0 (0.0%) | 31 (7.4%) |
| $15,000 to $19,999 | 8 (1.3%) | 0 (0.0%) |
| $20,000 to $24,999 | 20 (3.3%) | 8 (1.9%) |
| $25,000 to $34,999 | 29 (4.8%) | 59 (14.1%) |
| $35,000 to $49,999 | 78 (12.8%) | 66 (15.8%) |
| $50,000 to $74,999 | 92 (15.1%) | 46 (11.0%) |
| $75,000 to $99,999 | 124 (20.3%) | 84 (20.1%) |
| $100,000 to $149,999 | 97 (15.9%) | 54 (12.9%) |
| $150,000 or more | 109 (17.8%) | 0 (0.0%) |
| Total | 611 (100.0%) | 419 (100.0%) |
Monthly Housing Cost Tiers in Edneyville
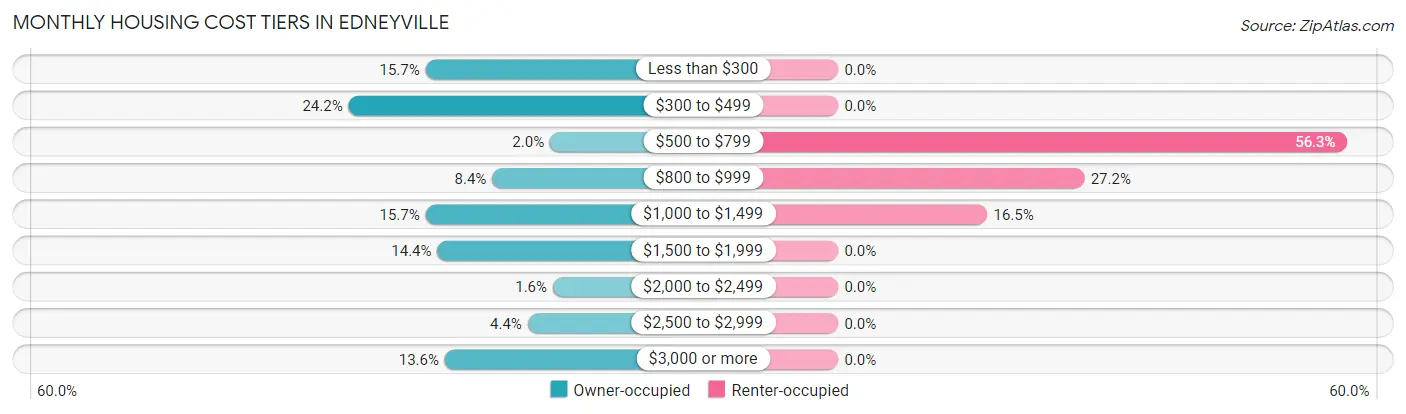
| Monthly Cost | Owner-occupied | Renter-occupied |
| Less than $300 | 96 (15.7%) | 0 (0.0%) |
| $300 to $499 | 148 (24.2%) | 0 (0.0%) |
| $500 to $799 | 12 (2.0%) | 236 (56.3%) |
| $800 to $999 | 51 (8.4%) | 114 (27.2%) |
| $1,000 to $1,499 | 96 (15.7%) | 69 (16.5%) |
| $1,500 to $1,999 | 88 (14.4%) | 0 (0.0%) |
| $2,000 to $2,499 | 10 (1.6%) | 0 (0.0%) |
| $2,500 to $2,999 | 27 (4.4%) | 0 (0.0%) |
| $3,000 or more | 83 (13.6%) | 0 (0.0%) |
| Total | 611 (100.0%) | 419 (100.0%) |
Physical Housing Characteristics in Edneyville
Housing Structures in Edneyville
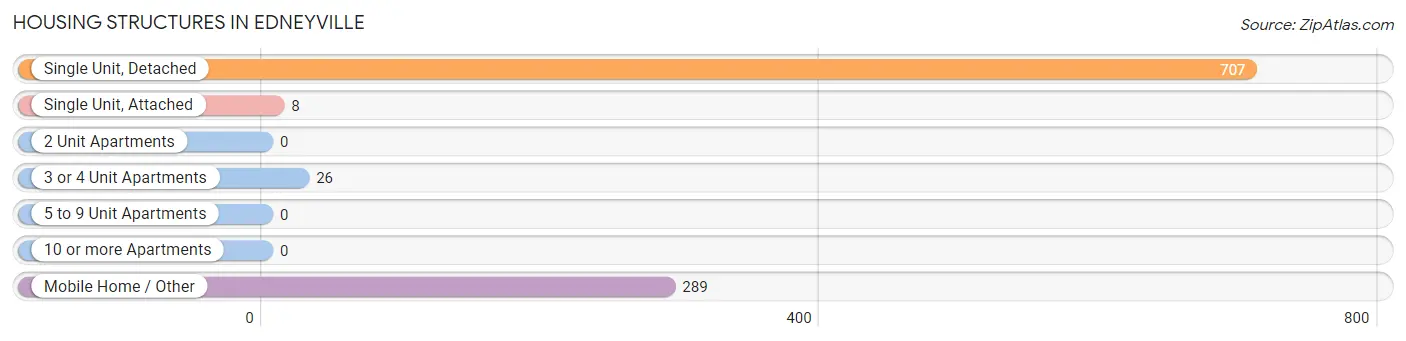
| Structure Type | # Housing Units | % Housing Units |
| Single Unit, Detached | 707 | 68.6% |
| Single Unit, Attached | 8 | 0.8% |
| 2 Unit Apartments | 0 | 0.0% |
| 3 or 4 Unit Apartments | 26 | 2.5% |
| 5 to 9 Unit Apartments | 0 | 0.0% |
| 10 or more Apartments | 0 | 0.0% |
| Mobile Home / Other | 289 | 28.1% |
| Total | 1,030 | 100.0% |
Housing Structures by Occupancy in Edneyville
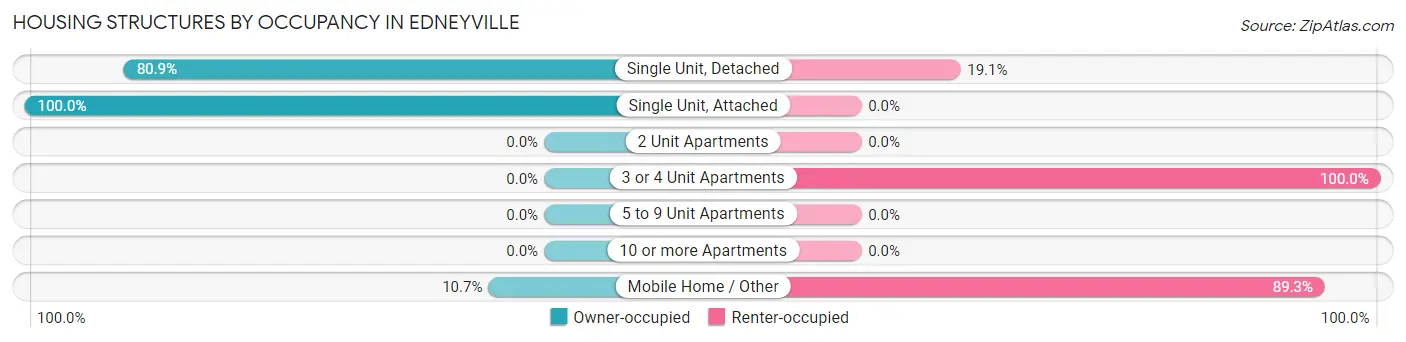
| Structure Type | Owner-occupied | Renter-occupied |
| Single Unit, Detached | 572 (80.9%) | 135 (19.1%) |
| Single Unit, Attached | 8 (100.0%) | 0 (0.0%) |
| 2 Unit Apartments | 0 (0.0%) | 0 (0.0%) |
| 3 or 4 Unit Apartments | 0 (0.0%) | 26 (100.0%) |
| 5 to 9 Unit Apartments | 0 (0.0%) | 0 (0.0%) |
| 10 or more Apartments | 0 (0.0%) | 0 (0.0%) |
| Mobile Home / Other | 31 (10.7%) | 258 (89.3%) |
| Total | 611 (59.3%) | 419 (40.7%) |
Housing Structures by Number of Rooms in Edneyville
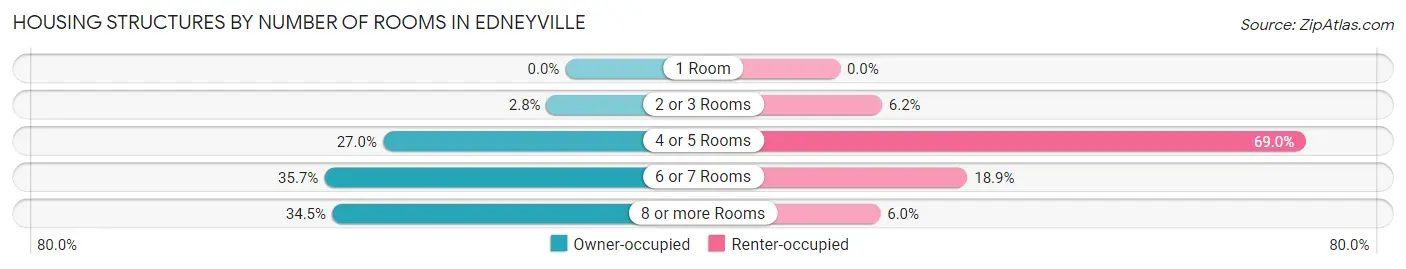
| Number of Rooms | Owner-occupied | Renter-occupied |
| 1 Room | 0 (0.0%) | 0 (0.0%) |
| 2 or 3 Rooms | 17 (2.8%) | 26 (6.2%) |
| 4 or 5 Rooms | 165 (27.0%) | 289 (69.0%) |
| 6 or 7 Rooms | 218 (35.7%) | 79 (18.9%) |
| 8 or more Rooms | 211 (34.5%) | 25 (6.0%) |
| Total | 611 (100.0%) | 419 (100.0%) |
Housing Structure by Heating Type in Edneyville
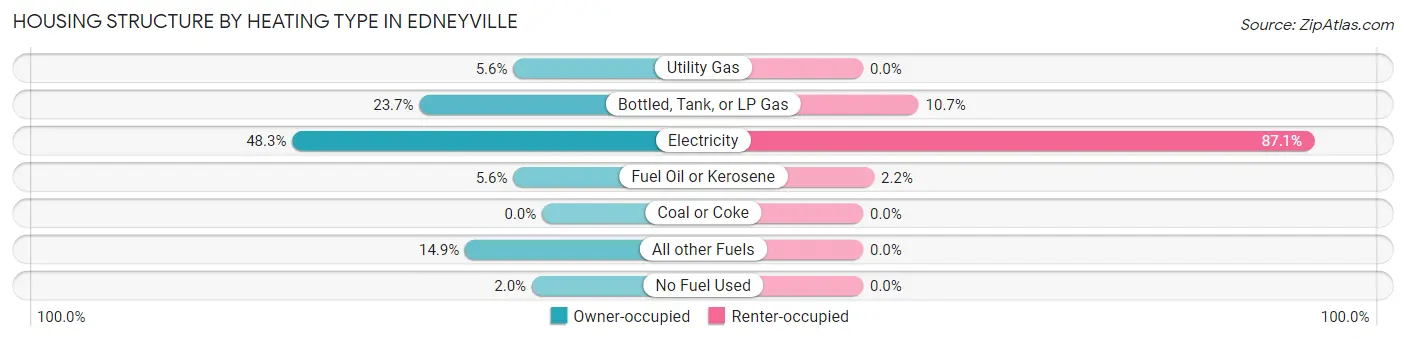
| Heating Type | Owner-occupied | Renter-occupied |
| Utility Gas | 34 (5.6%) | 0 (0.0%) |
| Bottled, Tank, or LP Gas | 145 (23.7%) | 45 (10.7%) |
| Electricity | 295 (48.3%) | 365 (87.1%) |
| Fuel Oil or Kerosene | 34 (5.6%) | 9 (2.1%) |
| Coal or Coke | 0 (0.0%) | 0 (0.0%) |
| All other Fuels | 91 (14.9%) | 0 (0.0%) |
| No Fuel Used | 12 (2.0%) | 0 (0.0%) |
| Total | 611 (100.0%) | 419 (100.0%) |
Household Vehicle Usage in Edneyville
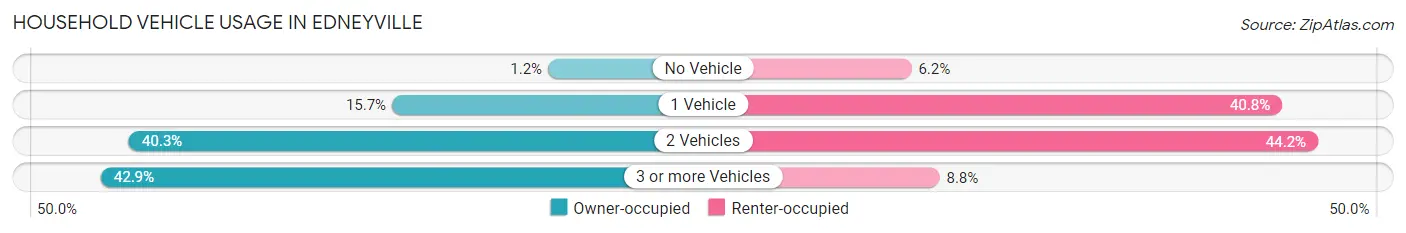
| Vehicles per Household | Owner-occupied | Renter-occupied |
| No Vehicle | 7 (1.1%) | 26 (6.2%) |
| 1 Vehicle | 96 (15.7%) | 171 (40.8%) |
| 2 Vehicles | 246 (40.3%) | 185 (44.2%) |
| 3 or more Vehicles | 262 (42.9%) | 37 (8.8%) |
| Total | 611 (100.0%) | 419 (100.0%) |
Real Estate & Mortgages in Edneyville
Real Estate and Mortgage Overview in Edneyville
| Characteristic | Without Mortgage | With Mortgage |
| Housing Units | 244 | 367 |
| Median Property Value | $248,000 | $244,800 |
| Median Household Income | $51,591 | $63 |
| Monthly Housing Costs | $313 | $83 |
| Real Estate Taxes | $1,190 | $0 |
Property Value by Mortgage Status in Edneyville
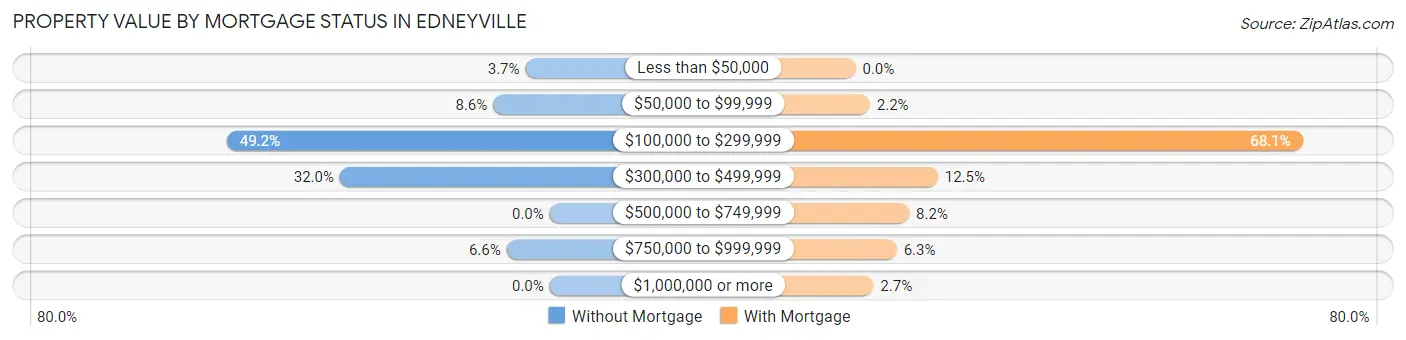
| Property Value | Without Mortgage | With Mortgage |
| Less than $50,000 | 9 (3.7%) | 0 (0.0%) |
| $50,000 to $99,999 | 21 (8.6%) | 8 (2.2%) |
| $100,000 to $299,999 | 120 (49.2%) | 250 (68.1%) |
| $300,000 to $499,999 | 78 (32.0%) | 46 (12.5%) |
| $500,000 to $749,999 | 0 (0.0%) | 30 (8.2%) |
| $750,000 to $999,999 | 16 (6.6%) | 23 (6.3%) |
| $1,000,000 or more | 0 (0.0%) | 10 (2.7%) |
| Total | 244 (100.0%) | 367 (100.0%) |
Household Income by Mortgage Status in Edneyville
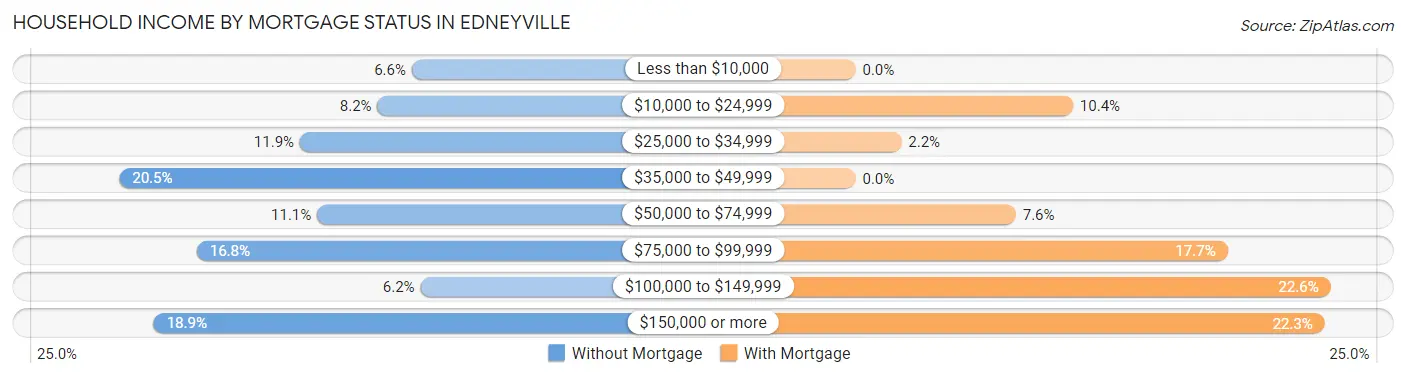
| Household Income | Without Mortgage | With Mortgage |
| Less than $10,000 | 16 (6.6%) | 0 (0.0%) |
| $10,000 to $24,999 | 20 (8.2%) | 38 (10.3%) |
| $25,000 to $34,999 | 29 (11.9%) | 8 (2.2%) |
| $35,000 to $49,999 | 50 (20.5%) | 0 (0.0%) |
| $50,000 to $74,999 | 27 (11.1%) | 28 (7.6%) |
| $75,000 to $99,999 | 41 (16.8%) | 65 (17.7%) |
| $100,000 to $149,999 | 15 (6.1%) | 83 (22.6%) |
| $150,000 or more | 46 (18.9%) | 82 (22.3%) |
| Total | 244 (100.0%) | 367 (100.0%) |
Property Value to Household Income Ratio in Edneyville
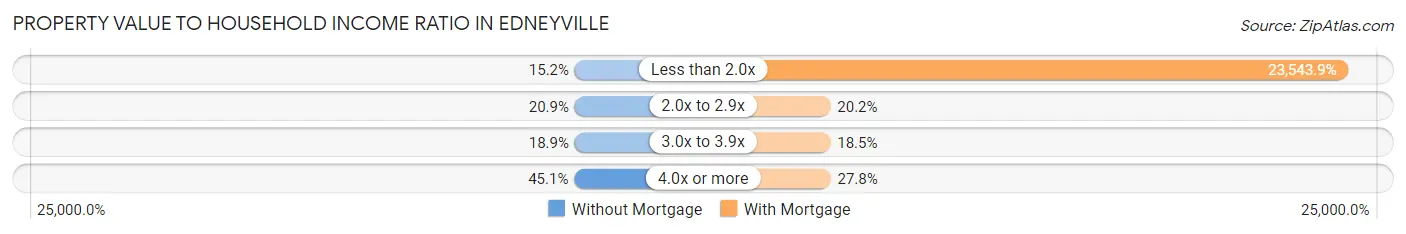
| Value-to-Income Ratio | Without Mortgage | With Mortgage |
| Less than 2.0x | 37 (15.2%) | 86,406 (23,543.9%) |
| 2.0x to 2.9x | 51 (20.9%) | 74 (20.2%) |
| 3.0x to 3.9x | 46 (18.9%) | 68 (18.5%) |
| 4.0x or more | 110 (45.1%) | 102 (27.8%) |
| Total | 244 (100.0%) | 367 (100.0%) |
Real Estate Taxes by Mortgage Status in Edneyville
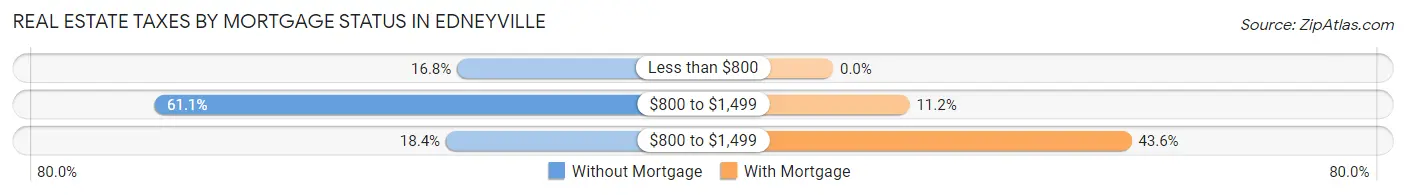
| Property Taxes | Without Mortgage | With Mortgage |
| Less than $800 | 41 (16.8%) | 0 (0.0%) |
| $800 to $1,499 | 149 (61.1%) | 41 (11.2%) |
| $800 to $1,499 | 45 (18.4%) | 160 (43.6%) |
| Total | 244 (100.0%) | 367 (100.0%) |
Health & Disability in Edneyville
Health Insurance Coverage by Age in Edneyville
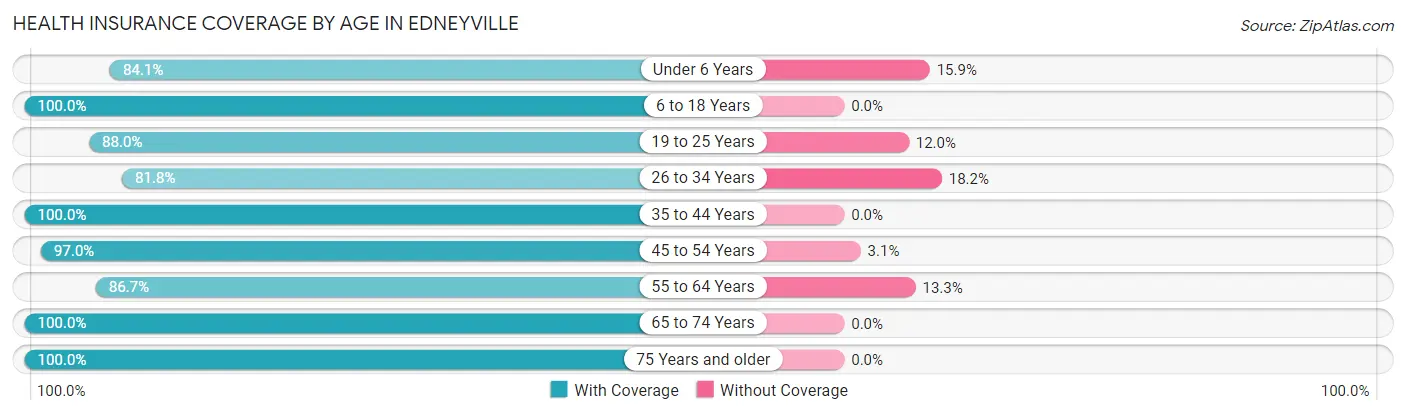
| Age Bracket | With Coverage | Without Coverage |
| Under 6 Years | 190 (84.1%) | 36 (15.9%) |
| 6 to 18 Years | 555 (100.0%) | 0 (0.0%) |
| 19 to 25 Years | 205 (88.0%) | 28 (12.0%) |
| 26 to 34 Years | 324 (81.8%) | 72 (18.2%) |
| 35 to 44 Years | 385 (100.0%) | 0 (0.0%) |
| 45 to 54 Years | 286 (97.0%) | 9 (3.0%) |
| 55 to 64 Years | 287 (86.7%) | 44 (13.3%) |
| 65 to 74 Years | 245 (100.0%) | 0 (0.0%) |
| 75 Years and older | 163 (100.0%) | 0 (0.0%) |
| Total | 2,640 (93.3%) | 189 (6.7%) |
Health Insurance Coverage by Citizenship Status in Edneyville
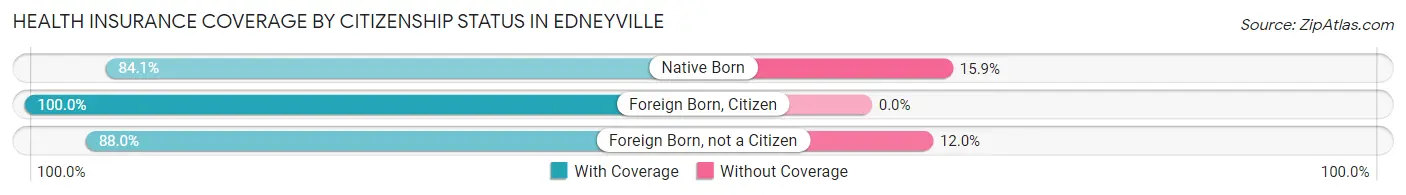
| Citizenship Status | With Coverage | Without Coverage |
| Native Born | 190 (84.1%) | 36 (15.9%) |
| Foreign Born, Citizen | 555 (100.0%) | 0 (0.0%) |
| Foreign Born, not a Citizen | 205 (88.0%) | 28 (12.0%) |
Health Insurance Coverage by Household Income in Edneyville
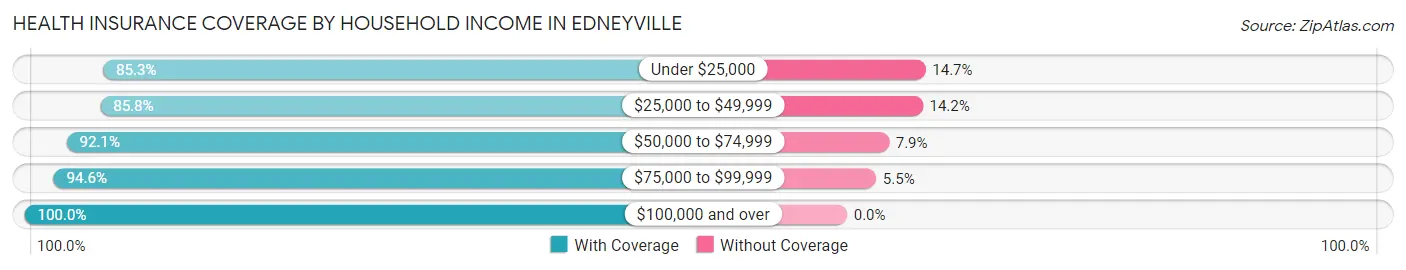
| Household Income | With Coverage | Without Coverage |
| Under $25,000 | 307 (85.3%) | 53 (14.7%) |
| $25,000 to $49,999 | 375 (85.8%) | 62 (14.2%) |
| $50,000 to $74,999 | 398 (92.1%) | 34 (7.9%) |
| $75,000 to $99,999 | 694 (94.6%) | 40 (5.4%) |
| $100,000 and over | 866 (100.0%) | 0 (0.0%) |
Public vs Private Health Insurance Coverage by Age in Edneyville
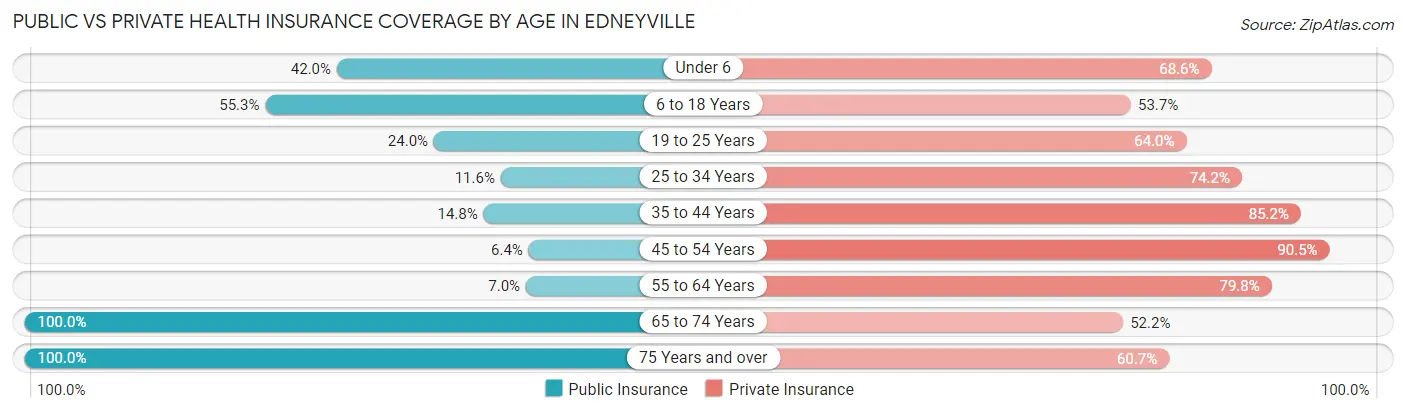
| Age Bracket | Public Insurance | Private Insurance |
| Under 6 | 95 (42.0%) | 155 (68.6%) |
| 6 to 18 Years | 307 (55.3%) | 298 (53.7%) |
| 19 to 25 Years | 56 (24.0%) | 149 (63.9%) |
| 25 to 34 Years | 46 (11.6%) | 294 (74.2%) |
| 35 to 44 Years | 57 (14.8%) | 328 (85.2%) |
| 45 to 54 Years | 19 (6.4%) | 267 (90.5%) |
| 55 to 64 Years | 23 (7.0%) | 264 (79.8%) |
| 65 to 74 Years | 245 (100.0%) | 128 (52.2%) |
| 75 Years and over | 163 (100.0%) | 99 (60.7%) |
| Total | 1,011 (35.7%) | 1,982 (70.1%) |
Disability Status by Sex by Age in Edneyville
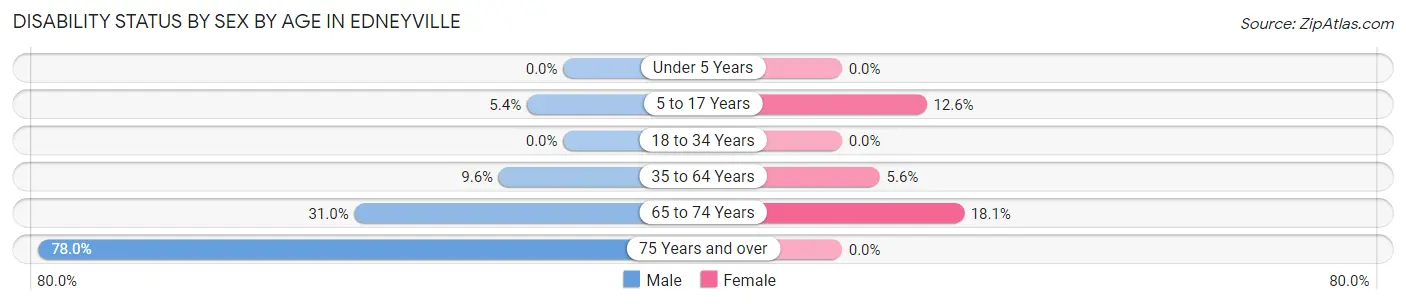
| Age Bracket | Male | Female |
| Under 5 Years | 0 (0.0%) | 0 (0.0%) |
| 5 to 17 Years | 15 (5.4%) | 44 (12.6%) |
| 18 to 34 Years | 0 (0.0%) | 0 (0.0%) |
| 35 to 64 Years | 49 (9.6%) | 28 (5.6%) |
| 65 to 74 Years | 40 (31.0%) | 21 (18.1%) |
| 75 Years and over | 46 (78.0%) | 0 (0.0%) |
Disability Class by Sex by Age in Edneyville
Disability Class: Hearing Difficulty
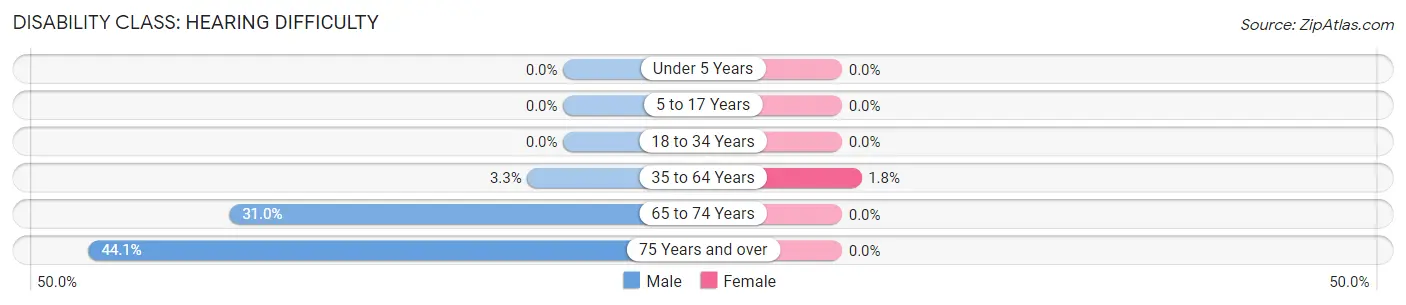
| Age Bracket | Male | Female |
| Under 5 Years | 0 (0.0%) | 0 (0.0%) |
| 5 to 17 Years | 0 (0.0%) | 0 (0.0%) |
| 18 to 34 Years | 0 (0.0%) | 0 (0.0%) |
| 35 to 64 Years | 17 (3.3%) | 9 (1.8%) |
| 65 to 74 Years | 40 (31.0%) | 0 (0.0%) |
| 75 Years and over | 26 (44.1%) | 0 (0.0%) |
Disability Class: Vision Difficulty
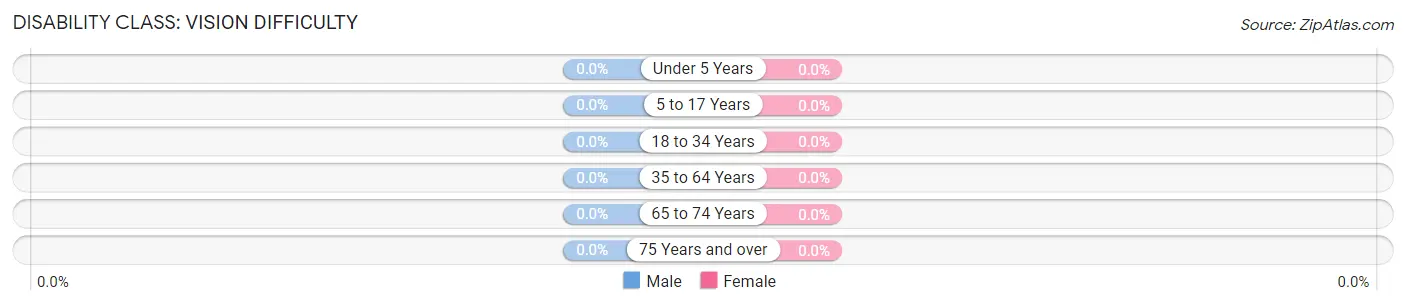
| Age Bracket | Male | Female |
| Under 5 Years | 0 (0.0%) | 0 (0.0%) |
| 5 to 17 Years | 0 (0.0%) | 0 (0.0%) |
| 18 to 34 Years | 0 (0.0%) | 0 (0.0%) |
| 35 to 64 Years | 0 (0.0%) | 0 (0.0%) |
| 65 to 74 Years | 0 (0.0%) | 0 (0.0%) |
| 75 Years and over | 0 (0.0%) | 0 (0.0%) |
Disability Class: Cognitive Difficulty
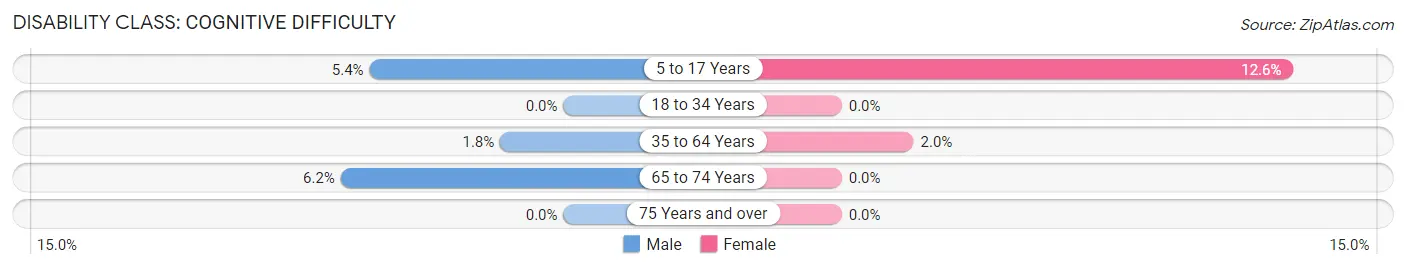
| Age Bracket | Male | Female |
| 5 to 17 Years | 15 (5.4%) | 44 (12.6%) |
| 18 to 34 Years | 0 (0.0%) | 0 (0.0%) |
| 35 to 64 Years | 9 (1.8%) | 10 (2.0%) |
| 65 to 74 Years | 8 (6.2%) | 0 (0.0%) |
| 75 Years and over | 0 (0.0%) | 0 (0.0%) |
Disability Class: Ambulatory Difficulty
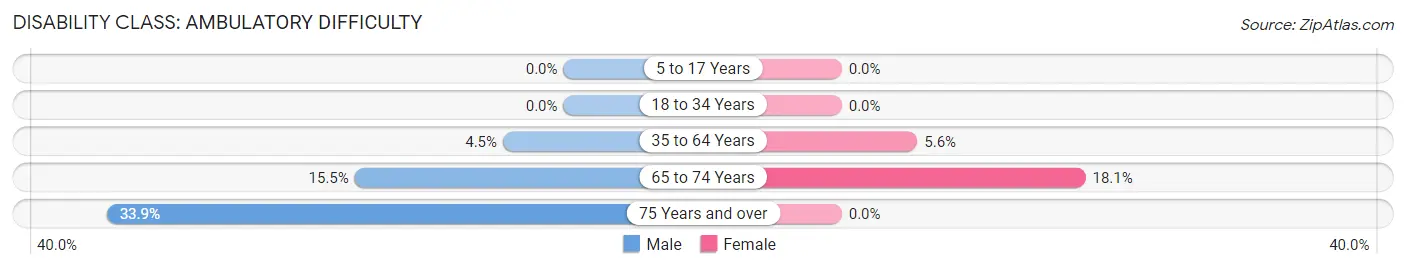
| Age Bracket | Male | Female |
| 5 to 17 Years | 0 (0.0%) | 0 (0.0%) |
| 18 to 34 Years | 0 (0.0%) | 0 (0.0%) |
| 35 to 64 Years | 23 (4.5%) | 28 (5.6%) |
| 65 to 74 Years | 20 (15.5%) | 21 (18.1%) |
| 75 Years and over | 20 (33.9%) | 0 (0.0%) |
Disability Class: Self-Care Difficulty
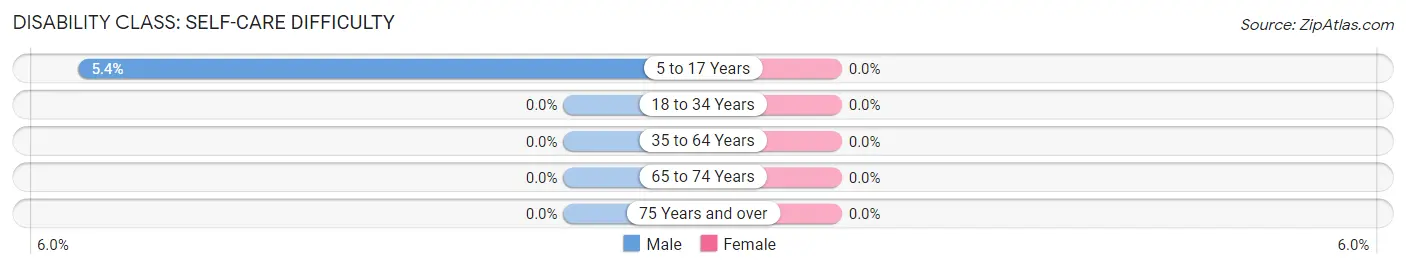
| Age Bracket | Male | Female |
| 5 to 17 Years | 15 (5.4%) | 0 (0.0%) |
| 18 to 34 Years | 0 (0.0%) | 0 (0.0%) |
| 35 to 64 Years | 0 (0.0%) | 0 (0.0%) |
| 65 to 74 Years | 0 (0.0%) | 0 (0.0%) |
| 75 Years and over | 0 (0.0%) | 0 (0.0%) |
Technology Access in Edneyville
Computing Device Access in Edneyville
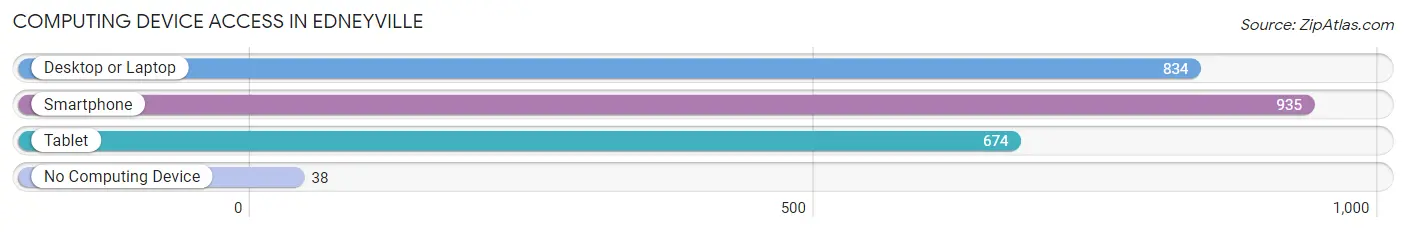
| Device Type | # Households | % Households |
| Desktop or Laptop | 834 | 81.0% |
| Smartphone | 935 | 90.8% |
| Tablet | 674 | 65.4% |
| No Computing Device | 38 | 3.7% |
| Total | 1,030 | 100.0% |
Internet Access in Edneyville
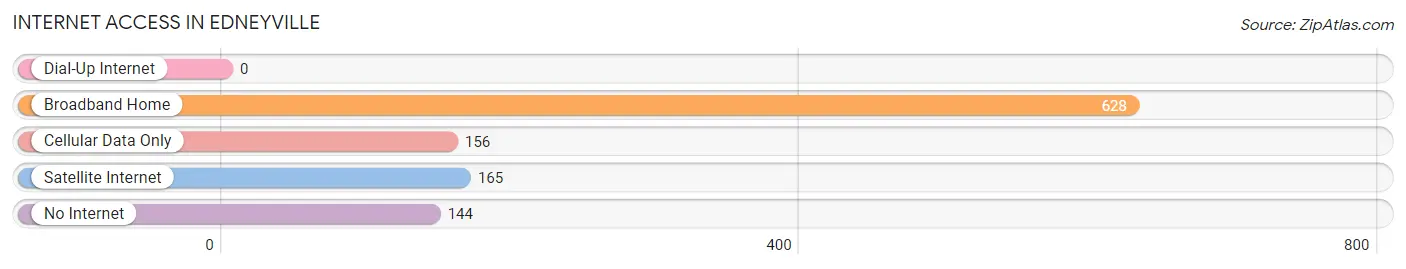
| Internet Type | # Households | % Households |
| Dial-Up Internet | 0 | 0.0% |
| Broadband Home | 628 | 61.0% |
| Cellular Data Only | 156 | 15.1% |
| Satellite Internet | 165 | 16.0% |
| No Internet | 144 | 14.0% |
| Total | 1,030 | 100.0% |
Edneyville Summary
Edneyville is a small unincorporated community located in Henderson County, North Carolina. It is situated in the foothills of the Blue Ridge Mountains, approximately 20 miles south of Asheville. The community is named after the Edney family, who settled in the area in the late 1700s.
History
The Edney family first settled in the area in the late 1700s. The family was originally from Scotland and had come to the United States in search of a better life. The Edneys were among the first settlers in the area and established a small farm. The family grew corn, wheat, and other crops, and raised livestock.
The Edneyville area was first known as Edneyville Crossroads, as it was located at the intersection of two major roads. The first post office was established in 1845, and the town was officially incorporated in 1887.
In the late 1800s, Edneyville was a thriving community with several businesses, including a general store, a blacksmith shop, a grist mill, and a sawmill. The town also had a school, a church, and a hotel.
Geography
Edneyville is located in the foothills of the Blue Ridge Mountains in Henderson County, North Carolina. The town is situated at an elevation of 1,400 feet and is approximately 20 miles south of Asheville. The town is located at the intersection of two major roads, US Highway 64 and NC Highway 225.
The town is surrounded by the Pisgah National Forest, which provides a variety of outdoor recreational activities, including hiking, camping, fishing, and hunting. The area is also home to several state parks, including DuPont State Forest and Gorges State Park.
Economy
Edneyville is a small, rural community with a population of approximately 1,000 people. The town is primarily a bedroom community, with most of its residents commuting to nearby cities for work. The town does not have any major industries, but there are several small businesses in the area, including a general store, a gas station, and a few restaurants.
The town is also home to several farms, which produce a variety of crops, including corn, wheat, and hay. The town also has a few apple orchards, which produce apples for local consumption and for sale at local farmers markets.
Demographics
As of the 2010 census, the population of Edneyville was 1,039. The racial makeup of the town was 97.3% White, 0.7% African American, 0.3% Native American, 0.2% Asian, 0.1% Pacific Islander, and 1.4% from other races. The median household income was $37,917, and the median family income was $45,000.
The town is served by the Henderson County School District, which includes Edneyville Elementary School, Edneyville Middle School, and Edneyville High School. The town also has a public library, which is part of the Henderson County Public Library System.
Common Questions
What is the Total Population of Edneyville?
Total Population of Edneyville is 2,829.
What is the Total Male Population of Edneyville?
Total Male Population of Edneyville is 1,409.
What is the Total Female Population of Edneyville?
Total Female Population of Edneyville is 1,420.
What is the Ratio of Males per 100 Females in Edneyville?
There are 99.23 Males per 100 Females in Edneyville.
What is the Ratio of Females per 100 Males in Edneyville?
There are 100.78 Females per 100 Males in Edneyville.
What is the Median Population Age in Edneyville?
Median Population Age in Edneyville is 35.3 Years.
What is the Average Family Size in Edneyville
Average Family Size in Edneyville is 3.0 People.
What is the Average Household Size in Edneyville
Average Household Size in Edneyville is 2.8 People.
What is Per Capita Income in Edneyville?
Per Capita income in Edneyville is $30,059.
What is the Median Family Income in Edneyville?
Median Family Income in Edneyville is $61,400.
What is the Median Household income in Edneyville?
Median Household Income in Edneyville is $61,600.
What is Income or Wage Gap in Edneyville?
Income or Wage Gap in Edneyville is 54.6%.
Women in Edneyville earn 45.4 cents for every dollar earned by a man.
What is Inequality or Gini Index in Edneyville?
Inequality or Gini Index in Edneyville is 0.44.
How Large is the Labor Force in Edneyville?
There are 1,597 People in the Labor Forcein in Edneyville.
What is the Percentage of People in the Labor Force in Edneyville?
75.0% of People are in the Labor Force in Edneyville.
What is the Unemployment Rate in Edneyville?
Unemployment Rate in Edneyville is 1.0%.