Southern Shores, NC
Southern Shores Map
Southern Shores Overview
3,098
TOTAL POPULATION
1,576
MALE POPULATION
1,522
FEMALE POPULATION
103.55
MALES / 100 FEMALES
96.57
FEMALES / 100 MALES
57.3
MEDIAN AGE
2.8
AVG FAMILY SIZE
2.6
AVG HOUSEHOLD SIZE
$65,765
PER CAPITA INCOME
$140,504
AVG FAMILY INCOME
$112,371
AVG HOUSEHOLD INCOME
27.4%
WAGE / INCOME GAP [ % ]
72.6¢/ $1
WAGE / INCOME GAP [ $ ]
0.42
INEQUALITY / GINI INDEX
1,457
LABOR FORCE [ PEOPLE ]
54.7%
PERCENT IN LABOR FORCE
14.4%
UNEMPLOYMENT RATE
Southern Shores Area Codes
Race in Southern Shores
The most populous races in Southern Shores are White / Caucasian (2,889 | 93.2%), Two or more Races (136 | 4.4%), and Black / African American (62 | 2.0%).

| Race | # Population | % Population |
| Asian | 11 | 0.4% |
| Black / African American | 62 | 2.0% |
| Hawaiian / Pacific | 0 | 0.0% |
| Hispanic or Latino | 9 | 0.3% |
| Native / Alaskan | 0 | 0.0% |
| White / Caucasian | 2,889 | 93.2% |
| Two or more Races | 136 | 4.4% |
| Some other Race | 0 | 0.0% |
| Total | 3,098 | 100.0% |
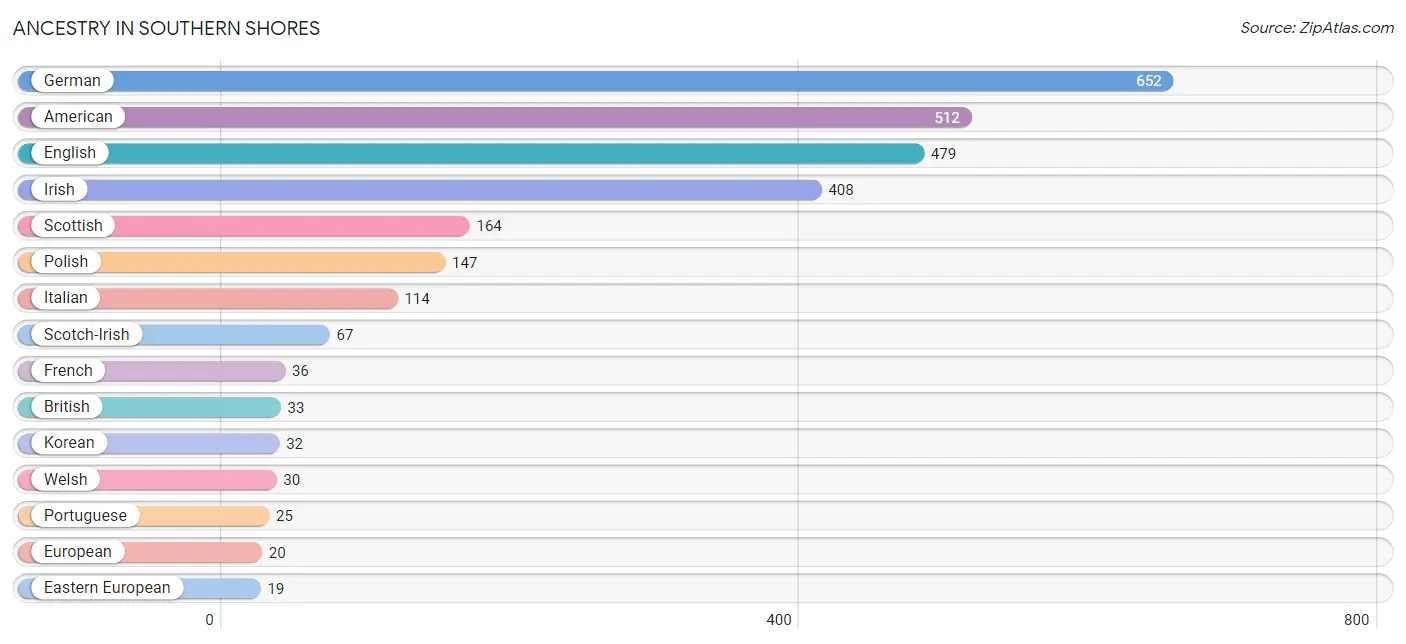
Ancestry in Southern Shores
The most populous ancestries reported in Southern Shores are German (652 | 21.0%), American (512 | 16.5%), English (479 | 15.5%), Irish (408 | 13.2%), and Scottish (164 | 5.3%), together accounting for 71.5% of all Southern Shores residents.
| Ancestry | # Population | % Population |
| American | 512 | 16.5% |
| Austrian | 5 | 0.2% |
| Belgian | 5 | 0.2% |
| British | 33 | 1.1% |
| Canadian | 5 | 0.2% |
| Dutch | 6 | 0.2% |
| Eastern European | 19 | 0.6% |
| English | 479 | 15.5% |
| European | 20 | 0.6% |
| French | 36 | 1.2% |
| French Canadian | 17 | 0.5% |
| German | 652 | 21.0% |
| Hungarian | 7 | 0.2% |
| Irish | 408 | 13.2% |
| Italian | 114 | 3.7% |
| Korean | 32 | 1.0% |
| Mexican | 9 | 0.3% |
| Northern European | 10 | 0.3% |
| Norwegian | 16 | 0.5% |
| Polish | 147 | 4.7% |
| Portuguese | 25 | 0.8% |
| Russian | 8 | 0.3% |
| Scandinavian | 18 | 0.6% |
| Scotch-Irish | 67 | 2.2% |
| Scottish | 164 | 5.3% |
| Serbian | 8 | 0.3% |
| Slovak | 7 | 0.2% |
| Thai | 7 | 0.2% |
| Welsh | 30 | 1.0% | View All 29 Rows |
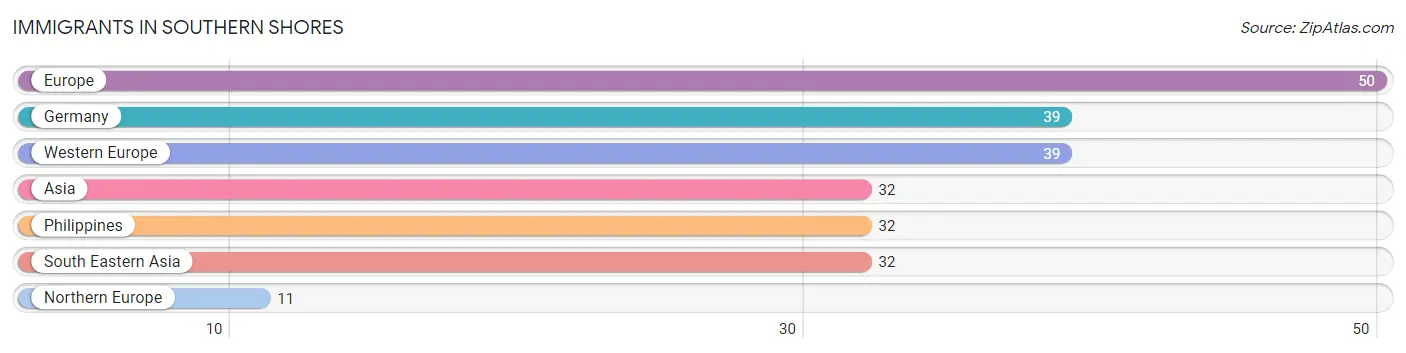
Immigrants in Southern Shores
The most numerous immigrant groups reported in Southern Shores came from Europe (50 | 1.6%), Germany (39 | 1.3%), Western Europe (39 | 1.3%), Asia (32 | 1.0%), and Philippines (32 | 1.0%), together accounting for 6.2% of all Southern Shores residents.
| Immigration Origin | # Population | % Population |
| Asia | 32 | 1.0% |
| Europe | 50 | 1.6% |
| Germany | 39 | 1.3% |
| Northern Europe | 11 | 0.4% |
| Philippines | 32 | 1.0% |
| South Eastern Asia | 32 | 1.0% |
| Western Europe | 39 | 1.3% | View All 7 Rows |
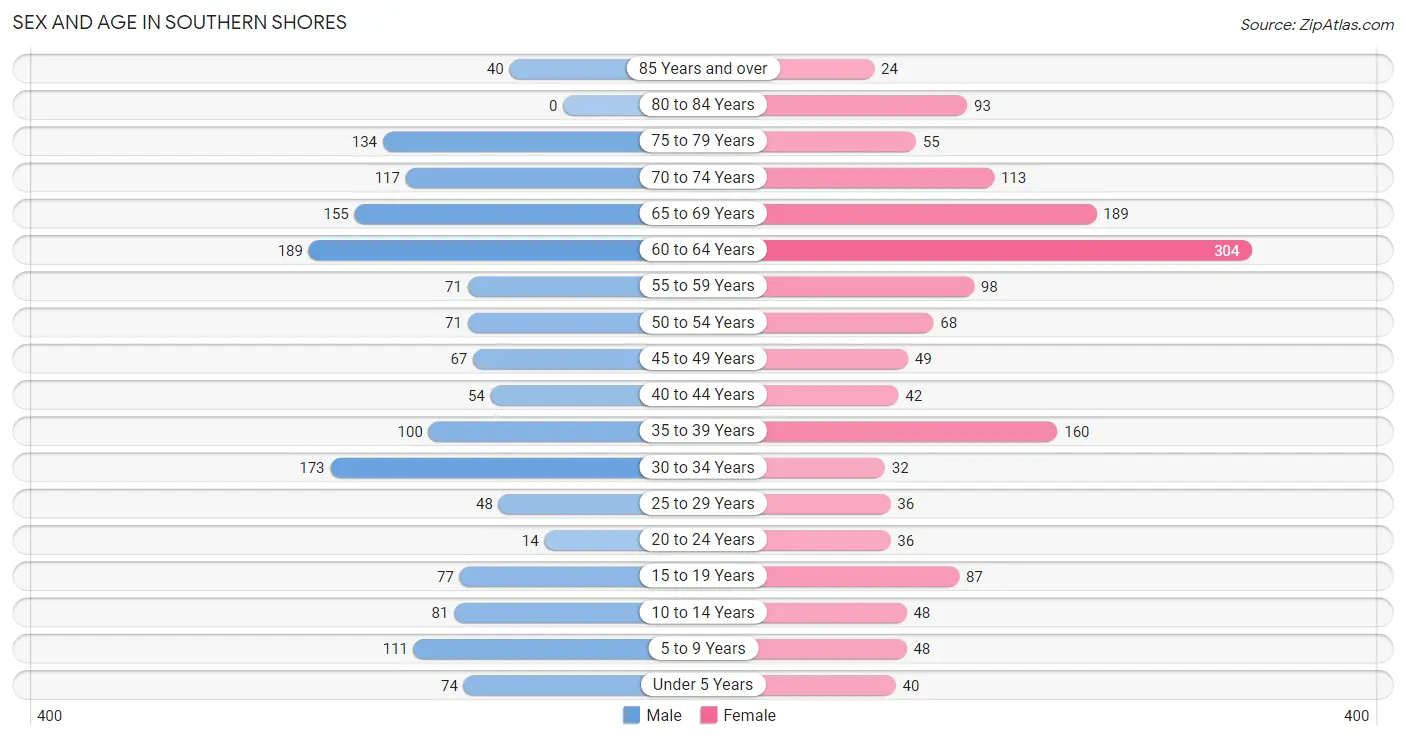
Sex and Age in Southern Shores
Sex and Age in Southern Shores
The most populous age groups in Southern Shores are 60 to 64 Years (189 | 12.0%) for men and 60 to 64 Years (304 | 20.0%) for women.
| Age Bracket | Male | Female |
| Under 5 Years | 74 (4.7%) | 40 (2.6%) |
| 5 to 9 Years | 111 (7.0%) | 48 (3.2%) |
| 10 to 14 Years | 81 (5.1%) | 48 (3.2%) |
| 15 to 19 Years | 77 (4.9%) | 87 (5.7%) |
| 20 to 24 Years | 14 (0.9%) | 36 (2.4%) |
| 25 to 29 Years | 48 (3.0%) | 36 (2.4%) |
| 30 to 34 Years | 173 (11.0%) | 32 (2.1%) |
| 35 to 39 Years | 100 (6.4%) | 160 (10.5%) |
| 40 to 44 Years | 54 (3.4%) | 42 (2.8%) |
| 45 to 49 Years | 67 (4.3%) | 49 (3.2%) |
| 50 to 54 Years | 71 (4.5%) | 68 (4.5%) |
| 55 to 59 Years | 71 (4.5%) | 98 (6.4%) |
| 60 to 64 Years | 189 (12.0%) | 304 (20.0%) |
| 65 to 69 Years | 155 (9.8%) | 189 (12.4%) |
| 70 to 74 Years | 117 (7.4%) | 113 (7.4%) |
| 75 to 79 Years | 134 (8.5%) | 55 (3.6%) |
| 80 to 84 Years | 0 (0.0%) | 93 (6.1%) |
| 85 Years and over | 40 (2.5%) | 24 (1.6%) |
| Total | 1,576 (100.0%) | 1,522 (100.0%) |
Families and Households in Southern Shores
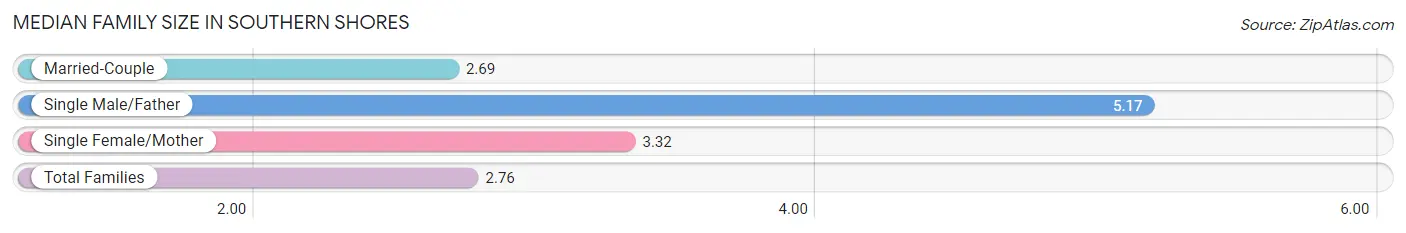
Median Family Size in Southern Shores
The median family size in Southern Shores is 2.76 persons per family, with single male/father families (6 | 0.6%) accounting for the largest median family size of 5.17 persons per family. On the other hand, married-couple families (880 | 91.6%) represent the smallest median family size with 2.69 persons per family.
| Family Type | # Families | Family Size |
| Married-Couple | 880 (91.6%) | 2.69 |
| Single Male/Father | 6 (0.6%) | 5.17 |
| Single Female/Mother | 75 (7.8%) | 3.32 |
| Total Families | 961 (100.0%) | 2.76 |
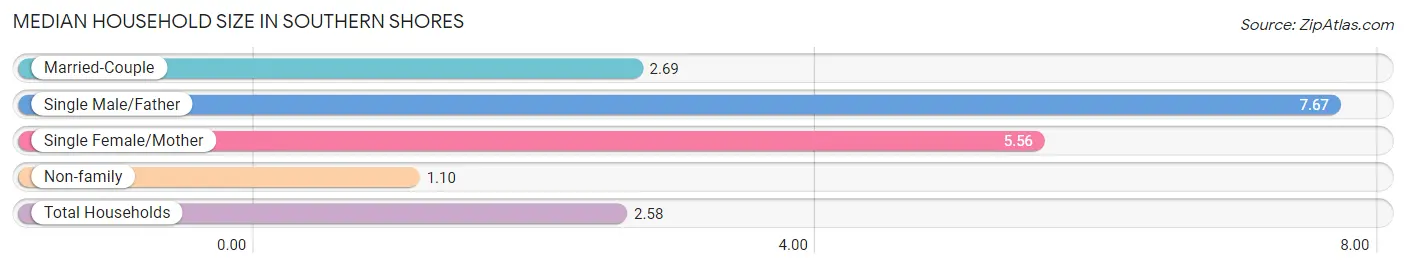
Median Household Size in Southern Shores
The median household size in Southern Shores is 2.58 persons per household, with single male/father households (6 | 0.5%) accounting for the largest median household size of 7.67 persons per household. non-family households (241 | 20.1%) represent the smallest median household size with 1.10 persons per household.
| Household Type | # Households | Household Size |
| Married-Couple | 880 (73.2%) | 2.69 |
| Single Male/Father | 6 (0.5%) | 7.67 |
| Single Female/Mother | 75 (6.2%) | 5.56 |
| Non-family | 241 (20.1%) | 1.10 |
| Total Households | 1,202 (100.0%) | 2.58 |
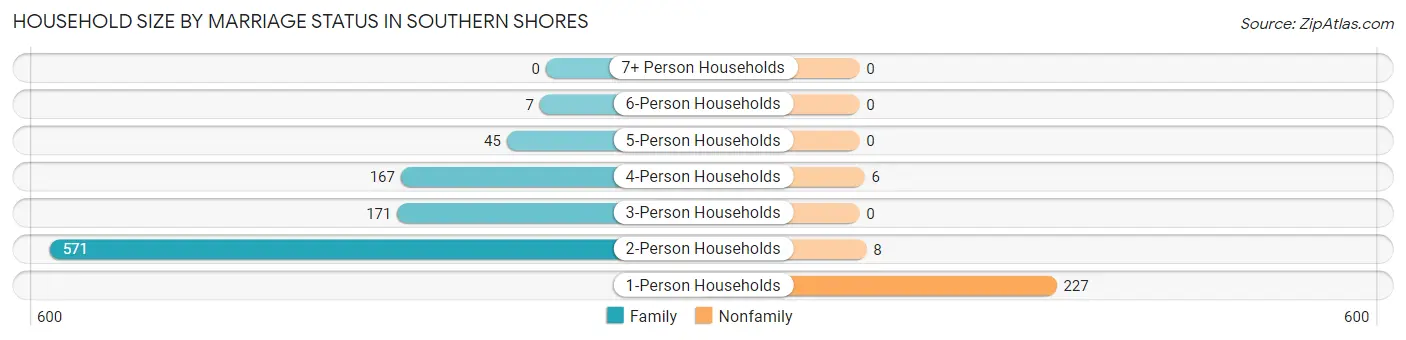
Household Size by Marriage Status in Southern Shores
Out of a total of 1,202 households in Southern Shores, 961 (79.9%) are family households, while 241 (20.1%) are nonfamily households. The most numerous type of family households are 2-person households, comprising 571, and the most common type of nonfamily households are 1-person households, comprising 227.
| Household Size | Family Households | Nonfamily Households |
| 1-Person Households | - | 227 (18.9%) |
| 2-Person Households | 571 (47.5%) | 8 (0.7%) |
| 3-Person Households | 171 (14.2%) | 0 (0.0%) |
| 4-Person Households | 167 (13.9%) | 6 (0.5%) |
| 5-Person Households | 45 (3.7%) | 0 (0.0%) |
| 6-Person Households | 7 (0.6%) | 0 (0.0%) |
| 7+ Person Households | 0 (0.0%) | 0 (0.0%) |
| Total | 961 (79.9%) | 241 (20.1%) |
Female Fertility in Southern Shores
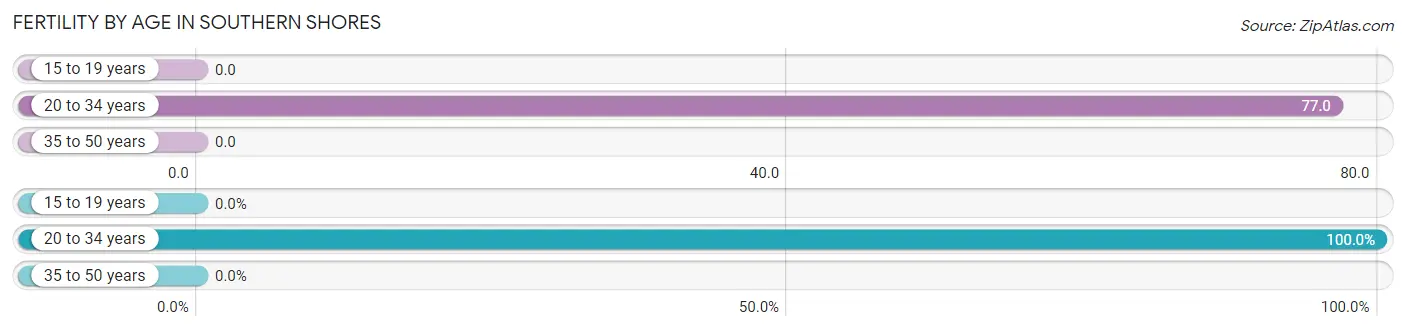
Fertility by Age in Southern Shores
Average fertility rate in Southern Shores is 17.0 births per 1,000 women. Women in the age bracket of 20 to 34 years have the highest fertility rate with 77.0 births per 1,000 women. Women in the age bracket of 20 to 34 years acount for 100.0% of all women with births.
| Age Bracket | Women with Births | Births / 1,000 Women |
| 15 to 19 years | 0 (0.0%) | 0.0 |
| 20 to 34 years | 8 (100.0%) | 77.0 |
| 35 to 50 years | 0 (0.0%) | 0.0 |
| Total | 8 (100.0%) | 17.0 |
Fertility by Age by Marriage Status in Southern Shores
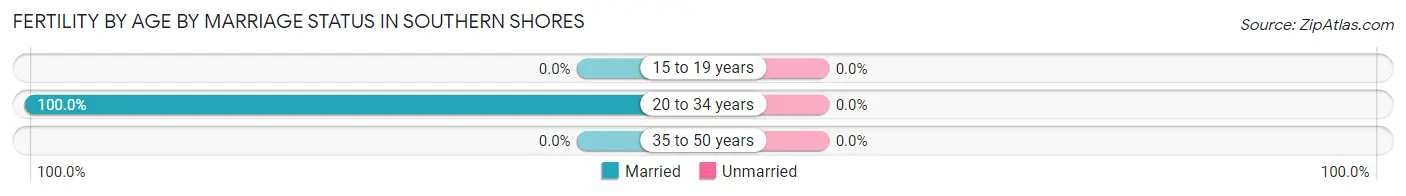
| Age Bracket | Married | Unmarried |
| 15 to 19 years | 0 (0.0%) | 0 (0.0%) |
| 20 to 34 years | 8 (100.0%) | 0 (0.0%) |
| 35 to 50 years | 0 (0.0%) | 0 (0.0%) |
| Total | 8 (100.0%) | 0 (0.0%) |
Fertility by Education in Southern Shores
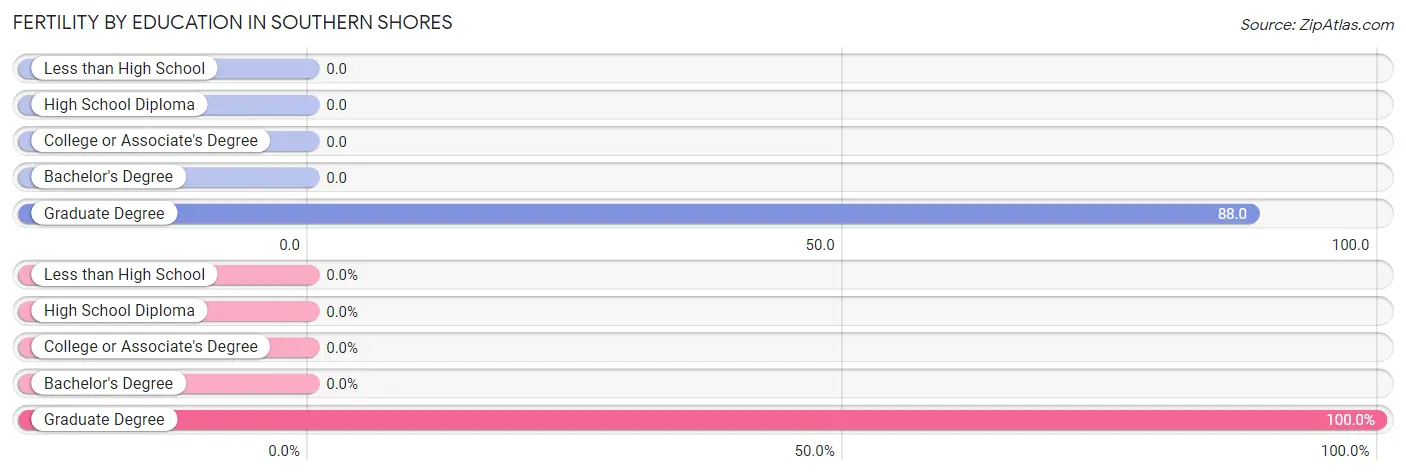
| Educational Attainment | Women with Births | Births / 1,000 Women |
| Less than High School | 0 (0.0%) | 0.0 |
| High School Diploma | 0 (0.0%) | 0.0 |
| College or Associate's Degree | 0 (0.0%) | 0.0 |
| Bachelor's Degree | 0 (0.0%) | 0.0 |
| Graduate Degree | 8 (100.0%) | 88.0 |
| Total | 8 (100.0%) | 17.0 |
Fertility by Education by Marriage Status in Southern Shores
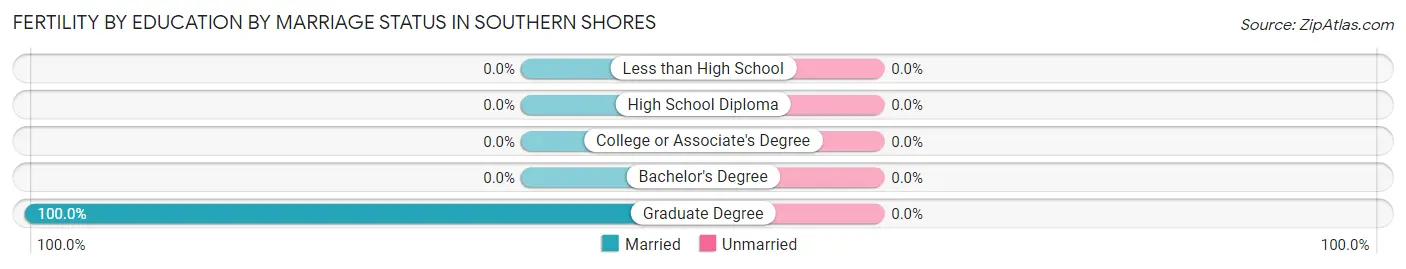
| Educational Attainment | Married | Unmarried |
| Less than High School | 0 (0.0%) | 0 (0.0%) |
| High School Diploma | 0 (0.0%) | 0 (0.0%) |
| College or Associate's Degree | 0 (0.0%) | 0 (0.0%) |
| Bachelor's Degree | 0 (0.0%) | 0 (0.0%) |
| Graduate Degree | 8 (100.0%) | 0 (0.0%) |
| Total | 8 (100.0%) | 0 (0.0%) |
Income in Southern Shores
Income Overview in Southern Shores
Per Capita Income in Southern Shores is $65,765, while median incomes of families and households are $140,504 and $112,371 respectively.
| Characteristic | Number | Measure |
| Per Capita Income | 3,098 | $65,765 |
| Median Family Income | 961 | $140,504 |
| Mean Family Income | 961 | $184,021 |
| Median Household Income | 1,202 | $112,371 |
| Mean Household Income | 1,202 | $163,721 |
| Income Deficit | 961 | $0 |
| Wage / Income Gap (%) | 3,098 | 27.44% |
| Wage / Income Gap ($) | 3,098 | 72.56¢ per $1 |
| Gini / Inequality Index | 3,098 | 0.42 |
Earnings by Sex in Southern Shores
Average Earnings in Southern Shores are $42,418, $55,600 for men and $40,345 for women, a difference of 27.4%.
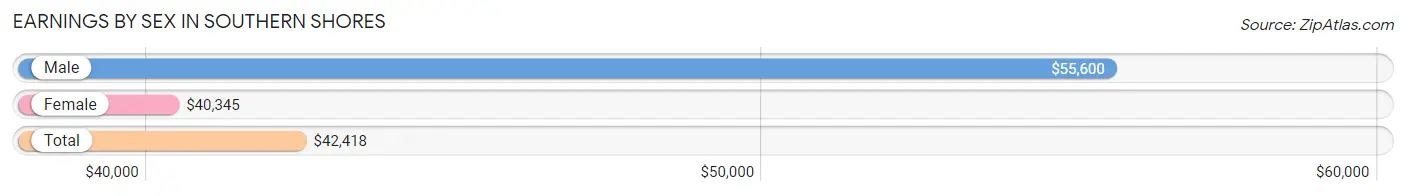
| Sex | Number | Average Earnings |
| Male | 856 (55.2%) | $55,600 |
| Female | 695 (44.8%) | $40,345 |
| Total | 1,551 (100.0%) | $42,418 |
Earnings by Sex by Income Bracket in Southern Shores
The most common earnings brackets in Southern Shores are $30,000 to $34,999 for men (201 | 23.5%) and $40,000 to $44,999 for women (94 | 13.5%).
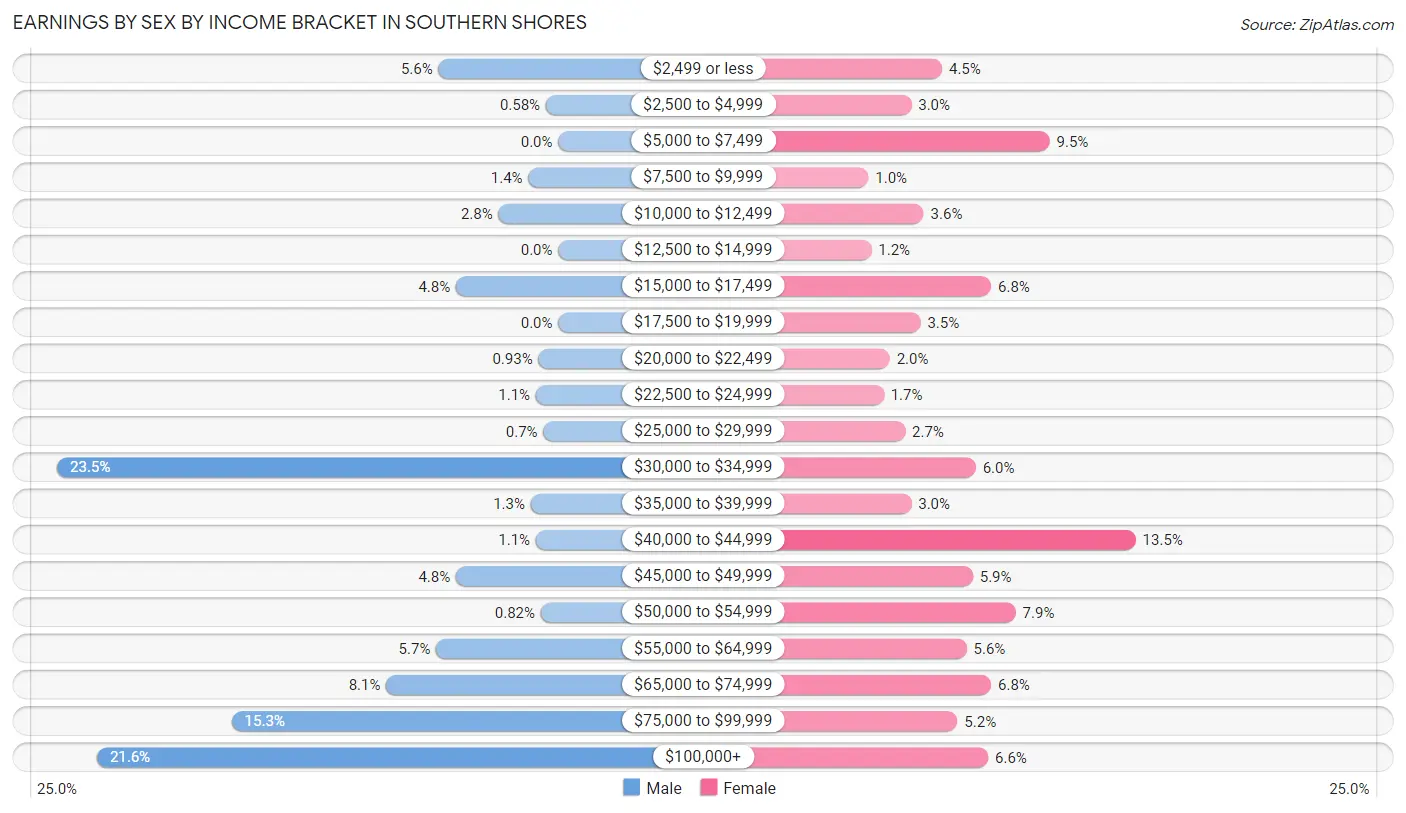
| Income | Male | Female |
| $2,499 or less | 48 (5.6%) | 31 (4.5%) |
| $2,500 to $4,999 | 5 (0.6%) | 21 (3.0%) |
| $5,000 to $7,499 | 0 (0.0%) | 66 (9.5%) |
| $7,500 to $9,999 | 12 (1.4%) | 7 (1.0%) |
| $10,000 to $12,499 | 24 (2.8%) | 25 (3.6%) |
| $12,500 to $14,999 | 0 (0.0%) | 8 (1.1%) |
| $15,000 to $17,499 | 41 (4.8%) | 47 (6.8%) |
| $17,500 to $19,999 | 0 (0.0%) | 24 (3.5%) |
| $20,000 to $22,499 | 8 (0.9%) | 14 (2.0%) |
| $22,500 to $24,999 | 9 (1.1%) | 12 (1.7%) |
| $25,000 to $29,999 | 6 (0.7%) | 19 (2.7%) |
| $30,000 to $34,999 | 201 (23.5%) | 42 (6.0%) |
| $35,000 to $39,999 | 11 (1.3%) | 21 (3.0%) |
| $40,000 to $44,999 | 9 (1.1%) | 94 (13.5%) |
| $45,000 to $49,999 | 41 (4.8%) | 41 (5.9%) |
| $50,000 to $54,999 | 7 (0.8%) | 55 (7.9%) |
| $55,000 to $64,999 | 49 (5.7%) | 39 (5.6%) |
| $65,000 to $74,999 | 69 (8.1%) | 47 (6.8%) |
| $75,000 to $99,999 | 131 (15.3%) | 36 (5.2%) |
| $100,000+ | 185 (21.6%) | 46 (6.6%) |
| Total | 856 (100.0%) | 695 (100.0%) |
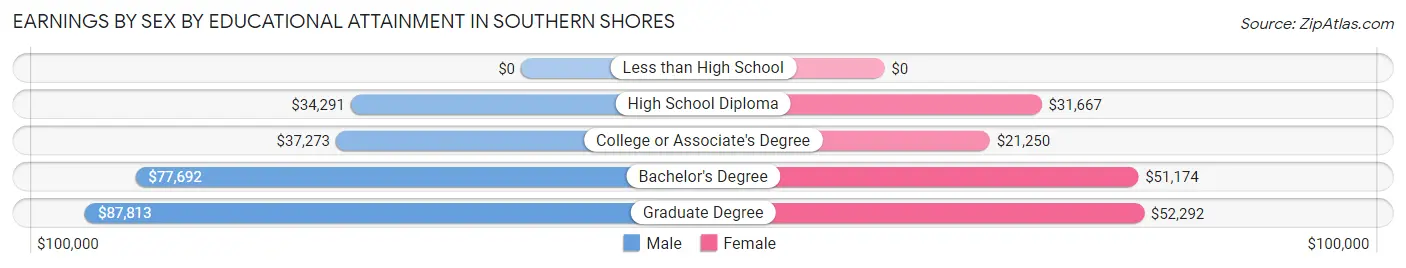
Earnings by Sex by Educational Attainment in Southern Shores
Average earnings in Southern Shores are $57,350 for men and $41,941 for women, a difference of 26.9%. Men with an educational attainment of graduate degree enjoy the highest average annual earnings of $87,813, while those with high school diploma education earn the least with $34,291. Women with an educational attainment of graduate degree earn the most with the average annual earnings of $52,292, while those with college or associate's degree education have the smallest earnings of $21,250.
| Educational Attainment | Male Income | Female Income |
| Less than High School | - | - |
| High School Diploma | $34,291 | $31,667 |
| College or Associate's Degree | $37,273 | $21,250 |
| Bachelor's Degree | $77,692 | $51,174 |
| Graduate Degree | $87,813 | $52,292 |
| Total | $57,350 | $41,941 |
Family Income in Southern Shores
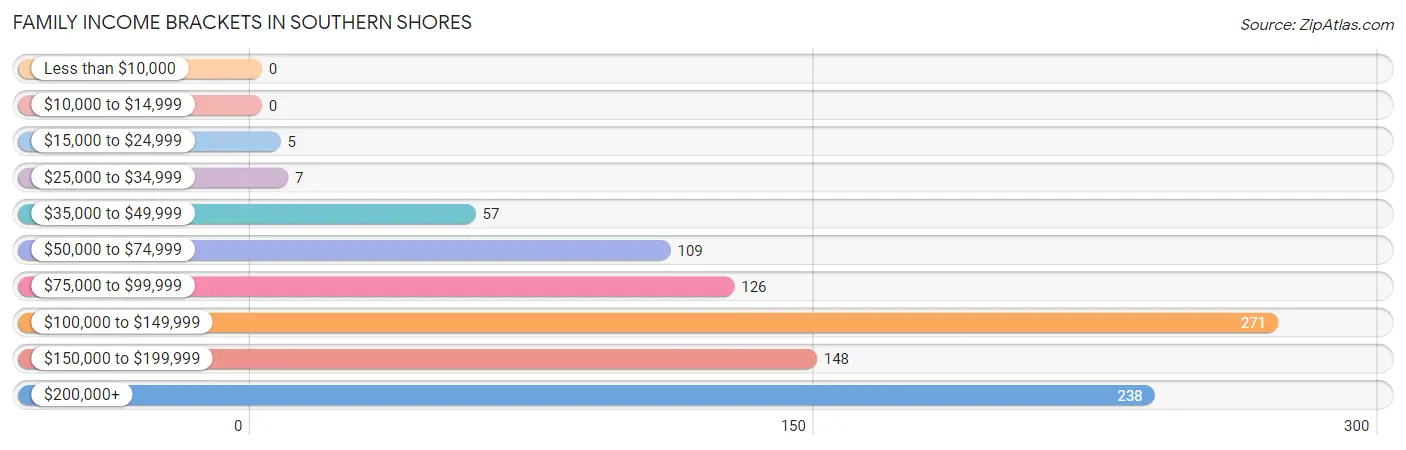
Family Income Brackets in Southern Shores
According to the Southern Shores family income data, there are 271 families falling into the $100,000 to $149,999 income range, which is the most common income bracket and makes up 28.2% of all families.
| Income Bracket | # Families | % Families |
| Less than $10,000 | 0 | 0.0% |
| $10,000 to $14,999 | 0 | 0.0% |
| $15,000 to $24,999 | 5 | 0.5% |
| $25,000 to $34,999 | 7 | 0.7% |
| $35,000 to $49,999 | 57 | 5.9% |
| $50,000 to $74,999 | 109 | 11.3% |
| $75,000 to $99,999 | 126 | 13.1% |
| $100,000 to $149,999 | 271 | 28.2% |
| $150,000 to $199,999 | 148 | 15.4% |
| $200,000+ | 238 | 24.8% |
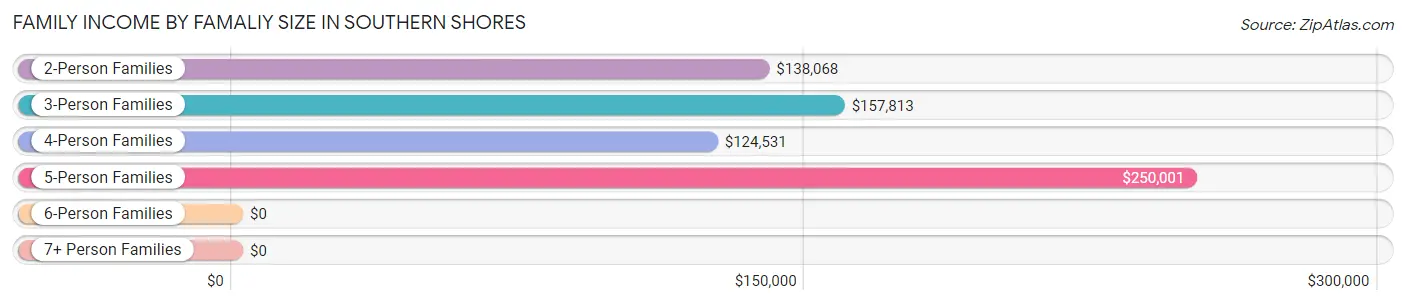
Family Income by Famaliy Size in Southern Shores
5-person families (31 | 3.2%) account for the highest median family income in Southern Shores with $250,001 per family, while 2-person families (615 | 64.0%) have the highest median income of $69,034 per family member.
| Income Bracket | # Families | Median Income |
| 2-Person Families | 615 (64.0%) | $138,068 |
| 3-Person Families | 127 (13.2%) | $157,813 |
| 4-Person Families | 181 (18.8%) | $124,531 |
| 5-Person Families | 31 (3.2%) | $250,001 |
| 6-Person Families | 7 (0.7%) | $0 |
| 7+ Person Families | 0 (0.0%) | $0 |
| Total | 961 (100.0%) | $140,504 |
Family Income by Number of Earners in Southern Shores
The median family income in Southern Shores is $140,504, with families comprising 2 earners (353) having the highest median family income of $149,375, while families with no earners (286) have the lowest median family income of $117,917, accounting for 36.7% and 29.8% of families, respectively.
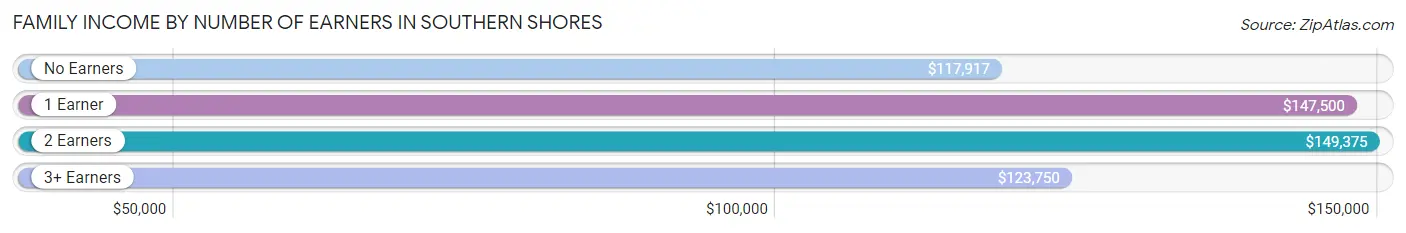
| Number of Earners | # Families | Median Income |
| No Earners | 286 (29.8%) | $117,917 |
| 1 Earner | 240 (25.0%) | $147,500 |
| 2 Earners | 353 (36.7%) | $149,375 |
| 3+ Earners | 82 (8.5%) | $123,750 |
| Total | 961 (100.0%) | $140,504 |
Household Income in Southern Shores
Household Income Brackets in Southern Shores
With 321 households falling in the category, the $100,000 to $149,999 income range is the most frequent in Southern Shores, accounting for 26.7% of all households.
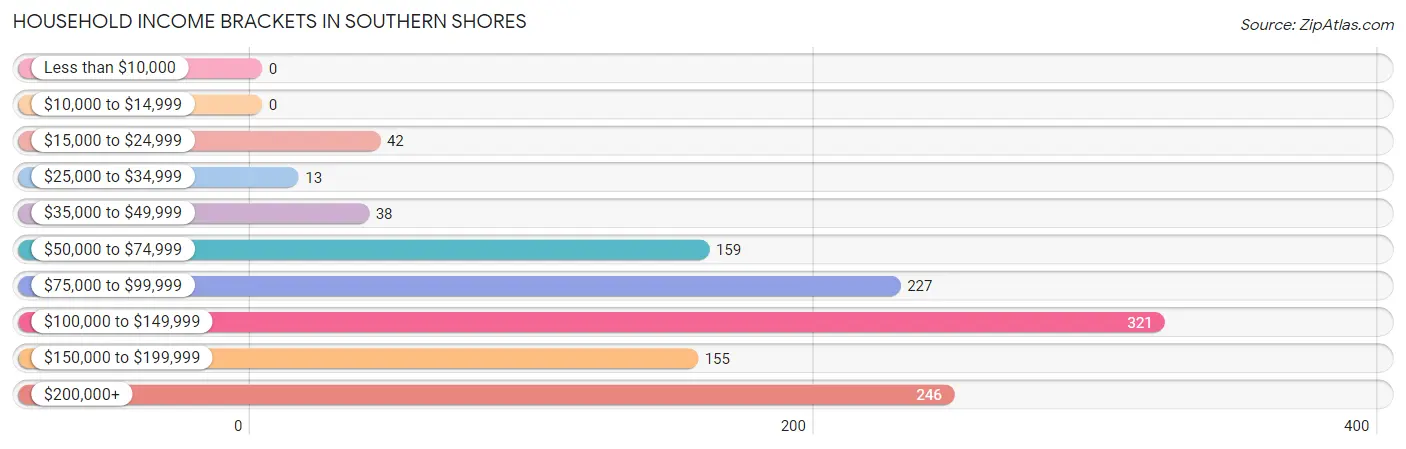
| Income Bracket | # Households | % Households |
| Less than $10,000 | 0 | 0.0% |
| $10,000 to $14,999 | 0 | 0.0% |
| $15,000 to $24,999 | 42 | 3.5% |
| $25,000 to $34,999 | 13 | 1.1% |
| $35,000 to $49,999 | 38 | 3.2% |
| $50,000 to $74,999 | 159 | 13.2% |
| $75,000 to $99,999 | 227 | 18.9% |
| $100,000 to $149,999 | 321 | 26.7% |
| $150,000 to $199,999 | 155 | 12.9% |
| $200,000+ | 246 | 20.5% |
Household Income by Householder Age in Southern Shores
The median household income in Southern Shores is $112,371, with the highest median household income of $140,880 found in the 25 to 44 years age bracket for the primary householder. A total of 197 households (16.4%) fall into this category.
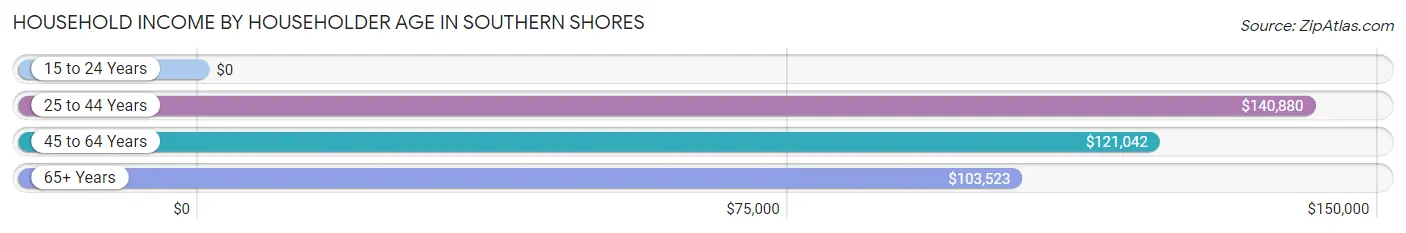
| Income Bracket | # Households | Median Income |
| 15 to 24 Years | 0 (0.0%) | $0 |
| 25 to 44 Years | 197 (16.4%) | $140,880 |
| 45 to 64 Years | 422 (35.1%) | $121,042 |
| 65+ Years | 583 (48.5%) | $103,523 |
| Total | 1,202 (100.0%) | $112,371 |
Poverty in Southern Shores
Income Below Poverty by Sex and Age in Southern Shores
With 0.6% poverty level for males and 1.0% for females among the residents of Southern Shores, 45 to 54 year old males and 18 to 24 year old females are the most vulnerable to poverty, with 10 males (7.2%) and 15 females (25.9%) in their respective age groups living below the poverty level.
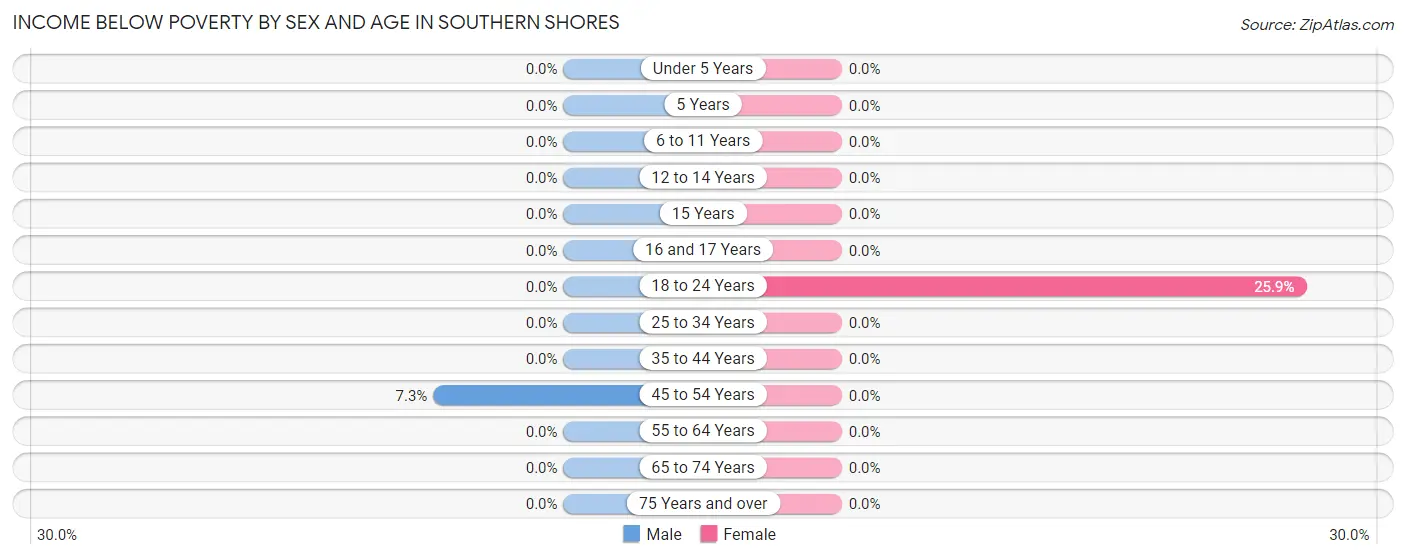
| Age Bracket | Male | Female |
| Under 5 Years | 0 (0.0%) | 0 (0.0%) |
| 5 Years | 0 (0.0%) | 0 (0.0%) |
| 6 to 11 Years | 0 (0.0%) | 0 (0.0%) |
| 12 to 14 Years | 0 (0.0%) | 0 (0.0%) |
| 15 Years | 0 (0.0%) | 0 (0.0%) |
| 16 and 17 Years | 0 (0.0%) | 0 (0.0%) |
| 18 to 24 Years | 0 (0.0%) | 15 (25.9%) |
| 25 to 34 Years | 0 (0.0%) | 0 (0.0%) |
| 35 to 44 Years | 0 (0.0%) | 0 (0.0%) |
| 45 to 54 Years | 10 (7.2%) | 0 (0.0%) |
| 55 to 64 Years | 0 (0.0%) | 0 (0.0%) |
| 65 to 74 Years | 0 (0.0%) | 0 (0.0%) |
| 75 Years and over | 0 (0.0%) | 0 (0.0%) |
| Total | 10 (0.6%) | 15 (1.0%) |
Income Above Poverty by Sex and Age in Southern Shores
According to the poverty statistics in Southern Shores, males aged under 5 years and females aged under 5 years are the age groups that are most secure financially, with 100.0% of males and 100.0% of females in these age groups living above the poverty line.
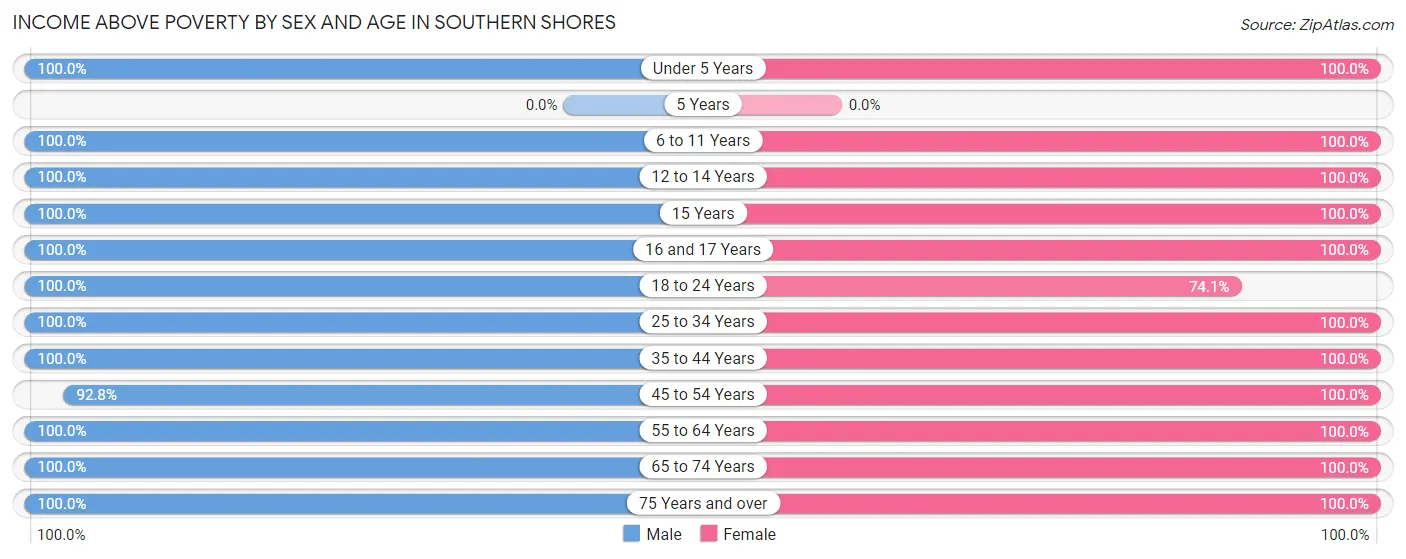
| Age Bracket | Male | Female |
| Under 5 Years | 74 (100.0%) | 40 (100.0%) |
| 5 Years | 0 (0.0%) | 0 (0.0%) |
| 6 to 11 Years | 133 (100.0%) | 64 (100.0%) |
| 12 to 14 Years | 59 (100.0%) | 32 (100.0%) |
| 15 Years | 27 (100.0%) | 5 (100.0%) |
| 16 and 17 Years | 6 (100.0%) | 60 (100.0%) |
| 18 to 24 Years | 58 (100.0%) | 43 (74.1%) |
| 25 to 34 Years | 221 (100.0%) | 68 (100.0%) |
| 35 to 44 Years | 154 (100.0%) | 202 (100.0%) |
| 45 to 54 Years | 128 (92.7%) | 117 (100.0%) |
| 55 to 64 Years | 260 (100.0%) | 402 (100.0%) |
| 65 to 74 Years | 272 (100.0%) | 302 (100.0%) |
| 75 Years and over | 174 (100.0%) | 172 (100.0%) |
| Total | 1,566 (99.4%) | 1,507 (99.0%) |
Income Below Poverty Among Married-Couple Families in Southern Shores
| Children | Above Poverty | Below Poverty |
| No Children | 607 (100.0%) | 0 (0.0%) |
| 1 or 2 Children | 240 (100.0%) | 0 (0.0%) |
| 3 or 4 Children | 33 (100.0%) | 0 (0.0%) |
| 5 or more Children | 0 (0.0%) | 0 (0.0%) |
| Total | 880 (100.0%) | 0 (0.0%) |
Income Below Poverty Among Single-Parent Households in Southern Shores
| Children | Single Father | Single Mother |
| No Children | 0 (0.0%) | 0 (0.0%) |
| 1 or 2 Children | 0 (0.0%) | 0 (0.0%) |
| 3 or 4 Children | 0 (0.0%) | 0 (0.0%) |
| 5 or more Children | 0 (0.0%) | 0 (0.0%) |
| Total | 0 (0.0%) | 0 (0.0%) |
Income Below Poverty Among Married-Couple vs Single-Parent Households in Southern Shores
| Children | Married-Couple Families | Single-Parent Households |
| No Children | 0 (0.0%) | 0 (0.0%) |
| 1 or 2 Children | 0 (0.0%) | 0 (0.0%) |
| 3 or 4 Children | 0 (0.0%) | 0 (0.0%) |
| 5 or more Children | 0 (0.0%) | 0 (0.0%) |
| Total | 0 (0.0%) | 0 (0.0%) |
Employment Characteristics in Southern Shores
Employment by Class of Employer in Southern Shores
Among the 1,215 employed individuals in Southern Shores, private company employees (674 | 55.5%), self-employed (incorporated) (185 | 15.2%), and self-employed (not incorporated) (128 | 10.5%) make up the most common classes of employment.
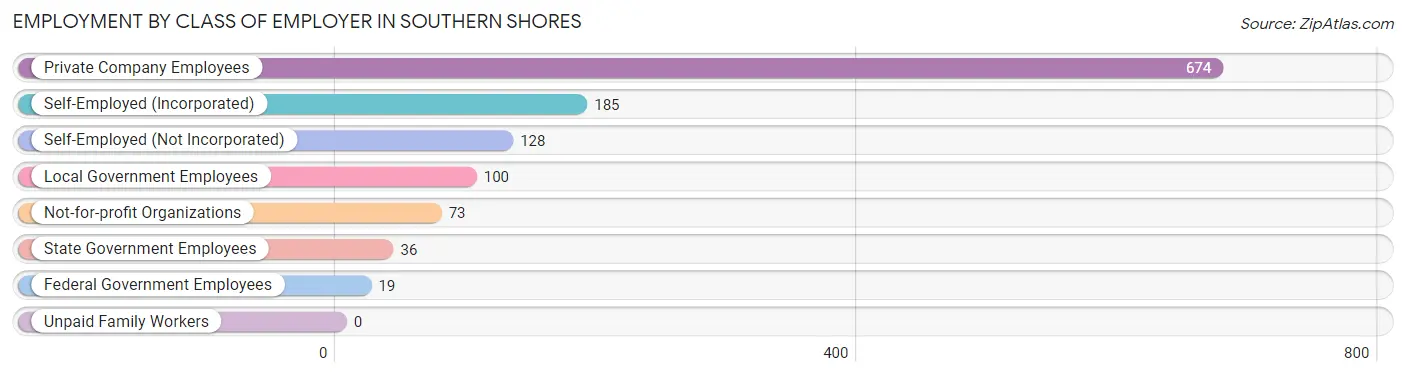
| Employer Class | # Employees | % Employees |
| Private Company Employees | 674 | 55.5% |
| Self-Employed (Incorporated) | 185 | 15.2% |
| Self-Employed (Not Incorporated) | 128 | 10.5% |
| Not-for-profit Organizations | 73 | 6.0% |
| Local Government Employees | 100 | 8.2% |
| State Government Employees | 36 | 3.0% |
| Federal Government Employees | 19 | 1.6% |
| Unpaid Family Workers | 0 | 0.0% |
| Total | 1,215 | 100.0% |
Employment Status by Age in Southern Shores
According to the labor force statistics for Southern Shores, out of the total population over 16 years of age (2,664), 54.7% or 1,457 individuals are in the labor force, with 14.4% or 210 of them unemployed. The age group with the highest labor force participation rate is 30 to 34 years, with 100.0% or 205 individuals in the labor force. Within the labor force, the 30 to 34 years age range has the highest percentage of unemployed individuals, with 78.5% or 161 of them being unemployed.
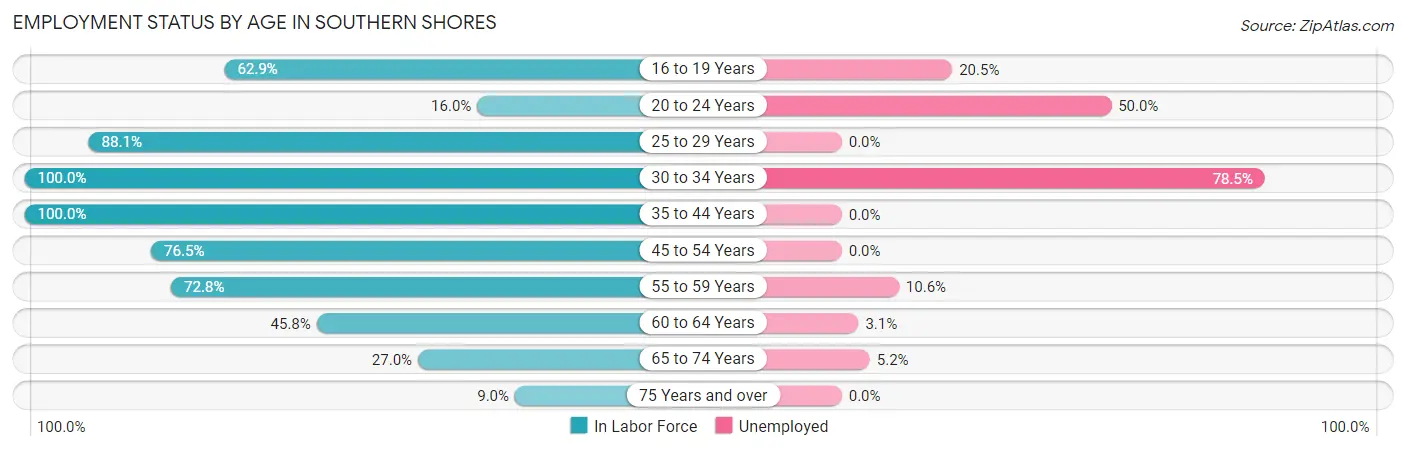
| Age Bracket | In Labor Force | Unemployed |
| 16 to 19 Years | 83 (62.9%) | 17 (20.5%) |
| 20 to 24 Years | 8 (16.0%) | 4 (50.0%) |
| 25 to 29 Years | 74 (88.1%) | 0 (0.0%) |
| 30 to 34 Years | 205 (100.0%) | 161 (78.5%) |
| 35 to 44 Years | 356 (100.0%) | 0 (0.0%) |
| 45 to 54 Years | 195 (76.5%) | 0 (0.0%) |
| 55 to 59 Years | 123 (72.8%) | 13 (10.6%) |
| 60 to 64 Years | 226 (45.8%) | 7 (3.1%) |
| 65 to 74 Years | 155 (27.0%) | 8 (5.2%) |
| 75 Years and over | 31 (9.0%) | 0 (0.0%) |
| Total | 1,457 (54.7%) | 210 (14.4%) |
Employment Status by Educational Attainment in Southern Shores
According to labor force statistics for Southern Shores, 75.5% of individuals (1,179) out of the total population between 25 and 64 years of age (1,562) are in the labor force, with 15.4% or 182 of them being unemployed. The group with the highest labor force participation rate are those with the educational attainment of high school diploma, with 86.6% or 380 individuals in the labor force. Within the labor force, individuals with high school diploma education have the highest percentage of unemployment, with 44.2% or 168 of them being unemployed.
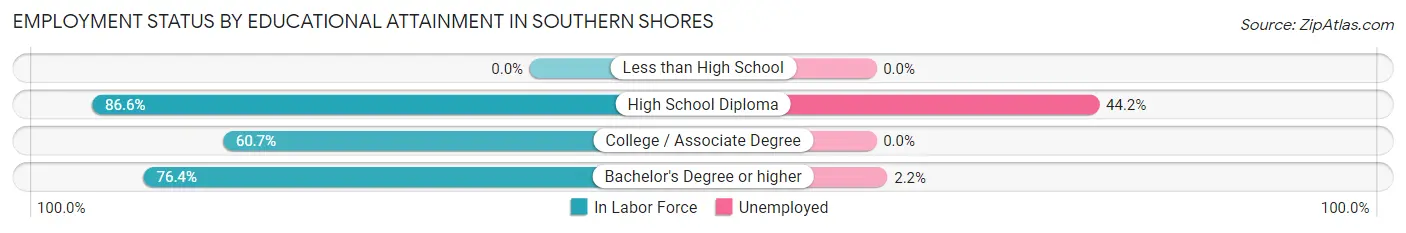
| Educational Attainment | In Labor Force | Unemployed |
| Less than High School | 0 (0.0%) | 0 (0.0%) |
| High School Diploma | 380 (86.6%) | 194 (44.2%) |
| College / Associate Degree | 198 (60.7%) | 0 (0.0%) |
| Bachelor's Degree or higher | 601 (76.4%) | 17 (2.2%) |
| Total | 1,179 (75.5%) | 241 (15.4%) |
Employment Occupations by Sex in Southern Shores
Management, Business, Science and Arts Occupations
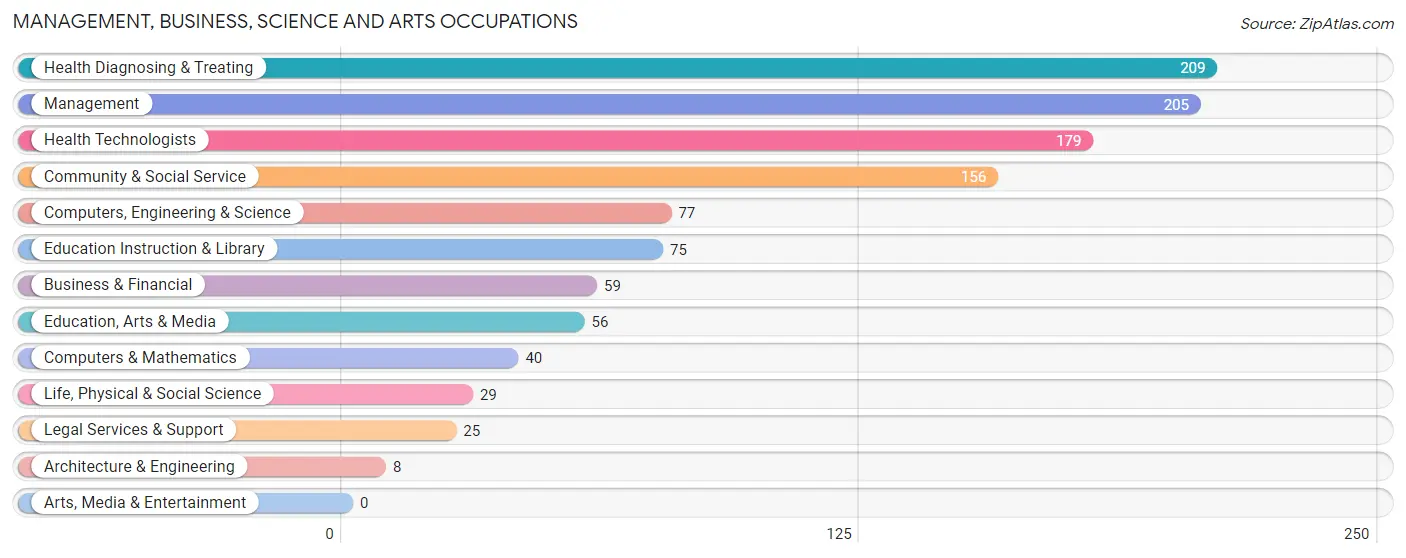
The most common Management, Business, Science and Arts occupations in Southern Shores are Health Diagnosing & Treating (209 | 16.8%), Management (205 | 16.5%), Health Technologists (179 | 14.4%), Community & Social Service (156 | 12.5%), and Computers, Engineering & Science (77 | 6.2%).
Management, Business, Science and Arts Occupations by Sex
Within the Management, Business, Science and Arts occupations in Southern Shores, the most male-oriented occupations are Computers, Engineering & Science (100.0%), Computers & Mathematics (100.0%), and Architecture & Engineering (100.0%), while the most female-oriented occupations are Health Diagnosing & Treating (78.0%), Health Technologists (74.3%), and Education Instruction & Library (68.0%).
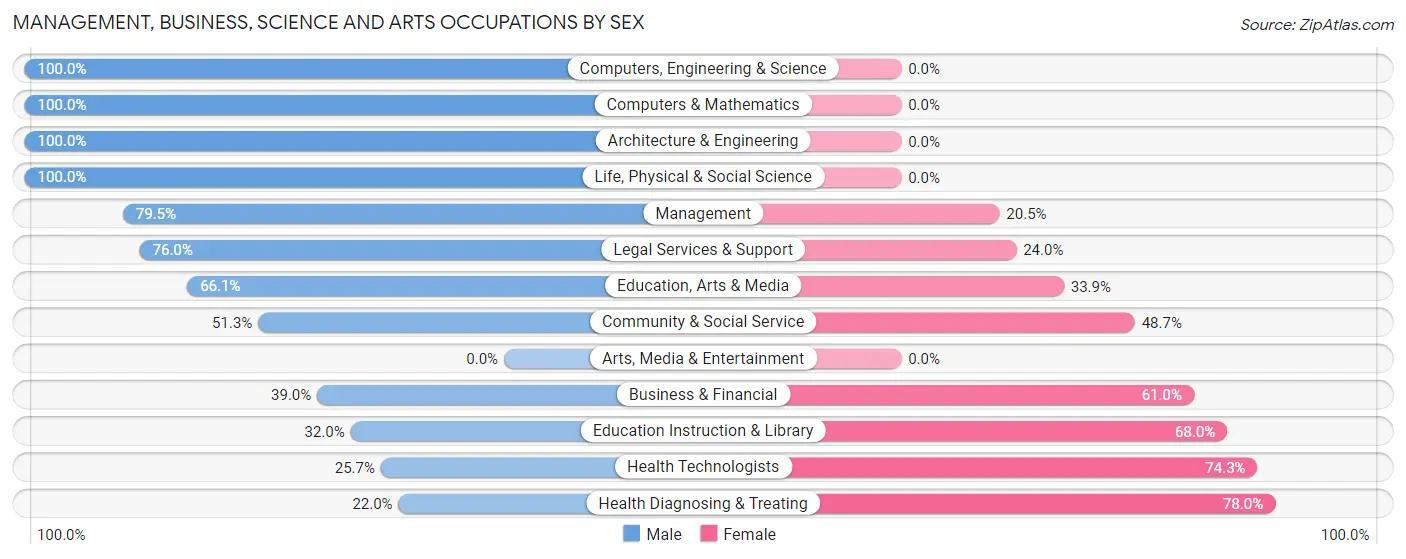
| Occupation | Male | Female |
| Management | 163 (79.5%) | 42 (20.5%) |
| Business & Financial | 23 (39.0%) | 36 (61.0%) |
| Computers, Engineering & Science | 77 (100.0%) | 0 (0.0%) |
| Computers & Mathematics | 40 (100.0%) | 0 (0.0%) |
| Architecture & Engineering | 8 (100.0%) | 0 (0.0%) |
| Life, Physical & Social Science | 29 (100.0%) | 0 (0.0%) |
| Community & Social Service | 80 (51.3%) | 76 (48.7%) |
| Education, Arts & Media | 37 (66.1%) | 19 (33.9%) |
| Legal Services & Support | 19 (76.0%) | 6 (24.0%) |
| Education Instruction & Library | 24 (32.0%) | 51 (68.0%) |
| Arts, Media & Entertainment | 0 (0.0%) | 0 (0.0%) |
| Health Diagnosing & Treating | 46 (22.0%) | 163 (78.0%) |
| Health Technologists | 46 (25.7%) | 133 (74.3%) |
| Total (Category) | 389 (55.1%) | 317 (44.9%) |
| Total (Overall) | 635 (51.0%) | 611 (49.0%) |
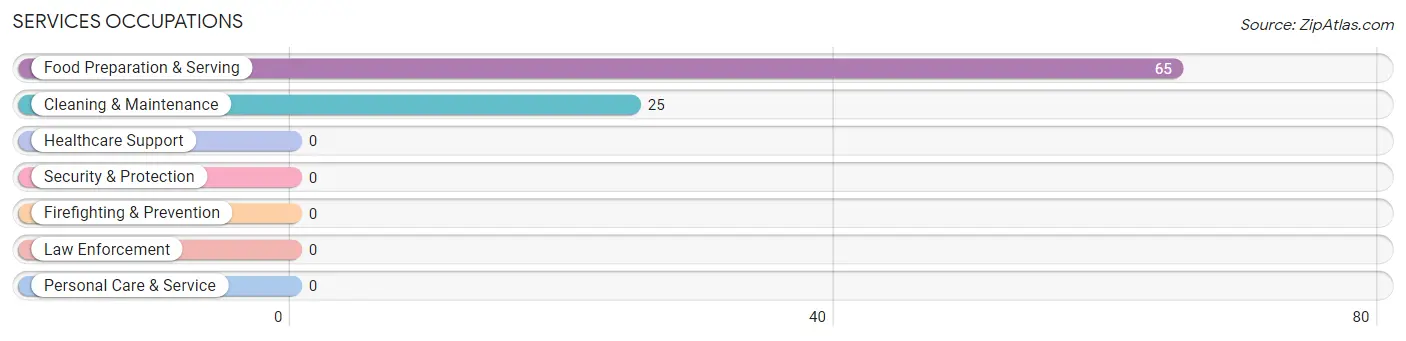
Services Occupations
The most common Services occupations in Southern Shores are Food Preparation & Serving (65 | 5.2%), and Cleaning & Maintenance (25 | 2.0%).
Services Occupations by Sex
Within the Services occupations in Southern Shores, the most male-oriented occupations are Cleaning & Maintenance (68.0%), and Food Preparation & Serving (15.4%), while the most female-oriented occupations are Food Preparation & Serving (84.6%), and Cleaning & Maintenance (32.0%).
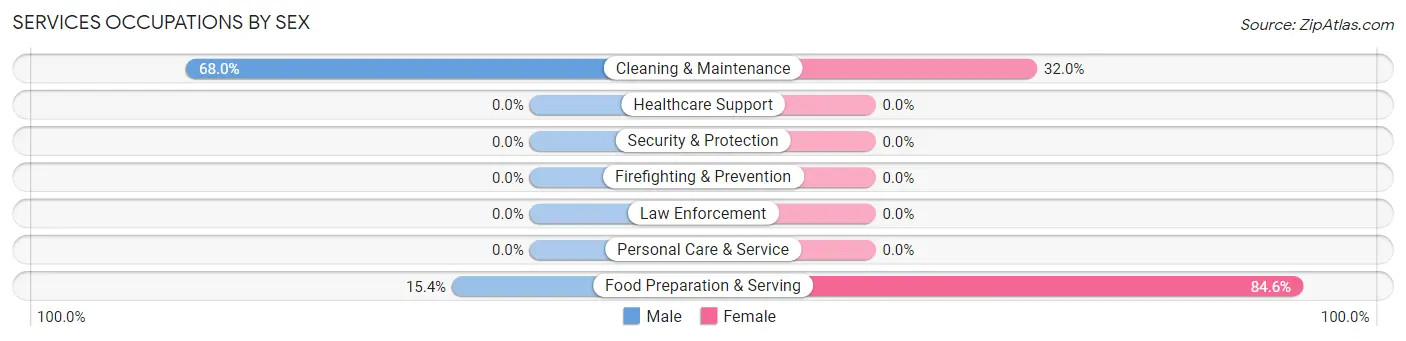
| Occupation | Male | Female |
| Healthcare Support | 0 (0.0%) | 0 (0.0%) |
| Security & Protection | 0 (0.0%) | 0 (0.0%) |
| Firefighting & Prevention | 0 (0.0%) | 0 (0.0%) |
| Law Enforcement | 0 (0.0%) | 0 (0.0%) |
| Food Preparation & Serving | 10 (15.4%) | 55 (84.6%) |
| Cleaning & Maintenance | 17 (68.0%) | 8 (32.0%) |
| Personal Care & Service | 0 (0.0%) | 0 (0.0%) |
| Total (Category) | 27 (30.0%) | 63 (70.0%) |
| Total (Overall) | 635 (51.0%) | 611 (49.0%) |
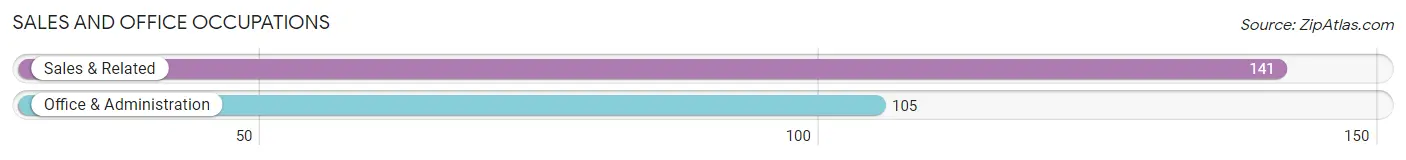
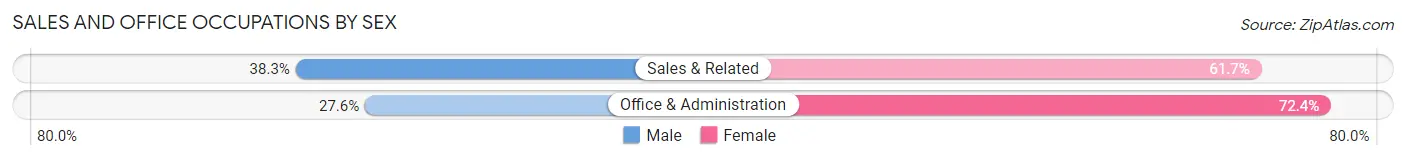
Sales and Office Occupations
The most common Sales and Office occupations in Southern Shores are Sales & Related (141 | 11.3%), and Office & Administration (105 | 8.4%).
Sales and Office Occupations by Sex
| Occupation | Male | Female |
| Sales & Related | 54 (38.3%) | 87 (61.7%) |
| Office & Administration | 29 (27.6%) | 76 (72.4%) |
| Total (Category) | 83 (33.7%) | 163 (66.3%) |
| Total (Overall) | 635 (51.0%) | 611 (49.0%) |
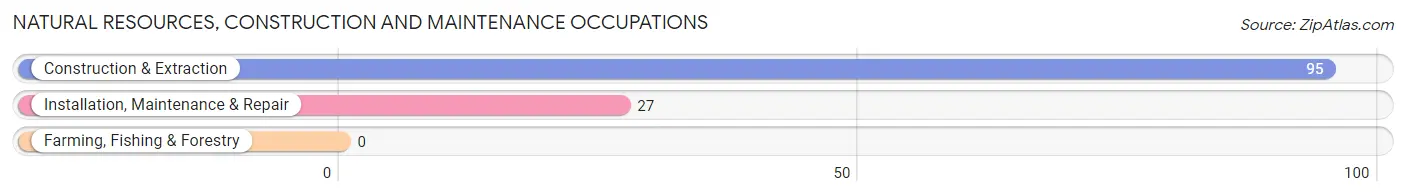
Natural Resources, Construction and Maintenance Occupations
The most common Natural Resources, Construction and Maintenance occupations in Southern Shores are Construction & Extraction (95 | 7.6%), and Installation, Maintenance & Repair (27 | 2.2%).
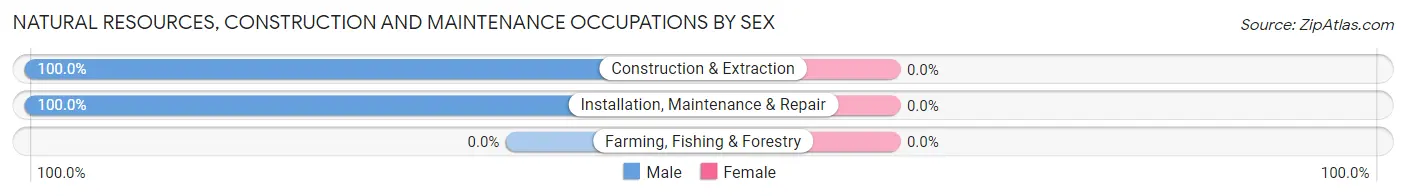
Natural Resources, Construction and Maintenance Occupations by Sex
| Occupation | Male | Female |
| Farming, Fishing & Forestry | 0 (0.0%) | 0 (0.0%) |
| Construction & Extraction | 95 (100.0%) | 0 (0.0%) |
| Installation, Maintenance & Repair | 27 (100.0%) | 0 (0.0%) |
| Total (Category) | 122 (100.0%) | 0 (0.0%) |
| Total (Overall) | 635 (51.0%) | 611 (49.0%) |
Production, Transportation and Moving Occupations
The most common Production, Transportation and Moving occupations in Southern Shores are Production (77 | 6.2%), and Transportation (5 | 0.4%).
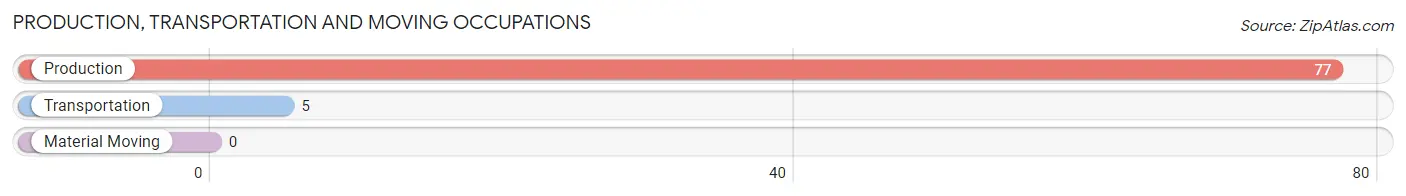
Production, Transportation and Moving Occupations by Sex
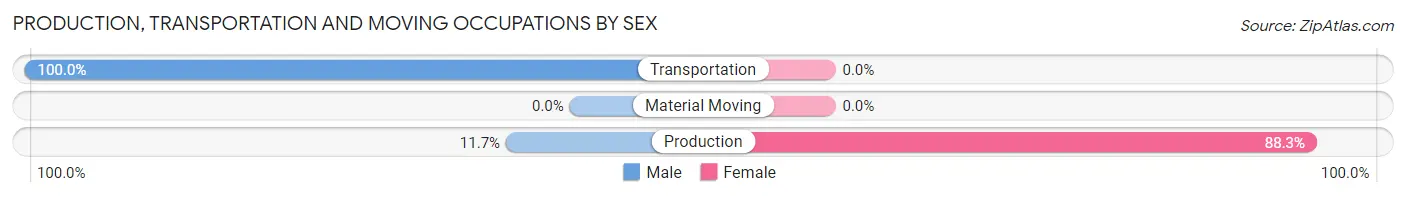
| Occupation | Male | Female |
| Production | 9 (11.7%) | 68 (88.3%) |
| Transportation | 5 (100.0%) | 0 (0.0%) |
| Material Moving | 0 (0.0%) | 0 (0.0%) |
| Total (Category) | 14 (17.1%) | 68 (82.9%) |
| Total (Overall) | 635 (51.0%) | 611 (49.0%) |
Employment Industries by Sex in Southern Shores
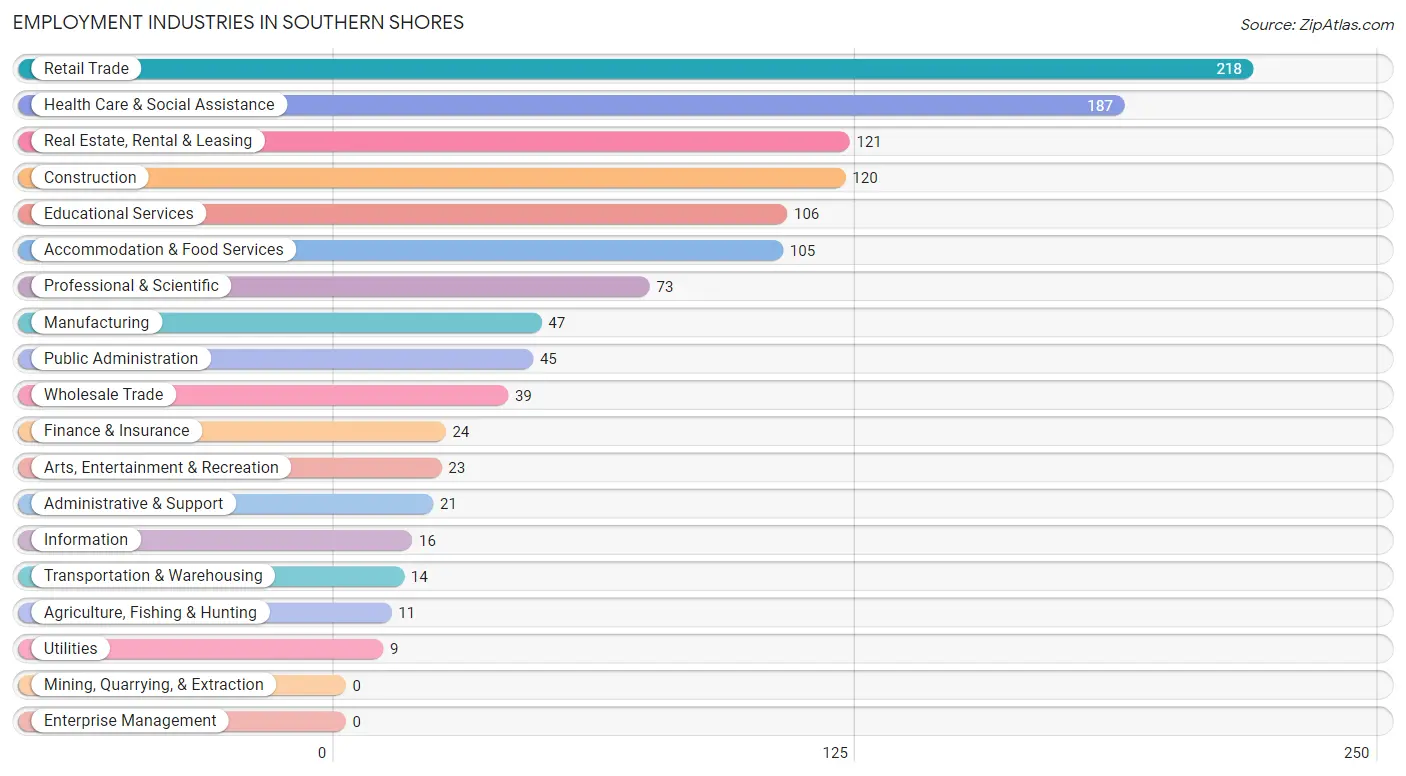
Employment Industries in Southern Shores
The major employment industries in Southern Shores include Retail Trade (218 | 17.5%), Health Care & Social Assistance (187 | 15.0%), Real Estate, Rental & Leasing (121 | 9.7%), Construction (120 | 9.6%), and Educational Services (106 | 8.5%).
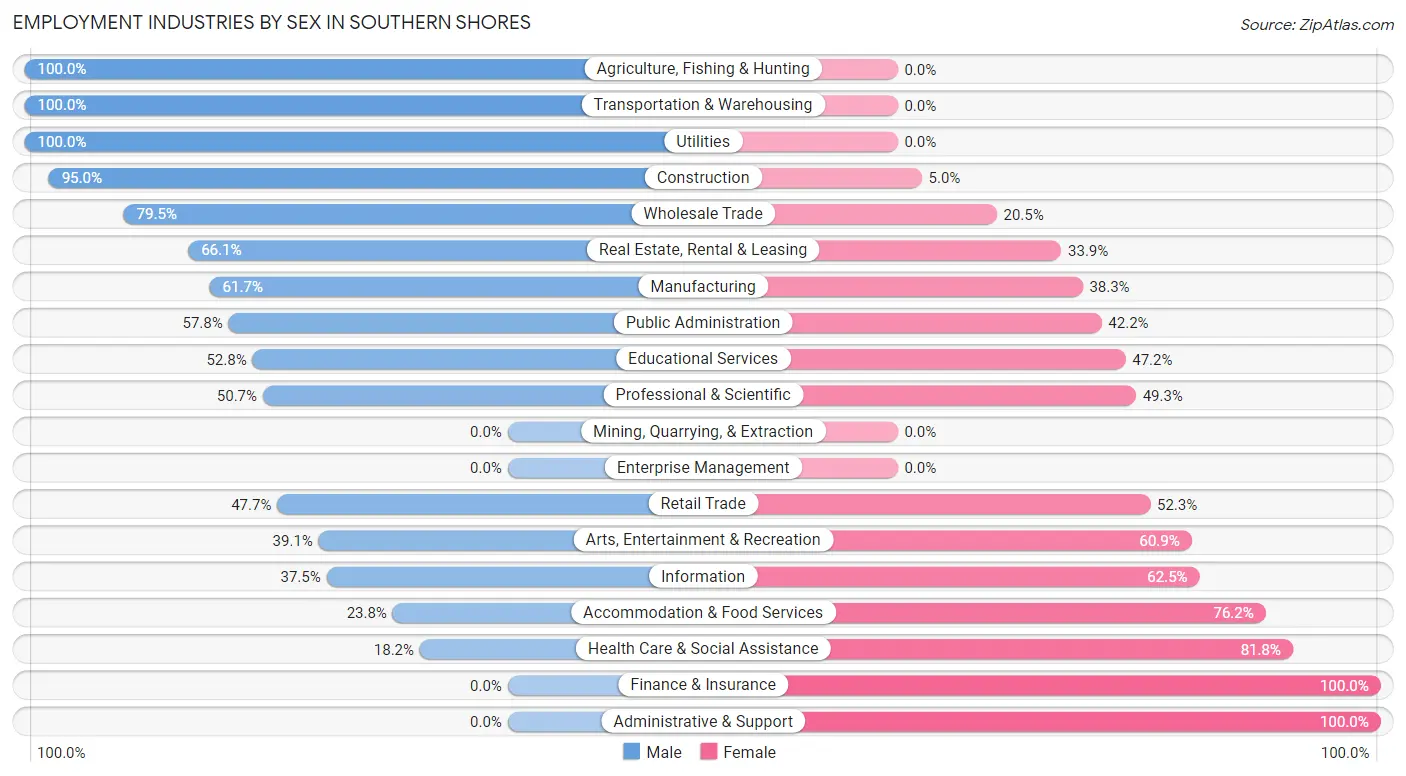
Employment Industries by Sex in Southern Shores
The Southern Shores industries that see more men than women are Agriculture, Fishing & Hunting (100.0%), Transportation & Warehousing (100.0%), and Utilities (100.0%), whereas the industries that tend to have a higher number of women are Finance & Insurance (100.0%), Administrative & Support (100.0%), and Health Care & Social Assistance (81.8%).
| Industry | Male | Female |
| Agriculture, Fishing & Hunting | 11 (100.0%) | 0 (0.0%) |
| Mining, Quarrying, & Extraction | 0 (0.0%) | 0 (0.0%) |
| Construction | 114 (95.0%) | 6 (5.0%) |
| Manufacturing | 29 (61.7%) | 18 (38.3%) |
| Wholesale Trade | 31 (79.5%) | 8 (20.5%) |
| Retail Trade | 104 (47.7%) | 114 (52.3%) |
| Transportation & Warehousing | 14 (100.0%) | 0 (0.0%) |
| Utilities | 9 (100.0%) | 0 (0.0%) |
| Information | 6 (37.5%) | 10 (62.5%) |
| Finance & Insurance | 0 (0.0%) | 24 (100.0%) |
| Real Estate, Rental & Leasing | 80 (66.1%) | 41 (33.9%) |
| Professional & Scientific | 37 (50.7%) | 36 (49.3%) |
| Enterprise Management | 0 (0.0%) | 0 (0.0%) |
| Administrative & Support | 0 (0.0%) | 21 (100.0%) |
| Educational Services | 56 (52.8%) | 50 (47.2%) |
| Health Care & Social Assistance | 34 (18.2%) | 153 (81.8%) |
| Arts, Entertainment & Recreation | 9 (39.1%) | 14 (60.9%) |
| Accommodation & Food Services | 25 (23.8%) | 80 (76.2%) |
| Public Administration | 26 (57.8%) | 19 (42.2%) |
| Total | 635 (51.0%) | 611 (49.0%) |
Education in Southern Shores
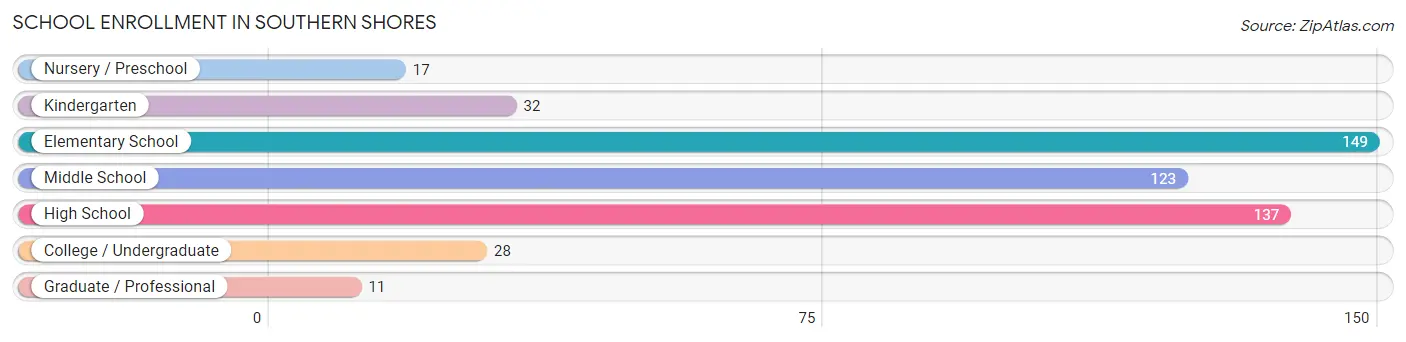
School Enrollment in Southern Shores
The most common levels of schooling among the 497 students in Southern Shores are elementary school (149 | 30.0%), high school (137 | 27.6%), and middle school (123 | 24.7%).
| School Level | # Students | % Students |
| Nursery / Preschool | 17 | 3.4% |
| Kindergarten | 32 | 6.4% |
| Elementary School | 149 | 30.0% |
| Middle School | 123 | 24.7% |
| High School | 137 | 27.6% |
| College / Undergraduate | 28 | 5.6% |
| Graduate / Professional | 11 | 2.2% |
| Total | 497 | 100.0% |
School Enrollment by Age by Funding Source in Southern Shores
Out of a total of 497 students who are enrolled in schools in Southern Shores, 102 (20.5%) attend a private institution, while the remaining 395 (79.5%) are enrolled in public schools. The age group of 3 to 4 year olds has the highest likelihood of being enrolled in private schools, with 17 (100.0% in the age bracket) enrolled. Conversely, the age group of 5 to 9 year old has the lowest likelihood of being enrolled in a private school, with 137 (86.2% in the age bracket) attending a public institution.
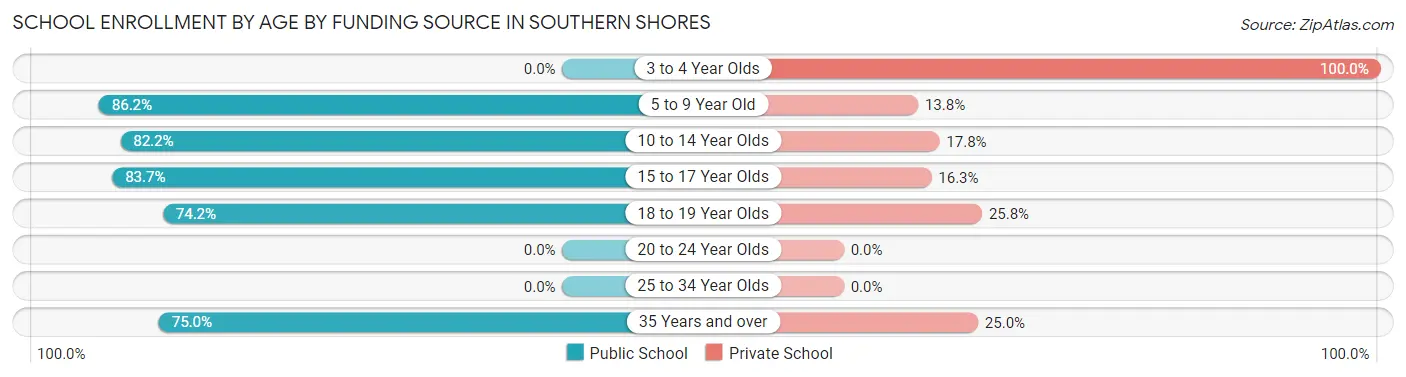
| Age Bracket | Public School | Private School |
| 3 to 4 Year Olds | 0 (0.0%) | 17 (100.0%) |
| 5 to 9 Year Old | 137 (86.2%) | 22 (13.8%) |
| 10 to 14 Year Olds | 106 (82.2%) | 23 (17.8%) |
| 15 to 17 Year Olds | 82 (83.7%) | 16 (16.3%) |
| 18 to 19 Year Olds | 49 (74.2%) | 17 (25.8%) |
| 20 to 24 Year Olds | 0 (0.0%) | 0 (0.0%) |
| 25 to 34 Year Olds | 0 (0.0%) | 0 (0.0%) |
| 35 Years and over | 21 (75.0%) | 7 (25.0%) |
| Total | 395 (79.5%) | 102 (20.5%) |
Educational Attainment by Field of Study in Southern Shores
Business (232 | 14.3%), education (224 | 13.8%), science & technology (216 | 13.3%), liberal arts & history (165 | 10.2%), and social sciences (124 | 7.7%) are the most common fields of study among 1,619 individuals in Southern Shores who have obtained a bachelor's degree or higher.
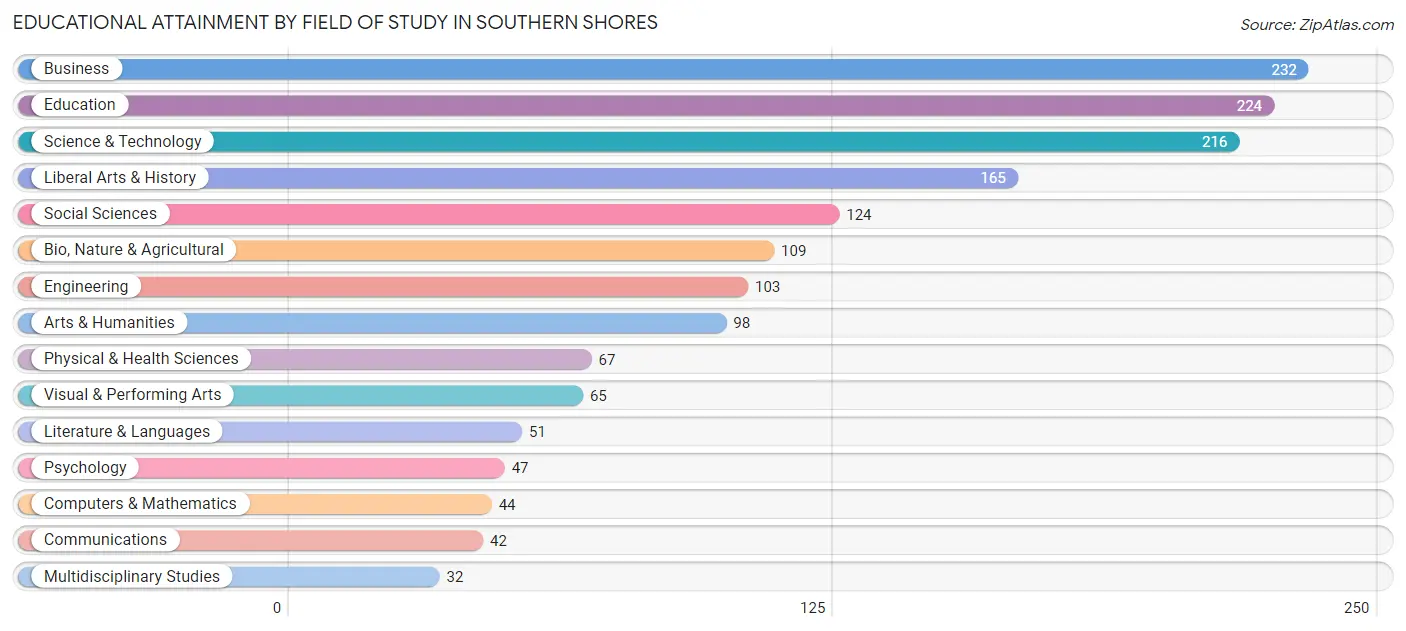
| Field of Study | # Graduates | % Graduates |
| Computers & Mathematics | 44 | 2.7% |
| Bio, Nature & Agricultural | 109 | 6.7% |
| Physical & Health Sciences | 67 | 4.1% |
| Psychology | 47 | 2.9% |
| Social Sciences | 124 | 7.7% |
| Engineering | 103 | 6.4% |
| Multidisciplinary Studies | 32 | 2.0% |
| Science & Technology | 216 | 13.3% |
| Business | 232 | 14.3% |
| Education | 224 | 13.8% |
| Literature & Languages | 51 | 3.2% |
| Liberal Arts & History | 165 | 10.2% |
| Visual & Performing Arts | 65 | 4.0% |
| Communications | 42 | 2.6% |
| Arts & Humanities | 98 | 6.0% |
| Total | 1,619 | 100.0% |
Transportation & Commute in Southern Shores
Vehicle Availability by Sex in Southern Shores
The most prevalent vehicle ownership categories in Southern Shores are males with 2 vehicles (365, accounting for 59.2%) and females with 2 vehicles (307, making up 61.0%).
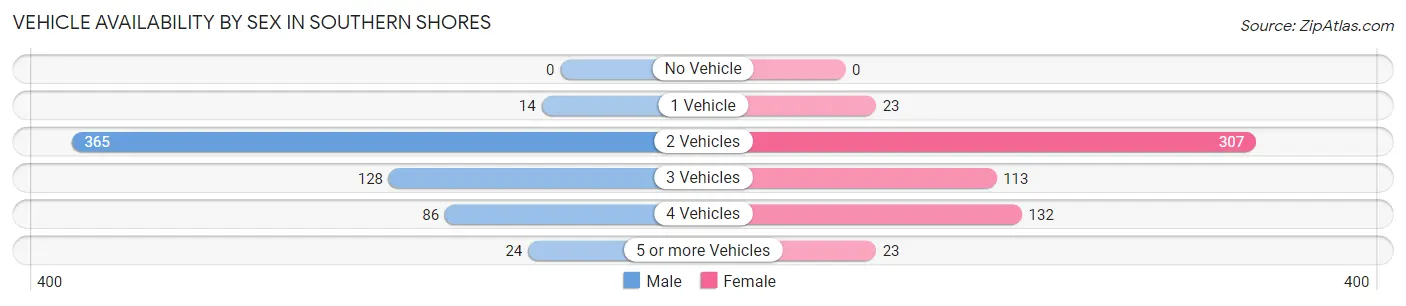
| Vehicles Available | Male | Female |
| No Vehicle | 0 (0.0%) | 0 (0.0%) |
| 1 Vehicle | 14 (2.3%) | 23 (3.8%) |
| 2 Vehicles | 365 (59.2%) | 307 (51.3%) |
| 3 Vehicles | 128 (20.7%) | 113 (18.9%) |
| 4 Vehicles | 86 (13.9%) | 132 (22.1%) |
| 5 or more Vehicles | 24 (3.9%) | 23 (3.8%) |
| Total | 617 (100.0%) | 598 (100.0%) |
Commute Time in Southern Shores
The most frequently occuring commute durations in Southern Shores are 5 to 9 minutes (226 commuters, 21.0%), 20 to 24 minutes (172 commuters, 16.0%), and 15 to 19 minutes (162 commuters, 15.1%).
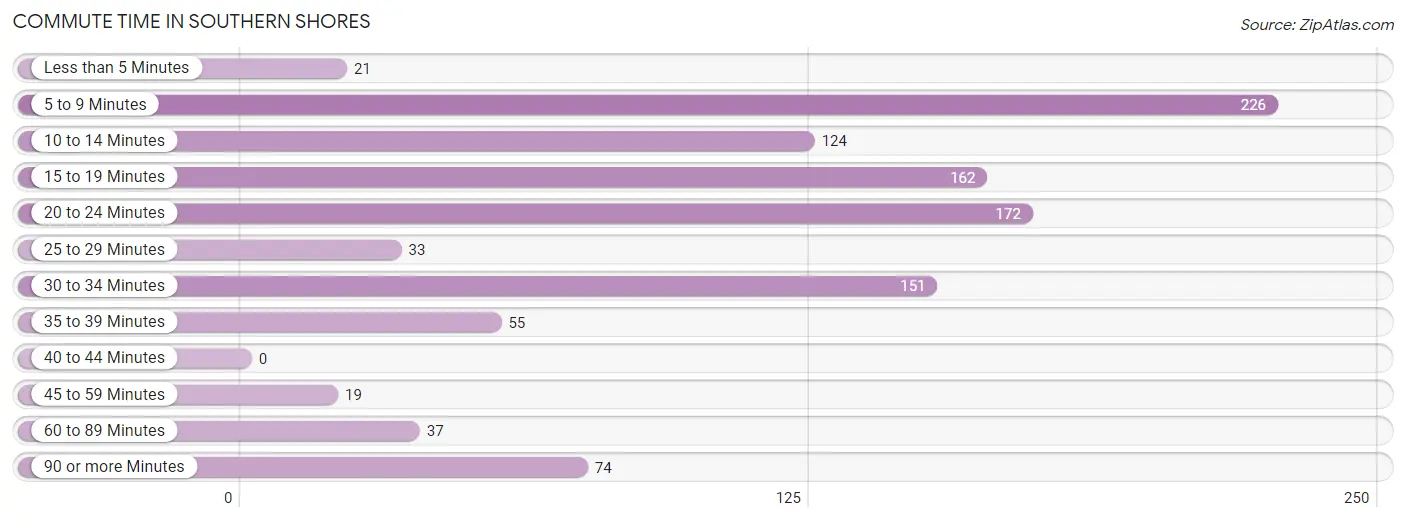
| Commute Time | # Commuters | % Commuters |
| Less than 5 Minutes | 21 | 2.0% |
| 5 to 9 Minutes | 226 | 21.0% |
| 10 to 14 Minutes | 124 | 11.6% |
| 15 to 19 Minutes | 162 | 15.1% |
| 20 to 24 Minutes | 172 | 16.0% |
| 25 to 29 Minutes | 33 | 3.1% |
| 30 to 34 Minutes | 151 | 14.1% |
| 35 to 39 Minutes | 55 | 5.1% |
| 40 to 44 Minutes | 0 | 0.0% |
| 45 to 59 Minutes | 19 | 1.8% |
| 60 to 89 Minutes | 37 | 3.5% |
| 90 or more Minutes | 74 | 6.9% |
Commute Time by Sex in Southern Shores
The most common commute times in Southern Shores are 20 to 24 minutes (134 commuters, 23.9%) for males and 5 to 9 minutes (124 commuters, 24.2%) for females.
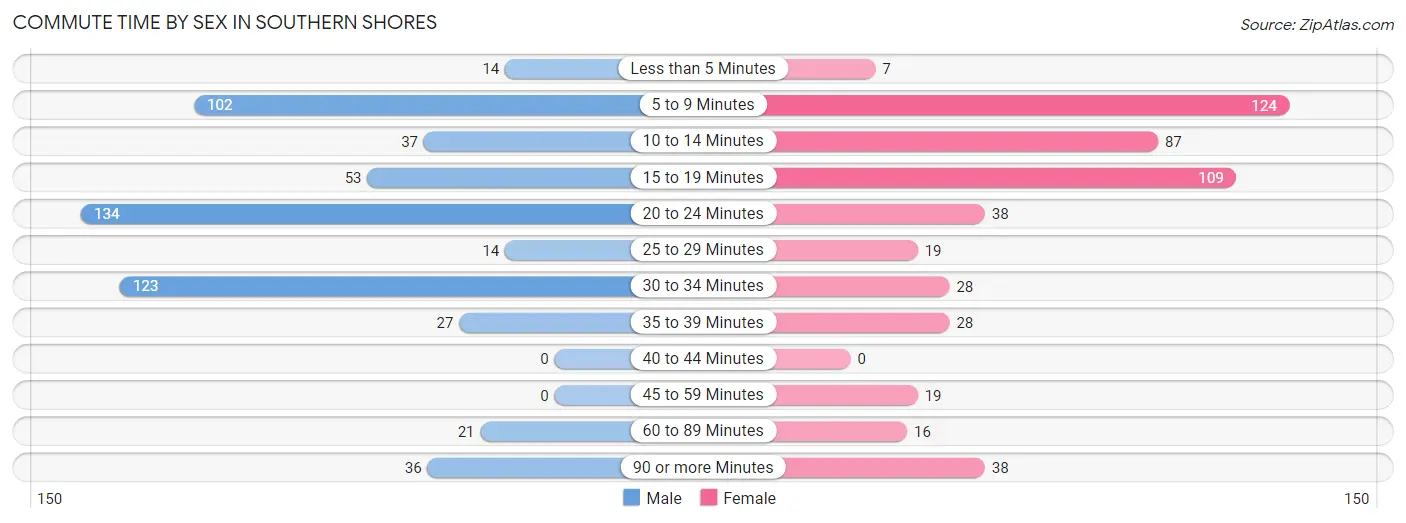
| Commute Time | Male | Female |
| Less than 5 Minutes | 14 (2.5%) | 7 (1.4%) |
| 5 to 9 Minutes | 102 (18.2%) | 124 (24.2%) |
| 10 to 14 Minutes | 37 (6.6%) | 87 (17.0%) |
| 15 to 19 Minutes | 53 (9.5%) | 109 (21.2%) |
| 20 to 24 Minutes | 134 (23.9%) | 38 (7.4%) |
| 25 to 29 Minutes | 14 (2.5%) | 19 (3.7%) |
| 30 to 34 Minutes | 123 (21.9%) | 28 (5.5%) |
| 35 to 39 Minutes | 27 (4.8%) | 28 (5.5%) |
| 40 to 44 Minutes | 0 (0.0%) | 0 (0.0%) |
| 45 to 59 Minutes | 0 (0.0%) | 19 (3.7%) |
| 60 to 89 Minutes | 21 (3.7%) | 16 (3.1%) |
| 90 or more Minutes | 36 (6.4%) | 38 (7.4%) |
Time of Departure to Work by Sex in Southern Shores
The most frequent times of departure to work in Southern Shores are 8:30 AM to 8:59 AM (162, 28.9%) for males and 7:30 AM to 7:59 AM (113, 22.0%) for females.
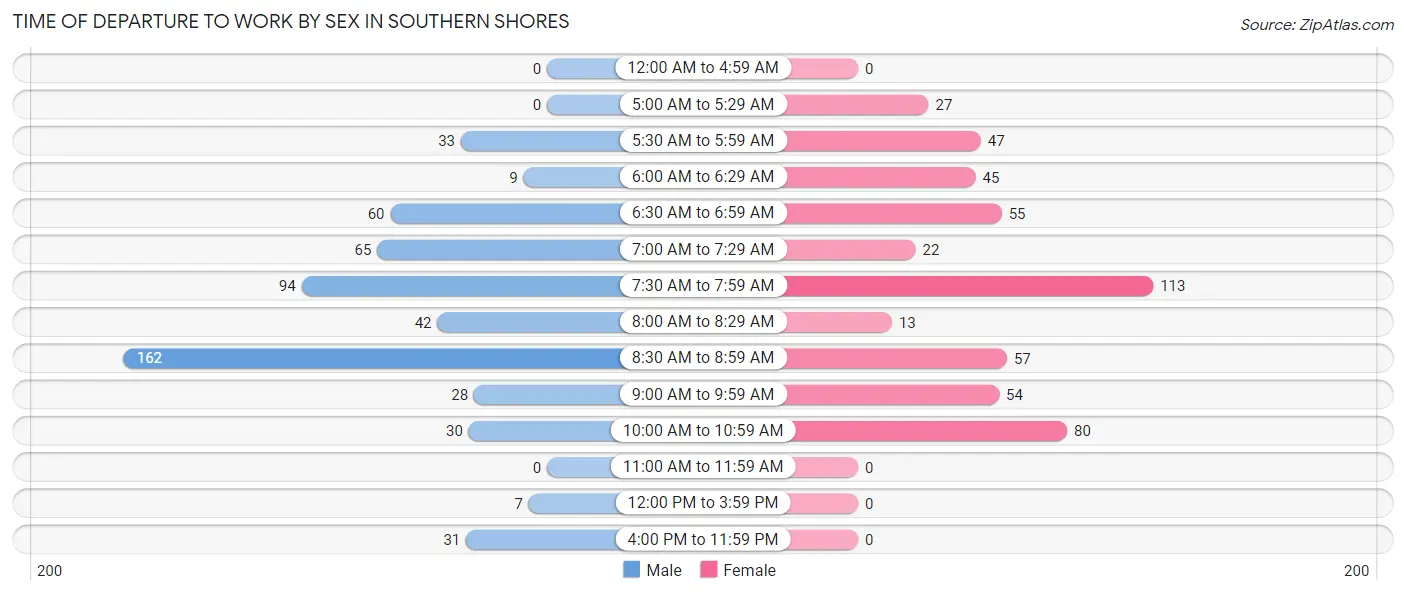
| Time of Departure | Male | Female |
| 12:00 AM to 4:59 AM | 0 (0.0%) | 0 (0.0%) |
| 5:00 AM to 5:29 AM | 0 (0.0%) | 27 (5.3%) |
| 5:30 AM to 5:59 AM | 33 (5.9%) | 47 (9.2%) |
| 6:00 AM to 6:29 AM | 9 (1.6%) | 45 (8.8%) |
| 6:30 AM to 6:59 AM | 60 (10.7%) | 55 (10.7%) |
| 7:00 AM to 7:29 AM | 65 (11.6%) | 22 (4.3%) |
| 7:30 AM to 7:59 AM | 94 (16.8%) | 113 (22.0%) |
| 8:00 AM to 8:29 AM | 42 (7.5%) | 13 (2.5%) |
| 8:30 AM to 8:59 AM | 162 (28.9%) | 57 (11.1%) |
| 9:00 AM to 9:59 AM | 28 (5.0%) | 54 (10.5%) |
| 10:00 AM to 10:59 AM | 30 (5.3%) | 80 (15.6%) |
| 11:00 AM to 11:59 AM | 0 (0.0%) | 0 (0.0%) |
| 12:00 PM to 3:59 PM | 7 (1.3%) | 0 (0.0%) |
| 4:00 PM to 11:59 PM | 31 (5.5%) | 0 (0.0%) |
| Total | 561 (100.0%) | 513 (100.0%) |
Housing Occupancy in Southern Shores
Occupancy by Ownership in Southern Shores
Of the total 1,202 dwellings in Southern Shores, owner-occupied units account for 1,058 (88.0%), while renter-occupied units make up 144 (12.0%).
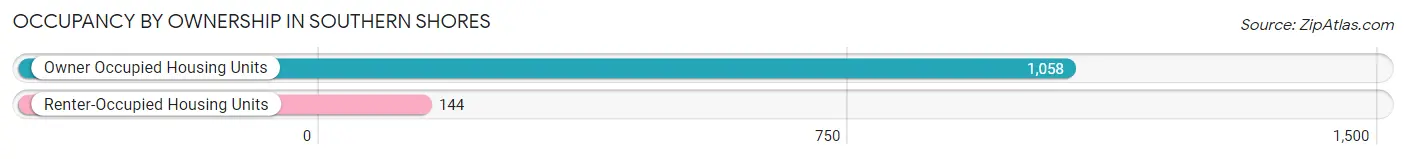
| Occupancy | # Housing Units | % Housing Units |
| Owner Occupied Housing Units | 1,058 | 88.0% |
| Renter-Occupied Housing Units | 144 | 12.0% |
| Total Occupied Housing Units | 1,202 | 100.0% |
Occupancy by Household Size in Southern Shores
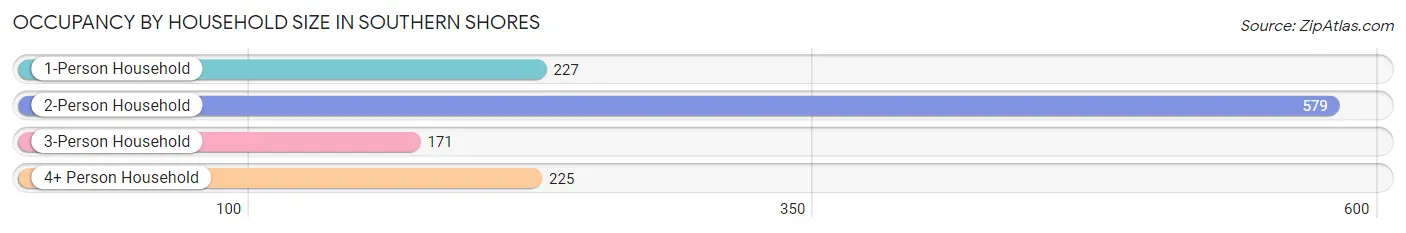
| Household Size | # Housing Units | % Housing Units |
| 1-Person Household | 227 | 18.9% |
| 2-Person Household | 579 | 48.2% |
| 3-Person Household | 171 | 14.2% |
| 4+ Person Household | 225 | 18.7% |
| Total Housing Units | 1,202 | 100.0% |
Occupancy by Ownership by Household Size in Southern Shores
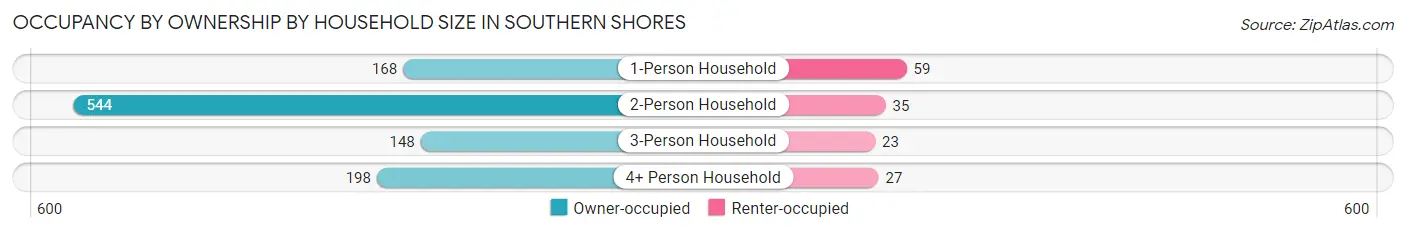
| Household Size | Owner-occupied | Renter-occupied |
| 1-Person Household | 168 (74.0%) | 59 (26.0%) |
| 2-Person Household | 544 (94.0%) | 35 (6.0%) |
| 3-Person Household | 148 (86.6%) | 23 (13.5%) |
| 4+ Person Household | 198 (88.0%) | 27 (12.0%) |
| Total Housing Units | 1,058 (88.0%) | 144 (12.0%) |
Occupancy by Educational Attainment in Southern Shores
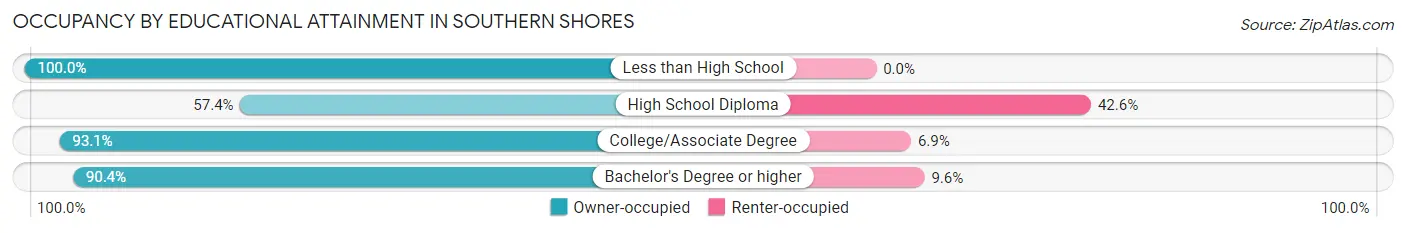
| Household Size | Owner-occupied | Renter-occupied |
| Less than High School | 5 (100.0%) | 0 (0.0%) |
| High School Diploma | 62 (57.4%) | 46 (42.6%) |
| College/Associate Degree | 216 (93.1%) | 16 (6.9%) |
| Bachelor's Degree or higher | 775 (90.4%) | 82 (9.6%) |
Occupancy by Age of Householder in Southern Shores
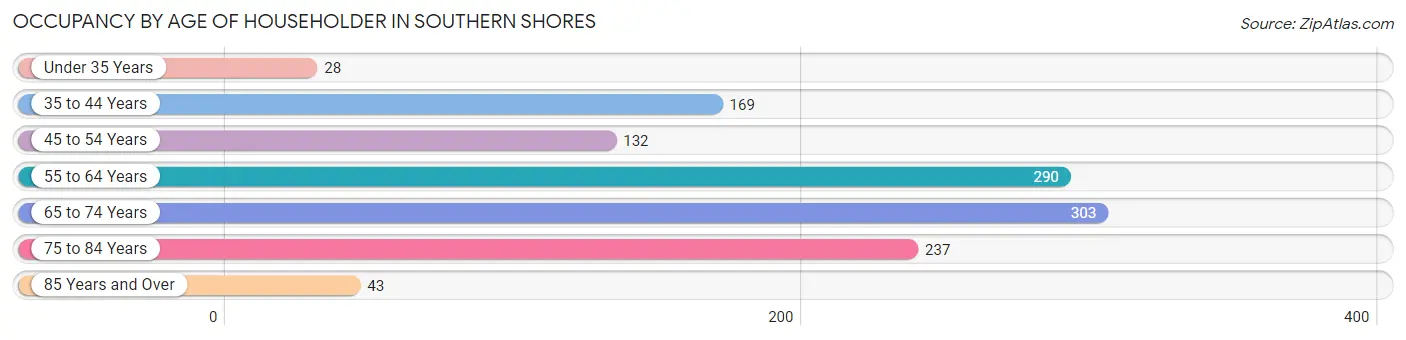
| Age Bracket | # Households | % Households |
| Under 35 Years | 28 | 2.3% |
| 35 to 44 Years | 169 | 14.1% |
| 45 to 54 Years | 132 | 11.0% |
| 55 to 64 Years | 290 | 24.1% |
| 65 to 74 Years | 303 | 25.2% |
| 75 to 84 Years | 237 | 19.7% |
| 85 Years and Over | 43 | 3.6% |
| Total | 1,202 | 100.0% |
Housing Finances in Southern Shores
Median Income by Occupancy in Southern Shores
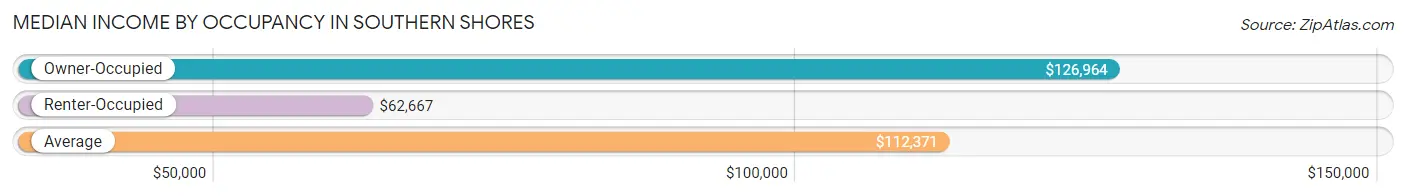
| Occupancy Type | # Households | Median Income |
| Owner-Occupied | 1,058 (88.0%) | $126,964 |
| Renter-Occupied | 144 (12.0%) | $62,667 |
| Average | 1,202 (100.0%) | $112,371 |
Occupancy by Householder Income Bracket in Southern Shores
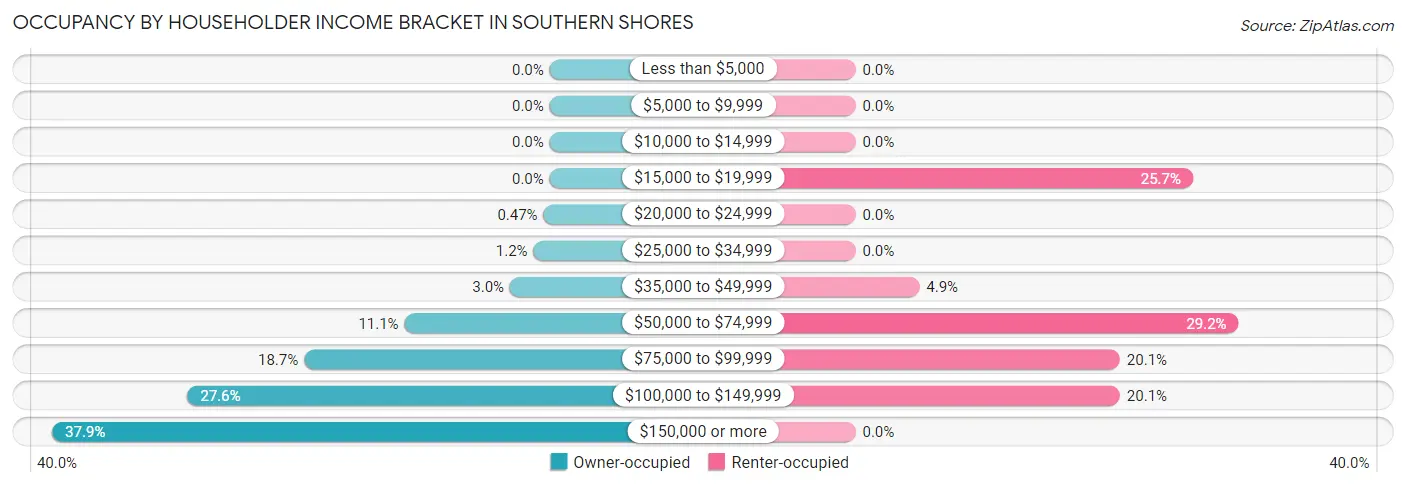
| Income Bracket | Owner-occupied | Renter-occupied |
| Less than $5,000 | 0 (0.0%) | 0 (0.0%) |
| $5,000 to $9,999 | 0 (0.0%) | 0 (0.0%) |
| $10,000 to $14,999 | 0 (0.0%) | 0 (0.0%) |
| $15,000 to $19,999 | 0 (0.0%) | 37 (25.7%) |
| $20,000 to $24,999 | 5 (0.5%) | 0 (0.0%) |
| $25,000 to $34,999 | 13 (1.2%) | 0 (0.0%) |
| $35,000 to $49,999 | 32 (3.0%) | 7 (4.9%) |
| $50,000 to $74,999 | 117 (11.1%) | 42 (29.2%) |
| $75,000 to $99,999 | 198 (18.7%) | 29 (20.1%) |
| $100,000 to $149,999 | 292 (27.6%) | 29 (20.1%) |
| $150,000 or more | 401 (37.9%) | 0 (0.0%) |
| Total | 1,058 (100.0%) | 144 (100.0%) |
Monthly Housing Cost Tiers in Southern Shores
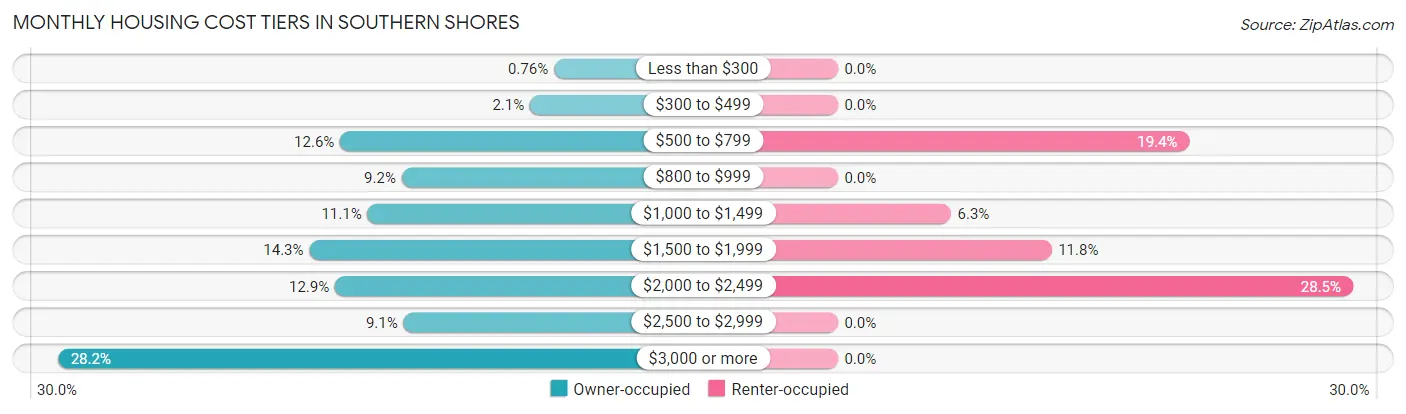
| Monthly Cost | Owner-occupied | Renter-occupied |
| Less than $300 | 8 (0.8%) | 0 (0.0%) |
| $300 to $499 | 22 (2.1%) | 0 (0.0%) |
| $500 to $799 | 133 (12.6%) | 28 (19.4%) |
| $800 to $999 | 97 (9.2%) | 0 (0.0%) |
| $1,000 to $1,499 | 117 (11.1%) | 9 (6.2%) |
| $1,500 to $1,999 | 151 (14.3%) | 17 (11.8%) |
| $2,000 to $2,499 | 136 (12.9%) | 41 (28.5%) |
| $2,500 to $2,999 | 96 (9.1%) | 0 (0.0%) |
| $3,000 or more | 298 (28.2%) | 0 (0.0%) |
| Total | 1,058 (100.0%) | 144 (100.0%) |
Physical Housing Characteristics in Southern Shores
Housing Structures in Southern Shores
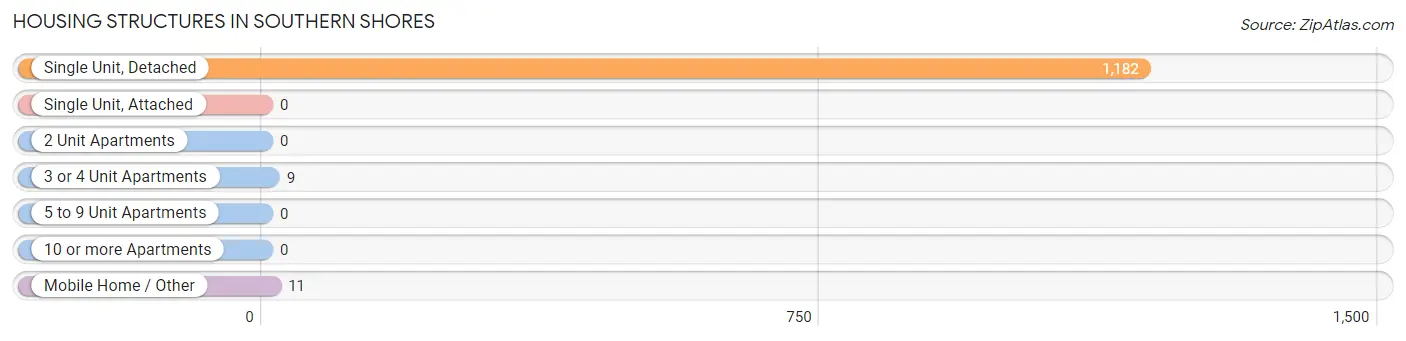
| Structure Type | # Housing Units | % Housing Units |
| Single Unit, Detached | 1,182 | 98.3% |
| Single Unit, Attached | 0 | 0.0% |
| 2 Unit Apartments | 0 | 0.0% |
| 3 or 4 Unit Apartments | 9 | 0.7% |
| 5 to 9 Unit Apartments | 0 | 0.0% |
| 10 or more Apartments | 0 | 0.0% |
| Mobile Home / Other | 11 | 0.9% |
| Total | 1,202 | 100.0% |
Housing Structures by Occupancy in Southern Shores
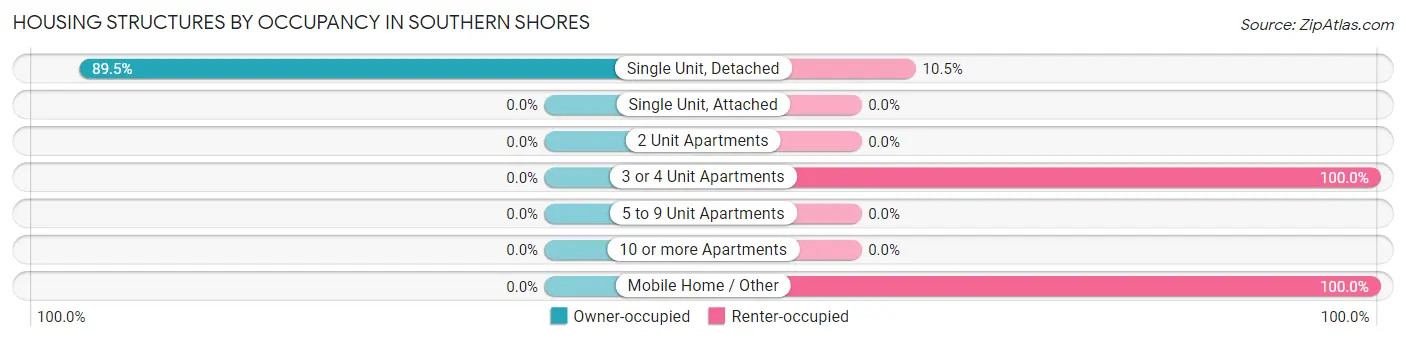
| Structure Type | Owner-occupied | Renter-occupied |
| Single Unit, Detached | 1,058 (89.5%) | 124 (10.5%) |
| Single Unit, Attached | 0 (0.0%) | 0 (0.0%) |
| 2 Unit Apartments | 0 (0.0%) | 0 (0.0%) |
| 3 or 4 Unit Apartments | 0 (0.0%) | 9 (100.0%) |
| 5 to 9 Unit Apartments | 0 (0.0%) | 0 (0.0%) |
| 10 or more Apartments | 0 (0.0%) | 0 (0.0%) |
| Mobile Home / Other | 0 (0.0%) | 11 (100.0%) |
| Total | 1,058 (88.0%) | 144 (12.0%) |
Housing Structures by Number of Rooms in Southern Shores
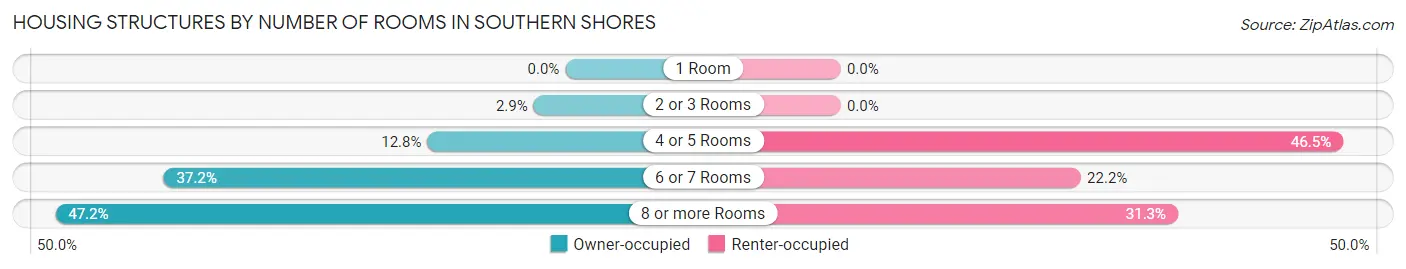
| Number of Rooms | Owner-occupied | Renter-occupied |
| 1 Room | 0 (0.0%) | 0 (0.0%) |
| 2 or 3 Rooms | 31 (2.9%) | 0 (0.0%) |
| 4 or 5 Rooms | 135 (12.8%) | 67 (46.5%) |
| 6 or 7 Rooms | 393 (37.1%) | 32 (22.2%) |
| 8 or more Rooms | 499 (47.2%) | 45 (31.2%) |
| Total | 1,058 (100.0%) | 144 (100.0%) |
Housing Structure by Heating Type in Southern Shores
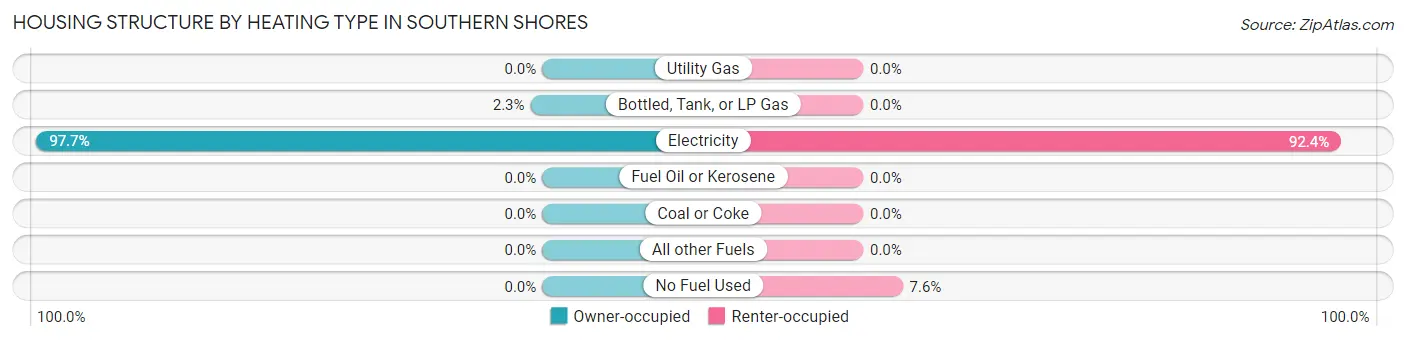
| Heating Type | Owner-occupied | Renter-occupied |
| Utility Gas | 0 (0.0%) | 0 (0.0%) |
| Bottled, Tank, or LP Gas | 24 (2.3%) | 0 (0.0%) |
| Electricity | 1,034 (97.7%) | 133 (92.4%) |
| Fuel Oil or Kerosene | 0 (0.0%) | 0 (0.0%) |
| Coal or Coke | 0 (0.0%) | 0 (0.0%) |
| All other Fuels | 0 (0.0%) | 0 (0.0%) |
| No Fuel Used | 0 (0.0%) | 11 (7.6%) |
| Total | 1,058 (100.0%) | 144 (100.0%) |
Household Vehicle Usage in Southern Shores
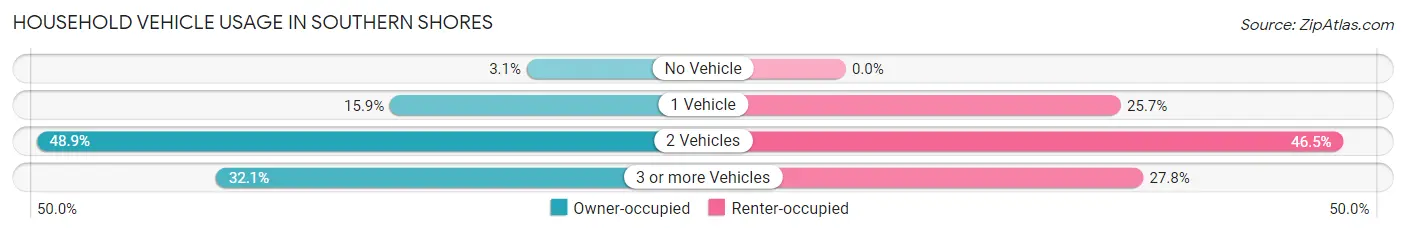
| Vehicles per Household | Owner-occupied | Renter-occupied |
| No Vehicle | 33 (3.1%) | 0 (0.0%) |
| 1 Vehicle | 168 (15.9%) | 37 (25.7%) |
| 2 Vehicles | 517 (48.9%) | 67 (46.5%) |
| 3 or more Vehicles | 340 (32.1%) | 40 (27.8%) |
| Total | 1,058 (100.0%) | 144 (100.0%) |
Real Estate & Mortgages in Southern Shores
Real Estate and Mortgage Overview in Southern Shores
| Characteristic | Without Mortgage | With Mortgage |
| Housing Units | 328 | 730 |
| Median Property Value | $499,200 | $615,900 |
| Median Household Income | $81,833 | $337 |
| Monthly Housing Costs | $826 | $298 |
| Real Estate Taxes | $3,440 | $16 |
Property Value by Mortgage Status in Southern Shores
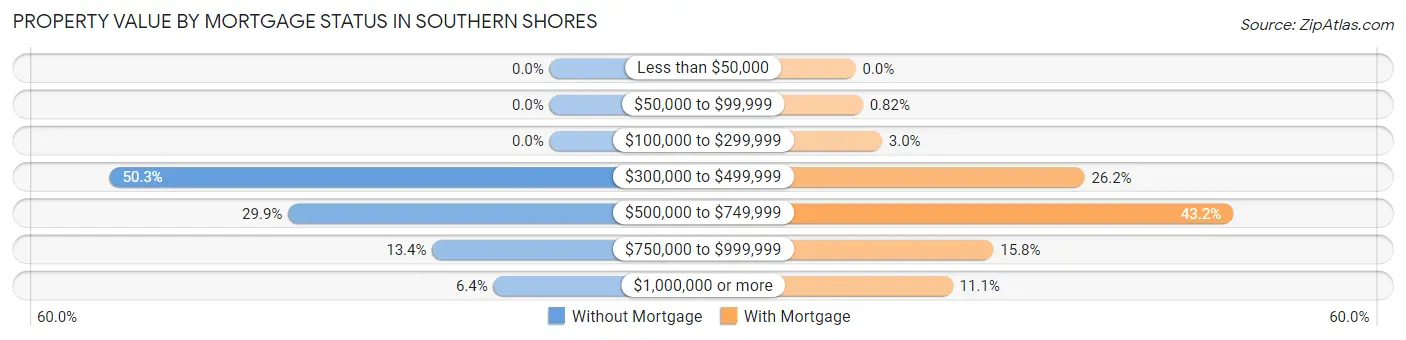
| Property Value | Without Mortgage | With Mortgage |
| Less than $50,000 | 0 (0.0%) | 0 (0.0%) |
| $50,000 to $99,999 | 0 (0.0%) | 6 (0.8%) |
| $100,000 to $299,999 | 0 (0.0%) | 22 (3.0%) |
| $300,000 to $499,999 | 165 (50.3%) | 191 (26.2%) |
| $500,000 to $749,999 | 98 (29.9%) | 315 (43.1%) |
| $750,000 to $999,999 | 44 (13.4%) | 115 (15.8%) |
| $1,000,000 or more | 21 (6.4%) | 81 (11.1%) |
| Total | 328 (100.0%) | 730 (100.0%) |
Household Income by Mortgage Status in Southern Shores
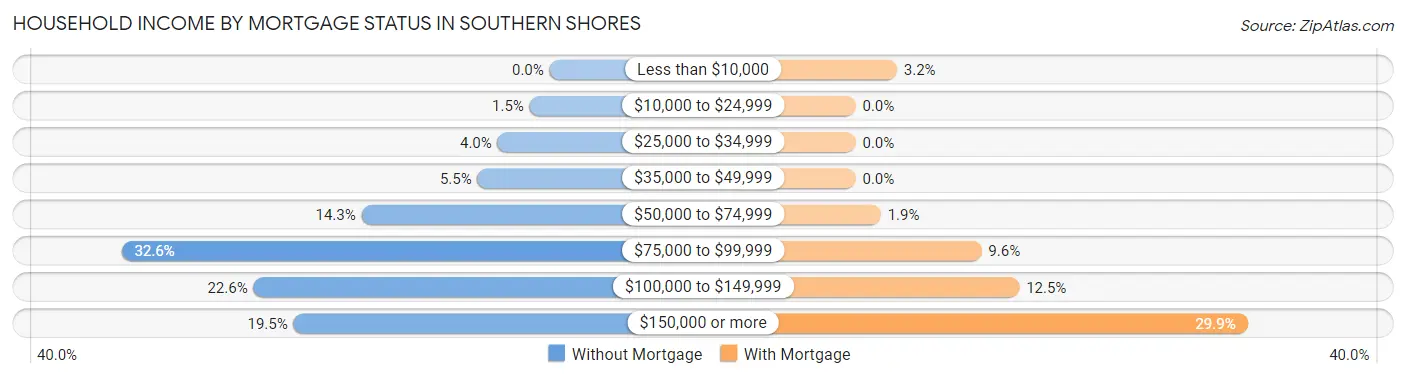
| Household Income | Without Mortgage | With Mortgage |
| Less than $10,000 | 0 (0.0%) | 23 (3.2%) |
| $10,000 to $24,999 | 5 (1.5%) | 0 (0.0%) |
| $25,000 to $34,999 | 13 (4.0%) | 0 (0.0%) |
| $35,000 to $49,999 | 18 (5.5%) | 0 (0.0%) |
| $50,000 to $74,999 | 47 (14.3%) | 14 (1.9%) |
| $75,000 to $99,999 | 107 (32.6%) | 70 (9.6%) |
| $100,000 to $149,999 | 74 (22.6%) | 91 (12.5%) |
| $150,000 or more | 64 (19.5%) | 218 (29.9%) |
| Total | 328 (100.0%) | 730 (100.0%) |
Property Value to Household Income Ratio in Southern Shores
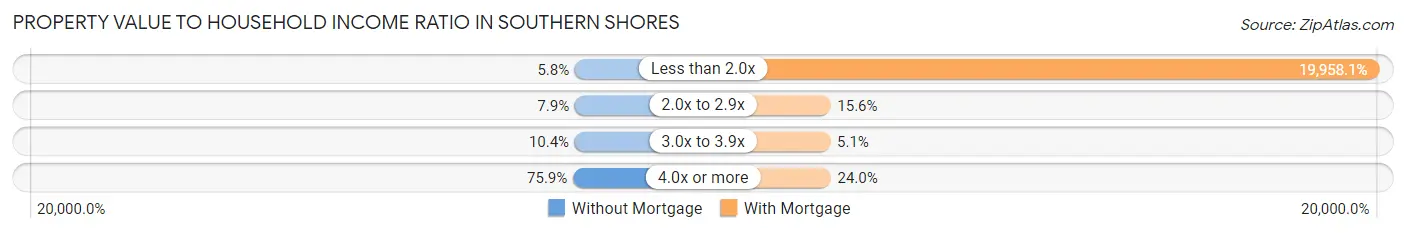
| Value-to-Income Ratio | Without Mortgage | With Mortgage |
| Less than 2.0x | 19 (5.8%) | 145,694 (19,958.1%) |
| 2.0x to 2.9x | 26 (7.9%) | 114 (15.6%) |
| 3.0x to 3.9x | 34 (10.4%) | 37 (5.1%) |
| 4.0x or more | 249 (75.9%) | 175 (24.0%) |
| Total | 328 (100.0%) | 730 (100.0%) |
Real Estate Taxes by Mortgage Status in Southern Shores
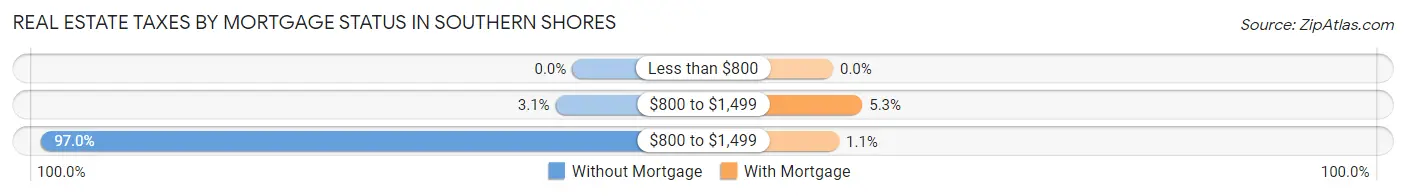
| Property Taxes | Without Mortgage | With Mortgage |
| Less than $800 | 0 (0.0%) | 0 (0.0%) |
| $800 to $1,499 | 10 (3.0%) | 39 (5.3%) |
| $800 to $1,499 | 318 (97.0%) | 8 (1.1%) |
| Total | 328 (100.0%) | 730 (100.0%) |
Health & Disability in Southern Shores
Health Insurance Coverage by Age in Southern Shores
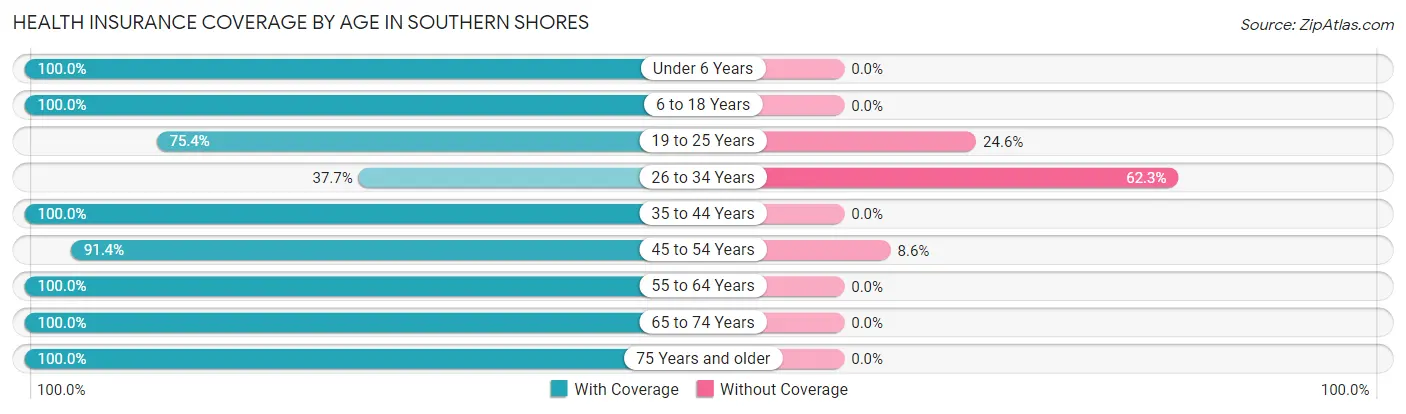
| Age Bracket | With Coverage | Without Coverage |
| Under 6 Years | 114 (100.0%) | 0 (0.0%) |
| 6 to 18 Years | 441 (100.0%) | 0 (0.0%) |
| 19 to 25 Years | 46 (75.4%) | 15 (24.6%) |
| 26 to 34 Years | 109 (37.7%) | 180 (62.3%) |
| 35 to 44 Years | 356 (100.0%) | 0 (0.0%) |
| 45 to 54 Years | 233 (91.4%) | 22 (8.6%) |
| 55 to 64 Years | 662 (100.0%) | 0 (0.0%) |
| 65 to 74 Years | 574 (100.0%) | 0 (0.0%) |
| 75 Years and older | 346 (100.0%) | 0 (0.0%) |
| Total | 2,881 (93.0%) | 217 (7.0%) |
Health Insurance Coverage by Citizenship Status in Southern Shores
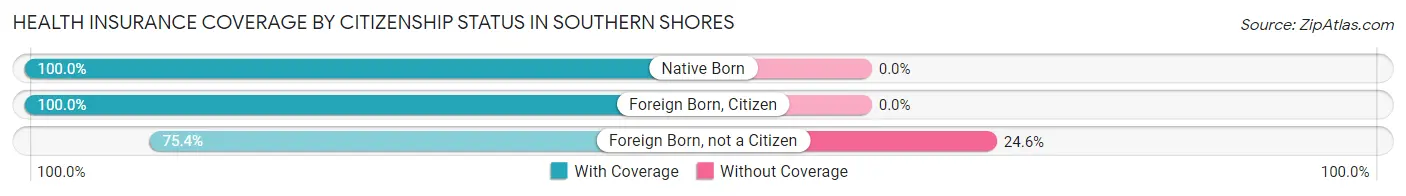
| Citizenship Status | With Coverage | Without Coverage |
| Native Born | 114 (100.0%) | 0 (0.0%) |
| Foreign Born, Citizen | 441 (100.0%) | 0 (0.0%) |
| Foreign Born, not a Citizen | 46 (75.4%) | 15 (24.6%) |
Health Insurance Coverage by Household Income in Southern Shores
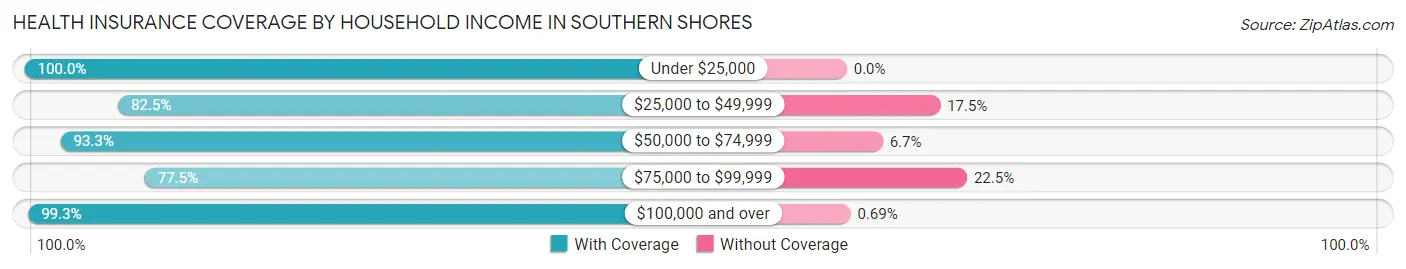
| Household Income | With Coverage | Without Coverage |
| Under $25,000 | 52 (100.0%) | 0 (0.0%) |
| $25,000 to $49,999 | 99 (82.5%) | 21 (17.5%) |
| $50,000 to $74,999 | 305 (93.3%) | 22 (6.7%) |
| $75,000 to $99,999 | 554 (77.5%) | 161 (22.5%) |
| $100,000 and over | 1,871 (99.3%) | 13 (0.7%) |
Public vs Private Health Insurance Coverage by Age in Southern Shores
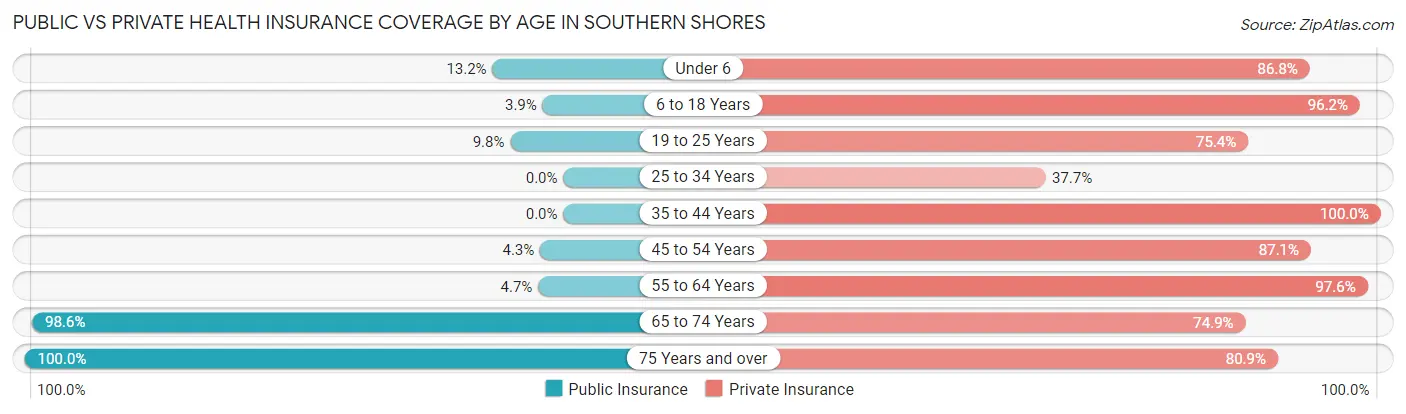
| Age Bracket | Public Insurance | Private Insurance |
| Under 6 | 15 (13.2%) | 99 (86.8%) |
| 6 to 18 Years | 17 (3.8%) | 424 (96.2%) |
| 19 to 25 Years | 6 (9.8%) | 46 (75.4%) |
| 25 to 34 Years | 0 (0.0%) | 109 (37.7%) |
| 35 to 44 Years | 0 (0.0%) | 356 (100.0%) |
| 45 to 54 Years | 11 (4.3%) | 222 (87.1%) |
| 55 to 64 Years | 31 (4.7%) | 646 (97.6%) |
| 65 to 74 Years | 566 (98.6%) | 430 (74.9%) |
| 75 Years and over | 346 (100.0%) | 280 (80.9%) |
| Total | 992 (32.0%) | 2,612 (84.3%) |
Disability Status by Sex by Age in Southern Shores
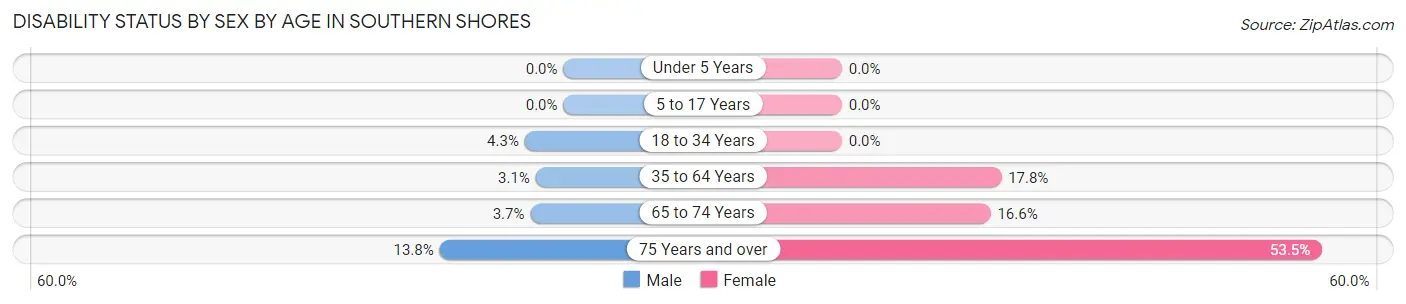
| Age Bracket | Male | Female |
| Under 5 Years | 0 (0.0%) | 0 (0.0%) |
| 5 to 17 Years | 0 (0.0%) | 0 (0.0%) |
| 18 to 34 Years | 12 (4.3%) | 0 (0.0%) |
| 35 to 64 Years | 17 (3.1%) | 128 (17.7%) |
| 65 to 74 Years | 10 (3.7%) | 50 (16.6%) |
| 75 Years and over | 24 (13.8%) | 92 (53.5%) |
Disability Class by Sex by Age in Southern Shores
Disability Class: Hearing Difficulty
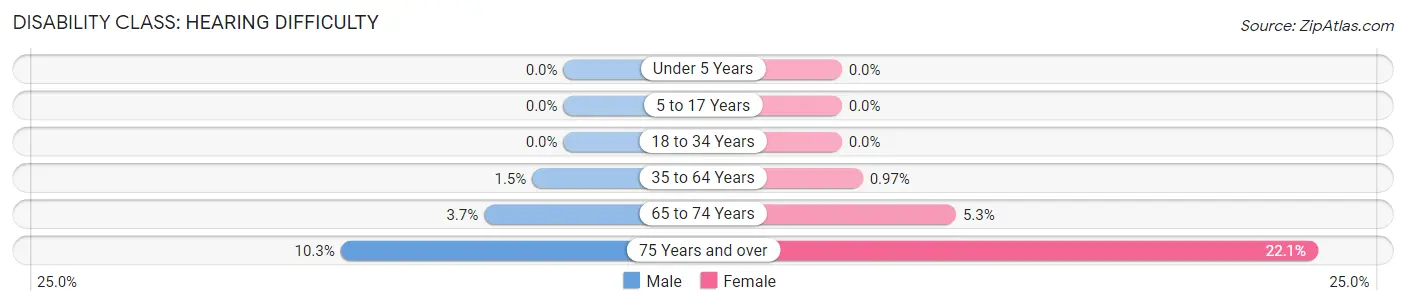
| Age Bracket | Male | Female |
| Under 5 Years | 0 (0.0%) | 0 (0.0%) |
| 5 to 17 Years | 0 (0.0%) | 0 (0.0%) |
| 18 to 34 Years | 0 (0.0%) | 0 (0.0%) |
| 35 to 64 Years | 8 (1.5%) | 7 (1.0%) |
| 65 to 74 Years | 10 (3.7%) | 16 (5.3%) |
| 75 Years and over | 18 (10.3%) | 38 (22.1%) |
Disability Class: Vision Difficulty
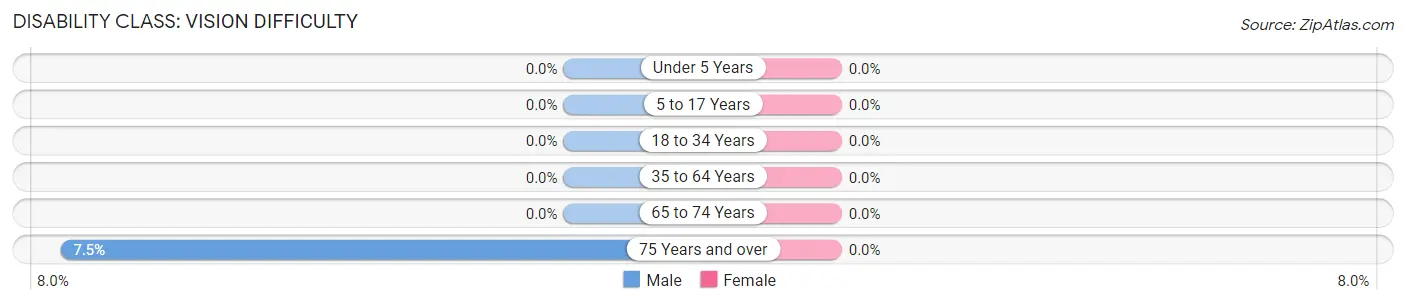
| Age Bracket | Male | Female |
| Under 5 Years | 0 (0.0%) | 0 (0.0%) |
| 5 to 17 Years | 0 (0.0%) | 0 (0.0%) |
| 18 to 34 Years | 0 (0.0%) | 0 (0.0%) |
| 35 to 64 Years | 0 (0.0%) | 0 (0.0%) |
| 65 to 74 Years | 0 (0.0%) | 0 (0.0%) |
| 75 Years and over | 13 (7.5%) | 0 (0.0%) |
Disability Class: Cognitive Difficulty
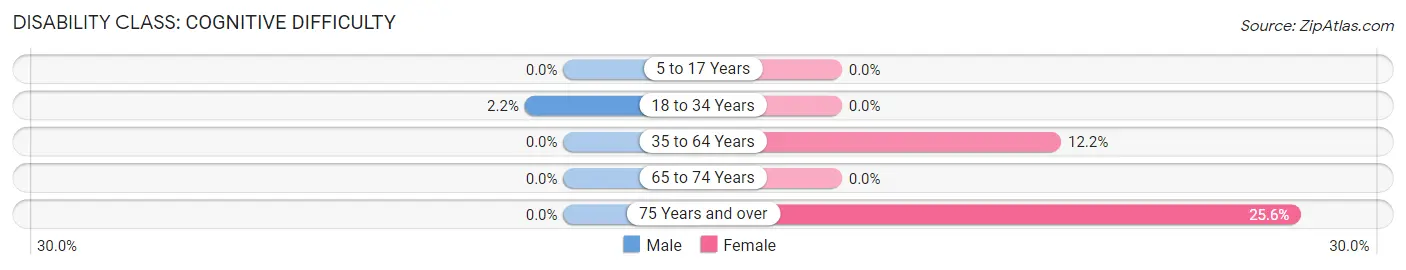
| Age Bracket | Male | Female |
| 5 to 17 Years | 0 (0.0%) | 0 (0.0%) |
| 18 to 34 Years | 6 (2.1%) | 0 (0.0%) |
| 35 to 64 Years | 0 (0.0%) | 88 (12.2%) |
| 65 to 74 Years | 0 (0.0%) | 0 (0.0%) |
| 75 Years and over | 0 (0.0%) | 44 (25.6%) |
Disability Class: Ambulatory Difficulty
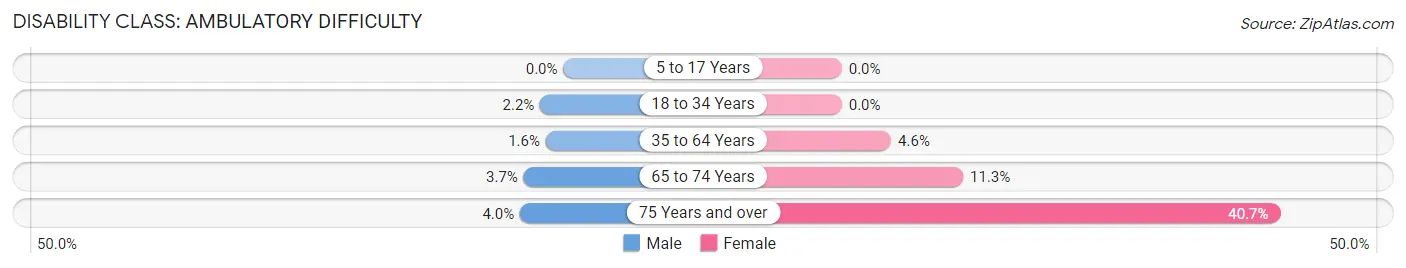
| Age Bracket | Male | Female |
| 5 to 17 Years | 0 (0.0%) | 0 (0.0%) |
| 18 to 34 Years | 6 (2.1%) | 0 (0.0%) |
| 35 to 64 Years | 9 (1.6%) | 33 (4.6%) |
| 65 to 74 Years | 10 (3.7%) | 34 (11.3%) |
| 75 Years and over | 7 (4.0%) | 70 (40.7%) |
Disability Class: Self-Care Difficulty
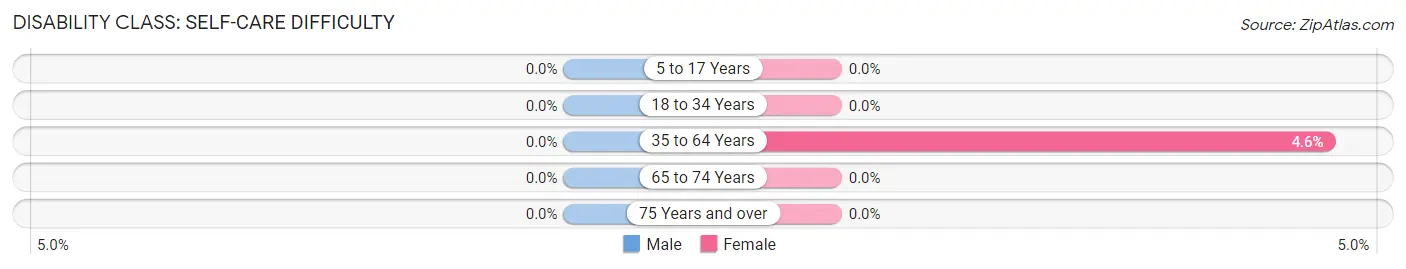
| Age Bracket | Male | Female |
| 5 to 17 Years | 0 (0.0%) | 0 (0.0%) |
| 18 to 34 Years | 0 (0.0%) | 0 (0.0%) |
| 35 to 64 Years | 0 (0.0%) | 33 (4.6%) |
| 65 to 74 Years | 0 (0.0%) | 0 (0.0%) |
| 75 Years and over | 0 (0.0%) | 0 (0.0%) |
Technology Access in Southern Shores
Computing Device Access in Southern Shores
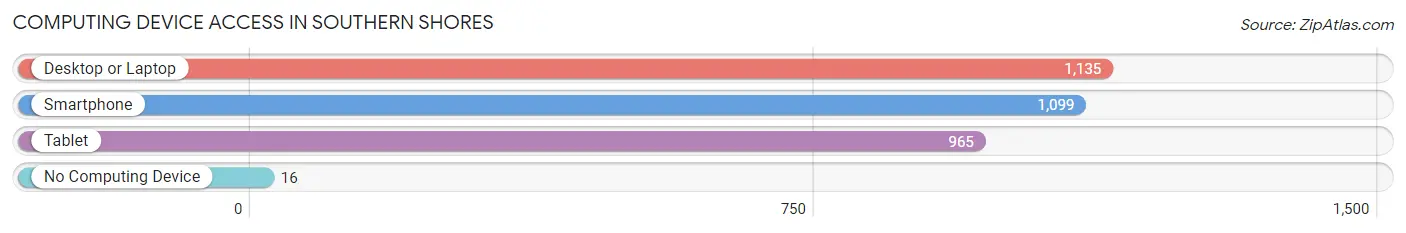
| Device Type | # Households | % Households |
| Desktop or Laptop | 1,135 | 94.4% |
| Smartphone | 1,099 | 91.4% |
| Tablet | 965 | 80.3% |
| No Computing Device | 16 | 1.3% |
| Total | 1,202 | 100.0% |
Internet Access in Southern Shores
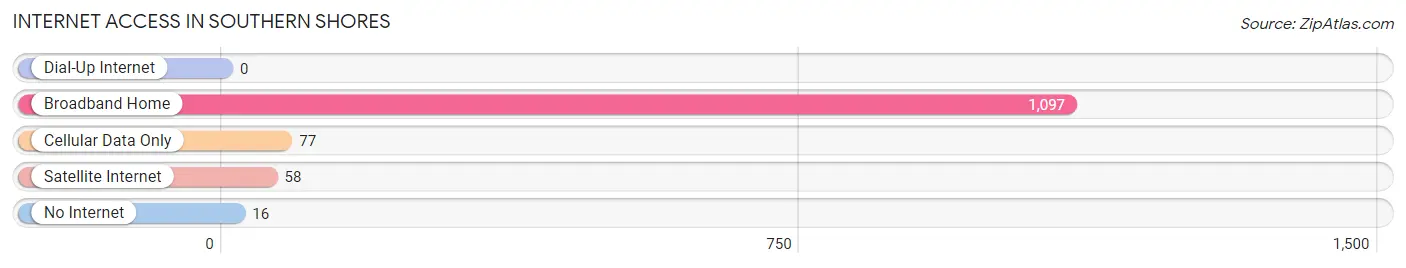
| Internet Type | # Households | % Households |
| Dial-Up Internet | 0 | 0.0% |
| Broadband Home | 1,097 | 91.3% |
| Cellular Data Only | 77 | 6.4% |
| Satellite Internet | 58 | 4.8% |
| No Internet | 16 | 1.3% |
| Total | 1,202 | 100.0% |
Southern Shores Summary
Southern Shores is a town located in Dare County, North Carolina. It is situated on the Outer Banks, a chain of barrier islands along the Atlantic Coast. The town was incorporated in 1981 and is home to approximately 2,500 people.
Geography
Southern Shores is located on the Outer Banks of North Carolina, a chain of barrier islands along the Atlantic Coast. The town is bordered by the Atlantic Ocean to the east, the Currituck Sound to the west, and the town of Kitty Hawk to the south. The town is approximately 8.5 square miles in size and is divided into four distinct neighborhoods: Hillcrest, Ocean Boulevard, Ocean View, and South Dogwood.
The town is known for its beautiful beaches, which are popular for swimming, surfing, and fishing. The beaches are also home to a variety of wildlife, including sea turtles, dolphins, and seabirds. The town is also home to a variety of parks and nature preserves, including the Kitty Hawk Woods Coastal Reserve and the Nags Head Woods Nature Preserve.
History
The area that is now Southern Shores was first settled by Native Americans, who lived in the area for thousands of years before the arrival of Europeans. The first Europeans to settle in the area were English colonists, who arrived in the late 1600s. The area was part of the original Dare County, which was established in 1705.
In the early 1900s, the area began to develop as a resort destination. The town of Southern Shores was officially incorporated in 1981. Since then, the town has grown steadily, becoming a popular destination for vacationers and retirees.
Economy
The economy of Southern Shores is largely driven by tourism. The town is home to a variety of hotels, restaurants, and other businesses that cater to visitors. The town is also home to a number of marinas, which provide services to boaters and fishermen.
In addition to tourism, the town is home to a number of businesses that provide goods and services to the local community. These include grocery stores, banks, and other retail establishments.
Demographics
As of the 2010 census, the population of Southern Shores was 2,521. The racial makeup of the town was 94.3% White, 2.2% African American, 0.7% Native American, 0.7% Asian, 0.2% Pacific Islander, and 1.9% from other races. The median household income was $62,917, and the median age was 53.
Conclusion
Southern Shores is a beautiful town located on the Outer Banks of North Carolina. The town is known for its beautiful beaches and is a popular destination for vacationers and retirees. The economy of the town is largely driven by tourism, and the town is home to a variety of businesses that provide goods and services to the local community. The population of the town is predominantly white, with a median age of 53 and a median household income of $62,917.
Common Questions
What is the Total Population of Southern Shores?
Total Population of Southern Shores is 3,098.
What is the Total Male Population of Southern Shores?
Total Male Population of Southern Shores is 1,576.
What is the Total Female Population of Southern Shores?
Total Female Population of Southern Shores is 1,522.
What is the Ratio of Males per 100 Females in Southern Shores?
There are 103.55 Males per 100 Females in Southern Shores.
What is the Ratio of Females per 100 Males in Southern Shores?
There are 96.57 Females per 100 Males in Southern Shores.
What is the Median Population Age in Southern Shores?
Median Population Age in Southern Shores is 57.3 Years.
What is the Average Family Size in Southern Shores
Average Family Size in Southern Shores is 2.8 People.
What is the Average Household Size in Southern Shores
Average Household Size in Southern Shores is 2.6 People.
What is Per Capita Income in Southern Shores?
Per Capita income in Southern Shores is $65,765.
What is the Median Family Income in Southern Shores?
Median Family Income in Southern Shores is $140,504.
What is the Median Household income in Southern Shores?
Median Household Income in Southern Shores is $112,371.
What is Income or Wage Gap in Southern Shores?
Income or Wage Gap in Southern Shores is 27.4%.
Women in Southern Shores earn 72.6 cents for every dollar earned by a man.
What is Inequality or Gini Index in Southern Shores?
Inequality or Gini Index in Southern Shores is 0.42.
How Large is the Labor Force in Southern Shores?
There are 1,457 People in the Labor Forcein in Southern Shores.
What is the Percentage of People in the Labor Force in Southern Shores?
54.7% of People are in the Labor Force in Southern Shores.
What is the Unemployment Rate in Southern Shores?
Unemployment Rate in Southern Shores is 14.4%.