Rochester, IN
Rochester Map
Rochester Overview
6,236
TOTAL POPULATION
3,148
MALE POPULATION
3,088
FEMALE POPULATION
101.94
MALES / 100 FEMALES
98.09
FEMALES / 100 MALES
45.1
MEDIAN AGE
3.1
AVG FAMILY SIZE
2.4
AVG HOUSEHOLD SIZE
$33,346
PER CAPITA INCOME
$79,234
AVG FAMILY INCOME
$62,885
AVG HOUSEHOLD INCOME
14.9%
WAGE / INCOME GAP [ % ]
85.1¢/ $1
WAGE / INCOME GAP [ $ ]
0.41
INEQUALITY / GINI INDEX
2,928
LABOR FORCE [ PEOPLE ]
58.3%
PERCENT IN LABOR FORCE
6.5%
UNEMPLOYMENT RATE
Rochester Zip Codes
Rochester Area Codes
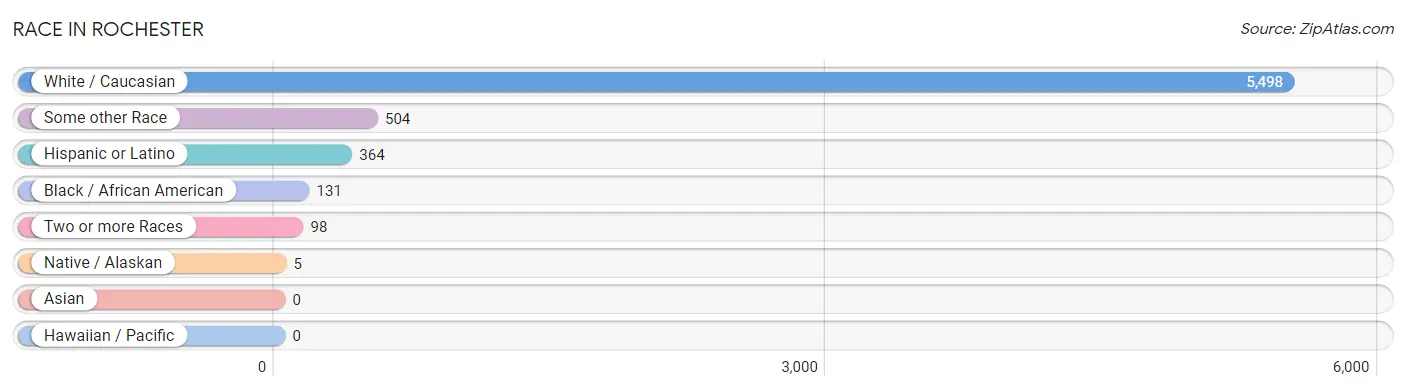
Race in Rochester
The most populous races in Rochester are White / Caucasian (5,498 | 88.2%), Some other Race (504 | 8.1%), and Hispanic or Latino (364 | 5.8%).
| Race | # Population | % Population |
| Asian | 0 | 0.0% |
| Black / African American | 131 | 2.1% |
| Hawaiian / Pacific | 0 | 0.0% |
| Hispanic or Latino | 364 | 5.8% |
| Native / Alaskan | 5 | 0.1% |
| White / Caucasian | 5,498 | 88.2% |
| Two or more Races | 98 | 1.6% |
| Some other Race | 504 | 8.1% |
| Total | 6,236 | 100.0% |
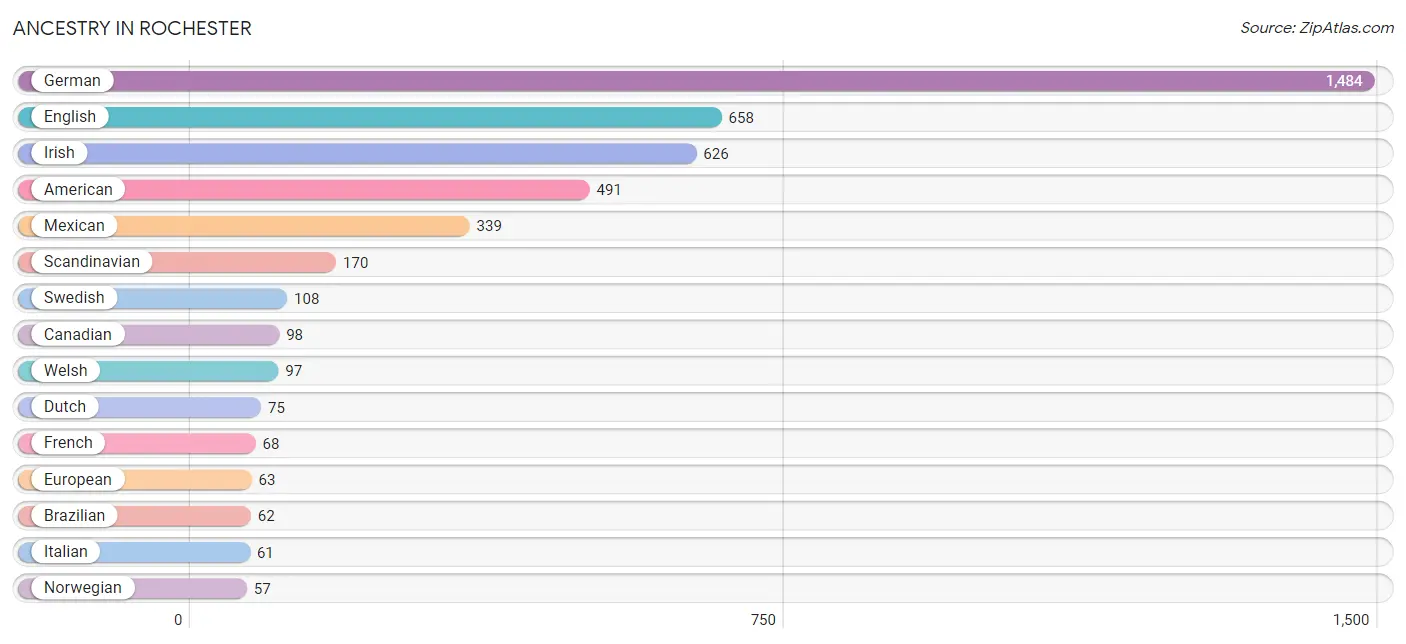
Ancestry in Rochester
The most populous ancestries reported in Rochester are German (1,484 | 23.8%), English (658 | 10.5%), Irish (626 | 10.0%), American (491 | 7.9%), and Mexican (339 | 5.4%), together accounting for 57.7% of all Rochester residents.
| Ancestry | # Population | % Population |
| American | 491 | 7.9% |
| Arab | 27 | 0.4% |
| Brazilian | 62 | 1.0% |
| British | 5 | 0.1% |
| Canadian | 98 | 1.6% |
| Cherokee | 16 | 0.3% |
| Czech | 34 | 0.5% |
| Dutch | 75 | 1.2% |
| English | 658 | 10.5% |
| European | 63 | 1.0% |
| French | 68 | 1.1% |
| German | 1,484 | 23.8% |
| Irish | 626 | 10.0% |
| Italian | 61 | 1.0% |
| Mexican | 339 | 5.4% |
| Norwegian | 57 | 0.9% |
| Palestinian | 27 | 0.4% |
| Polish | 33 | 0.5% |
| Portuguese | 51 | 0.8% |
| Puerto Rican | 3 | 0.1% |
| Romanian | 3 | 0.1% |
| Scandinavian | 170 | 2.7% |
| Scotch-Irish | 47 | 0.7% |
| Scottish | 53 | 0.9% |
| Swedish | 108 | 1.7% |
| Welsh | 97 | 1.6% | View All 26 Rows |
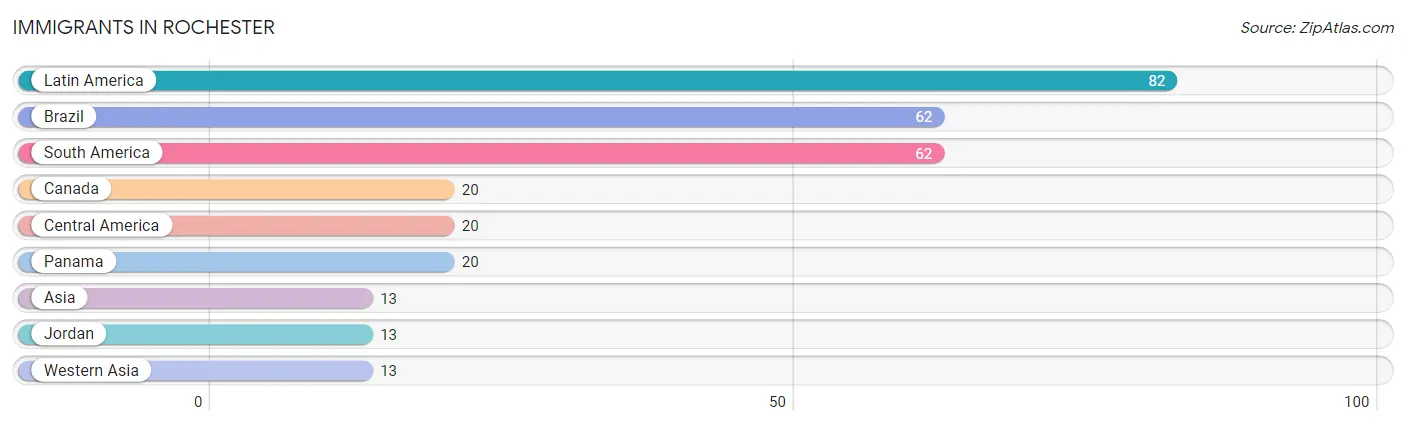
Immigrants in Rochester
The most numerous immigrant groups reported in Rochester came from Latin America (82 | 1.3%), Brazil (62 | 1.0%), South America (62 | 1.0%), Canada (20 | 0.3%), and Central America (20 | 0.3%), together accounting for 3.9% of all Rochester residents.
| Immigration Origin | # Population | % Population |
| Asia | 13 | 0.2% |
| Brazil | 62 | 1.0% |
| Canada | 20 | 0.3% |
| Central America | 20 | 0.3% |
| Jordan | 13 | 0.2% |
| Latin America | 82 | 1.3% |
| Panama | 20 | 0.3% |
| South America | 62 | 1.0% |
| Western Asia | 13 | 0.2% | View All 9 Rows |
Sex and Age in Rochester
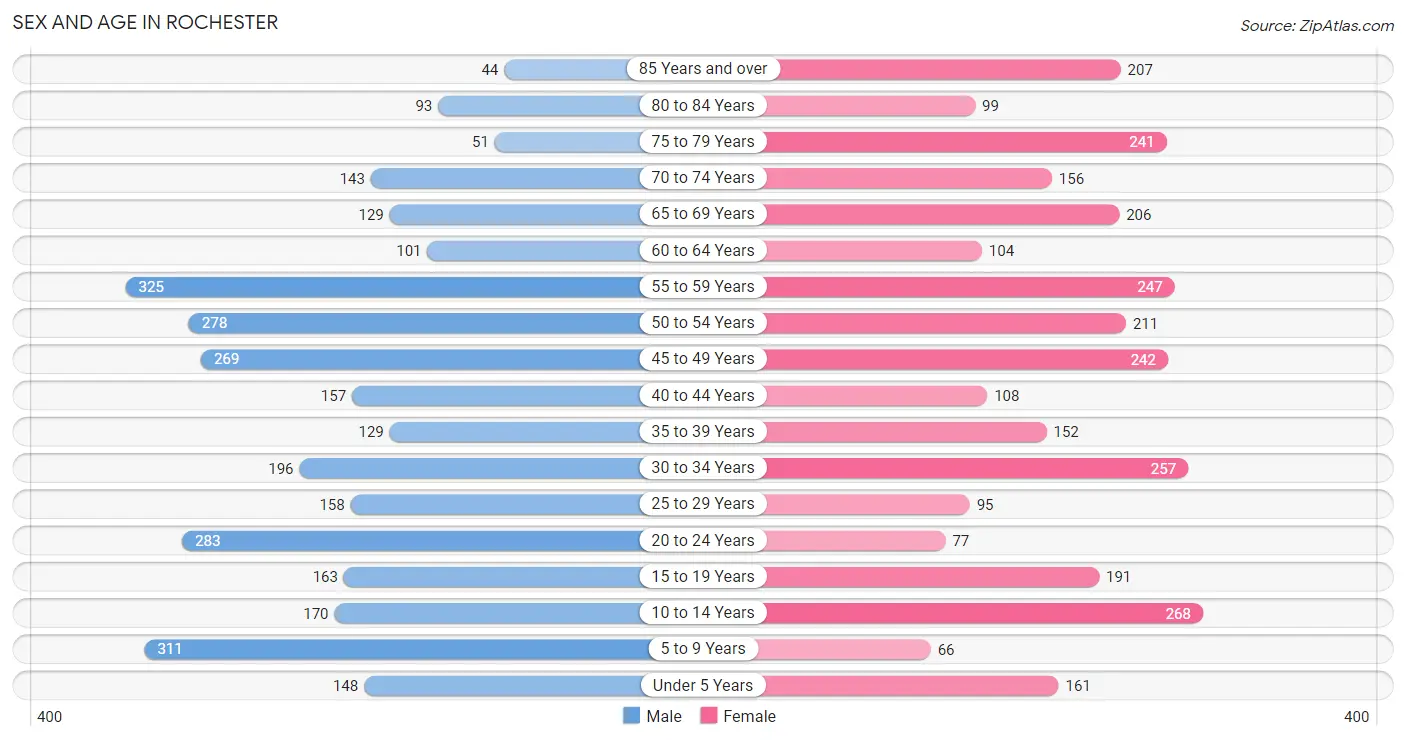
Sex and Age in Rochester
The most populous age groups in Rochester are 55 to 59 Years (325 | 10.3%) for men and 10 to 14 Years (268 | 8.7%) for women.
| Age Bracket | Male | Female |
| Under 5 Years | 148 (4.7%) | 161 (5.2%) |
| 5 to 9 Years | 311 (9.9%) | 66 (2.1%) |
| 10 to 14 Years | 170 (5.4%) | 268 (8.7%) |
| 15 to 19 Years | 163 (5.2%) | 191 (6.2%) |
| 20 to 24 Years | 283 (9.0%) | 77 (2.5%) |
| 25 to 29 Years | 158 (5.0%) | 95 (3.1%) |
| 30 to 34 Years | 196 (6.2%) | 257 (8.3%) |
| 35 to 39 Years | 129 (4.1%) | 152 (4.9%) |
| 40 to 44 Years | 157 (5.0%) | 108 (3.5%) |
| 45 to 49 Years | 269 (8.6%) | 242 (7.8%) |
| 50 to 54 Years | 278 (8.8%) | 211 (6.8%) |
| 55 to 59 Years | 325 (10.3%) | 247 (8.0%) |
| 60 to 64 Years | 101 (3.2%) | 104 (3.4%) |
| 65 to 69 Years | 129 (4.1%) | 206 (6.7%) |
| 70 to 74 Years | 143 (4.5%) | 156 (5.1%) |
| 75 to 79 Years | 51 (1.6%) | 241 (7.8%) |
| 80 to 84 Years | 93 (2.9%) | 99 (3.2%) |
| 85 Years and over | 44 (1.4%) | 207 (6.7%) |
| Total | 3,148 (100.0%) | 3,088 (100.0%) |
Families and Households in Rochester
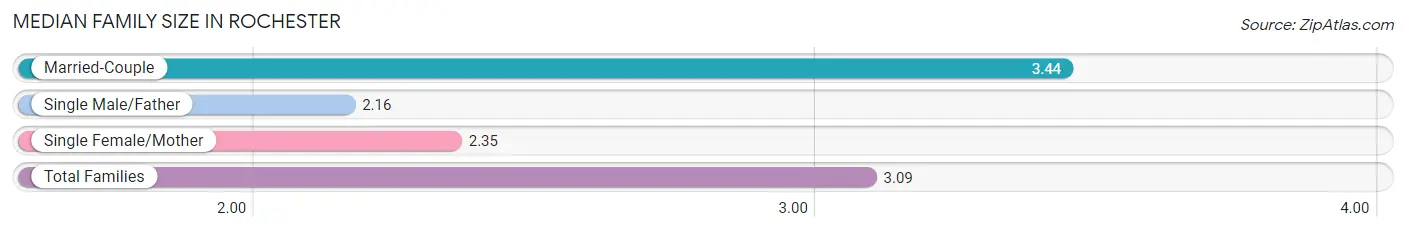
Median Family Size in Rochester
The median family size in Rochester is 3.09 persons per family, with married-couple families (1,125 | 69.5%) accounting for the largest median family size of 3.44 persons per family. On the other hand, single male/father families (188 | 11.6%) represent the smallest median family size with 2.16 persons per family.
| Family Type | # Families | Family Size |
| Married-Couple | 1,125 (69.5%) | 3.44 |
| Single Male/Father | 188 (11.6%) | 2.16 |
| Single Female/Mother | 306 (18.9%) | 2.35 |
| Total Families | 1,619 (100.0%) | 3.09 |
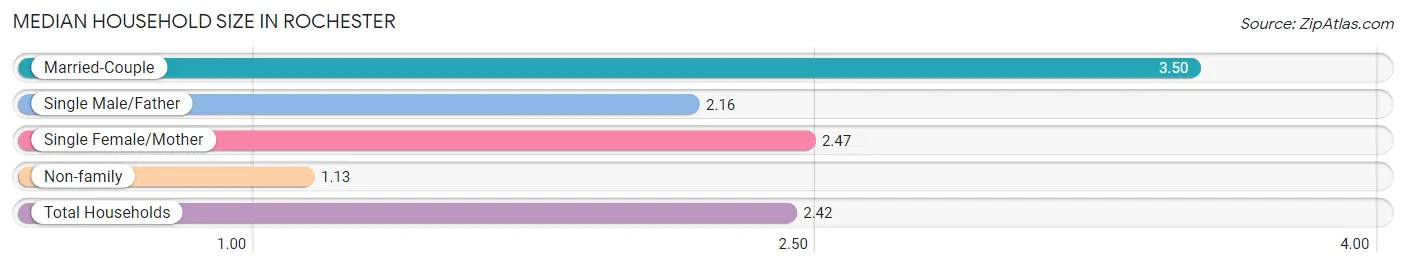
Median Household Size in Rochester
The median household size in Rochester is 2.42 persons per household, with married-couple households (1,125 | 44.4%) accounting for the largest median household size of 3.5 persons per household. non-family households (915 | 36.1%) represent the smallest median household size with 1.13 persons per household.
| Household Type | # Households | Household Size |
| Married-Couple | 1,125 (44.4%) | 3.50 |
| Single Male/Father | 188 (7.4%) | 2.16 |
| Single Female/Mother | 306 (12.1%) | 2.47 |
| Non-family | 915 (36.1%) | 1.13 |
| Total Households | 2,534 (100.0%) | 2.42 |
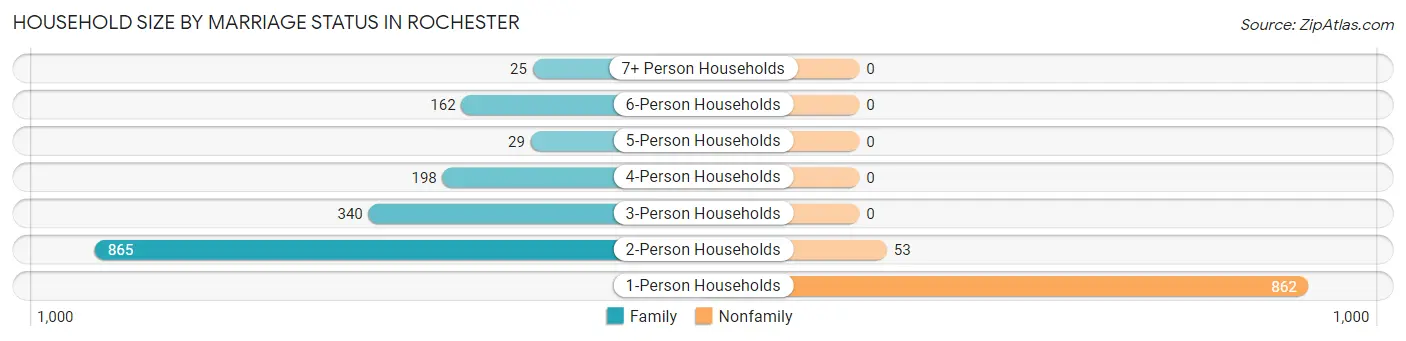
Household Size by Marriage Status in Rochester
Out of a total of 2,534 households in Rochester, 1,619 (63.9%) are family households, while 915 (36.1%) are nonfamily households. The most numerous type of family households are 2-person households, comprising 865, and the most common type of nonfamily households are 1-person households, comprising 862.
| Household Size | Family Households | Nonfamily Households |
| 1-Person Households | - | 862 (34.0%) |
| 2-Person Households | 865 (34.1%) | 53 (2.1%) |
| 3-Person Households | 340 (13.4%) | 0 (0.0%) |
| 4-Person Households | 198 (7.8%) | 0 (0.0%) |
| 5-Person Households | 29 (1.1%) | 0 (0.0%) |
| 6-Person Households | 162 (6.4%) | 0 (0.0%) |
| 7+ Person Households | 25 (1.0%) | 0 (0.0%) |
| Total | 1,619 (63.9%) | 915 (36.1%) |
Female Fertility in Rochester
Fertility by Age in Rochester
| Age Bracket | Women with Births | Births / 1,000 Women |
| 15 to 19 years | 0 (0.0%) | 0.0 |
| 20 to 34 years | 0 (0.0%) | 0.0 |
| 35 to 50 years | 0 (0.0%) | 0.0 |
| Total | 0 (0.0%) | 0.0 |
Fertility by Age by Marriage Status in Rochester
| Age Bracket | Married | Unmarried |
| 15 to 19 years | 0 (0.0%) | 0 (0.0%) |
| 20 to 34 years | 0 (0.0%) | 0 (0.0%) |
| 35 to 50 years | 0 (0.0%) | 0 (0.0%) |
| Total | 0 (0.0%) | 0 (0.0%) |
Fertility by Education in Rochester
| Educational Attainment | Women with Births | Births / 1,000 Women |
| Less than High School | 0 (0.0%) | 0.0 |
| High School Diploma | 0 (0.0%) | 0.0 |
| College or Associate's Degree | 0 (0.0%) | 0.0 |
| Bachelor's Degree | 0 (0.0%) | 0.0 |
| Graduate Degree | 0 (0.0%) | 0.0 |
| Total | 0 (0.0%) | 0.0 |
Fertility by Education by Marriage Status in Rochester
| Educational Attainment | Married | Unmarried |
| Less than High School | 0 (0.0%) | 0 (0.0%) |
| High School Diploma | 0 (0.0%) | 0 (0.0%) |
| College or Associate's Degree | 0 (0.0%) | 0 (0.0%) |
| Bachelor's Degree | 0 (0.0%) | 0 (0.0%) |
| Graduate Degree | 0 (0.0%) | 0 (0.0%) |
| Total | 0 (0.0%) | 0 (0.0%) |
Income in Rochester
Income Overview in Rochester
Per Capita Income in Rochester is $33,346, while median incomes of families and households are $79,234 and $62,885 respectively.
| Characteristic | Number | Measure |
| Per Capita Income | 6,236 | $33,346 |
| Median Family Income | 1,619 | $79,234 |
| Mean Family Income | 1,619 | $90,562 |
| Median Household Income | 2,534 | $62,885 |
| Mean Household Income | 2,534 | $72,864 |
| Income Deficit | 1,619 | $0 |
| Wage / Income Gap (%) | 6,236 | 14.89% |
| Wage / Income Gap ($) | 6,236 | 85.11¢ per $1 |
| Gini / Inequality Index | 6,236 | 0.41 |
Earnings by Sex in Rochester
Average Earnings in Rochester are $38,640, $41,024 for men and $34,917 for women, a difference of 14.9%.
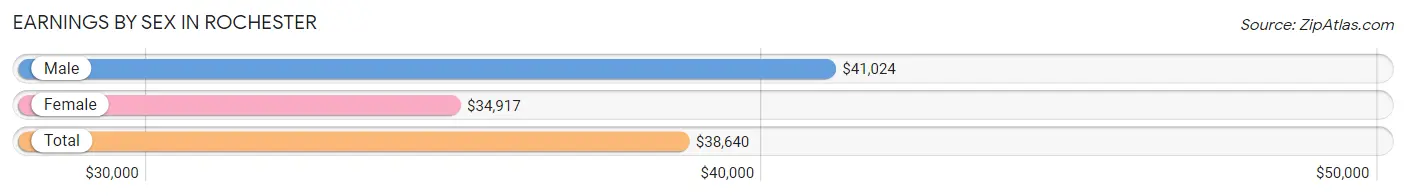
| Sex | Number | Average Earnings |
| Male | 1,693 (54.1%) | $41,024 |
| Female | 1,435 (45.9%) | $34,917 |
| Total | 3,128 (100.0%) | $38,640 |
Earnings by Sex by Income Bracket in Rochester
The most common earnings brackets in Rochester are $30,000 to $34,999 for men (247 | 14.6%) and $30,000 to $34,999 for women (193 | 13.5%).
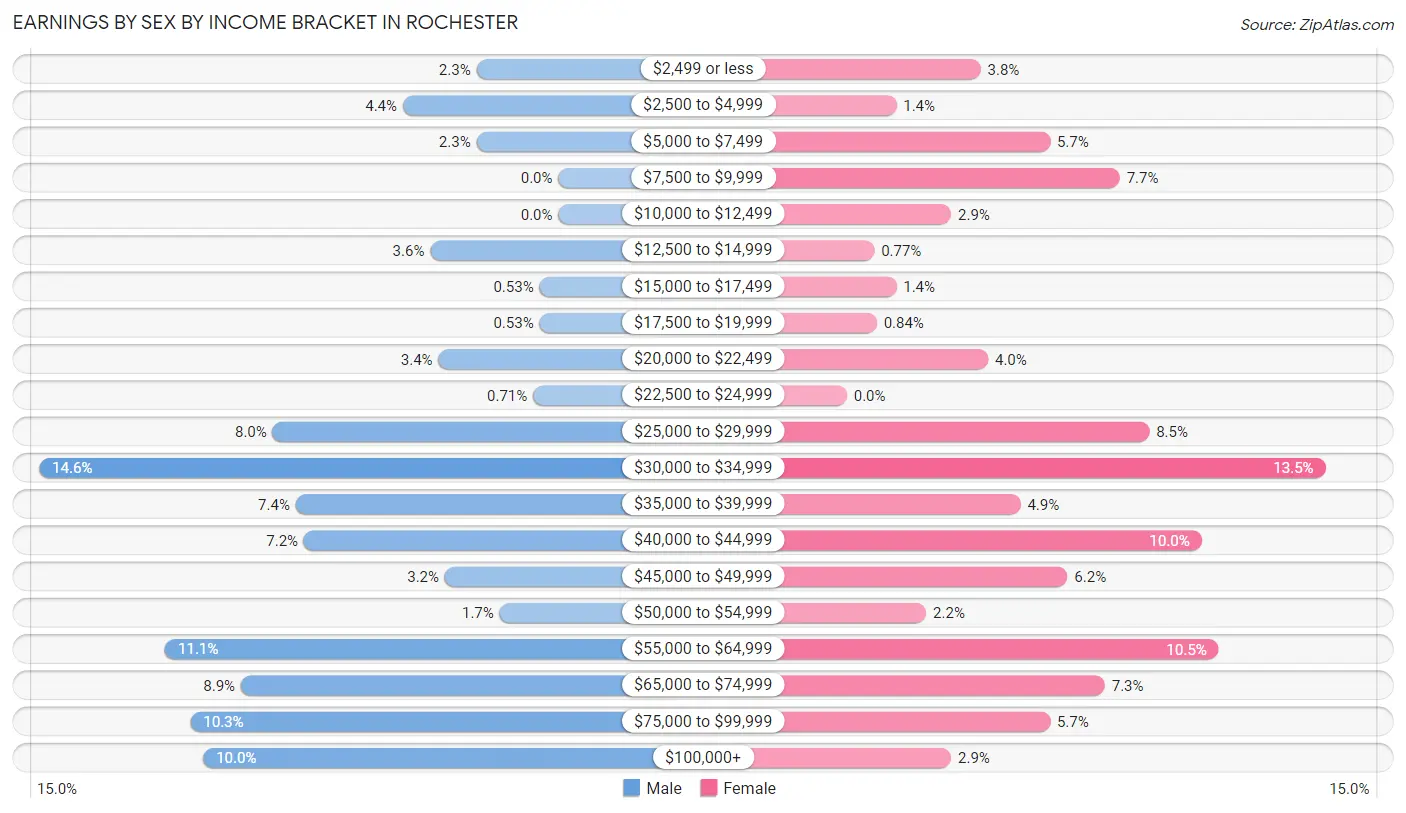
| Income | Male | Female |
| $2,499 or less | 39 (2.3%) | 54 (3.8%) |
| $2,500 to $4,999 | 74 (4.4%) | 20 (1.4%) |
| $5,000 to $7,499 | 39 (2.3%) | 82 (5.7%) |
| $7,500 to $9,999 | 0 (0.0%) | 110 (7.7%) |
| $10,000 to $12,499 | 0 (0.0%) | 42 (2.9%) |
| $12,500 to $14,999 | 61 (3.6%) | 11 (0.8%) |
| $15,000 to $17,499 | 9 (0.5%) | 20 (1.4%) |
| $17,500 to $19,999 | 9 (0.5%) | 12 (0.8%) |
| $20,000 to $22,499 | 57 (3.4%) | 57 (4.0%) |
| $22,500 to $24,999 | 12 (0.7%) | 0 (0.0%) |
| $25,000 to $29,999 | 136 (8.0%) | 122 (8.5%) |
| $30,000 to $34,999 | 247 (14.6%) | 193 (13.5%) |
| $35,000 to $39,999 | 125 (7.4%) | 70 (4.9%) |
| $40,000 to $44,999 | 121 (7.1%) | 143 (10.0%) |
| $45,000 to $49,999 | 54 (3.2%) | 89 (6.2%) |
| $50,000 to $54,999 | 28 (1.7%) | 32 (2.2%) |
| $55,000 to $64,999 | 187 (11.1%) | 150 (10.4%) |
| $65,000 to $74,999 | 151 (8.9%) | 104 (7.2%) |
| $75,000 to $99,999 | 175 (10.3%) | 82 (5.7%) |
| $100,000+ | 169 (10.0%) | 42 (2.9%) |
| Total | 1,693 (100.0%) | 1,435 (100.0%) |
Earnings by Sex by Educational Attainment in Rochester
Average earnings in Rochester are $45,142 for men and $39,043 for women, a difference of 13.5%. Men with an educational attainment of college or associate's degree enjoy the highest average annual earnings of $58,792, while those with less than high school education earn the least with $30,441. Women with an educational attainment of graduate degree earn the most with the average annual earnings of $66,134, while those with high school diploma education have the smallest earnings of $28,064.
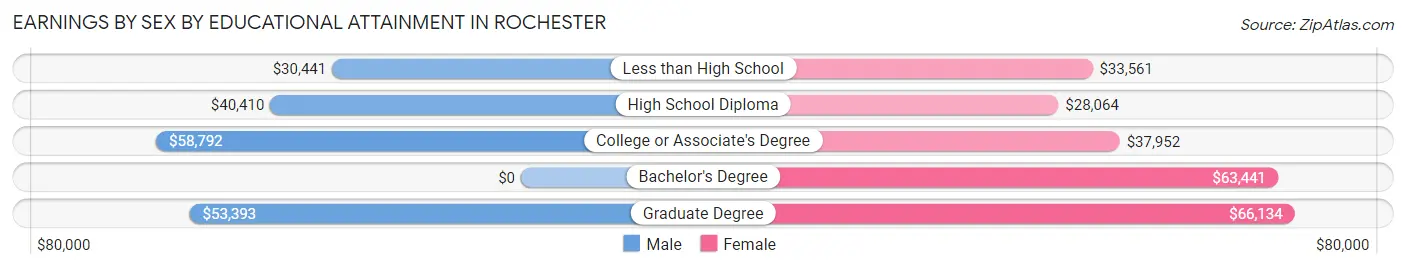
| Educational Attainment | Male Income | Female Income |
| Less than High School | $30,441 | $33,561 |
| High School Diploma | $40,410 | $28,064 |
| College or Associate's Degree | $58,792 | $37,952 |
| Bachelor's Degree | - | - |
| Graduate Degree | $53,393 | $66,134 |
| Total | $45,142 | $39,043 |
Family Income in Rochester
Family Income Brackets in Rochester
According to the Rochester family income data, there are 342 families falling into the $100,000 to $149,999 income range, which is the most common income bracket and makes up 21.1% of all families. Conversely, the $10,000 to $14,999 income bracket is the least frequent group with only 6 families (0.4%) belonging to this category.
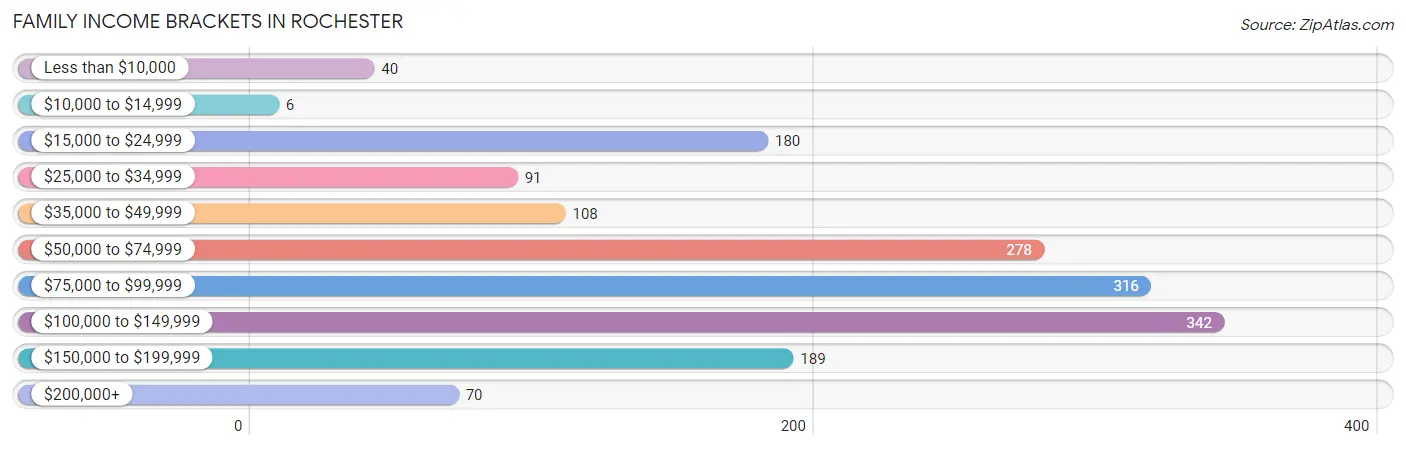
| Income Bracket | # Families | % Families |
| Less than $10,000 | 40 | 2.5% |
| $10,000 to $14,999 | 6 | 0.4% |
| $15,000 to $24,999 | 180 | 11.1% |
| $25,000 to $34,999 | 91 | 5.6% |
| $35,000 to $49,999 | 108 | 6.7% |
| $50,000 to $74,999 | 278 | 17.2% |
| $75,000 to $99,999 | 316 | 19.5% |
| $100,000 to $149,999 | 342 | 21.1% |
| $150,000 to $199,999 | 189 | 11.7% |
| $200,000+ | 70 | 4.3% |
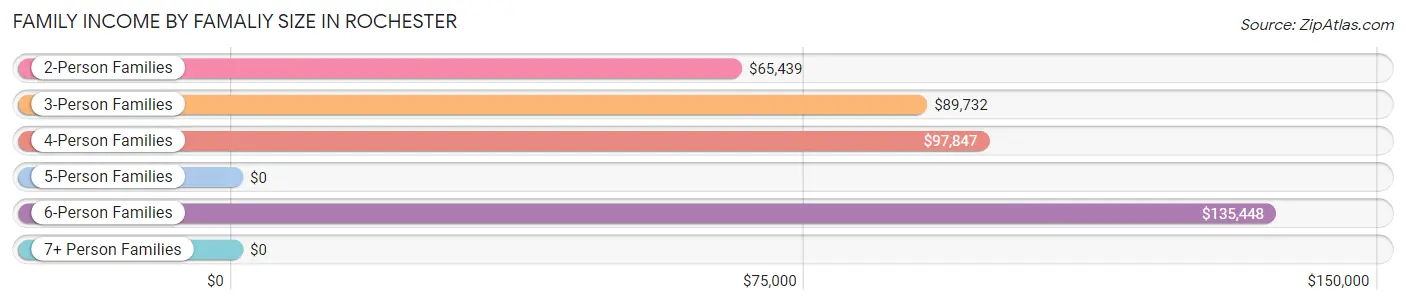
Family Income by Famaliy Size in Rochester
6-person families (133 | 8.2%) account for the highest median family income in Rochester with $135,448 per family, while 2-person families (909 | 56.1%) have the highest median income of $32,720 per family member.
| Income Bracket | # Families | Median Income |
| 2-Person Families | 909 (56.1%) | $65,439 |
| 3-Person Families | 296 (18.3%) | $89,732 |
| 4-Person Families | 198 (12.2%) | $97,847 |
| 5-Person Families | 58 (3.6%) | $0 |
| 6-Person Families | 133 (8.2%) | $135,448 |
| 7+ Person Families | 25 (1.5%) | $0 |
| Total | 1,619 (100.0%) | $79,234 |
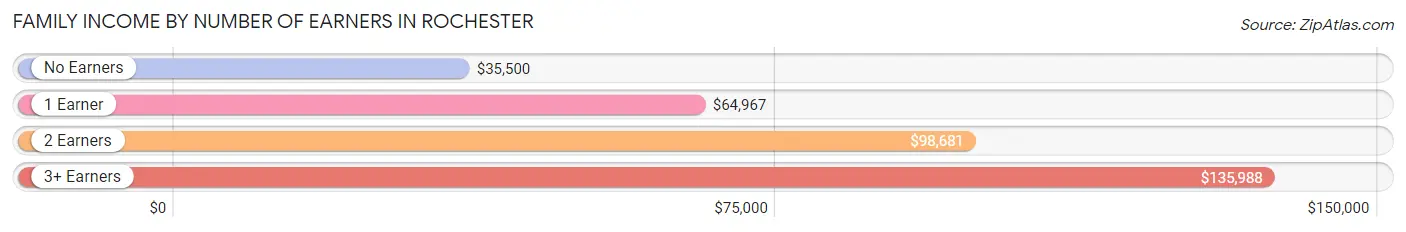
Family Income by Number of Earners in Rochester
The median family income in Rochester is $79,234, with families comprising 3+ earners (166) having the highest median family income of $135,988, while families with no earners (366) have the lowest median family income of $35,500, accounting for 10.2% and 22.6% of families, respectively.
| Number of Earners | # Families | Median Income |
| No Earners | 366 (22.6%) | $35,500 |
| 1 Earner | 341 (21.1%) | $64,967 |
| 2 Earners | 746 (46.1%) | $98,681 |
| 3+ Earners | 166 (10.2%) | $135,988 |
| Total | 1,619 (100.0%) | $79,234 |
Household Income in Rochester
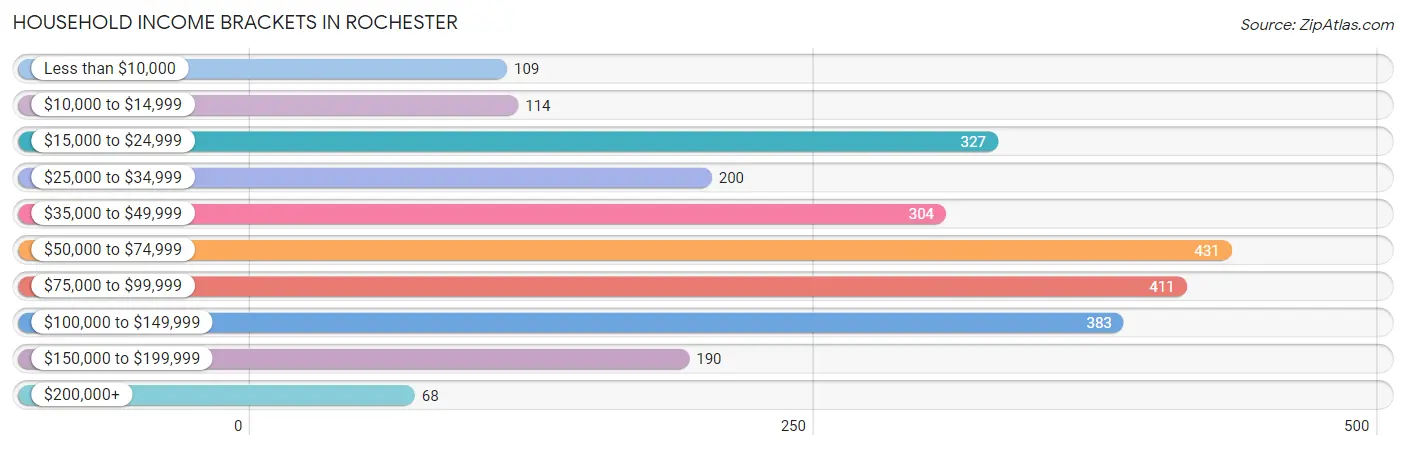
Household Income Brackets in Rochester
With 431 households falling in the category, the $50,000 to $74,999 income range is the most frequent in Rochester, accounting for 17.0% of all households. In contrast, only 68 households (2.7%) fall into the $200,000+ income bracket, making it the least populous group.
| Income Bracket | # Households | % Households |
| Less than $10,000 | 109 | 4.3% |
| $10,000 to $14,999 | 114 | 4.5% |
| $15,000 to $24,999 | 327 | 12.9% |
| $25,000 to $34,999 | 200 | 7.9% |
| $35,000 to $49,999 | 304 | 12.0% |
| $50,000 to $74,999 | 431 | 17.0% |
| $75,000 to $99,999 | 411 | 16.2% |
| $100,000 to $149,999 | 383 | 15.1% |
| $150,000 to $199,999 | 190 | 7.5% |
| $200,000+ | 68 | 2.7% |
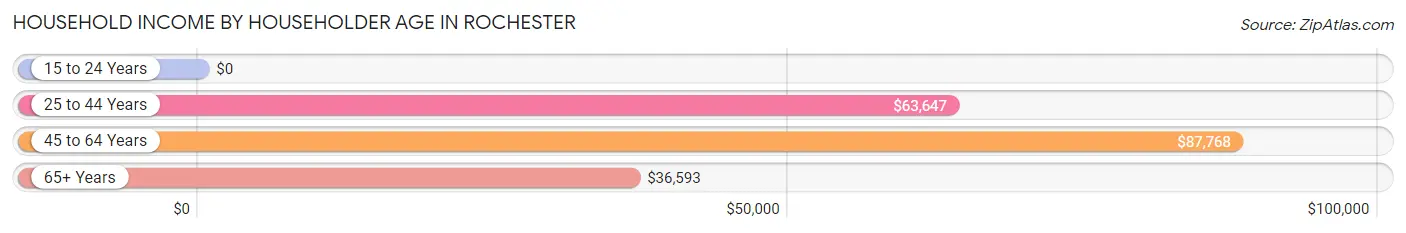
Household Income by Householder Age in Rochester
The median household income in Rochester is $62,885, with the highest median household income of $87,768 found in the 45 to 64 years age bracket for the primary householder. A total of 1,016 households (40.1%) fall into this category. Meanwhile, the 15 to 24 years age bracket for the primary householder has the lowest median household income of $0, with 124 households (4.9%) in this group.
| Income Bracket | # Households | Median Income |
| 15 to 24 Years | 124 (4.9%) | $0 |
| 25 to 44 Years | 585 (23.1%) | $63,647 |
| 45 to 64 Years | 1,016 (40.1%) | $87,768 |
| 65+ Years | 809 (31.9%) | $36,593 |
| Total | 2,534 (100.0%) | $62,885 |
Poverty in Rochester
Income Below Poverty by Sex and Age in Rochester
With 14.3% poverty level for males and 16.5% for females among the residents of Rochester, under 5 year old males and 16 and 17 year old females are the most vulnerable to poverty, with 80 males (54.0%) and 94 females (100.0%) in their respective age groups living below the poverty level.
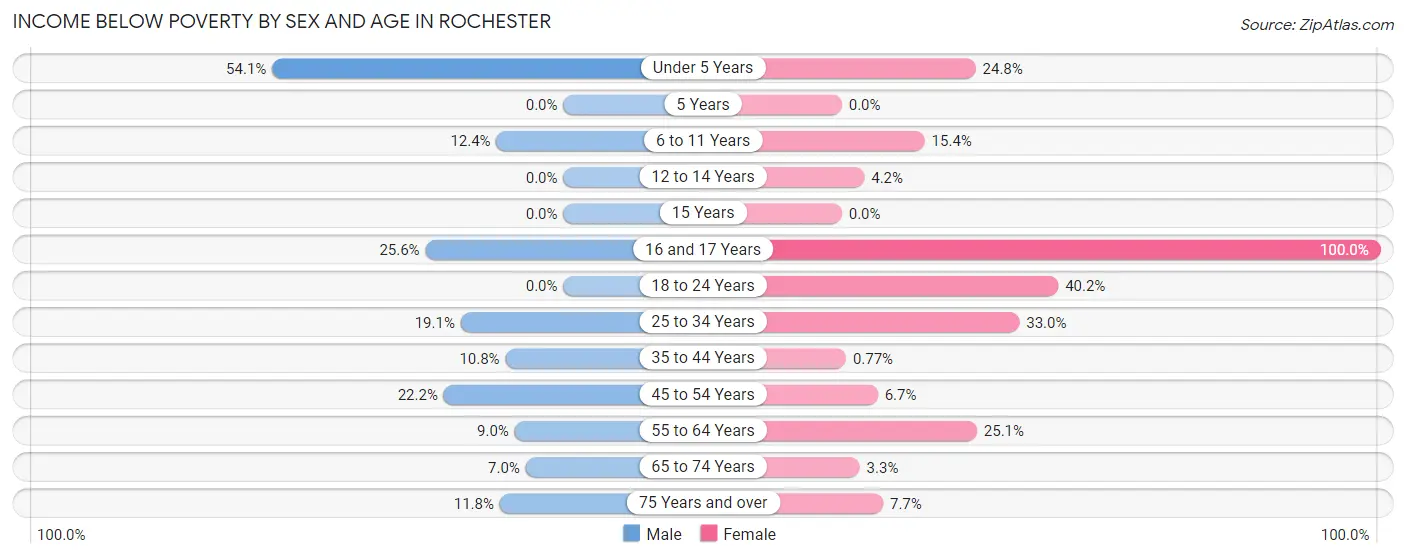
| Age Bracket | Male | Female |
| Under 5 Years | 80 (54.0%) | 40 (24.8%) |
| 5 Years | 0 (0.0%) | 0 (0.0%) |
| 6 to 11 Years | 40 (12.4%) | 32 (15.4%) |
| 12 to 14 Years | 0 (0.0%) | 4 (4.2%) |
| 15 Years | 0 (0.0%) | 0 (0.0%) |
| 16 and 17 Years | 32 (25.6%) | 94 (100.0%) |
| 18 to 24 Years | 0 (0.0%) | 47 (40.2%) |
| 25 to 34 Years | 64 (19.1%) | 116 (33.0%) |
| 35 to 44 Years | 30 (10.7%) | 2 (0.8%) |
| 45 to 54 Years | 119 (22.2%) | 30 (6.7%) |
| 55 to 64 Years | 38 (9.0%) | 88 (25.1%) |
| 65 to 74 Years | 19 (7.0%) | 12 (3.3%) |
| 75 Years and over | 21 (11.8%) | 40 (7.6%) |
| Total | 443 (14.3%) | 505 (16.5%) |
Income Above Poverty by Sex and Age in Rochester
According to the poverty statistics in Rochester, males aged 5 years and females aged 5 years are the age groups that are most secure financially, with 100.0% of males and 100.0% of females in these age groups living above the poverty line.
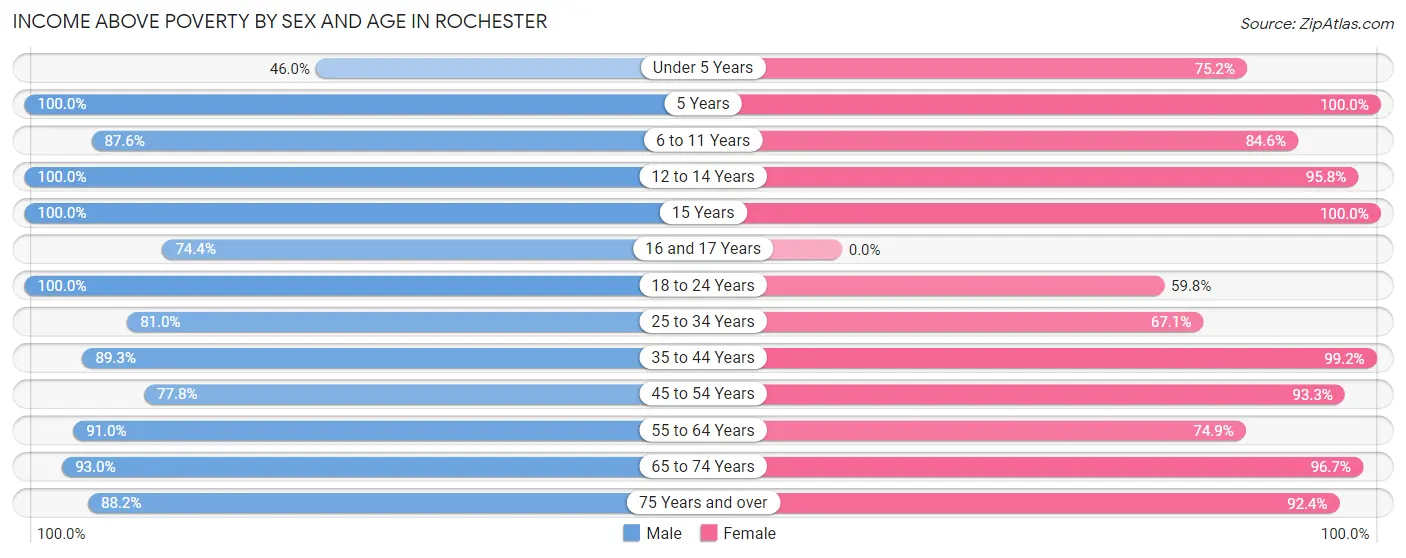
| Age Bracket | Male | Female |
| Under 5 Years | 68 (46.0%) | 121 (75.2%) |
| 5 Years | 23 (100.0%) | 30 (100.0%) |
| 6 to 11 Years | 282 (87.6%) | 176 (84.6%) |
| 12 to 14 Years | 136 (100.0%) | 92 (95.8%) |
| 15 Years | 38 (100.0%) | 51 (100.0%) |
| 16 and 17 Years | 93 (74.4%) | 0 (0.0%) |
| 18 to 24 Years | 278 (100.0%) | 70 (59.8%) |
| 25 to 34 Years | 272 (80.9%) | 236 (67.0%) |
| 35 to 44 Years | 249 (89.2%) | 258 (99.2%) |
| 45 to 54 Years | 417 (77.8%) | 420 (93.3%) |
| 55 to 64 Years | 383 (91.0%) | 263 (74.9%) |
| 65 to 74 Years | 253 (93.0%) | 350 (96.7%) |
| 75 Years and over | 157 (88.2%) | 483 (92.3%) |
| Total | 2,649 (85.7%) | 2,550 (83.5%) |
Income Below Poverty Among Married-Couple Families in Rochester
The poverty statistics for married-couple families in Rochester show that 9.6% or 108 of the total 1,125 families live below the poverty line. Families with 1 or 2 children have the highest poverty rate of 17.5%, comprising of 58 families. On the other hand, families with no children have the lowest poverty rate of 3.6%, which includes 21 families.
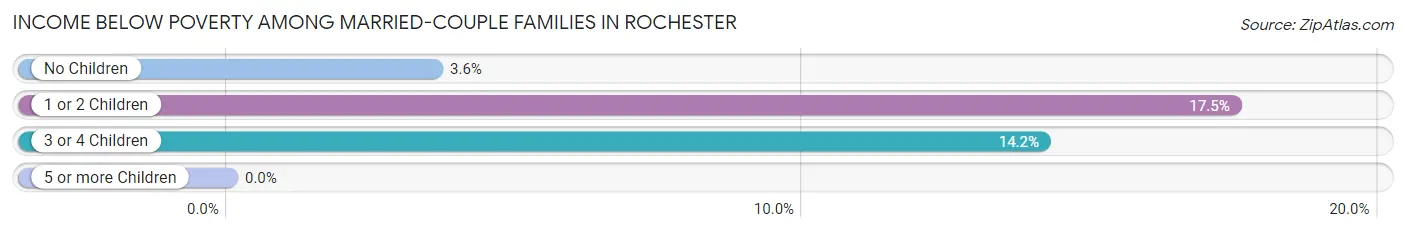
| Children | Above Poverty | Below Poverty |
| No Children | 567 (96.4%) | 21 (3.6%) |
| 1 or 2 Children | 274 (82.5%) | 58 (17.5%) |
| 3 or 4 Children | 176 (85.9%) | 29 (14.1%) |
| 5 or more Children | 0 (0.0%) | 0 (0.0%) |
| Total | 1,017 (90.4%) | 108 (9.6%) |
Income Below Poverty Among Single-Parent Households in Rochester
According to the poverty data in Rochester, 23.9% or 45 single-father households and 26.8% or 82 single-mother households are living below the poverty line. Among single-father households, those with 1 or 2 children have the highest poverty rate, with 45 households (100.0%) experiencing poverty. Likewise, among single-mother households, those with no children have the highest poverty rate, with 57 households (36.5%) falling below the poverty line.
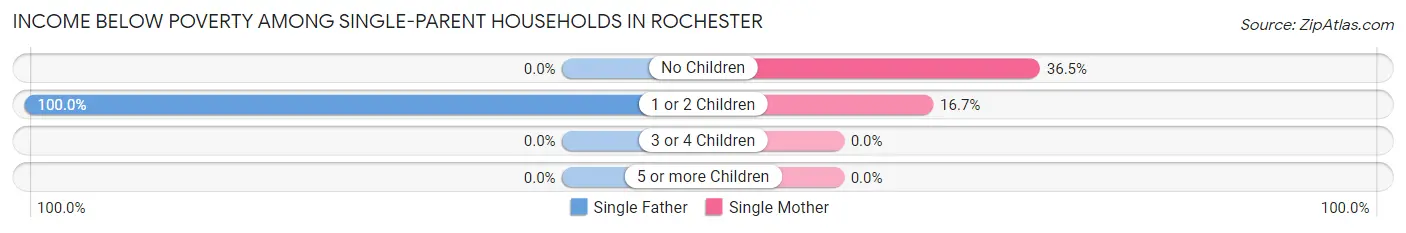
| Children | Single Father | Single Mother |
| No Children | 0 (0.0%) | 57 (36.5%) |
| 1 or 2 Children | 45 (100.0%) | 25 (16.7%) |
| 3 or 4 Children | 0 (0.0%) | 0 (0.0%) |
| 5 or more Children | 0 (0.0%) | 0 (0.0%) |
| Total | 45 (23.9%) | 82 (26.8%) |
Income Below Poverty Among Married-Couple vs Single-Parent Households in Rochester
The poverty data for Rochester shows that 108 of the married-couple family households (9.6%) and 127 of the single-parent households (25.7%) are living below the poverty level. Within the married-couple family households, those with 1 or 2 children have the highest poverty rate, with 58 households (17.5%) falling below the poverty line. Among the single-parent households, those with 1 or 2 children have the highest poverty rate, with 70 household (35.9%) living below poverty.
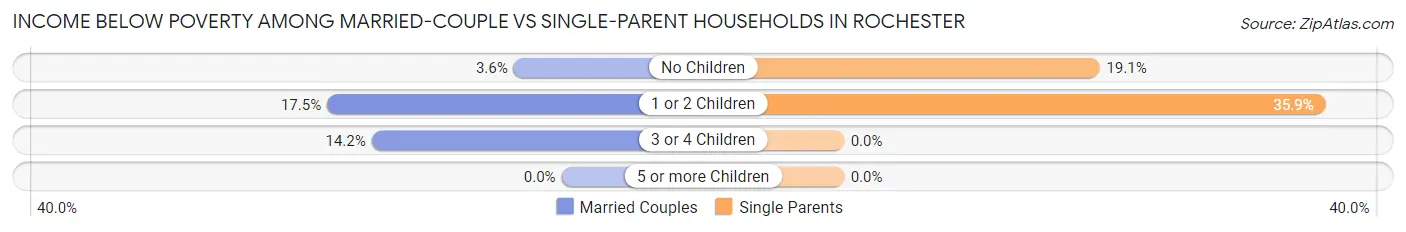
| Children | Married-Couple Families | Single-Parent Households |
| No Children | 21 (3.6%) | 57 (19.1%) |
| 1 or 2 Children | 58 (17.5%) | 70 (35.9%) |
| 3 or 4 Children | 29 (14.1%) | 0 (0.0%) |
| 5 or more Children | 0 (0.0%) | 0 (0.0%) |
| Total | 108 (9.6%) | 127 (25.7%) |
Employment Characteristics in Rochester
Employment by Class of Employer in Rochester
Among the 2,717 employed individuals in Rochester, private company employees (1,997 | 73.5%), not-for-profit organizations (226 | 8.3%), and local government employees (184 | 6.8%) make up the most common classes of employment.
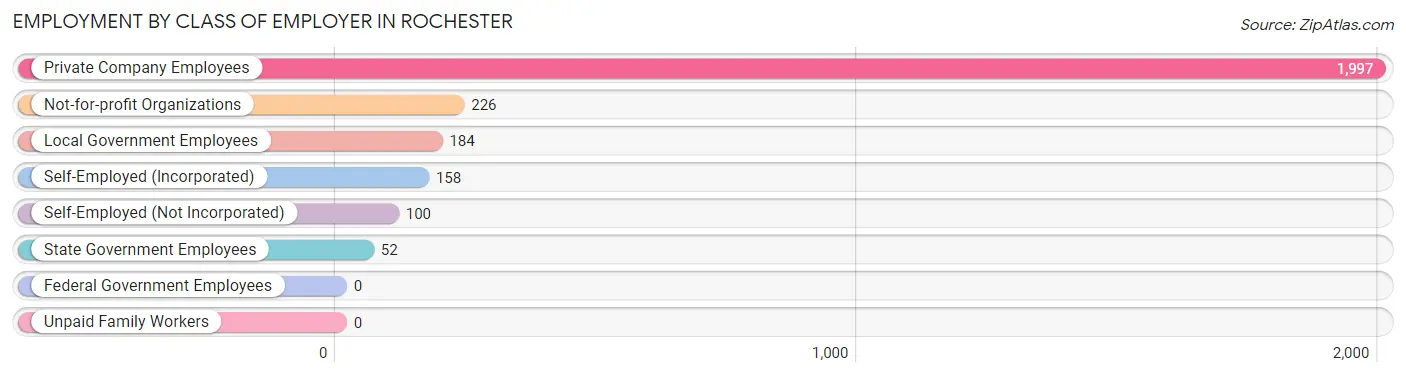
| Employer Class | # Employees | % Employees |
| Private Company Employees | 1,997 | 73.5% |
| Self-Employed (Incorporated) | 158 | 5.8% |
| Self-Employed (Not Incorporated) | 100 | 3.7% |
| Not-for-profit Organizations | 226 | 8.3% |
| Local Government Employees | 184 | 6.8% |
| State Government Employees | 52 | 1.9% |
| Federal Government Employees | 0 | 0.0% |
| Unpaid Family Workers | 0 | 0.0% |
| Total | 2,717 | 100.0% |
Employment Status by Age in Rochester
According to the labor force statistics for Rochester, out of the total population over 16 years of age (5,023), 58.3% or 2,928 individuals are in the labor force, with 6.5% or 190 of them unemployed. The age group with the highest labor force participation rate is 35 to 44 years, with 98.2% or 536 individuals in the labor force. Within the labor force, the 25 to 29 years age range has the highest percentage of unemployed individuals, with 21.4% or 44 of them being unemployed.
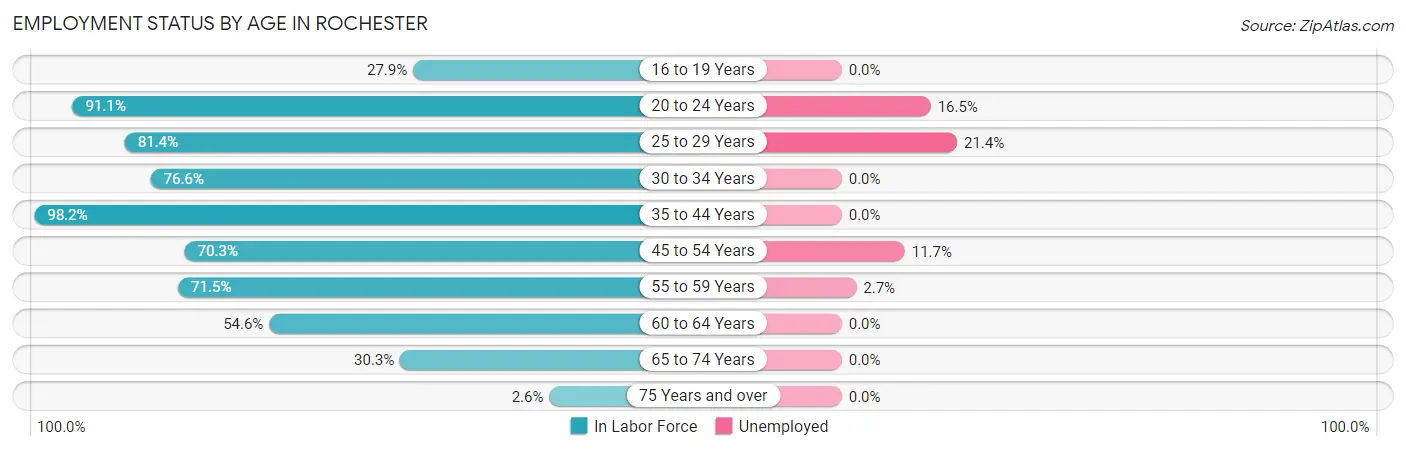
| Age Bracket | In Labor Force | Unemployed |
| 16 to 19 Years | 74 (27.9%) | 0 (0.0%) |
| 20 to 24 Years | 328 (91.1%) | 54 (16.5%) |
| 25 to 29 Years | 206 (81.4%) | 44 (21.4%) |
| 30 to 34 Years | 347 (76.6%) | 0 (0.0%) |
| 35 to 44 Years | 536 (98.2%) | 0 (0.0%) |
| 45 to 54 Years | 703 (70.3%) | 82 (11.7%) |
| 55 to 59 Years | 409 (71.5%) | 11 (2.7%) |
| 60 to 64 Years | 112 (54.6%) | 0 (0.0%) |
| 65 to 74 Years | 192 (30.3%) | 0 (0.0%) |
| 75 Years and over | 19 (2.6%) | 0 (0.0%) |
| Total | 2,928 (58.3%) | 190 (6.5%) |
Employment Status by Educational Attainment in Rochester
According to labor force statistics for Rochester, 76.4% of individuals (2,314) out of the total population between 25 and 64 years of age (3,029) are in the labor force, with 5.9% or 137 of them being unemployed. The group with the highest labor force participation rate are those with the educational attainment of college / associate degree, with 88.8% or 932 individuals in the labor force. Within the labor force, individuals with high school diploma education have the highest percentage of unemployment, with 20.0% or 137 of them being unemployed.
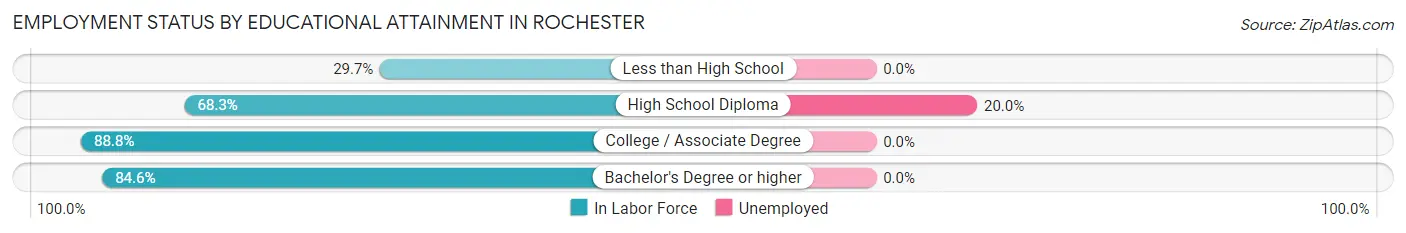
| Educational Attainment | In Labor Force | Unemployed |
| Less than High School | 70 (29.7%) | 0 (0.0%) |
| High School Diploma | 684 (68.3%) | 200 (20.0%) |
| College / Associate Degree | 932 (88.8%) | 0 (0.0%) |
| Bachelor's Degree or higher | 628 (84.6%) | 0 (0.0%) |
| Total | 2,314 (76.4%) | 179 (5.9%) |
Employment Occupations by Sex in Rochester
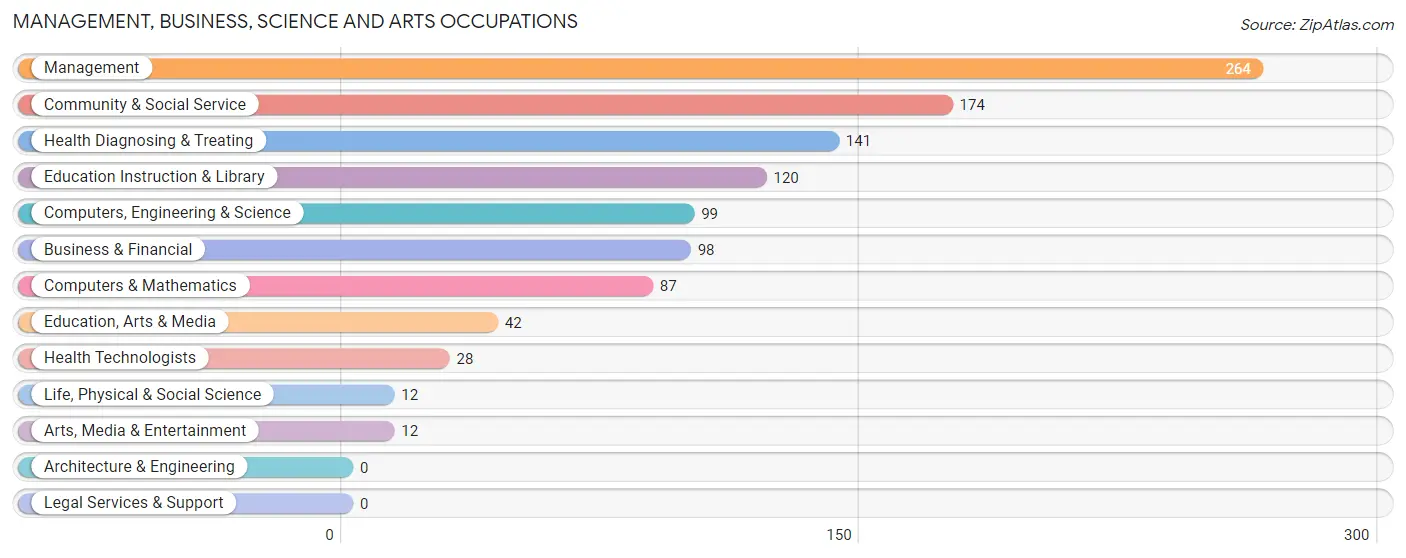
Management, Business, Science and Arts Occupations
The most common Management, Business, Science and Arts occupations in Rochester are Management (264 | 9.7%), Community & Social Service (174 | 6.4%), Health Diagnosing & Treating (141 | 5.2%), Education Instruction & Library (120 | 4.4%), and Computers, Engineering & Science (99 | 3.6%).
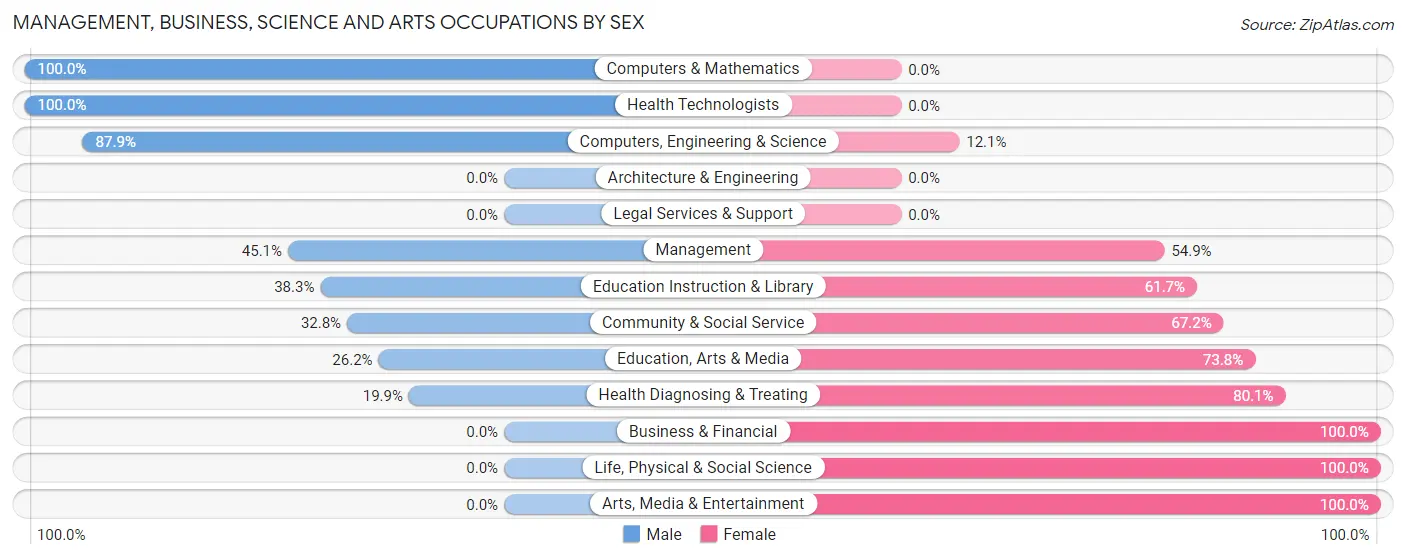
Management, Business, Science and Arts Occupations by Sex
Within the Management, Business, Science and Arts occupations in Rochester, the most male-oriented occupations are Computers & Mathematics (100.0%), Health Technologists (100.0%), and Computers, Engineering & Science (87.9%), while the most female-oriented occupations are Business & Financial (100.0%), Life, Physical & Social Science (100.0%), and Arts, Media & Entertainment (100.0%).
| Occupation | Male | Female |
| Management | 119 (45.1%) | 145 (54.9%) |
| Business & Financial | 0 (0.0%) | 98 (100.0%) |
| Computers, Engineering & Science | 87 (87.9%) | 12 (12.1%) |
| Computers & Mathematics | 87 (100.0%) | 0 (0.0%) |
| Architecture & Engineering | 0 (0.0%) | 0 (0.0%) |
| Life, Physical & Social Science | 0 (0.0%) | 12 (100.0%) |
| Community & Social Service | 57 (32.8%) | 117 (67.2%) |
| Education, Arts & Media | 11 (26.2%) | 31 (73.8%) |
| Legal Services & Support | 0 (0.0%) | 0 (0.0%) |
| Education Instruction & Library | 46 (38.3%) | 74 (61.7%) |
| Arts, Media & Entertainment | 0 (0.0%) | 12 (100.0%) |
| Health Diagnosing & Treating | 28 (19.9%) | 113 (80.1%) |
| Health Technologists | 28 (100.0%) | 0 (0.0%) |
| Total (Category) | 291 (37.5%) | 485 (62.5%) |
| Total (Overall) | 1,594 (58.3%) | 1,141 (41.7%) |
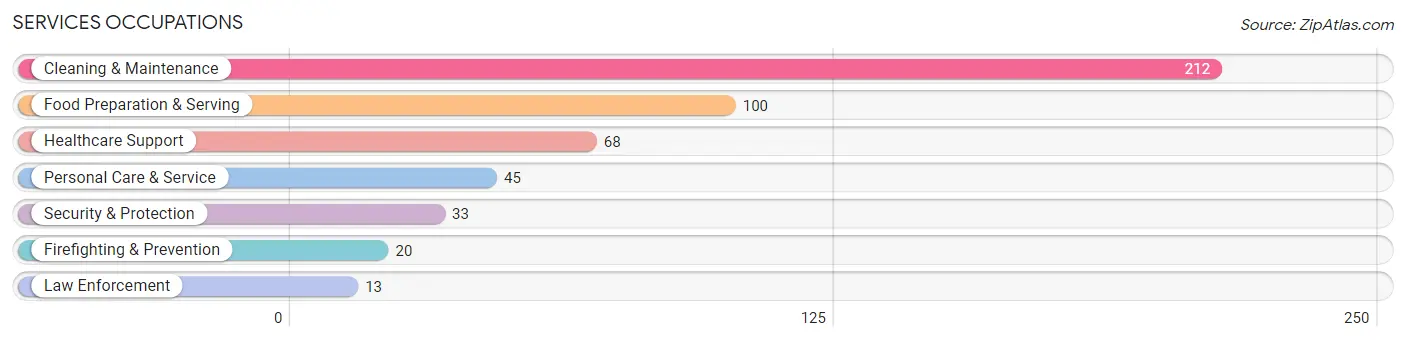
Services Occupations
The most common Services occupations in Rochester are Cleaning & Maintenance (212 | 7.7%), Food Preparation & Serving (100 | 3.7%), Healthcare Support (68 | 2.5%), Personal Care & Service (45 | 1.7%), and Security & Protection (33 | 1.2%).
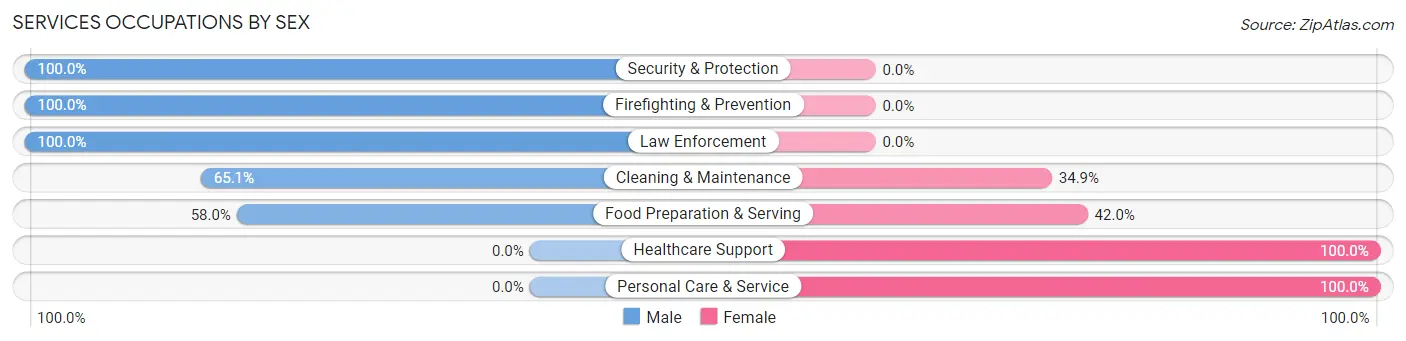
Services Occupations by Sex
Within the Services occupations in Rochester, the most male-oriented occupations are Security & Protection (100.0%), Firefighting & Prevention (100.0%), and Law Enforcement (100.0%), while the most female-oriented occupations are Healthcare Support (100.0%), Personal Care & Service (100.0%), and Food Preparation & Serving (42.0%).
| Occupation | Male | Female |
| Healthcare Support | 0 (0.0%) | 68 (100.0%) |
| Security & Protection | 33 (100.0%) | 0 (0.0%) |
| Firefighting & Prevention | 20 (100.0%) | 0 (0.0%) |
| Law Enforcement | 13 (100.0%) | 0 (0.0%) |
| Food Preparation & Serving | 58 (58.0%) | 42 (42.0%) |
| Cleaning & Maintenance | 138 (65.1%) | 74 (34.9%) |
| Personal Care & Service | 0 (0.0%) | 45 (100.0%) |
| Total (Category) | 229 (50.0%) | 229 (50.0%) |
| Total (Overall) | 1,594 (58.3%) | 1,141 (41.7%) |
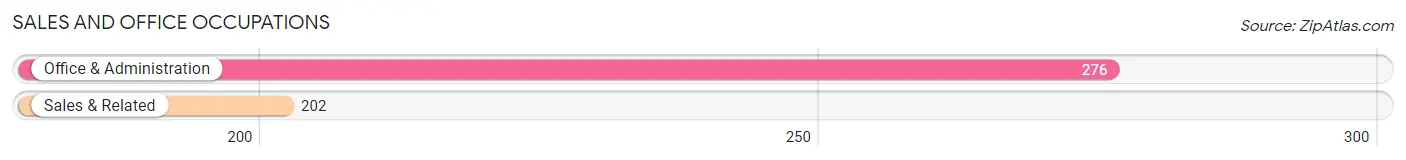
Sales and Office Occupations
The most common Sales and Office occupations in Rochester are Office & Administration (276 | 10.1%), and Sales & Related (202 | 7.4%).
Sales and Office Occupations by Sex
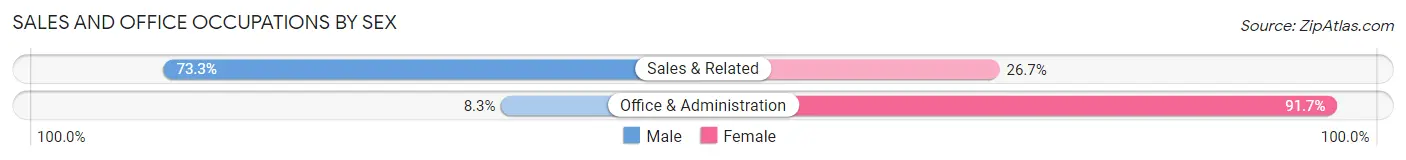
| Occupation | Male | Female |
| Sales & Related | 148 (73.3%) | 54 (26.7%) |
| Office & Administration | 23 (8.3%) | 253 (91.7%) |
| Total (Category) | 171 (35.8%) | 307 (64.2%) |
| Total (Overall) | 1,594 (58.3%) | 1,141 (41.7%) |
Natural Resources, Construction and Maintenance Occupations
The most common Natural Resources, Construction and Maintenance occupations in Rochester are Construction & Extraction (118 | 4.3%), and Installation, Maintenance & Repair (82 | 3.0%).

Natural Resources, Construction and Maintenance Occupations by Sex
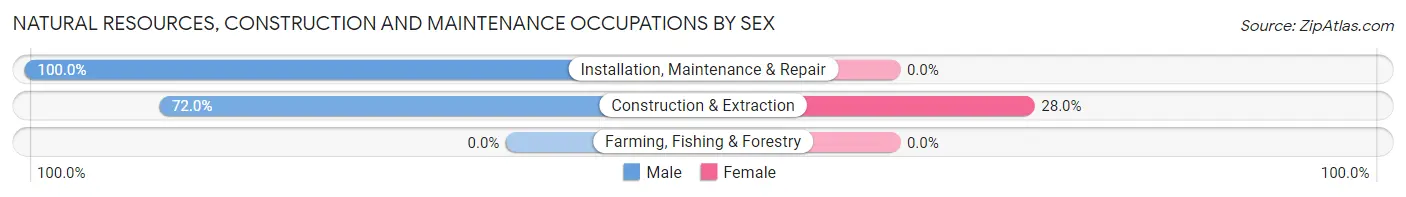
| Occupation | Male | Female |
| Farming, Fishing & Forestry | 0 (0.0%) | 0 (0.0%) |
| Construction & Extraction | 85 (72.0%) | 33 (28.0%) |
| Installation, Maintenance & Repair | 82 (100.0%) | 0 (0.0%) |
| Total (Category) | 167 (83.5%) | 33 (16.5%) |
| Total (Overall) | 1,594 (58.3%) | 1,141 (41.7%) |
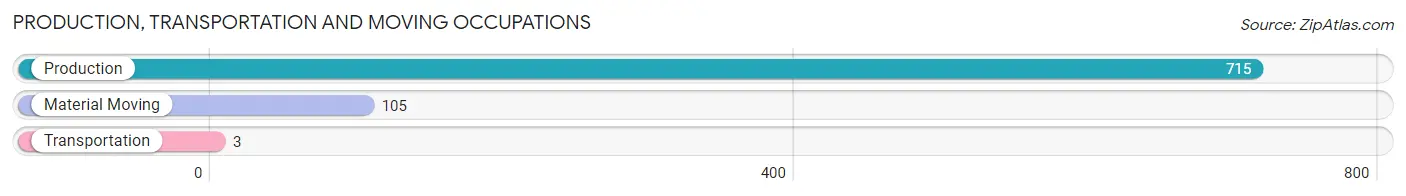
Production, Transportation and Moving Occupations
The most common Production, Transportation and Moving occupations in Rochester are Production (715 | 26.1%), Material Moving (105 | 3.8%), and Transportation (3 | 0.1%).
Production, Transportation and Moving Occupations by Sex
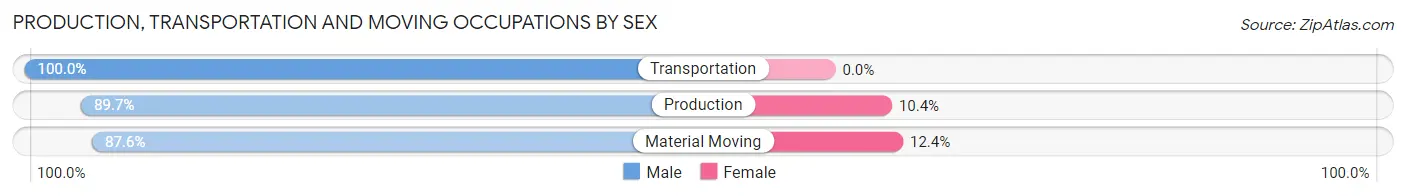
| Occupation | Male | Female |
| Production | 641 (89.6%) | 74 (10.3%) |
| Transportation | 3 (100.0%) | 0 (0.0%) |
| Material Moving | 92 (87.6%) | 13 (12.4%) |
| Total (Category) | 736 (89.4%) | 87 (10.6%) |
| Total (Overall) | 1,594 (58.3%) | 1,141 (41.7%) |
Employment Industries by Sex in Rochester
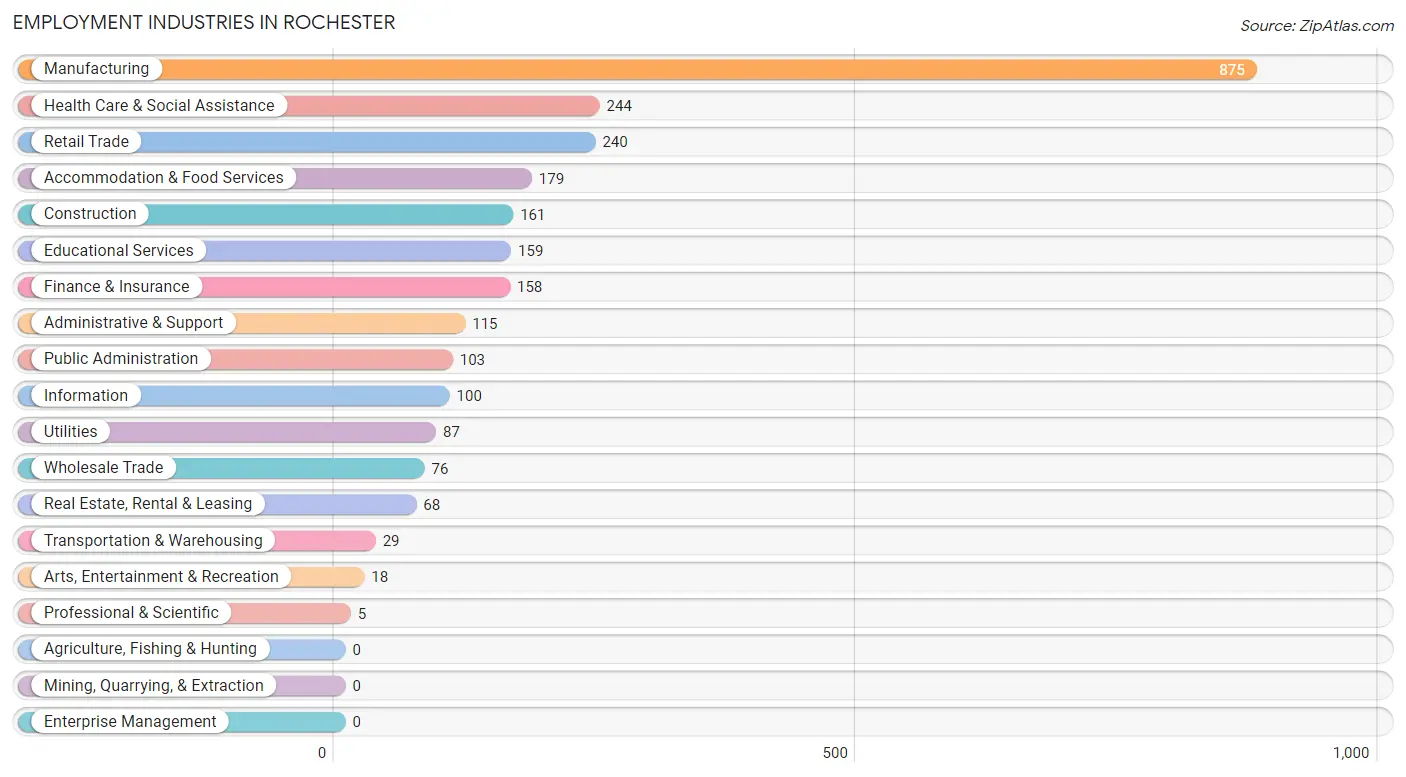
Employment Industries in Rochester
The major employment industries in Rochester include Manufacturing (875 | 32.0%), Health Care & Social Assistance (244 | 8.9%), Retail Trade (240 | 8.8%), Accommodation & Food Services (179 | 6.5%), and Construction (161 | 5.9%).
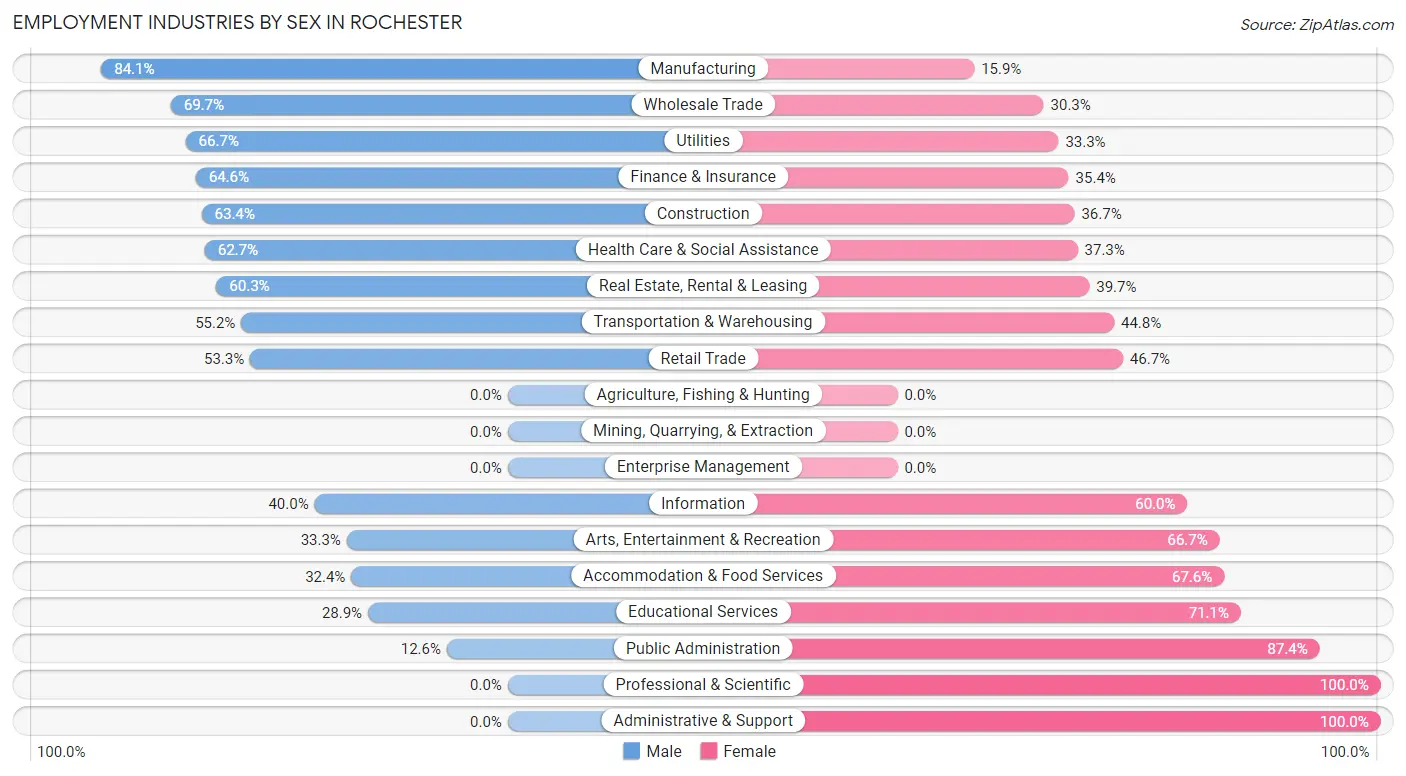
Employment Industries by Sex in Rochester
The Rochester industries that see more men than women are Manufacturing (84.1%), Wholesale Trade (69.7%), and Utilities (66.7%), whereas the industries that tend to have a higher number of women are Professional & Scientific (100.0%), Administrative & Support (100.0%), and Public Administration (87.4%).
| Industry | Male | Female |
| Agriculture, Fishing & Hunting | 0 (0.0%) | 0 (0.0%) |
| Mining, Quarrying, & Extraction | 0 (0.0%) | 0 (0.0%) |
| Construction | 102 (63.3%) | 59 (36.6%) |
| Manufacturing | 736 (84.1%) | 139 (15.9%) |
| Wholesale Trade | 53 (69.7%) | 23 (30.3%) |
| Retail Trade | 128 (53.3%) | 112 (46.7%) |
| Transportation & Warehousing | 16 (55.2%) | 13 (44.8%) |
| Utilities | 58 (66.7%) | 29 (33.3%) |
| Information | 40 (40.0%) | 60 (60.0%) |
| Finance & Insurance | 102 (64.6%) | 56 (35.4%) |
| Real Estate, Rental & Leasing | 41 (60.3%) | 27 (39.7%) |
| Professional & Scientific | 0 (0.0%) | 5 (100.0%) |
| Enterprise Management | 0 (0.0%) | 0 (0.0%) |
| Administrative & Support | 0 (0.0%) | 115 (100.0%) |
| Educational Services | 46 (28.9%) | 113 (71.1%) |
| Health Care & Social Assistance | 153 (62.7%) | 91 (37.3%) |
| Arts, Entertainment & Recreation | 6 (33.3%) | 12 (66.7%) |
| Accommodation & Food Services | 58 (32.4%) | 121 (67.6%) |
| Public Administration | 13 (12.6%) | 90 (87.4%) |
| Total | 1,594 (58.3%) | 1,141 (41.7%) |
Education in Rochester
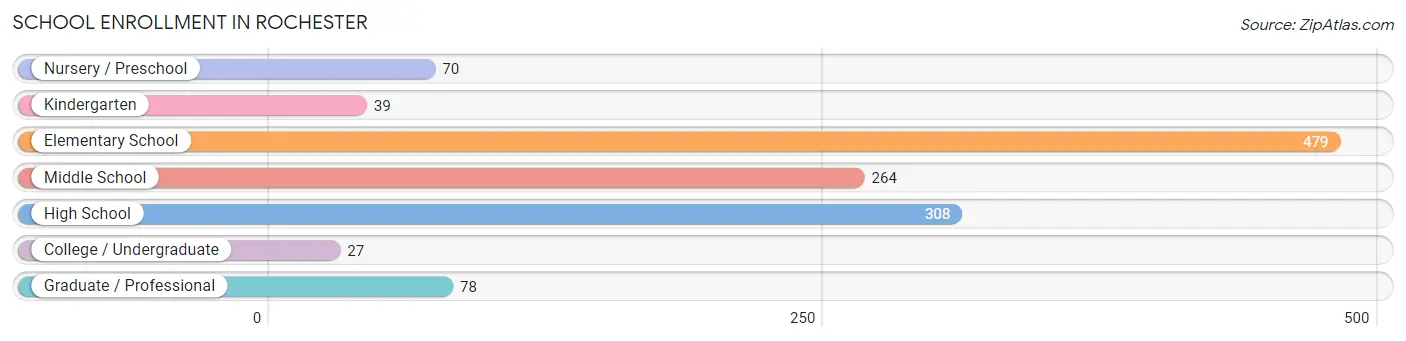
School Enrollment in Rochester
The most common levels of schooling among the 1,265 students in Rochester are elementary school (479 | 37.9%), high school (308 | 24.3%), and middle school (264 | 20.9%).
| School Level | # Students | % Students |
| Nursery / Preschool | 70 | 5.5% |
| Kindergarten | 39 | 3.1% |
| Elementary School | 479 | 37.9% |
| Middle School | 264 | 20.9% |
| High School | 308 | 24.3% |
| College / Undergraduate | 27 | 2.1% |
| Graduate / Professional | 78 | 6.2% |
| Total | 1,265 | 100.0% |
School Enrollment by Age by Funding Source in Rochester
Out of a total of 1,265 students who are enrolled in schools in Rochester, 70 (5.5%) attend a private institution, while the remaining 1,195 (94.5%) are enrolled in public schools. The age group of 5 to 9 year old has the highest likelihood of being enrolled in private schools, with 42 (11.1% in the age bracket) enrolled. Conversely, the age group of 3 to 4 year olds has the lowest likelihood of being enrolled in a private school, with 37 (100.0% in the age bracket) attending a public institution.
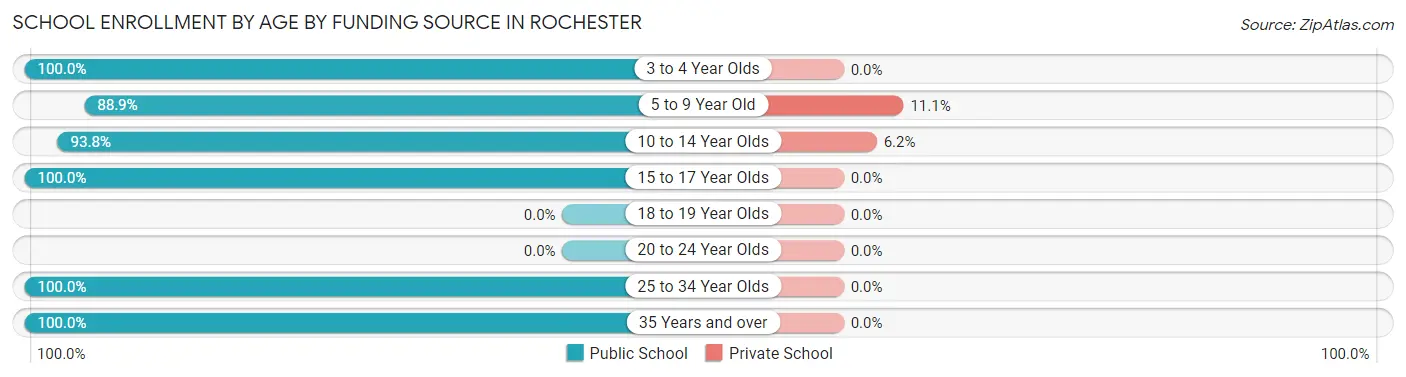
| Age Bracket | Public School | Private School |
| 3 to 4 Year Olds | 37 (100.0%) | 0 (0.0%) |
| 5 to 9 Year Old | 335 (88.9%) | 42 (11.1%) |
| 10 to 14 Year Olds | 411 (93.8%) | 27 (6.2%) |
| 15 to 17 Year Olds | 308 (100.0%) | 0 (0.0%) |
| 18 to 19 Year Olds | 0 (0.0%) | 0 (0.0%) |
| 20 to 24 Year Olds | 0 (0.0%) | 0 (0.0%) |
| 25 to 34 Year Olds | 59 (100.0%) | 0 (0.0%) |
| 35 Years and over | 46 (100.0%) | 0 (0.0%) |
| Total | 1,195 (94.5%) | 70 (5.5%) |
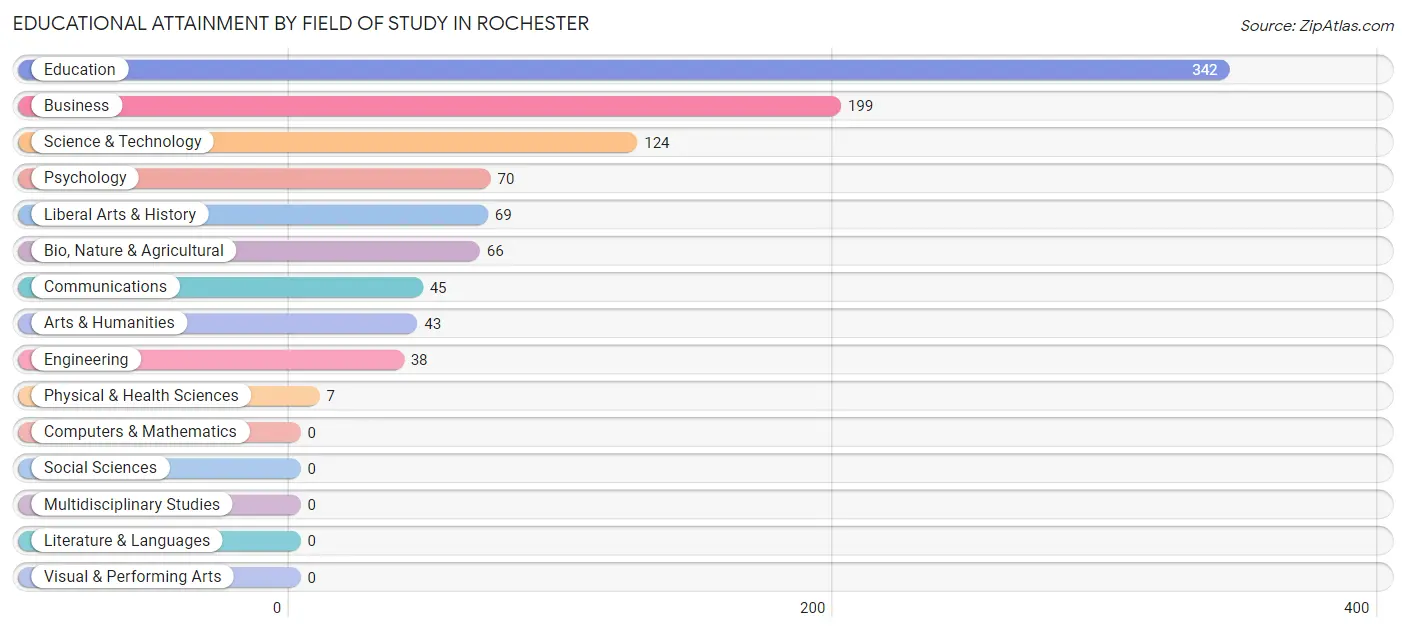
Educational Attainment by Field of Study in Rochester
Education (342 | 34.1%), business (199 | 19.8%), science & technology (124 | 12.4%), psychology (70 | 7.0%), and liberal arts & history (69 | 6.9%) are the most common fields of study among 1,003 individuals in Rochester who have obtained a bachelor's degree or higher.
| Field of Study | # Graduates | % Graduates |
| Computers & Mathematics | 0 | 0.0% |
| Bio, Nature & Agricultural | 66 | 6.6% |
| Physical & Health Sciences | 7 | 0.7% |
| Psychology | 70 | 7.0% |
| Social Sciences | 0 | 0.0% |
| Engineering | 38 | 3.8% |
| Multidisciplinary Studies | 0 | 0.0% |
| Science & Technology | 124 | 12.4% |
| Business | 199 | 19.8% |
| Education | 342 | 34.1% |
| Literature & Languages | 0 | 0.0% |
| Liberal Arts & History | 69 | 6.9% |
| Visual & Performing Arts | 0 | 0.0% |
| Communications | 45 | 4.5% |
| Arts & Humanities | 43 | 4.3% |
| Total | 1,003 | 100.0% |
Transportation & Commute in Rochester
Vehicle Availability by Sex in Rochester
The most prevalent vehicle ownership categories in Rochester are males with 2 vehicles (662, accounting for 41.6%) and females with 2 vehicles (312, making up 59.1%).
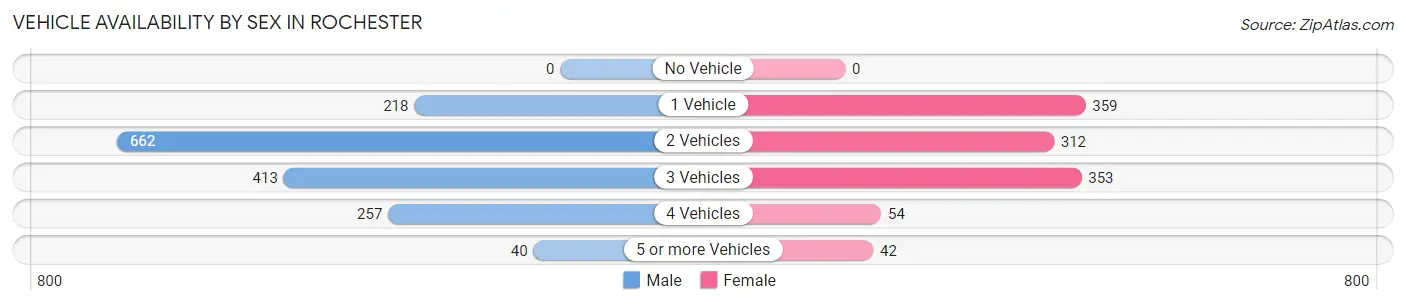
| Vehicles Available | Male | Female |
| No Vehicle | 0 (0.0%) | 0 (0.0%) |
| 1 Vehicle | 218 (13.7%) | 359 (32.1%) |
| 2 Vehicles | 662 (41.6%) | 312 (27.9%) |
| 3 Vehicles | 413 (26.0%) | 353 (31.5%) |
| 4 Vehicles | 257 (16.2%) | 54 (4.8%) |
| 5 or more Vehicles | 40 (2.5%) | 42 (3.7%) |
| Total | 1,590 (100.0%) | 1,120 (100.0%) |
Commute Time in Rochester
The most frequently occuring commute durations in Rochester are 5 to 9 minutes (752 commuters, 28.5%), 10 to 14 minutes (406 commuters, 15.4%), and 30 to 34 minutes (319 commuters, 12.1%).
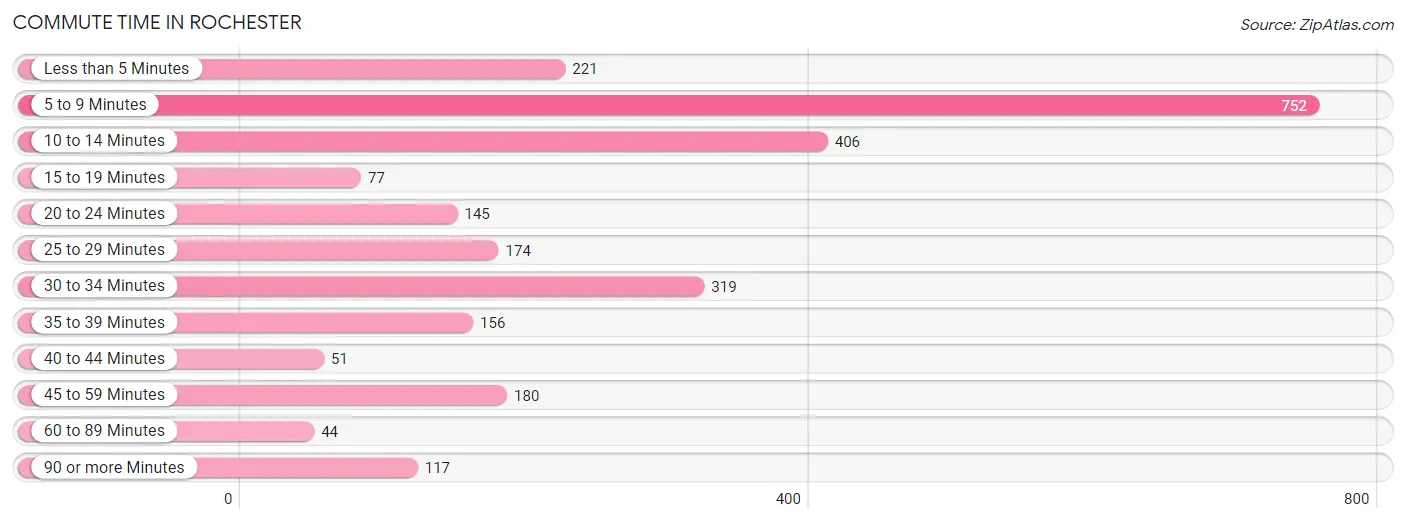
| Commute Time | # Commuters | % Commuters |
| Less than 5 Minutes | 221 | 8.4% |
| 5 to 9 Minutes | 752 | 28.5% |
| 10 to 14 Minutes | 406 | 15.4% |
| 15 to 19 Minutes | 77 | 2.9% |
| 20 to 24 Minutes | 145 | 5.5% |
| 25 to 29 Minutes | 174 | 6.6% |
| 30 to 34 Minutes | 319 | 12.1% |
| 35 to 39 Minutes | 156 | 5.9% |
| 40 to 44 Minutes | 51 | 1.9% |
| 45 to 59 Minutes | 180 | 6.8% |
| 60 to 89 Minutes | 44 | 1.7% |
| 90 or more Minutes | 117 | 4.4% |
Commute Time by Sex in Rochester
The most common commute times in Rochester are 5 to 9 minutes (490 commuters, 31.2%) for males and 5 to 9 minutes (262 commuters, 24.4%) for females.
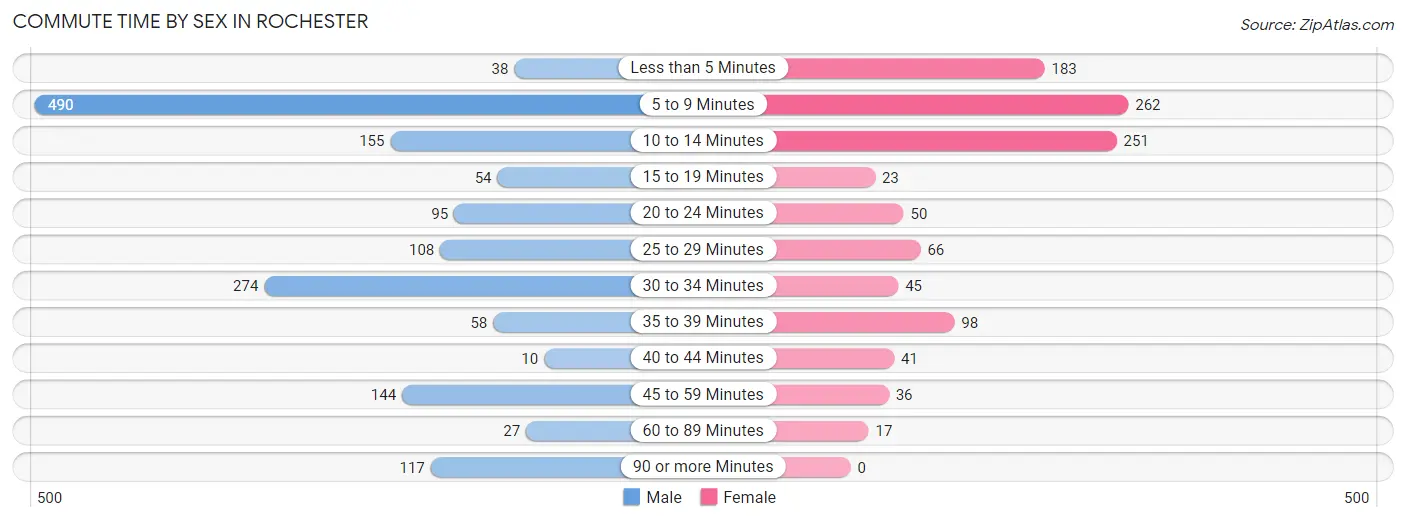
| Commute Time | Male | Female |
| Less than 5 Minutes | 38 (2.4%) | 183 (17.1%) |
| 5 to 9 Minutes | 490 (31.2%) | 262 (24.4%) |
| 10 to 14 Minutes | 155 (9.9%) | 251 (23.4%) |
| 15 to 19 Minutes | 54 (3.4%) | 23 (2.1%) |
| 20 to 24 Minutes | 95 (6.0%) | 50 (4.7%) |
| 25 to 29 Minutes | 108 (6.9%) | 66 (6.2%) |
| 30 to 34 Minutes | 274 (17.4%) | 45 (4.2%) |
| 35 to 39 Minutes | 58 (3.7%) | 98 (9.1%) |
| 40 to 44 Minutes | 10 (0.6%) | 41 (3.8%) |
| 45 to 59 Minutes | 144 (9.2%) | 36 (3.4%) |
| 60 to 89 Minutes | 27 (1.7%) | 17 (1.6%) |
| 90 or more Minutes | 117 (7.4%) | 0 (0.0%) |
Time of Departure to Work by Sex in Rochester
The most frequent times of departure to work in Rochester are 7:00 AM to 7:29 AM (284, 18.1%) for males and 7:30 AM to 7:59 AM (191, 17.8%) for females.
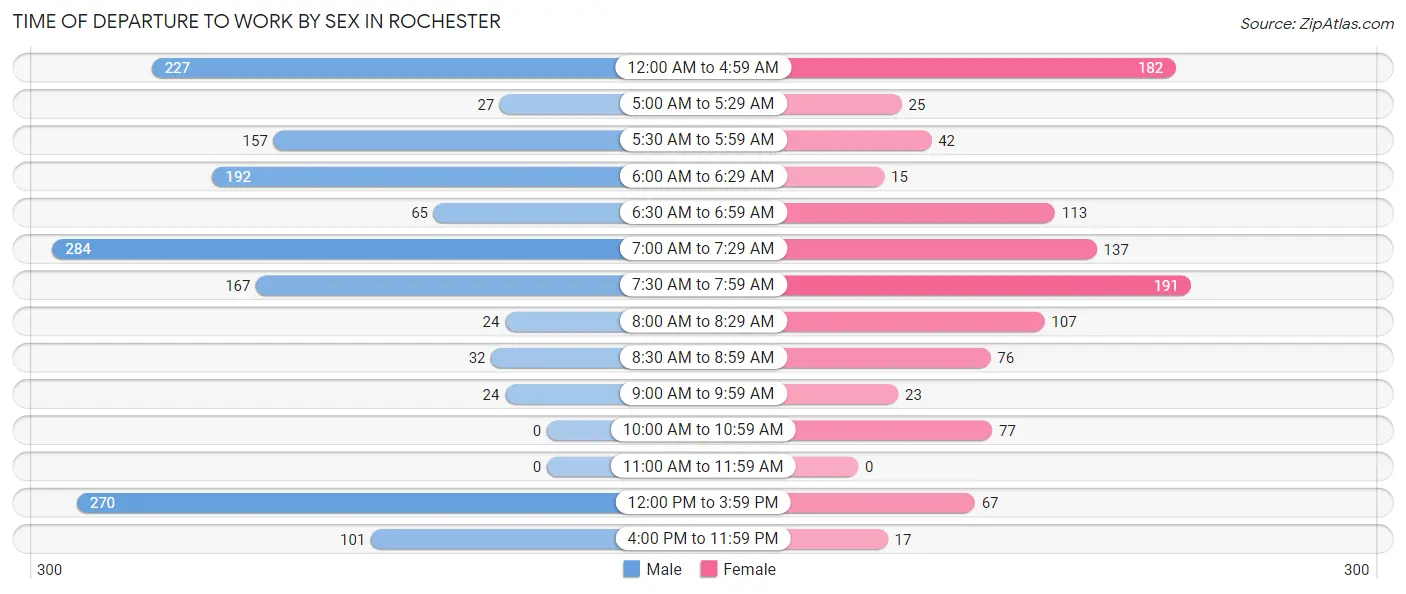
| Time of Departure | Male | Female |
| 12:00 AM to 4:59 AM | 227 (14.5%) | 182 (17.0%) |
| 5:00 AM to 5:29 AM | 27 (1.7%) | 25 (2.3%) |
| 5:30 AM to 5:59 AM | 157 (10.0%) | 42 (3.9%) |
| 6:00 AM to 6:29 AM | 192 (12.2%) | 15 (1.4%) |
| 6:30 AM to 6:59 AM | 65 (4.1%) | 113 (10.5%) |
| 7:00 AM to 7:29 AM | 284 (18.1%) | 137 (12.8%) |
| 7:30 AM to 7:59 AM | 167 (10.6%) | 191 (17.8%) |
| 8:00 AM to 8:29 AM | 24 (1.5%) | 107 (10.0%) |
| 8:30 AM to 8:59 AM | 32 (2.0%) | 76 (7.1%) |
| 9:00 AM to 9:59 AM | 24 (1.5%) | 23 (2.1%) |
| 10:00 AM to 10:59 AM | 0 (0.0%) | 77 (7.2%) |
| 11:00 AM to 11:59 AM | 0 (0.0%) | 0 (0.0%) |
| 12:00 PM to 3:59 PM | 270 (17.2%) | 67 (6.2%) |
| 4:00 PM to 11:59 PM | 101 (6.4%) | 17 (1.6%) |
| Total | 1,570 (100.0%) | 1,072 (100.0%) |
Housing Occupancy in Rochester
Occupancy by Ownership in Rochester
Of the total 2,534 dwellings in Rochester, owner-occupied units account for 1,579 (62.3%), while renter-occupied units make up 955 (37.7%).
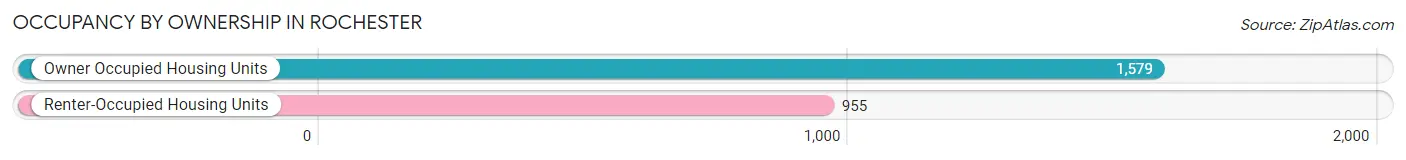
| Occupancy | # Housing Units | % Housing Units |
| Owner Occupied Housing Units | 1,579 | 62.3% |
| Renter-Occupied Housing Units | 955 | 37.7% |
| Total Occupied Housing Units | 2,534 | 100.0% |
Occupancy by Household Size in Rochester
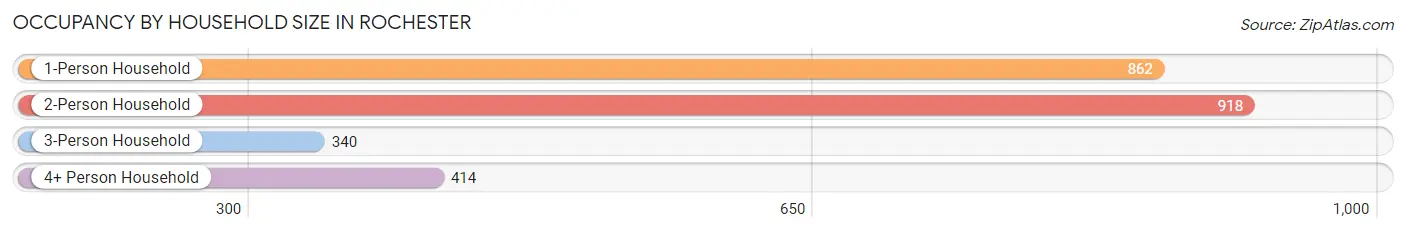
| Household Size | # Housing Units | % Housing Units |
| 1-Person Household | 862 | 34.0% |
| 2-Person Household | 918 | 36.2% |
| 3-Person Household | 340 | 13.4% |
| 4+ Person Household | 414 | 16.3% |
| Total Housing Units | 2,534 | 100.0% |
Occupancy by Ownership by Household Size in Rochester
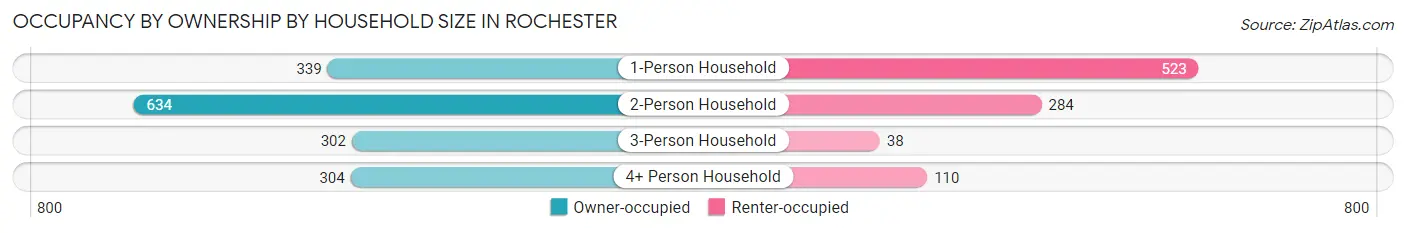
| Household Size | Owner-occupied | Renter-occupied |
| 1-Person Household | 339 (39.3%) | 523 (60.7%) |
| 2-Person Household | 634 (69.1%) | 284 (30.9%) |
| 3-Person Household | 302 (88.8%) | 38 (11.2%) |
| 4+ Person Household | 304 (73.4%) | 110 (26.6%) |
| Total Housing Units | 1,579 (62.3%) | 955 (37.7%) |
Occupancy by Educational Attainment in Rochester
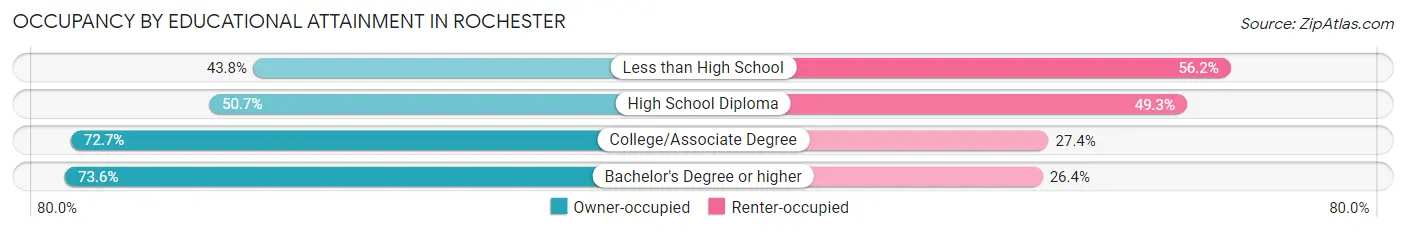
| Household Size | Owner-occupied | Renter-occupied |
| Less than High School | 92 (43.8%) | 118 (56.2%) |
| High School Diploma | 480 (50.7%) | 466 (49.3%) |
| College/Associate Degree | 542 (72.7%) | 204 (27.4%) |
| Bachelor's Degree or higher | 465 (73.6%) | 167 (26.4%) |
Occupancy by Age of Householder in Rochester
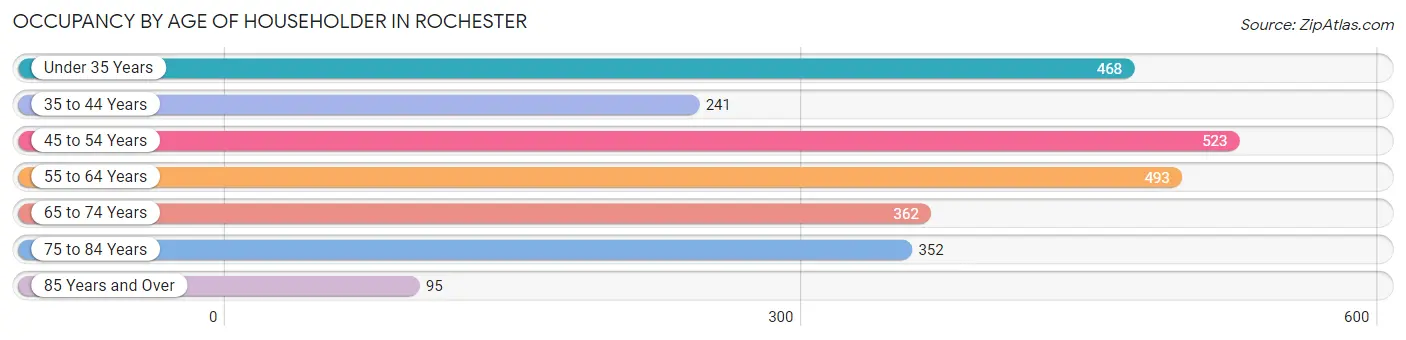
| Age Bracket | # Households | % Households |
| Under 35 Years | 468 | 18.5% |
| 35 to 44 Years | 241 | 9.5% |
| 45 to 54 Years | 523 | 20.6% |
| 55 to 64 Years | 493 | 19.5% |
| 65 to 74 Years | 362 | 14.3% |
| 75 to 84 Years | 352 | 13.9% |
| 85 Years and Over | 95 | 3.7% |
| Total | 2,534 | 100.0% |
Housing Finances in Rochester
Median Income by Occupancy in Rochester
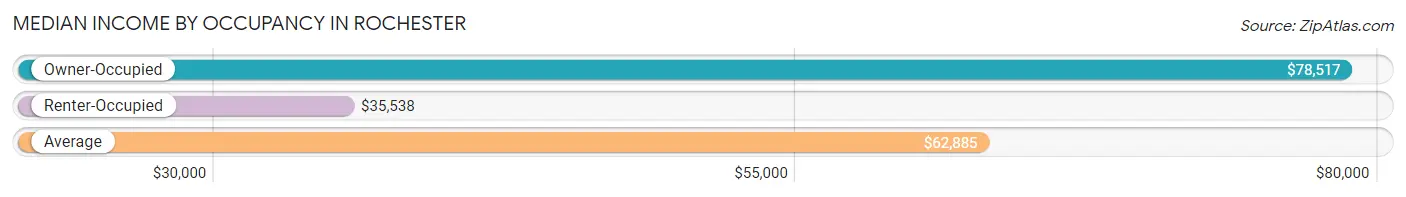
| Occupancy Type | # Households | Median Income |
| Owner-Occupied | 1,579 (62.3%) | $78,517 |
| Renter-Occupied | 955 (37.7%) | $35,538 |
| Average | 2,534 (100.0%) | $62,885 |
Occupancy by Householder Income Bracket in Rochester
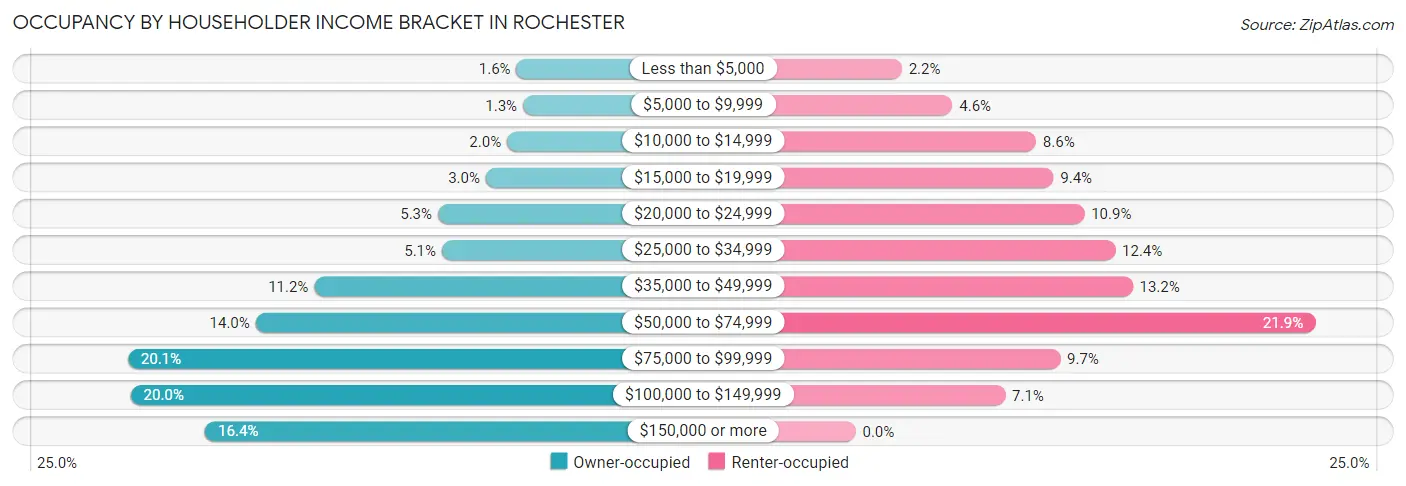
| Income Bracket | Owner-occupied | Renter-occupied |
| Less than $5,000 | 25 (1.6%) | 21 (2.2%) |
| $5,000 to $9,999 | 20 (1.3%) | 44 (4.6%) |
| $10,000 to $14,999 | 32 (2.0%) | 82 (8.6%) |
| $15,000 to $19,999 | 48 (3.0%) | 90 (9.4%) |
| $20,000 to $24,999 | 84 (5.3%) | 104 (10.9%) |
| $25,000 to $34,999 | 81 (5.1%) | 118 (12.4%) |
| $35,000 to $49,999 | 177 (11.2%) | 126 (13.2%) |
| $50,000 to $74,999 | 221 (14.0%) | 209 (21.9%) |
| $75,000 to $99,999 | 317 (20.1%) | 93 (9.7%) |
| $100,000 to $149,999 | 315 (20.0%) | 68 (7.1%) |
| $150,000 or more | 259 (16.4%) | 0 (0.0%) |
| Total | 1,579 (100.0%) | 955 (100.0%) |
Monthly Housing Cost Tiers in Rochester
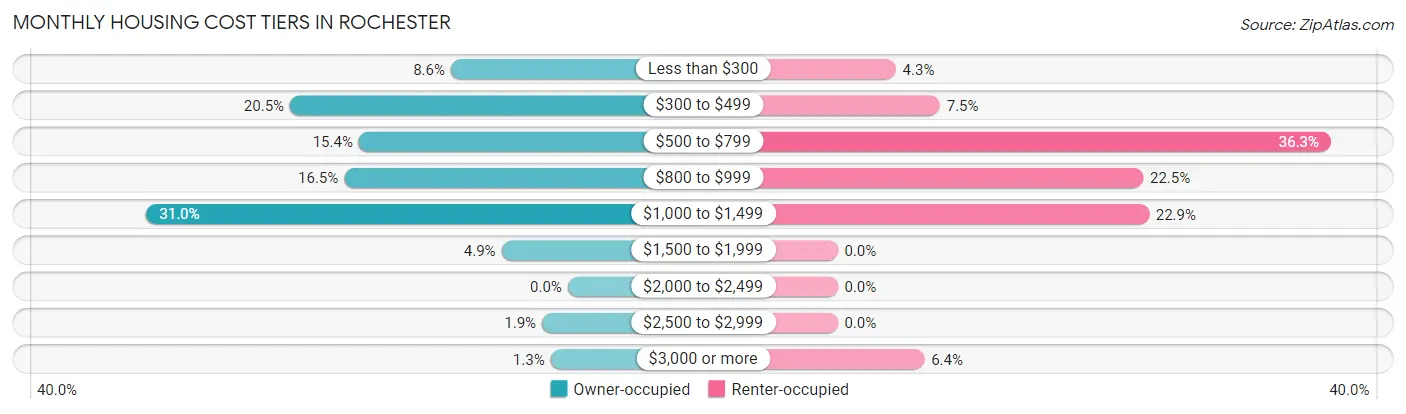
| Monthly Cost | Owner-occupied | Renter-occupied |
| Less than $300 | 136 (8.6%) | 41 (4.3%) |
| $300 to $499 | 323 (20.5%) | 72 (7.5%) |
| $500 to $799 | 243 (15.4%) | 347 (36.3%) |
| $800 to $999 | 260 (16.5%) | 215 (22.5%) |
| $1,000 to $1,499 | 490 (31.0%) | 219 (22.9%) |
| $1,500 to $1,999 | 77 (4.9%) | 0 (0.0%) |
| $2,000 to $2,499 | 0 (0.0%) | 0 (0.0%) |
| $2,500 to $2,999 | 30 (1.9%) | 0 (0.0%) |
| $3,000 or more | 20 (1.3%) | 61 (6.4%) |
| Total | 1,579 (100.0%) | 955 (100.0%) |
Physical Housing Characteristics in Rochester
Housing Structures in Rochester
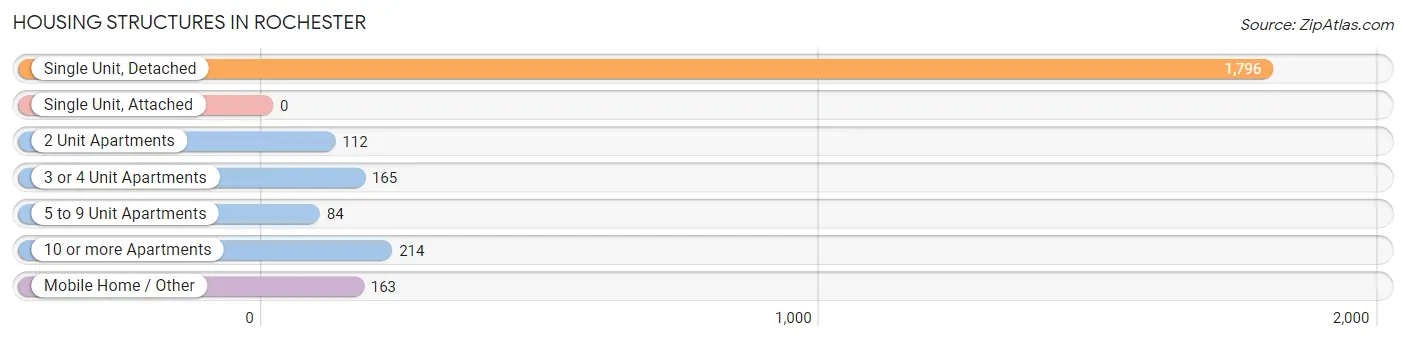
| Structure Type | # Housing Units | % Housing Units |
| Single Unit, Detached | 1,796 | 70.9% |
| Single Unit, Attached | 0 | 0.0% |
| 2 Unit Apartments | 112 | 4.4% |
| 3 or 4 Unit Apartments | 165 | 6.5% |
| 5 to 9 Unit Apartments | 84 | 3.3% |
| 10 or more Apartments | 214 | 8.5% |
| Mobile Home / Other | 163 | 6.4% |
| Total | 2,534 | 100.0% |
Housing Structures by Occupancy in Rochester
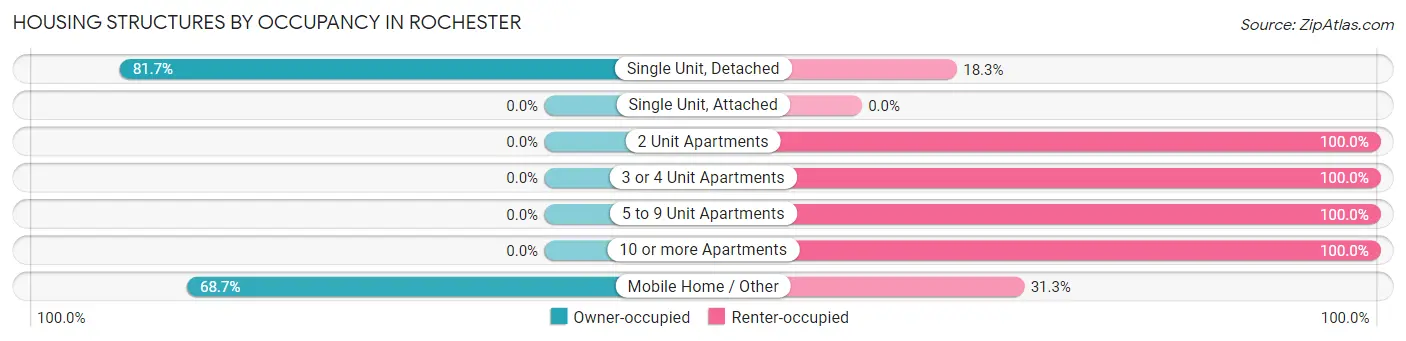
| Structure Type | Owner-occupied | Renter-occupied |
| Single Unit, Detached | 1,467 (81.7%) | 329 (18.3%) |
| Single Unit, Attached | 0 (0.0%) | 0 (0.0%) |
| 2 Unit Apartments | 0 (0.0%) | 112 (100.0%) |
| 3 or 4 Unit Apartments | 0 (0.0%) | 165 (100.0%) |
| 5 to 9 Unit Apartments | 0 (0.0%) | 84 (100.0%) |
| 10 or more Apartments | 0 (0.0%) | 214 (100.0%) |
| Mobile Home / Other | 112 (68.7%) | 51 (31.3%) |
| Total | 1,579 (62.3%) | 955 (37.7%) |
Housing Structures by Number of Rooms in Rochester
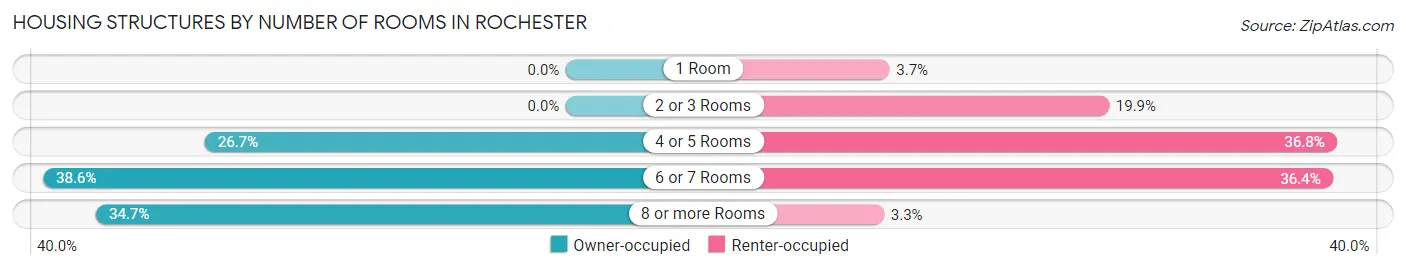
| Number of Rooms | Owner-occupied | Renter-occupied |
| 1 Room | 0 (0.0%) | 35 (3.7%) |
| 2 or 3 Rooms | 0 (0.0%) | 190 (19.9%) |
| 4 or 5 Rooms | 421 (26.7%) | 351 (36.7%) |
| 6 or 7 Rooms | 610 (38.6%) | 348 (36.4%) |
| 8 or more Rooms | 548 (34.7%) | 31 (3.3%) |
| Total | 1,579 (100.0%) | 955 (100.0%) |
Housing Structure by Heating Type in Rochester
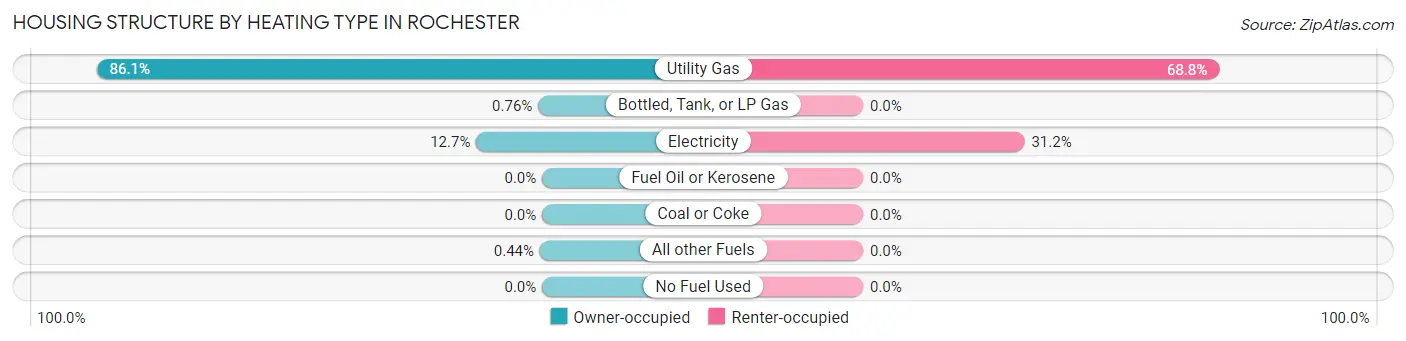
| Heating Type | Owner-occupied | Renter-occupied |
| Utility Gas | 1,359 (86.1%) | 657 (68.8%) |
| Bottled, Tank, or LP Gas | 12 (0.8%) | 0 (0.0%) |
| Electricity | 201 (12.7%) | 298 (31.2%) |
| Fuel Oil or Kerosene | 0 (0.0%) | 0 (0.0%) |
| Coal or Coke | 0 (0.0%) | 0 (0.0%) |
| All other Fuels | 7 (0.4%) | 0 (0.0%) |
| No Fuel Used | 0 (0.0%) | 0 (0.0%) |
| Total | 1,579 (100.0%) | 955 (100.0%) |
Household Vehicle Usage in Rochester
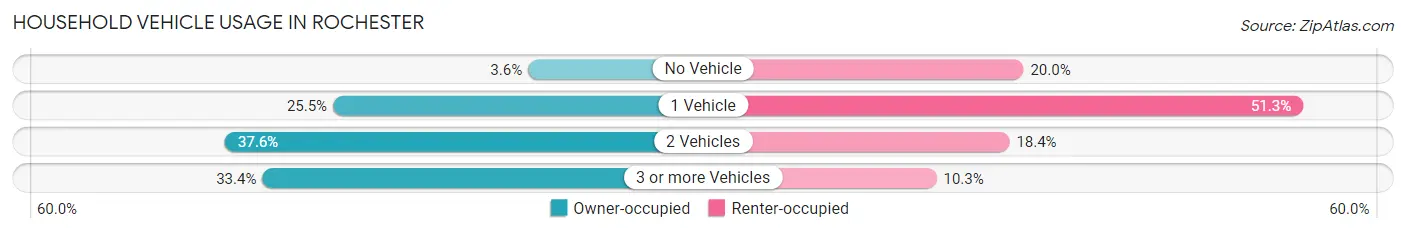
| Vehicles per Household | Owner-occupied | Renter-occupied |
| No Vehicle | 57 (3.6%) | 191 (20.0%) |
| 1 Vehicle | 402 (25.5%) | 490 (51.3%) |
| 2 Vehicles | 593 (37.6%) | 176 (18.4%) |
| 3 or more Vehicles | 527 (33.4%) | 98 (10.3%) |
| Total | 1,579 (100.0%) | 955 (100.0%) |
Real Estate & Mortgages in Rochester
Real Estate and Mortgage Overview in Rochester
| Characteristic | Without Mortgage | With Mortgage |
| Housing Units | 599 | 980 |
| Median Property Value | $106,000 | $139,700 |
| Median Household Income | $67,264 | $76 |
| Monthly Housing Costs | $436 | $20 |
| Real Estate Taxes | $811 | $47 |
Property Value by Mortgage Status in Rochester
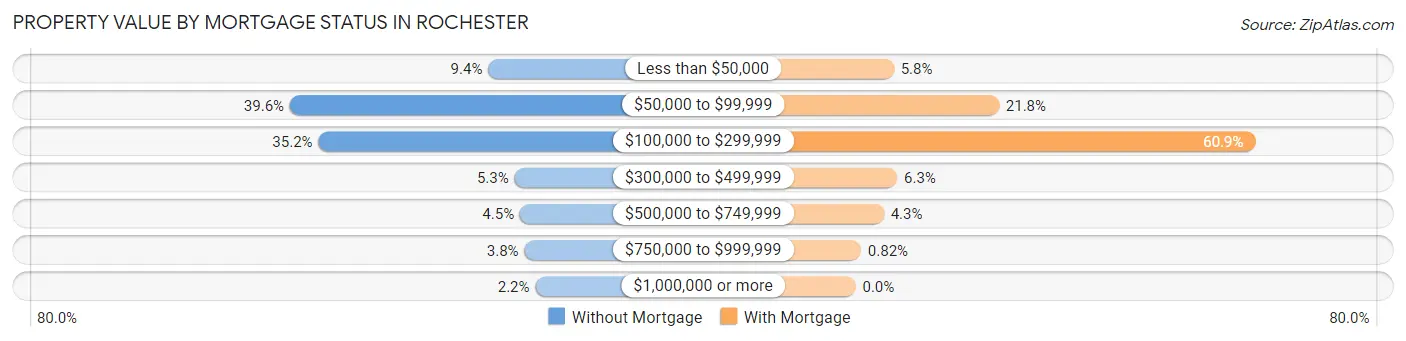
| Property Value | Without Mortgage | With Mortgage |
| Less than $50,000 | 56 (9.3%) | 57 (5.8%) |
| $50,000 to $99,999 | 237 (39.6%) | 214 (21.8%) |
| $100,000 to $299,999 | 211 (35.2%) | 597 (60.9%) |
| $300,000 to $499,999 | 32 (5.3%) | 62 (6.3%) |
| $500,000 to $749,999 | 27 (4.5%) | 42 (4.3%) |
| $750,000 to $999,999 | 23 (3.8%) | 8 (0.8%) |
| $1,000,000 or more | 13 (2.2%) | 0 (0.0%) |
| Total | 599 (100.0%) | 980 (100.0%) |
Household Income by Mortgage Status in Rochester
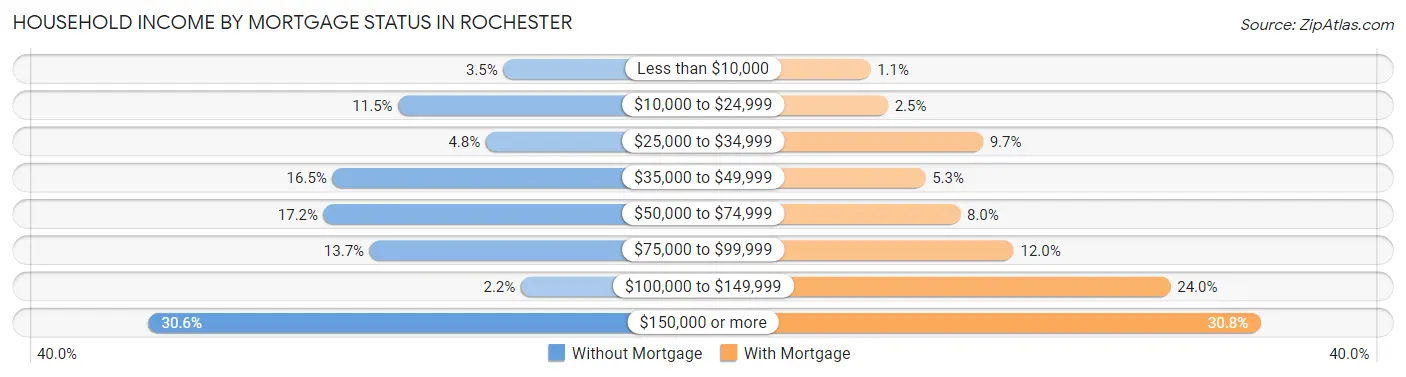
| Household Income | Without Mortgage | With Mortgage |
| Less than $10,000 | 21 (3.5%) | 11 (1.1%) |
| $10,000 to $24,999 | 69 (11.5%) | 24 (2.5%) |
| $25,000 to $34,999 | 29 (4.8%) | 95 (9.7%) |
| $35,000 to $49,999 | 99 (16.5%) | 52 (5.3%) |
| $50,000 to $74,999 | 103 (17.2%) | 78 (8.0%) |
| $75,000 to $99,999 | 82 (13.7%) | 118 (12.0%) |
| $100,000 to $149,999 | 13 (2.2%) | 235 (24.0%) |
| $150,000 or more | 183 (30.5%) | 302 (30.8%) |
| Total | 599 (100.0%) | 980 (100.0%) |
Property Value to Household Income Ratio in Rochester
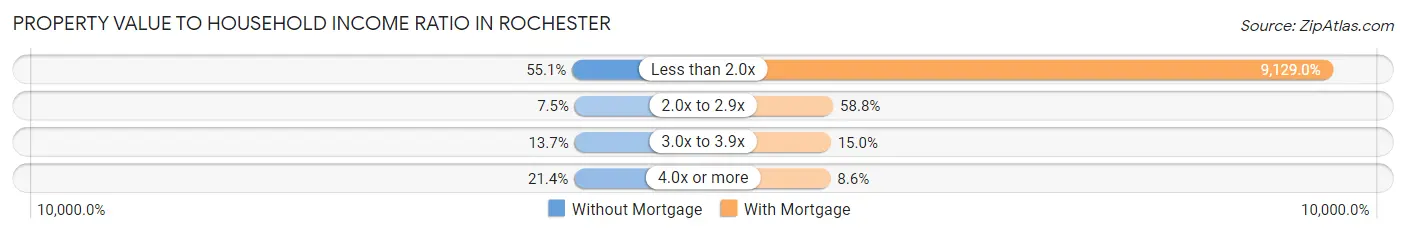
| Value-to-Income Ratio | Without Mortgage | With Mortgage |
| Less than 2.0x | 330 (55.1%) | 89,464 (9,129.0%) |
| 2.0x to 2.9x | 45 (7.5%) | 576 (58.8%) |
| 3.0x to 3.9x | 82 (13.7%) | 147 (15.0%) |
| 4.0x or more | 128 (21.4%) | 84 (8.6%) |
| Total | 599 (100.0%) | 980 (100.0%) |
Real Estate Taxes by Mortgage Status in Rochester
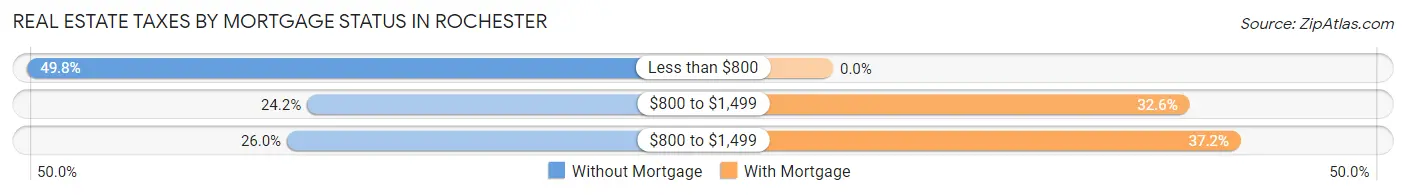
| Property Taxes | Without Mortgage | With Mortgage |
| Less than $800 | 298 (49.7%) | 0 (0.0%) |
| $800 to $1,499 | 145 (24.2%) | 319 (32.6%) |
| $800 to $1,499 | 156 (26.0%) | 365 (37.2%) |
| Total | 599 (100.0%) | 980 (100.0%) |
Health & Disability in Rochester
Health Insurance Coverage by Age in Rochester
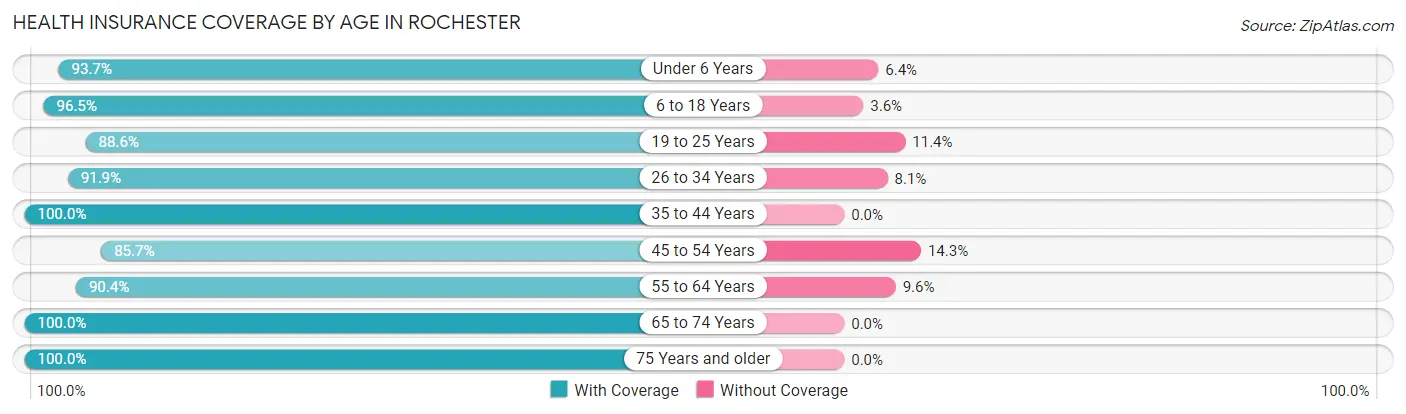
| Age Bracket | With Coverage | Without Coverage |
| Under 6 Years | 339 (93.6%) | 23 (6.4%) |
| 6 to 18 Years | 1,032 (96.5%) | 38 (3.5%) |
| 19 to 25 Years | 389 (88.6%) | 50 (11.4%) |
| 26 to 34 Years | 592 (91.9%) | 52 (8.1%) |
| 35 to 44 Years | 539 (100.0%) | 0 (0.0%) |
| 45 to 54 Years | 845 (85.7%) | 141 (14.3%) |
| 55 to 64 Years | 698 (90.4%) | 74 (9.6%) |
| 65 to 74 Years | 634 (100.0%) | 0 (0.0%) |
| 75 Years and older | 701 (100.0%) | 0 (0.0%) |
| Total | 5,769 (93.9%) | 378 (6.1%) |
Health Insurance Coverage by Citizenship Status in Rochester
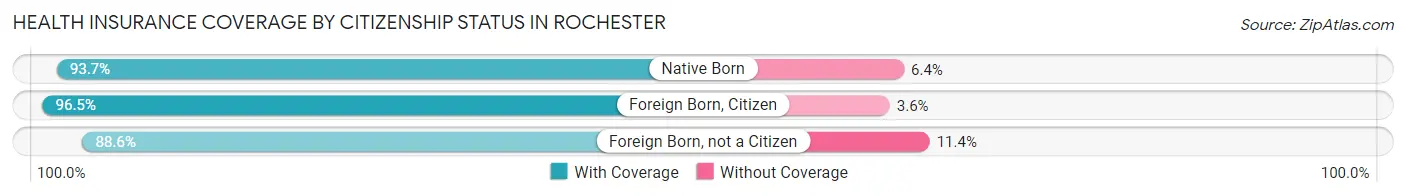
| Citizenship Status | With Coverage | Without Coverage |
| Native Born | 339 (93.6%) | 23 (6.4%) |
| Foreign Born, Citizen | 1,032 (96.5%) | 38 (3.5%) |
| Foreign Born, not a Citizen | 389 (88.6%) | 50 (11.4%) |
Health Insurance Coverage by Household Income in Rochester
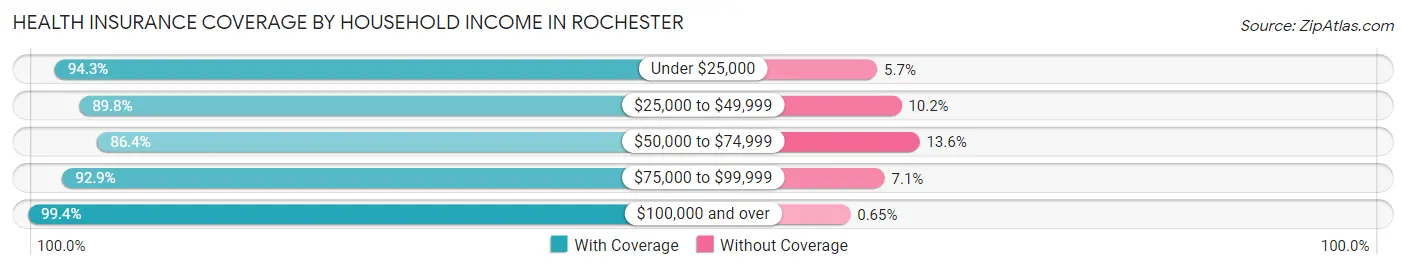
| Household Income | With Coverage | Without Coverage |
| Under $25,000 | 795 (94.3%) | 48 (5.7%) |
| $25,000 to $49,999 | 815 (89.8%) | 93 (10.2%) |
| $50,000 to $74,999 | 958 (86.4%) | 151 (13.6%) |
| $75,000 to $99,999 | 906 (92.9%) | 69 (7.1%) |
| $100,000 and over | 2,282 (99.4%) | 15 (0.6%) |
Public vs Private Health Insurance Coverage by Age in Rochester
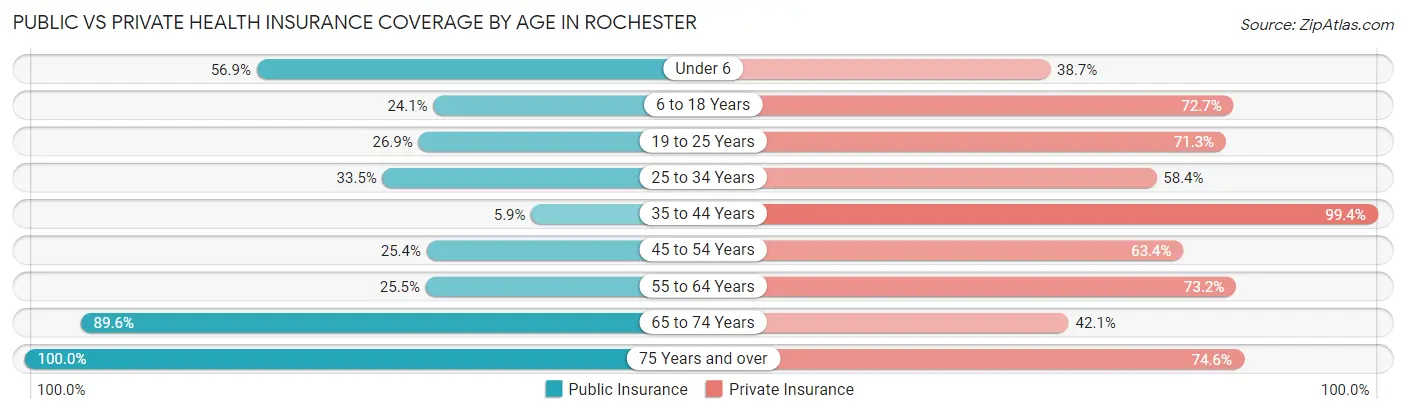
| Age Bracket | Public Insurance | Private Insurance |
| Under 6 | 206 (56.9%) | 140 (38.7%) |
| 6 to 18 Years | 258 (24.1%) | 778 (72.7%) |
| 19 to 25 Years | 118 (26.9%) | 313 (71.3%) |
| 25 to 34 Years | 216 (33.5%) | 376 (58.4%) |
| 35 to 44 Years | 32 (5.9%) | 536 (99.4%) |
| 45 to 54 Years | 250 (25.4%) | 625 (63.4%) |
| 55 to 64 Years | 197 (25.5%) | 565 (73.2%) |
| 65 to 74 Years | 568 (89.6%) | 267 (42.1%) |
| 75 Years and over | 701 (100.0%) | 523 (74.6%) |
| Total | 2,546 (41.4%) | 4,123 (67.1%) |
Disability Status by Sex by Age in Rochester
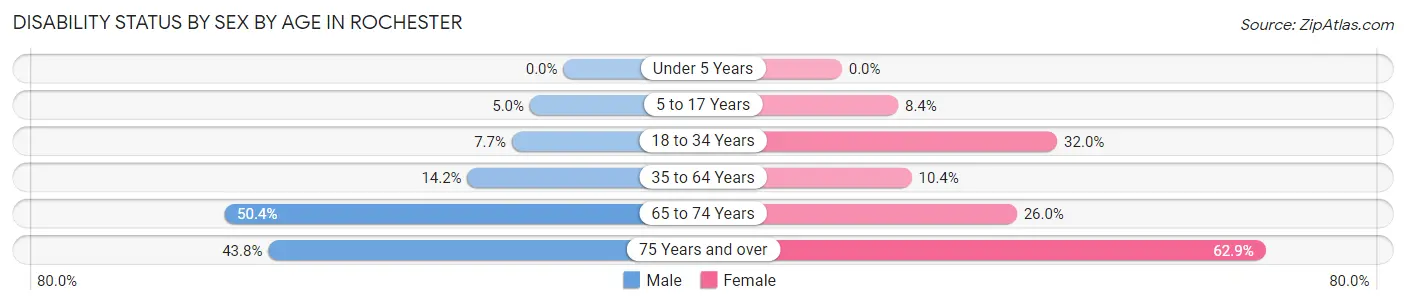
| Age Bracket | Male | Female |
| Under 5 Years | 0 (0.0%) | 0 (0.0%) |
| 5 to 17 Years | 32 (5.0%) | 40 (8.4%) |
| 18 to 34 Years | 47 (7.6%) | 150 (32.0%) |
| 35 to 64 Years | 176 (14.2%) | 110 (10.4%) |
| 65 to 74 Years | 137 (50.4%) | 94 (26.0%) |
| 75 Years and over | 78 (43.8%) | 329 (62.9%) |
Disability Class by Sex by Age in Rochester
Disability Class: Hearing Difficulty
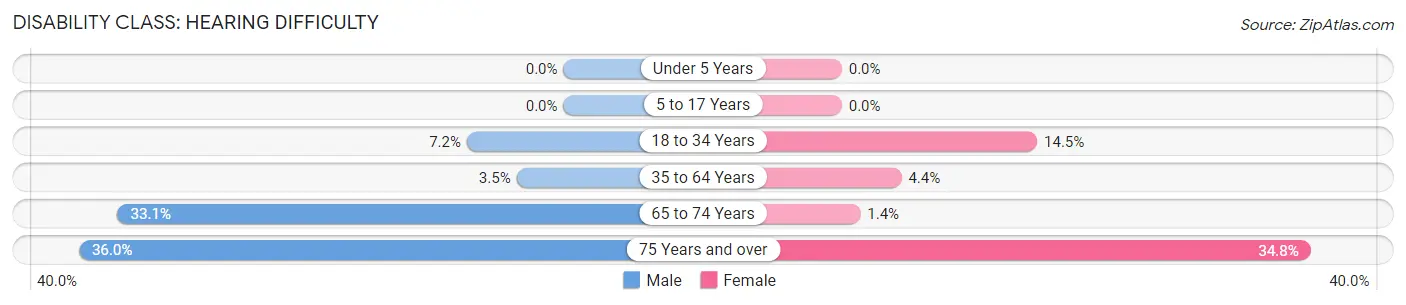
| Age Bracket | Male | Female |
| Under 5 Years | 0 (0.0%) | 0 (0.0%) |
| 5 to 17 Years | 0 (0.0%) | 0 (0.0%) |
| 18 to 34 Years | 44 (7.2%) | 68 (14.5%) |
| 35 to 64 Years | 43 (3.5%) | 47 (4.4%) |
| 65 to 74 Years | 90 (33.1%) | 5 (1.4%) |
| 75 Years and over | 64 (36.0%) | 182 (34.8%) |
Disability Class: Vision Difficulty
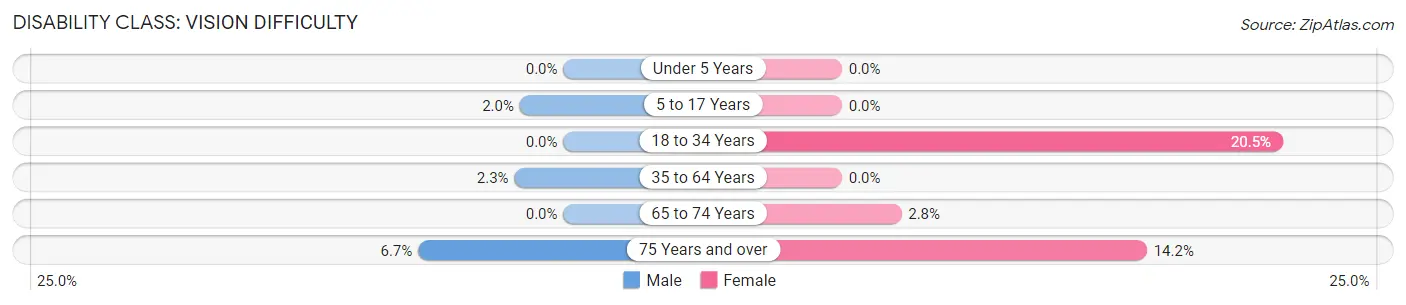
| Age Bracket | Male | Female |
| Under 5 Years | 0 (0.0%) | 0 (0.0%) |
| 5 to 17 Years | 13 (2.0%) | 0 (0.0%) |
| 18 to 34 Years | 0 (0.0%) | 96 (20.5%) |
| 35 to 64 Years | 28 (2.3%) | 0 (0.0%) |
| 65 to 74 Years | 0 (0.0%) | 10 (2.8%) |
| 75 Years and over | 12 (6.7%) | 74 (14.1%) |
Disability Class: Cognitive Difficulty
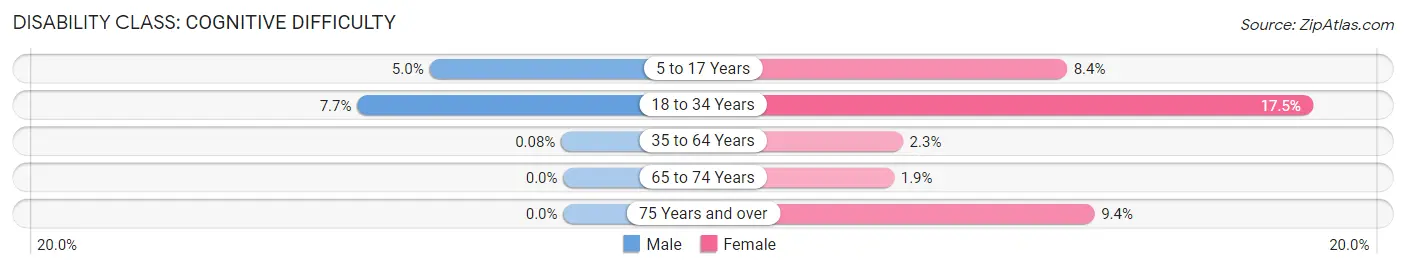
| Age Bracket | Male | Female |
| 5 to 17 Years | 32 (5.0%) | 40 (8.4%) |
| 18 to 34 Years | 47 (7.6%) | 82 (17.5%) |
| 35 to 64 Years | 1 (0.1%) | 24 (2.3%) |
| 65 to 74 Years | 0 (0.0%) | 7 (1.9%) |
| 75 Years and over | 0 (0.0%) | 49 (9.4%) |
Disability Class: Ambulatory Difficulty
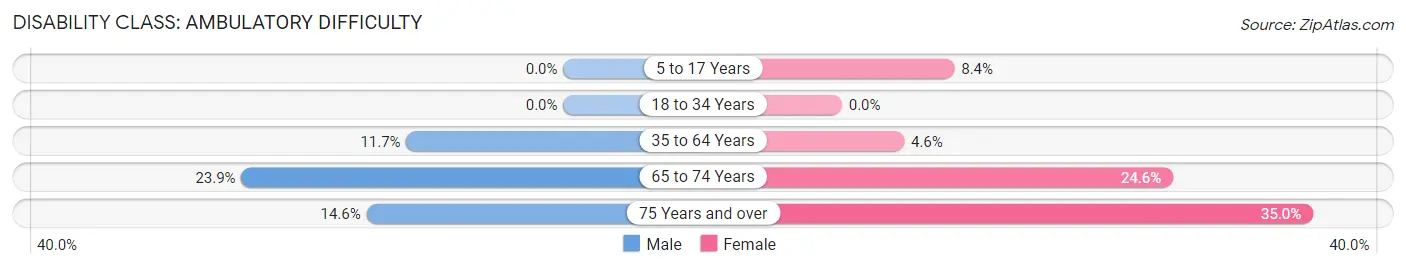
| Age Bracket | Male | Female |
| 5 to 17 Years | 0 (0.0%) | 40 (8.4%) |
| 18 to 34 Years | 0 (0.0%) | 0 (0.0%) |
| 35 to 64 Years | 144 (11.7%) | 49 (4.6%) |
| 65 to 74 Years | 65 (23.9%) | 89 (24.6%) |
| 75 Years and over | 26 (14.6%) | 183 (35.0%) |
Disability Class: Self-Care Difficulty
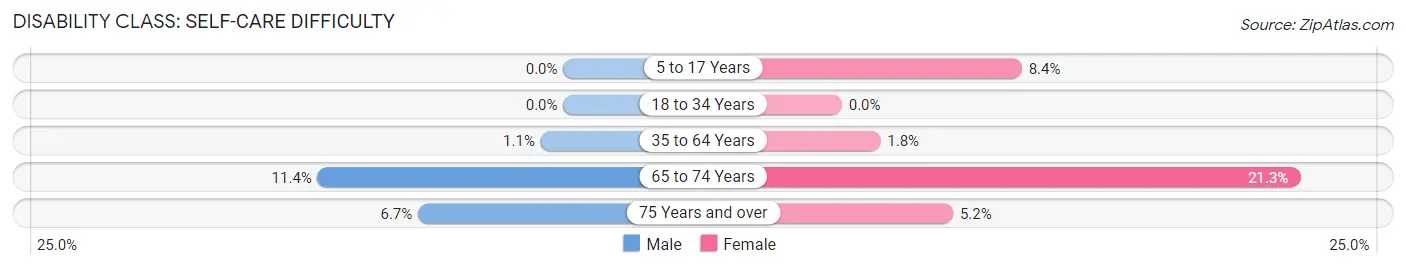
| Age Bracket | Male | Female |
| 5 to 17 Years | 0 (0.0%) | 40 (8.4%) |
| 18 to 34 Years | 0 (0.0%) | 0 (0.0%) |
| 35 to 64 Years | 13 (1.1%) | 19 (1.8%) |
| 65 to 74 Years | 31 (11.4%) | 77 (21.3%) |
| 75 Years and over | 12 (6.7%) | 27 (5.2%) |
Technology Access in Rochester
Computing Device Access in Rochester
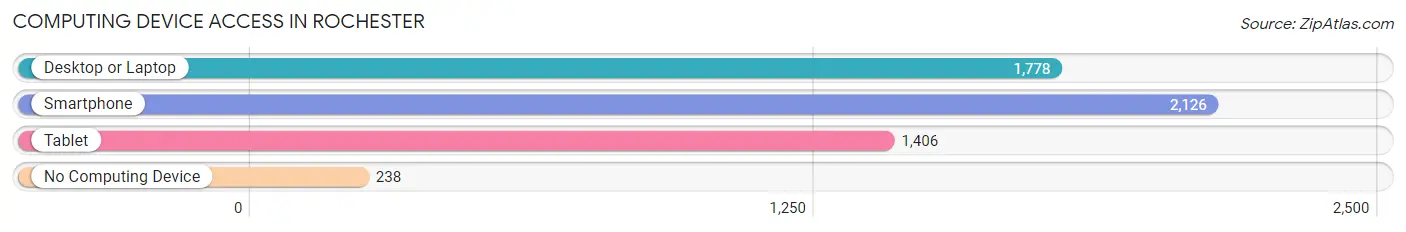
| Device Type | # Households | % Households |
| Desktop or Laptop | 1,778 | 70.2% |
| Smartphone | 2,126 | 83.9% |
| Tablet | 1,406 | 55.5% |
| No Computing Device | 238 | 9.4% |
| Total | 2,534 | 100.0% |
Internet Access in Rochester
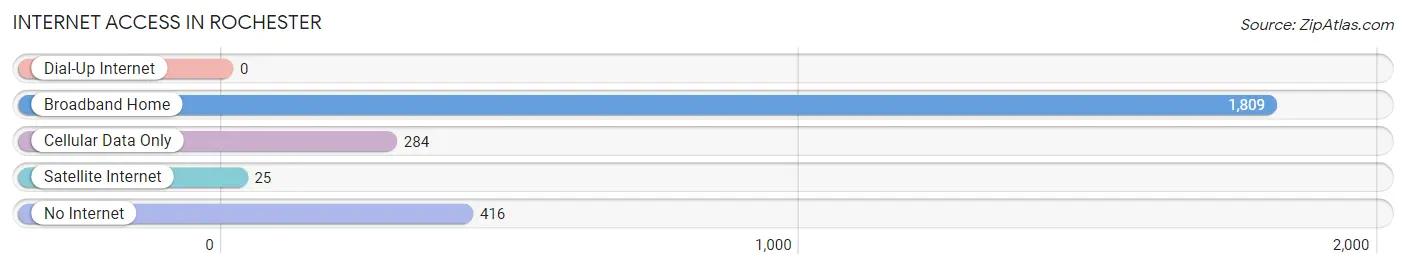
| Internet Type | # Households | % Households |
| Dial-Up Internet | 0 | 0.0% |
| Broadband Home | 1,809 | 71.4% |
| Cellular Data Only | 284 | 11.2% |
| Satellite Internet | 25 | 1.0% |
| No Internet | 416 | 16.4% |
| Total | 2,534 | 100.0% |
Rochester Summary
Rochester, Indiana is a small city located in Fulton County, Indiana. It is situated in the northern part of the state, approximately 50 miles south of South Bend and 60 miles north of Indianapolis. The city has a population of approximately 6,000 people and is the county seat of Fulton County.
History
Rochester was founded in 1835 by a group of settlers from New York. The city was named after Rochester, New York, the hometown of many of the settlers. The city was incorporated in 1853 and has since grown to become the largest city in Fulton County.
Rochester has a rich history of industry and agriculture. In the late 19th century, the city was home to several factories, including a woolen mill, a flour mill, and a sawmill. The city also had a thriving agricultural industry, with many farmers growing corn, wheat, and other crops.
In the early 20th century, Rochester was a popular tourist destination, with many visitors coming to the city to enjoy its natural beauty and recreational activities. The city was also home to several resorts, including the Rochester Hotel and the Rochester Inn.
Geography
Rochester is located in the northern part of Indiana, approximately 50 miles south of South Bend and 60 miles north of Indianapolis. The city is situated on the banks of the Tippecanoe River, which flows through the city and provides a scenic backdrop. The city is surrounded by rolling hills and farmland, and is home to several parks and recreational areas.
Economy
Rochester’s economy is largely based on agriculture and manufacturing. The city is home to several factories, including a steel mill, a paper mill, and a plastics plant. The city also has a thriving agricultural industry, with many farmers growing corn, wheat, and other crops.
The city is also home to several small businesses, including restaurants, retail stores, and service providers. The city is also home to several educational institutions, including a community college and a vocational school.
Demographics
As of the 2010 census, Rochester had a population of 6,000 people. The city has a median age of 38.7 years, and the median household income is $41,000. The city is predominantly white, with approximately 90% of the population identifying as white. The city also has a small Hispanic population, with approximately 5% of the population identifying as Hispanic or Latino.
Rochester is a small city with a rich history and a vibrant economy. The city is home to several factories, agricultural businesses, and small businesses, and is a popular tourist destination. The city is also home to several educational institutions, and has a diverse population.
Common Questions
What is the Total Population of Rochester?
Total Population of Rochester is 6,236.
What is the Total Male Population of Rochester?
Total Male Population of Rochester is 3,148.
What is the Total Female Population of Rochester?
Total Female Population of Rochester is 3,088.
What is the Ratio of Males per 100 Females in Rochester?
There are 101.94 Males per 100 Females in Rochester.
What is the Ratio of Females per 100 Males in Rochester?
There are 98.09 Females per 100 Males in Rochester.
What is the Median Population Age in Rochester?
Median Population Age in Rochester is 45.1 Years.
What is the Average Family Size in Rochester
Average Family Size in Rochester is 3.1 People.
What is the Average Household Size in Rochester
Average Household Size in Rochester is 2.4 People.
What is Per Capita Income in Rochester?
Per Capita income in Rochester is $33,346.
What is the Median Family Income in Rochester?
Median Family Income in Rochester is $79,234.
What is the Median Household income in Rochester?
Median Household Income in Rochester is $62,885.
What is Income or Wage Gap in Rochester?
Income or Wage Gap in Rochester is 14.9%.
Women in Rochester earn 85.1 cents for every dollar earned by a man.
What is Inequality or Gini Index in Rochester?
Inequality or Gini Index in Rochester is 0.41.
How Large is the Labor Force in Rochester?
There are 2,928 People in the Labor Forcein in Rochester.
What is the Percentage of People in the Labor Force in Rochester?
58.3% of People are in the Labor Force in Rochester.
What is the Unemployment Rate in Rochester?
Unemployment Rate in Rochester is 6.5%.