Cheriton, VA
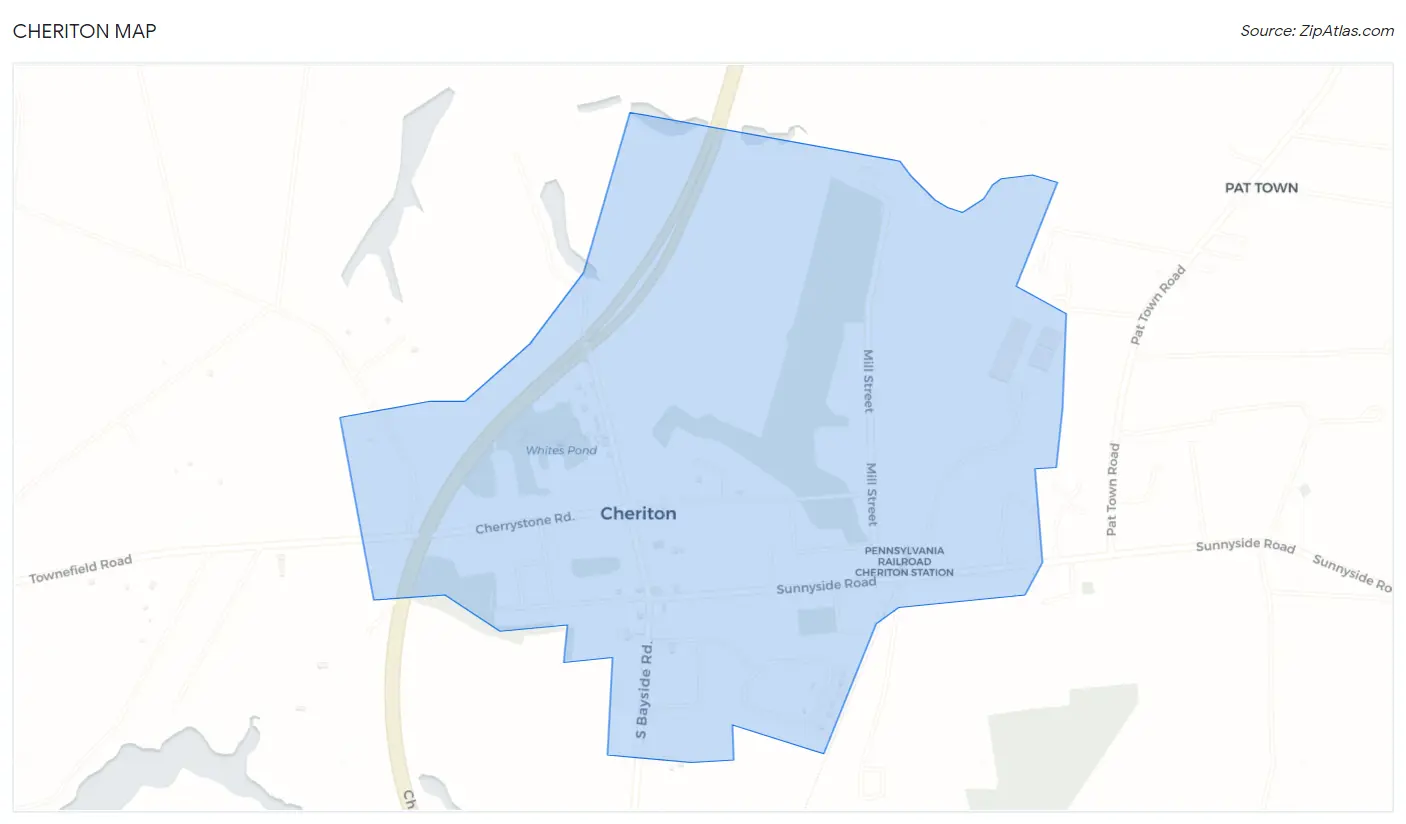
Cheriton Map
Cheriton Overview
562
TOTAL POPULATION
233
MALE POPULATION
329
FEMALE POPULATION
70.82
MALES / 100 FEMALES
141.20
FEMALES / 100 MALES
50.3
MEDIAN AGE
2.3
AVG FAMILY SIZE
2.1
AVG HOUSEHOLD SIZE
$24,196
PER CAPITA INCOME
$36,136
AVG FAMILY INCOME
$29,077
AVG HOUSEHOLD INCOME
2.1%
WAGE / INCOME GAP [ % ]
97.9¢/ $1
WAGE / INCOME GAP [ $ ]
0.44
INEQUALITY / GINI INDEX
213
LABOR FORCE [ PEOPLE ]
42.2%
PERCENT IN LABOR FORCE
2.3%
UNEMPLOYMENT RATE
Cheriton Zip Codes
Cheriton Area Codes
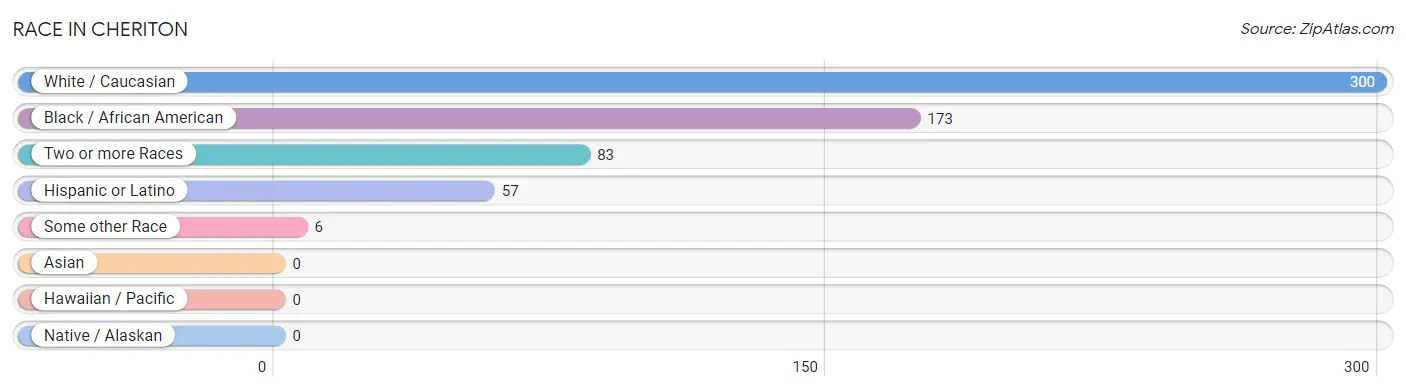
Race in Cheriton
The most populous races in Cheriton are White / Caucasian (300 | 53.4%), Black / African American (173 | 30.8%), and Two or more Races (83 | 14.8%).
| Race | # Population | % Population |
| Asian | 0 | 0.0% |
| Black / African American | 173 | 30.8% |
| Hawaiian / Pacific | 0 | 0.0% |
| Hispanic or Latino | 57 | 10.1% |
| Native / Alaskan | 0 | 0.0% |
| White / Caucasian | 300 | 53.4% |
| Two or more Races | 83 | 14.8% |
| Some other Race | 6 | 1.1% |
| Total | 562 | 100.0% |
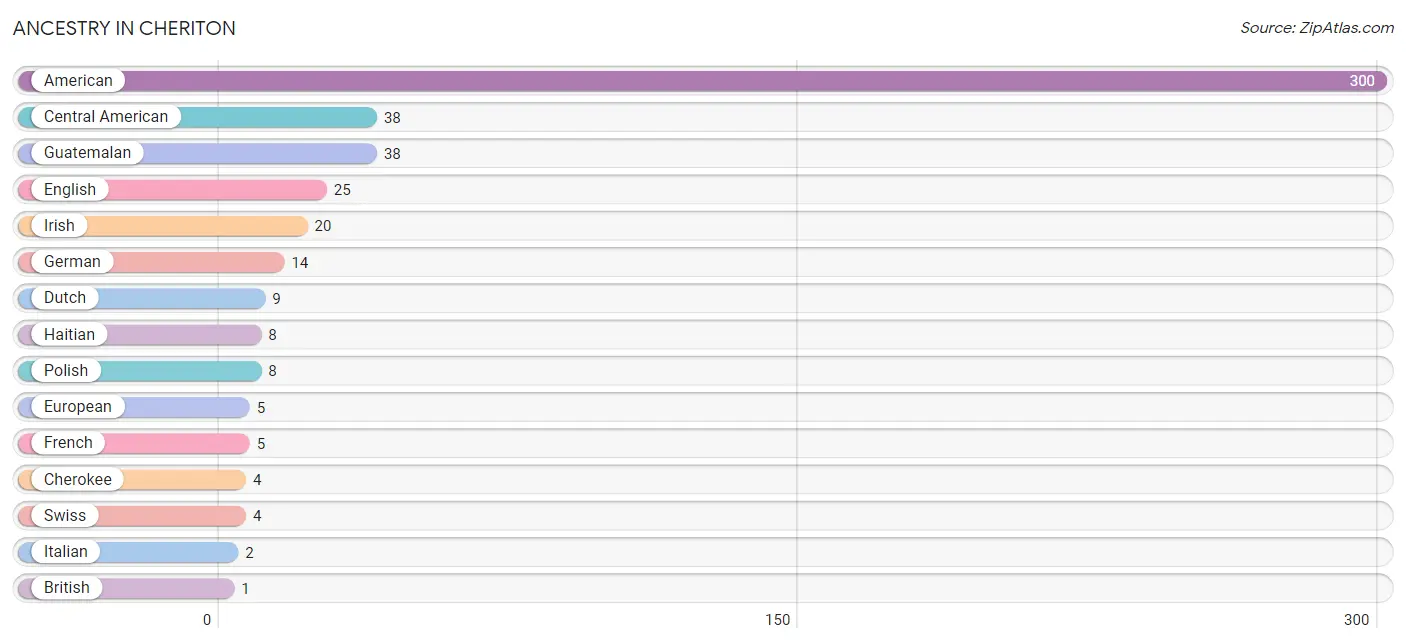
Ancestry in Cheriton
The most populous ancestries reported in Cheriton are American (300 | 53.4%), Central American (38 | 6.8%), Guatemalan (38 | 6.8%), English (25 | 4.4%), and Irish (20 | 3.6%), together accounting for 74.9% of all Cheriton residents.
| Ancestry | # Population | % Population |
| American | 300 | 53.4% |
| British | 1 | 0.2% |
| Canadian | 1 | 0.2% |
| Central American | 38 | 6.8% |
| Cherokee | 4 | 0.7% |
| Dutch | 9 | 1.6% |
| English | 25 | 4.4% |
| European | 5 | 0.9% |
| French | 5 | 0.9% |
| French American Indian | 1 | 0.2% |
| German | 14 | 2.5% |
| Guatemalan | 38 | 6.8% |
| Haitian | 8 | 1.4% |
| Irish | 20 | 3.6% |
| Iroquois | 1 | 0.2% |
| Italian | 2 | 0.4% |
| Polish | 8 | 1.4% |
| Swiss | 4 | 0.7% | View All 18 Rows |
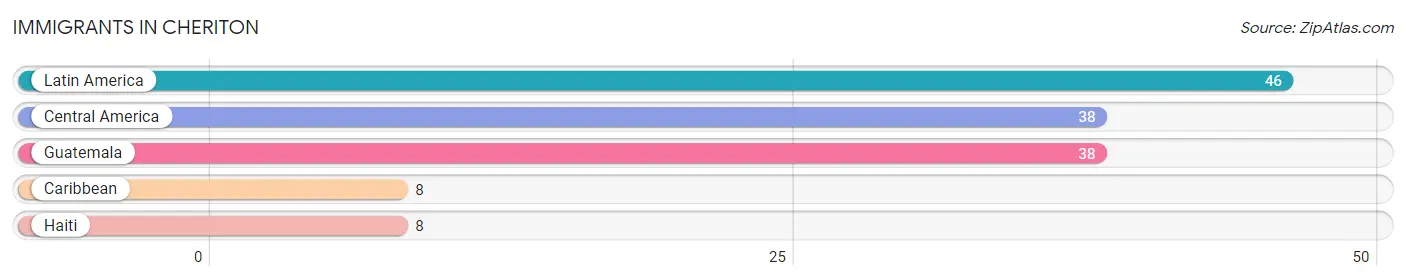
Immigrants in Cheriton
The most numerous immigrant groups reported in Cheriton came from Latin America (46 | 8.2%), Central America (38 | 6.8%), Guatemala (38 | 6.8%), Caribbean (8 | 1.4%), and Haiti (8 | 1.4%), together accounting for 24.5% of all Cheriton residents.
| Immigration Origin | # Population | % Population |
| Caribbean | 8 | 1.4% |
| Central America | 38 | 6.8% |
| Guatemala | 38 | 6.8% |
| Haiti | 8 | 1.4% |
| Latin America | 46 | 8.2% | View All 5 Rows |
Sex and Age in Cheriton
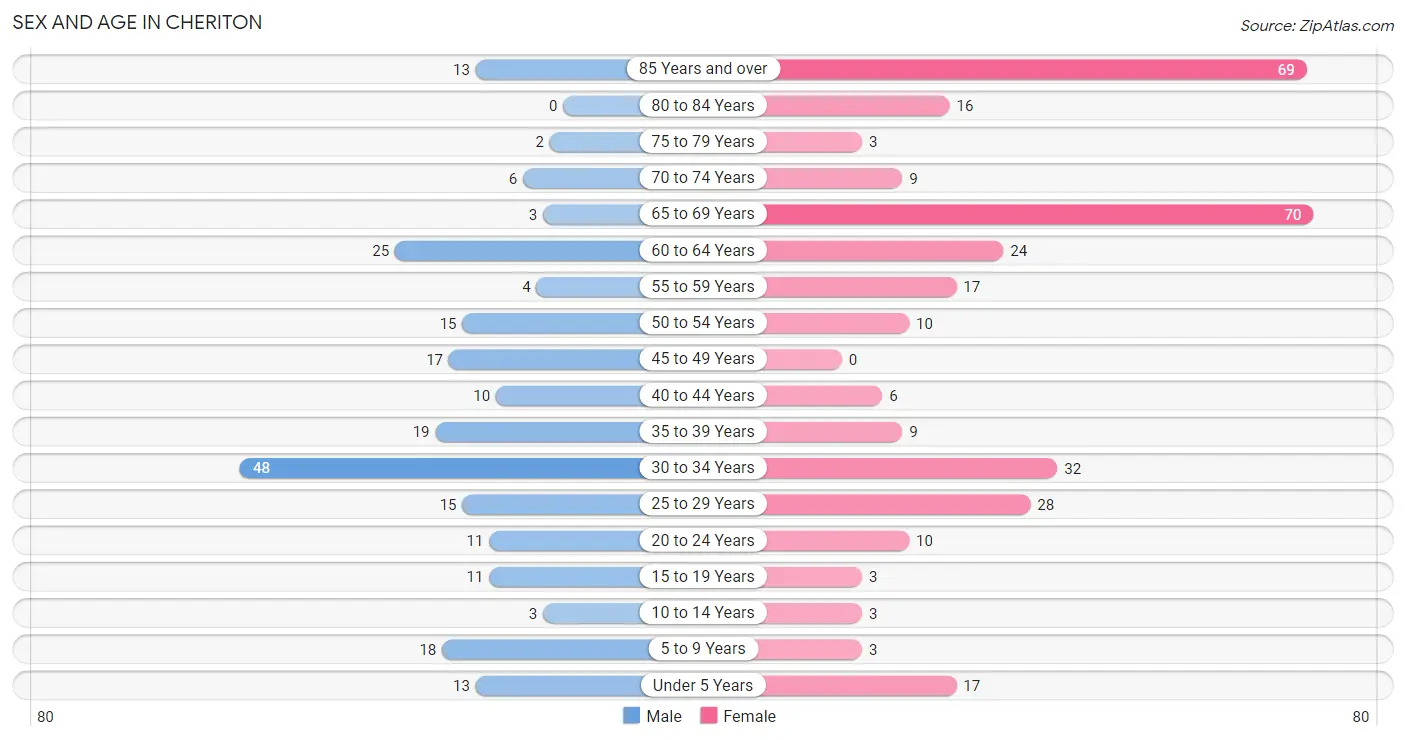
Sex and Age in Cheriton
The most populous age groups in Cheriton are 30 to 34 Years (48 | 20.6%) for men and 65 to 69 Years (70 | 21.3%) for women.
| Age Bracket | Male | Female |
| Under 5 Years | 13 (5.6%) | 17 (5.2%) |
| 5 to 9 Years | 18 (7.7%) | 3 (0.9%) |
| 10 to 14 Years | 3 (1.3%) | 3 (0.9%) |
| 15 to 19 Years | 11 (4.7%) | 3 (0.9%) |
| 20 to 24 Years | 11 (4.7%) | 10 (3.0%) |
| 25 to 29 Years | 15 (6.4%) | 28 (8.5%) |
| 30 to 34 Years | 48 (20.6%) | 32 (9.7%) |
| 35 to 39 Years | 19 (8.2%) | 9 (2.7%) |
| 40 to 44 Years | 10 (4.3%) | 6 (1.8%) |
| 45 to 49 Years | 17 (7.3%) | 0 (0.0%) |
| 50 to 54 Years | 15 (6.4%) | 10 (3.0%) |
| 55 to 59 Years | 4 (1.7%) | 17 (5.2%) |
| 60 to 64 Years | 25 (10.7%) | 24 (7.3%) |
| 65 to 69 Years | 3 (1.3%) | 70 (21.3%) |
| 70 to 74 Years | 6 (2.6%) | 9 (2.7%) |
| 75 to 79 Years | 2 (0.9%) | 3 (0.9%) |
| 80 to 84 Years | 0 (0.0%) | 16 (4.9%) |
| 85 Years and over | 13 (5.6%) | 69 (21.0%) |
| Total | 233 (100.0%) | 329 (100.0%) |
Families and Households in Cheriton
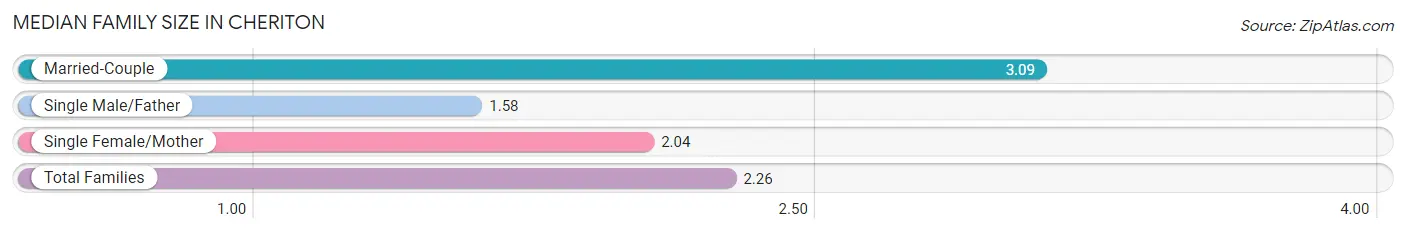
Median Family Size in Cheriton
The median family size in Cheriton is 2.26 persons per family, with married-couple families (45 | 25.6%) accounting for the largest median family size of 3.09 persons per family. On the other hand, single male/father families (19 | 10.8%) represent the smallest median family size with 1.58 persons per family.
| Family Type | # Families | Family Size |
| Married-Couple | 45 (25.6%) | 3.09 |
| Single Male/Father | 19 (10.8%) | 1.58 |
| Single Female/Mother | 112 (63.6%) | 2.04 |
| Total Families | 176 (100.0%) | 2.26 |
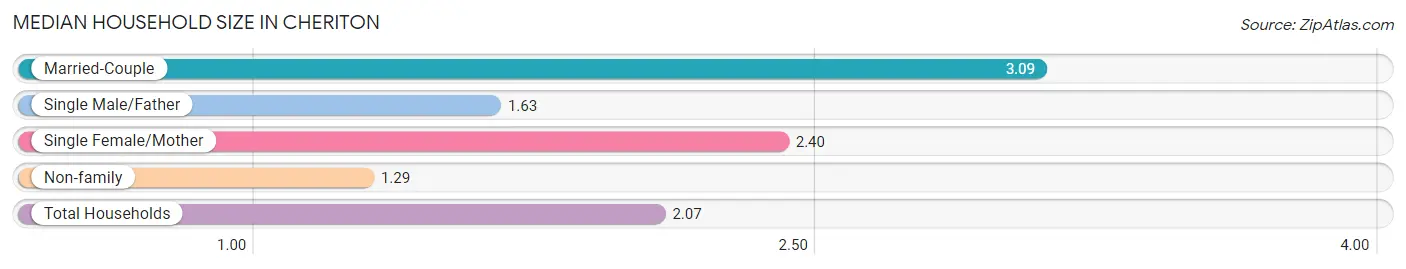
Median Household Size in Cheriton
The median household size in Cheriton is 2.07 persons per household, with married-couple households (45 | 16.6%) accounting for the largest median household size of 3.09 persons per household. non-family households (95 | 35.1%) represent the smallest median household size with 1.29 persons per household.
| Household Type | # Households | Household Size |
| Married-Couple | 45 (16.6%) | 3.09 |
| Single Male/Father | 19 (7.0%) | 1.63 |
| Single Female/Mother | 112 (41.3%) | 2.40 |
| Non-family | 95 (35.1%) | 1.29 |
| Total Households | 271 (100.0%) | 2.07 |
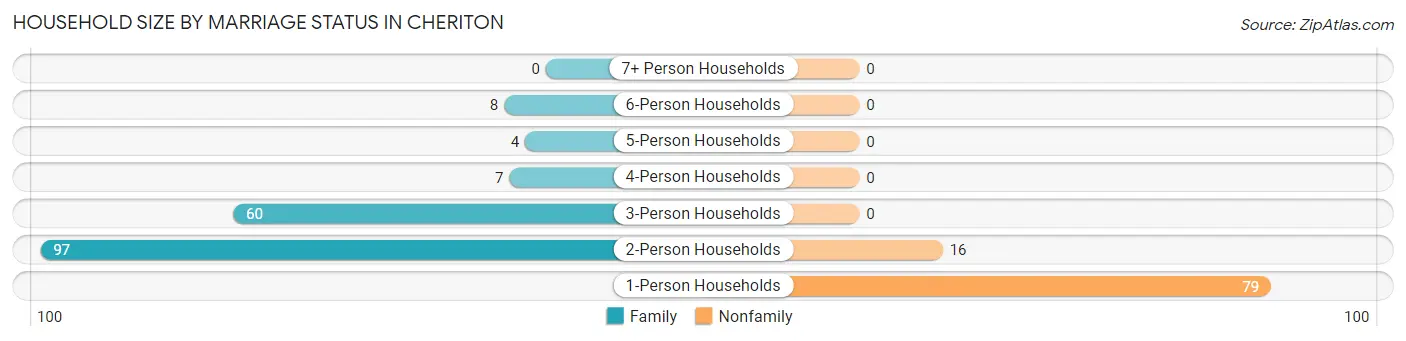
Household Size by Marriage Status in Cheriton
Out of a total of 271 households in Cheriton, 176 (64.9%) are family households, while 95 (35.1%) are nonfamily households. The most numerous type of family households are 2-person households, comprising 97, and the most common type of nonfamily households are 1-person households, comprising 79.
| Household Size | Family Households | Nonfamily Households |
| 1-Person Households | - | 79 (29.1%) |
| 2-Person Households | 97 (35.8%) | 16 (5.9%) |
| 3-Person Households | 60 (22.1%) | 0 (0.0%) |
| 4-Person Households | 7 (2.6%) | 0 (0.0%) |
| 5-Person Households | 4 (1.5%) | 0 (0.0%) |
| 6-Person Households | 8 (2.9%) | 0 (0.0%) |
| 7+ Person Households | 0 (0.0%) | 0 (0.0%) |
| Total | 176 (64.9%) | 95 (35.1%) |
Female Fertility in Cheriton
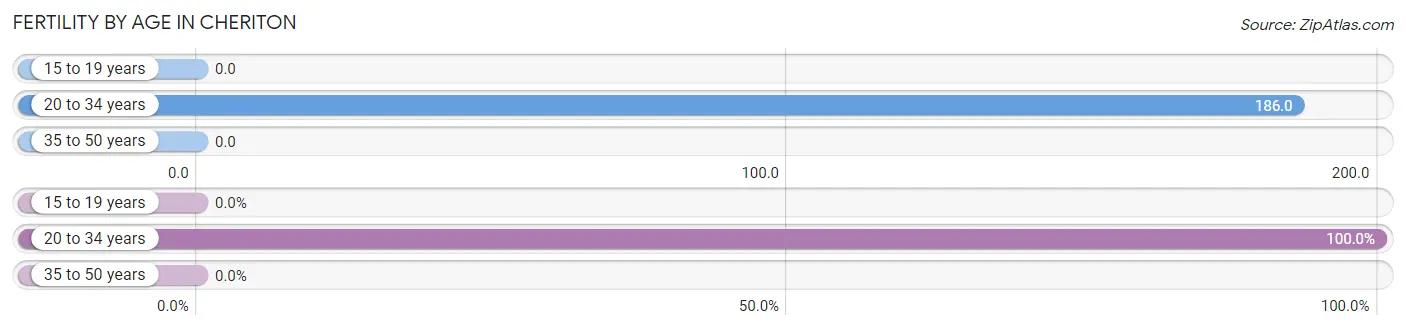
Fertility by Age in Cheriton
Average fertility rate in Cheriton is 148.0 births per 1,000 women. Women in the age bracket of 20 to 34 years have the highest fertility rate with 186.0 births per 1,000 women. Women in the age bracket of 20 to 34 years acount for 100.0% of all women with births.
| Age Bracket | Women with Births | Births / 1,000 Women |
| 15 to 19 years | 0 (0.0%) | 0.0 |
| 20 to 34 years | 13 (100.0%) | 186.0 |
| 35 to 50 years | 0 (0.0%) | 0.0 |
| Total | 13 (100.0%) | 148.0 |
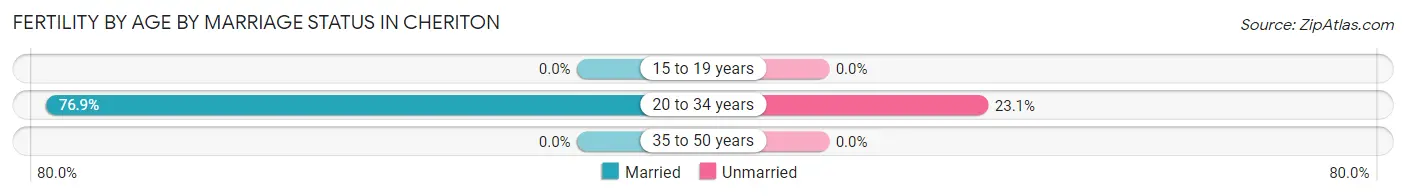
Fertility by Age by Marriage Status in Cheriton
76.9% of women with births (13) in Cheriton are married. The highest percentage of unmarried women with births falls into 20 to 34 years age bracket with 23.1% of them unmarried at the time of birth, while the lowest percentage of unmarried women with births belong to 20 to 34 years age bracket with 23.1% of them unmarried.
| Age Bracket | Married | Unmarried |
| 15 to 19 years | 0 (0.0%) | 0 (0.0%) |
| 20 to 34 years | 10 (76.9%) | 3 (23.1%) |
| 35 to 50 years | 0 (0.0%) | 0 (0.0%) |
| Total | 10 (76.9%) | 3 (23.1%) |
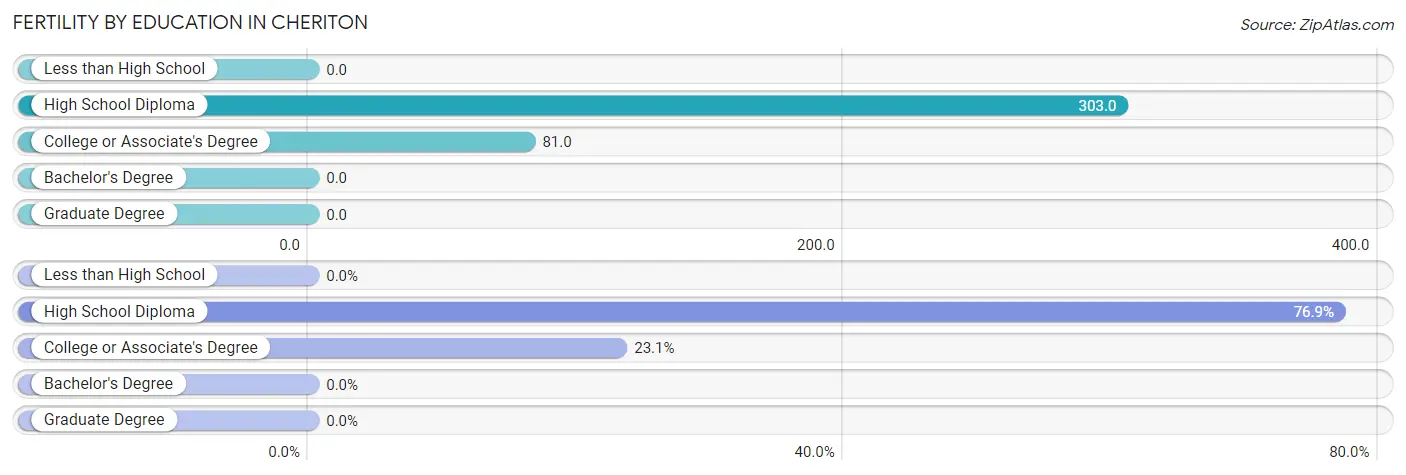
Fertility by Education in Cheriton
| Educational Attainment | Women with Births | Births / 1,000 Women |
| Less than High School | 0 (0.0%) | 0.0 |
| High School Diploma | 10 (76.9%) | 303.0 |
| College or Associate's Degree | 3 (23.1%) | 81.0 |
| Bachelor's Degree | 0 (0.0%) | 0.0 |
| Graduate Degree | 0 (0.0%) | 0.0 |
| Total | 13 (100.0%) | 148.0 |
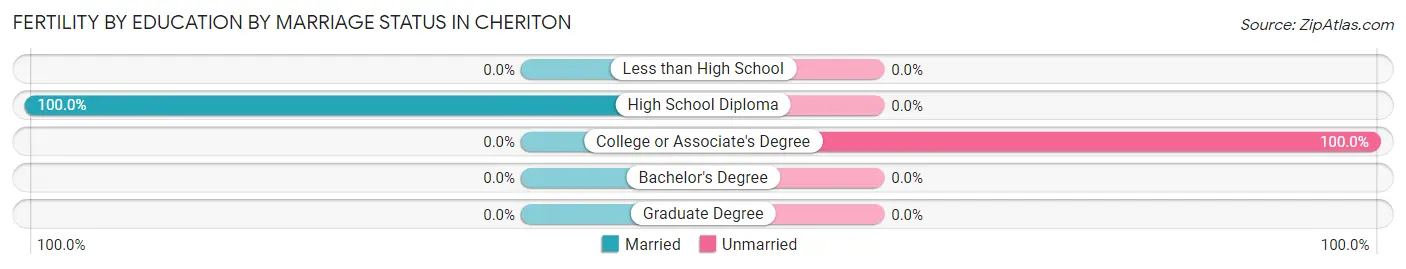
Fertility by Education by Marriage Status in Cheriton
23.1% of women with births in Cheriton are unmarried. Women with the educational attainment of high school diploma are most likely to be married with 100.0% of them married at childbirth, while women with the educational attainment of college or associate's degree are least likely to be married with 100.0% of them unmarried at childbirth.
| Educational Attainment | Married | Unmarried |
| Less than High School | 0 (0.0%) | 0 (0.0%) |
| High School Diploma | 10 (100.0%) | 0 (0.0%) |
| College or Associate's Degree | 0 (0.0%) | 3 (100.0%) |
| Bachelor's Degree | 0 (0.0%) | 0 (0.0%) |
| Graduate Degree | 0 (0.0%) | 0 (0.0%) |
| Total | 10 (76.9%) | 3 (23.1%) |
Income in Cheriton
Income Overview in Cheriton
Per Capita Income in Cheriton is $24,196, while median incomes of families and households are $36,136 and $29,077 respectively.
| Characteristic | Number | Measure |
| Per Capita Income | 562 | $24,196 |
| Median Family Income | 176 | $36,136 |
| Mean Family Income | 176 | $43,377 |
| Median Household Income | 271 | $29,077 |
| Mean Household Income | 271 | $44,047 |
| Income Deficit | 176 | $0 |
| Wage / Income Gap (%) | 562 | 2.13% |
| Wage / Income Gap ($) | 562 | 97.87¢ per $1 |
| Gini / Inequality Index | 562 | 0.44 |
Earnings by Sex in Cheriton
Average Earnings in Cheriton are $30,313, $30,781 for men and $30,125 for women, a difference of 2.1%.
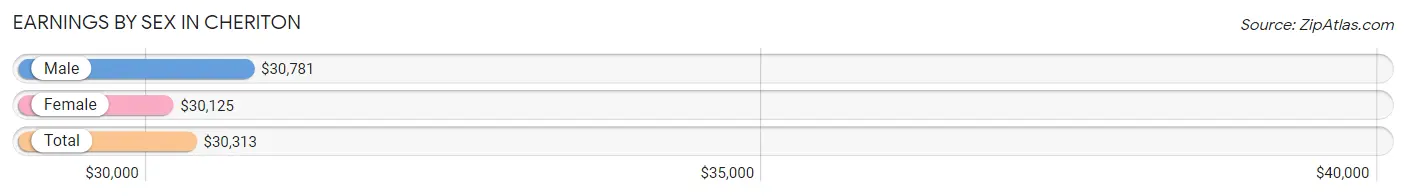
| Sex | Number | Average Earnings |
| Male | 119 (51.5%) | $30,781 |
| Female | 112 (48.5%) | $30,125 |
| Total | 231 (100.0%) | $30,313 |
Earnings by Sex by Income Bracket in Cheriton
The most common earnings brackets in Cheriton are $25,000 to $29,999 for men (45 | 37.8%) and $25,000 to $29,999 for women (32 | 28.6%).
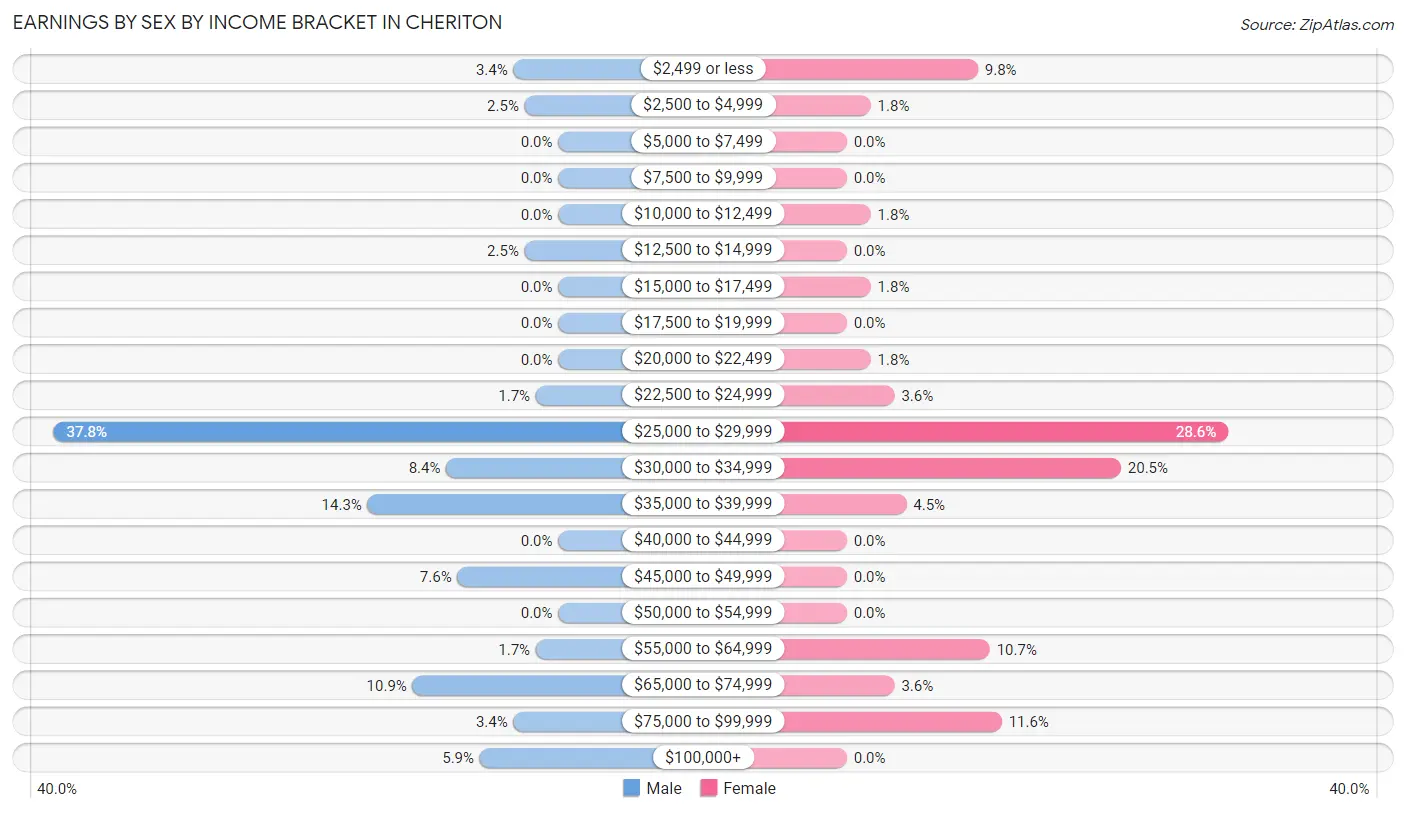
| Income | Male | Female |
| $2,499 or less | 4 (3.4%) | 11 (9.8%) |
| $2,500 to $4,999 | 3 (2.5%) | 2 (1.8%) |
| $5,000 to $7,499 | 0 (0.0%) | 0 (0.0%) |
| $7,500 to $9,999 | 0 (0.0%) | 0 (0.0%) |
| $10,000 to $12,499 | 0 (0.0%) | 2 (1.8%) |
| $12,500 to $14,999 | 3 (2.5%) | 0 (0.0%) |
| $15,000 to $17,499 | 0 (0.0%) | 2 (1.8%) |
| $17,500 to $19,999 | 0 (0.0%) | 0 (0.0%) |
| $20,000 to $22,499 | 0 (0.0%) | 2 (1.8%) |
| $22,500 to $24,999 | 2 (1.7%) | 4 (3.6%) |
| $25,000 to $29,999 | 45 (37.8%) | 32 (28.6%) |
| $30,000 to $34,999 | 10 (8.4%) | 23 (20.5%) |
| $35,000 to $39,999 | 17 (14.3%) | 5 (4.5%) |
| $40,000 to $44,999 | 0 (0.0%) | 0 (0.0%) |
| $45,000 to $49,999 | 9 (7.6%) | 0 (0.0%) |
| $50,000 to $54,999 | 0 (0.0%) | 0 (0.0%) |
| $55,000 to $64,999 | 2 (1.7%) | 12 (10.7%) |
| $65,000 to $74,999 | 13 (10.9%) | 4 (3.6%) |
| $75,000 to $99,999 | 4 (3.4%) | 13 (11.6%) |
| $100,000+ | 7 (5.9%) | 0 (0.0%) |
| Total | 119 (100.0%) | 112 (100.0%) |
Earnings by Sex by Educational Attainment in Cheriton
Average earnings in Cheriton are $29,970 for men and $30,938 for women, a difference of 3.1%. Men with an educational attainment of high school diploma enjoy the highest average annual earnings of $47,083, while those with college or associate's degree education earn the least with $36,875. Women with an educational attainment of bachelor's degree earn the most with the average annual earnings of $32,500, while those with high school diploma education have the smallest earnings of $28,958.
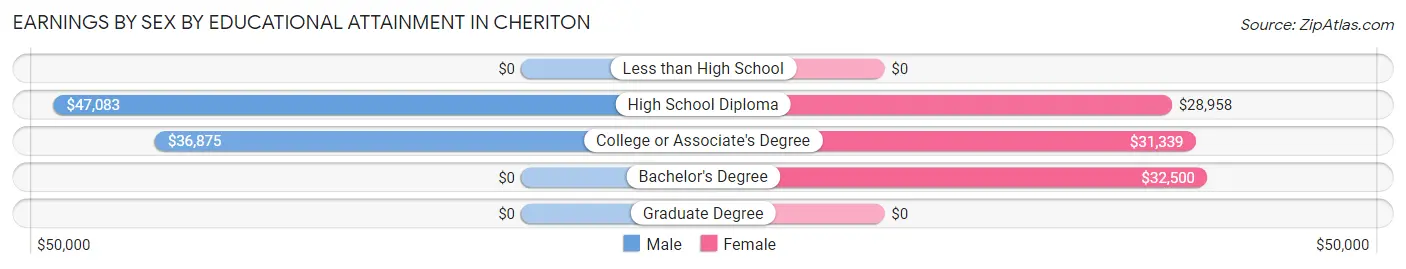
| Educational Attainment | Male Income | Female Income |
| Less than High School | - | - |
| High School Diploma | $47,083 | $28,958 |
| College or Associate's Degree | $36,875 | $31,339 |
| Bachelor's Degree | - | - |
| Graduate Degree | - | - |
| Total | $29,970 | $30,938 |
Family Income in Cheriton
Family Income Brackets in Cheriton
According to the Cheriton family income data, there are 68 families falling into the $10,000 to $14,999 income range, which is the most common income bracket and makes up 38.6% of all families.
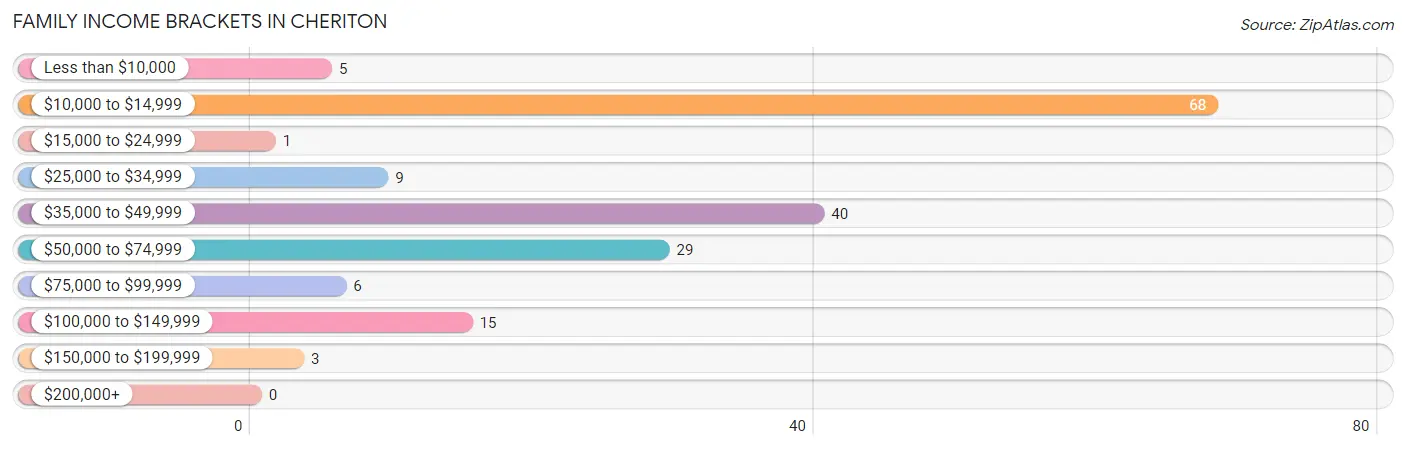
| Income Bracket | # Families | % Families |
| Less than $10,000 | 5 | 2.8% |
| $10,000 to $14,999 | 68 | 38.6% |
| $15,000 to $24,999 | 1 | 0.6% |
| $25,000 to $34,999 | 9 | 5.1% |
| $35,000 to $49,999 | 40 | 22.7% |
| $50,000 to $74,999 | 29 | 16.5% |
| $75,000 to $99,999 | 6 | 3.4% |
| $100,000 to $149,999 | 15 | 8.5% |
| $150,000 to $199,999 | 3 | 1.7% |
| $200,000+ | 0 | 0.0% |
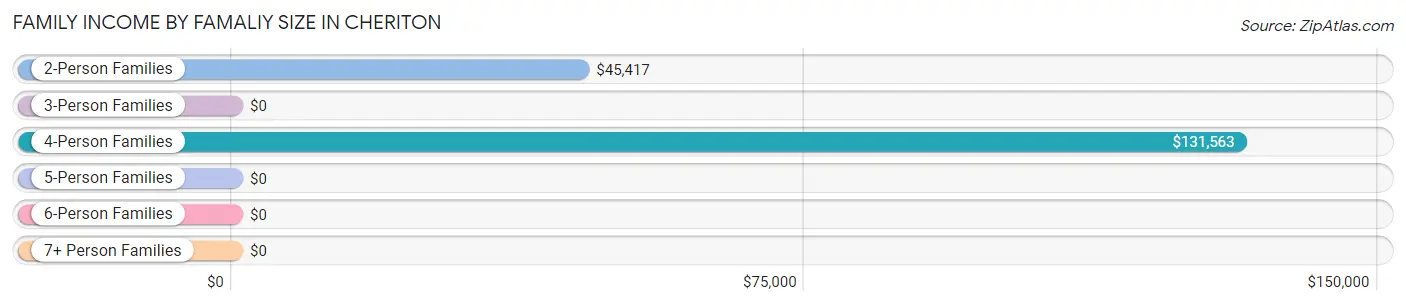
Family Income by Famaliy Size in Cheriton
4-person families (9 | 5.1%) account for the highest median family income in Cheriton with $131,563 per family, while 4-person families (9 | 5.1%) have the highest median income of $32,891 per family member.
| Income Bracket | # Families | Median Income |
| 2-Person Families | 110 (62.5%) | $45,417 |
| 3-Person Families | 55 (31.2%) | $0 |
| 4-Person Families | 9 (5.1%) | $131,563 |
| 5-Person Families | 2 (1.1%) | $0 |
| 6-Person Families | 0 (0.0%) | $0 |
| 7+ Person Families | 0 (0.0%) | $0 |
| Total | 176 (100.0%) | $36,136 |
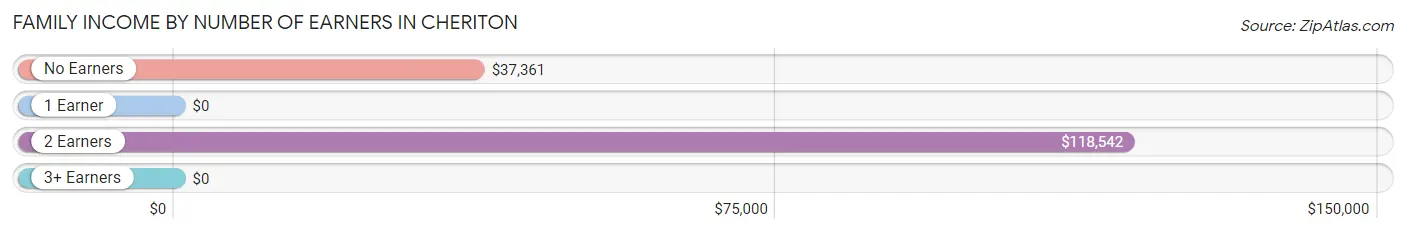
Family Income by Number of Earners in Cheriton
| Number of Earners | # Families | Median Income |
| No Earners | 59 (33.5%) | $37,361 |
| 1 Earner | 88 (50.0%) | $0 |
| 2 Earners | 27 (15.3%) | $118,542 |
| 3+ Earners | 2 (1.1%) | $0 |
| Total | 176 (100.0%) | $36,136 |
Household Income in Cheriton
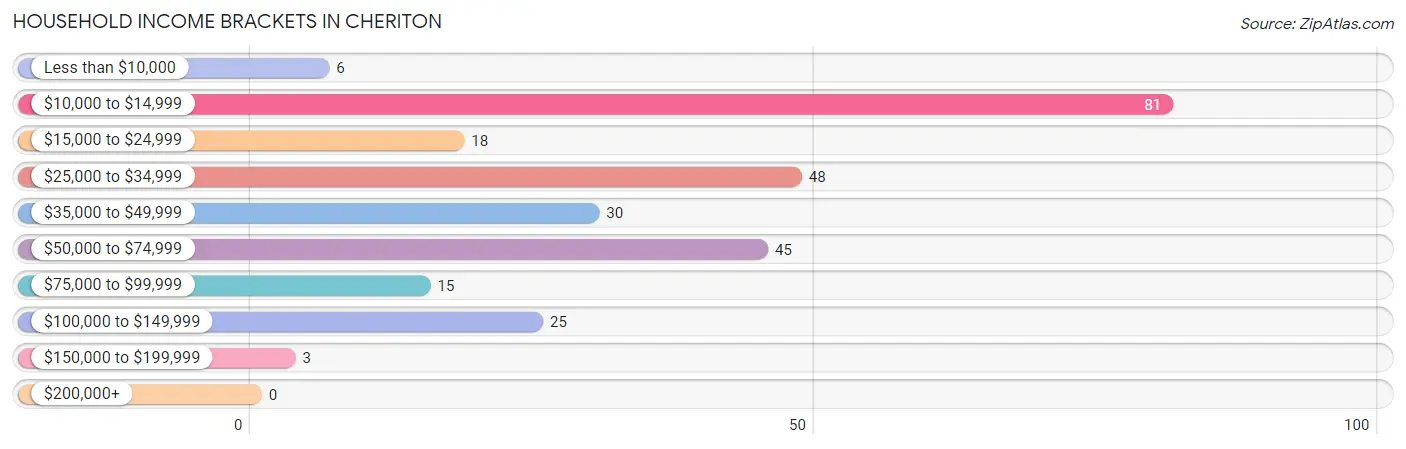
Household Income Brackets in Cheriton
With 81 households falling in the category, the $10,000 to $14,999 income range is the most frequent in Cheriton, accounting for 29.9% of all households.
| Income Bracket | # Households | % Households |
| Less than $10,000 | 6 | 2.2% |
| $10,000 to $14,999 | 81 | 29.9% |
| $15,000 to $24,999 | 18 | 6.6% |
| $25,000 to $34,999 | 48 | 17.7% |
| $35,000 to $49,999 | 30 | 11.1% |
| $50,000 to $74,999 | 45 | 16.6% |
| $75,000 to $99,999 | 15 | 5.5% |
| $100,000 to $149,999 | 25 | 9.2% |
| $150,000 to $199,999 | 3 | 1.1% |
| $200,000+ | 0 | 0.0% |
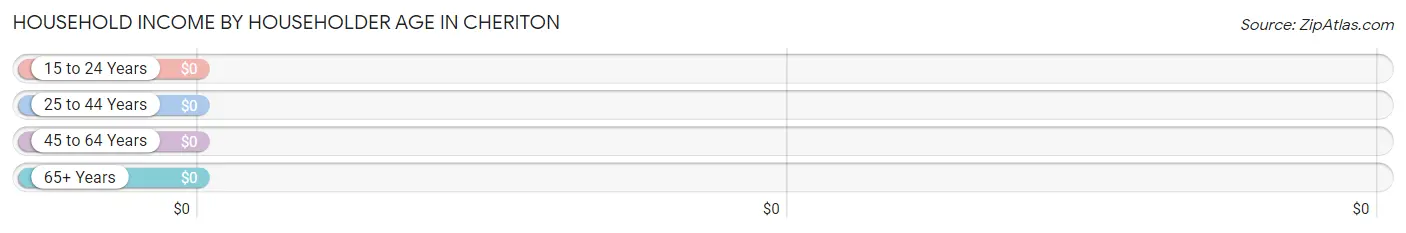
Household Income by Householder Age in Cheriton
| Income Bracket | # Households | Median Income |
| 15 to 24 Years | 0 (0.0%) | $0 |
| 25 to 44 Years | 72 (26.6%) | $0 |
| 45 to 64 Years | 72 (26.6%) | $0 |
| 65+ Years | 127 (46.9%) | $0 |
| Total | 271 (100.0%) | $29,077 |
Poverty in Cheriton
Income Below Poverty by Sex and Age in Cheriton
With 25.3% poverty level for males and 24.1% for females among the residents of Cheriton, 5 year old males and 65 to 74 year old females are the most vulnerable to poverty, with 17 males (100.0%) and 54 females (68.3%) in their respective age groups living below the poverty level.
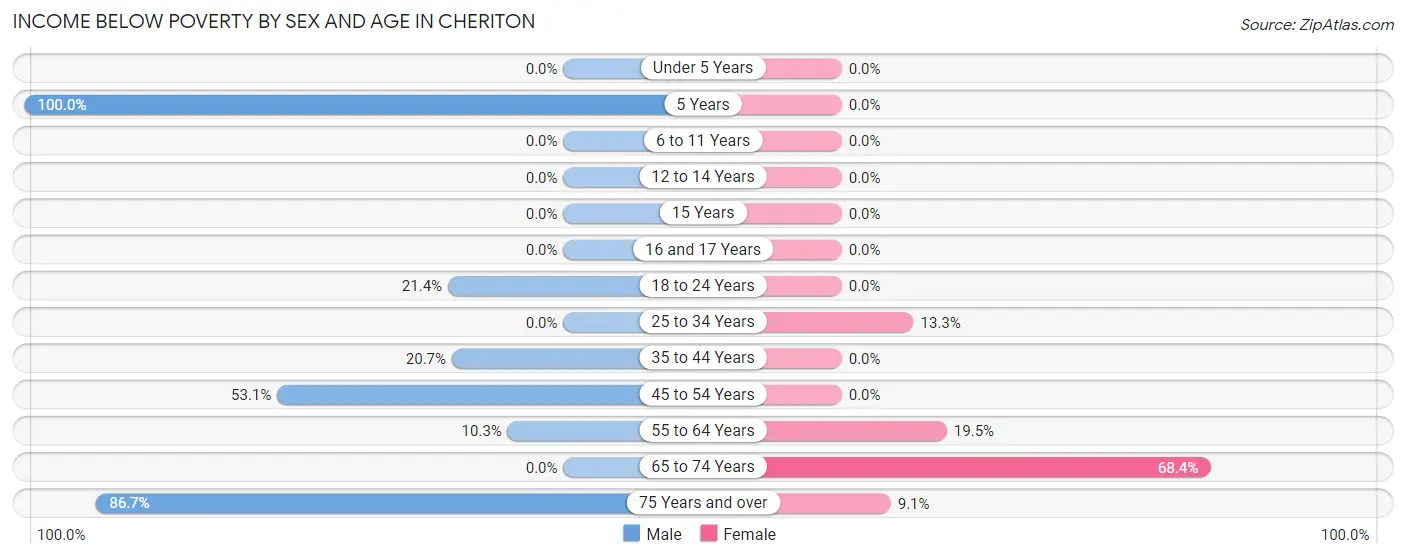
| Age Bracket | Male | Female |
| Under 5 Years | 0 (0.0%) | 0 (0.0%) |
| 5 Years | 17 (100.0%) | 0 (0.0%) |
| 6 to 11 Years | 0 (0.0%) | 0 (0.0%) |
| 12 to 14 Years | 0 (0.0%) | 0 (0.0%) |
| 15 Years | 0 (0.0%) | 0 (0.0%) |
| 16 and 17 Years | 0 (0.0%) | 0 (0.0%) |
| 18 to 24 Years | 3 (21.4%) | 0 (0.0%) |
| 25 to 34 Years | 0 (0.0%) | 8 (13.3%) |
| 35 to 44 Years | 6 (20.7%) | 0 (0.0%) |
| 45 to 54 Years | 17 (53.1%) | 0 (0.0%) |
| 55 to 64 Years | 3 (10.3%) | 8 (19.5%) |
| 65 to 74 Years | 0 (0.0%) | 54 (68.3%) |
| 75 Years and over | 13 (86.7%) | 8 (9.1%) |
| Total | 59 (25.3%) | 78 (24.1%) |
Income Above Poverty by Sex and Age in Cheriton
According to the poverty statistics in Cheriton, males aged under 5 years and females aged under 5 years are the age groups that are most secure financially, with 100.0% of males and 100.0% of females in these age groups living above the poverty line.
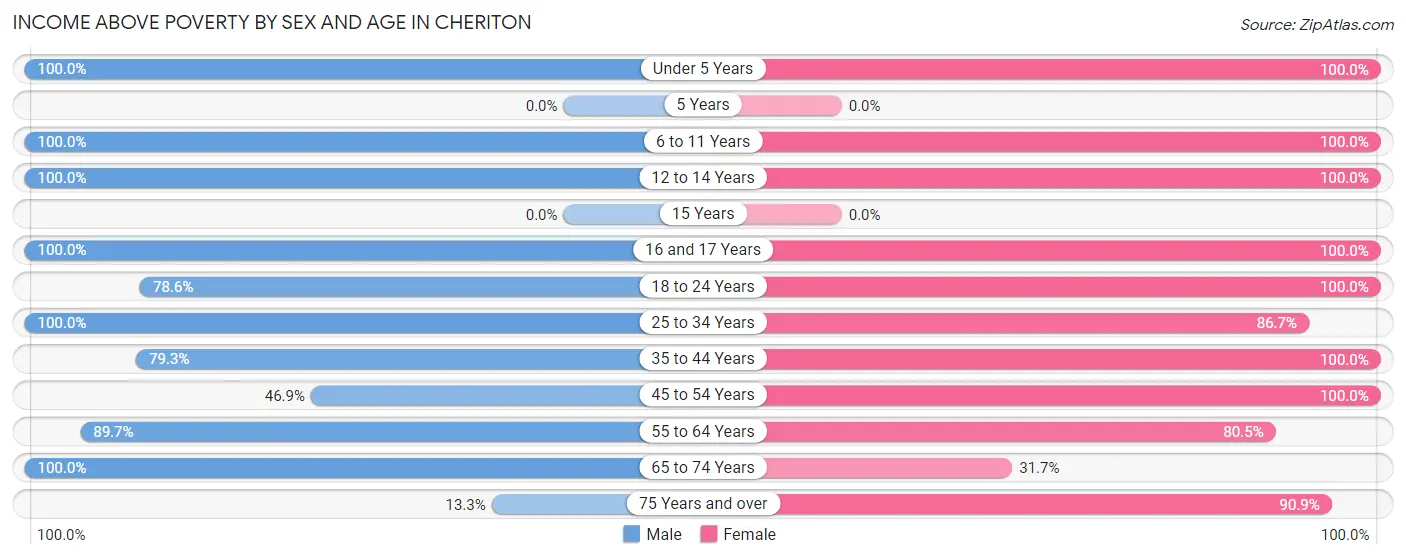
| Age Bracket | Male | Female |
| Under 5 Years | 13 (100.0%) | 11 (100.0%) |
| 5 Years | 0 (0.0%) | 0 (0.0%) |
| 6 to 11 Years | 1 (100.0%) | 3 (100.0%) |
| 12 to 14 Years | 3 (100.0%) | 3 (100.0%) |
| 15 Years | 0 (0.0%) | 0 (0.0%) |
| 16 and 17 Years | 8 (100.0%) | 3 (100.0%) |
| 18 to 24 Years | 11 (78.6%) | 10 (100.0%) |
| 25 to 34 Years | 63 (100.0%) | 52 (86.7%) |
| 35 to 44 Years | 23 (79.3%) | 15 (100.0%) |
| 45 to 54 Years | 15 (46.9%) | 10 (100.0%) |
| 55 to 64 Years | 26 (89.7%) | 33 (80.5%) |
| 65 to 74 Years | 9 (100.0%) | 25 (31.7%) |
| 75 Years and over | 2 (13.3%) | 80 (90.9%) |
| Total | 174 (74.7%) | 245 (75.8%) |
Income Below Poverty Among Married-Couple Families in Cheriton
The poverty statistics for married-couple families in Cheriton show that 6.7% or 3 of the total 45 families live below the poverty line. Families with no children have the highest poverty rate of 9.4%, comprising of 3 families. On the other hand, families with 1 or 2 children have the lowest poverty rate of 0.0%, which includes 0 families.
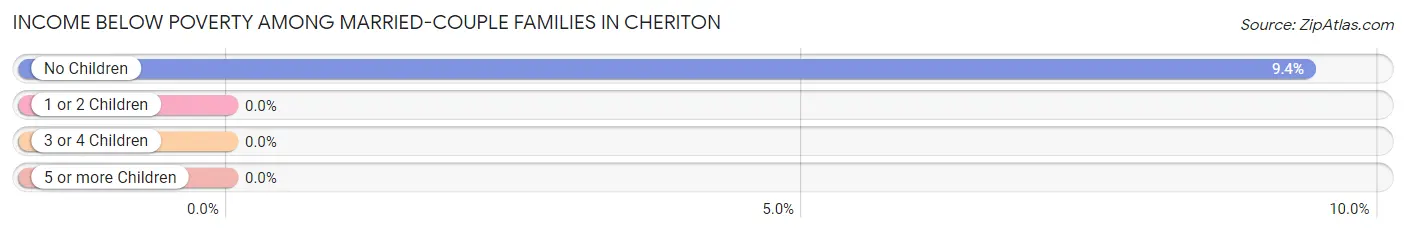
| Children | Above Poverty | Below Poverty |
| No Children | 29 (90.6%) | 3 (9.4%) |
| 1 or 2 Children | 11 (100.0%) | 0 (0.0%) |
| 3 or 4 Children | 2 (100.0%) | 0 (0.0%) |
| 5 or more Children | 0 (0.0%) | 0 (0.0%) |
| Total | 42 (93.3%) | 3 (6.7%) |
Income Below Poverty Among Single-Parent Households in Cheriton
According to the poverty data in Cheriton, 89.5% or 17 single-father households and 47.3% or 53 single-mother households are living below the poverty line. Among single-father households, those with no children have the highest poverty rate, with 17 households (100.0%) experiencing poverty. Likewise, among single-mother households, those with 1 or 2 children have the highest poverty rate, with 51 households (87.9%) falling below the poverty line.
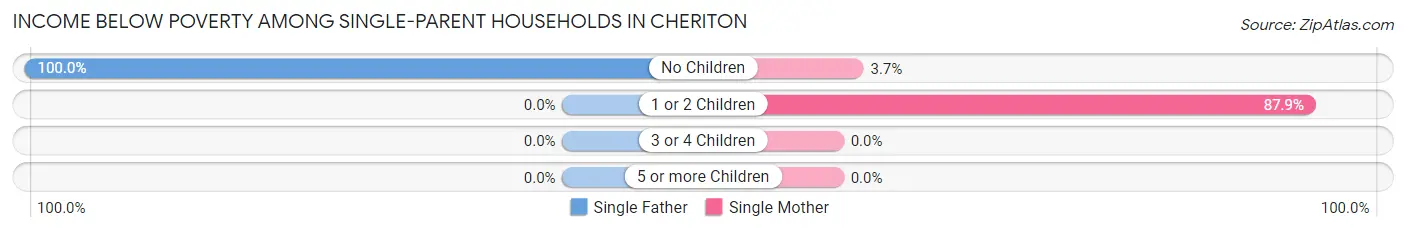
| Children | Single Father | Single Mother |
| No Children | 17 (100.0%) | 2 (3.7%) |
| 1 or 2 Children | 0 (0.0%) | 51 (87.9%) |
| 3 or 4 Children | 0 (0.0%) | 0 (0.0%) |
| 5 or more Children | 0 (0.0%) | 0 (0.0%) |
| Total | 17 (89.5%) | 53 (47.3%) |
Income Below Poverty Among Married-Couple vs Single-Parent Households in Cheriton
The poverty data for Cheriton shows that 3 of the married-couple family households (6.7%) and 70 of the single-parent households (53.4%) are living below the poverty level. Within the married-couple family households, those with no children have the highest poverty rate, with 3 households (9.4%) falling below the poverty line. Among the single-parent households, those with 1 or 2 children have the highest poverty rate, with 51 household (85.0%) living below poverty.
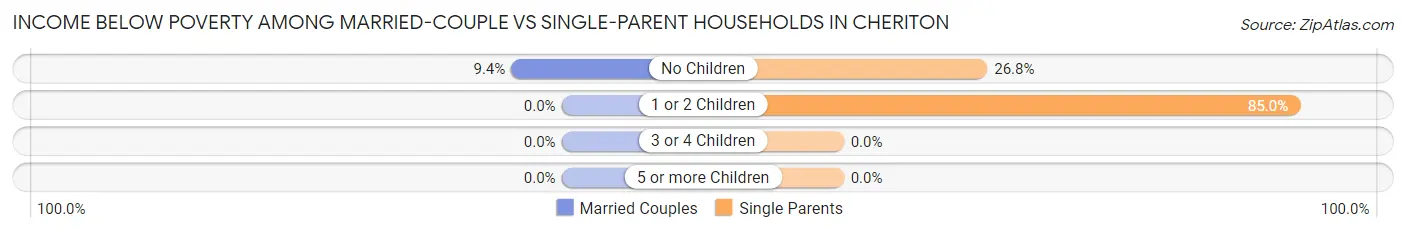
| Children | Married-Couple Families | Single-Parent Households |
| No Children | 3 (9.4%) | 19 (26.8%) |
| 1 or 2 Children | 0 (0.0%) | 51 (85.0%) |
| 3 or 4 Children | 0 (0.0%) | 0 (0.0%) |
| 5 or more Children | 0 (0.0%) | 0 (0.0%) |
| Total | 3 (6.7%) | 70 (53.4%) |
Employment Characteristics in Cheriton
Employment by Class of Employer in Cheriton
Among the 208 employed individuals in Cheriton, private company employees (97 | 46.6%), self-employed (not incorporated) (50 | 24.0%), and local government employees (24 | 11.5%) make up the most common classes of employment.
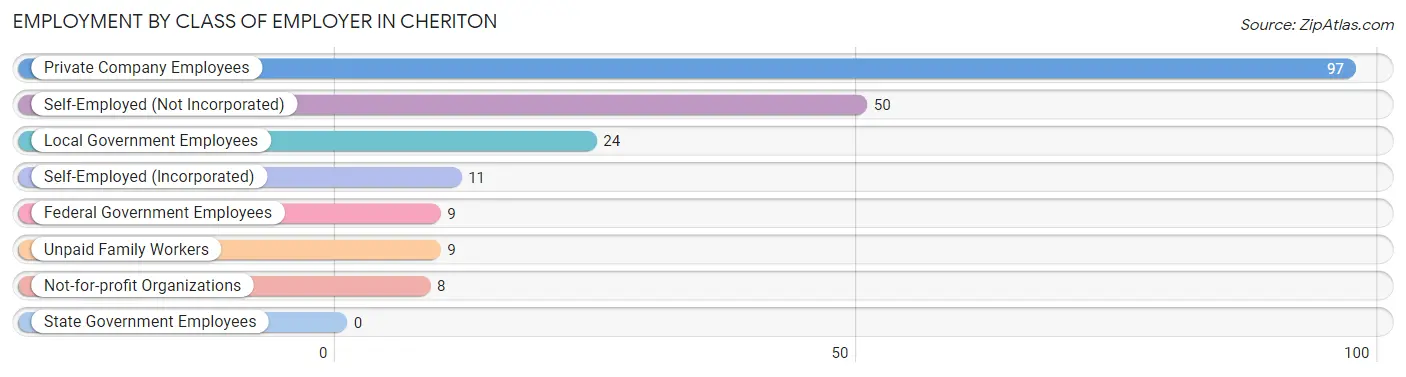
| Employer Class | # Employees | % Employees |
| Private Company Employees | 97 | 46.6% |
| Self-Employed (Incorporated) | 11 | 5.3% |
| Self-Employed (Not Incorporated) | 50 | 24.0% |
| Not-for-profit Organizations | 8 | 3.8% |
| Local Government Employees | 24 | 11.5% |
| State Government Employees | 0 | 0.0% |
| Federal Government Employees | 9 | 4.3% |
| Unpaid Family Workers | 9 | 4.3% |
| Total | 208 | 100.0% |
Employment Status by Age in Cheriton
According to the labor force statistics for Cheriton, out of the total population over 16 years of age (505), 42.2% or 213 individuals are in the labor force, with 2.3% or 5 of them unemployed. The age group with the highest labor force participation rate is 20 to 24 years, with 100.0% or 21 individuals in the labor force. Within the labor force, the 35 to 44 years age range has the highest percentage of unemployed individuals, with 17.9% or 5 of them being unemployed.
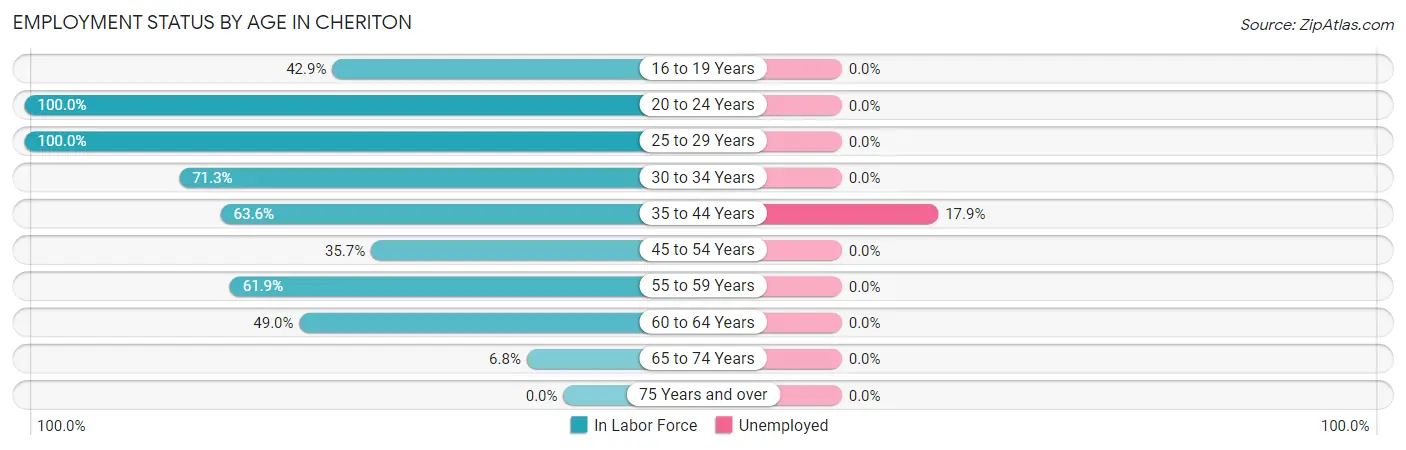
| Age Bracket | In Labor Force | Unemployed |
| 16 to 19 Years | 6 (42.9%) | 0 (0.0%) |
| 20 to 24 Years | 21 (100.0%) | 0 (0.0%) |
| 25 to 29 Years | 43 (100.0%) | 0 (0.0%) |
| 30 to 34 Years | 57 (71.3%) | 0 (0.0%) |
| 35 to 44 Years | 28 (63.6%) | 5 (17.9%) |
| 45 to 54 Years | 15 (35.7%) | 0 (0.0%) |
| 55 to 59 Years | 13 (61.9%) | 0 (0.0%) |
| 60 to 64 Years | 24 (49.0%) | 0 (0.0%) |
| 65 to 74 Years | 6 (6.8%) | 0 (0.0%) |
| 75 Years and over | 0 (0.0%) | 0 (0.0%) |
| Total | 213 (42.2%) | 5 (2.3%) |
Employment Status by Educational Attainment in Cheriton
According to labor force statistics for Cheriton, 64.5% of individuals (180) out of the total population between 25 and 64 years of age (279) are in the labor force, with 2.8% or 5 of them being unemployed. The group with the highest labor force participation rate are those with the educational attainment of less than high school, with 75.0% or 42 individuals in the labor force. Within the labor force, individuals with bachelor's degree or higher education have the highest percentage of unemployment, with 17.2% or 5 of them being unemployed.
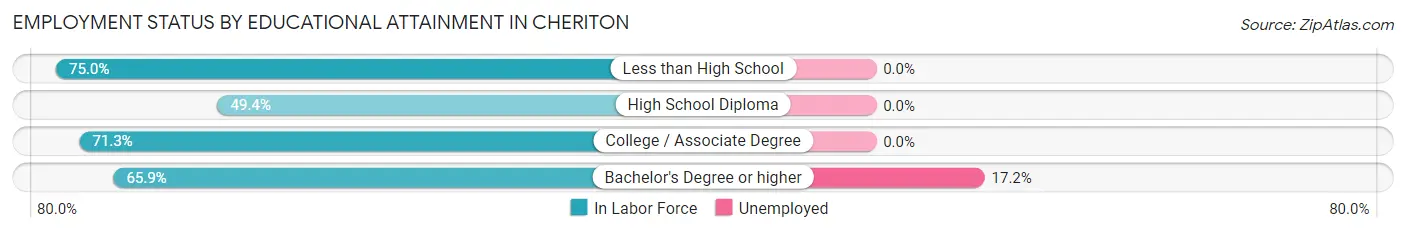
| Educational Attainment | In Labor Force | Unemployed |
| Less than High School | 42 (75.0%) | 0 (0.0%) |
| High School Diploma | 42 (49.4%) | 0 (0.0%) |
| College / Associate Degree | 67 (71.3%) | 0 (0.0%) |
| Bachelor's Degree or higher | 29 (65.9%) | 8 (17.2%) |
| Total | 180 (64.5%) | 8 (2.8%) |
Employment Occupations by Sex in Cheriton
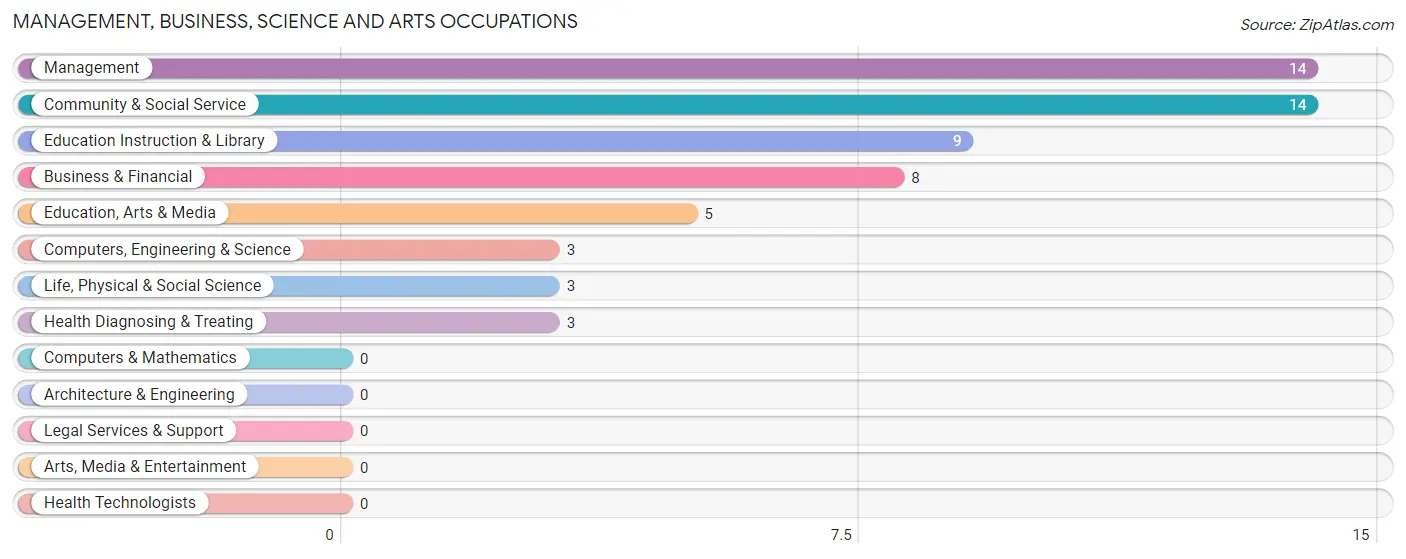
Management, Business, Science and Arts Occupations
The most common Management, Business, Science and Arts occupations in Cheriton are Management (14 | 6.7%), Community & Social Service (14 | 6.7%), Education Instruction & Library (9 | 4.3%), Business & Financial (8 | 3.8%), and Education, Arts & Media (5 | 2.4%).
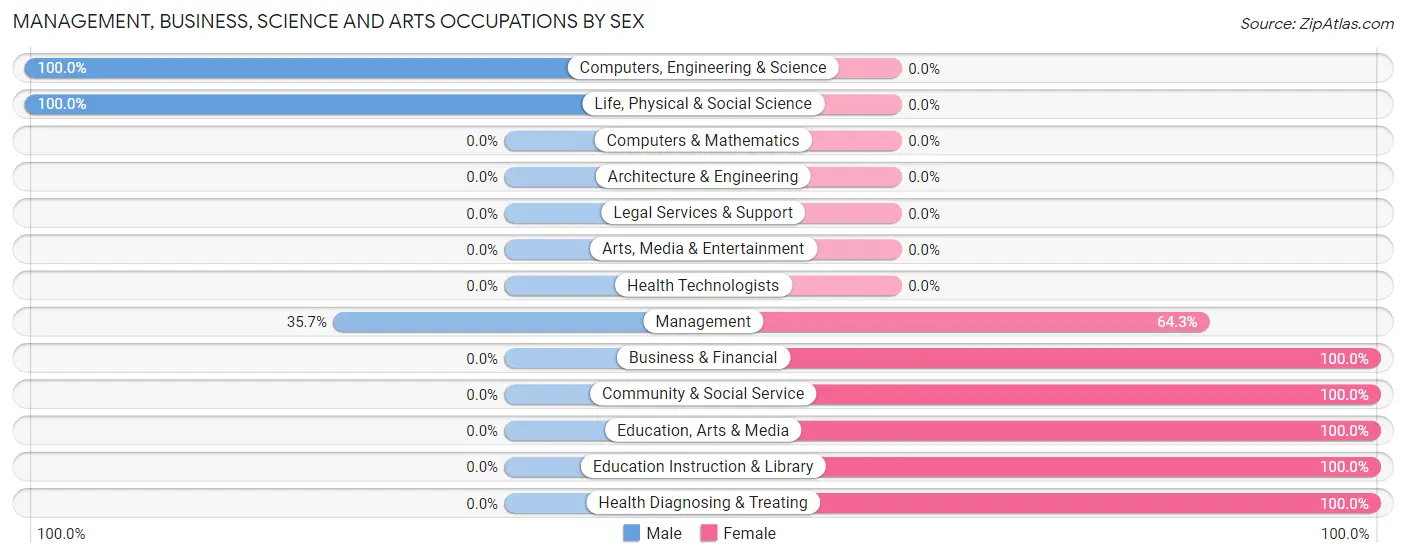
Management, Business, Science and Arts Occupations by Sex
Within the Management, Business, Science and Arts occupations in Cheriton, the most male-oriented occupations are Computers, Engineering & Science (100.0%), Life, Physical & Social Science (100.0%), and Management (35.7%), while the most female-oriented occupations are Business & Financial (100.0%), Community & Social Service (100.0%), and Education, Arts & Media (100.0%).
| Occupation | Male | Female |
| Management | 5 (35.7%) | 9 (64.3%) |
| Business & Financial | 0 (0.0%) | 8 (100.0%) |
| Computers, Engineering & Science | 3 (100.0%) | 0 (0.0%) |
| Computers & Mathematics | 0 (0.0%) | 0 (0.0%) |
| Architecture & Engineering | 0 (0.0%) | 0 (0.0%) |
| Life, Physical & Social Science | 3 (100.0%) | 0 (0.0%) |
| Community & Social Service | 0 (0.0%) | 14 (100.0%) |
| Education, Arts & Media | 0 (0.0%) | 5 (100.0%) |
| Legal Services & Support | 0 (0.0%) | 0 (0.0%) |
| Education Instruction & Library | 0 (0.0%) | 9 (100.0%) |
| Arts, Media & Entertainment | 0 (0.0%) | 0 (0.0%) |
| Health Diagnosing & Treating | 0 (0.0%) | 3 (100.0%) |
| Health Technologists | 0 (0.0%) | 0 (0.0%) |
| Total (Category) | 8 (19.1%) | 34 (80.9%) |
| Total (Overall) | 103 (49.5%) | 105 (50.5%) |
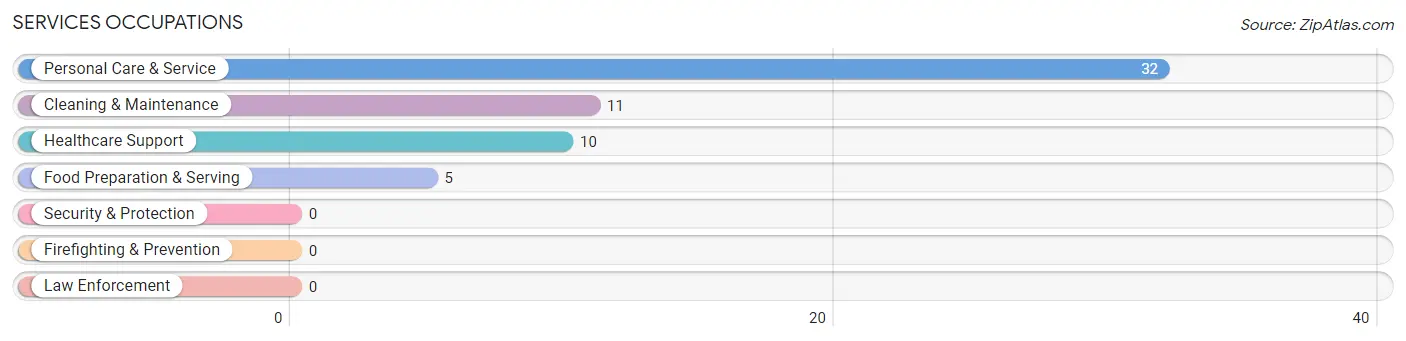
Services Occupations
The most common Services occupations in Cheriton are Personal Care & Service (32 | 15.4%), Cleaning & Maintenance (11 | 5.3%), Healthcare Support (10 | 4.8%), and Food Preparation & Serving (5 | 2.4%).
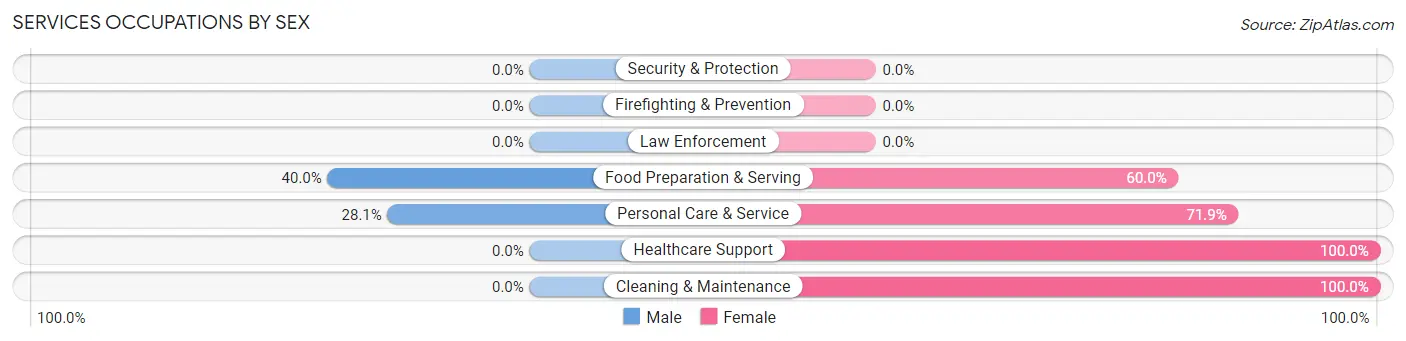
Services Occupations by Sex
Within the Services occupations in Cheriton, the most male-oriented occupations are Food Preparation & Serving (40.0%), and Personal Care & Service (28.1%), while the most female-oriented occupations are Healthcare Support (100.0%), Cleaning & Maintenance (100.0%), and Personal Care & Service (71.9%).
| Occupation | Male | Female |
| Healthcare Support | 0 (0.0%) | 10 (100.0%) |
| Security & Protection | 0 (0.0%) | 0 (0.0%) |
| Firefighting & Prevention | 0 (0.0%) | 0 (0.0%) |
| Law Enforcement | 0 (0.0%) | 0 (0.0%) |
| Food Preparation & Serving | 2 (40.0%) | 3 (60.0%) |
| Cleaning & Maintenance | 0 (0.0%) | 11 (100.0%) |
| Personal Care & Service | 9 (28.1%) | 23 (71.9%) |
| Total (Category) | 11 (19.0%) | 47 (81.0%) |
| Total (Overall) | 103 (49.5%) | 105 (50.5%) |
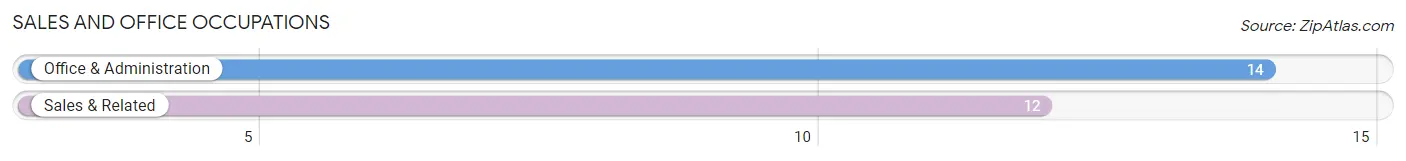
Sales and Office Occupations
The most common Sales and Office occupations in Cheriton are Office & Administration (14 | 6.7%), and Sales & Related (12 | 5.8%).
Sales and Office Occupations by Sex
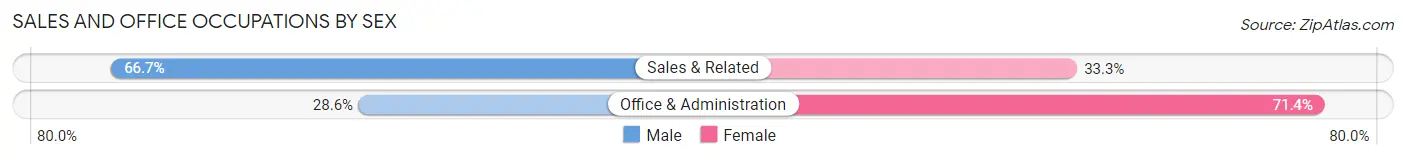
| Occupation | Male | Female |
| Sales & Related | 8 (66.7%) | 4 (33.3%) |
| Office & Administration | 4 (28.6%) | 10 (71.4%) |
| Total (Category) | 12 (46.2%) | 14 (53.8%) |
| Total (Overall) | 103 (49.5%) | 105 (50.5%) |
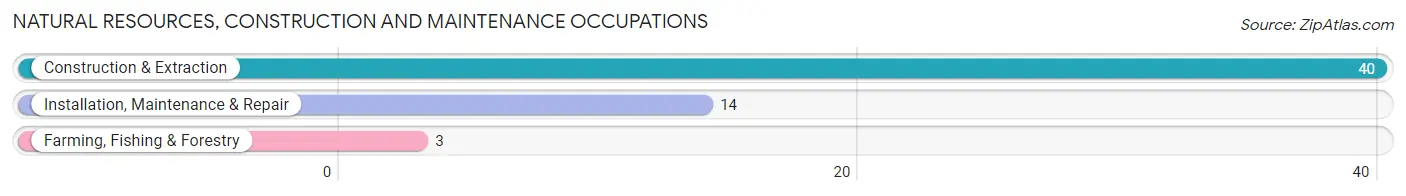
Natural Resources, Construction and Maintenance Occupations
The most common Natural Resources, Construction and Maintenance occupations in Cheriton are Construction & Extraction (40 | 19.2%), Installation, Maintenance & Repair (14 | 6.7%), and Farming, Fishing & Forestry (3 | 1.4%).
Natural Resources, Construction and Maintenance Occupations by Sex
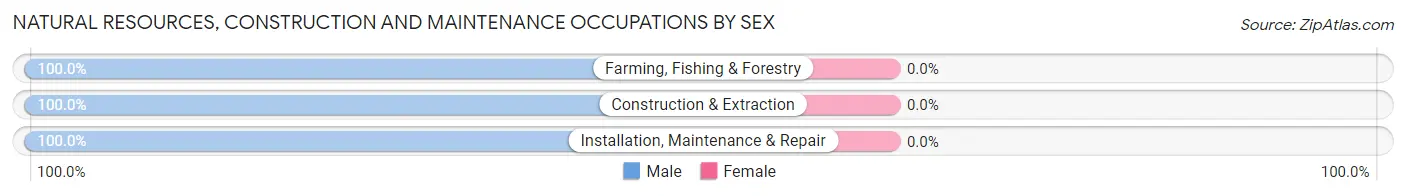
| Occupation | Male | Female |
| Farming, Fishing & Forestry | 3 (100.0%) | 0 (0.0%) |
| Construction & Extraction | 40 (100.0%) | 0 (0.0%) |
| Installation, Maintenance & Repair | 14 (100.0%) | 0 (0.0%) |
| Total (Category) | 57 (100.0%) | 0 (0.0%) |
| Total (Overall) | 103 (49.5%) | 105 (50.5%) |
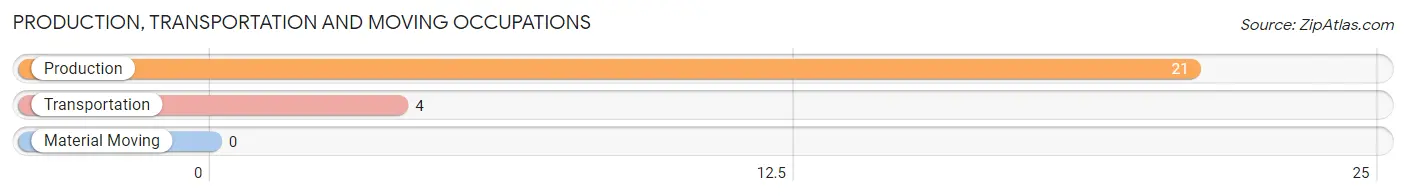
Production, Transportation and Moving Occupations
The most common Production, Transportation and Moving occupations in Cheriton are Production (21 | 10.1%), and Transportation (4 | 1.9%).
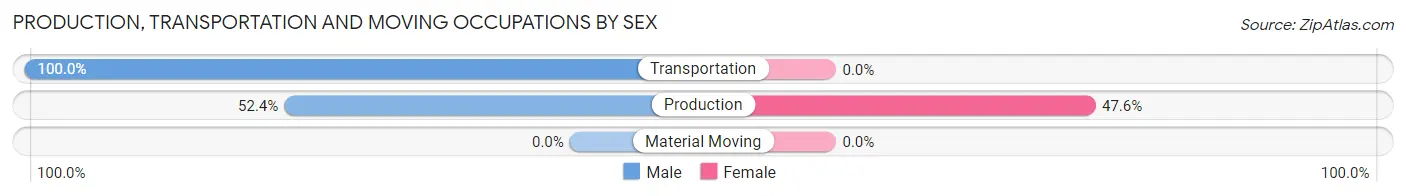
Production, Transportation and Moving Occupations by Sex
| Occupation | Male | Female |
| Production | 11 (52.4%) | 10 (47.6%) |
| Transportation | 4 (100.0%) | 0 (0.0%) |
| Material Moving | 0 (0.0%) | 0 (0.0%) |
| Total (Category) | 15 (60.0%) | 10 (40.0%) |
| Total (Overall) | 103 (49.5%) | 105 (50.5%) |
Employment Industries by Sex in Cheriton
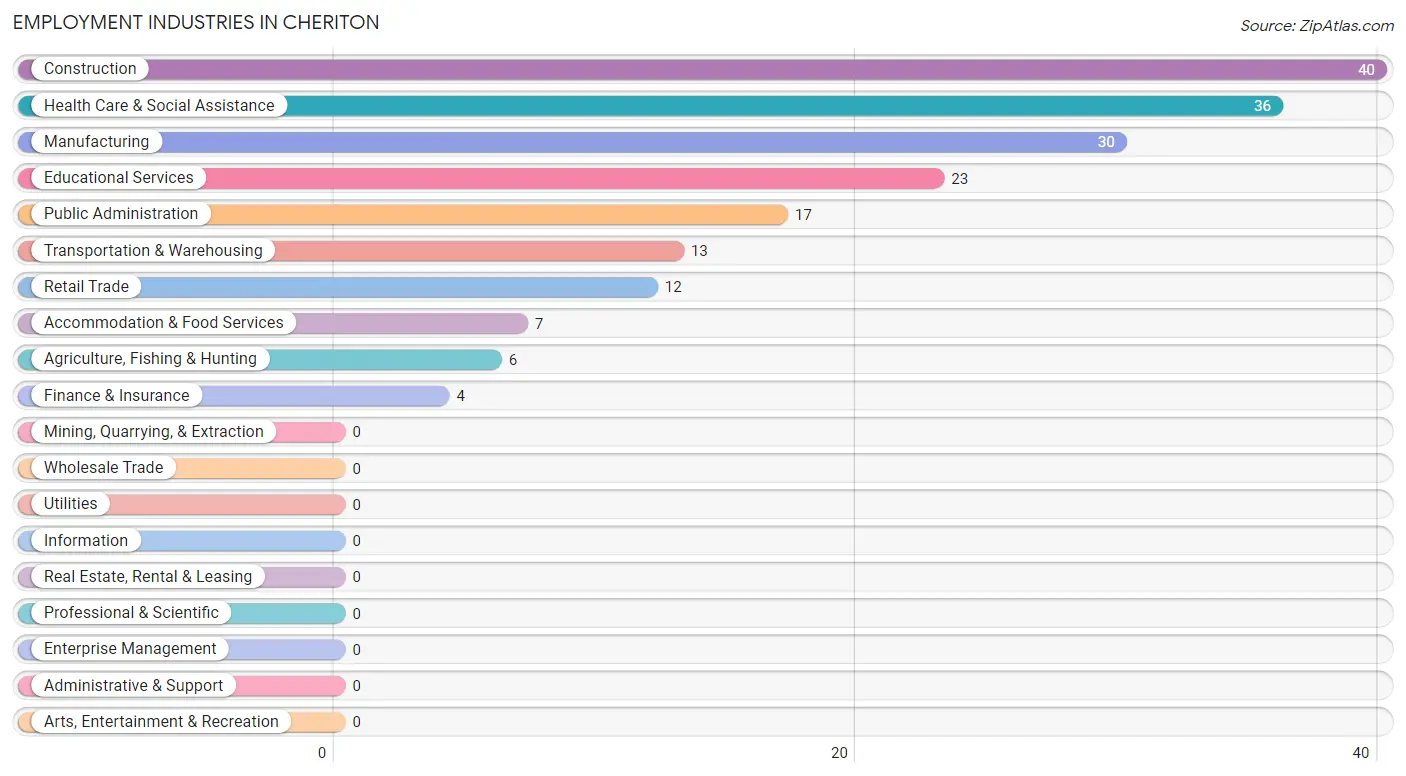
Employment Industries in Cheriton
The major employment industries in Cheriton include Construction (40 | 19.2%), Health Care & Social Assistance (36 | 17.3%), Manufacturing (30 | 14.4%), Educational Services (23 | 11.1%), and Public Administration (17 | 8.2%).
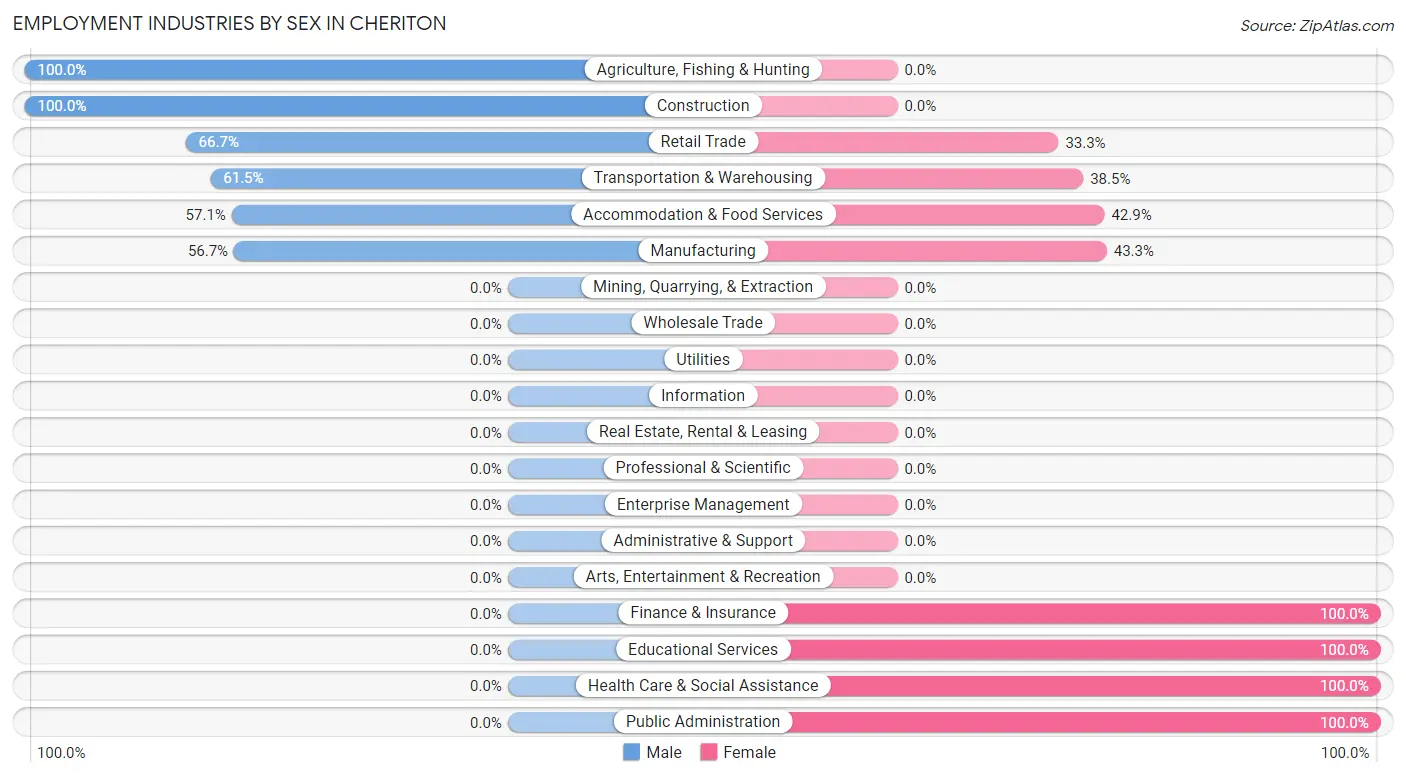
Employment Industries by Sex in Cheriton
The Cheriton industries that see more men than women are Agriculture, Fishing & Hunting (100.0%), Construction (100.0%), and Retail Trade (66.7%), whereas the industries that tend to have a higher number of women are Finance & Insurance (100.0%), Educational Services (100.0%), and Health Care & Social Assistance (100.0%).
| Industry | Male | Female |
| Agriculture, Fishing & Hunting | 6 (100.0%) | 0 (0.0%) |
| Mining, Quarrying, & Extraction | 0 (0.0%) | 0 (0.0%) |
| Construction | 40 (100.0%) | 0 (0.0%) |
| Manufacturing | 17 (56.7%) | 13 (43.3%) |
| Wholesale Trade | 0 (0.0%) | 0 (0.0%) |
| Retail Trade | 8 (66.7%) | 4 (33.3%) |
| Transportation & Warehousing | 8 (61.5%) | 5 (38.5%) |
| Utilities | 0 (0.0%) | 0 (0.0%) |
| Information | 0 (0.0%) | 0 (0.0%) |
| Finance & Insurance | 0 (0.0%) | 4 (100.0%) |
| Real Estate, Rental & Leasing | 0 (0.0%) | 0 (0.0%) |
| Professional & Scientific | 0 (0.0%) | 0 (0.0%) |
| Enterprise Management | 0 (0.0%) | 0 (0.0%) |
| Administrative & Support | 0 (0.0%) | 0 (0.0%) |
| Educational Services | 0 (0.0%) | 23 (100.0%) |
| Health Care & Social Assistance | 0 (0.0%) | 36 (100.0%) |
| Arts, Entertainment & Recreation | 0 (0.0%) | 0 (0.0%) |
| Accommodation & Food Services | 4 (57.1%) | 3 (42.9%) |
| Public Administration | 0 (0.0%) | 17 (100.0%) |
| Total | 103 (49.5%) | 105 (50.5%) |
Education in Cheriton
School Enrollment in Cheriton
The most common levels of schooling among the 49 students in Cheriton are kindergarten (17 | 34.7%), high school (17 | 34.7%), and nursery / preschool (6 | 12.2%).
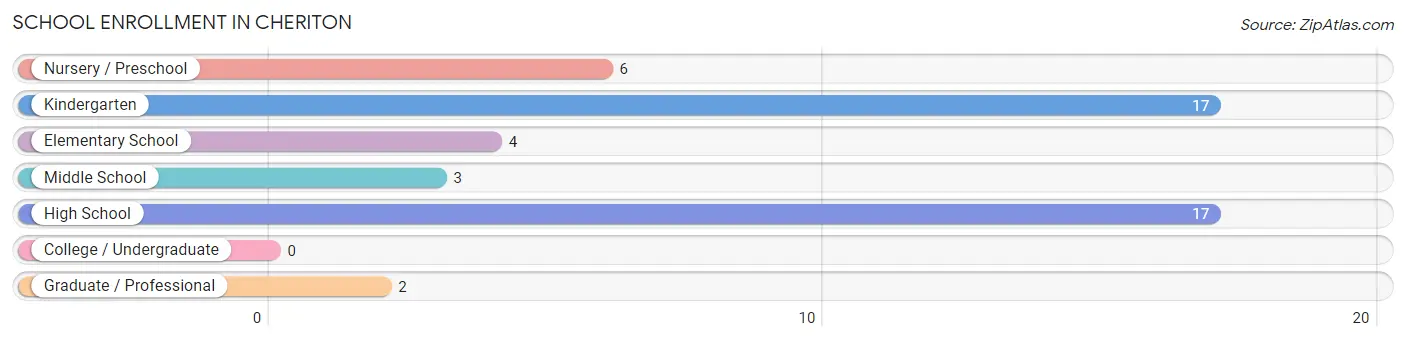
| School Level | # Students | % Students |
| Nursery / Preschool | 6 | 12.2% |
| Kindergarten | 17 | 34.7% |
| Elementary School | 4 | 8.2% |
| Middle School | 3 | 6.1% |
| High School | 17 | 34.7% |
| College / Undergraduate | 0 | 0.0% |
| Graduate / Professional | 2 | 4.1% |
| Total | 49 | 100.0% |
School Enrollment by Age by Funding Source in Cheriton
Out of a total of 49 students who are enrolled in schools in Cheriton, 11 (22.4%) attend a private institution, while the remaining 38 (77.6%) are enrolled in public schools. The age group of 3 to 4 year olds has the highest likelihood of being enrolled in private schools, with 6 (100.0% in the age bracket) enrolled. Conversely, the age group of 5 to 9 year old has the lowest likelihood of being enrolled in a private school, with 21 (100.0% in the age bracket) attending a public institution.
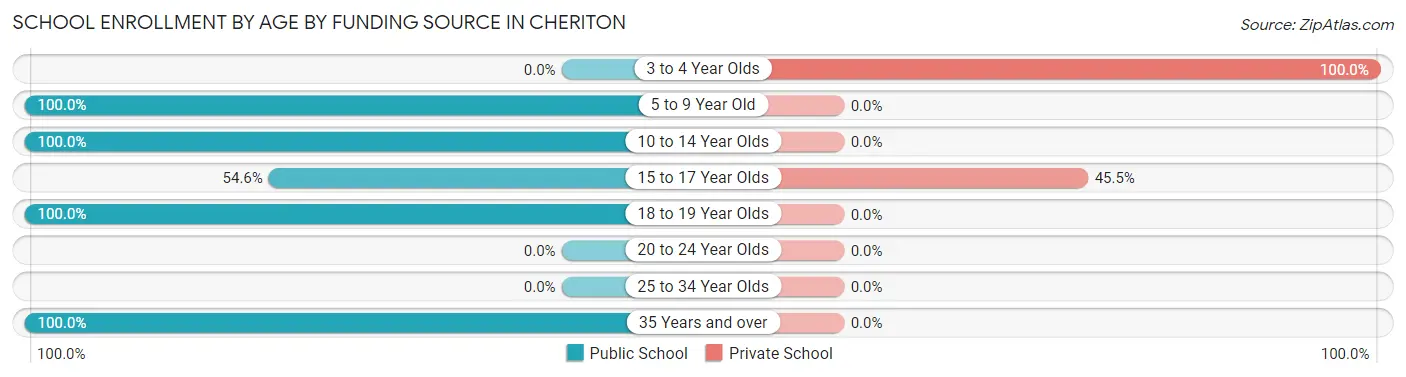
| Age Bracket | Public School | Private School |
| 3 to 4 Year Olds | 0 (0.0%) | 6 (100.0%) |
| 5 to 9 Year Old | 21 (100.0%) | 0 (0.0%) |
| 10 to 14 Year Olds | 6 (100.0%) | 0 (0.0%) |
| 15 to 17 Year Olds | 6 (54.5%) | 5 (45.5%) |
| 18 to 19 Year Olds | 3 (100.0%) | 0 (0.0%) |
| 20 to 24 Year Olds | 0 (0.0%) | 0 (0.0%) |
| 25 to 34 Year Olds | 0 (0.0%) | 0 (0.0%) |
| 35 Years and over | 2 (100.0%) | 0 (0.0%) |
| Total | 38 (77.6%) | 11 (22.4%) |
Educational Attainment by Field of Study in Cheriton
Visual & performing arts (15 | 23.1%), business (14 | 21.5%), bio, nature & agricultural (9 | 13.9%), education (9 | 13.9%), and communications (7 | 10.8%) are the most common fields of study among 65 individuals in Cheriton who have obtained a bachelor's degree or higher.
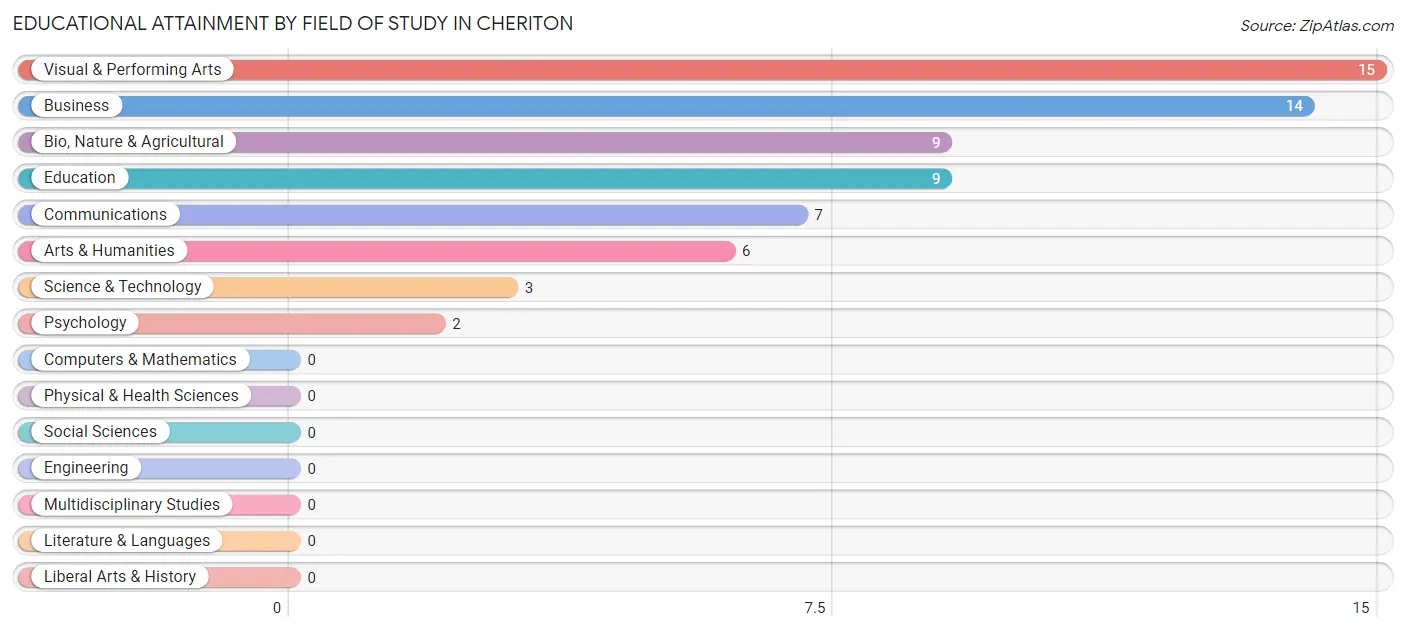
| Field of Study | # Graduates | % Graduates |
| Computers & Mathematics | 0 | 0.0% |
| Bio, Nature & Agricultural | 9 | 13.9% |
| Physical & Health Sciences | 0 | 0.0% |
| Psychology | 2 | 3.1% |
| Social Sciences | 0 | 0.0% |
| Engineering | 0 | 0.0% |
| Multidisciplinary Studies | 0 | 0.0% |
| Science & Technology | 3 | 4.6% |
| Business | 14 | 21.5% |
| Education | 9 | 13.9% |
| Literature & Languages | 0 | 0.0% |
| Liberal Arts & History | 0 | 0.0% |
| Visual & Performing Arts | 15 | 23.1% |
| Communications | 7 | 10.8% |
| Arts & Humanities | 6 | 9.2% |
| Total | 65 | 100.0% |
Transportation & Commute in Cheriton
Vehicle Availability by Sex in Cheriton
The most prevalent vehicle ownership categories in Cheriton are males with 1 vehicle (38, accounting for 36.9%) and females with 1 vehicle (19, making up 36.2%).
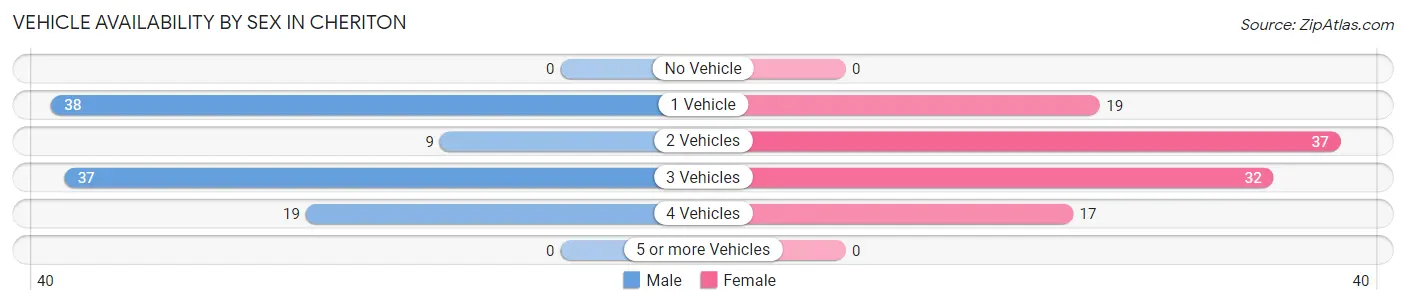
| Vehicles Available | Male | Female |
| No Vehicle | 0 (0.0%) | 0 (0.0%) |
| 1 Vehicle | 38 (36.9%) | 19 (18.1%) |
| 2 Vehicles | 9 (8.7%) | 37 (35.2%) |
| 3 Vehicles | 37 (35.9%) | 32 (30.5%) |
| 4 Vehicles | 19 (18.4%) | 17 (16.2%) |
| 5 or more Vehicles | 0 (0.0%) | 0 (0.0%) |
| Total | 103 (100.0%) | 105 (100.0%) |
Commute Time in Cheriton
The most frequently occuring commute durations in Cheriton are 45 to 59 minutes (55 commuters, 28.1%), 10 to 14 minutes (42 commuters, 21.4%), and 15 to 19 minutes (33 commuters, 16.8%).
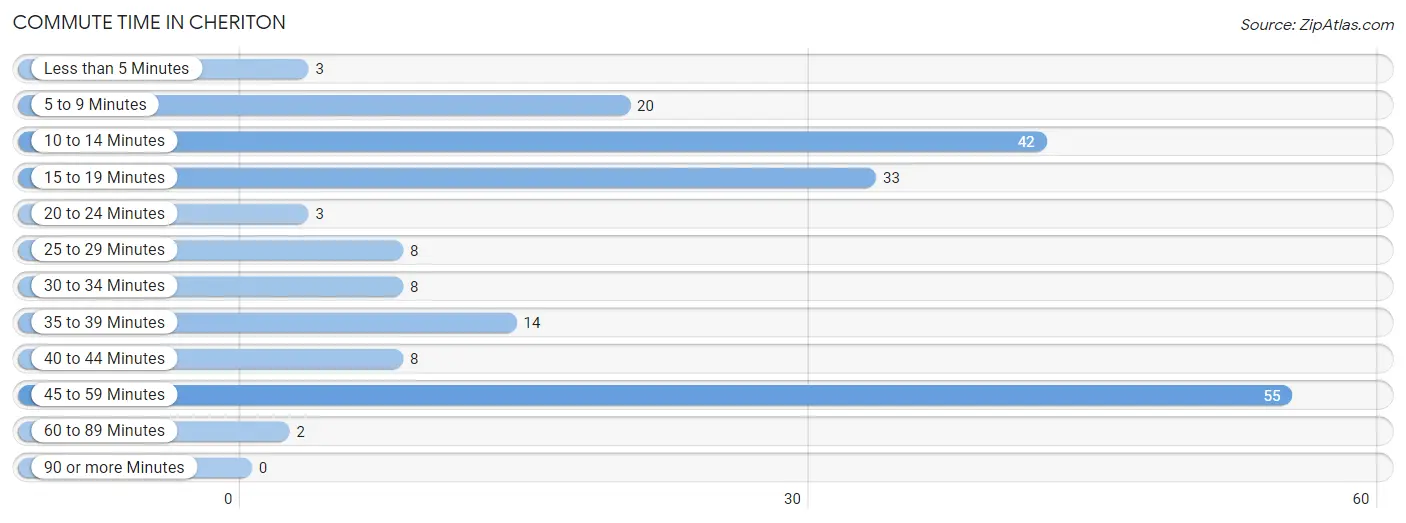
| Commute Time | # Commuters | % Commuters |
| Less than 5 Minutes | 3 | 1.5% |
| 5 to 9 Minutes | 20 | 10.2% |
| 10 to 14 Minutes | 42 | 21.4% |
| 15 to 19 Minutes | 33 | 16.8% |
| 20 to 24 Minutes | 3 | 1.5% |
| 25 to 29 Minutes | 8 | 4.1% |
| 30 to 34 Minutes | 8 | 4.1% |
| 35 to 39 Minutes | 14 | 7.1% |
| 40 to 44 Minutes | 8 | 4.1% |
| 45 to 59 Minutes | 55 | 28.1% |
| 60 to 89 Minutes | 2 | 1.0% |
| 90 or more Minutes | 0 | 0.0% |
Commute Time by Sex in Cheriton
The most common commute times in Cheriton are 45 to 59 minutes (53 commuters, 51.5%) for males and 10 to 14 minutes (22 commuters, 23.7%) for females.
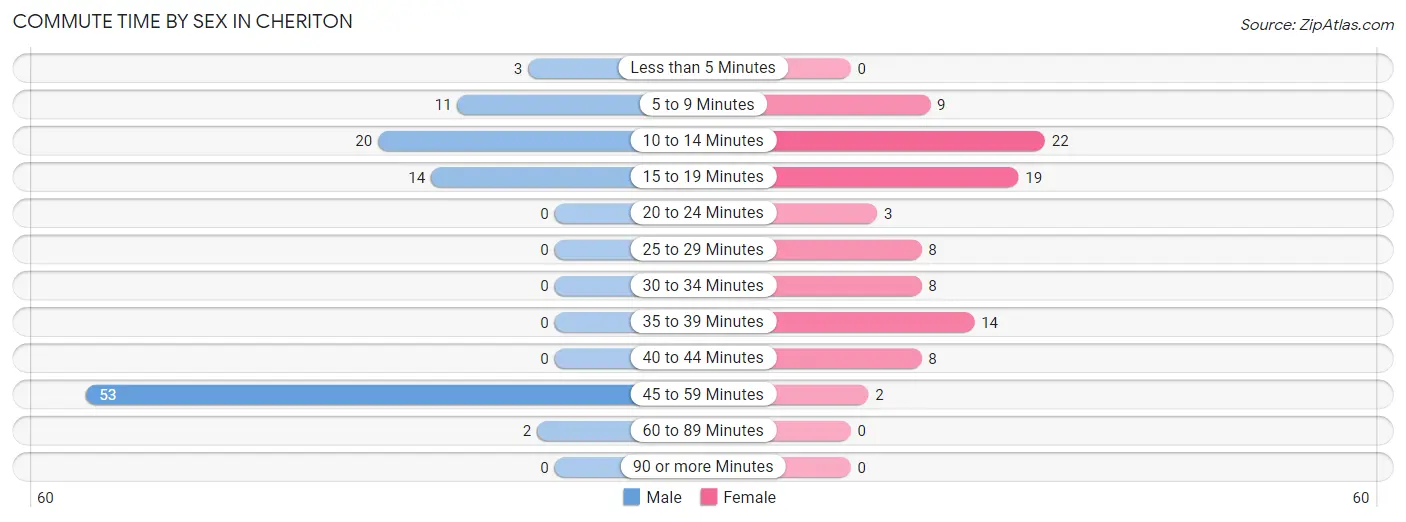
| Commute Time | Male | Female |
| Less than 5 Minutes | 3 (2.9%) | 0 (0.0%) |
| 5 to 9 Minutes | 11 (10.7%) | 9 (9.7%) |
| 10 to 14 Minutes | 20 (19.4%) | 22 (23.7%) |
| 15 to 19 Minutes | 14 (13.6%) | 19 (20.4%) |
| 20 to 24 Minutes | 0 (0.0%) | 3 (3.2%) |
| 25 to 29 Minutes | 0 (0.0%) | 8 (8.6%) |
| 30 to 34 Minutes | 0 (0.0%) | 8 (8.6%) |
| 35 to 39 Minutes | 0 (0.0%) | 14 (15.0%) |
| 40 to 44 Minutes | 0 (0.0%) | 8 (8.6%) |
| 45 to 59 Minutes | 53 (51.5%) | 2 (2.1%) |
| 60 to 89 Minutes | 2 (1.9%) | 0 (0.0%) |
| 90 or more Minutes | 0 (0.0%) | 0 (0.0%) |
Time of Departure to Work by Sex in Cheriton
The most frequent times of departure to work in Cheriton are 7:30 AM to 7:59 AM (43, 41.7%) for males and 7:00 AM to 7:29 AM (30, 32.3%) for females.
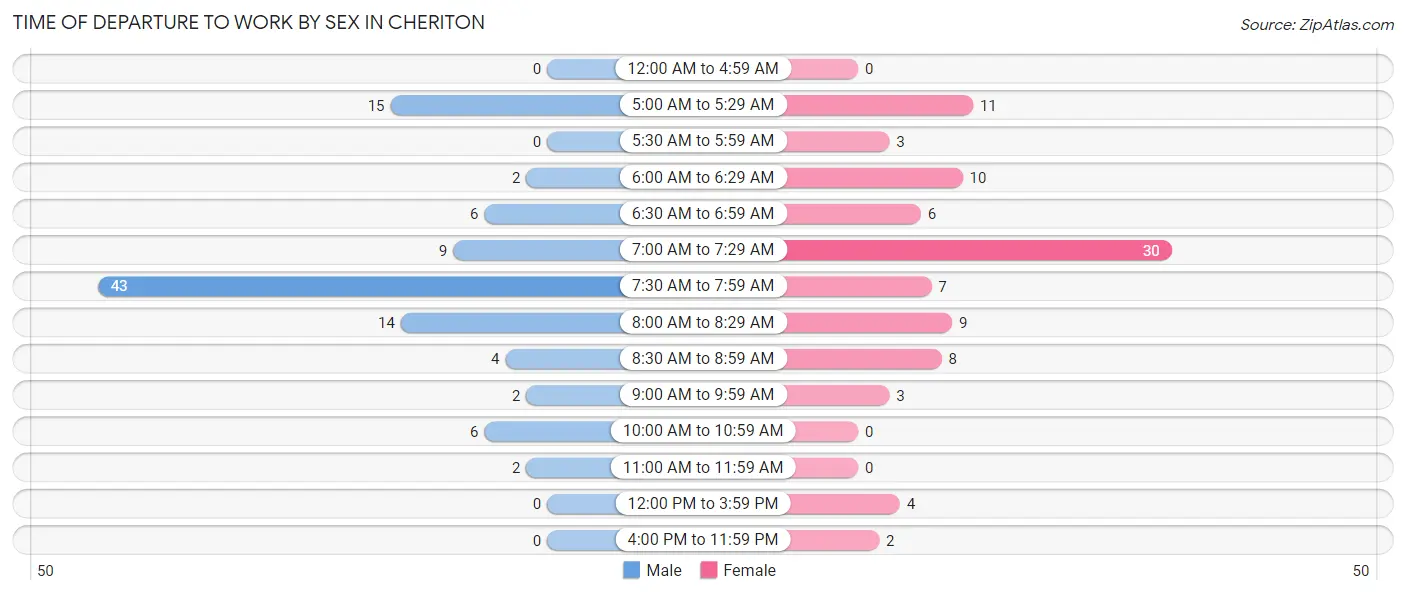
| Time of Departure | Male | Female |
| 12:00 AM to 4:59 AM | 0 (0.0%) | 0 (0.0%) |
| 5:00 AM to 5:29 AM | 15 (14.6%) | 11 (11.8%) |
| 5:30 AM to 5:59 AM | 0 (0.0%) | 3 (3.2%) |
| 6:00 AM to 6:29 AM | 2 (1.9%) | 10 (10.7%) |
| 6:30 AM to 6:59 AM | 6 (5.8%) | 6 (6.5%) |
| 7:00 AM to 7:29 AM | 9 (8.7%) | 30 (32.3%) |
| 7:30 AM to 7:59 AM | 43 (41.7%) | 7 (7.5%) |
| 8:00 AM to 8:29 AM | 14 (13.6%) | 9 (9.7%) |
| 8:30 AM to 8:59 AM | 4 (3.9%) | 8 (8.6%) |
| 9:00 AM to 9:59 AM | 2 (1.9%) | 3 (3.2%) |
| 10:00 AM to 10:59 AM | 6 (5.8%) | 0 (0.0%) |
| 11:00 AM to 11:59 AM | 2 (1.9%) | 0 (0.0%) |
| 12:00 PM to 3:59 PM | 0 (0.0%) | 4 (4.3%) |
| 4:00 PM to 11:59 PM | 0 (0.0%) | 2 (2.1%) |
| Total | 103 (100.0%) | 93 (100.0%) |
Housing Occupancy in Cheriton
Occupancy by Ownership in Cheriton
Of the total 271 dwellings in Cheriton, owner-occupied units account for 147 (54.2%), while renter-occupied units make up 124 (45.8%).
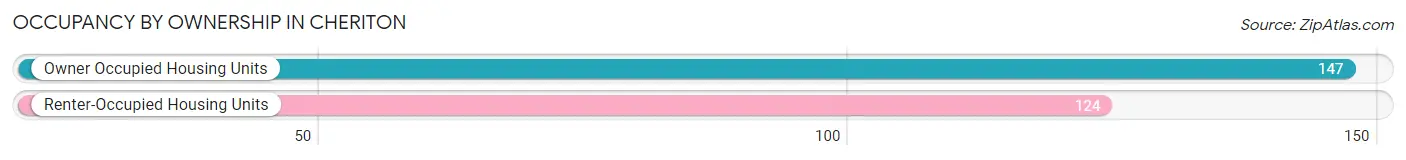
| Occupancy | # Housing Units | % Housing Units |
| Owner Occupied Housing Units | 147 | 54.2% |
| Renter-Occupied Housing Units | 124 | 45.8% |
| Total Occupied Housing Units | 271 | 100.0% |
Occupancy by Household Size in Cheriton
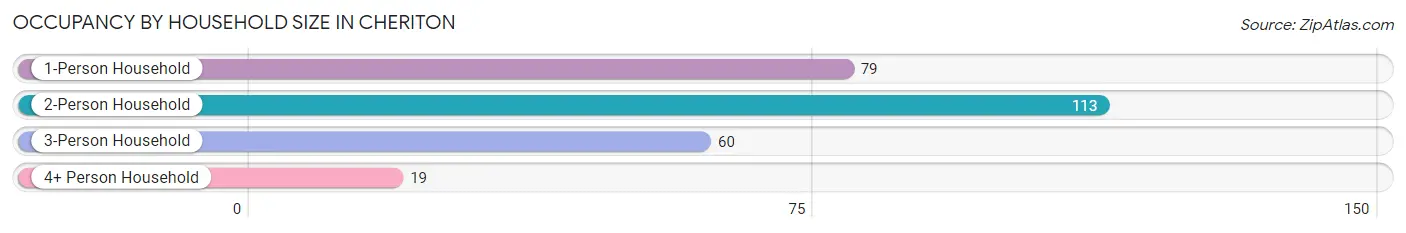
| Household Size | # Housing Units | % Housing Units |
| 1-Person Household | 79 | 29.1% |
| 2-Person Household | 113 | 41.7% |
| 3-Person Household | 60 | 22.1% |
| 4+ Person Household | 19 | 7.0% |
| Total Housing Units | 271 | 100.0% |
Occupancy by Ownership by Household Size in Cheriton
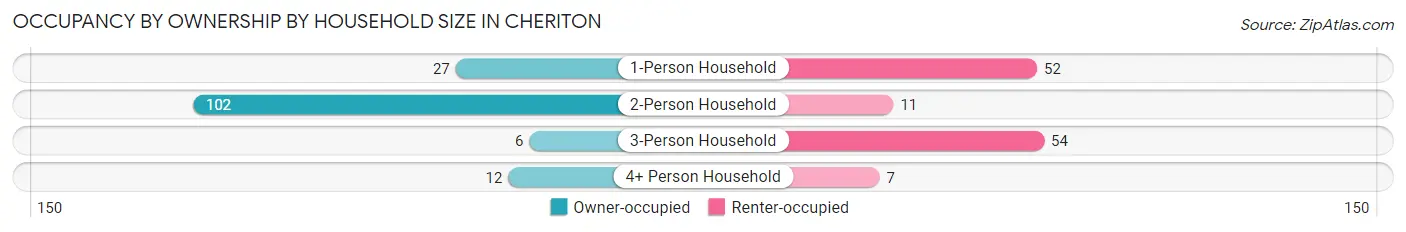
| Household Size | Owner-occupied | Renter-occupied |
| 1-Person Household | 27 (34.2%) | 52 (65.8%) |
| 2-Person Household | 102 (90.3%) | 11 (9.7%) |
| 3-Person Household | 6 (10.0%) | 54 (90.0%) |
| 4+ Person Household | 12 (63.2%) | 7 (36.8%) |
| Total Housing Units | 147 (54.2%) | 124 (45.8%) |
Occupancy by Educational Attainment in Cheriton
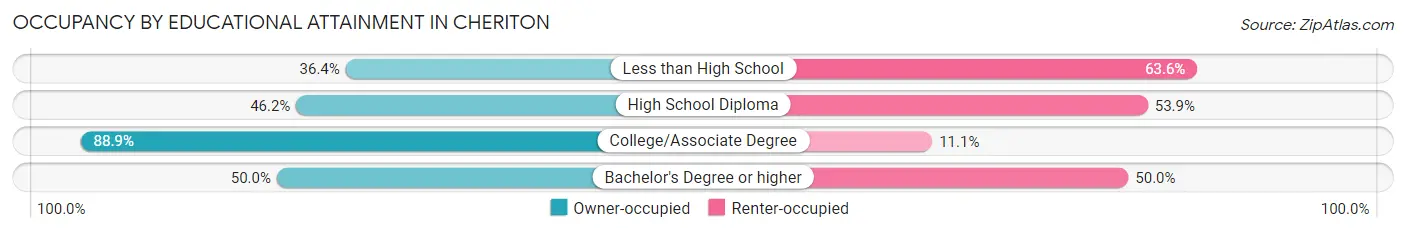
| Household Size | Owner-occupied | Renter-occupied |
| Less than High School | 24 (36.4%) | 42 (63.6%) |
| High School Diploma | 48 (46.2%) | 56 (53.8%) |
| College/Associate Degree | 56 (88.9%) | 7 (11.1%) |
| Bachelor's Degree or higher | 19 (50.0%) | 19 (50.0%) |
Occupancy by Age of Householder in Cheriton
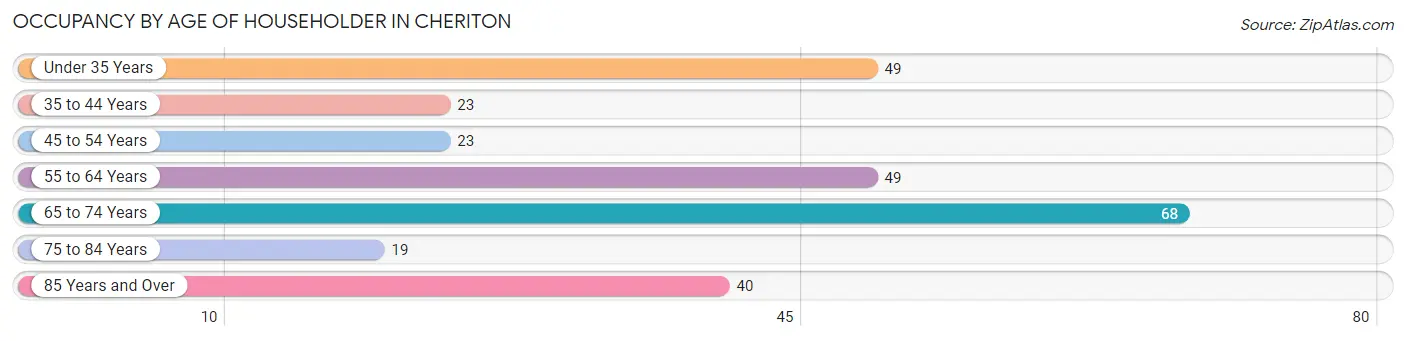
| Age Bracket | # Households | % Households |
| Under 35 Years | 49 | 18.1% |
| 35 to 44 Years | 23 | 8.5% |
| 45 to 54 Years | 23 | 8.5% |
| 55 to 64 Years | 49 | 18.1% |
| 65 to 74 Years | 68 | 25.1% |
| 75 to 84 Years | 19 | 7.0% |
| 85 Years and Over | 40 | 14.8% |
| Total | 271 | 100.0% |
Housing Finances in Cheriton
Median Income by Occupancy in Cheriton
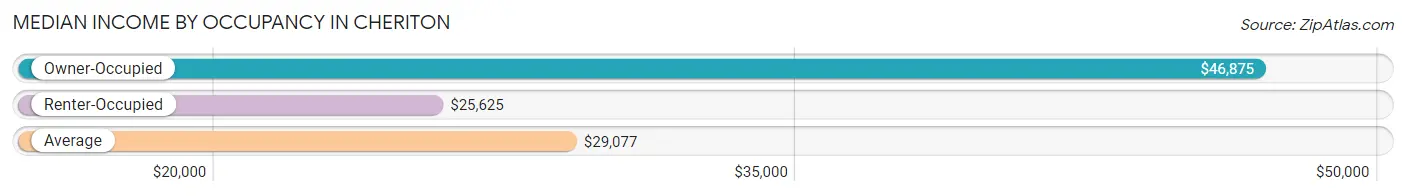
| Occupancy Type | # Households | Median Income |
| Owner-Occupied | 147 (54.2%) | $46,875 |
| Renter-Occupied | 124 (45.8%) | $25,625 |
| Average | 271 (100.0%) | $29,077 |
Occupancy by Householder Income Bracket in Cheriton
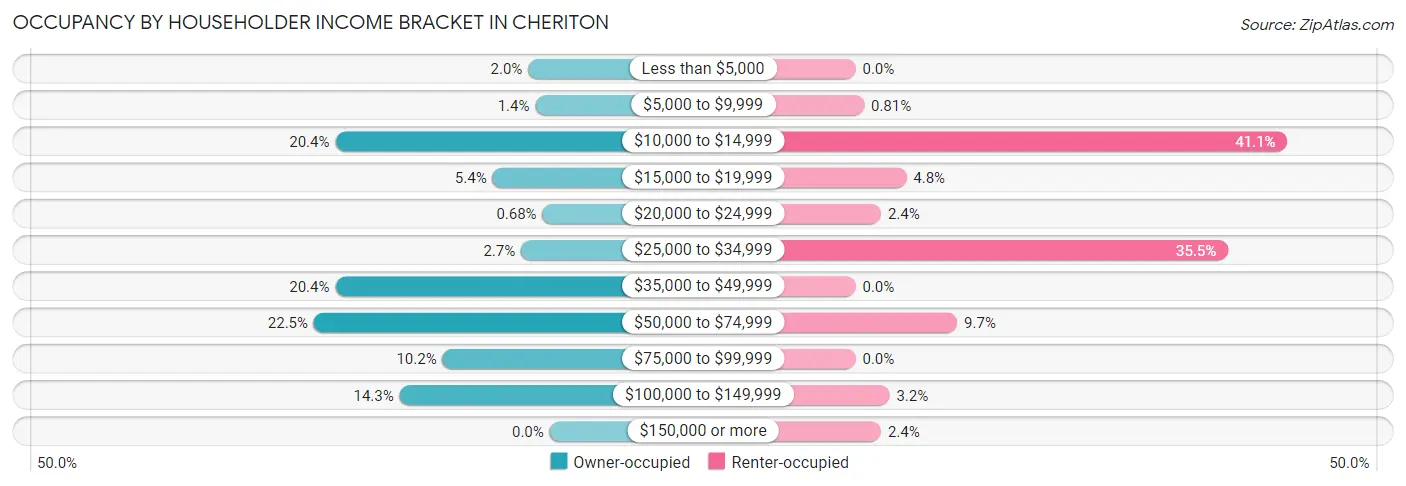
| Income Bracket | Owner-occupied | Renter-occupied |
| Less than $5,000 | 3 (2.0%) | 0 (0.0%) |
| $5,000 to $9,999 | 2 (1.4%) | 1 (0.8%) |
| $10,000 to $14,999 | 30 (20.4%) | 51 (41.1%) |
| $15,000 to $19,999 | 8 (5.4%) | 6 (4.8%) |
| $20,000 to $24,999 | 1 (0.7%) | 3 (2.4%) |
| $25,000 to $34,999 | 4 (2.7%) | 44 (35.5%) |
| $35,000 to $49,999 | 30 (20.4%) | 0 (0.0%) |
| $50,000 to $74,999 | 33 (22.5%) | 12 (9.7%) |
| $75,000 to $99,999 | 15 (10.2%) | 0 (0.0%) |
| $100,000 to $149,999 | 21 (14.3%) | 4 (3.2%) |
| $150,000 or more | 0 (0.0%) | 3 (2.4%) |
| Total | 147 (100.0%) | 124 (100.0%) |
Monthly Housing Cost Tiers in Cheriton
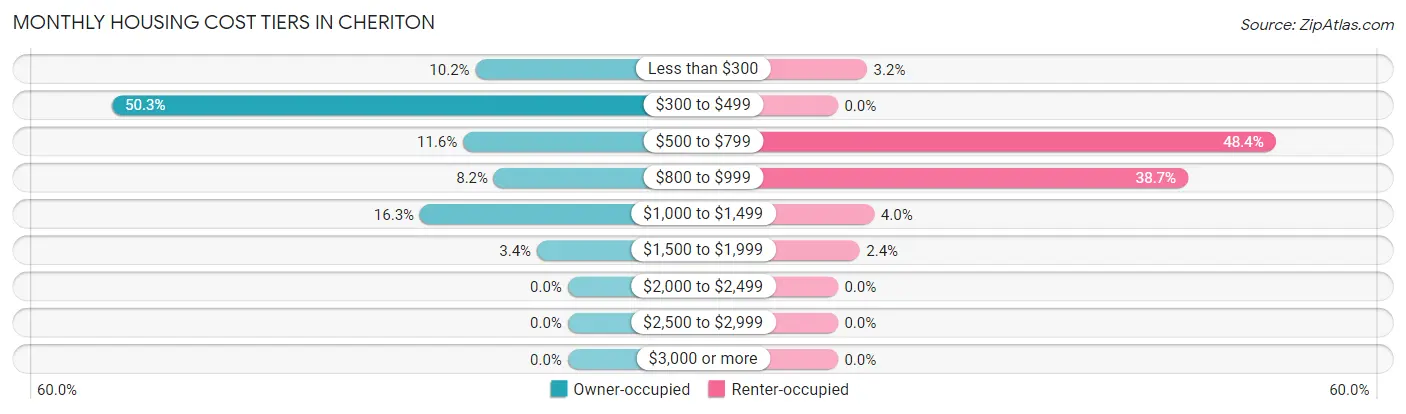
| Monthly Cost | Owner-occupied | Renter-occupied |
| Less than $300 | 15 (10.2%) | 4 (3.2%) |
| $300 to $499 | 74 (50.3%) | 0 (0.0%) |
| $500 to $799 | 17 (11.6%) | 60 (48.4%) |
| $800 to $999 | 12 (8.2%) | 48 (38.7%) |
| $1,000 to $1,499 | 24 (16.3%) | 5 (4.0%) |
| $1,500 to $1,999 | 5 (3.4%) | 3 (2.4%) |
| $2,000 to $2,499 | 0 (0.0%) | 0 (0.0%) |
| $2,500 to $2,999 | 0 (0.0%) | 0 (0.0%) |
| $3,000 or more | 0 (0.0%) | 0 (0.0%) |
| Total | 147 (100.0%) | 124 (100.0%) |
Physical Housing Characteristics in Cheriton
Housing Structures in Cheriton
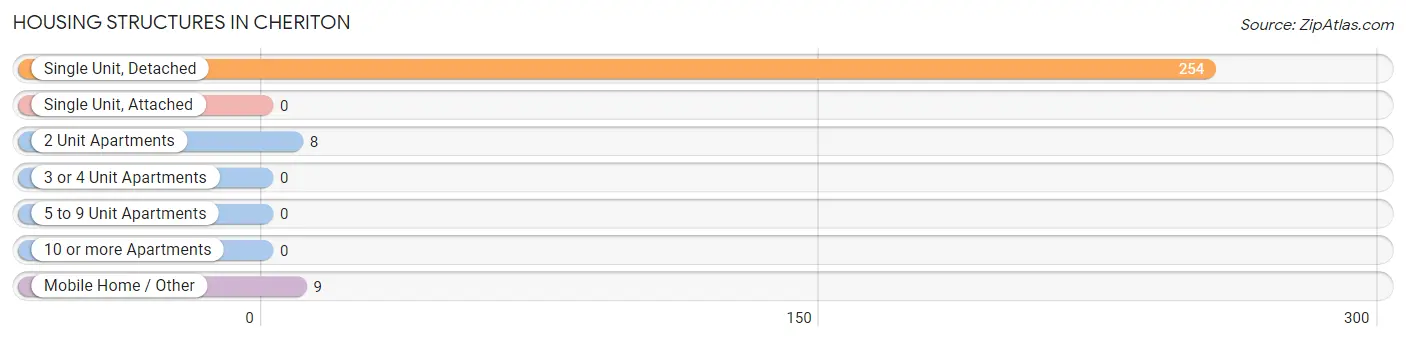
| Structure Type | # Housing Units | % Housing Units |
| Single Unit, Detached | 254 | 93.7% |
| Single Unit, Attached | 0 | 0.0% |
| 2 Unit Apartments | 8 | 2.9% |
| 3 or 4 Unit Apartments | 0 | 0.0% |
| 5 to 9 Unit Apartments | 0 | 0.0% |
| 10 or more Apartments | 0 | 0.0% |
| Mobile Home / Other | 9 | 3.3% |
| Total | 271 | 100.0% |
Housing Structures by Occupancy in Cheriton
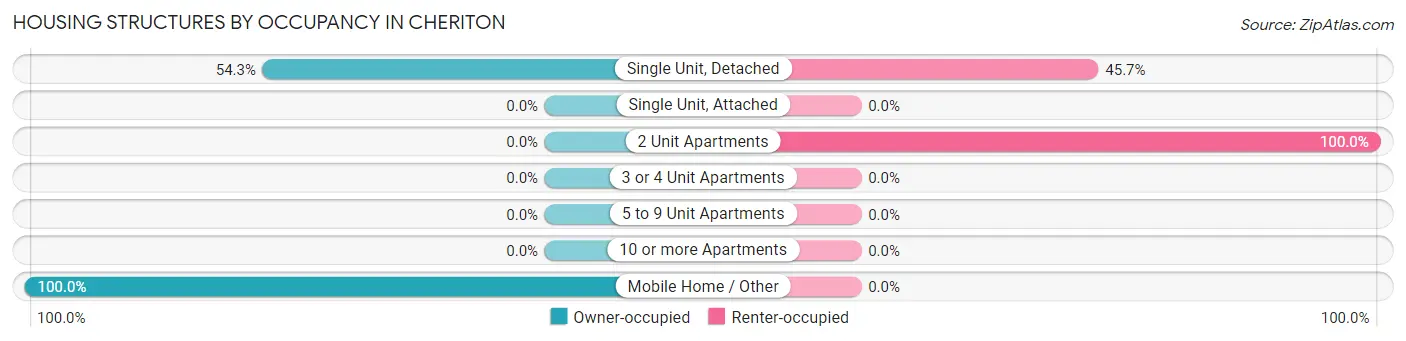
| Structure Type | Owner-occupied | Renter-occupied |
| Single Unit, Detached | 138 (54.3%) | 116 (45.7%) |
| Single Unit, Attached | 0 (0.0%) | 0 (0.0%) |
| 2 Unit Apartments | 0 (0.0%) | 8 (100.0%) |
| 3 or 4 Unit Apartments | 0 (0.0%) | 0 (0.0%) |
| 5 to 9 Unit Apartments | 0 (0.0%) | 0 (0.0%) |
| 10 or more Apartments | 0 (0.0%) | 0 (0.0%) |
| Mobile Home / Other | 9 (100.0%) | 0 (0.0%) |
| Total | 147 (54.2%) | 124 (45.8%) |
Housing Structures by Number of Rooms in Cheriton
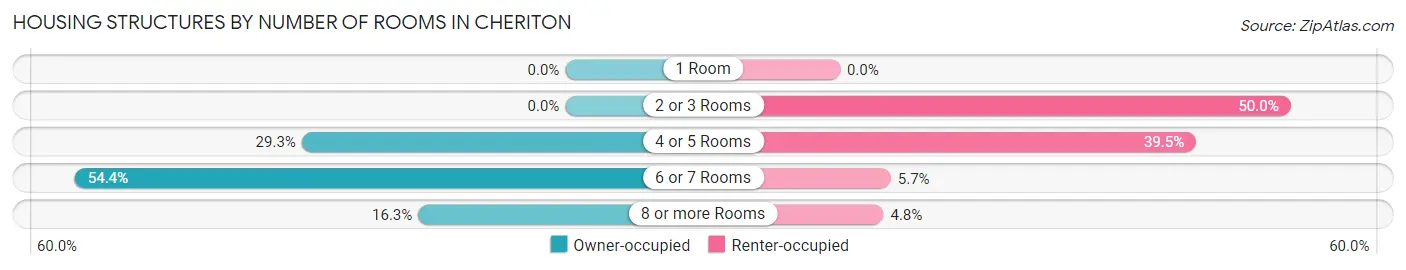
| Number of Rooms | Owner-occupied | Renter-occupied |
| 1 Room | 0 (0.0%) | 0 (0.0%) |
| 2 or 3 Rooms | 0 (0.0%) | 62 (50.0%) |
| 4 or 5 Rooms | 43 (29.2%) | 49 (39.5%) |
| 6 or 7 Rooms | 80 (54.4%) | 7 (5.7%) |
| 8 or more Rooms | 24 (16.3%) | 6 (4.8%) |
| Total | 147 (100.0%) | 124 (100.0%) |
Housing Structure by Heating Type in Cheriton
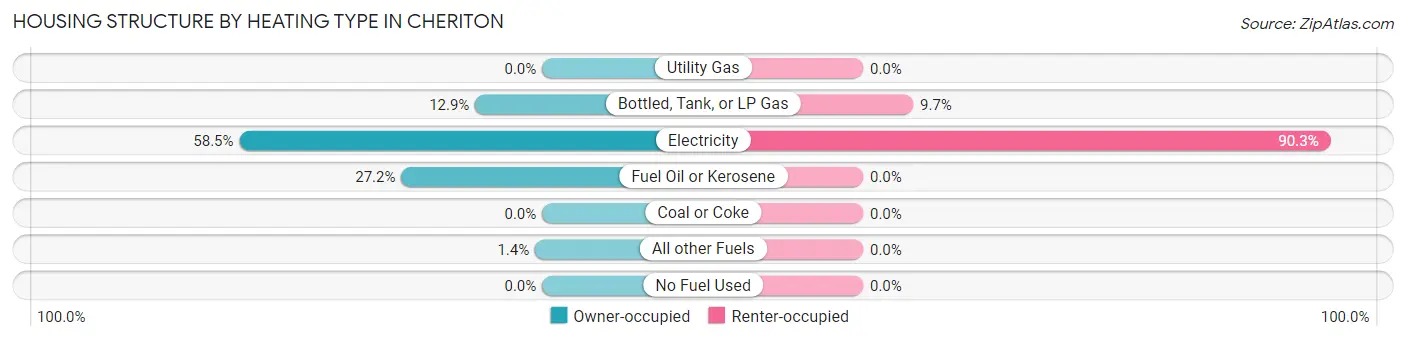
| Heating Type | Owner-occupied | Renter-occupied |
| Utility Gas | 0 (0.0%) | 0 (0.0%) |
| Bottled, Tank, or LP Gas | 19 (12.9%) | 12 (9.7%) |
| Electricity | 86 (58.5%) | 112 (90.3%) |
| Fuel Oil or Kerosene | 40 (27.2%) | 0 (0.0%) |
| Coal or Coke | 0 (0.0%) | 0 (0.0%) |
| All other Fuels | 2 (1.4%) | 0 (0.0%) |
| No Fuel Used | 0 (0.0%) | 0 (0.0%) |
| Total | 147 (100.0%) | 124 (100.0%) |
Household Vehicle Usage in Cheriton
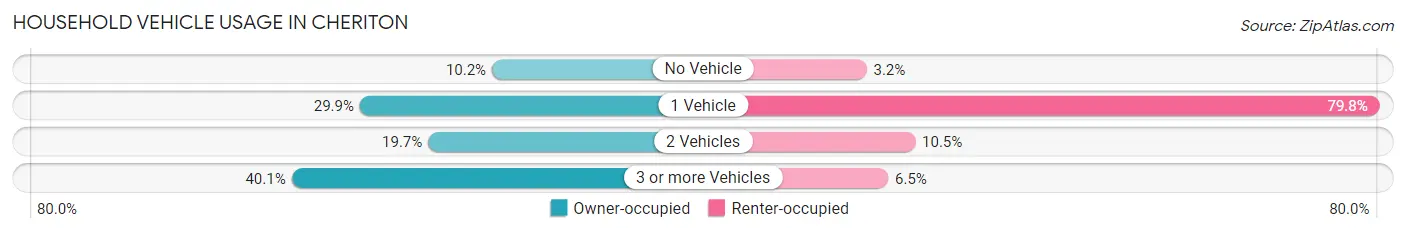
| Vehicles per Household | Owner-occupied | Renter-occupied |
| No Vehicle | 15 (10.2%) | 4 (3.2%) |
| 1 Vehicle | 44 (29.9%) | 99 (79.8%) |
| 2 Vehicles | 29 (19.7%) | 13 (10.5%) |
| 3 or more Vehicles | 59 (40.1%) | 8 (6.5%) |
| Total | 147 (100.0%) | 124 (100.0%) |
Real Estate & Mortgages in Cheriton
Real Estate and Mortgage Overview in Cheriton
| Characteristic | Without Mortgage | With Mortgage |
| Housing Units | 109 | 38 |
| Median Property Value | $115,500 | $225,000 |
| Median Household Income | $37,361 | $0 |
| Monthly Housing Costs | $430 | $0 |
| Real Estate Taxes | $1,061 | $0 |
Property Value by Mortgage Status in Cheriton
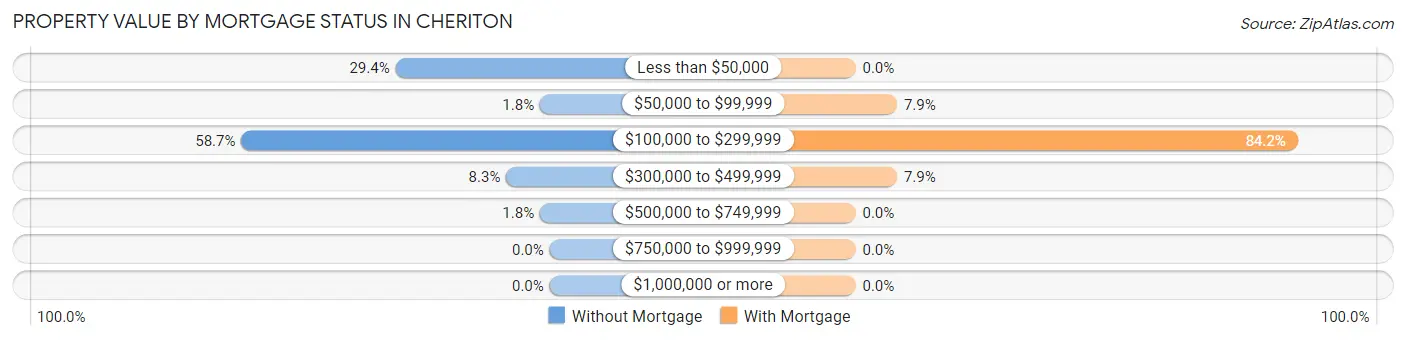
| Property Value | Without Mortgage | With Mortgage |
| Less than $50,000 | 32 (29.4%) | 0 (0.0%) |
| $50,000 to $99,999 | 2 (1.8%) | 3 (7.9%) |
| $100,000 to $299,999 | 64 (58.7%) | 32 (84.2%) |
| $300,000 to $499,999 | 9 (8.3%) | 3 (7.9%) |
| $500,000 to $749,999 | 2 (1.8%) | 0 (0.0%) |
| $750,000 to $999,999 | 0 (0.0%) | 0 (0.0%) |
| $1,000,000 or more | 0 (0.0%) | 0 (0.0%) |
| Total | 109 (100.0%) | 38 (100.0%) |
Household Income by Mortgage Status in Cheriton
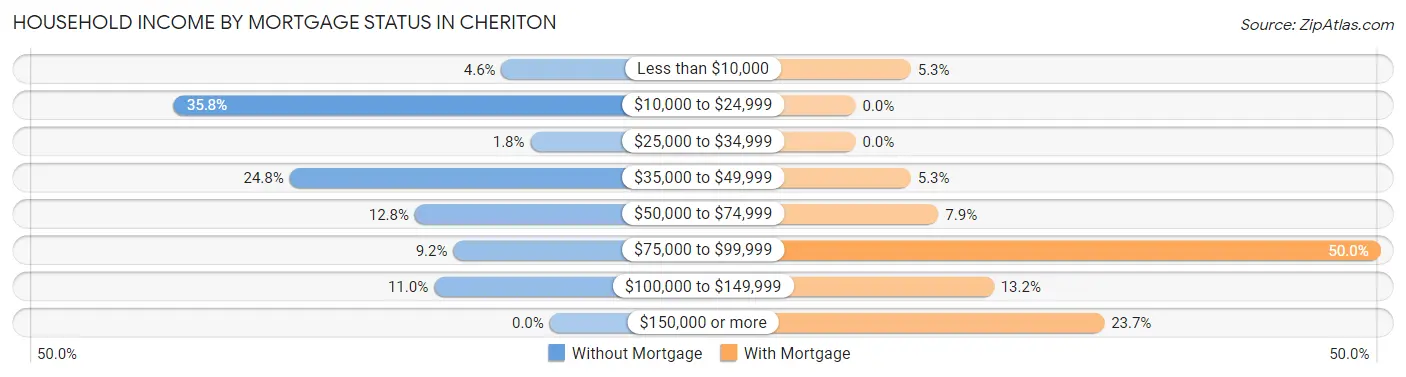
| Household Income | Without Mortgage | With Mortgage |
| Less than $10,000 | 5 (4.6%) | 2 (5.3%) |
| $10,000 to $24,999 | 39 (35.8%) | 0 (0.0%) |
| $25,000 to $34,999 | 2 (1.8%) | 0 (0.0%) |
| $35,000 to $49,999 | 27 (24.8%) | 2 (5.3%) |
| $50,000 to $74,999 | 14 (12.8%) | 3 (7.9%) |
| $75,000 to $99,999 | 10 (9.2%) | 19 (50.0%) |
| $100,000 to $149,999 | 12 (11.0%) | 5 (13.2%) |
| $150,000 or more | 0 (0.0%) | 9 (23.7%) |
| Total | 109 (100.0%) | 38 (100.0%) |
Property Value to Household Income Ratio in Cheriton
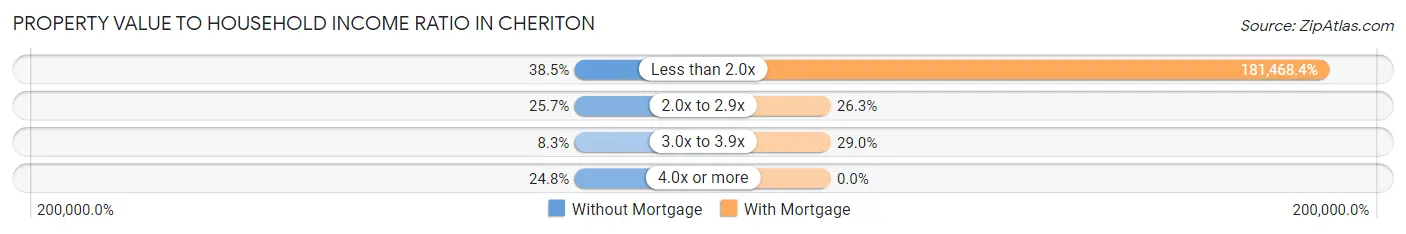
| Value-to-Income Ratio | Without Mortgage | With Mortgage |
| Less than 2.0x | 42 (38.5%) | 68,958 (181,468.4%) |
| 2.0x to 2.9x | 28 (25.7%) | 10 (26.3%) |
| 3.0x to 3.9x | 9 (8.3%) | 11 (28.9%) |
| 4.0x or more | 27 (24.8%) | 0 (0.0%) |
| Total | 109 (100.0%) | 38 (100.0%) |
Real Estate Taxes by Mortgage Status in Cheriton
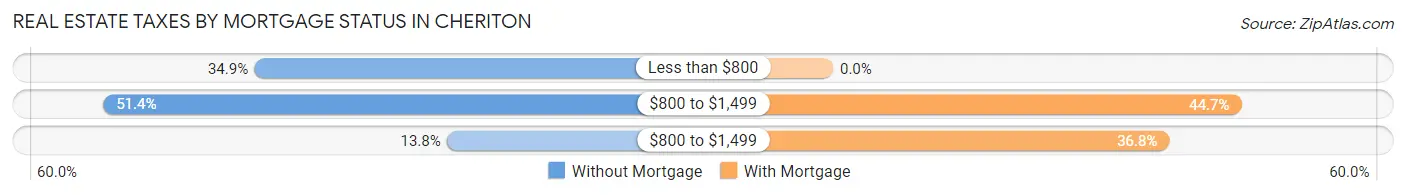
| Property Taxes | Without Mortgage | With Mortgage |
| Less than $800 | 38 (34.9%) | 0 (0.0%) |
| $800 to $1,499 | 56 (51.4%) | 17 (44.7%) |
| $800 to $1,499 | 15 (13.8%) | 14 (36.8%) |
| Total | 109 (100.0%) | 38 (100.0%) |
Health & Disability in Cheriton
Health Insurance Coverage by Age in Cheriton
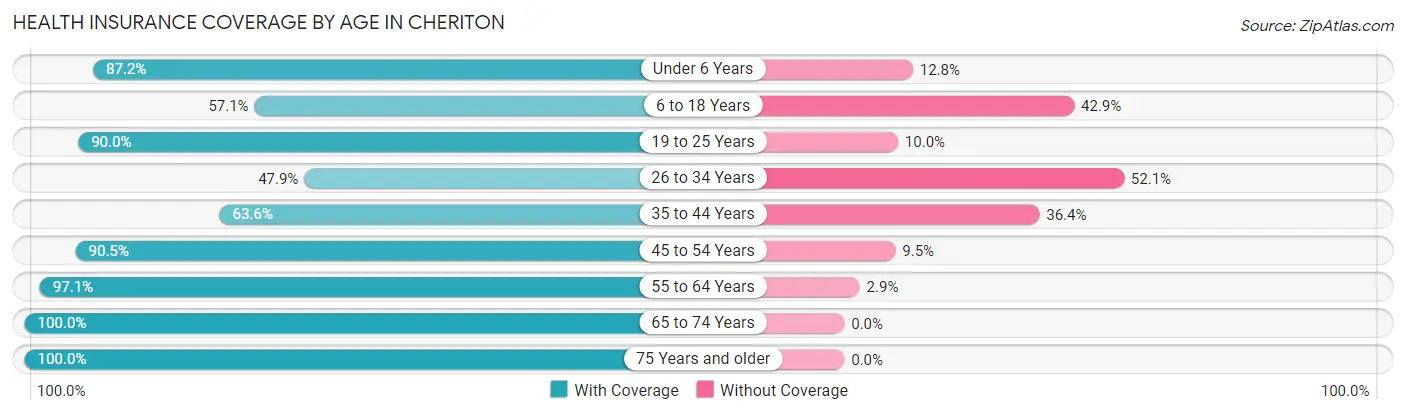
| Age Bracket | With Coverage | Without Coverage |
| Under 6 Years | 41 (87.2%) | 6 (12.8%) |
| 6 to 18 Years | 12 (57.1%) | 9 (42.9%) |
| 19 to 25 Years | 27 (90.0%) | 3 (10.0%) |
| 26 to 34 Years | 56 (47.9%) | 61 (52.1%) |
| 35 to 44 Years | 28 (63.6%) | 16 (36.4%) |
| 45 to 54 Years | 38 (90.5%) | 4 (9.5%) |
| 55 to 64 Years | 68 (97.1%) | 2 (2.9%) |
| 65 to 74 Years | 88 (100.0%) | 0 (0.0%) |
| 75 Years and older | 103 (100.0%) | 0 (0.0%) |
| Total | 461 (82.0%) | 101 (18.0%) |
Health Insurance Coverage by Citizenship Status in Cheriton
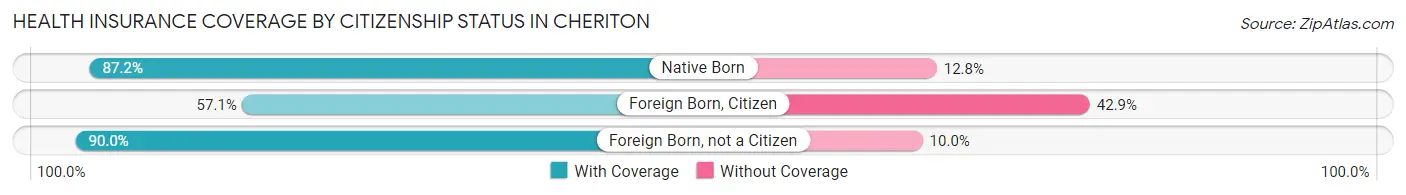
| Citizenship Status | With Coverage | Without Coverage |
| Native Born | 41 (87.2%) | 6 (12.8%) |
| Foreign Born, Citizen | 12 (57.1%) | 9 (42.9%) |
| Foreign Born, not a Citizen | 27 (90.0%) | 3 (10.0%) |
Health Insurance Coverage by Household Income in Cheriton
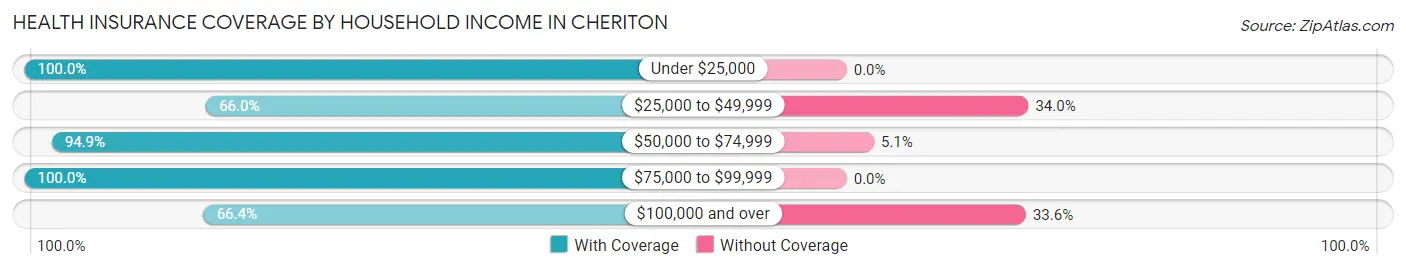
| Household Income | With Coverage | Without Coverage |
| Under $25,000 | 144 (100.0%) | 0 (0.0%) |
| $25,000 to $49,999 | 93 (66.0%) | 48 (34.0%) |
| $50,000 to $74,999 | 93 (94.9%) | 5 (5.1%) |
| $75,000 to $99,999 | 36 (100.0%) | 0 (0.0%) |
| $100,000 and over | 95 (66.4%) | 48 (33.6%) |
Public vs Private Health Insurance Coverage by Age in Cheriton
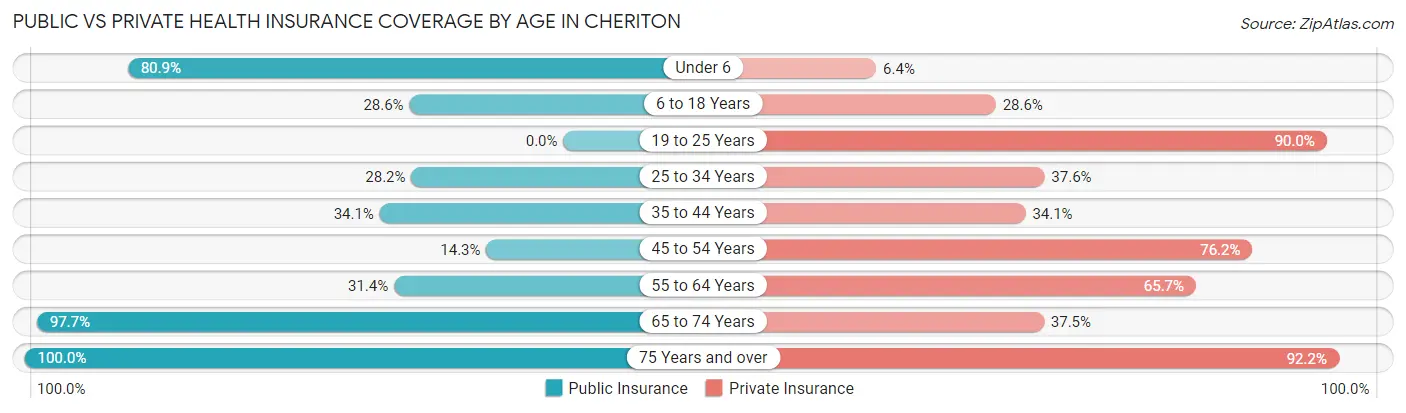
| Age Bracket | Public Insurance | Private Insurance |
| Under 6 | 38 (80.8%) | 3 (6.4%) |
| 6 to 18 Years | 6 (28.6%) | 6 (28.6%) |
| 19 to 25 Years | 0 (0.0%) | 27 (90.0%) |
| 25 to 34 Years | 33 (28.2%) | 44 (37.6%) |
| 35 to 44 Years | 15 (34.1%) | 15 (34.1%) |
| 45 to 54 Years | 6 (14.3%) | 32 (76.2%) |
| 55 to 64 Years | 22 (31.4%) | 46 (65.7%) |
| 65 to 74 Years | 86 (97.7%) | 33 (37.5%) |
| 75 Years and over | 103 (100.0%) | 95 (92.2%) |
| Total | 309 (55.0%) | 301 (53.6%) |
Disability Status by Sex by Age in Cheriton
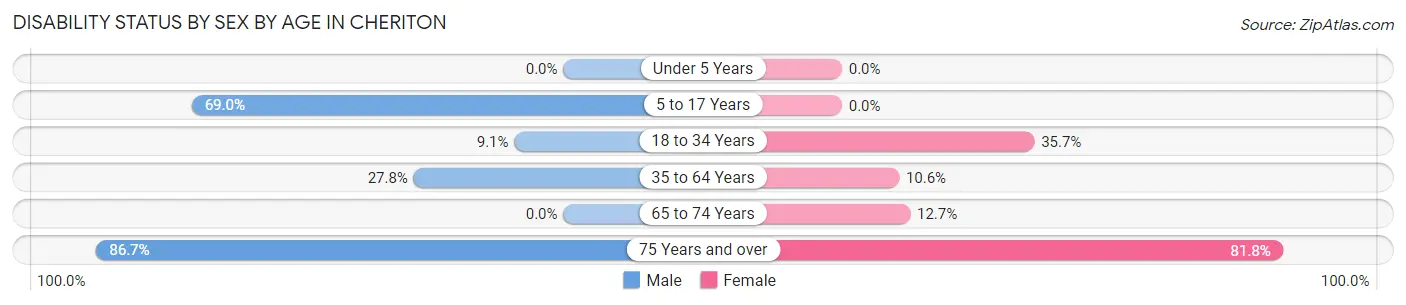
| Age Bracket | Male | Female |
| Under 5 Years | 0 (0.0%) | 0 (0.0%) |
| 5 to 17 Years | 20 (69.0%) | 0 (0.0%) |
| 18 to 34 Years | 7 (9.1%) | 25 (35.7%) |
| 35 to 64 Years | 25 (27.8%) | 7 (10.6%) |
| 65 to 74 Years | 0 (0.0%) | 10 (12.7%) |
| 75 Years and over | 13 (86.7%) | 72 (81.8%) |
Disability Class by Sex by Age in Cheriton
Disability Class: Hearing Difficulty
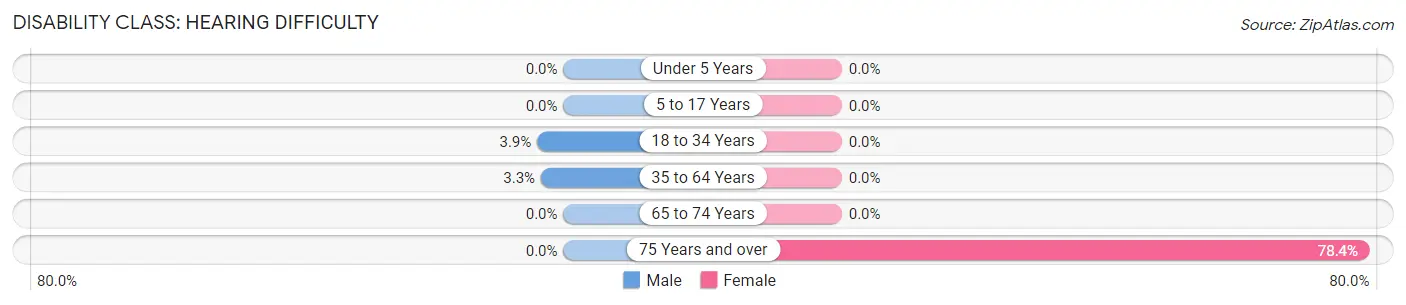
| Age Bracket | Male | Female |
| Under 5 Years | 0 (0.0%) | 0 (0.0%) |
| 5 to 17 Years | 0 (0.0%) | 0 (0.0%) |
| 18 to 34 Years | 3 (3.9%) | 0 (0.0%) |
| 35 to 64 Years | 3 (3.3%) | 0 (0.0%) |
| 65 to 74 Years | 0 (0.0%) | 0 (0.0%) |
| 75 Years and over | 0 (0.0%) | 69 (78.4%) |
Disability Class: Vision Difficulty
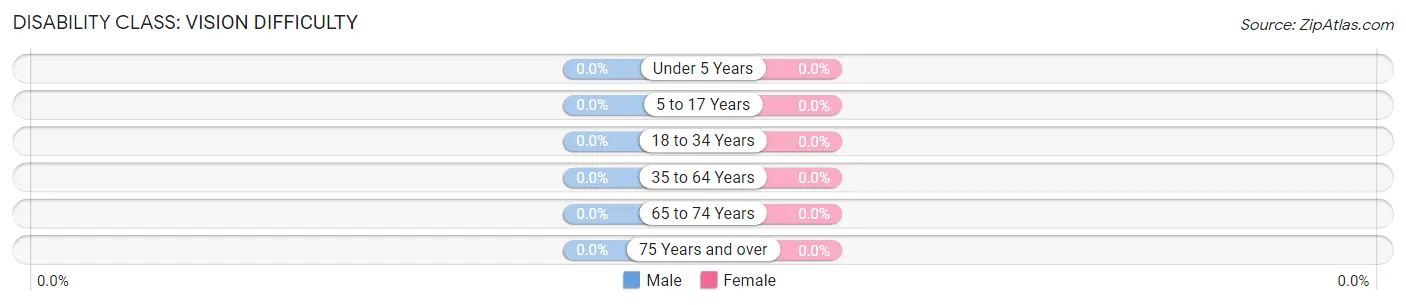
| Age Bracket | Male | Female |
| Under 5 Years | 0 (0.0%) | 0 (0.0%) |
| 5 to 17 Years | 0 (0.0%) | 0 (0.0%) |
| 18 to 34 Years | 0 (0.0%) | 0 (0.0%) |
| 35 to 64 Years | 0 (0.0%) | 0 (0.0%) |
| 65 to 74 Years | 0 (0.0%) | 0 (0.0%) |
| 75 Years and over | 0 (0.0%) | 0 (0.0%) |
Disability Class: Cognitive Difficulty
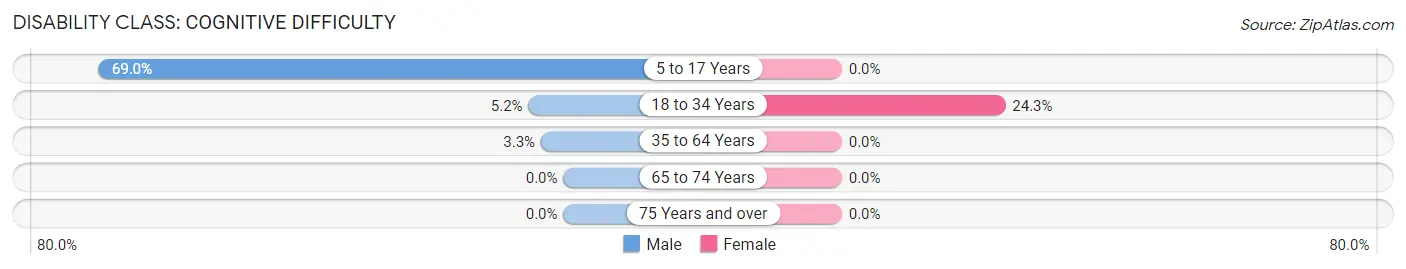
| Age Bracket | Male | Female |
| 5 to 17 Years | 20 (69.0%) | 0 (0.0%) |
| 18 to 34 Years | 4 (5.2%) | 17 (24.3%) |
| 35 to 64 Years | 3 (3.3%) | 0 (0.0%) |
| 65 to 74 Years | 0 (0.0%) | 0 (0.0%) |
| 75 Years and over | 0 (0.0%) | 0 (0.0%) |
Disability Class: Ambulatory Difficulty
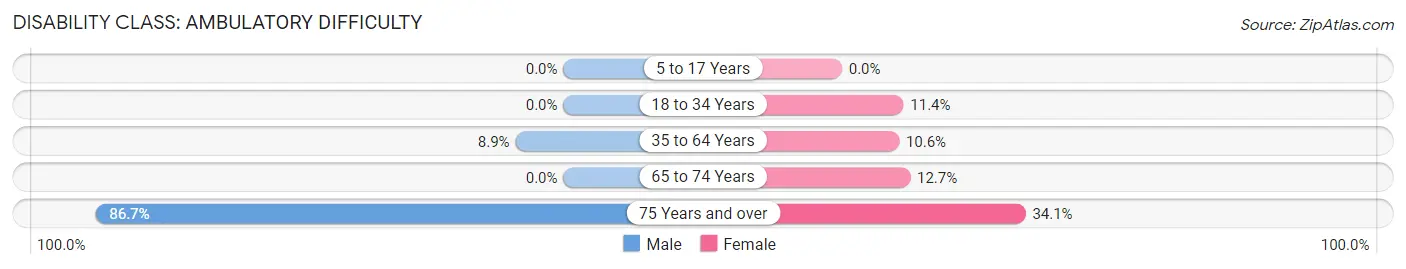
| Age Bracket | Male | Female |
| 5 to 17 Years | 0 (0.0%) | 0 (0.0%) |
| 18 to 34 Years | 0 (0.0%) | 8 (11.4%) |
| 35 to 64 Years | 8 (8.9%) | 7 (10.6%) |
| 65 to 74 Years | 0 (0.0%) | 10 (12.7%) |
| 75 Years and over | 13 (86.7%) | 30 (34.1%) |
Disability Class: Self-Care Difficulty
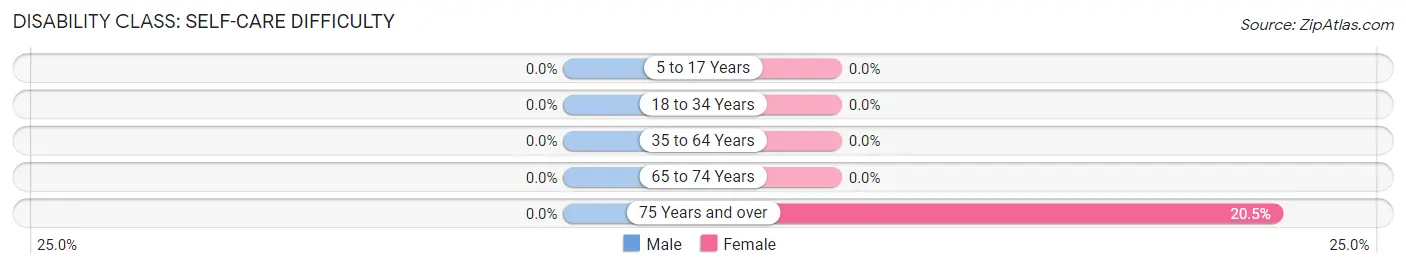
| Age Bracket | Male | Female |
| 5 to 17 Years | 0 (0.0%) | 0 (0.0%) |
| 18 to 34 Years | 0 (0.0%) | 0 (0.0%) |
| 35 to 64 Years | 0 (0.0%) | 0 (0.0%) |
| 65 to 74 Years | 0 (0.0%) | 0 (0.0%) |
| 75 Years and over | 0 (0.0%) | 18 (20.4%) |
Technology Access in Cheriton
Computing Device Access in Cheriton
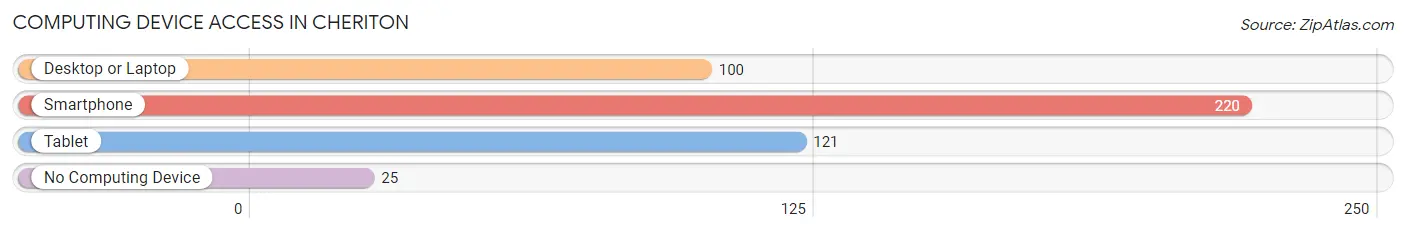
| Device Type | # Households | % Households |
| Desktop or Laptop | 100 | 36.9% |
| Smartphone | 220 | 81.2% |
| Tablet | 121 | 44.7% |
| No Computing Device | 25 | 9.2% |
| Total | 271 | 100.0% |
Internet Access in Cheriton
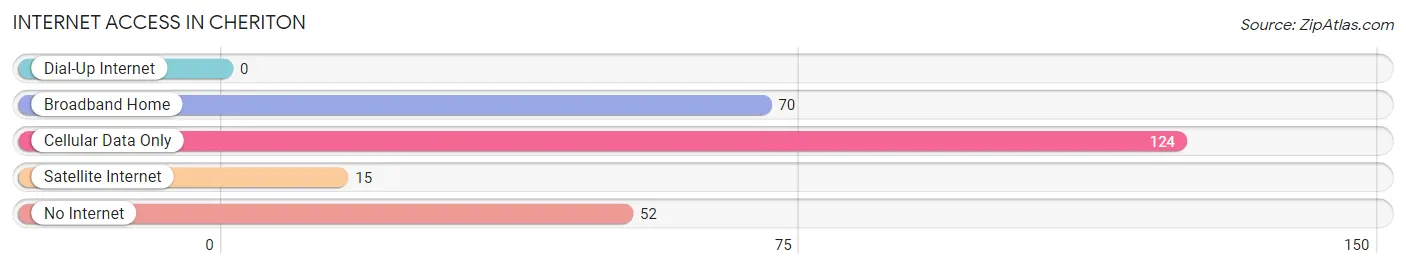
| Internet Type | # Households | % Households |
| Dial-Up Internet | 0 | 0.0% |
| Broadband Home | 70 | 25.8% |
| Cellular Data Only | 124 | 45.8% |
| Satellite Internet | 15 | 5.5% |
| No Internet | 52 | 19.2% |
| Total | 271 | 100.0% |
Cheriton Summary
Cheriton is a small town located in Northampton County, Virginia. It is situated on the Eastern Shore of the Chesapeake Bay, approximately 30 miles south of the state capital of Richmond. The town has a population of approximately 1,000 people and is part of the Hampton Roads metropolitan area.
History
The area that is now Cheriton was first settled in the early 1600s by English colonists. The town was originally known as “Cherrystone” and was part of the larger Northampton County. In 1705, the town was officially incorporated as “Cheriton” and was named after the nearby Cherrystone Creek.
During the American Revolution, Cheriton was a major port for the British Navy. The town was also the site of a major battle between the British and American forces in 1781. After the war, the town experienced a period of growth and prosperity.
In the late 19th century, Cheriton became a popular tourist destination due to its proximity to the Chesapeake Bay. The town was also home to several large oyster packing plants, which provided employment for many of the town’s residents.
Geography
Cheriton is located in Northampton County, Virginia. The town is situated on the Eastern Shore of the Chesapeake Bay, approximately 30 miles south of the state capital of Richmond. The town is bordered by the towns of Exmore, Nassawadox, and Cape Charles.
The town has a total area of 1.2 square miles, all of which is land. The town is located at an elevation of 10 feet above sea level. The climate in Cheriton is classified as humid subtropical, with hot, humid summers and mild winters.
Economy
The economy of Cheriton is largely based on tourism and agriculture. The town is home to several oyster packing plants, which provide employment for many of the town’s residents. The town is also home to several small businesses, including restaurants, shops, and a marina.
The town is also home to several large farms, which produce a variety of crops, including corn, soybeans, and wheat. The town is also home to several wineries, which produce a variety of wines.
Demographics
As of the 2010 census, the population of Cheriton was 1,000 people. The racial makeup of the town was 94.2% White, 3.2% African American, 0.2% Native American, 0.2% Asian, 0.2% from other races, and 1.9% from two or more races. Hispanic or Latino of any race were 1.2% of the population.
The median income for a household in the town was $37,500, and the median income for a family was $45,000. The per capita income for the town was $19,000. About 11.2% of families and 14.2% of the population were below the poverty line, including 18.2% of those under age 18 and 8.2% of those age 65 or over.
Common Questions
What is the Total Population of Cheriton?
Total Population of Cheriton is 562.
What is the Total Male Population of Cheriton?
Total Male Population of Cheriton is 233.
What is the Total Female Population of Cheriton?
Total Female Population of Cheriton is 329.
What is the Ratio of Males per 100 Females in Cheriton?
There are 70.82 Males per 100 Females in Cheriton.
What is the Ratio of Females per 100 Males in Cheriton?
There are 141.20 Females per 100 Males in Cheriton.
What is the Median Population Age in Cheriton?
Median Population Age in Cheriton is 50.3 Years.
What is the Average Family Size in Cheriton
Average Family Size in Cheriton is 2.3 People.
What is the Average Household Size in Cheriton
Average Household Size in Cheriton is 2.1 People.
What is Per Capita Income in Cheriton?
Per Capita income in Cheriton is $24,196.
What is the Median Family Income in Cheriton?
Median Family Income in Cheriton is $36,136.
What is the Median Household income in Cheriton?
Median Household Income in Cheriton is $29,077.
What is Income or Wage Gap in Cheriton?
Income or Wage Gap in Cheriton is 2.1%.
Women in Cheriton earn 97.9 cents for every dollar earned by a man.
What is Inequality or Gini Index in Cheriton?
Inequality or Gini Index in Cheriton is 0.44.
How Large is the Labor Force in Cheriton?
There are 213 People in the Labor Forcein in Cheriton.
What is the Percentage of People in the Labor Force in Cheriton?
42.2% of People are in the Labor Force in Cheriton.
What is the Unemployment Rate in Cheriton?
Unemployment Rate in Cheriton is 2.3%.